analysis and application of maintenance strategies …574931/fulltext01.pdfanalysis and application...
TRANSCRIPT

i
Analysis and application of maintenance strategies for
Omnicane Thermal Energy Operations
(St Aubin) Ltd
Jasbeersingh BUNDHOO
Student ID: 800630A751
DSEE
Mauritius

ii
Master of Science Thesis EGI 2012 – 102
MSC EKV920
Analysis and application of maintenance
strategies for Omnicane Thermal Energy
Operations
(St Aubin) Ltd
Jasbeersingh
BUNDHOO
Approved
Date
Examiner
Name
Supervisor
Name
Commissioner
Contact person
Abstract Maintenance costs at Omnicane Thermal Energy Operations (St Aubin) Ltd contribute a significant part of
the unit cost of electrical energy produced and affect the profitability of the power plant. Hence it is necessary
and crucial to minimize maintenance costs by optimizing maintenance processes to make the plant more
reliable and to run economically.
The total maintenance cost for OTEOSAL from year 2008 to 2011 is seen to be increasing and has even
double from 2008 to 2011. The cost of external labor during operation has increased by nearly four times due
to a lot of breakdown on different equipments and also the value of the spare parts store is seen to rise
because many spare parts are bought at random in fear of having a shut down due to unavailability of spare
parts. These excess expenses contribute to a loss in profitability. With a good maintenance strategy, the total
maintenance cost can be reduced by about 30%.
Fault Tree Analysis (FTA) and Failure Mode Effect Analysis (FMEA) were done and allowed identifying
critical equipments at the power plant and the Grate Stocker, one of the most important and critical
equipment for the plant was selected to perform a Quantitative Analysis of the FTAs. The probability of
failure for the Grate Stocker is seen to be 0.98 and has reliability as low as 0.02. Quantitative Analysis of FTA
and Pareto Analysis will allow having the right quantity of spare parts at the right time without overstocking.
From this thesis, it can be said that combining different maintenance and management methods and
strategies based on FTA, FMEA and Pareto Analysis and all these well formalized and documented according
to ISO 9001 will certainly allow the power plant to gain a lot like availability, reliability and even financially
from maintenance and also will make OTEOSAL ready for new challenges appearing in the energy sector in
Mauritius.
iii
Table of Contents
Introduction ............................................................................................................................................ 1
1.1 OTEOSAL .................................................................................................................................. 1
1.2 Aim of Thesis ............................................................................................................................ 1
1.3 Objectives of Thesis ................................................................................................................. 2
1.4 Maintenance data for OTEOSAL ............................................................................................... 2
2 Background and Literature Review .................................................................................................. 3
2.1 Process Description .................................................................................................................. 3
2.1.1 Coal Handling Plant .......................................................................................................... 3
2.1.2 Feeders and Spreaders ..................................................................................................... 5
2.1.3 Traveling Chain Grate ....................................................................................................... 5
2.1.4 Bottom Ash ...................................................................................................................... 5
2.1.5 Air preheater .................................................................................................................... 7
2.1.6 Primary and Secondary Air ............................................................................................... 7
2.1.7 Induced Draught Fan ........................................................................................................ 7
2.1.8 Re-injection of Fly Ash ...................................................................................................... 7
2.1.9 Economizers ..................................................................................................................... 8
2.1.10 Electrostatic Precipitator and Fly Ash ................................................................................ 8
2.1.11 Boiler Water ................................................................................................................... 10
2.1.12 Steam Turbine and Electric Generator ............................................................................ 10
2.1.13 Condenser and Cooling Tower ........................................................................................ 12
2.2 Maintenance at OTEOSA ........................................................................................................ 14
2.3 Maintenance Management Strategies and Methods .............................................................. 14
2.3.1 Preventive Maintenance ................................................................................................. 14
2.3.2 Condition based maintenance ........................................................................................ 16
iv
2.3.3 Corrective Maintenance ................................................................................................. 18
2.3.4 Reliability-centered maintenance (RCM) ......................................................................... 18
2.3.5 Lean Maintenance .......................................................................................................... 23
2.3.6 Six Sigma ........................................................................................................................ 24
3 Analysis of main equipments and evaluating maintenance needs .................................................. 28
3.1 Main equipments at OTEOSAL ................................................................................................ 28
3.2 Evaluating maintenance needs at OTEOSAL ............................................................................ 28
4 Analysis of FTA ............................................................................................................................... 31
4.1 Introduction ........................................................................................................................... 31
4.2 Objectives .............................................................................................................................. 31
4.3 Commonly used symbols ........................................................................................................ 31
4.3.1 Fault Tree “Gates” and “Event” Symbols. ........................................................................ 32
4.4 Benefits of Fault Tree Analysis ................................................................................................ 32
4.5 Drawbacks of Fault Tree Analysis ........................................................................................... 33
4.6 Fault Tree Analysis on OTEOSAL Main Systems ....................................................................... 33
4.7 Observations made on FTA performed at OTEOSA ................................................................. 46
5 Failure Mode and Effects Analysis (FMEA) ...................................................................................... 47
5.1 Introduction ........................................................................................................................... 47
5.2 FMECA Benefits...................................................................................................................... 48
5.3 Applying FMECA at OTEOSAL.................................................................................................. 48
5.4 Risk Priority Number Method ................................................................................................. 48
5.5 Severity(S) .............................................................................................................................. 49
5.6 Occurrence (O) ....................................................................................................................... 50
5.7 Detection (D) ......................................................................................................................... 50
5.8 FMECA Table .......................................................................................................................... 51
5.9 Maintenance Strategy determination ..................................................................................... 51
v
5.10 FMECA Tables for OTEOSAL .................................................................................................... 53
5.11 Analysis of FMECA .................................................................................................................. 55
5.12 Maintenance Tasks Comparisons. .......................................................................................... 55
6 Applying FTA to a specific equipment at the OTEOSAL power plant ................................................ 57
6.1 Grate Stocker ......................................................................................................................... 57
6.2 FTAs for the grate stocker ...................................................................................................... 57
6.3 The quantitative analysis of the FTA ....................................................................................... 61
6.3.1 6.3.1 Equations for quantitative analysis ........................................................................ 61
6.3.2 Reliability of k-out-of-n for the coal spreader and feeder ................................................ 63
6.4 Analysis of results .................................................................................................................. 67
6.5 Pareto Analysis....................................................................................................................... 67
6.5.1 Definition of Pareto Analysis ........................................................................................... 67
6.5.2 Steps to identify the important causes using Pareto analysis ................................................. 68
6.5.2 Pareto Analysis for Grate Stocker ................................................................................... 69
6.5.3.1 Pareto Analysis for driving part of Travelling Grate ................................................................. 69
6.5.3.2 Pareto Analysis for Rear Driving part of Travelling Grate ........................................................ 72
6.5.3.3 Pareto Analysis for Chain Assembly parts of Travelling Grate ................................................. 75
6.5.3.4 Pareto Analysis for Fixed Parts of Travelling Grate .................................................................. 78
6.5.3.5 Pareto Analysis for whole Travelling Grate ............................................................................. 81
6.5.3.6 Pareto Analysis for Coal Feeder .............................................................................................. 83
6.5.3.7 Pareto Analysis for Coal Spreader ........................................................................................... 86
7 Setting Up of Maintenance Strategy and Guidelines for OTEOSAL .................................................. 89
7.1 Company’s expectations from the Maintenance Department ................................................. 89
7.2 Documents for maintenance strategy guidelines and maintenance quality system ............... 100
8 Discussion and Conclusion ........................................................................................................... 104
8.1 Overview.............................................................................................................................. 104

vi
8.2 Maintenance and management methods ............................................................................. 104
8.3 Maintenance Strategy based on FTA and FMEA .................................................................... 104
8.4 Quantitative Analysis of FTA and Pareto Analysis ................................................................. 105
8.5 Quality Management System ............................................................................................... 106
8.6 Conclusion ........................................................................................................................... 106
9 REFERENCES ................................................................................................................................ 107
APPENDIX 1 – FTA Diagrams ........................................................................................................... 109
APPENDIX 2 – FMECA Table ............................................................................................................ 136
vii
Table of Figures and Tables
FIGURE 1.4-1 [A] BAR CHART REPRESENTING EVOLUTION OF TOTAL MAINTENANCE COST AND [B] CHART REPRESENTING EVOLUTION OF
THE VALUE OF THE SPARE PART STORE ............................................................................................................................ 2
FIGURE 2.1-1 CONVEYOR IN THE COAL HANDLING PLANT .......................................................................................................... 4
FIGURE 2.1-2 COAL HANDLING PLANT .................................................................................................................................. 4
FIGURE 2.1-3 COAL SPREADER AND FEEDER ........................................................................................................................... 5
FIGURE 2.1-4 TRAVELLING GRATE STOKER AND BOTTOM ASH CONVEYOR ..................................................................................... 6
FIGURE 2.1-6 COAL SPREADER AND FEEDER ........................................................................................................................... 9
FIGURE 2.1-7 DEMINERALISED WATER TREATMENT PLANT ..................................................................................................... 10
FIGURE 2.1-8 TURBINE OPERATION DIAGRAM ...................................................................................................................... 11
FIGURE 2.1-9 CONDENSER ................................................................................................................................................ 12
FIGURE 2.1-10 COOLING TOWER ........................................................................................................................................ 12
FIGURE 2.1-11 PROCESS DIAGRAM .................................................................................................................................... 13
FIGURE 2.3-1 THE BATHTUB CURVE FOR PREVENTIVE MAINTENANCE (MOBLEY, R.K., 2002) .......................................................... 15
FIGURE 3.2-1 PROCESS SCHEMATIC OF MAIN EQUIPMENTS AT OTEOSAL ................................................................................... 29
FIGURE 4.3-1 TWO REGULARLY USED FAULT TREE GATE SYMBOLS : (1) OR GATE; (2) AND GATE. ................................................... 32
FIGURE 4.3-2 TWO FREQUENTLY USED FAULT EVENT SYMBOLS: (1) CIRCLE; (2) RECTANGLE. ........................................................... 32
FIGURE 4.6-1 FTA FOR WHOLE POWER PLANT ...................................................................................................................... 35
FIGURE 4.6-2 FTA FOR COAL HANDLING PLANT .................................................................................................................... 36
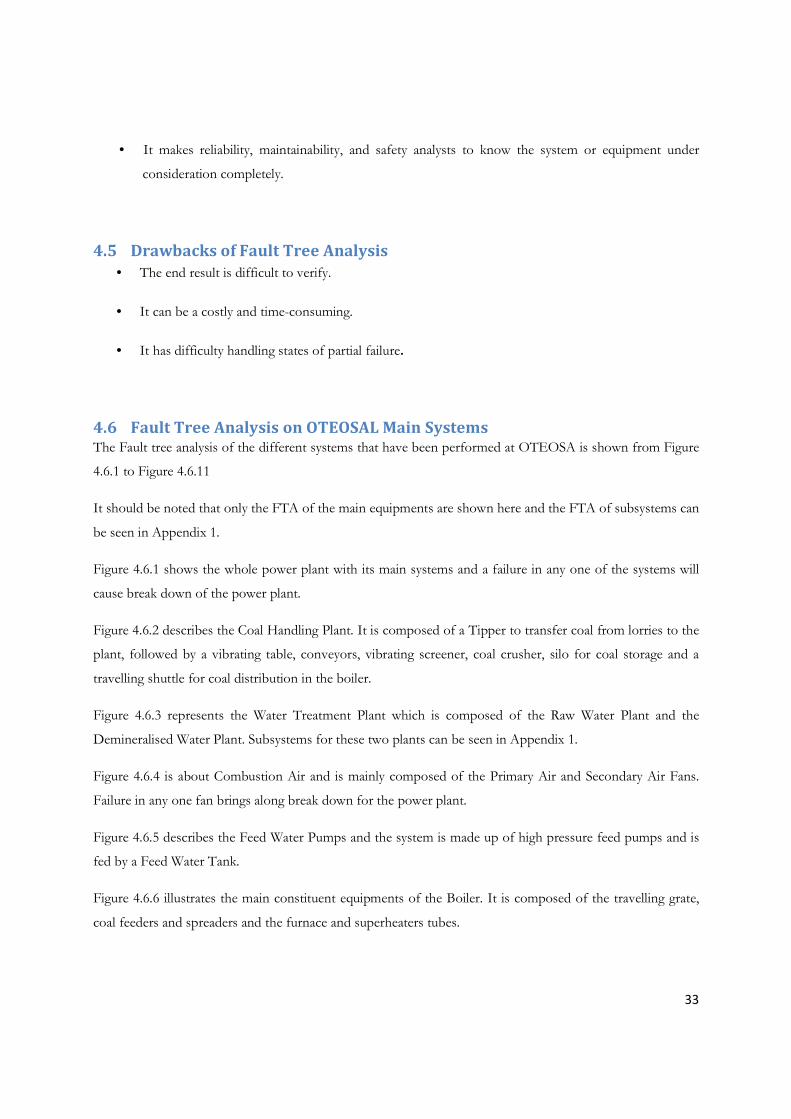
FIGURE 4.6-3 FTA FOR WATER TREATMENT PLANT ............................................................................................................... 37
FIGURE 4.6-4 FTA FOR COMBUSTION AIR ............................................................................................................................ 38
FIGURE 4.6-5 FTA FOR FEED WATER .................................................................................................................................. 39
FIGURE 4.6-6 FTA FOR BOILER .......................................................................................................................................... 40
FIGURE 4.6-7 FTA FOR STEAM DISTRIBUTION ....................................................................................................................... 41
FIGURE 4.6-8 FTA FOR WASTE DISPOSAL SYSTEM ................................................................................................................. 42
FIGURE 4.6-9 FTA FOR TURBO-ALTERNATOR AND AUXILIARY EQUIPMENTS ............................................................................... 43
FIGURE 4.6-10 FTA FOR INSTRUMENTATION AND CONTROL .................................................................................................... 44
FIGURE 4.6-11 FTA FOR COMPRESSED AIR .......................................................................................................................... 45
FIGURE 6.2-1 FTA FOR COAL SPREADER .............................................................................................................................. 57
FIGURE 6.2-2 FTA FOR COAL FEEDER .................................................................................................................................. 58
FIGURE 6.2-3 FTA FOR GEARBOX ....................................................................................................................................... 58
FIGURE 6.2-4 FTA FOR DRIVE MOTOR ................................................................................................................................ 59
FIGURE 6.2-5 FTA FOR TRAVELLING GRATE .......................................................................................................................... 60
FIGURE 6.2-6 FTA FOR GRATE STOCKER ............................................................................................................................... 61
FIGURE 6.5-1 EXAMPLE OF PARETO CHART ........................................................................................................................... 68
FIGURE 6.5-2 PARETO FOR DRIVING PART OF TRAVELLING GRATE FOR THE YEAR 2008 .................................................................. 69
FIGURE 6.5-3 PARETO FOR DRIVING PART OF TRAVELLING GRATE FOR THE YEAR 2009 .................................................................. 69
FIGURE 6.5-4 PARETO FOR DRIVING PART OF TRAVELLING GRATE FOR THE YEAR 2010 .................................................................. 70
FIGURE 6.5-5 PARETO FOR MEAN FREQUENCY OF BREAKDOWN ............................................................................................... 70
FIGURE 6.5-6 PIE CHART REPRESENTING MEAN FREQUENCY OF BREAKDOWN FOR DRIVING PARTS IN TRAVELLING GRATE ................... 71
FIGURE 6.5-7 PARETO FOR REAR DRIVING PART OF TRAVELLING GRATE FOR THE YEAR 2008.......................................................... 72
FIGURE 6.5-8 PARETO FOR REAR DRIVING PART OF TRAVELLING GRATE FOR THE YEAR 2009.......................................................... 72
FIGURE 6.5-9 PARETO FOR REAR DRIVING PART OF TRAVELLING GRATE FOR THE YEAR 2010.......................................................... 73
FIGURE 6.5-10 PARETO OF MEAN FREQUENCY OF BREAKDOWN FOR REAR DRIVING PART OF TRAVELLING GRATE .............................. 73

viii
FIGURE 6.5-11 PIE CHART REPRESENTING MEAN FREQUENCY OF BREAKDOWN FOR REAR DRIVING PARTS IN TRAVELLING GRATE ......... 74
FIGURE 6.5-12 PARETO FOR CHAIN ASSEMBLY PARTS OF TRAVELLING GRATE FOR THE YEAR 2008 .................................................. 75
FIGURE 6.5-13 PARETO FOR CHAIN ASSEMBLY PARTS OF TRAVELLING GRATE FOR THE YEAR 2009 .................................................. 75
FIGURE 6.5-14 PARETO FOR CHAIN ASSEMBLY PARTS OF TRAVELLING GRATE FOR THE YEAR 2010 .................................................. 76
FIGURE 6.5-15 PARETO OF MEAN FREQUENCY OF BREAKDOWN FOR CHAIN ASSEMBLY PARTS OF TRAVELLING GRATE ........................ 76
FIGURE 6.5-16 PIE CHART REPRESENTING MEAN FREQUENCY OF BREAKDOWN FOR CHAIN ASSEMBLY PARTS IN TRAVELLING GRATE ..... 77
FIGURE 6.5-17 PARETO FOR FIXED PARTS OF TRAVELLING GRATE FOR THE YEAR 2008 ................................................................. 78
FIGURE 6.5-18 PARETO FOR FIXED PARTS OF TRAVELLING GRATE FOR THE YEAR 2009 ................................................................. 78
FIGURE 6.5-19 PARETO FOR FIXED PARTS OF TRAVELLING GRATE FOR THE YEAR.......................................................................... 79
FIGURE 6.5-20 PARETO OF MEAN FREQUENCY OF BREAKDOWN FOR FIXED PARTS OF TRAVELLING GRATE ....................................... 79
FIGURE 6.5-21 PIE CHART REPRESENTING MEAN FREQUENCY OF BREAKDOWN FOR FIXED PARTS IN TRAVELLING GRATE .................... 80
FIGURE 6.5-22 PARETO FOR WHOLE TRAVELLING GRATE FOR THE YEAR 2008 ............................................................................ 81
FIGURE 6.5-23 PARETO FOR WHOLE TRAVELLING GRATE FOR THE YEAR 2009 ............................................................................ 81
FIGURE 6.5-24 PARETO FOR WHOLE TRAVELLING GRATE FOR THE YEAR 2010 ............................................................................ 82
FIGURE 6.5-25 PARETO OF MEAN FREQUENCY OF BREAKDOWN FOR WHOLE OF TRAVELLING GRATE ............................................... 82
FIGURE 6.5-26 PARETO FOR COAL FEEDER FOR THE YEAR 2008 ............................................................................................... 83
FIGURE 6.5-27 PARETO FOR COAL FEEDER FOR THE YEAR 2009 ............................................................................................... 84
FIGURE 6.5-28 PARETO FOR COAL FEEDER FOR THE YEAR 2010 ............................................................................................... 84
FIGURE 6.5-29 PARETO OF MEAN FREQUENCY OF BREAKDOWN FOR COAL FEEDER ..................................................................... 85
FIGURE 6.5-30 PIE CHART REPRESENTING MEAN FREQUENCY OF BREAKDOWN FOR COAL FEEDER .................................................. 85
FIGURE 6.5-31 PARETO FOR COAL SPREADER FOR THE YEAR 2008 ........................................................................................... 86
FIGURE 6.5-32 PARETO FOR COAL SPREADER FOR THE YEAR 2009 ........................................................................................... 86
FIGURE 6.5-33 PARETO FOR COAL SPREADER FOR THE YEAR 2010 ........................................................................................... 87
FIGURE 6.5-34 PARETO OF MEAN FREQUENCY OF BREAKDOWN FOR COAL SPREADER .................................................................. 87
FIGURE 6.5-35 PIE CHART REPRESENTING MEAN FREQUENCY OF BREAKDOWN FOR COAL SPREADER .............................................. 88
FIGURE 7.2-1 THE MAINTENANCE WORKFLOW (BS EN13460:2002, 2002) ......................................................................... 101
FIGURE 7.2-2 INPUT/OUTPUT DOCUMENTS (BS EN13460:2002, 2002)............................................................................... 102
Tables
TABLE 1.4—1 EVOLUTION OF TOTAL MAINTENANCE COST ........................................................................................................ 2
TABLE 3.2—1 SUMMARY OF THE MAIN EQUIPMENTS WITH THEIR CONSTITUENT PARTS.................................................................. 30
TABLE 5.5—1 RANKING FOR SEVERITY ................................................................................................................................. 49
TABLE 5.6—1 RANKING FOR OCCURRENCE OF FAILURES .......................................................................................................... 50
TABLE 5.7—1 RANKING FOR DETECTION OF FAILURES ............................................................................................................ 51
TABLE 5.9—1 MAINTENANCE TASK ..................................................................................................................................... 52
TABLE 5.10—1 FMECA TABLE FOR COAL HANDLING PLANT – TIPPER ...................................................................................... 53
TABLE 5.10—2 SUGGESTED MAINTENANCE STRATEGY AND RPN FOR COAL HANDLING PLANT – TIPPER ......................................... 54
TABLE 5.11—1 RPN RANGE .............................................................................................................................................. 55
TABLE 5.12—1 MAINTENANCE TASKS ................................................................................................................................. 55
TABLE 5.12—2 PERCENTAGE CONTRIBUTION OF RESPECTIVE MAINTENANCE TASK FOR BOTH ACTUAL & RCM STRATEGY. ................... 56
TABLE 6.3—1 QUANTITATIVE ANALYSIS FOR THE FTA OF THE COAL SPREADER ........................................................................... 64
TABLE 6.3—2 QUANTITATIVE ANALYSIS FOR THE FTA OF THE COAL FEEDER ............................................................................... 65
TABLE 6.3—3 QUANTITATIVE ANALYSIS FOR THE FTA OF THE TRAVELLING GRATE ........................................................................ 66
TABLE 7.1—1 SHOWS GUIDELINES IN THE NORMATIVE PART FOR THE PREPARATORY PHASE. (BS EN13460:2002, 2002) ................. 90

ix
TABLE 7.1—2 SHOWS GUIDELINES / DOCUMENTS NEEDED WITHIN THE OPERATIONAL PHASE OF EQUIPMENT. (BS EN13460:2002,
2002) ................................................................................................................................................................... 94

x
Nomenclature
CEB Central Electricity Board
CBM Condition based maintenance
CM Corrective maintenance
CMMS Computer maintenance management system
DMAIC Define, Measure, Analyze, Improve, Control
DFSS Design for Six Sigma
ESP Electrostatic precipitator
FMEA Failure Mode Effect Analysis
FF Fault-finding
FTA Fault Tree Analysis
ID Fan Induced Draught Fan
ISO International Standard Organization
IPP Independent power producers
LCE Life Cycle Engineering
LP Heater Low Pressure Heater
MDC Mechanical dust collector
MTTF Mean Time to Failure
OTEOSAL Omnicane Thermal Energy Operations (St Aubin) Ltd
OEE Overall equipment effectiveness
PPA Power purchase agreement
PM Preventive maintenance
RCM Reliability Centered Maintenance
RPN Risk priority number
SCADA Supervisory Control and Data Acquisition
TD Time-directed
1
Introduction
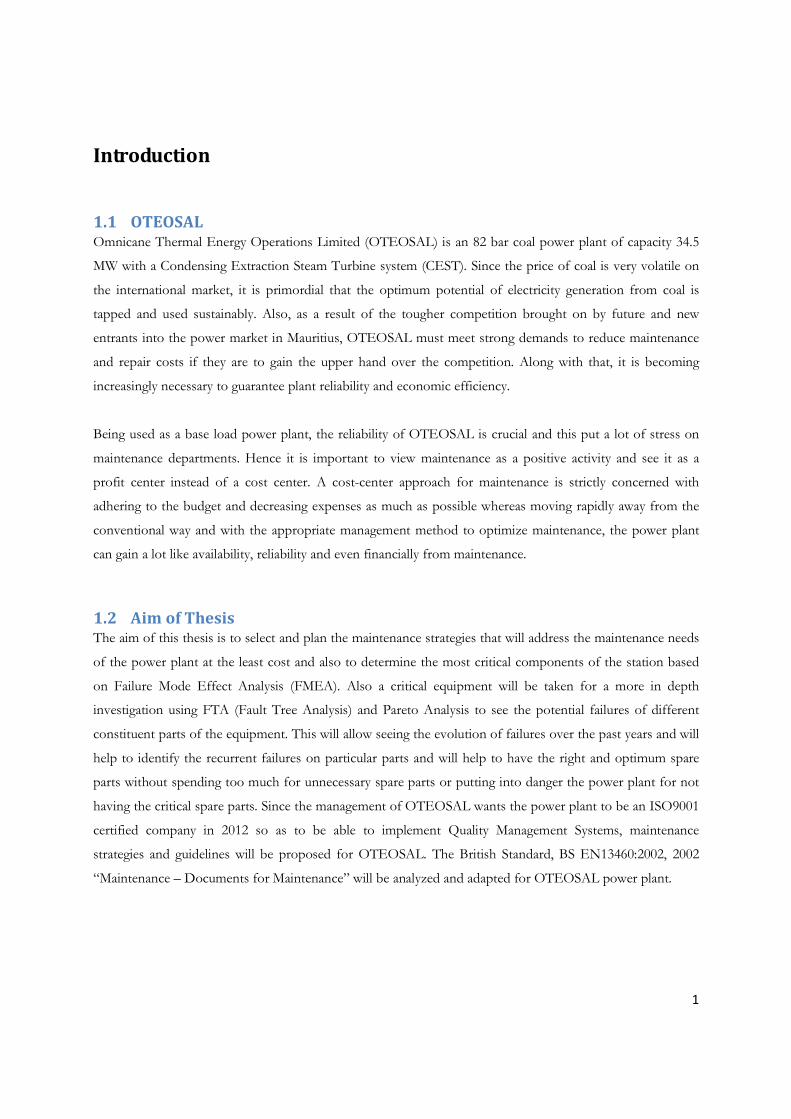
1.1 OTEOSAL Omnicane Thermal Energy Operations Limited (OTEOSAL) is an 82 bar coal power plant of capacity 34.5
MW with a Condensing Extraction Steam Turbine system (CEST). Since the price of coal is very volatile on
the international market, it is primordial that the optimum potential of electricity generation from coal is
tapped and used sustainably. Also, as a result of the tougher competition brought on by future and new
entrants into the power market in Mauritius, OTEOSAL must meet strong demands to reduce maintenance
and repair costs if they are to gain the upper hand over the competition. Along with that, it is becoming
increasingly necessary to guarantee plant reliability and economic efficiency.
Being used as a base load power plant, the reliability of OTEOSAL is crucial and this put a lot of stress on
maintenance departments. Hence it is important to view maintenance as a positive activity and see it as a
profit center instead of a cost center. A cost-center approach for maintenance is strictly concerned with
adhering to the budget and decreasing expenses as much as possible whereas moving rapidly away from the
conventional way and with the appropriate management method to optimize maintenance, the power plant
can gain a lot like availability, reliability and even financially from maintenance.
1.2 Aim of Thesis The aim of this thesis is to select and plan the maintenance strategies that will address the maintenance needs
of the power plant at the least cost and also to determine the most critical components of the station based
on Failure Mode Effect Analysis (FMEA). Also a critical equipment will be taken for a more in depth
investigation using FTA (Fault Tree Analysis) and Pareto Analysis to see the potential failures of different
constituent parts of the equipment. This will allow seeing the evolution of failures over the past years and will
help to identify the recurrent failures on particular parts and will help to have the right and optimum spare
parts without spending too much for unnecessary spare parts or putting into danger the power plant for not
having the critical spare parts. Since the management of OTEOSAL wants the power plant to be an ISO9001
certified company in 2012 so as to be able to implement Quality Management Systems, maintenance
strategies and guidelines will be proposed for OTEOSAL. The British Standard, BS EN13460:2002, 2002
“Maintenance – Documents for Maintenance” will be analyzed and adapted for OTEOSAL power plant.

2
1.3 Objectives of Thesis The outcomes expected from this thesis are to reduce maintenance cost and downtime losses of the steam
power plant and increase profitability by adopting the proper maintenance strategies that ensure its reliable
availability and thus, satisfy the maturing and growing electricity demand of the Mauritian economy.
1.4 Maintenance data for OTEOSAL The total maintenance cost (in Mauritian Rupees) as in Table 1.1 for OTEOSAL from year 2008 to 2011 is
seen to be increasing and has even double from 2008 to 2011. According to the people from the maintenance
department, the cost of external labor during operation has increased by nearly four times due to a lot of
breakdown on different equipments and has needed urgent intervention of external labor to prevent the
power plant from shutting down. Also the value of the spare parts store is seen to rise (Figure 1.4-1 [B])
because many spare parts are bought at random in fear of having a shut down due to unavailability of spare
parts. But these excess expenses on unnecessary spare parts prevent the power plant from using wisely its
finance and also contribute to a loss in profitability. All this is due to a lack of a good maintenance strategy
and knowledge of the criticalities and failure rates of particular equipments.
Table 1.4—1 Evolution of Total Maintenance Cost
2008 2009 2010 2011
Cost of Spare Parts used (Rs) 14,680,737.78 23,303,201.60 12,508,640.50 26,751,309.20
Cost of External Labour during operation (Rs) 2,985,074.87 4,543,213.92 7,195,333.01 12,818,026.67
Cost of External Labour during shut down (Rs) 4,028,727.77 4,609,677.35 8,674,446.14 5,034,165.81
Total Maintenance Cost (Rs) 21,694,540.42 32,456,092.87 28,378,419.65 44,603,501.68
Figure 1.4-1 [A] Bar Chart representing Evolution of total Maintenance Cost and [B] Chart representing
Evolution of the value of the spare part store
[A] [B]
3
2 Background and Literature Review
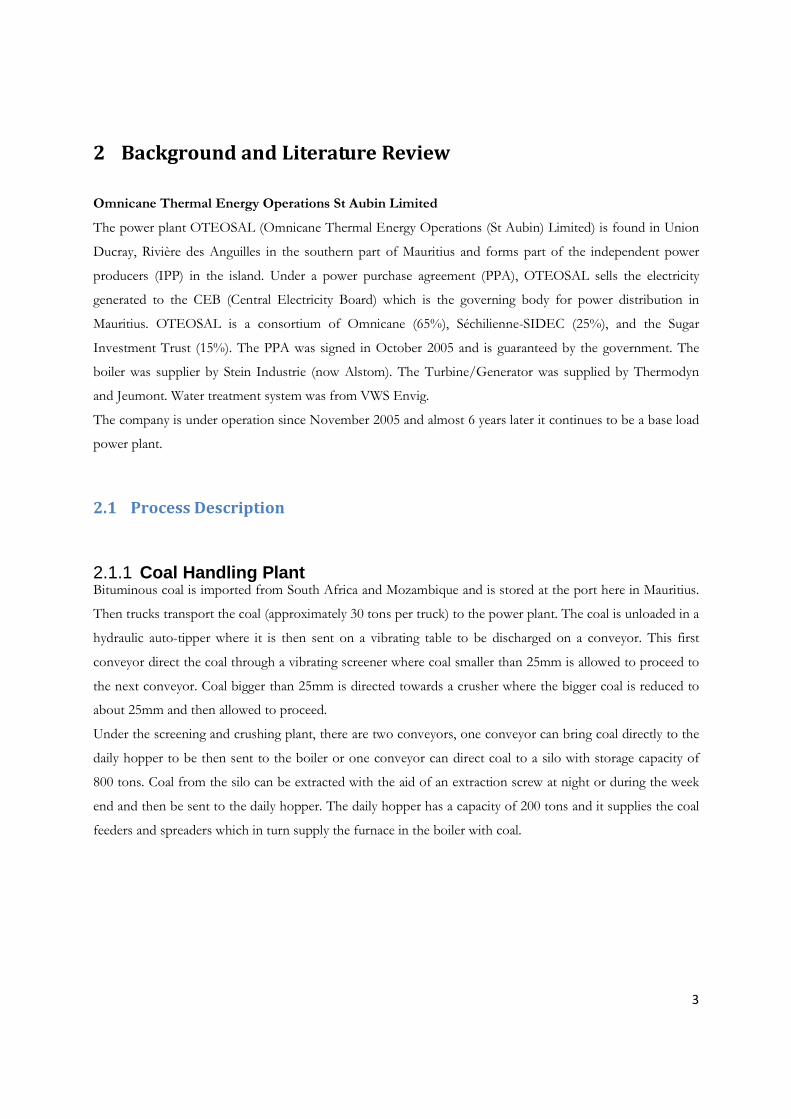
Omnicane Thermal Energy Operations St Aubin Limited
The power plant OTEOSAL (Omnicane Thermal Energy Operations (St Aubin) Limited) is found in Union
Ducray, Rivière des Anguilles in the southern part of Mauritius and forms part of the independent power
producers (IPP) in the island. Under a power purchase agreement (PPA), OTEOSAL sells the electricity
generated to the CEB (Central Electricity Board) which is the governing body for power distribution in
Mauritius. OTEOSAL is a consortium of Omnicane (65%), Séchilienne-SIDEC (25%), and the Sugar
Investment Trust (15%). The PPA was signed in October 2005 and is guaranteed by the government. The
boiler was supplier by Stein Industrie (now Alstom). The Turbine/Generator was supplied by Thermodyn
and Jeumont. Water treatment system was from VWS Envig.
The company is under operation since November 2005 and almost 6 years later it continues to be a base load
power plant.
2.1 Process Description
2.1.1 Coal Handling Plant Bituminous coal is imported from South Africa and Mozambique and is stored at the port here in Mauritius.
Then trucks transport the coal (approximately 30 tons per truck) to the power plant. The coal is unloaded in a
hydraulic auto-tipper where it is then sent on a vibrating table to be discharged on a conveyor. This first
conveyor direct the coal through a vibrating screener where coal smaller than 25mm is allowed to proceed to
the next conveyor. Coal bigger than 25mm is directed towards a crusher where the bigger coal is reduced to
about 25mm and then allowed to proceed.
Under the screening and crushing plant, there are two conveyors, one conveyor can bring coal directly to the
daily hopper to be then sent to the boiler or one conveyor can direct coal to a silo with storage capacity of
800 tons. Coal from the silo can be extracted with the aid of an extraction screw at night or during the week
end and then be sent to the daily hopper. The daily hopper has a capacity of 200 tons and it supplies the coal
feeders and spreaders which in turn supply the furnace in the boiler with coal.

4
Figure 2.1-1 Conveyor in the Coal Handling
Plant
Figure 2.1-2 Coal Handling Plant
5
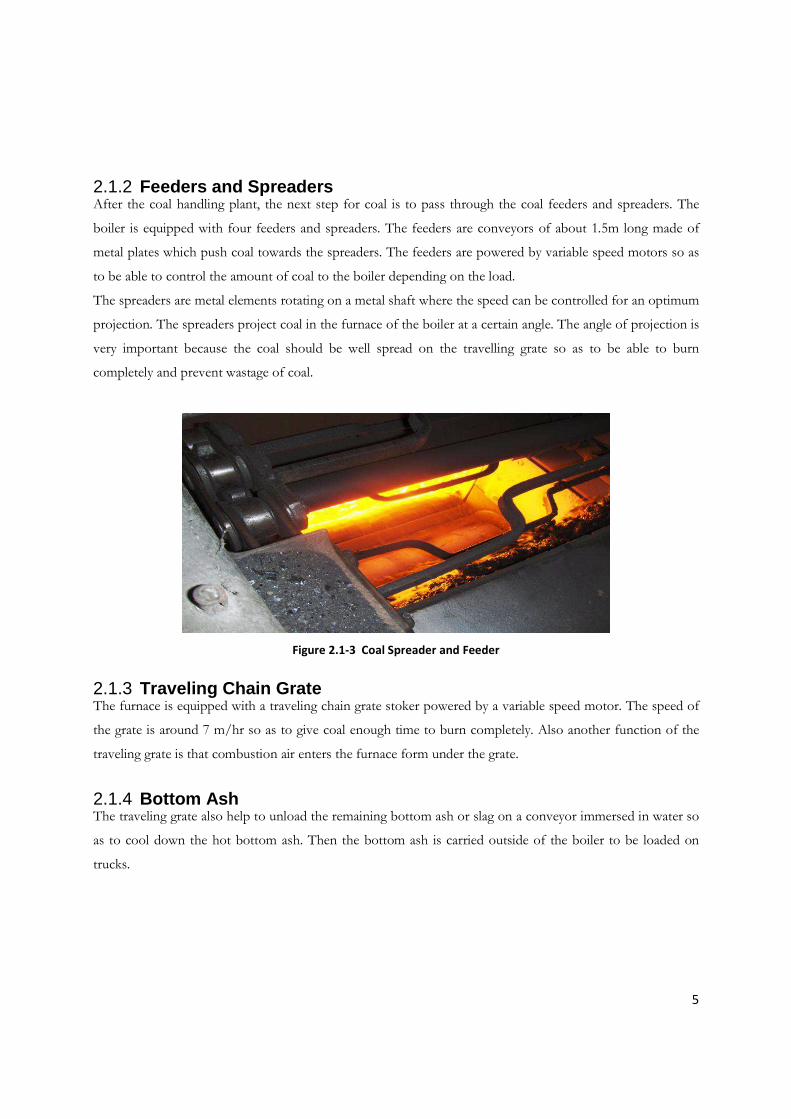
2.1.2 Feeders and Spreaders After the coal handling plant, the next step for coal is to pass through the coal feeders and spreaders. The
boiler is equipped with four feeders and spreaders. The feeders are conveyors of about 1.5m long made of
metal plates which push coal towards the spreaders. The feeders are powered by variable speed motors so as
to be able to control the amount of coal to the boiler depending on the load.
The spreaders are metal elements rotating on a metal shaft where the speed can be controlled for an optimum
projection. The spreaders project coal in the furnace of the boiler at a certain angle. The angle of projection is
very important because the coal should be well spread on the travelling grate so as to be able to burn
completely and prevent wastage of coal.
Figure 2.1-3 Coal Spreader and Feeder
2.1.3 Traveling Chain Grate The furnace is equipped with a traveling chain grate stoker powered by a variable speed motor. The speed of
the grate is around 7 m/hr so as to give coal enough time to burn completely. Also another function of the
traveling grate is that combustion air enters the furnace form under the grate.
2.1.4 Bottom Ash The traveling grate also help to unload the remaining bottom ash or slag on a conveyor immersed in water so
as to cool down the hot bottom ash. Then the bottom ash is carried outside of the boiler to be loaded on
trucks.

6
Figure 2.1-4 Travelling Grate Stoker and Bottom ash conveyor
Travelling Grate
Botton Ash Conveyor

7
2.1.5 Air preheater Combustion air from the primary and part of the secondary air is channeled through an air preheater. This air
preheater uses hot boiler water which comes from the economizers to preheat combustion air. The air
temperature then varies from 80 °C to 120 °C
2.1.6 Primary and Secondary Air The combustion of coal in the furnace is done by primary and secondary air. Primary air is obtained from a
fan equipped with dampers so as to be able to control the amount of air entering the furnace. The primary air
enters the furnace from under the traveling grate. Before entering the furnace, the primary air passes through
an air pre-heater to be heated up to around 110 °C. The secondary air is also obtained from a fan equipped
with dampers. For the secondary air, part of it is heated and part of the air is left at room temperature. Part of
the heated air is injected in the boiler from under the spreaders in order to burn small particles of coal
projected and the other part enters the furnace at the back of the boiler where this air is injected about 3
meters high in the furnace so as to complete combustion at this height. On the other hand, the unheated air is
injected in front of the furnace just above the traveling grate.
2.1.7 Induced Draught Fan The combustion of coal produces flue gas and this flue gas must be evacuated from the furnace. This is done
by the induced draught fan which is driven by a variable speed motor and equipped with dampers. The ID
Fan also keeps a slight depression in the furnace chamber to prevent flue gas from getting out of the furnace.
2.1.8 Re-injection of Fly Ash As a result of coal combustion, there is a lot of fly ash produced and this fly ash is rich in unburned carbon.
The fly ash is taken away from the furnace by the action of the induced draught fan (ID Fan). Since fly ash is
rich in unburned carbon and represents a useful source of energy, it is collected via a mechanical dust
collector (MDC), channeled through pipes and rotating valves and then re-injected in the furnace with the aid
of a blowing fan.

8
Figure 2.1-5 Mechanical dust collector
2.1.9 Economizers The flue gas duct is fitted with two finned tubes economizers and since after the mechanical dust collector
(MDC) the temperature of the flue gas is around 450 °C, this source of heat is used to pre-heat boiler water.
The boiler water before the first economizer which is second in the flow of flue gas is about 110 °C and after
the economizer it is around 170 °C. Then after the second economizer, the boiler water reaches around 230
°C. This heated water then passes through the air preheater as described before.
2.1.10 Electrostatic Precipitator and Fly Ash The next step is to pass the flue gas through an electrostatic precipitator (ESP) in order to gather and convey
all the fly ash into a silo. The fly ash is then channeled to trucks and transported away.

9
Figure 2.1-5 Coal Spreader and Feeder
Mechanical
Dust Collector
Economizer
Electrostatic
Precipitator Boiler
Chimney
Secondary Air
Fan
Primary Air Fan
Air Heater

10
2.1.11 Boiler Water The demineralised water plant generates the boiler water which is directed to the feed water tank. The
demineralised water is then heated from the extracted steam at 3 bars from the turbine. The feed water tank
provides the feed water pumps which propels water at 115 bars and this water passes via the economizers and
finally to the boiler. Added to that, the flowrate of feed water to the boiler is about 128 m3/hr. The boiler is
of water tube type. This type of boiler is used for the production of high pressure and superheated steam up
to 160 bars and 500 ˚C. Water tube boilers consist of a series of the water tubes arranged inside a furnace in a
number of possible configurations. These tubes receive water from the feed water tank and connect the lower
drum to the upper drum. In the furnace where combustion takes place the heat is transferred mainly by
radiation to tubes. Saturated steam is generated in the boiler and then goes through superheaters to come at
82 bars and 525 ˚C superheated. The superheated steam then passes into the turbine for expansion.
Figure 2.1-6 Demineralised Water Treatment Plant
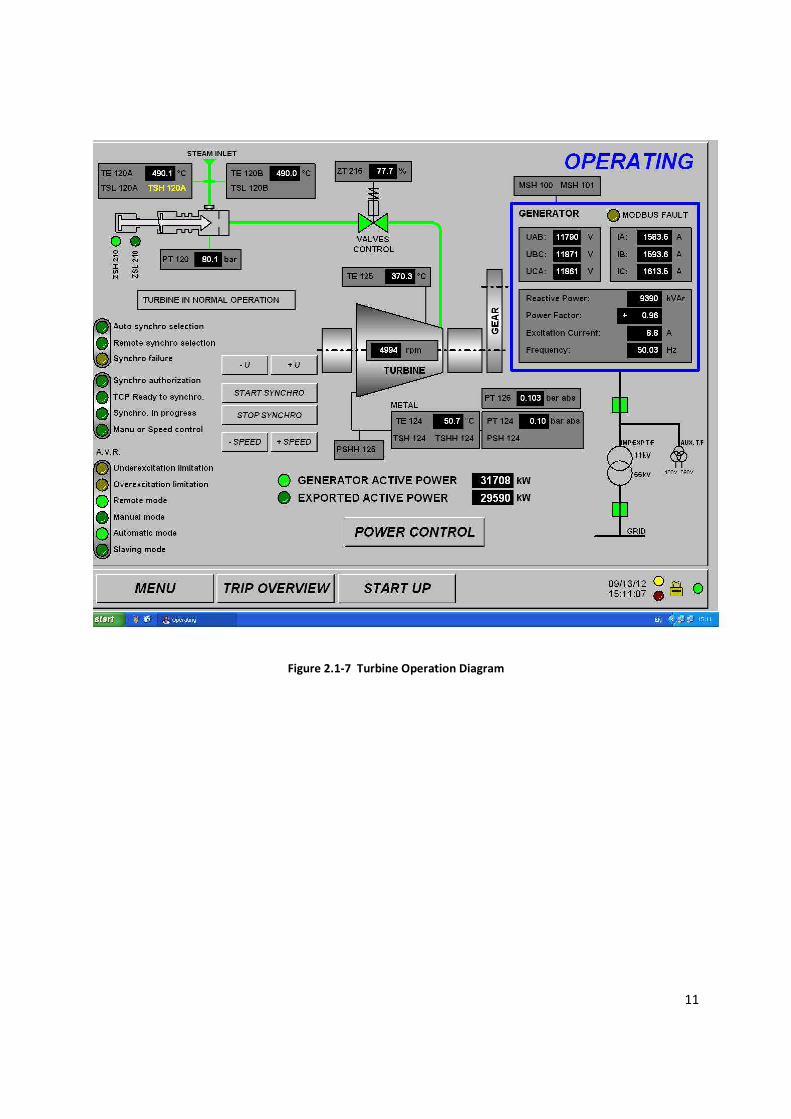
2.1.12 Steam Turbine and Electric Generator Superheated steam enters the turbine at 82 bars and is expanded to about 100 mbars. The amount of
superheated steam at the inlet of the turbine is controlled by inlet valves which allow the optimum flow of
steam in the turbine. The energy produced turns the turbine at 5000 rpm. Steam is extracted from the turbine
at 2 stages. The first extracted steam is used to heat feedwater in the feedwater tank. The second extraction is
to heat return condensate in a LP (Low Pressure) Heater (close feedwater heater). The steam turbine is
coupled to a reduction gear where the speed of the turbine is reduced to 1500 rpm and the reduction gear is
coupled to an electric generator to produce 34.5 MW net. The electric generator produces voltage at 11 KV
and then is stepped up in transformers to 66KV to then be sent to the national grid.
11
Figure 2.1-7 Turbine Operation Diagram

12
2.1.13 Condenser and Cooling Tower After expansion in the turbine, the saturated steam is cooled down in the condenser to around 80 ˚ C. The
condenser is basically a shell and tube heat exchanger. The return condensate is then pumped back to the
feedwater tank with the help of a centrifugal pump. The cooling of the saturated steam is done with the help
of recirculating water at about 35 ˚ C in the condenser and this recirculated water is cooled down in the
cooling tower. The cooling tower is an induced draught type making the use of fans to create the draught.
Figure 2.1-8 Condenser
Figure 2.1-9 Cooling Tower
13
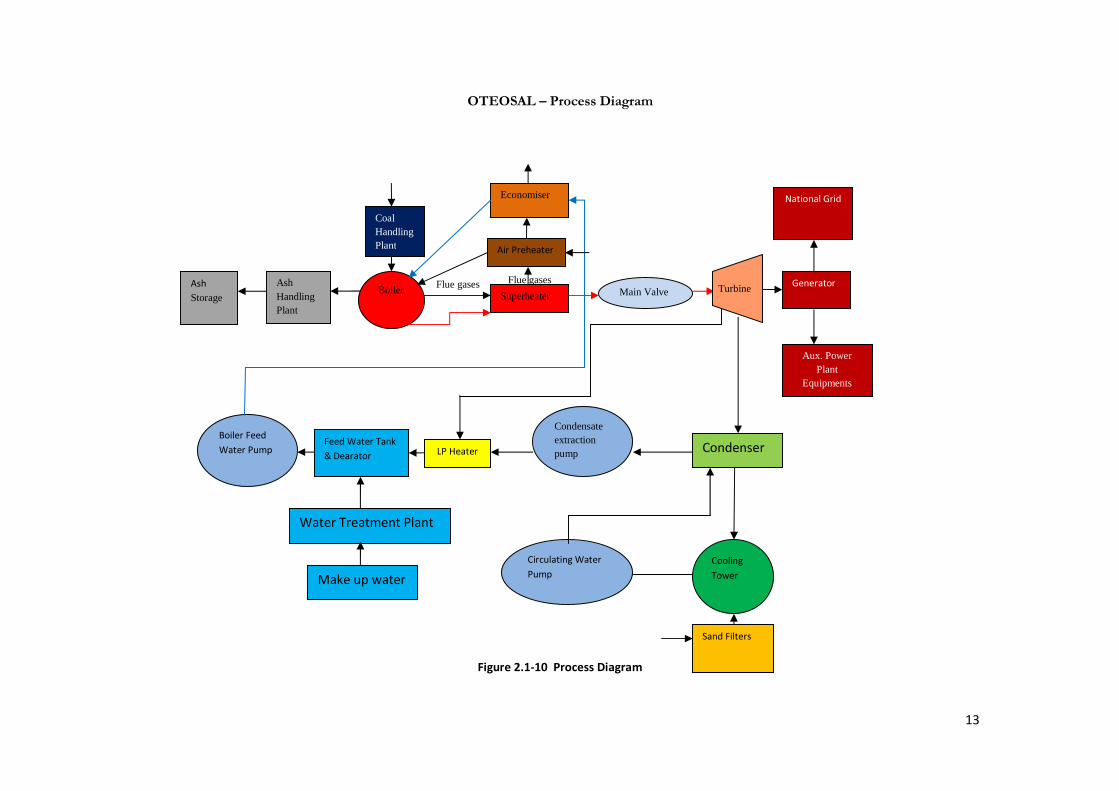
OTEOSAL – Process Diagram
Figure 2.1-10 Process Diagram
Ash Storage
Ash Handling Plant
Boiler
Coal Handling Plant
Economiser
Superheater
Air Preheater
Main Valve Generator
National Grid
Aux. Power Plant
Equipments
Condenser
Condensate extraction pump LP Heater
Feed Water Tank
& Dearator
Boiler Feed
Water Pump
Cooling
Tower
Sand Filters
Circulating Water
Pump
Water Treatment Plant
Make up water
Flue gases Flue gases Turbine

14
2.2 Maintenance at OTEOSAL
Since OTEOSAL is operated as a base load power station, this put greater challenges to the maintenance
teams so as to ensure high availabilities and reliabilities of the power plant. Also since Mauritius is an island
deprived of natural resources like coal, a good maintenance management is important to ensure sustainability
of the resources and meet the growing expectations from its sole client the CEB.
OTEOSAL and like many other coal power plants in Mauritius build their own maintenance management
systems depending on their maintenance needs, their intuitive judgment and experiences and supported by
recommendations of the manuals of the different equipments composing the power stations.
Most manufacturers of equipment recommend maintenance practices accompanying their equipment in the
maintenance manuals. Their recommendations assume application and operation of equipment according to
design conditions. In practice, equipment are rarely operated according to design. Overloading or
underutilizing equipment and operating them in environmental conditions not always according to design
conditions result in maintenance recommendations in the maintenance manual ineffective.
2.3 Maintenance Management Strategies and Methods
The maintenance cost in probably most industries is quite significant and therefore, an evolution in
maintenance management has certainly been the driving force to reduce maintenance costs, improve
productivity, the quality of work and ensure human, equipments and environmental safety.
The literature about the different maintenance methods is quite numerous. For this thesis, maintenance
management methods like preventive maintenance (PM), condition based maintenance (CBM), corrective
maintenance (CM) along with six sigma, lean maintenance and reliability centered maintenance (RCM) will be
reviewed.
2.3.1 Preventive Maintenance
Preventive maintenance (PM) is a time based maintenance method in which the maintenance activities are
planned and scheduled based on predetermined counter intervals in order to prevent breakdowns and failures
from occurring (Clety, 2008). The book ‘applied reliability centered maintenance’ (Jim August, 1999) defines
PM as any scheduled preventive tasks intended to reduce the probability of failure of equipment. Also a

15
preventive maintenance (PM) approach is to prevent the problems associated with CM so as to get rid of the
waste and decrease asset life cycle costs.
PM tasks are carried out to avoid failure, to detect initial failure, or to determine hidden failure (Smith, 1993).
This results in three types of PM task:
(1) time-directed (TD);
(2) CBM; and
(3) fault-finding (FF).
A TD task may refer to the replacement of a component, in which case it is an suitable choice only when the
hazard rate is an increasing function of age (i.e. new items are better than old ones in terms of probability of
imminent failure or other measures of usefulness), and the cost of a preventive replacement is considerably
less than the cost of a failure and its associated repair (Mann et al., 1995).
A CBM task is carried out to notice early failures long before their occurrence. CBM uses condition
monitoring techniques to find out whether a problem exists in equipment, how severe the problem is, and
how long the equipment can run before failure; or to detect and identify specific components (e.g. gear sets,
bearings) in the equipment that are deteriorating (i.e. the failure mode) .
An FF task is carried out at a fixed plan decided in advance to verify the health conditions of rarely used
items such as protective devices and standby units.
The aim of PM is to enhance equipment performance and reliability by preventing failure of equipment. PM
is commonly used where equipment failure is age related or where the equipment failure rates follow what is
called bath-tub curve. (Figure 2.3-1)
Figure 2.3-1 The bathtub curve for preventive maintenance (Mobley, R.K., 2002)

16
The different tasks that are performed in a PM include inspections, adjustments, tests, calibrations, rebuilding
and replacements of parts.
By adopting PM, the objectives and benefits are (Clety, 2008):
• Improved system reliability.
• Decreased cost of replacement.
• Decreased system downtime.
• Better spares inventory management.
However, for the good running of a PM system, a list of tools, spare parts and instruments required should
be available. A procedure to record the measurements to be made should also be present. Emphasis should
also be made on the limits or ranges for the parameters to be measured.
Required safety procedures such as isolation and locking out must also be available.
In order to be able to organize a PM strategy, recommendations in maintenance manuals from equipment
suppliers should be available along with the knowledge of the different persons working in the maintenance
teams.
As all maintenance systems, advantages and disadvantages do exist as are discussed below. The performance
of PM has many advantages including increase in equipment availability, performed as convenient, balanced
workload, increase in production revenue, consistency in quality, reduction in need for standby equipment,
stimulation in preaction instead of reaction, reduction in parts inventory, improved safety and easy availability
of scheduled resources. Whereas, some disadvantages of PM are: exposing equipment to possible damage,
using a greater number of parts, increases in initial costs, failures in new parts/components, and demands
more frequent access to equipments. (B.S Dhillon, 2002)
2.3.2 Condition based maintenance
CBM Systems or Predictive Maintenance (PdM) methods are an extension of preventive maintenance and
have been proved to minimize the cost of maintenance, improve operational safety and reduce the frequency
and severity of in-service machine failures. The basic theory of condition monitoring is to know the
deteriorating condition of a machine component, well in advance of a breakdown.
Condition based maintenance is a set of maintenance actions based on the evidence of need for maintenance
obtained from real time assessment of equipment condition obtained from embedded sensors and external

17
tests and measurement taken by portable equipment. (Michael V Brown, 2003). Also, Predictive maintenance
(PdM) involves comparing the trends of measured physical parameters against known engineering limits for
the purpose of detecting, analyzing and correcting problems before failure occurs
There are varieties of critical equipments in power plants. These components require routine inspection to
ensure their integrity. The purpose of the inspection is to identify any degradation in the integrity of the
systems during their service life and to provide an early warning in order that remedial action can be taken
before failure occurs. Assessing the condition is necessary to optimize inspection and maintenance schedules,
so as to be able to make decisions and to avoid unplanned outages.
To maintain an efficiently power plant and avoid failure of critical equipments, it is necessary to maintain the
critical parts of these equipments. The effect of planned maintenance is depending upon the methods used
for maintenance. The combination of corrective, preventative and condition based maintenance is primordial
for critical equipments. This type of maintenance policy and strategy will improve performance of power
plants through the availability of critical equipments.
CBM is system that strives to identify faults before they become critical which enables accurate planning of
PMs. With CBM, the different critical equipments are assessed while in operation and a decision is made as to
whether they need maintenance or not and if so, when it should be done to prevent failures. Assessments can
be of all kind ranging from like simple visual inspection or fully automated system to sense, receive and
process performance data, monitor, diagnose and predict failure.
Condition monitoring techniques and their applications to a power plant
Vibration monitoring measures the frequency and amplitude of vibrations which are mainly caused by
misalignment, rotational imbalance, wear and improper installation of equipment, and looseness of assembled
parts. Vibrations are undesirable because they lead to damage and the eventual failure of the equipments.
Vibration monitoring and analysis are important means to detect future failures in rotation machines and can
be used to prevent costly failures.
In oil analysis, samples of lubricating, hydraulic, or dielectric oil are examined at frequent periods to
determine the quality and metal contents of the oil. If these measurements show that the oil quality has
deteriorated to an intolerable level, it will be substituted to guarantee adequate operation of the equipments.
The analysis comprises of spectrographic techniques and diagnostic procedures to examine the elements
contained in the oil sample. The state of health of the machine can also be revealed by scrutinizing the size,
shape, quantity and composition of wear particles in the oil samples.

18
Ultrasonic technology is also used in CBM because ultrasonic apparatus are sensitive to high-frequency
sounds. These high-frequency sounds are inaudible to the human ear and therefore ultrasonic apparatus
distinguishes them from lower-frequency sounds and mechanical vibration. Machine friction and stress
produce distinctive sounds in the upper ultrasonic range and changes in these friction and stress waves can
indicate deteriorating conditions for a particular equipment. An ultrasonic apparatus can differentiate normal
wear from abnormal wear, physical damage, imbalance conditions and lubrication problems. Therefore this
give sufficient time to prepare for maintenance and helps in spare part management.
Infrared Thermography is also widely used in power plants to detect heat signature created by faulty
mechanical equipment, high electrical resistance or high current flow in electrical systems.
2.3.3 Corrective Maintenance
Corrective maintenance (CM), also known as breakdown maintenance, is done to bring back an equipment in
a state of working condition after a failure has occurred. The logic of run-to-failure management is easy and
direct.
A plant using run-to-failure management does not spend any money on maintenance until a machine or
system break down. However, few plants use a true run-to-failure management philosophy. In almost all
instances, plants carry out basic preventive tasks (i.e., lubrication and machine adjustments) even in a run-to-
failure environment. The major expenses linked with this type of maintenance management are:
• High spare parts inventory costs.
• High overtime labor costs.
• High machine downtime.
• Low production availability.
2.3.4 Reliability-centered maintenance (RCM)
In a reliability-centered maintenance (RCM) process, systematically all of the functions and functional failures
of assets should be identified. This process also identifies all likely causes for these failures. Then RCM
proceeds to identify the effects of these likely failure modes and to identify in what way those effects matter.
Once it has gathered this information, the RCM process then selects the most appropriate asset management
policy. (L.R. Higgins, 2008)

19
On the other hand, Reliability centered maintenance (RCM) magazine provides the following definition of
RCM: “a process used to determine the maintenance requirements of any physical asset in its operating
context.”
Basically, RCM methodology deals with some key issues not dealt with by other maintenance programs and it
is aware that all equipment in a facility is not of equal importance to either the process or facility safety. Also
it recognizes that equipment design and operation differs and that different equipment will have a higher
probability to undergo failures from different degradation mechanisms than others.
RCM also approaches the structuring of a maintenance program recognizing that a facility does not have
unlimited financial and personnel resources and that the use of both need to be prioritized and optimized.
Hence, RCM is a systematic approach to evaluate a facility’s equipment and resources to best combine the
two and result in a high degree of facility reliability and cost-effectiveness.
Some advantages and disadvantages of RCM are:
Advantages
• Can be the most efficient maintenance program.
• Lower costs by eliminating unnecessary maintenance or overhauls.
• Minimize frequency of overhauls.
• Reduced probability of sudden equipment failures.
• Able to focus maintenance activities on critical components.
• Increased component reliability.
• Incorporates root cause analysis.
Disadvantages
• Can have significant startup cost, training, equipment, etc.
• Savings potential not readily seen by management
The procedure involves asking questions on the following subjects in a RCM:
• The functions and related performance standards of an item in its present working condition.
• Possible ways in which the item may fail to carry out its required tasks.
• Causes of each functional failure.
• Events that follow each failure.
• Significance of each failure.
• Measures to prevent failure.
• Corrective measures that may be taken if there is no appropriate preventive step.

20
RCM Process
The RCM process takes place first during the equipment design and development stage, when it is used to
develop maintenance plans. During product process and use, these plans are then revised based on field
experience. The following two criteria are keys to the maintenance plans:
• Parts that are not critical to safety. In this case, preventive maintenance tasks should be chosen
that will decrease the ownership life cycle cost.
• Parts that are critical to safety. In this case, preventive maintenance actions should be chosen
that will help to prevent reliability or safety from reducing to an undesirable stage, or will help to
decrease the ownership life cycle cost. It is through the preventive maintenance program that initial
failures are identified and corrected, the probability of failure is decreased, hidden failures are
detected, and the cost-effectiveness of the maintenance program is improved.
RCM methodology
The RCM methodology is completely described in four unique features:
• Safeguard functions.
• Detect failure modes that can make the functions fail.
• Prioritize function need (via failure modes).
• Select applicable and effective PM tasks for the high priority failure modes.
21
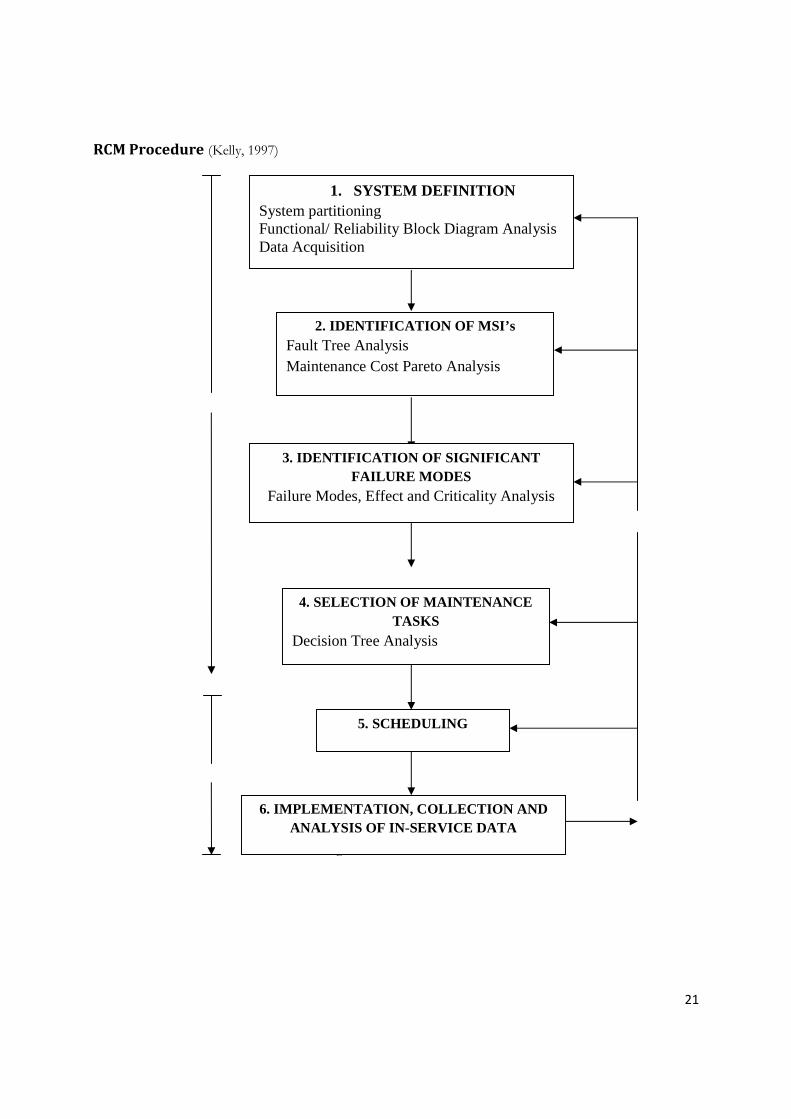
RCM Procedure (Kelly, 1997)
Figure 9: RCM Procedure
1. SYSTEM DEFINITION System partitioning Functional/ Reliability Block Diagram Analysis Data Acquisition
2. IDENTIFICATION OF MSI’s Fault Tree Analysis Maintenance Cost Pareto Analysis
3. IDENTIFICATION OF SIGNIFICANT FAILURE MODES
Failure Modes, Effect and Criticality Analysis
6. IMPLEMENTATION, COLLECTION AND ANALYSIS OF IN-SERVICE DATA
5. SCHEDULING
4. SELECTION OF MAINTENANCE TASKS
Decision Tree Analysis

22
The basic RCM process is composed of the following steps:
1. Identify important items with respect to maintenance.
Usually, maintenance important items are identified using techniques such as failure, mode, effects, and
criticality analysis (FMECA) and fault tree analysis (FTA).
2. Obtain appropriate failure data.
In determining occurrence probabilities and assessing criticality, the availability of data on part failure rate,
operator error probability, and inspection efficiency is essential. These types of data come from field
experience, generic failure databanks, etc.
3. Develop fault tree analysis data.
Probabilities of occurrence of fault events— basic, intermediate, and top events are calculated as per
combinatorial properties of the logic elements in the fault tree analysis.
4. Apply decision logic to critical failure modes.
The decision logic is designed to lead, by asking standard assessment questions, to the most desirable
preventive maintenance task combinations. The same logic is applied to each crucial mode of failure of each
maintenance-important item.
5. Classify maintenance requirements.
Maintenance requirements are categorized into three classifications: on-condition maintenance requirements,
condition-monitoring maintenance requirements, and hard-time maintenance requirements.
6. Implement RCM decisions.
Task frequencies and intervals are set as part of the overall maintenance strategy or plan.
7. Apply sustaining-engineering on the basis of field experience.
Once the system/equipment start operating, the real-life data begin to accumulate. At that time, one of the
most urgent steps is to re-evaluate all RCM-associated default decisions.
RCM Components
The four major components of RCM are: corrective maintenance, preventive maintenance, predictive testing
and inspection, and proactive maintenance.
23
Industries can benefit a lot from RCM in various ways as enumerated below:
• Traceability. The information, assumptions and reasoning that led to all maintenance policy
decisions are fully documented. Hence, subsequent plant reliability can be periodically audited
maintenance experience reviewed and strategy updated (where necessary) on a rational basis.
• Rationalism. By identifying unnecessary preventive work unachievable maintenance workload is
eliminated.
• Cost saving. Overall workload is reduced due to a general shift from away from time-based
preventive works towards condition-based work. Hence, a reduction in spares holding.
• Plant improvement. Re-design eliminates recurrent failures or poor maintainability‘s.
• Education. The whole exercise raises the workforce‘s overall level of skill and technical
knowledge. Moreover, the actual existence of a RCM regime will itself tend to attract better-skilled
personnel in maintenance.
2.3.5 Lean Maintenance Lean Maintenance means reliability and reduced need for maintenance troubleshooting and repairs. Also Lean
Maintenance comes from protecting against the real causes of equipment downtime and not just their
symptoms. (Howard C. Cooper, 2002)
On his part, Ricky Smith of Life Cycle Engineering (LCE) defines lean maintenance as ‘a proactive
maintenance operation employing planned and scheduled maintenance activities through total productive
maintenance practices using maintenance strategies developed through application of reliability centered maintenance
(RCM) decision logic and practiced by empowered (self-directed) action teams using the 5S process, weekly Kaizen
improvement events, and autonomous maintenance together with multi-skilled, maintenance technician-performed
maintenance through the committed use of their work order system and their computer managed maintenance
system (CMMS) or enterprise asset management system’ (Ricky Smith, 2004).
The key elements of a lean maintenance method can be summarized as described below (Clety, 2008 and
Ricky Smith, 2004):
• Proactive maintenance means that lean maintenance uses PM and CBM strategies to prevent
and predict failure instead of reacting to it.

24
• Planned and scheduled means that the maintenance activities are documented in such a way
that the required activities, labour needs, spare parts and time needed to complete the tasks are
known in advance. By being scheduled, the maintenance activities are prioritized and assigned a
designated action time.
• Application of RCM decision logic means lean maintenance tasks are optimized.
• Self empowered teams’ means lean teams are designed so that a maintenance team has all the
skills required to execute all the tasks within the team.
• Application of 5S: sort (remove unwanted items), straighten (organize), scrub (clean),
standardize (make routine), spread (expand to other areas).
• Kaizen means that lean focuses on continuous evaluation and improvement of the
maintenance processes in terms of time, resources use and quality of work.
In his article ‘lean principles’ Jerry Kilpatrick classifies the benefits of lean maintenance into three types (Jerry
Kilpatrick, 2003):
1. Operational gains– reduced lead time, increase productivity, reduced inventory and improved quality.
2. Administrative improvements – reduced paperwork, reduced staffing, reduced process errors, streamlined
customer care, cost reduction, job standardization.
3. Strategic gains in achieving overall company goals.
Kishan Bagadia in the white paper from Infor global solutions identifies four areas that can benefit from lean
maintenance as optimization of spare parts inventory management, achieving quality preventive maintenance
through better management, cross training of staff for multi-skilled task force and a continuous improvement
drive in the maintenance spectrum.
2.3.6 Six Sigma According to Stan Grabill, a certified Six Sigma expert (Black Belt) writing for Maintenance Technology’s
Viewpoint column, Six Sigma focuses on reducing variation in a business’ internal processes using a
rigorously structured, statistical approach that is tied to business results.

25
He also states that Six Sigma for asset dependability reduces the variation in design, procurement, installation,
operation, reliability, and maintainability of equipment assets in order to provide predictable performance at
optimal cost of ownership.
Stan Grabill thinks of Six Sigma as root cause variation analysis, where a different set of tools is used to
identify sources of variation and determine a means to mitigate “bad” variation and control “good” variation
to enhance output productivity. The reason to do this highly structured methodology is to reap the business
benefits of reducing variation, which results in break-through productivity improvements. (Stan Grabill, 2001)
Originated by Motorola, Six Sigma took hold in a big way in the early 1990s. The focus was reducing variation
in manufacturing processes.
Six Sigma does not create new tools but uses existing ones. The main methodologies of Six Sigma are Define,
Measure, Analyze, Improve, Control (DMAIC) and Design for Six Sigma (DFSS).
DMAIC (Robson Quinello, 2003)
Robson Quinello explains that to apply Six Sigma in maintenance, work groups that have a good
understanding of preventive maintenance techniques in addition to a strong leadership commitment should
be first found.
The methodology is divided into five distinct phases:
• Phase D (Define). Establish the objectives of the department and identify the critical-for-quality
processes. In this phase, leaders, planners, maintenance staff, need to work together to set
departments goals.
• Phase M (Measure). After teams have made their choices, the indexes, data collection plan, and
analysis method can be chosen. Some common indexes include frequency of preventive
maintenance, frequency of predictive maintenance, productivity, number of corrective occurrences,
maintenance costs, downtime, pulse survey, overall equipment effectiveness (OEE), etc.
• Phase A (Analyze). Teams will use analysis graphs (Pareto, scatter, run chart, box plots, etc.) to
visualize trends and to search for root causes.
• Phase I (Improve). An action plan and failure mode and effects analysis (FMEA) can help in the
action definition to improve the performance of the chosen indexes.
• Phase C (Control). Teams will outline a plan to retain the gains after the conclusion of the project.
The finance department can assist in investment calculations, profits, ROI, etc.

26
Some points are important for a healthy maintenance program:
• Everyone in the organization must be informed and involved. If only top management participate
and managers or supervisors are not involved completely, the program may fail.
• Roles and responsibilities should be clearly defined.
• Compensation, career plans, and retention plans of those involved in the program must be defined.
• It is essential to find the commonalities among distinct groups (quality control people, managers,
supervisors, controllers, etc.).
• Targets need to be established and coherent goals set.
• A selection process should be set up to search for the best talent in the company. A strong
commitment from top leaders is essential.
• Extra programs should be developed.
• Future activities should be defined for the best talent after the learning phase as they will be in a
special position to influence the department structure.
• Support should be available for the jobs and projects.
• If the maintenance department is already involved in techniques of maintenance like TPM, predictive
maintenance or CMMS, it will be easier to apply Six Sigma as there is a good base from which to
work.
• Departments that are led by managers or supervisors with no vision or goals are not environments
that will stimulate the growth of the program. Mentality and culture change may be necessary.
• The maintenance department must be strategically located within the organization because it will be
in the spotlight.
• Work groups need to be able to function independently and be results driven.
• Projects, activities, methods or programs of quality, in maintenance areas may not be well
understood. Adaptation is the key for success.

27
These results can be expected from Six Sigma:
• Sustainable results in short and medium timeframes.
• Disciplined work groups.
• Autonomy of the maintenance professionals.
• Data driven maintenance.
• Optimized resources.
• Improved relationship between finance and operations.
• Increased financial return.
• High performance environment.
• Creativity support.
• World class maintenance.
28
3 Analysis of main equipments and evaluating maintenance
needs
3.1 Main equipments at OTEOSAL OTEOSAL is composed of many types of equipment that all combined allow the good functioning of the
power plant. For the sake of this thesis, the power plant will be divided into 10 parts composing of the main
equipments.
The different parts are:
1. Coal Handling Plant
2. Water Treatment Plant
3. Combustion Air
4. Feed water Pump
5. Boiler
6. Steam Distribution Systems
7. Waste Disposal (Flue Gas, Fly Ash and Bottom Ash)
8. Turbo-Alternator (including auxiliary equipments, cooling tower and condenser)
9. Instrumentation, Power Control and SCADA
10. Compressed Air
An overview of the power plant can be observed in Figure 3.2-1and a summary of the main equipments with
their constituent parts can be seen in Table 3.2-1
3.2 Evaluating maintenance needs at OTEOSAL In order to understand and evaluate the maintenance needs at OTEOSAL, Failure Mode Analysis (FTA) and
Failure mode, effects, and criticality analysis (FMECA) were conducted.
In chapter 4, a Failure Mode Analysis (FTA) is done for all the equipments and they are categorized in
diagrams so that a clear idea is obtained of how failure in different systems can bring about failure in main
equipments and consequent failure for the whole power plant.
A Failure mode, effects, and criticality analysis (FMECA) was conducted in Chapter 5 so as to evaluate the
criticalities of the failures, the severities of the effects of the failures and the probabilities of their occurrences.

29
Figure 3.2-1 Process Schematic of main equipments at OTEOSAL

30
Table 3.2—1 Summary of the main equipments with their constituent parts
System/process Main Equipment Main Components
Coal Handling Plant
Coal Receiver
Coal Separation and Crushing
Coal Conveying
Silo
Tipper, Vibrating Table, Hydraulic Circuits, Hydraulic
Pump, Motor
Vibrating Screener and Crusher
Conveyor Belt, Gearbox, Motor
Extracting Screw, Gearbox, Motor
Water Treatment Plant
Pumping Station
Clarifier
Demineralised Water Plant
Pumps and Piping
Structure of Clarifier
Pumps, Filters, Pneumatic Valves, Ion Beds
Combustion Air
Primary/Secondary Fan
Air Heater
Fan, Motor, Bearings, Dampers
Air Heater Tubes, Control Valves
Feed water Pump
Pumps
Feed Water Tank
Impellers, Bearings, Seals, Non Return Valves, Motor
Piping and Valves, Deaerator, Safety Valves, Sensors
Boiler
Traveling Grate
Boiler Tubes
Steam Drums
Grate Chain constituent parts, Gearbox, Motor
Superheater Tubes, Furnace Tubes, Economizers
Upper/Lower Drums, Safety Valves, Main Bank Tubes
Steam Distribution
Systems
Piping and Valves
Sensors
High Temp./Press. Pipes, Actuators, Seals, Discs
Instrumentation and Control Equipments, SCADA
Waste Disposal (Flue
Gas, Fly Ash and Bottom
Ash)
I.D Fan
Electrostatic Precipitator
Ash Silo
Conveyor
Fan, Motor, Bearings, Dampers
Positive/Negative Plates, Gearbox, Motor,
Transformer
Boosters, Pipings, Evacuation Valves
Conveyor Belt, Gearbox, Motor
Turbo-Alternator
(including auxiliary
equipments, cooling
tower and condenser)
Steam Turbine
Oil/Lubrification System
Gas Extraction System
Cooling Tower
Condenser
Generator
Transformers
Protection
Main Valves, Governor Valves, Rotor, Nozzles,
Diaphragms, Bearings, Casing, Gland Seals, Control
Oil, Pumps, servomotors, oil tanks, oil pipes, Filters,
Coolers
Steam Jet Ejector, Valves, Intercoolers, Nozzles
Fans, Gearbox, Motor, Splash Pack Fill, Cold Water
Pond, Recirculation Pumps
Condenser Heat Exchangers
Rotor, Stator, Exciter, Bearings, Coolers
Step up transformers, High Voltage Equipments
Relays, switchgears
31
Instrumentation, Power
Control and SCADA
Instrumentation
SCADA
Sensors, Data Transmission Lines, PLC, Relays
Servers, Relays, PLC
Compressed Air
Compressor
Piping
Rotary Screw, Solenoid Valves, Motor, Sensors
Pipes and Valves
4 Analysis of FTA
4.1 Introduction This effective reliability analysis tool can be used for different troubles associated with maintainability. Fault
tree analysis (FTA) examines the system or product, in terms of its operation and environment, to determine
all possible ways in which the undesirable event can occur. Furthermore, FTA is a useful tool to analyze the
system and to identify all possible failure causes at all possible levels associated with a system.
4.2 Objectives Fault tree analysis of a system can be used to identify critical components. In doing so, it can help for cost-
effective improvements. It also provides input to testing, maintenance, and operational procedures and
policies, that is, it confirms the ability of the system to fulfill its imposed safety requirements.
4.3 Commonly used symbols Commonly used symbols to construct a fault tree: (a) an OR gate, (b) an AND gate, (c) a resultant event, (d) a
basic event, (e) an incomplete event. Two commonly used fault event symbols: (a) circle; (b) rectangle.
• Or gate. This represents a condition in which an output event occurs if any one or more of the n
input events occur.
• And gate. This represents a condition in which an output event occurs only if all of the n input
events occur.
• Resultant event. This represents a condition in which an event is a result of the combination of
fault events that precede it.
• Basic event. This represents the failure of an elementary component or a basic fault event.
• Incomplete event. This represents a fault event whose cause has not been fully determined either
due to lack of interest or due to lack of data.
32
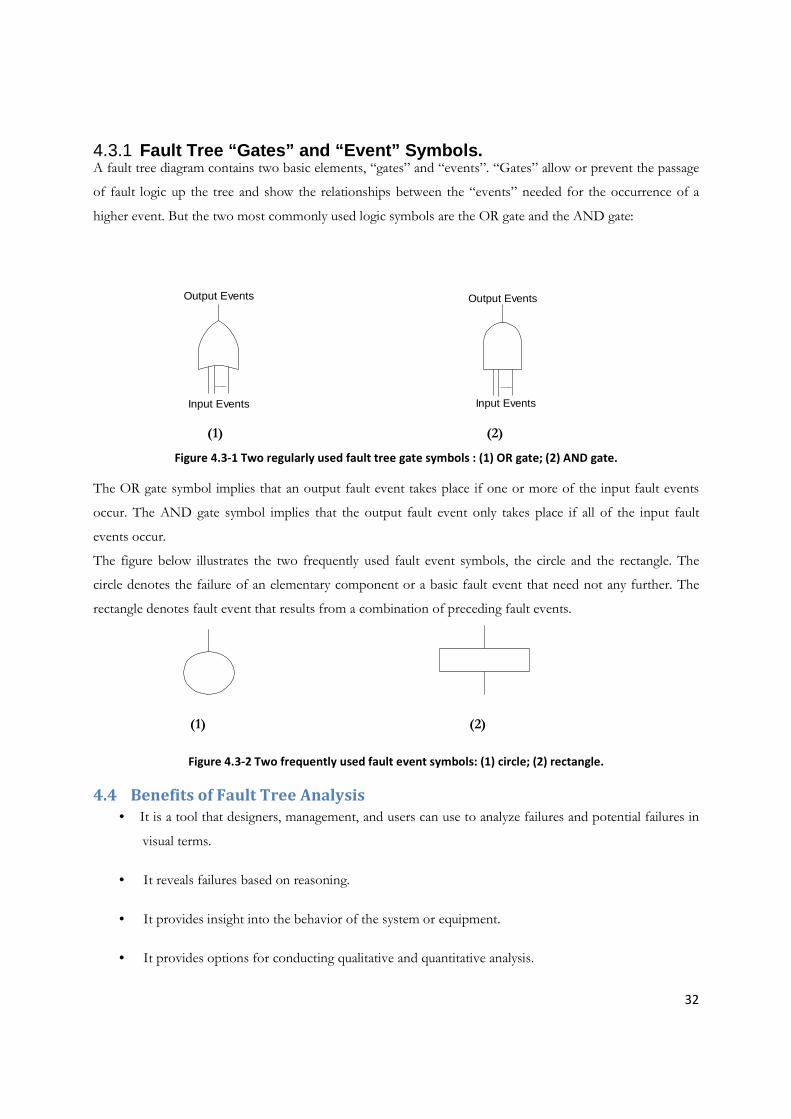
4.3.1 Fault Tree “Gates” and “Event” Symbols. A fault tree diagram contains two basic elements, “gates” and “events”. “Gates” allow or prevent the passage
of fault logic up the tree and show the relationships between the “events” needed for the occurrence of a
higher event. But the two most commonly used logic symbols are the OR gate and the AND gate:
Input Events
Output Events
Output Events
Input Events
(1) (2)
Figure 4.3-1 Two regularly used fault tree gate symbols : (1) OR gate; (2) AND gate.
The OR gate symbol implies that an output fault event takes place if one or more of the input fault events
occur. The AND gate symbol implies that the output fault event only takes place if all of the input fault
events occur.
The figure below illustrates the two frequently used fault event symbols, the circle and the rectangle. The
circle denotes the failure of an elementary component or a basic fault event that need not any further. The
rectangle denotes fault event that results from a combination of preceding fault events.
(1) (2)
Figure 4.3-2 Two frequently used fault event symbols: (1) circle; (2) rectangle.
4.4 Benefits of Fault Tree Analysis
• It is a tool that designers, management, and users can use to analyze failures and potential failures in
visual terms.
• It reveals failures based on reasoning.
• It provides insight into the behavior of the system or equipment.
• It provides options for conducting qualitative and quantitative analysis.
33
• It makes reliability, maintainability, and safety analysts to know the system or equipment under
consideration completely.
4.5 Drawbacks of Fault Tree Analysis
• The end result is difficult to verify.
• It can be a costly and time-consuming.
• It has difficulty handling states of partial failure.
4.6 Fault Tree Analysis on OTEOSAL Main Systems The Fault tree analysis of the different systems that have been performed at OTEOSA is shown from Figure
4.6.1 to Figure 4.6.11
It should be noted that only the FTA of the main equipments are shown here and the FTA of subsystems can
be seen in Appendix 1.
Figure 4.6.1 shows the whole power plant with its main systems and a failure in any one of the systems will
cause break down of the power plant.
Figure 4.6.2 describes the Coal Handling Plant. It is composed of a Tipper to transfer coal from lorries to the
plant, followed by a vibrating table, conveyors, vibrating screener, coal crusher, silo for coal storage and a
travelling shuttle for coal distribution in the boiler.
Figure 4.6.3 represents the Water Treatment Plant which is composed of the Raw Water Plant and the
Demineralised Water Plant. Subsystems for these two plants can be seen in Appendix 1.
Figure 4.6.4 is about Combustion Air and is mainly composed of the Primary Air and Secondary Air Fans.
Failure in any one fan brings along break down for the power plant.
Figure 4.6.5 describes the Feed Water Pumps and the system is made up of high pressure feed pumps and is
fed by a Feed Water Tank.
Figure 4.6.6 illustrates the main constituent equipments of the Boiler. It is composed of the travelling grate,
coal feeders and spreaders and the furnace and superheaters tubes.

34
Figure 4.6.7 represents the Steam Distribution System and is made up of pipings, manual and automatic
valves and instrumentation sensors.
Figure 4.6.8 is the Waste Disposal System and is composed of the I.D Fan, Ash Handling Plant, Ash Silo for
ash storage, Electrostatic Precipitator and conveyor belt for bottom ash carriage.
Figure 4.6.9 describes failures in the Turbo-Alternator system. This important system is made up of the Steam
Turbine, Turbo-Alternator Gear, Alternator, Transformers, Protection, Cooling Tower and Condenser.
Figure 4.6.10 analyses the Instrumentation, Power Control and SCADA.
Figure 4.6.11 shows the main failures that can occur in the Compressed Air System.

35
Figure 4.6-1 FTA for whole Power Plant
8 9 15 4
2
3 6 7 10
Failure of Power
Plant
Failure in Coal
Handling Plant
Failure in
Water
Treatment
Failure in
Combustion Air
Failure in Feed
Water Pump
Failure in
Boiler
Failure in
Compressed
Air
Failure in
Instrumentation
& Control
Failure in Waste
Disposal
Failure in Steam
Distribution
System
1
Failure in
Turbo-
Alternator

36
Figure 4.6-2 FTA for Coal Handling Plant
2
12 13 14 15 16 17 18
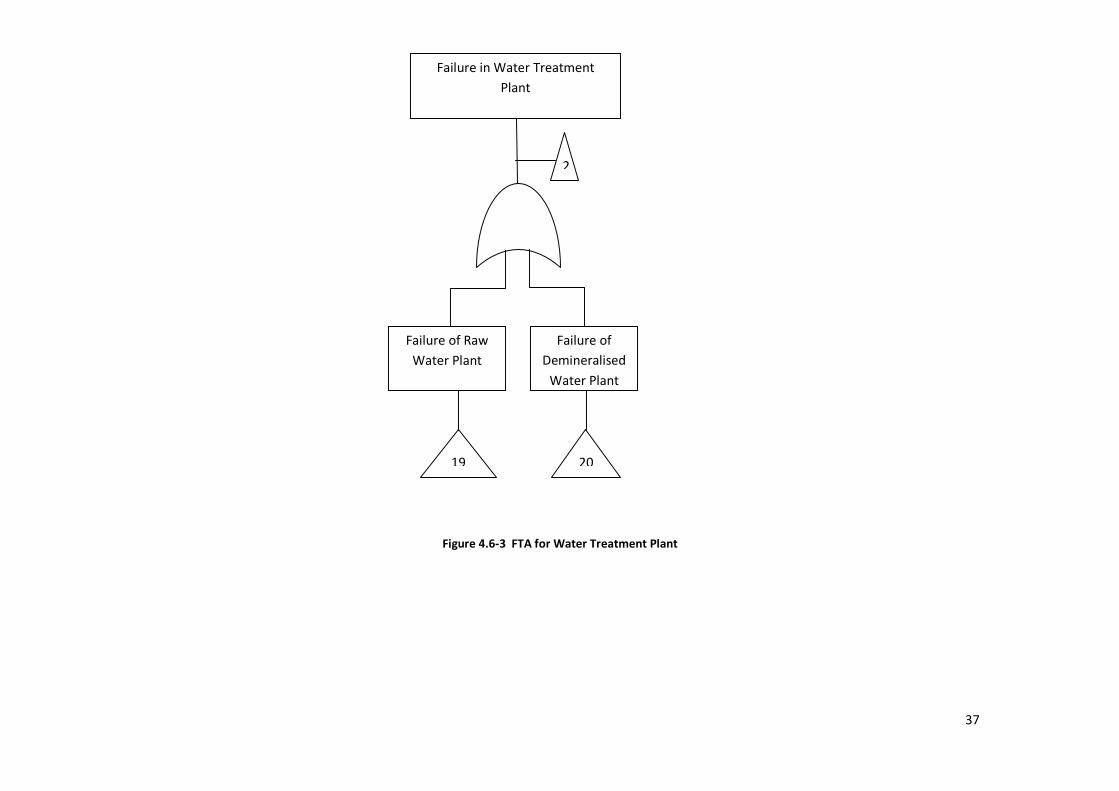
37
Figure 4.6-3 FTA for Water Treatment Plant
2
Failure in Water Treatment
Plant
Failure of Raw
Water Plant
Failure of
Demineralised
Water Plant
19 20

38
Figure 4.6-4 FTA for Combustion Air
4
Failure in Combustion Air
Failure in
Primary Air
Failure in
Secondary Air
21 22
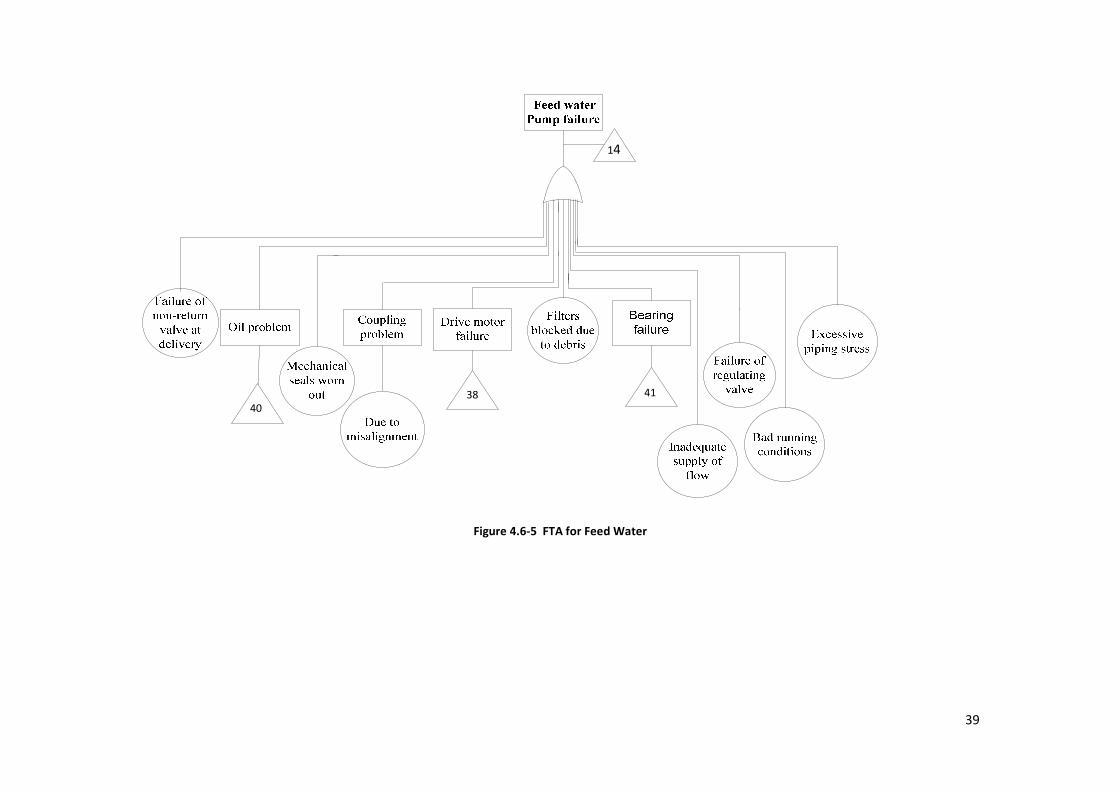
39
Figure 4.6-5 FTA for Feed Water
14
40 38 41

40
Figure 4.6-6 FTA for Boiler
6
21
22
41 38 39
23 27
5
24
25
25 25
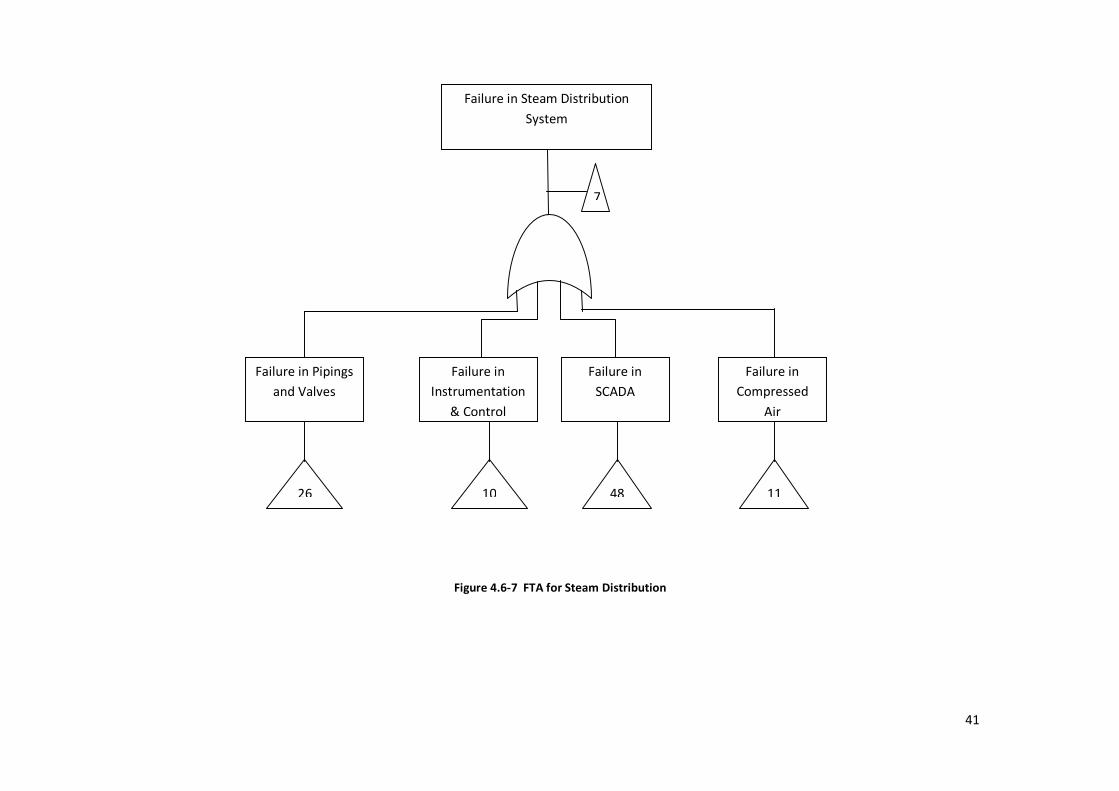
41
Figure 4.6-7 FTA for Steam Distribution
7
Failure in Steam Distribution
System
Failure in Pipings
and Valves
26
Failure in
Compressed
Air
11
Failure in
Instrumentation
& Control
Failure in
SCADA
10 48

42
Figure 4.6-8 FTA for Waste Disposal System
8
Failure in Waste Disposal System
Failure in Ash
Handling Plant
28
Failure in
Conveyor for
Bottom Ash
15
Failure in Ash
Silo
Failure in
Electrostatic
Precipitator
29 30
Failure in
Compressed
Air
11
Failure in I.D
Fan
27

43
Figure 4.6-9 FTA for Turbo-Alternator and Auxiliary Equipments
9
Failure in Turbo-Alternator and
Auxiliary Equipments
Failure in
Turbine Gear
32
Failure in
Cooling Tower
36
Failure in
Condenser
37
Failure in
Steam Turbine
31
Failure in
Turbine
Protection
Failure in
Alternator
33
Failure in
Transformer
Failure in
Instrumentatio
n & Control
34 10

44
Figure 4.6-10 FTA for Instrumentation and Control
10

45
Figure 4.6-11 FTA for Compressed Air
40 38 46
11
46
4.7 Observations made on FTA performed at OTEOSA The FTAs that have been worked out in Chapter 4 can be utilized as a primary step when first
identifying a failure, since they show in the diagrams all the potential failures of the systems
examined. From these FTAs, it will be simple and straight forward to rapidly establish what the
possible causes of a problem are in a particular system and therefore, optimize time and focus more
on one particular part instead of analyzing the whole system.
Once these analyses have been made, a failure mode, effects, and criticality analysis (FMECA) are
being conducted to establish the maintenance strategies that must be used for the various systems
(see Chapter 5).
47
5 Failure Mode and Effects Analysis (FMEA)
5.1 Introduction Failure mode and effects analysis (FMEA) is a structured qualitative analysis of a system,
subsystem, component, or function that underlines possible failure modes, their causes, and the
effects of a failure on system operation. FMEA also evaluates the criticality of the failure, that is,
the severity of the effect of the failure and the probability of its occurrence. This type of analysis is
referred to as failure mode, effects, and criticality analysis (FMECA) and the failure modes are
assigned priorities.
For the case of a power plant, at design level, FMECA helps to identify and prevent failures right
from the system design. It analyzes the design that has been developed and examines how failures
of individual equipments would affect the system operation. The purpose of doing FMECA is to
analyze the process by which the system is to be run and assess how potential failures in the
process would affect the system operation.
Information related to an FMECA and sources for obtaining it are:
• Item identification numbers, available from the parts list for the system.
• Item functional specifications, available from the engineer or from the parts list.
• System function, available in the customer requirements or from the engineer.
• Provisions or design changes to prevent or compensate for failures, available from
the engineer.
• Mission phase/operational mode, available from the engineer
• Failure effects, available from the engineer.
• Failure modes, causes, and rates, available from the factory database and the field
experience database.
• Failure probability/severity classification, available from the engineer.
• Failure detection method(s) available from the engineer.

48
5.2 FMECA Benefits Some of the advantages of performing an FMECA are that it:
• Proves useful for making design comparisons.
• Serves as a visibility tool for managers.
• Provides a systematic approach to classifying hardware failures.
• Identifies all possible failure modes and their effects on mission, personnel and
system.
• Generates useful data for use in system safety and maintainability analyses.
• Helps improve communication among design interface personnel.
• Effectively analyzes small, large, and complex systems.
• Is easy to understand.
• Starts from the level of greatest detail and works upward.
• Detect risks to system performance and safety.
5.3 Applying FMECA at OTEOSAL From the FTA performed, the critical components have already been identified. Then, before
performing the FMECA, respective table of detection, severity and occurrence have been worked
out based on the function of the plant. Added to that, the help of the employees from the
maintenance department was taken to build up properly these tables in accordance with the
functioning of the power plant.
5.4 Risk Priority Number Method This technique bases the risk priority number for an item failure mode on three factors: probability
of occurrence, the severity of the failure's effects, and probability of failure detection. RPN
evaluates the risks related with possible failures that have been found.RPN is calculated as the
product of a ranking from 1-10 allocated to each factor:
RPN= Severity(S) * Occurrence (O) * Detection (D)

49
Failure modes with a high RPN are more critical and given a higher priority than ones with a lower
RPN. When the scales used range from 1 to 10, the value of an RPN will be between 1 and 1,000.
However, the scales and categories used can vary from one organization to another.
5.5 Severity(S) The severity of a failure can be described as the degree to which a failure of a component will affect
the proper running of the machines or systems.
Table 5.5—1 Ranking for Severity
Description of Ranking Level of
Severity, S
Rank
No effect on any system.
Have bypass route.
Remote 1
Repair is simple. No stoppage of plant or machine is required. Minor 2
Repair may take between 30 minutes and 1 hour. Easy replacement of
spare parts required. No stoppage of plant required.
Low 3
Repair may take between 2 and 5 hours and important spare parts
required. No stoppage of plant required.
Moderate 4
Repair may take between 5 to 24 hours and costly spare parts required.
No stoppage of plant required.
High 5
Repair may take more than 1 day and can cause machine failure. Very High 6
Repair may take more than 1 day and can cause total plant failure Extremely
High
7

50
5.6 Occurrence (O) The occurrence of a failure is defined as the probability that a failure of a part occurs or the relative number
of failures expected during the item’s useful life. With the help of the employees from the maintenance
department, it was decided to take a lifetime of 3 years.
Table 5.6—1 Ranking for Occurrence of failures
Definition Rank
Remote Frequency of failure of part is btw 0-2 1
Extremely Low Frequency of failure of part is btw 2-4 2
Very Low Frequency of failure of part is btw 4-6 3
Low Frequency of failure of part is btw 6-8 4
Reasonably Low Frequency of failure of part is btw 8-10 5
Moderate Frequency of failure of part is btw 10-12 6
Reasonably High Frequency of failure of part is btw 12-14 7
High Frequency of failure of part is btw 14-16 8
Very High Frequency of failure of part is btw 16-18 9
Extremely High Frequency of failure of part is greater than 18 10
5.7 Detection (D) Detection can be defined as the capacity to identify problems or potential source for faults. The earlier a fault
is detected, the better it is. If a failure is not detected in time, the resulting outcomes may prove fatal for the
plant in terms of maintenance cost of repair and cost of production loss.
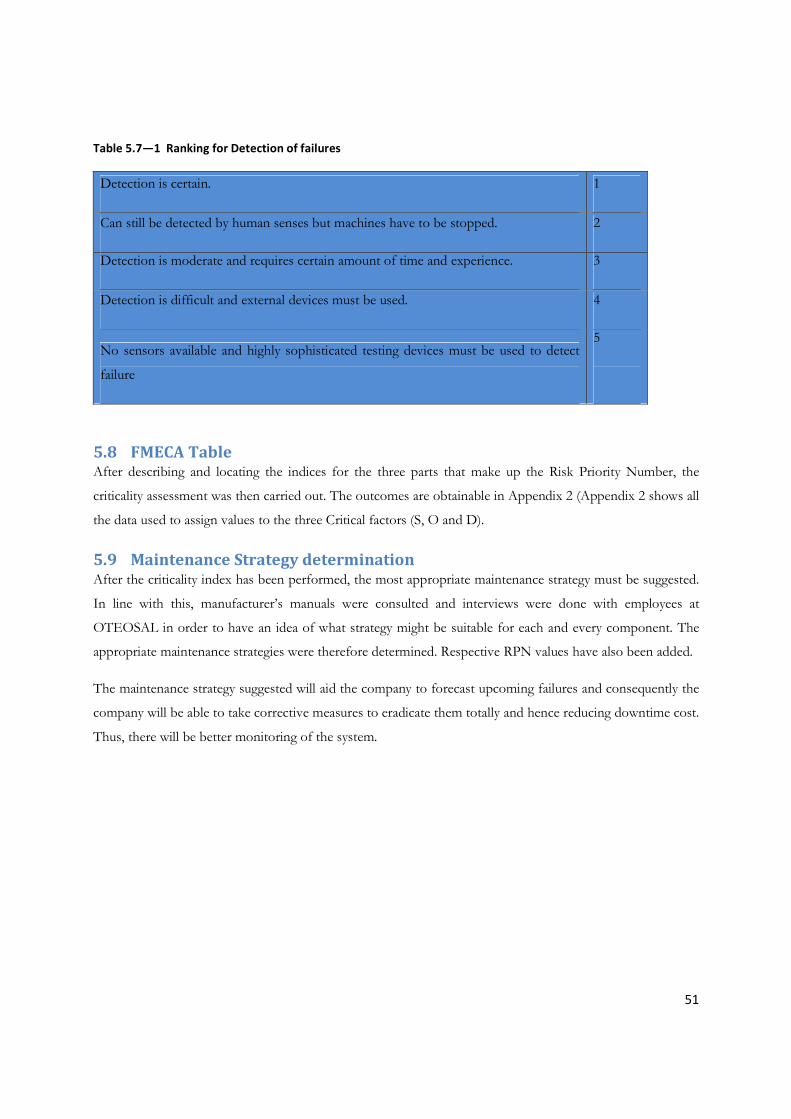
51
Table 5.7—1 Ranking for Detection of failures
Detection is certain. 1
Can still be detected by human senses but machines have to be stopped. 2
Detection is moderate and requires certain amount of time and experience. 3
Detection is difficult and external devices must be used. 4
No sensors available and highly sophisticated testing devices must be used to detect
failure
5
5.8 FMECA Table After describing and locating the indices for the three parts that make up the Risk Priority Number, the
criticality assessment was then carried out. The outcomes are obtainable in Appendix 2 (Appendix 2 shows all
the data used to assign values to the three Critical factors (S, O and D).
5.9 Maintenance Strategy determination After the criticality index has been performed, the most appropriate maintenance strategy must be suggested.
In line with this, manufacturer’s manuals were consulted and interviews were done with employees at
OTEOSAL in order to have an idea of what strategy might be suitable for each and every component. The
appropriate maintenance strategies were therefore determined. Respective RPN values have also been added.
The maintenance strategy suggested will aid the company to forecast upcoming failures and consequently the
company will be able to take corrective measures to eradicate them totally and hence reducing downtime cost.
Thus, there will be better monitoring of the system.

52
Table 5.9—1 Maintenance task
Maintenance
Strategy
Remarks
Breakdown • Routine Inspection must be done.
• Low occurrence.
• Must ensured availability of spare parts.
Preventive • Check alignment.
• Greasing.
• Daily or periodic checking.
• Daily or periodic cleaning.
• Visually inspect for wear, corrosion, cracking, or leakage of
lubricant.
Predictive • Periodic inspection.
• Periodic analysis of data and sample obtained.

53
5.10 FMECA Tables for OTEOSAL Below, only one FMECA table for a system is shown and the rest can be viewed in Appendix 2.
Also only one table of maintenance strategy is presented here and the whole can be seen in Appendix 3.
Table 5.10—1 FMECA Table for Coal Handling Plant – Tipper
System Sub-system &
Function
Failure Mode Effect of Failure Cause of Failure Criticality Analysis
S O D RPN
CO
AL
HA
ND
LIN
G P
LA
NT
Tipper
[Lifting of coal]
Lubrification failure Degraded
performance
Oil seal failure 3 1 1 3
Contamination of
oil
5 2 5 50
Valve failure 3 1 2 6
Oil filter failure 3 1 2 6
Oil tank failure 3 1 1 3
Hydraulic cylinder
failure
Shutdown Cylinder fails 6 1 3 18
Failure due to
misalignment
5 1 3 15
Hydraulic pump
failure
Shutdown Valve failure 3 1 2 6
Bearing failure 4 1 1 4
Pipe failure 3 1 1 3
Oil seal failure 3 1 1 3
Mechanical seal
failure
3 1 1 3

54
Table 5.10—2 Suggested Maintenance Strategy and RPN for Coal Handling Plant – Tipper
Sub-system
Failure mode
Cause of
failure
Actual
Maintenance
Strategies
Suggested
Maintenance
Strategies
RPN
Tipper
Lubrification
failure
Oil seal failure Breakdown Breakdown 3
Contamination
of oil
Predictive Predictive 50
Valve failure Breakdown Breakdown 6
Oil filter
failure
Breakdown Breakdown 6
Oil tank failure Breakdown Breakdown 3
Hydraulic
cylinder
failure
Cylinder fails Preventive Preventive 18
Failure due to
misalignment
Preventive Preventive
15
Hydraulic
pump failure
Valve failure Breakdown Breakdown 6
Bearing failure Preventive Breakdown 4
Pipe failure Breakdown Breakdown 3
Oil seal failure Preventive Breakdown 3
Mechanical
seal failure
Preventive Breakdown 3

55
5.11 Analysis of FMECA From Tables 5.6 and A.3, it can be noted that the required maintenance strategies are between a range of
RPN values.
Table 5.11—1 RPN range
Maintenance Strategy RPN range
Breakdown 1 ≤ RPN < 10
Preventive or Predictive RPN ≥ 10
Added to that, the selection of these strategies was not based only on these RPN values. As a matter of fact,
the RPN value can be lower for certain component but their importance to the proper operation of the plant
and also due to their high detection factor. Therefore, greater significance was given to detection and severity
indices as these components are very critical for the plant. Subsequently, appropriate maintenance strategies
were suggested as listed in Tables 5.10-2 and A.3.
5.12 Maintenance Tasks Comparisons. A maintenance task comparison was carried out between the suggested maintenance based on RCM and the
actual maintenance carried out. From these tables, the number of maintenance tasks carried out is listed in
Table 5.12-1. Added to that, a percentage of the different maintenance strategies performed over the overall
maintenance tasks were carried out so as to give a clear indication of the contribution of each maintenance
task. This is shown in Table 5.12-2.
Table 5.12—1 Maintenance Tasks
Type of Maintenance Actual Maintenance RCM
(Proposed maintenance)
Breakdown Maintenance 156 87
Preventive Maintenance 142 211
CBM 102 102

56
Table 5.12—2 Percentage contribution of respective maintenance task for both Actual & RCM strategy.
Type of Maintenance % of respective
maintenance task
compares to the total
actual maintenance task
% of respective
maintenance task
compares to the total
proposed maintenance task
Breakdown Maintenance 39.00 21.75
Preventive Maintenance 35.50 52.75
CBM 25.50 25.50
In the existing maintenance tasks, there are 156 breakdown maintenance tasks, which represent around 39%
of the total maintenance tasks. This clearly shows that breakdown maintenance is currently being used greatly.
So, in a power plant which runs for 24 hours continuously and is a base load station, some measures must be
taken so as to prevent some failures to occur. Therefore, preventive maintenance is adopted and from Table
5.12-2 and A.3, it is evident that from the proposed RCM tasks, preventive maintenance is greatly used and
has a major part in the overall maintenance task. This is to ensure a smooth running of the power plant.
Furthermore, it can be deduced from Table 5.10-2 and A.3 that the company have been using CBM
techniques for many machines. From the proposed maintenance tasks, it can be observed that this is the
required technique that must be used as these machines are certainly critical for the plant.
Furthermore, from the FMECA that has been carried out, it can be deduced that many machines are critical
and can cause plant failure. So, it is unwise to practise one maintenance strategy on the machine. It is
preferable to perform a combination of the maintenance task because a machine can have many types of
causes related to its failure.

57
6 Applying FTA to a specific equipment at the OTEOSAL power
plant
6.1 Grate Stocker At the power plant, after data collection and interview with the people from the maintenance department, it
has been observed that the equipment that needed more attention is the grate stocker.
The grate stocker is composed of the travelling grate, the coal feeders and coal spreaders. Many resources are
allocated for the good functioning of the grate stocker and hence it has been decided to carry a more in depth
investigation so as to be able to make the equipment more reliable and be able to prevent unnecessary
failures.
First FTA diagrams will be done for the different equipment composing the grate stocker followed by
quantitative analysis of the FTAs presented on excel sheets and then Pareto Analysis will be presented to
show the proportion of different failures.
6.2 FTAs for the grate stocker
Figure 6.2-1 FTA for Coal Spreader

58
Figure 6.2-2 FTA for Coal Feeder
Figure 6.2-3 FTA for Gearbox

59
Figure 6.2-4 FTA for Drive Motor
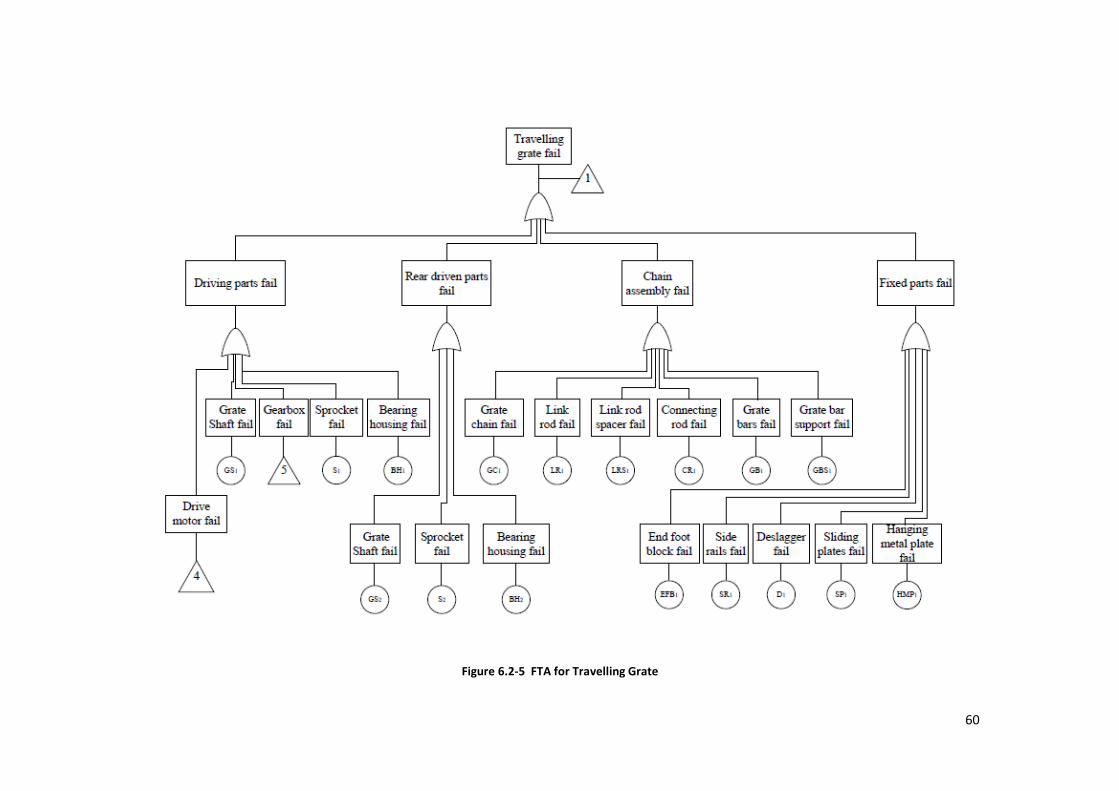
60
Figure 6.2-5 FTA for Travelling Grate

61
Figure 6.2-6 FTA for Grate Stocker
6.3 The quantitative analysis of the FTA
6.3.1 6.3.1 Equations for quantitative analysis From the data collected, the mean frequency of breakdown for the year 2008, 2009 and 2010 was calculated
for all the different parts of the stoker. The mean probability of failure (F (t)) was then obtained by dividing
the mean frequency of breakdown to the number of parts initially on the grate stoker.
F (t) =
Also, R (t) is the probability that the component is in the functioning state is given by:
R (t) = 1- F (t)........................................................................................................................... (1)
The reliability of each component is hence calculated.
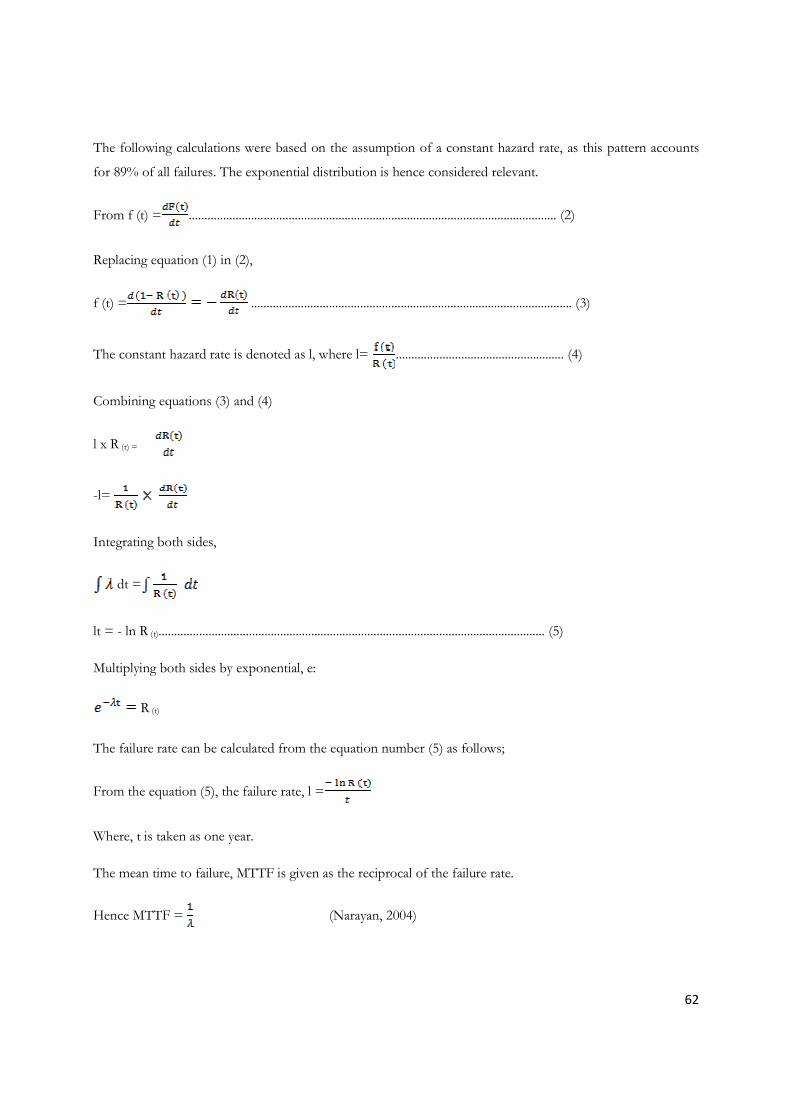
62
The following calculations were based on the assumption of a constant hazard rate, as this pattern accounts
for 89% of all failures. The exponential distribution is hence considered relevant.
From f (t) = ...................................................................................................................... (2)
Replacing equation (1) in (2),
f (t) = ....................................................................................................... (3)
The constant hazard rate is denoted as l, where l= ...................................................... (4)
Combining equations (3) and (4)
l x R (t) =
-l=
Integrating both sides,
dt =
lt = - ln R (t)............................................................................................................................ (5)
Multiplying both sides by exponential, e:
R (t)
The failure rate can be calculated from the equation number (5) as follows;
From the equation (5), the failure rate, l =
Where, t is taken as one year.
The mean time to failure, MTTF is given as the reciprocal of the failure rate.
Hence MTTF = (Narayan, 2004)

63
6.3.2 Reliability of k-out-of-n for the coal spreader and feeder There are four coal spreader and feeder arranged in parallel to each other and for the system to work at least
2 out of the 4 spreader must be working similarly 2 out of the feeder must be working.
For the calculation of the reliability of the coal spreader and that of the feeder the following formula is used:
(Marvin Rausand and Arnljot Heyland, 2004)
For the current system of the coal feeder:
As indicated before 2 out of 4 coal feeder must be in the up state for the system to work. Hence, k =2 and n
=4, the reliability (R(t) ) was found from the analysis of the failure and from the data collected (refer to
equation 1 ), R(t) = 0.29833 also F(t) = 1- R(t) which is equal to F(t) =0.70167.
Therefore, Rs
Rs =0.2705
Hence the reliability of the coal feeder is 27.05%
Similarly for the calculation of the coal spreader:
As indicated before 2 out of 4 coal spreader must be in the up state for the system to work. Hence, k =2 and
n =4, the reliability (R(t) ) was found from the analysis of the failure and from the data collected (refer to
equation 1 ), R(t) = 0.29833 also F(t) = 1- R(t) which is equal to F(t) =0.70167.
Therefore, Rs
Rs = 0.2557
Hence the reliability of the coal spreader is 25.57%

64
Table 6.3—1 Quantitative analysis for the FTA of the Coal Spreader
Spreader parts Quantity
Frequency of breakdown in 2010
Frequency of breakdown in 2009
Frequency of breakdown in 2008
Mean frequnecy of breakdown
Mean % freq of
breakdownF(t) R(t) Failure rate/ ƛ MTTF Reliablilty
FTA top event calculation
Probability of spreader fail
Reliability of Spreader
Bearings 8 2 3 2 2.3333 29.1667 0.2917 0.7083 0.3448 2.899891514Transmission belt 8 2 4 0 2.0000 25.0000 0.2500 0.7500 0.2877 3.476059497Blade cylinder 4 1 2 1 1.3333 33.3333 0.3333 0.6667 0.4055 2.466303462
MotorMotor Bearing 8 0 0 0 0.0000 0.0000 0.0000 1.0000 0.0000 0Motor shaft 4 0 0 0 0.0000 0.0000 0.0000 1.0000 0.0000 0Motor fuse 4 1 1 1 1.0000 25.0000 0.2500 0.7500 0.2877 3.476059497Motor relay 4 0 1 0.3333 8.3333 0.0833 0.9167 0.0870 11.49274997Motor windings 4 0 0 0 0.0000 0.0000 0.0000 1.0000 0.0000 0Motor contactor 4 0 0 0 0.0000 0.0000 0.0000 1.0000 0.0000 0
0.3125
0.243489580.7565104171 0.0000
0.31250.6875

65
Table 6.3—2 Quantitative analysis for the FTA of the Coal Feeder
Feeder parts Quantity
Frequency of
breakdown in 2010
Frequency of breakdown in
2009
Frequency of breakdown in
2008
Mean frequnecy of breakdown
Mean % freq of
breakdownF(t) R(t) Failure rate/ ƛ MTTF Reliablilty
FTA top event calculation
Probability of feeder fail
Reliability of
Feeder
Bearings 16 1 3 2 2.0000 12.5000 0.1250 0.8750 0.1335 7.488875689Metal bars of belt 100 25 36 18 26.3333 26.3333 0.2633 0.7367 0.3056 3.272039599Transmission chain 4 1 0 1 0.6667 16.6667 0.1667 0.8333 0.1823 5.484814948Metal chains 8 1 3 1 1.6667 20.8333 0.2083 0.7917 0.2336 4.280549781Projection plate 24 3 0 0 1.0000 4.1667 0.0417 0.9583 0.0426 23.49645347
motorBearing 8 0 0 0 0.0000 0.0000 0.0000 1.0000 0.0000 0Shaft 4 0 0 0 0.0000 0.0000 0.0000 1.0000 0.0000 0Fuse 4 1 0 1 0.6667 16.6667 0.1667 0.8333 0.1823 5.484814948Relay 4 0 0 1 0.3333 8.3333 0.0833 0.9167 0.0870 11.49274997Windings 4 0 0 0 0.0000 0.0000 0.0000 1.0000 0.0000 0Contactor 4 0 0 0 0.0000 0.0000 0.0000 1.0000 0.0000 0
GearboxBearing 8 0 1 0 0.3333 4.1667 0.0417 0.9583 0.0426 23.49645347Gear 8 0 0 0 0.0000 0.0000 0.0000 1.0000 0.0000 0Shaft 4 0 0 0 0.0000 0.0000 0.0000 1.0000 0.0000 0
0.7016758161 0.0000
0.236110.763888889 0.2361
0.958333333 0.0417 0.0417
0.29833456

66
Table 6.3—3 Quantitative analysis for the FTA of the Travelling Grate
Grate partsQuantity on
grate
Frequency of
breakdown in 2010
frequency of breakdown in
2009
Frequency of breakdown in
2008
Mean frequency of breakdown
Mean % freq of
breakdownF(t) R(t) Failure rate/ ƛ MTTF Reliablilty
Probability of failure of the
grate
Reliability of Grate
Probability of failure of the
travelling grate stoker
Reliability of the travelling grate stoker
Grate chain 40 1 2 1 1.3333 3.3333 0.0333 0.9667 0.0339016 29.49717492Grate bars support 2000 14 18 36 22.6667 1.1333 0.0113 0.9887 0.0114 87.73434428Link rods 2000 8 6 12 8.6667 0.4333 0.0043 0.9957 0.0043 230.2688689Link rod spacer 2000 1 2 3 2.0000 0.1000 0.0010 0.9990 0.0010 999.4999166Grate bars 12600 350 180 124 218.0000 1.7302 0.0173 0.9827 0.0175 57.29671073Connecting rod 2000 1 3 3 2.3333 0.1167 0.0012 0.9988 0.0012 856.6427599Side rails 100 2 1 1 1.3333 1.3333 0.0133 0.9867 0.0134 74.49888142Deslagger 18 1 3 2 2.0000 11.1111 0.1111 0.8889 0.1178 8.490187016End foot block 72 1 2 3 2.0000 2.7778 0.0278 0.9722 0.0282 35.49765246Hanging metal plate 17 3 1 1 1.6667 9.8039 0.0980 0.9020 0.1032 9.691402839Sliding plates 142 1 3 2 2.0000 1.4085 0.0141 0.9859 0.0142 70.49881795Sprocket 40 1 2 1 1.3333 3.3333 0.0333 0.9667 0.0339 29.49717492Bearing housing 16 1 0 1 0.6667 4.1667 0.0417 0.9583 0.0426 23.49645347Grate shaft 4 1 0 0 0.3333 8.3333 0.0833 0.9167 0.0870 11.49274997Sprocket 40 2 1 1 1.3333 3.3333 0.0333 0.9667 0.0339 29.49717492Bearing housing 16 0 1 2 1.0000 6.2500 0.0625 0.9375 0.0645 15.49462216Grate shaft 4 1 0 0 0.3333 8.3333 0.0833 0.9167 0.0870 11.49274997
GearboxGearbox bearing 4 1 0 0 0.3333 8.3333 0.0833 0.9167 0.0870 11.49274997
Gearbox gear 10 0 0 1 0.3333 3.3333 0.0333 0.9667 0.0339 29.49717492
Gearbox shaft 2 0 1 0 0.3333 16.6667 0.1667 0.8333 0.1823 5.484814948Motor
Motor Bearing 4 0 0 1 0.3333 8.3333 0.0833 0.9167 0.0870 11.49274997Motor shaft 2 0 0 0 0.0000 0.0000 0.0000 1.0000 0.0000 0Motor fuse 2 0 0 0 0.0000 0.0000 0.0000 1.0000 0.0000 0Motor relay 2 0 0 1 0.3333 16.6667 0.1667 0.8333 0.1823 5.484814948Motor windings 2 1 0 0 0.3333 16.6667 0.1667 0.8333 0.1823 5.484814948Motor contactor 2 0 0 0 0.0000 0.0000 0.0000 1.0000 0.0000 0
0.933081058 0.0669
0.765387949
0.758247216 0.2418
0.849189815 0.1508
0.1693
0.60951
0.390494878 0.2616
0.916666667 0.0833
0.363430.694444444 0.3056
0.982958055 0.017041945
FTA top event calculation
0.234612051
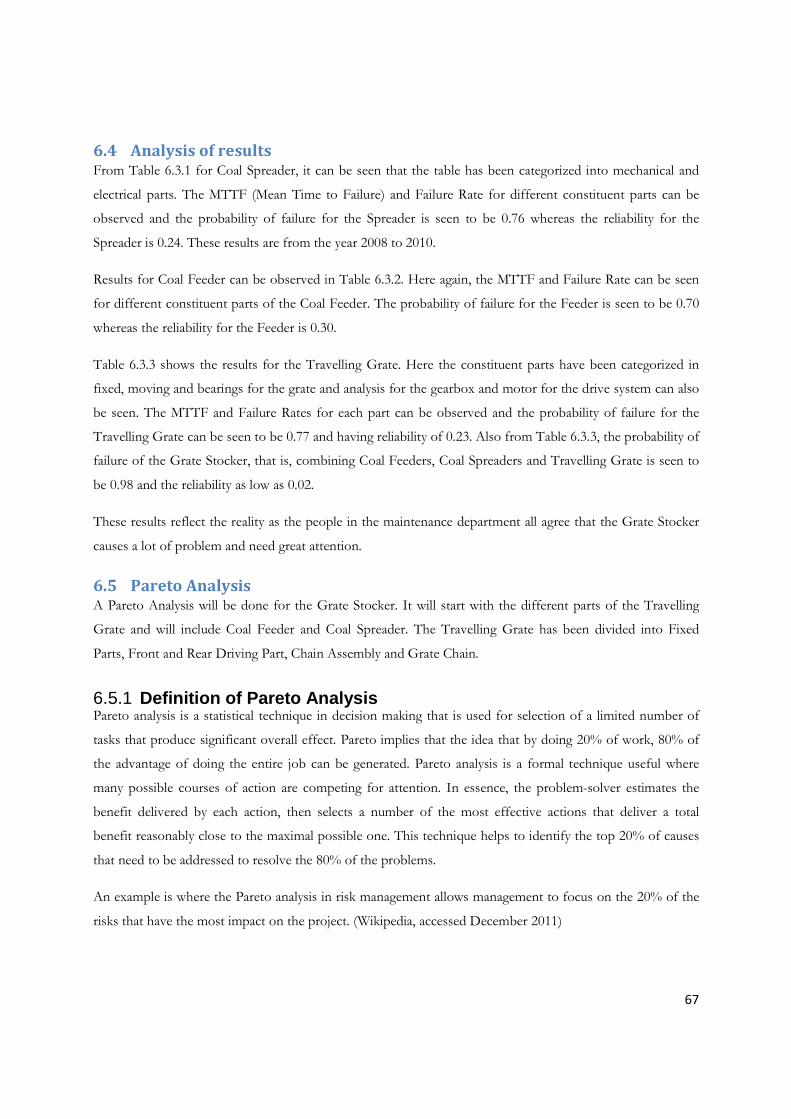
67
6.4 Analysis of results From Table 6.3.1 for Coal Spreader, it can be seen that the table has been categorized into mechanical and
electrical parts. The MTTF (Mean Time to Failure) and Failure Rate for different constituent parts can be
observed and the probability of failure for the Spreader is seen to be 0.76 whereas the reliability for the
Spreader is 0.24. These results are from the year 2008 to 2010.
Results for Coal Feeder can be observed in Table 6.3.2. Here again, the MTTF and Failure Rate can be seen
for different constituent parts of the Coal Feeder. The probability of failure for the Feeder is seen to be 0.70
whereas the reliability for the Feeder is 0.30.
Table 6.3.3 shows the results for the Travelling Grate. Here the constituent parts have been categorized in
fixed, moving and bearings for the grate and analysis for the gearbox and motor for the drive system can also
be seen. The MTTF and Failure Rates for each part can be observed and the probability of failure for the
Travelling Grate can be seen to be 0.77 and having reliability of 0.23. Also from Table 6.3.3, the probability of
failure of the Grate Stocker, that is, combining Coal Feeders, Coal Spreaders and Travelling Grate is seen to
be 0.98 and the reliability as low as 0.02.
These results reflect the reality as the people in the maintenance department all agree that the Grate Stocker
causes a lot of problem and need great attention.
6.5 Pareto Analysis A Pareto Analysis will be done for the Grate Stocker. It will start with the different parts of the Travelling
Grate and will include Coal Feeder and Coal Spreader. The Travelling Grate has been divided into Fixed
Parts, Front and Rear Driving Part, Chain Assembly and Grate Chain.
6.5.1 Definition of Pareto Analysis Pareto analysis is a statistical technique in decision making that is used for selection of a limited number of
tasks that produce significant overall effect. Pareto implies that the idea that by doing 20% of work, 80% of
the advantage of doing the entire job can be generated. Pareto analysis is a formal technique useful where
many possible courses of action are competing for attention. In essence, the problem-solver estimates the
benefit delivered by each action, then selects a number of the most effective actions that deliver a total
benefit reasonably close to the maximal possible one. This technique helps to identify the top 20% of causes
that need to be addressed to resolve the 80% of the problems.
An example is where the Pareto analysis in risk management allows management to focus on the 20% of the
risks that have the most impact on the project. (Wikipedia, accessed December 2011)

68
6.5.2 Steps to identify the important causes using Pareto analysis
(Wikipedia, accessed December 2011)
• Step 1: Form an explicit table listing the causes and their frequency as a percentage.
• Step 2: Arrange the rows in the decreasing order of importance of the causes (i.e., the most
important cause first)
• Step 3: Add a cumulative percentage column to the table
• Step 4: Plot with causes on x- and cumulative percentage on y-axis
• Step 5: Join the above points to form a curve
• Step 6: Plot (on the same graph) a bar graph with causes on x- and percent frequency on y-axis
• Step 7: Draw line at 80% on y-axis parallel to x-axis. Then drop the line at the point of intersection
with the curve on x-axis. This point on the x-axis separates the important causes (on the left) and
trivial causes (on the right)
• Step 8: Explicitly Review the chart to ensure that at least 80% of the causes are captured
Failures in 2008 3 2 2 1 1
Percent 33.3 22.2 22.2 11.1 11.1
Cum % 33.3 55.6 77.8 88.9 100.0
Fixed parts
side rai ls
hang
ing metal p
late
sliding
plates
des lag
ger
end foot b
lock
9
8
7
6
5
4
3
2
1
0
100
80
60
40
20
0
Failu
res in
20
08
Pe
rce
nt
Pareto Chart of Fixed parts
Figure 6.5-1 Example of Pareto Chart

69
6.5.2 Pareto Analysis for Grate Stocker 6.5.3.1 Pareto Analysis for driving part of Travelling Grate
Failures in 2008 0 0 0 02 1 1 1 1 0 0 0
Percent 0.0 0.0 0.0 0.033.3 16.7 16.7 16.7 16.7 0.0 0.0 0.0
Cum % 100.0100.0100.0100.033.3 50.0 66.7 83.3100.0100.0100.0100.0
Driving parts
mot
or w
inding
s
mot
or sha
ft
mot
or fus
e
mot
or con
tact
or
grat
e sha
ft
gearbo
x sh
aft
gearbo
x be
aring
sprock
et
mot
or relay
mot
or B
earin
g
gear
box ge
ar
Bearing
hous
ing
6
5
4
3
2
1
0
100
80
60
40
20
0
Failu
res i
n 2
00
8
Pe
rce
nt
Pareto Chart of Driving parts
Figure 6.5-2 Pareto for driving part of Travelling Grate for the year 2008
Failures in 2009 0 0 0 01 1 1 0 0 0 0 0
Percent 0.0 0.0 0.0 0.033.3 33.3 33.3 0.0 0.0 0.0 0.0 0.0
Cum % 100.0100.0100.0100.033.3 66.7 100.0100.0100.0100.0100.0100.0
Driving parts
mot
or w
inding
s
mot
or sha
ft
mot
or re
lay
mot
or fu
se
mot
or con
tact
or
mot
or Bea
ring
grat
e sha
ft
gear
box
gear
gear
box be
aring
spro
cket
gear
box sh
aft
Bear
ing h
ousin
g
3.0
2.5
2.0
1.5
1.0
0.5
0.0
100
80
60
40
20
0
Fa
ilu
res in
20
09
Pe
rce
nt
Pareto Chart of Driving parts
Figure 6.5-3 Pareto for driving part of Travelling Grate for the year 2009

70
Failures in 2010 0 0 0 02 1 1 1 0 0 0 0
Percent 0.0 0.0 0.0 0.040.0 20.0 20.0 20.0 0.0 0.0 0.0 0.0
Cum % 100.0100.0100.0100.040.0 60.0 80.0100.0100.0100.0100.0100.0
Driving parts
mot
or sha
ft
mot
or re
lay
mot
or fus
e
mot
or con
tact
or
mot
or B
earin
g
gearbo
x sh
aft
gearbo
x ge
ar
Bearing
hous
ing
mot
or w
inding
s
grate
sha
ft
gearbo
x be
aring
spro
cket
5
4
3
2
1
0
100
80
60
40
20
0
Failu
res in
20
10
Perc
en
t
Pareto Chart of Driving parts
Figure 6.5-4 Pareto for driving part of Travelling Grate for the year 2010
mean frequnecy of breakdown 0.3330.0000.0000.0001.3331.0000.3330.3330.3330.3330.3330.333
Percent 7.1 0.0 0.0 0.028.6 21.4 7.1 7.1 7.1 7.1 7.1 7.1
Cum % 100.0100.0100.0100.028.6 50.0 57.1 64.3 71.4 78.6 85.7 92.9
Driving parts
motor sha
ft
motor
fuse
motor
con
tactor
motor w
inding
s
motor
relay
motor
Bea
ring
grate sha
ft
gearbo
x sh
aft
gearbo
x ge
ar
gear
box be
aring
Bear
ing ho
using
sprock
et
5
4
3
2
1
0
100
80
60
40
20
0
me
an
fre
qu
ne
cy
of
bre
akd
ow
n
Pe
rce
nt
Pareto Chart of Driving parts
Figure 6.5-5 Pareto for Mean Frequency of Breakdown

71
Figure 6.5-6 Pie Chart representing Mean Frequency of Breakdown for Driving Parts in Travelling Grate
The Pareto chart for the driving parts of the travelling grate for the year 2008 indicates that 80% of the
failures are due to the failure of the bearing housing, the gearbox gear and motor relay. While that of 2009
clearly points out that 80% of failures are due to failures of the bearing housing and the gearbox shaft. The
Pareto analysis of the year 2010 also shows that the sprocket, gearbox bearing and the grate shaft accounts
for 80% of the failure of the driving parts of the travelling grate.
The Pareto analysis of the mean frequency of breakdown for these three years allow a more global analysis of
which parts of the driving parts of the travelling rate accounts for the 80% of failures. From this it can be
deduced that the sprocket and bearing housing are the most important failed parts in this system as the two
of them make up to 51% failures for the driven parts of the travelling grate.

72
6.5.3.2 Pareto Analysis for Rear Driving part of Travelling Grate
Failures in 2008 1 1 0
Percent 50.0 50.0 0.0
Cum % 50.0 100.0 100.0
Rear driven parts grate shaftsprocketBearing housing
2.0
1.5
1.0
0.5
0.0
100
80
60
40
20
0
Failu
res in
20
08
Pe
rce
nt
Pareto Chart of Rear driven parts
Figure 6.5-7 Pareto for Rear Driving part of Travelling Grate for the year 2008
Failures in 2009 2 1 0
Percent 66.7 33.3 0.0
Cum % 66.7 100.0 100.0
Rear driven parts Bearing housinggrate shaftsprocket
3.0
2.5
2.0
1.5
1.0
0.5
0.0
100
80
60
40
20
0
Failu
res in 2
009
Perc
ent
Pareto Chart of Rear driven parts
Figure 6.5-8 Pareto for Rear Driving part of Travelling Grate for the year 2009

73
Failures in 2010 1 1 1
Percent 33.3 33.3 33.3
Cum % 33.3 66.7 100.0
Rear driven parts sprocketgrate shaftBearing housing
3.0
2.5
2.0
1.5
1.0
0.5
0.0
100
80
60
40
20
0
Failu
res in
20
10
Pe
rce
nt
Pareto Chart of Rear driven parts
Figure 6.5-9 Pareto for Rear Driving part of Travelling Grate for the year 2010
mean frequnecy of breakdown 1.333 0.667 0.333
Percent 57.1 28.6 14.3
Cum % 57.1 85.7 100.0
Rear driven parts grate shaftBearing housingsprocket
2.5
2.0
1.5
1.0
0.5
0.0
100
80
60
40
20
0
me
an
fre
qu
ne
cy
of
bre
akd
ow
n
Pe
rce
nt
Pareto Chart of Rear driven parts
Figure 6.5-10 Pareto of Mean Frequency of Breakdown for Rear Driving part of Travelling Grate

74
Figure 6.5-11 Pie Chart representing Mean Frequency of Breakdown for Rear Driving Parts in Travelling Grate
The Pareto chart for the rear driving parts of the travelling grate for the year 2008 indicates that 80% of the
failures are due to the failure of the bearing housing. While that of 2009 clearly points out that 80% of failures
are due to failures of the sprocket. The Pareto analysis of the year 2010 also shows that bearing housing and
the grate shaft accounts for 80% of the failure of the rear driving parts of the travelling grate.
The Pareto analysis of the mean frequency of breakdown for these three years indicates that, the sprocket is
the most important failed parts in this system as it makes up to 57% failures for the rear driven parts of the
travelling grate

75
6.5.3.3 Pareto Analysis for Chain Assembly parts of Travelling Grate
Failures in 2008 124 36 12 3 3 1
Percent 69.3 20.1 6.7 1.7 1.7 0.6
Cum % 69.3 89.4 96.1 97.8 99.4 100.0
Chain assenbly parts
Grate ch
ain
link ro
d sp
acer
conn
ectin
g rod
link rods
grate ba
rs sup
port
Grate ba
rs
200
150
100
50
0
100
80
60
40
20
0
Failu
res in
20
08
Pe
rce
nt
Pareto Chart of Chain assembly parts
Figure 6.5-12 Pareto for Chain Assembly parts of Travelling Grate for the year 2008
Failures in 2009 180 18 6 3 2 2
Percent 85.3 8.5 2.8 1.4 0.9 0.9
Cum % 85.3 93.8 96.7 98.1 99.1 100.0
Chain assenbly parts
link ro
d sp
acer
Grate ch
ain
conn
ectin
g rod
link rods
grate ba
rs sup
port
Grate ba
rs
200
150
100
50
0
100
80
60
40
20
0
Failu
res in
20
09
Pe
rce
nt
Pareto Chart of Chain assembly parts
Figure 6.5-13 Pareto for Chain Assembly parts of Travelling Grate for the year 2009

76
Failures in 2010 350 14 8 1 1 1
Percent 93.3 3.7 2.1 0.3 0.3 0.3
Cum % 93.3 97.1 99.2 99.5 99.7 100.0
Chain assenbly parts
link ro
d sp
acer
Grate ch
ain
conn
ectin
g rod
l ink rods
grate ba
rs sup
port
Grate ba
rs
400
300
200
100
0
100
80
60
40
20
0
Failu
res in
20
10
Pe
rce
nt
Pareto Chart of Chain assembly parts
Figure 6.5-14 Pareto for Chain Assembly parts of Travelling Grate for the year 2010
mean frequnecy of breakdown 218.0 22.7 8.7 2.3 2.0 1.3
Percent 85.5 8.9 3.4 0.9 0.8 0.5
Cum % 85.5 94.4 97.8 98.7 99.5 100.0
Chain assenbly parts
Grate ch
ain
link rod sp
acer
conn
ectin
g ro
d
l ink rods
grate
bars sup
port
Grate ba
rs
250
200
150
100
50
0
100
80
60
40
20
0me
an
fre
qu
ne
cy
of
bre
akd
ow
n
Pe
rce
nt
Pareto Chart of Chain assenbly parts
Figure 6.5-15 Pareto of Mean Frequency of Breakdown for Chain Assembly parts of Travelling Grate

77
Figure 6.5-16 Pie Chart representing Mean Frequency of Breakdown for Chain Assembly Parts in Travelling
Grate
The Pareto analysis for Mean Frequency of Breakdown for the Chain Assembly parts for the years 2008 to
2010 indicates that the grate bars are responsible for more than 80% of the failures of the chain assembly
parts.
This value of 80 % shows that a lot of man hours and spare grate bars are needed.
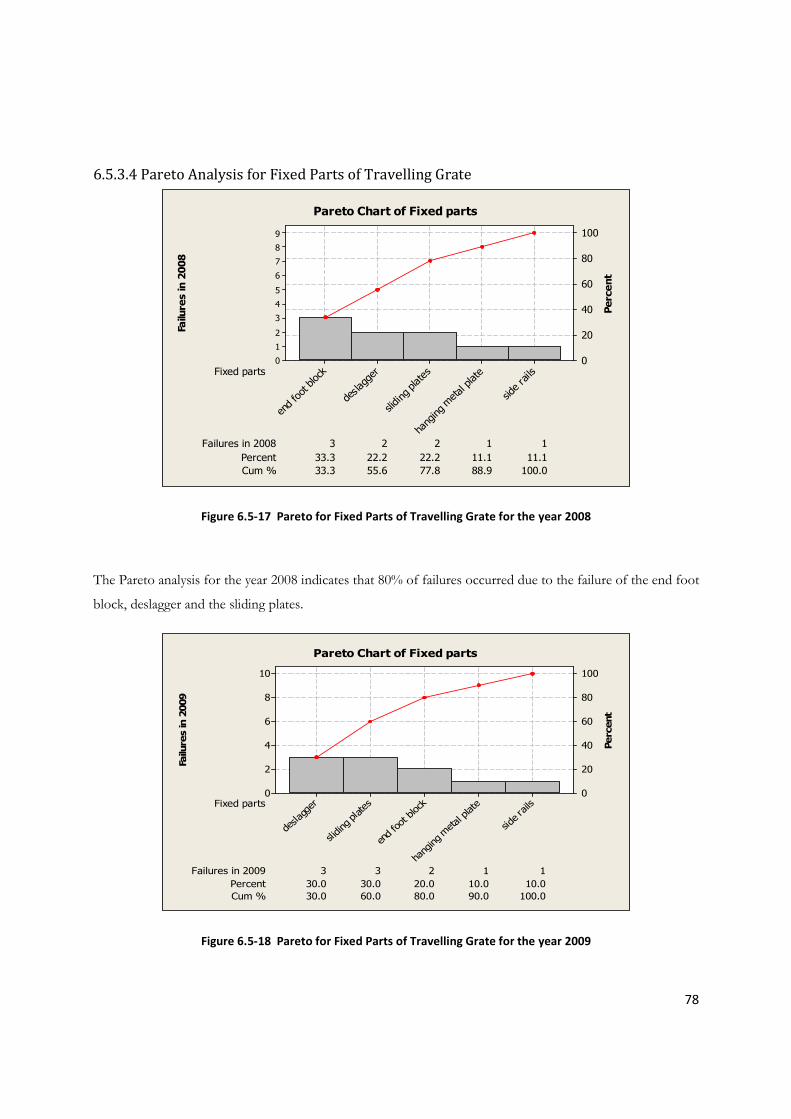
78
6.5.3.4 Pareto Analysis for Fixed Parts of Travelling Grate
Failures in 2008 3 2 2 1 1
Percent 33.3 22.2 22.2 11.1 11.1
Cum % 33.3 55.6 77.8 88.9 100.0
Fixed parts
side rai ls
hang
ing metal plate
sliding
plates
deslag
ger
end foot block
9
8
7
6
5
4
3
2
1
0
100
80
60
40
20
0
Failu
res in
20
08
Perc
en
t
Pareto Chart of Fixed parts
Figure 6.5-17 Pareto for Fixed Parts of Travelling Grate for the year 2008
The Pareto analysis for the year 2008 indicates that 80% of failures occurred due to the failure of the end foot
block, deslagger and the sliding plates.
Failures in 2009 3 3 2 1 1
Percent 30.0 30.0 20.0 10.0 10.0
Cum % 30.0 60.0 80.0 90.0 100.0
Fixed parts
side ra
ils
hang
ing metal plate
end foot block
sl iding
plates
deslag
ger
10
8
6
4
2
0
100
80
60
40
20
0
Failu
res in 2
009
Perc
ent
Pareto Chart of Fixed parts
Figure 6.5-18 Pareto for Fixed Parts of Travelling Grate for the year 2009

79
While for the year 2009 the Pareto analysis showed that the end foot block, deslagger and the sliding plates
are once again the major influence for the 80% of breakdown of the fixed parts failure.
Failures in 2010 3 2 1 1 1
Percent 37.5 25.0 12.5 12.5 12.5
Cum % 37.5 62.5 75.0 87.5 100.0
Fixed parts
sl iding
plates
end foot block
deslag
ger
side rai ls
hang
ing metal plate
9
8
7
6
5
4
3
2
1
0
100
80
60
40
20
0
Failu
res in 2
010
Perc
ent
Pareto Chart of Fixed parts
Figure 6.5-19 Pareto for Fixed Parts of Travelling Grate for the year
For the year 2009, Pareto analysis showed that hanging metal plates and the side rails and the deslagger
account for 80% of breakdown of the fixed parts failure.
mean frequnecy of breakdown 2.000 2.000 2.000 1.667 1.333
Percent 22.2 22.2 22.2 18.5 14.8
Cum % 22.2 44.4 66.7 85.2 100.0
Fixed parts
side rails
hang
ing metal plate
sliding
plates
end foot block
deslag
ger
9
8
7
6
5
4
3
2
1
0
100
80
60
40
20
0
mean f
requnecy o
f bre
akdow
n
Perc
ent
Pareto Chart of Fixed parts
Figure 6.5-20 Pareto of Mean Frequency of Breakdown for Fixed Parts of Travelling Grate

80
The Pareto of the mean frequency of breakdown indicates that 80% of failures are due to the failure of the
deslagger, end foot block, the sliding plates and the hanging metal plates. These parts are thus the most
critical parts among the fixed parts of the grate.
Figure 6.5-21 Pie Chart representing Mean Frequency of Breakdown for Fixed Parts in Travelling Grate
For years 2008 to 2010, it can be observed that the Mean Frequency of Breakdown of different constituent
parts for the fixed parts of the travelling grate is almost the same. This implies that spare parts for these
constituent parts should be available each year.

81
6.5.3.5 Pareto Analysis for whole Travelling Grate
Failures in 2008 2 2 1 1 1 1 1 1 0 0124 0 0 0 0 0 036 12 3 3 3 3 2
Percent 1 1 1 1 1 1 1 1 0 063 0 0 0 0 0 018 6 2 2 2 2 1
Cum % 96 97 97 98 98 99 9910010010063 10010010010010010082 88 89 91 92 94 95
Travelling grate chain parts
moto
r windings
mo to
r sh
aft
mot
or fus
e
mo to
r co
ntac
tor
grate sh
aft
grate sha
ft
gearbo
x sh
aft
gear
box be
aring
side rails
mo to
r relay
motor
Bea
ring
hanging metal p
late
Grate cha
in
gear
box ge
ar
spro
cket
sliding
plates
desla
gge
r
link
rod sp
acer
end fo
ot block
conn
ectin
g rod
Bearin
g h
ousing
link r
ods
gra
te b
ars su
ppor
t
Grate bar
s
200
150
100
50
0
100
80
60
40
20
0
Failu
res in
20
08
Pe
rce
nt
Pareto Chart of Travelling grate chain parts
Figure 6.5-22 Pareto for whole Travelling Grate for the year 2008
Failures in 2009 2 2 1 1 1 1 1 1 0 0180 0 0 0 0 0 018 6 3 3 3 3 2
Percent 1 1 0 0 0 0 0 0 0 079 0 0 0 0 0 08 3 1 1 1 1 1
Cum % 96 97 98 98 99 9910010010010079 10010010010010010087 89 91 92 93 95 96
Travelling grate chain parts
moto
r winding
s
mo to
r sh
aft
motor re
lay
mo to
r fuse
motor
contac
tor
moto r
Bear
ing
gearbo
x g ea
r
gearbox
bea
ring
side ra
ils
hanging metal p
late
grate sh
aft
grate sha
ft
gearbo
x sh
aft
Bear
ing hou
sing
link ro
d sp
acer
Grate cha
in
end fo
ot b
lock
spro
cket
sliding
plates
d eslagge
r
conn
ectin
g ro d
link
rods
gra
te b
ars su
ppo
rt
Grate bar
s
250
200
150
100
50
0
100
80
60
40
20
0
Failu
res in
20
09
Pe
rce
nt
Pareto Chart of Travelling grate chain parts
Figure 6.5-23 Pareto for whole Travelling Grate for the year 2009

82
Failures in 2010 1 1 1 1 1 1 1 1 1 0350 0 0 0 0 0 014 8 3 3 2 1 1
Percent 0 0 0 0 0 0 0 0 0 090 0 0 0 0 0 04 2 1 1 1 0 0
Cum % 98 98 98 99 99 99 9910010010090 10010010010010010093 95 96 97 97 97 98
Travelling grate chain parts
mo to
r sh
aft
motor relay
mot
or fus
e
mo to
r co
ntac
tor
motor
Bea
ring
gearbo
x sh
aft
gear
box ge
ar
sliding
plates
motor windin gs
link
rod sp
acer
grate sh
aft
Gra
te cha
in
grate sha
ft
gear
box be
aring
end fo
ot block
d eslagge
r
conn
ectin
g rod
Bearing hou
sing
side ra
ils
spro
cket
hanging m
etal plate
link r
ods
gra
te b
ars su
ppor
t
Grate bar
s
400
300
200
100
0
100
80
60
40
20
0
Failu
res in
20
10
Pe
rce
nt
Pareto Chart of Travelling grate chain parts
Figure 6.5-24 Pareto for whole Travelling Grate for the year 2010
mean frequnecy of breakdown 2.0 1.71.7 1.3 1.30.3 0.3 0.3 0.30.3218.0 0.3 0.30.3 0.0 0.00.022.78.7 2.72.3 2.02.02.0
Percent 1 1 1 0 0 0 0 0 0 080 0 0 0 0 0 08 3 1 1 1 1 1
Cum % 97 97 98 99 99 99 99 9910010080 10010010010010010089 92 93 94 95 95 96
Travelling grate chain parts
moto r
shaft
mo to
r fuse
moto r
con ta
ctor
motor wind in
gs
motor re
lay
mo to
r Be
aring
grate sh
aft
g rate s
haft
gearbo
x sh
aft
gearbo
x ge
ar
gearb
ox bea
ring
side rails
Gra
te cha
in
Bearing hous
ing
hanging m
etal plate
slid in
g plates
link r
od sp
acer
end fo
ot b
lock
desla
gge
r
conn
ectin
g rod
spro
cket
link ro
d s
gra
te b
ars su
ppor
t
Gra
te b
ars
300
250
200
150
100
50
0
100
80
60
40
20
0
me
an
fre
qu
ne
cy
of
bre
ak
do
wn
Pe
rce
nt
Pareto Chart of Travelling grate chain parts
Figure 6.5-25 Pareto of Mean Frequency of Breakdown for whole of Travelling Grate

83
The Pareto analysis for the years 2008 to 2010 for the whole Travelling Grate indicates that the failures of the
grate bars account for 80% of the failures.
However, with the help of the second level Pareto performed on the sub parts of the travelling grate, it has
been clearly demonstrated that there are other critical parts that must also be taken into considerations when
analysing the travelling grate breakdown.
6.5.3.6 Pareto Analysis for Coal Feeder
Failures in 2008 0 0 0 0 0 018 2 1 1 1 1 0 0
Percent 0 0 0 0 0 075 8 4 4 4 4 0 0
Cum % 100 100 100 100 100 10075 83 88 92 96 100 100 100
Feeder parts
projec
tion plate
Motor w
inding
s
Motor sha
ft
Motor con
tactor
Motor Bea
ring
Gear
box sh
aft
Gearbo
x ge
ar
Gearbo
x be
aring
trans
miss
ion ch
ain
Motor re
lay
Motor
fuse
metal cha
ins
bearings
metal bars of belt
25
20
15
10
5
0
100
80
60
40
20
0
Failu
res in
20
08
Pe
rce
nt
Pareto Chart of Feeder parts
Figure 6.5-26 Pareto for Coal Feeder for the year 2008
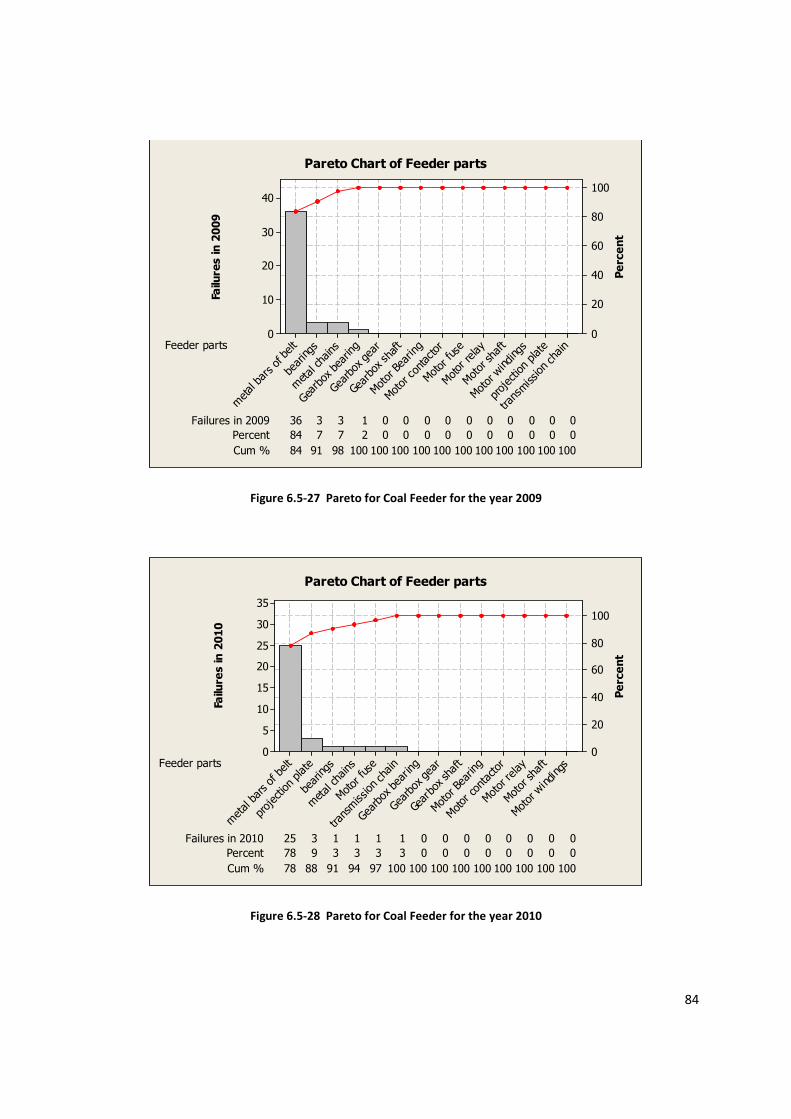
84
Failures in 2009 0 0 0 0 0 036 3 3 1 0 0 0 0
Percent 0 0 0 0 0 084 7 7 2 0 0 0 0
Cum % 100 100 100 100 100 10084 91 98 100 100 100 100 100
Feeder parts
trans
miss
ion ch
ain
projec
tion plate
Motor w
inding
s
Motor sha
ft
Motor
relay
Motor fu
se
Motor
con
tactor
Motor Bea
ring
Gearbo
x sh
aft
Gearbo
x ge
ar
Gearb
ox bea
ring
metal cha
ins
bearings
metal bar
s of belt
40
30
20
10
0
100
80
60
40
20
0
Failu
res in
20
09
Pe
rce
nt
Pareto Chart of Feeder parts
Figure 6.5-27 Pareto for Coal Feeder for the year 2009
Failures in 2010 0 0 0 0 0 025 3 1 1 1 1 0 0
Percent 0 0 0 0 0 078 9 3 3 3 3 0 0
Cum % 100 100 100 100 100 10078 88 91 94 97 100 100 100
Feeder parts
Motor
winding
s
Motor sha
ft
Motor re
lay
Motor
con
tactor
Motor Bea
ring
Gear
box sh
aft
Gearbo
x ge
ar
Gearbo
x be
aring
trans
miss
ion ch
ain
Motor fu
se
metal cha
ins
bearings
projec
tion plate
metal bars of belt
35
30
25
20
15
10
5
0
100
80
60
40
20
0
Failu
res in
20
10
Pe
rce
nt
Pareto Chart of Feeder parts
Figure 6.5-28 Pareto for Coal Feeder for the year 2010

85
mean frequnecy of breakdown 0.000.000.000.000.000.0026.332.001.671.000.670.670.330.33
Percent 0 0 0 0 0 080 6 5 3 2 2 1 1
Cum % 10010010010010010080 86 91 94 96 98 99100
Feeder parts
Motor w
inding
s
Motor sha
ft
Motor
con
tactor
Motor
Bea
ring
Gear
box sh
aft
Gearbo
x ge
ar
Motor
relay
Gearbox
bea
ring
trans
miss
ion ch
ain
Motor fu
se
projec
tion plate
metal cha
ins
bearings
metal bars of belt
35
30
25
20
15
10
5
0
100
80
60
40
20
0
me
an
fre
qu
ne
cy
of
bre
akd
ow
n
Pe
rce
nt
Pareto Chart of Feeder parts
Figure 6.5-29 Pareto of Mean Frequency of Breakdown for Coal Feeder
From the Pareto analysis and from Figure 6.5-30 it can be seen that the metal bars of the belts accounts for
80% of failures of the feeder for the year 2008 to 2010.
Figure 6.5-30 Pie Chart representing Mean Frequency of Breakdown for Coal Feeder

86
6.5.3.7 Pareto Analysis for Coal Spreader
Failures in 2008 02 1 1 1 0 0 0 0
Percent 0.040.0 20.0 20.0 20.0 0.0 0.0 0.0 0.0
Cum % 100.040.0 60.0 80.0 100.0 100.0 100.0 100.0 100.0
Spreader parts
tran
smiss
ion be
lt
Motor
winding
s
Motor
sha
ft
Motor con
tactor
Motor
Bea
ring
Motor relay
Motor fu
se
blad
e cy
linde
r
bearings
5
4
3
2
1
0
100
80
60
40
20
0
Failu
res in
20
08
Pe
rce
nt
Pareto Chart of Spreader parts
Figure 6.5-31 Pareto for Coal Spreader for the year 2008
The Pareto analysis for the year 2008 shows that 80% of the failures of the spreader are due to the failure of
the bearings, blade cylinders and the motor fuse.
Failures in 2009 04 3 2 1 1 0 0 0
Percent 0.036.4 27.3 18.2 9.1 9.1 0.0 0.0 0.0
Cum % 100.036.4 63.6 81.8 90.9 100.0100.0 100.0100.0
Spreader parts
Motor w
inding
s
Motor sha
ft
Motor
con
tactor
Motor
Bea
ring
Motor relay
Motor
fuse
blad
e cy
linde
r
bear
ings
tran
smiss
ion be
lt
12
10
8
6
4
2
0
100
80
60
40
20
0
Failu
res in 2
009
Perc
ent
Pareto Chart of Spreader parts
Figure 6.5-32 Pareto for Coal Spreader for the year 2009

87
For the year 2009 the Pareto indicates that the transmission belt, bearings and the blade cylinder account for
more than 80% of the failure of the spreader.
Failures in 2010 02 2 1 1 0 0 0 0
Percent 0.033.3 33.3 16.7 16.7 0.0 0.0 0.0 0.0
Cum % 100.033.3 66.7 83.3 100.0 100.0 100.0 100.0 100.0
Spreader parts
Motor
winding
s
Motor sha
ft
Motor
relay
Motor con
tactor
Motor
Bea
ring
Motofus
e
blad
e cy
linde
r
tran
smiss
ion be
lt
bearings
6
5
4
3
2
1
0
100
80
60
40
20
0
Failu
res in 2
010
Perc
ent
Pareto Chart of Spreader parts
Figure 6.5-33 Pareto for Coal Spreader for the year 2010
The Pareto for the year 2010 is similar to that of 2008, that is, the bearings, transmission belt and the blade
cylinder are identified as the parts that failed the most on the spreader.
mean frequnecy of breakdown 0.0002.3332.0001.3331.0000.6670.0000.0000.000
Percent 0.031.8 27.3 18.2 13.6 9.1 0.0 0.0 0.0
Cum % 100.031.8 59.1 77.3 90.9100.0100.0100.0100.0
Spreader parts
Motor w
inding
s
Motor
sha
ft
Motor con
tactor
Motor Bea
ring
Motor relay
Motofus
e
blad
e cyl in
der
tran
smiss
ion be
lt
bearings
8
7
6
5
4
3
2
1
0
100
80
60
40
20
0mean fre
qunecy o
f bre
akdow
n
Perc
ent
Pareto Chart of Spreader parts
Figure 6.5-34 Pareto of Mean Frequency of Breakdown for Coal Spreader

88
Figure 6.5-35 Pie Chart representing Mean Frequency of Breakdown for Coal Spreader
Therefore, the Pareto analysis of the mean breakdown frequency for 2008 to 2010 also points out that the
bearings, the transmission belt and the blade cylinders are accountable to 80% of the failure of the spreaders.

89
7 Setting Up of Maintenance Strategy and Guidelines for OTEOSAL
7.1 Company’s expectations from the Maintenance Department OTEOSAL is projecting to be an ISO9001 certified company in 2012 so as to be able to implement Quality
Management Systems at the power plant. Therefore it is of upmost importance to set up a maintenance
strategy to be in line with the quality policy the company wants to put forward.
After interviewing the maintenance staff and going through the maintenance procedures that are already in
place, it has been observed that overall the power plant has a software for maintenance management
including work order generation, data recording of incidents and other useful functions that maintenance
software offers. But till now, maintenance procedures were not carried out to standard maintenance
management.
As it is well known, maintenance, as any other function in a power plant, requires a suitable information flow
between the different points of the internal organization and with the rest of the functional and
organizational units of the plant, in order to fulfill its objectives of reaching an acceptable performance.
The maintenance strategy and guidelines that will be proposed for OTEOSAL will be divided into normative
and informative parts. The British Standard, BS EN13460:2002, 2002 “Maintenance – Documents for
Maintenance” has been analyzed and adapted for OTEOSAL power plant.
The normative part concerns the first part of the life cycle of the equipment to be maintained, namely the
preparatory phase. When an equipment is acquired, the maintenance department requires certain
documentation to maintain and operate the equipment properly. The appropriate documentation has to be
provided by the supplier of this equipment.
The informative part concerns the operational phase of the life cycle of the equipment to be maintained. The
informative part, in addition to the normative part, develops the documentation for maintenance having
regard to the maintenance function as a part of the quality system of the company. (BS EN13460:2002, 2002)
The strategy adopted for OTEOSAL specifies general guidelines for:
• The technical documentation to be supplied with an equipment, at the latest before it is ready
to be put into service, in order to support its maintenance; see Table 7.1-1;
• The documentation of information to be established within the operational phase of an
equipment, in order to support the maintenance requirements; see Table 7.2-1, Figure 7.1-1 and Figure
7.2-2.
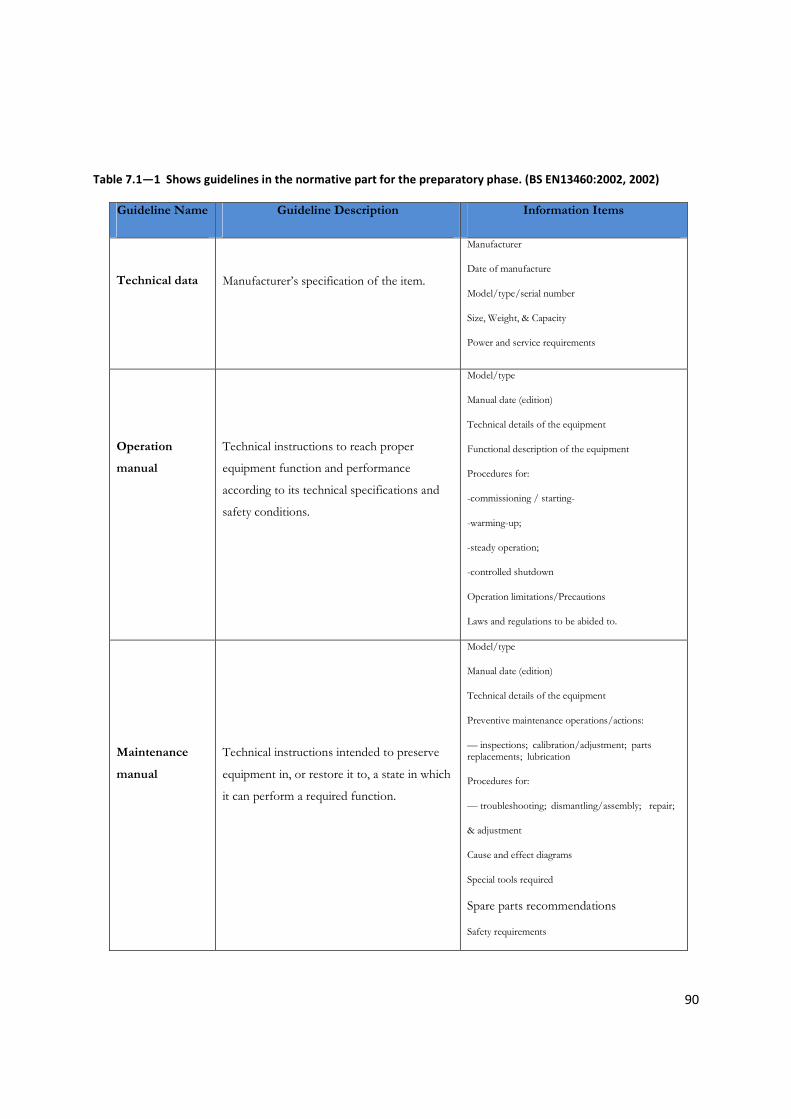
90
Table 7.1—1 Shows guidelines in the normative part for the preparatory phase. (BS EN13460:2002, 2002)
Guideline Name Guideline Description Information Items
Technical data
Manufacturer’s specification of the item.
Manufacturer
Date of manufacture
Model/type/serial number
Size, Weight, & Capacity
Power and service requirements
Operation
manual
Technical instructions to reach proper
equipment function and performance
according to its technical specifications and
safety conditions.
Model/type
Manual date (edition)
Technical details of the equipment
Functional description of the equipment
Procedures for:
-commissioning / starting-
-warming-up;
-steady operation;
-controlled shutdown
Operation limitations/Precautions
Laws and regulations to be abided to.
Maintenance
manual
Technical instructions intended to preserve
equipment in, or restore it to, a state in which
it can perform a required function.
Model/type
Manual date (edition)
Technical details of the equipment
Preventive maintenance operations/actions:
— inspections; calibration/adjustment; parts replacements; lubrication
Procedures for:
— troubleshooting; dismantling/assembly; repair;
& adjustment
Cause and effect diagrams
Special tools required
Spare parts recommendations
Safety requirements

91
Guideline Name Guideline Description Information Items
Components list
Comprehensive list of equipments which
constitute part of another one.
Model/type/serial number
Part number
Part description
Part quantity.
Arrangements
Drawing showing replacement components
layout for an equipment.
Drawing code and identification
Date (issue/revision)
Dimensions
Equipment components location and
identification
Necessary space for disassembly and
maintenance
Relevant information about connection details
When necessary: lifting lugs, inspection hatches, ladders, etc.
Detail
Drawing with part list to ensure dismantling,
repair and assembly of items.
Code identifying the equipment which is detailed
Assembly drawing showing parts positions
Identification of each part of the drawing:
— part number;
— description;
— number of units.
Any other relevant information for assembly and disassembly operations.
Lubrication map
Drawing showing position of each equipment
lubrication point, with lubrication data and
specifications.
Map code and identification
Date (issue/revision)
Item identification (code and name)
Lubrication point position (drawing)
Lubrication point identification
Lubrication point description
Lubricant specifications
Routing, when necessary.

92
Guideline Name Guideline Description Information Items
Single line
diagram
Overall power distribution diagram:
— electrical;
— pneumatic;
— hydraulic.
This kind of diagram includes switchboard circuits.
Diagram code and identification
Date (issue/revision)
Power distribution units (generators, transformers, switch gears, rectifiers, etc)
End consumers (for high voltage switchgears only)
Earthing lines for systems, equipment and cables (general earthing principles will be included).
Logic diagram
System control diagram to clarify the overall
system logic.
Diagram code and identification
Date (issue/revision)
Logic functions (symbols, internetworking and control flow)
Modes of operation (e.g. starting, shutdown, alarm, trip functions).
Circuit diagram
Overall feeder and control circuits diagram.
Diagram code and identification
Date (issue/revision)
All internal connections for control, alarms,
protection, interlocks, trip functions, monitoring, etc
Settings of timers, thermal overload and protection relays
Wire and cable numbers
Terminal numbers
Component list for in line, control and protection systems
Switch gear/board location code
Consumer/supplier location code
Termination details and type of external signal (fire and gas trip signal, etc.)
Power and current rating
Reference drawings.
Location
Drawing showing the position of all field
equipments within the considered area
Drawing code and identification
Date (issue/revision)
Area identification (code and name)
Equipment identification and location code
Equipment drawings or symbols, without dimensional details.

93
Guideline Name Guideline Description Information Items
Pipe and
instrument
diagram
Overall fluid conduction (air, steam, oil, fuel)
and control diagram.
Diagram code and identification
Date (issue/revision)
All internal connections for control, alarms,
protection, interlocks, trip functions, monitoring
Pipe numbers
Valves location code
Terminal numbers
Component list for in line control and protection
systems
Consumer/supplier location code
Termination details and type of external signal
(Color, fire and gas trip signal)
Pressure, flow and temperature rating
Reference drawings.
Layout
Drawing showing all areas of the power plant.
Drawing code and identification
Date (issue/revision)
Plant name (and code, when necessary)
Areas: relative position, dimensions, names and codes.
Test program
report
Commissioning report which demonstrates
that an item is in compliance with
specifications.
Manufacturer with Model / type / serial number
Date of commissioning
Warranty period and conditions
Fulfillment of the technical details:
— size (when required);
— weight(when required);
— power and Service Requirements
— capacity/performance (output);
Assembly details and operation data.
Certificates
Specific safety and statutory regulations
certificates for items (lifting equipment, steam
boilers, pressure vessels, etc).
Manufacturer with Model/type/serial number
Date of manufacture
Subject to be certified
Date of certificate
Certification body/office and signature/stamp.

94
Table 7.1—2 Shows guidelines / documents needed within the operational phase of equipment. (BS
EN13460:2002, 2002)
Guideline/Document Name Document Description Information Items
D1
Document index
Relevant aspects concerning the
issue of each maintenance
document.
Document number
Document title
Document originator (design, manufacturer, operation, maintenance, etc.)
D2
Equipment basic data
Equipment basic information
coming from either the
preparatory or the operational
phase. This information is related
to technical, contractual,
administrative, locational and
operational aspects of an
equipment, in order to define it
within the company.
Location code
Equipment name
Acquisition price of the equipment
Manufacturer/Model/type/serial number
Date of manufacture/Date of installation
Warranty period
Responsible maintenance department
Standard estimated maintenance time
(preventive and corrective)
D3
Equipment history record of
maintenance operations
List of work orders of a
particular equipment.
Equipment code and name
Date (issue)
List of work orders chronologically ordered
including:
— number
— date
— complaint/cause
— failing part
— running hours of the item
— registration/open/closure dates
— cost of job covered by the work order
D4 Work order Main document to release, to
follow and to manage each
maintenance operation.
The format will be based on the software that the power plant already possesses.

95
Guideline/Document Name Document Description Information Items
D5
Spare parts cross reference list
Catalogue of spare parts and
articles stored
Article code, Name & Description
Stock location
Main supplier, Lead time & Price
Unit of measure & Unit of purchase
Minimum level & Order quantity
Supplier article code
D6
Cause and effect diagram
Diagram showing, by order of
importance, the different causes
which produce a given failure for
a particular equipment.
Effect description and code
Serial number/location codes
Diagram date (issue date)
Period of time analyzed
List of causes in descendent order, including
for each cause:
— cause description
— relative cause importance % (in cost, downtime, number of failures, etc.)
— total importance (cost or downtime or number of failures produced, etc.)
D7
Parameter history record
Set of values given by any
equipment inspected/ monitored
parameter during a certain period
of time.
Item code and name
Parameter description and measure units
Measurement point identification
Date (issue)
Period of time analyzed (since/to)
For each record:
— time
— parameter value
— measurement point identification
Cross-reference to technical procedure
D8 MTBF-MTTR control chart Statistical information document.
Contains the referred values for
equipment considered of major
interest
Item code and Identification
Date(issue)
Cause of failure analyzed and code
MTTR — MTBF

96
Guideline/Document Name Document Description Information Items
D9
Planning sheet
List of work orders according to
a given priority
Date (issue)
Item code and identification
Planning period (from/to)
List of work orders sorted including:
— number
— expected date
— complaint
— item (lower level)
D10 Scheduling sheet Work orders planning and time
schedule assignment for a given
period. It is obtained by
assigning the available resources
to the work orders backlog.
Date (issue)
Equipment code and identification
Planning period (since/to)
List of work orders sorted including:
— number
— start date
— due time –complaint
— resources required by the work order
D11 Production planning Planning of the use of
production resources
(installations, personnel),
defining availability window for
maintenance operations implying
complete or partial shutdown.
Annual production program
Monthly production program
Weekly/daily production program
D12
Maintenance cost history record
Maintenance expenses classified
according to the maintenance for
a given period of time.
Date issued
Period of time analyzed (since/to)

97
Guideline/Document Name Document Description Information Items
D13
Management reviews of
maintenance quality goals and
policies
Manual of the company's
maintenance quality policy and
system
General policy
Governing principles
Organization and responsibility
Elements of the maintenance quality system
List of quality-relevant documents
D14 Procedure for maintenance
contract
Check list of points to be verified
when reviewing a contract.
Company's contracting policy.
D15
Procedure to review causes of
critical failures
Instructions regarding the
periodic review of causes for
critical failures.
History recording of critical failures per machine/element.
Failure cost.
Causes of failure.
Work carried out.
D16 Procedures to evaluate
maintenance operations time for
critical failures (MTTR, MTTM)
Description of work
measurement techniques to be
used.
History recording of critical failures per machine/element.
Time between failures
Time to repair each failure.
D17 Acceptable maintenance
suppliers
List of qualified maintenance
suppliers.
Address, Ownership, Size, Occupancy
Financial Situation
References & Expertise
Proximity
D18
Procedure to issue maintenance
items purchase orders
Instructions for technical
purchasing.
Definitions
Purchase requisitions
Offer requests
Offer selection
Purchase orders
Technical and general specifications
Commercial and legal terms
Payment conditions
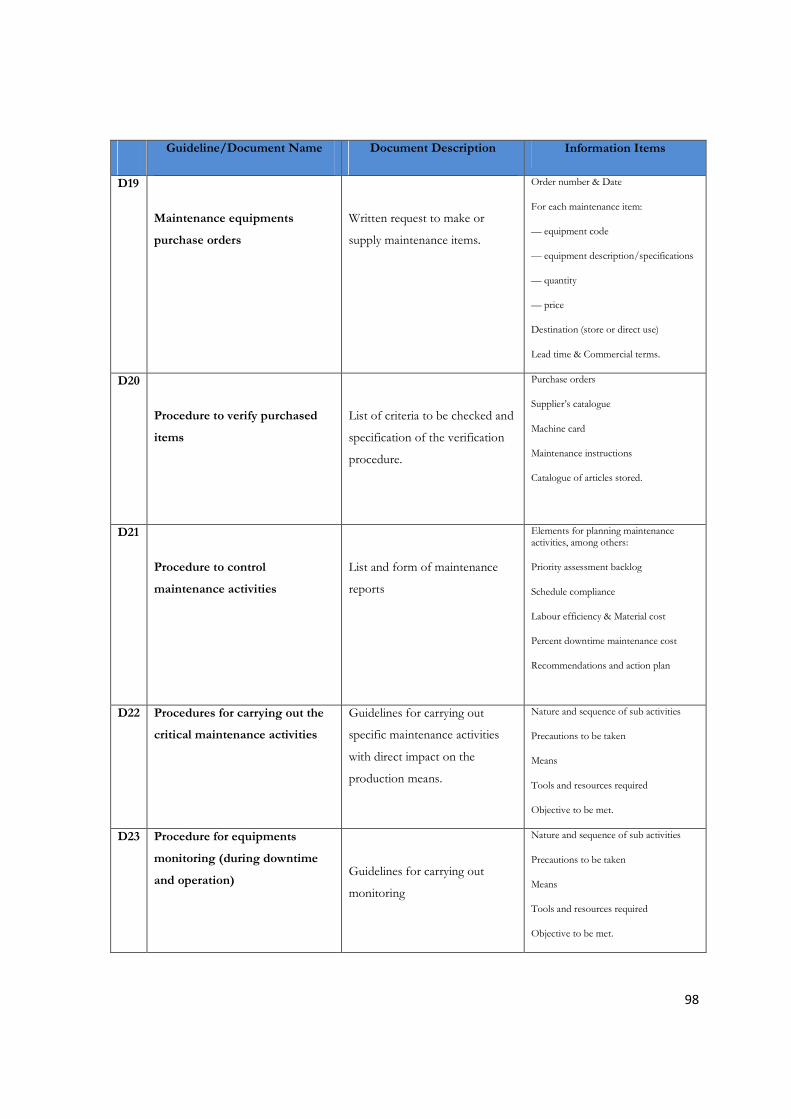
98
Guideline/Document Name Document Description Information Items
D19
Maintenance equipments
purchase orders
Written request to make or
supply maintenance items.
Order number & Date
For each maintenance item:
— equipment code
— equipment description/specifications
— quantity
— price
Destination (store or direct use)
Lead time & Commercial terms.
D20
Procedure to verify purchased
items
List of criteria to be checked and
specification of the verification
procedure.
Purchase orders
Supplier’s catalogue
Machine card
Maintenance instructions
Catalogue of articles stored.
D21
Procedure to control
maintenance activities
List and form of maintenance
reports
Elements for planning maintenance activities, among others:
Priority assessment backlog
Schedule compliance
Labour efficiency & Material cost
Percent downtime maintenance cost
Recommendations and action plan
D22 Procedures for carrying out the
critical maintenance activities
Guidelines for carrying out
specific maintenance activities
with direct impact on the
production means.
Nature and sequence of sub activities
Precautions to be taken
Means
Tools and resources required
Objective to be met.
D23 Procedure for equipments
monitoring (during downtime
and operation)
Guidelines for carrying out
monitoring
Nature and sequence of sub activities
Precautions to be taken
Means
Tools and resources required
Objective to be met.
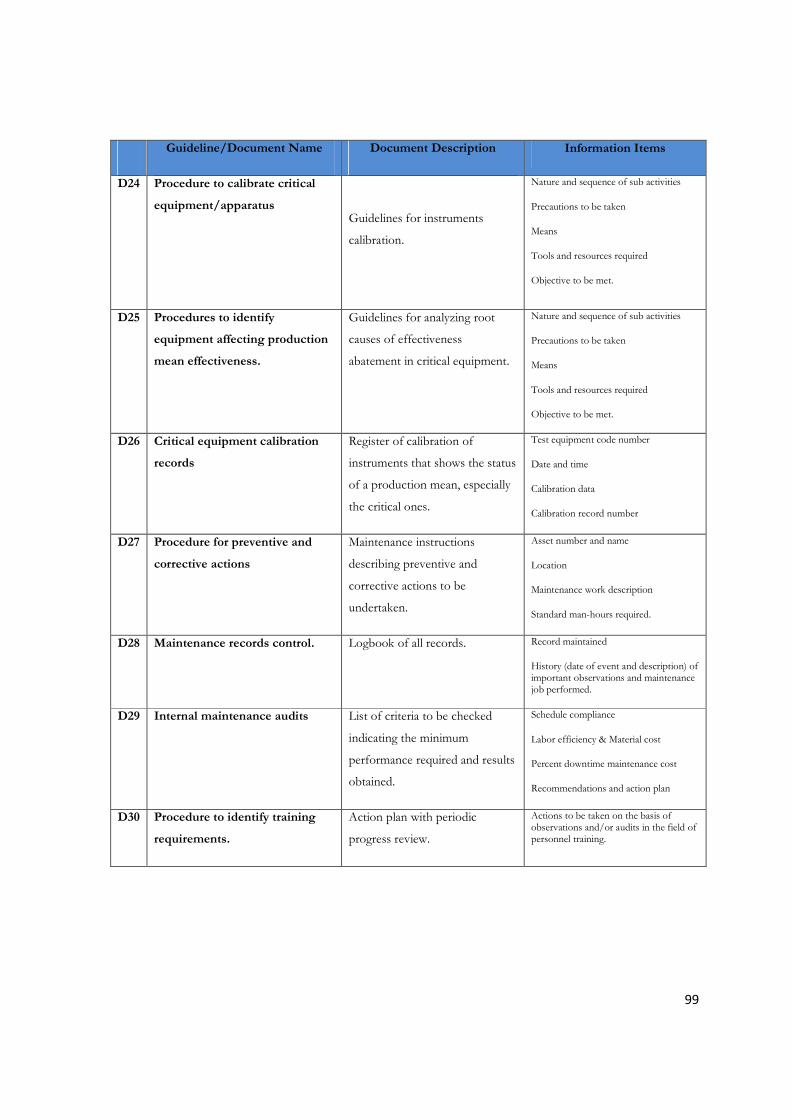
99
Guideline/Document Name Document Description Information Items
D24 Procedure to calibrate critical
equipment/apparatus
Guidelines for instruments
calibration.
Nature and sequence of sub activities
Precautions to be taken
Means
Tools and resources required
Objective to be met.
D25 Procedures to identify
equipment affecting production
mean effectiveness.
Guidelines for analyzing root
causes of effectiveness
abatement in critical equipment.
Nature and sequence of sub activities
Precautions to be taken
Means
Tools and resources required
Objective to be met.
D26 Critical equipment calibration
records
Register of calibration of
instruments that shows the status
of a production mean, especially
the critical ones.
Test equipment code number
Date and time
Calibration data
Calibration record number
D27 Procedure for preventive and
corrective actions
Maintenance instructions
describing preventive and
corrective actions to be
undertaken.
Asset number and name
Location
Maintenance work description
Standard man-hours required.
D28 Maintenance records control. Logbook of all records. Record maintained
History (date of event and description) of important observations and maintenance job performed.
D29 Internal maintenance audits List of criteria to be checked
indicating the minimum
performance required and results
obtained.
Schedule compliance
Labor efficiency & Material cost
Percent downtime maintenance cost
Recommendations and action plan
D30 Procedure to identify training
requirements.
Action plan with periodic
progress review.
Actions to be taken on the basis of observations and/or audits in the field of personnel training.

100
7.2 Documents for maintenance strategy guidelines and maintenance quality
system In order to fulfill the quality policy which OTEOSAL wants to put forward as specified in ISO 9001, this
thesis, based on the British Standard, BS EN13460:2002, 2002 “Maintenance – Documents for
Maintenance”, provides a list that defines the adequate set of documents that support the information needed
to perform the different tasks involved in the maintenance function of the power plant.
From the document BS EN13460:2002, 30 documents including records and procedures (see Table 7.1-2) has
been identified and selected to cover the requirements for the maintenance quality system that best suite
OTEOSAL.
To find out the kind of information necessary to perform the maintenance activities, first of all, all the tasks
have to be studied in detail. The starting point of the analysis to be carried out to obtain the required
documentation of information for maintenance is the “Maintenance workflow” (see Figure 7.2-1). At the
power plant, the management of the maintenance department can make use of the “Maintenance workflow”
in order to realize the documents of information that they will need for setting up a standard maintenance
strategy.
A combination of the 30 documents (from Table 7.1-2 – D1 to D30) and the use of the chart found in figure
7.2 will bring as end product a standard maintenance policy as part of ISO 9001.
The correct fulfillment of each one of the maintenance workflow steps requires the supply of certain
information, contained in the INPUT DOCUMENTS (see Figure 7.2-2). Each step of the maintenance
workflow generates information, contained in the OUTPUT DOCUMENTS (see Figure 7.2-2), which will be
necessary to carry out other steps.
Each step is detailed for easy comprehension of the information which is required and generated as seen in
figure 7.2-2 (BS EN13460:2002, 2002)

101
Figure 7.2-1 The Maintenance Workflow (BS EN13460:2002, 2002)
STUDY DEFINE
PREVENTIVE CORRECTIVE
MAINTENANCE OPERATIONS
WORK PLANNING
RELEASE – ASSIGNMENT OF THE WORK ORDER
CARRY OUT THE WORK
CLOSURE OF THE WORK ORDER
PRODUCTION OF REPORTS
REPORTS ANALYSIS
WORK SCHEDULING

102
Continued
Figure 7.2-2 Input/Output Documents (BS EN13460:2002, 2002)
Study – Define
Maintenance Activities
• Preventive
o Spare Parts
o Estimated Resources
• Corrective
Work Planning
Ordered list of works according to a
priority and for a given period
Work Schedule
Date to start and finish each
maintenance work.
Resources assignation
Work Order Release and Assignment
Input Documents Maintenance Activities Output Documents
-Documents required from
the preparatory phase
-Feedback Documents
-Procedures
-Other Plant Specific
Documentation; E.g: D13 &
D29 (see Table 7.2)
-Preventive Plan (See Table 7.2: D27)
-Procedures
-Spare Part List (D5)
-Required Resources
-W.O Request (D4)
-Production Planning (D11)
-Procedures
-Feedback Documents
Planning Sheet (D9)
-Planning Sheet (D9)
-Spare Parts in Stock
-Tools
-Resources
-Man Power Resources (D30)
Scheduling Sheet (D10)
-Scheduling Sheet (D10)
-Spare Parts in Stock
-Tools
-Resources
-Man Power Resources (D30)
Work Order (D4)

103
Figure 7.2-2 Input/Output Documents (BS EN13460:2002, 2002) Continued
Carry Out the Work
Closure of the Work Order
Production of Reports
Reports Analysis
Input Documents Maintenance Activities Output Documents -Documents required from
the preparatory phase
-Procedures
-Work Order (D4)
-Spare Part List (D5)
-Tools
-Feedback Documents
-Work Order (D4)
-Procedures
History Records (D3 & D7)
-History Records
-Procedures
Records (Reports) E.g: D12
Records (Reports)
Feedback Documents
Improvement Proposal

104
8 Discussion and Conclusion
8.1 Overview From the data in Table 1.1, it can be seen that the total maintenance cost for the power plant is increasing
each year and therefore this tends to make the management of OTEOSAL to view maintenance as a cost
center when it is actually an important economic activity to the organization. This view can change if
maintenance activities are optimized so that only the right activities are done by the right personnel at the
right time using the right tools, resources and procedures. The management strategies and methods are useful
in optimizing maintenance through proper planning and execution of maintenance tasks. The fact that
OTEOSAL is operated as a baseload power plant puts high demand on plant maintenance teams to ensure
high availability, reliability and safety of the plant.
8.2 Maintenance and management methods The literature review part has showed that the RCM method is suitable for determining and optimizing
maintenance strategies for newly installed equipment, determining PM procedures for complex systems and
for analyzing and cutting down excessive maintenance costs. Also when new design or equipment different
from the existing ones are brought forward, new maintenance procedures must be developed for the new
equipment or design. Another case where RCM is useful is when the plant has high down time. An RCM
method can be used to analyze the maintenance needs for the new plant by doing FMEA analysis and
develop maintenance procedures that will meet the requirements at the same time fitting into the existing
maintenance programs.
From the chapter Literature Review, it can be observed that there are many maintenance problems in the
power plant that can be addressed by lean method. They include waste of manpower when maintenance staff
are used to do non-maintenance tasks, long delays of work due to lack of spare parts or waiting for people,
maintenance tasks taking long because of delays of transport, spare parts, waiting for the equipment to be
stopped and isolated or waiting for the people. Lean can be used to identify man hours wasted because of
unnecessary human movements for example to pick tools or to go to the stores and return back. When these
wasted man-hours are eliminated, manpower costs can be reduced significantly and these resources can be
used for other more important works.
8.3 Maintenance Strategy based on FTA and FMEA It has been seen in the introductory chapter that the cost of maintenance for the company is weighing a lot
on the budget and this is mainly due to a lack of knowledge of the different failures that can occur on
particular equipments and their effect and criticality on the different systems.

105
The power plant has been divided into 10 major parts composing of the main equipments and Fault Tree
Analysis has been performed for these equipments where the people of the maintenance department can have
an overview of the different failures that can occur. The analysis was followed by a FMEA and has showed
that many machines are critical and can cause plant failure. So, it is unwise to practice one maintenance
strategy on the machine. It is preferable to perform a combination of the maintenance task because a machine
can have many types of causes related to its failure. Also greater significance was given to detection and
severity indices as these components are very critical for the plant. Subsequently, appropriate maintenance
strategies were suggested as listed in Tables 5.6 and A.3.
The maintenance methods of PM, CBM and CM have their strengths and weaknesses and suitability. CBM is
presented in many literatures as the most optimum maintenance method because the maintenance tasks are
based on the measured need of the equipment. The cost of CBM tools is high. PM is the most widely used
method but is only suitable where failure is age related. Most failures are not age related. CM is most
appropriate where failure has little consequences.
It can be said that to address the high downtime, RCM method will employ the root cause analysis, Fault Tree
Analysis and FMEA to identify the causes of the down time. Hence, by identifying and solving the root
causes of downtime, down time costs will be greatly reduced.
8.4 Quantitative Analysis of FTA and Pareto Analysis FTA and FMEA allow identifying critical equipments at the power plant and the Grate Stocker, one of the
most important and critical equipment for the plant was selected to perform a Quantitative Analysis of the
FTAs. The MTTF (Mean Time to Failure) and Failure Rates as well as the probability of failure and reliability
of the Grate Stocker have been calculated from the Quantitative Analysis. The probability of failure for the
Grate Stocker is seen to be 0.98 and has reliability as low as 0.02.
The Grate Stocker is composed of the Travelling Grate, the Coal Feeders and Coal Spreaders and Pareto
Analysis has revealed for the last 3 years the parts of the different equipments that are more susceptible to
failure. Also the Mean Frequency of Breakdown for the different parts was presented.
With Quantitative Analysis of FTA and Pareto Analysis, equipments needing more attention are identified
and particular parts of equipment that are prone to breakdown are also identified. As can be seen in Figure
1.2, the value of the spare parts store is seen to rise because many spare parts are bought at random in fear of
having a shut down due to unavailability of spare parts. But these excess expenses on unnecessary spare parts
prevent the power plant from using wisely its finance and also contribute to a loss in profitability. All this is
due to a lack of a good maintenance strategy and knowledge of the criticalities and failure rates of particular

106
equipments. Quantitative Analysis of FTA and Pareto Analysis will allow having the right quantity of spare
parts at the right time without overstocking.
8.5 Quality Management System Interviews and observations at OTEOSAL have revealed that a number of concepts in the conventional
management are already being practiced under the classical concepts. All that is lacking is formalizing and
documenting the processes as required in the conventional methods. Selective application of the formal
methods would be very cost effective and beneficial for the company.
Fortunately OTEOSAL is projecting to be an ISO9001 certified company in 2012 so as to be able to
implement Quality Management Systems at the power plant. Therefore it was of upmost importance to set up
a maintenance strategy to be in line with the quality policy the company wants to put forward.
The British Standard, BS EN13460:2002, 2002 “Maintenance – Documents for Maintenance” has been
analyzed and adapted for OTEOSAL power plant.
8.6 Conclusion Maintenance costs at OTEOSAL contribute a significant part of the unit cost of electrical energy produced
and affect the profitability of the power plant. Hence it is necessary and crucial to minimize maintenance
costs by optimizing maintenance processes to make the plant run economically. This is achieved by
optimizing maintenance methods. Combining different maintenance and management methods and strategies
based on FTA, FMEA and Pareto Analysis and all these well formalized and documented according to
International Standard will certainly allow the power plant to gain a lot like availability, reliability and even
financially from maintenance and also will make OTEOSAL ready for new challenges appearing in the energy
sector in Mauritius.

107
9 REFERENCES
British Standard, BS EN 13460:2002, Maintenance —Documents for maintenance, BSI, London.
Balbir S. Dhillon - 1999 - Business & Economics [Online], Available at:
books.google.com/booksisbn=088415257X... (Accessed August 2011)
Clety Kwambai Bore, 2008: Analysis of Management Methods and Application to Maintenance of Geothermal Power
Plants. MSc Thesis. University of Iceland. 2008.
Howard C. Cooper, 2002: Lean maintenance for lean manufacturing; A white paper by Amemco company Infor
Global Solutions GmbH, 2007: Lean maintenance best practices to turn asset management into a profit-
centre.
Jerry Kilpatrick, 2003: Lean Principles. Utah manufacturing extension partnership.
Jim August, 1999: Applied Reliability Centered Maintenance. Pennwell publishers, 500pp.
Kelly, A. 1997, Maintenance Strategy: Business Centred Maintenance, Oxford Butterworth Heinemann
Marvin Rausand and Arnljot Heyland, 2004. In SYSTEM RELIABILITY THEORY. 2nd ed. John Wiley
& Sons, Inc., Hoboken, New Jersey. p.160.
Michael V Brown, 2003: Building a PM program brick by brick, new standard institute Inc publications.
http://www.newstandardinstitute.com
Mobley, R.K., 2002, Introduction to Preventive Maintenance, 2nd ed, Butterworth Heinemann, Elsevier, 2002.
Pp4.
Mobley, R.K, Higgins, R.L., Darrin, J., Wikoff, D.J., 2008, Maintenance Engineering Handbook, 7th ed,
McGraw-Hill
Narayan, V., 2004. In Effective maintenance management. New York: Industrial Press Inc. p.33.
Ricky Smith, 2004: What is lean maintenance? Maintenance Technology October 2004, Life Cycle Engineering
Robson Quinello, 2003: Ford Motor Co. Brasil, Maintenance and Six Sigma. Web based article.
Stanley (Stan) T. Grabill, 2001: Sigma Breakthrough Technologies, Inc. Web based article.
http://en.wikipedia.org/wiki/Pareto_analysis (Accessed December 2011)

108
http://www.mt-online.com/component/content/article/187-may2001/643-process-mapping-in-six-
sigma.html and http://www.mt-online.com/component/content/article/188-september2001/655-the-new-
world-of-six-sigma-dont-get-left-behind.html?Itemid=90 (Accessed August 2011)
http://www.mt-online.com/component/content/article/208-november2003/1104-maintenance-and-six-
sigma.html?Itemid=90 (Accessed August 2011)

109
APPENDIX 1 – FTA Diagrams

110

111

112

113

114

115

116

117

118
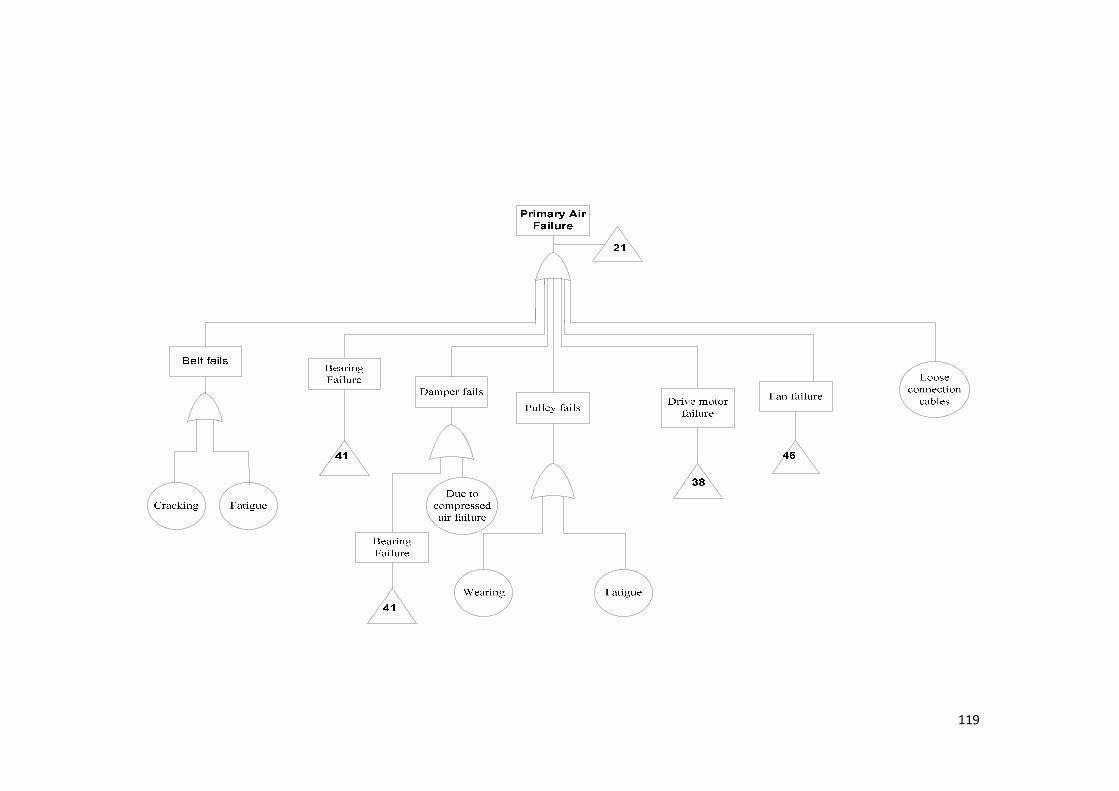
119

120
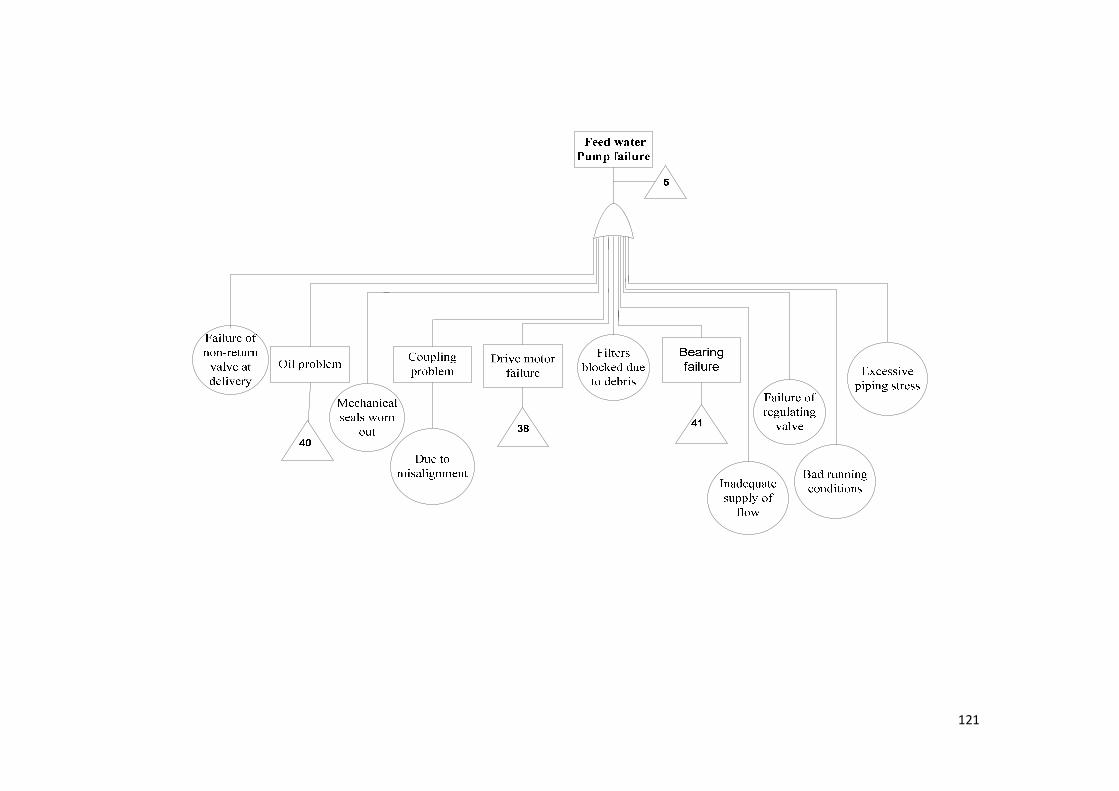
121
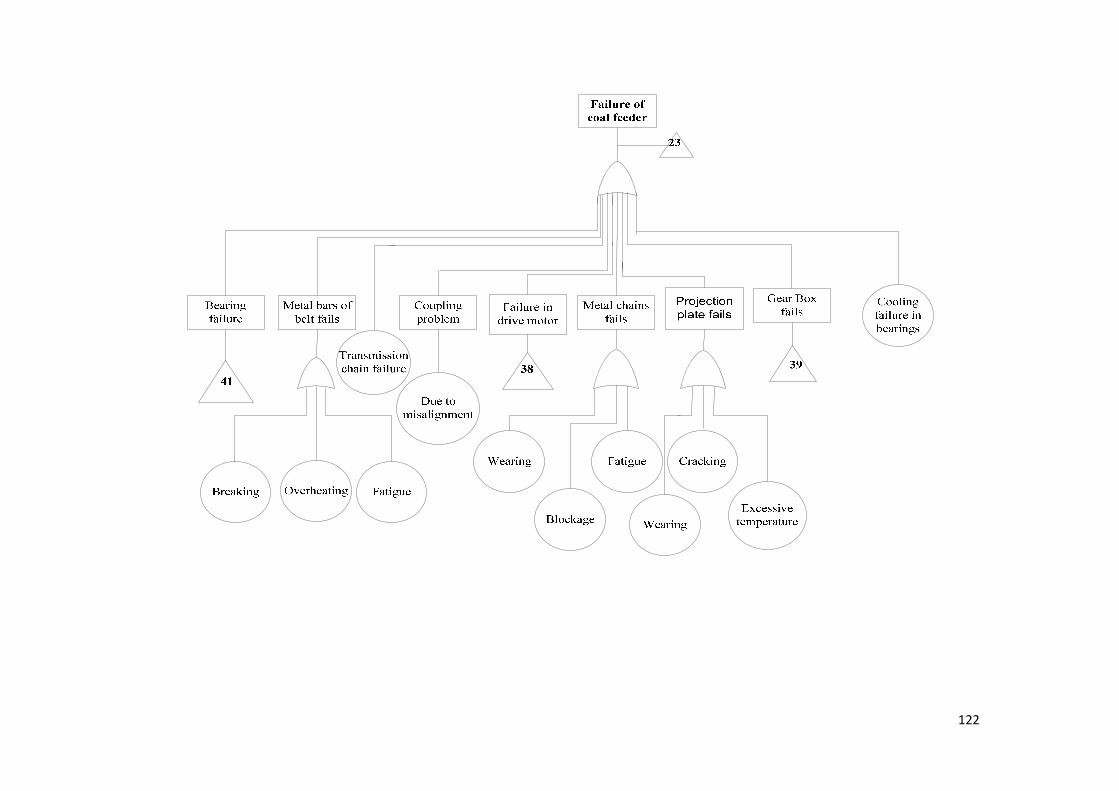
122

123

124

125
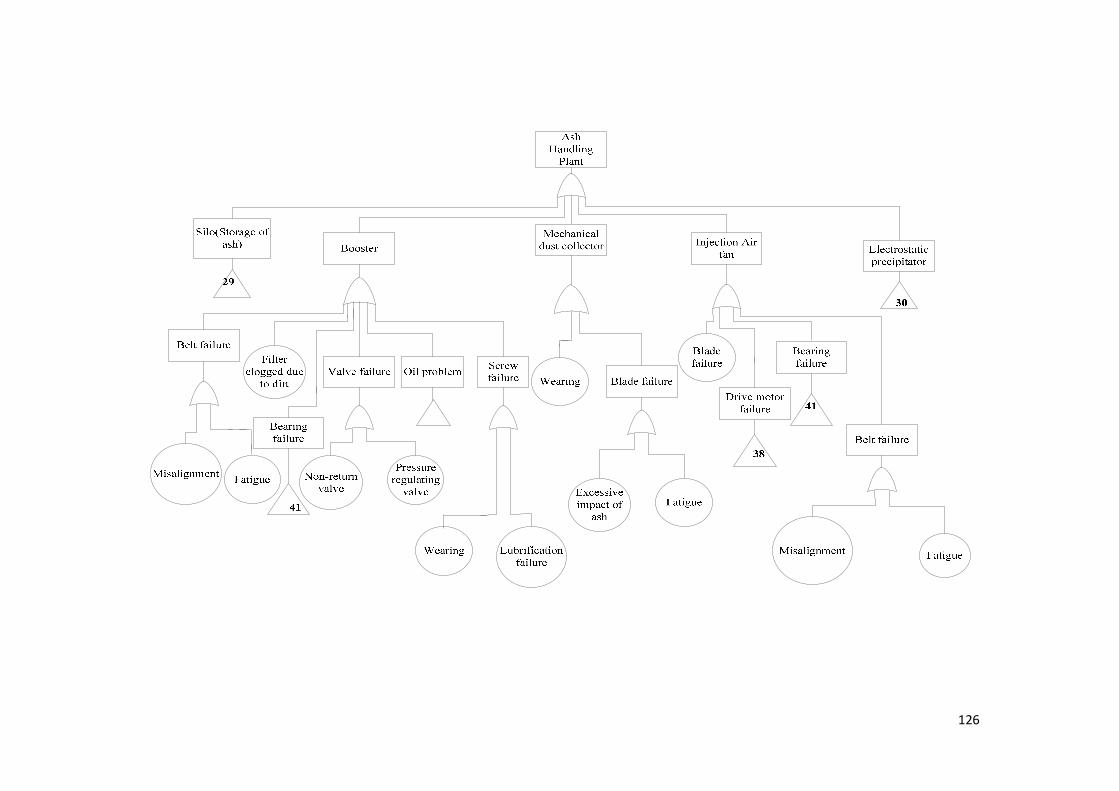
126

127

128

129

130

131
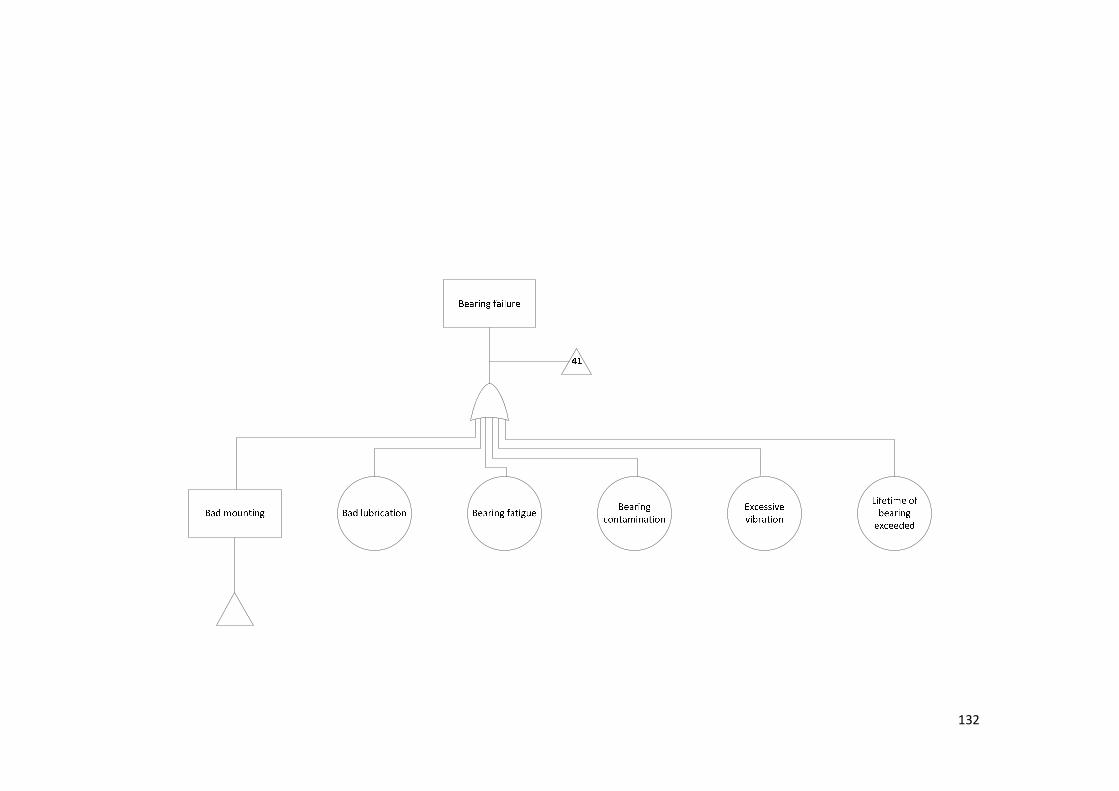
132

133
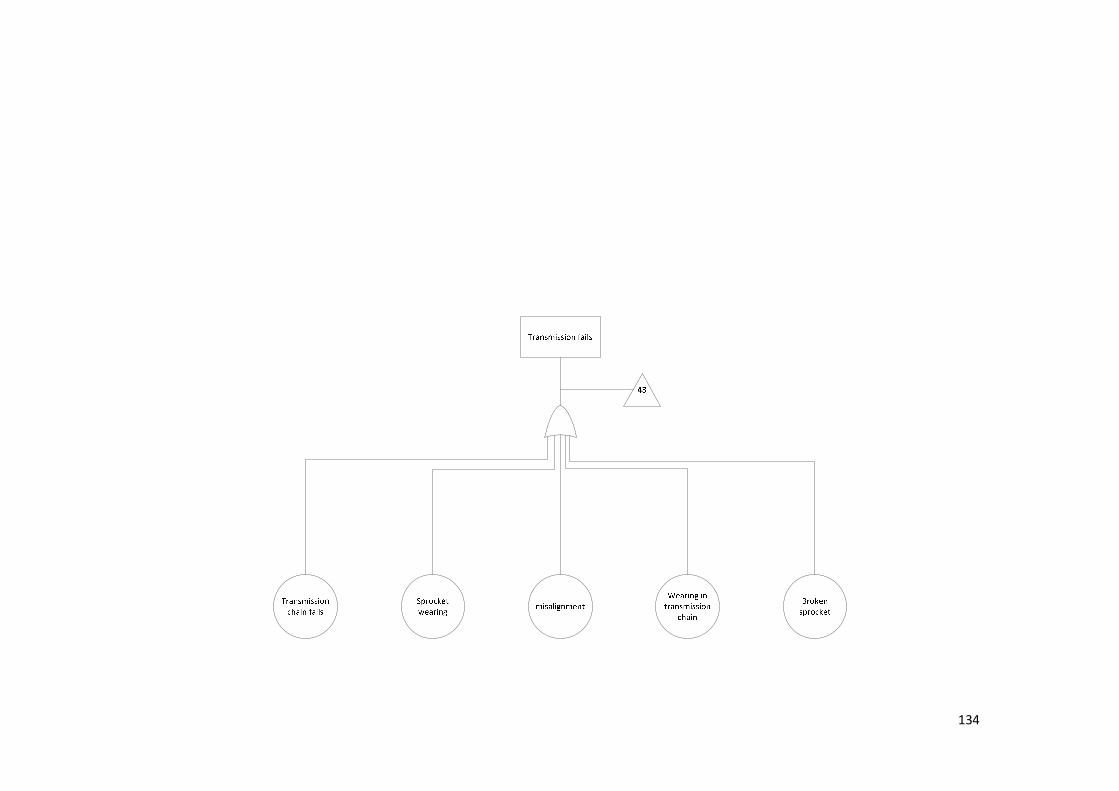
134
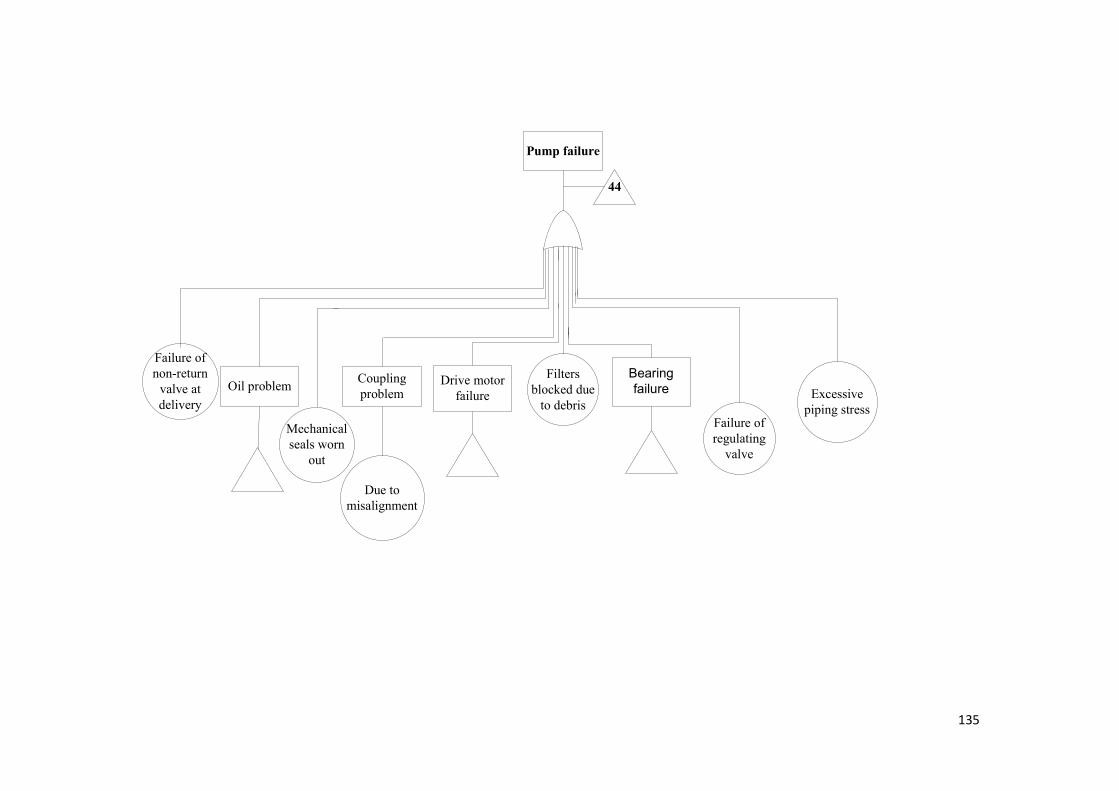
135
Pump failure
Failure of
non-return
valve at
delivery
Mechanical
seals worn
out
Coupling
problemDrive motor
failure
Bearing
failureOil problem
Due to
misalignment
Filters
blocked due
to debris
Failure of
regulating
valve
Excessive
piping stress
44
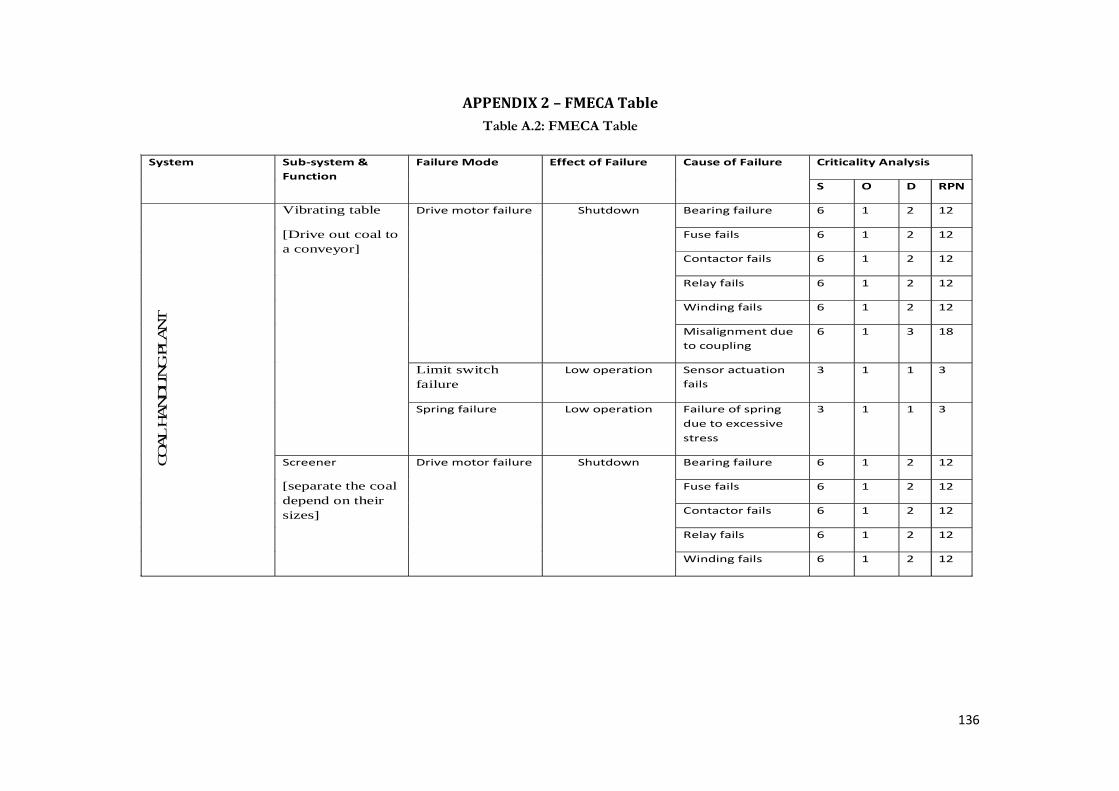
136
APPENDIX 2 – FMECA Table
Table A.2: FMECA Table
System Sub-system &
Function
Failure Mode Effect of Failure Cause of Failure Criticality Analysis
S O D RPN
COAL H
ANDLIN
G P
LAN
T
Vibrating table
[Drive out coal to a conveyor]
Drive motor failure Shutdown Bearing failure 6 1 2 12
Fuse fails 6 1 2 12
Contactor fails 6 1 2 12
Relay fails 6 1 2 12
Winding fails 6 1 2 12
Misalignment due
to coupling
6 1 3 18
Limit switch failure
Low operation Sensor actuation
fails
3 1 1 3
Spring failure Low operation Failure of spring
due to excessive
stress
3 1 1 3
Screener
[separate the coal depend on their sizes]
Drive motor failure Shutdown Bearing failure 6 1 2 12
Fuse fails 6 1 2 12
Contactor fails 6 1 2 12
Relay fails 6 1 2 12
Winding fails 6 1 2 12

137
System Sub-system &
Function
Failure Mode Effect of Failure Cause of Failure Criticality Analysis
S O D RPN
COAL H
ANDLIN
G P
LAN
T
Vibrating table
[Drive out coal to a conveyor]
Drive motor failure Shutdown Bearing failure 6 1 2 12
Fuse fails 6 1 2 12
Contactor fails 6 1 2 12
Relay fails 6 1 2 12
Winding fails 6 1 2 12
Misalignment due
to coupling
6 1 3 18
Limit switch failure
Low operation Sensor actuation
fails
3 1 1 3
Spring failure Low operation Failure of spring
due to excessive
stress
3 1 1 3
Screener
[separate the coal depend on their sizes]
Drive motor failure Shutdown Bearing failure 6 1 2 12
Fuse fails 6 1 2 12
Contactor fails 6 1 2 12
Relay fails 6 1 2 12
Winding fails 6 1 2 12

138
System Sub-system &
Function
Failure Mode Effect of Failure Cause of Failure Criticality Analysis
S O D RPN
COAL H
ANDLIN
G P
LAN
T
Screener
[separate the coal depending on their sizes]
Drive motor failure Shutdown Misalignment due
to coupling
6 1 3 18
Bearing failure Shutdown Overloading 6 1 3 18
Lubrification failure 6 1 3 18
Shock absorber
fails
Low operation Component fails
due to excessive
stress
5 1 2 10
Bolt failure Low operation Bolts broken 3 10 1 30
Loosening of bolts
due to excessive
vibration
3 10 1 30
Screen failure Shutdown Misalignment 5 1 3 15
Conveyor
[Transportation of
coal]
Sensor failure Low operation Jam sensor fails 3 5 2 30
Rotational sensor 3 1 1 3
Bearing failure
Shutdown Overloading 6 1 3 18
Lubrification failure 6 1 3 18

139
System Sub-system &
Function
Failure Mode Effect of Failure Cause of Failure Criticality Analysis
S O D RPN
COA
L H
AN
DLIN
G P
LA
NT
Conveyor
[Transportation of
coal]
Drive motor failure Shutdown Bearing failure 6 1 2 12
Fuse fails 6 1 2 12
Contactor fails 6 1 2 12
Relay fails 6 1 2 12
Winding fails 6 1 2 12
Misalignment due
to coupling failure
6 1 3 18
Roller failure Low operation Component fails
due to friction and
wearing
3 2 1 6
Conveyor belt
failure
Shutdown Misalignment of
belt
5 1 3 15
Tearing 6 1 1 6
Failure of joints 3 2 1 6
Gear box failure Shutdown Seals fail 5 1 2 10
Wearing of gear 5 1 2 10
Gear clogged 5 1 2 10

140
System Sub-system &
Function
Failure Mode Effect of Failure Cause of Failure Criticality Analysis
S O D RPN
CO
AL H
AN
DLIN
G P
LA
NT
Conveyor
[Transportation of
coal]
Gear box failure Shutdown Lubrification failure 5 1 4 20
Bearing failure 5 1 4 20
Bearing failure Shutdown Overloading 6 1 3 18
Lubrification failure 6 1 3 18
Crusher
[Reduce the coal in
size between 0-50
mm]
Belt drive failure Low operation Fatigue failure 3 1 1 3
Cracking 3 1 1 3
Gear box failure Shutdown Seals fail 5 1 2 10
Wearing of gear 5 1 2 10
Gear clogged 5 1 2 10
Lubrification failure 5 1 4 20
Bearing failure 5 1 4 20
Crusher teeth
failure
Shutdown Component fails
due to wearing
5 1 1 5
Coupling problem 5 1 3 15

141
System Sub-system &
Function
Failure Mode Effect of Failure Cause of Failure Criticality Analysis
S O D RPN
CO
AL H
AN
DLIN
G P
LA
NT
Crusher
[Reduce the coal in
size between 0-50
mm]
Bearing failure Shutdown Overloading 6 1 3 18
Lubrification failure 6 1 3 18
Sensor failure Low operation Component
defective
3 5 1 15
Crusher clogged Low operation Component fails
due to big
unwanted particles
3 3 2 18
Silo
[Storage of coal]
Bearing failure Shutdown Overloading 6 1 3 18
Lubrification failure 6 1 3 18
Gear box failure Shutdown Seals fail 5 1 2 10
Wearing of gear 5 1 2 10
Gear clogged 5 1 2 10
Lubrification failure 5 1 4 20
Bearing failure 5 1 4 20
Drive motor failure Shutdown Bearing failure 6 1 2 12
Fuse fails 6 1 2 12
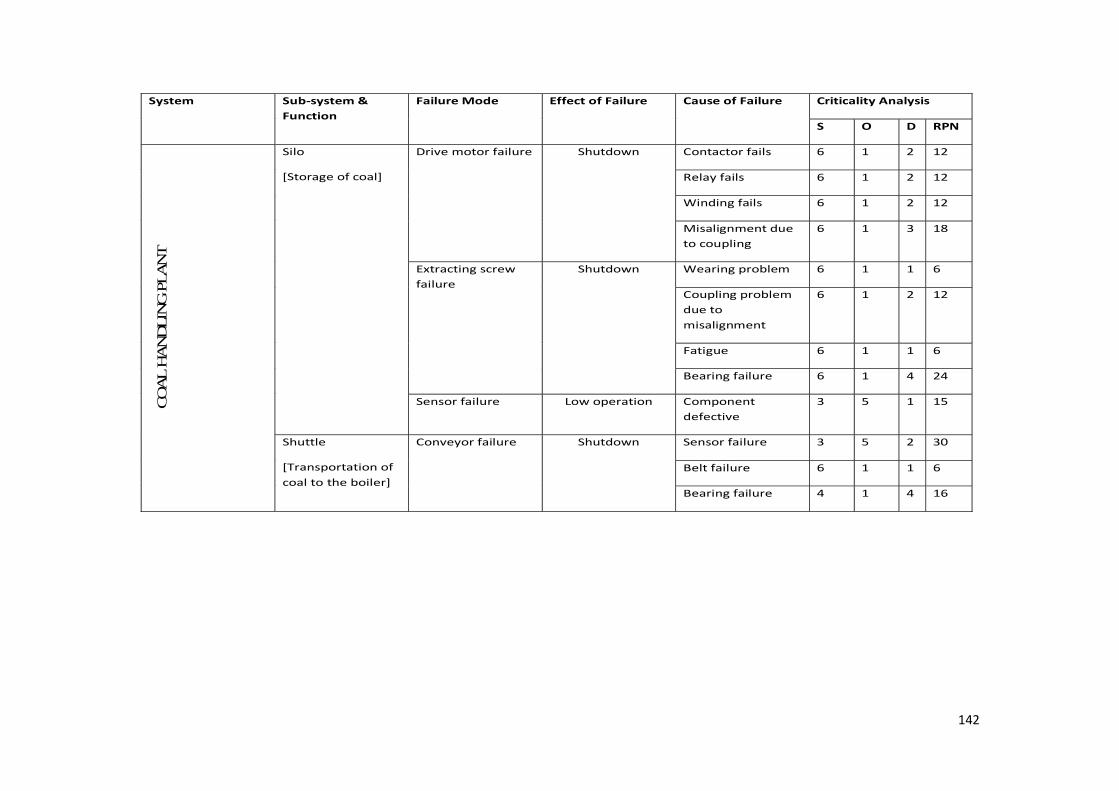
142
System Sub-system &
Function
Failure Mode Effect of Failure Cause of Failure Criticality Analysis
S O D RPN
CO
AL H
AN
DLIN
G P
LA
NT
Silo
[Storage of coal]
Drive motor failure Shutdown Contactor fails 6 1 2 12
Relay fails 6 1 2 12
Winding fails 6 1 2 12
Misalignment due
to coupling
6 1 3 18
Extracting screw
failure
Shutdown Wearing problem 6 1 1 6
Coupling problem
due to
misalignment
6 1 2 12
Fatigue 6 1 1 6
Bearing failure 6 1 4 24
Sensor failure Low operation Component
defective
3 5 1 15
Shuttle
[Transportation of
coal to the boiler]
Conveyor failure Shutdown Sensor failure 3 5 2 30
Belt failure 6 1 1 6
Bearing failure 4 1 4 16
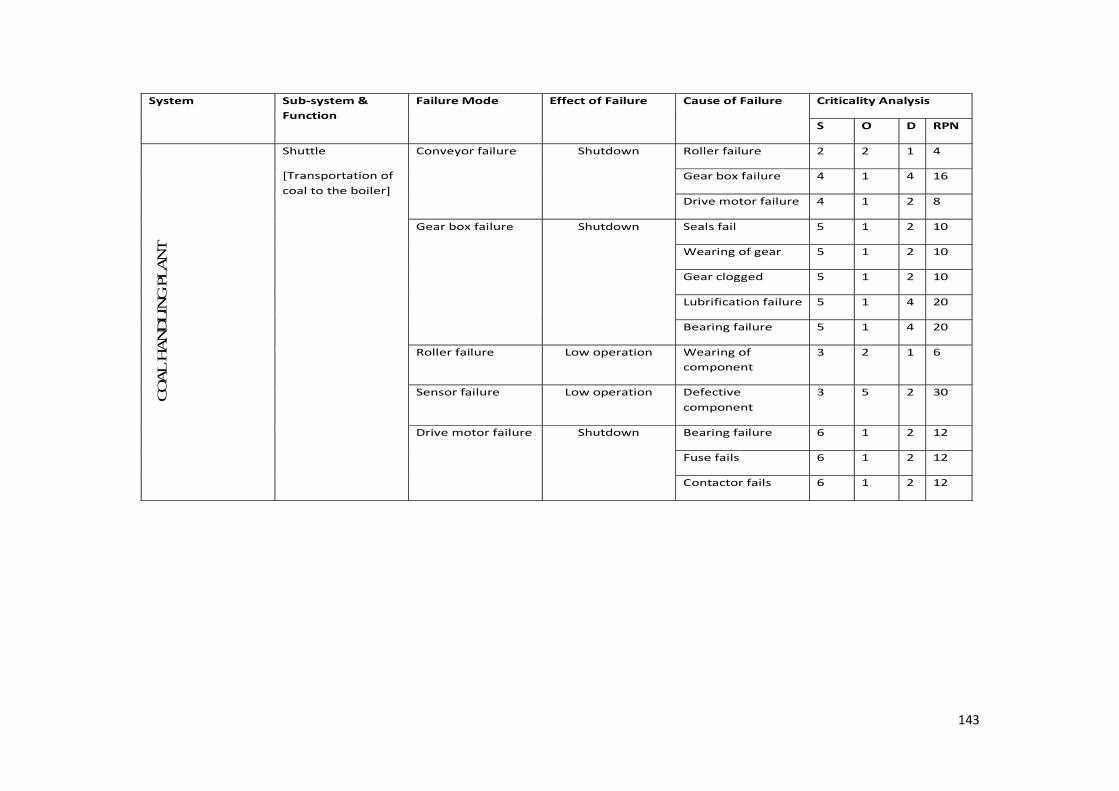
143
System Sub-system &
Function
Failure Mode Effect of Failure Cause of Failure Criticality Analysis
S O D RPN
CO
AL H
AN
DLIN
G P
LA
NT
Shuttle
[Transportation of
coal to the boiler]
Conveyor failure Shutdown Roller failure 2 2 1 4
Gear box failure 4 1 4 16
Drive motor failure 4 1 2 8
Gear box failure Shutdown Seals fail 5 1 2 10
Wearing of gear 5 1 2 10
Gear clogged 5 1 2 10
Lubrification failure 5 1 4 20
Bearing failure 5 1 4 20
Roller failure Low operation Wearing of
component
3 2 1 6
Sensor failure Low operation Defective
component
3 5 2 30
Drive motor failure Shutdown Bearing failure 6 1 2 12
Fuse fails 6 1 2 12
Contactor fails 6 1 2 12

144
System Sub-system &
Function
Failure Mode Effect of Failure Cause of Failure Criticality Analysis
S O D RPN
CO
AL H
AN
DLIN
G P
LA
NT
Shuttle
[Transportation of
coal to the boiler]
Drive motor failure Shutdown Relay fails 6 1 2 12
Winding fails 6 1 2 12
Misalignment due
to coupling
6 1 3 18
Belt failure Low operation Fatigue 3 6 1 18
Misalignment 3 6 1 18

145
System Sub-system &
Function
Failure Mode Effect of Failure Cause of Failure Criticality Analysis
S O D RPN
BO
ILER W
ATER A
ND
STEA
M
Primary air
[Regulates the
quantity of air
moving into the
furnace]
Belt failure Low operation Cracking due to
fatigue
3 1 1 3
Bearing failure Shutdown Overloading 6 1 3 18
Lubrification failure 6 1 4 24
Damper failure Shutdown Compressed air
failure
7 1 2 14
Bearing failure 7 1 2 14
Pulley failure Low operation Wearing 4 1 2 8
Fatigue 4 1 2 8
Drive motor failure Shutdown Bearing failure 6 1 2 12
Fuse fails 6 1 2 12
Contactor fails 6 1 2 12
Relay fails 6 1 2 12
Winding fails 6 1 2 12
Misalignment due
to coupling failure
6 1 3 18

146
System Sub-system &
Function
Failure Mode Effect of Failure Cause of Failure Criticality Analysis
S O D RPN
BO
ILER W
ATER A
ND
STEA
M
Primary Air
[Regulates the
quantity of air
moving into the
furnace]
Fan failure Shutdown Bearing failure 6 1 4 16
Blade failure 6 1 2 12
Misalignment 6 1 2 12
Shaft failure 6 1 3 18
Electrical circuit
failure
6 1 4 24
Secondary Air
[Air is injected into
the exhaust gases
to allow for a full
combustion ]
Bearing failure Shutdown Overloading 6 1 3 18
Lubrification failure 6 1 4 24
Pulley failure Low operation Wearing 4 1 2 8
Fatigue 4 1 2 8
Damper failure Shutdown Compressed air
failure
7 1 2 14
Bearing failure 7 1 2 14
Drive motor failure Shutdown Bearing failure 6 1 2 12
Fuse fails 6 1 2 12
Contactor fails 6 1 2 12

147
System Sub-system &
Function
Failure Mode Effect of Failure Cause of Failure Criticality Analysis
S O D RPN
BO
ILER W
ATER A
ND
STEA
M
Secondary Air
[Air is injected into
the exhaust gases
to allow for a full
combustion ]
Drive motor failure Shutdown Relay fails 6 1 2 12
Winding fails 6 1 2 12
Misalignment due
to coupling failure
6 1 3 18
Fan failure Shutdown Bearing failure 6 1 4 16
Blade failure 6 1 2 12
Misalignment 6 1 2 12
Shaft failure 6 1 3 18
Electrical circuit
failure
6 1 4 24
Induced Draught
(ID) fan
[Removes flue
gases from the
furnace and forces
the exhaust gas up
the chimney]
Bearing failure Shutdown Overloading 6 1 3 18
Lubrification failure 6 1 3 18
Damper failure Shutdown Compressed air
failure
7 1 2 14
Bearing failure 7 1 2 14
Drive motor failure Shutdown Bearing failure 6 1 2 12

148
System Sub-system &
Function
Failure Mode Effect of Failure Cause of Failure Criticality Analysis
S O D RPN
BO
ILER W
ATER A
ND
STEA
M
&
BO
ILER C
OA
L
Induced Draught
(ID) fan
[Removes flue
gases from the
furnace and forces
the exhaust gas up
the chimney]
Drive motor failure Shutdown Fuse fails 6 1 2 12
Contactor fails 6 1 2 12
Relay fails 6 1 2 12
Winding fails 6 1 2 12
Misalignment due
to coupling failure
6 1 3 18
Fan failure Shutdown Bearing failure 6 1 4 16
Blade failure 6 1 2 12
Misalignment 6 1 2 12
Shaft failure 6 1 3 18
Electrical circuit
failure
6 1 4 24
Coal feeder
[Direct coal to the
spreader]
Bearing failure Shutdown Overloading 6 1 3 18
Lubrification failure 6 1 3 18
Drive motor failure Shutdown Bearing failure 6 1 2 12
Fuse fails 6 1 2 12
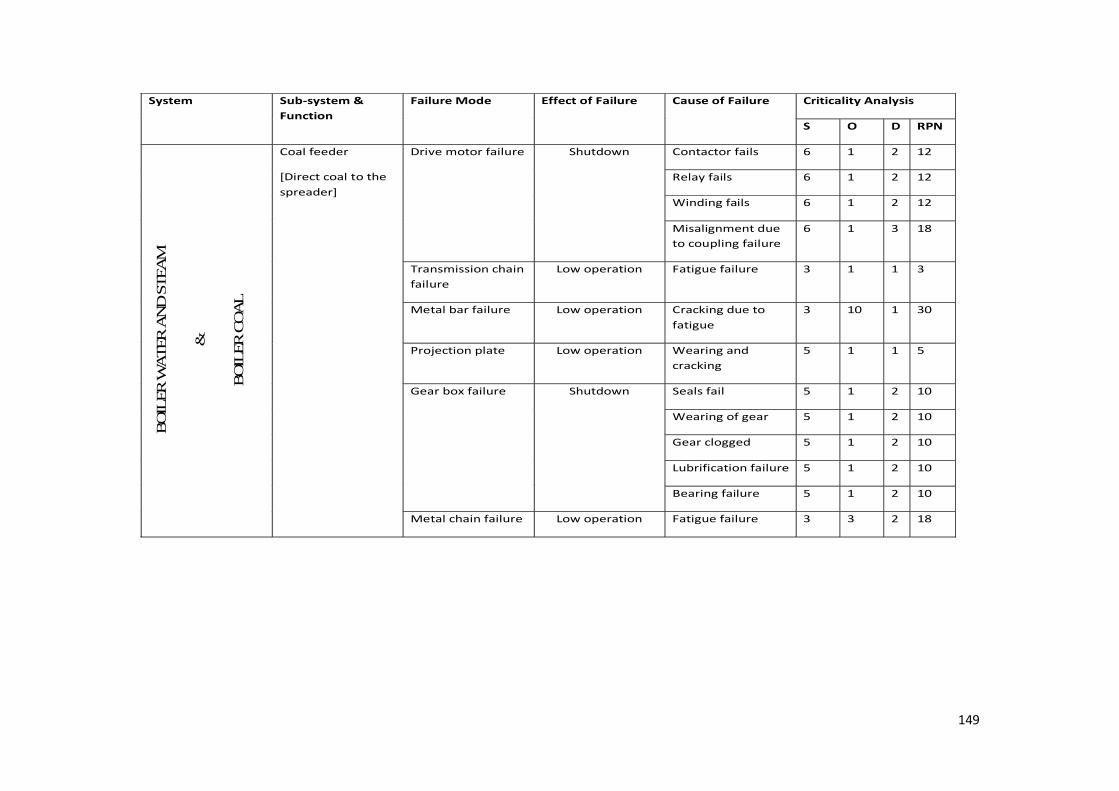
149
System Sub-system &
Function
Failure Mode Effect of Failure Cause of Failure Criticality Analysis
S O D RPN
BO
ILER W
ATER A
ND
STEA
M
&
BO
ILER C
OA
L
Coal feeder
[Direct coal to the
spreader]
Drive motor failure Shutdown Contactor fails 6 1 2 12
Relay fails 6 1 2 12
Winding fails 6 1 2 12
Misalignment due
to coupling failure
6 1 3 18
Transmission chain
failure
Low operation Fatigue failure 3 1 1 3
Metal bar failure Low operation Cracking due to
fatigue
3 10 1 30
Projection plate Low operation Wearing and
cracking
5 1 1 5
Gear box failure Shutdown Seals fail 5 1 2 10
Wearing of gear 5 1 2 10
Gear clogged 5 1 2 10
Lubrification failure 5 1 2 10
Bearing failure 5 1 2 10
Metal chain failure Low operation Fatigue failure 3 3 2 18

150
System Sub-system &
Function
Failure Mode Effect of Failure Cause of Failure Criticality Analysis
S O D RPN
BO
ILER W
ATER A
ND
STEA
M
&
BO
ILER C
OA
L
Coal spreader
[project coal in the
furnace of the
boiler at an angle]
Blade cylinder
failure
Shutdown Fatigue 6 1 1 6
Rotational
controller failure
Shutdown Component
defective
6 3 1 18
Bearing failure Shutdown Overloading 6 1 3 18
Lubrification failure 6 1 3 18
Transmission belt
failure
Low operation Fatigue and
wearing
3 1 1 3
Drive motor failure Shutdown Bearing failure 6 1 2 12
Fuse fails 6 1 2 12
Contactor fails 6 1 2 12
Relay fails 6 1 2 12
Winding fails 6 1 2 12
Misalignment due
to coupling failure
6 1 3 18
Reinjection of ash Belt failure
Low operation Cracking due to
fatigue
3 1 1 3

151
System Sub-system &
Function
Failure Mode Effect of Failure Cause of Failure Criticality Analysis
S O D RPN
BO
ILER W
ATER A
ND
STEAM
&
BO
ILER C
OAL
Reinjection of ash
[Reinsert ash and
unburned coal to
the boiler]
Bearing failure Shutdown Overloading 6 1 3 18
Lubrification failure 6 1 3 18
Pulley failure Low operation Wearing 4 1 2 8
Fatigue 4 1 2 8
Drive motor failure Shutdown Bearing failure 6 1 2 12
Fuse fails 6 1 2 12
Contactor fails 6 1 2 12
Relay fails 6 1 2 12
Winding fails 6 1 2 12
Misalignment due
to coupling failure
6 1 3 18
Fan failure Shutdown Bearing failure 6 1 4 16
Blade failure 6 1 2 12
Misalignment 6 1 2 12
Shaft failure 6 1 3 18
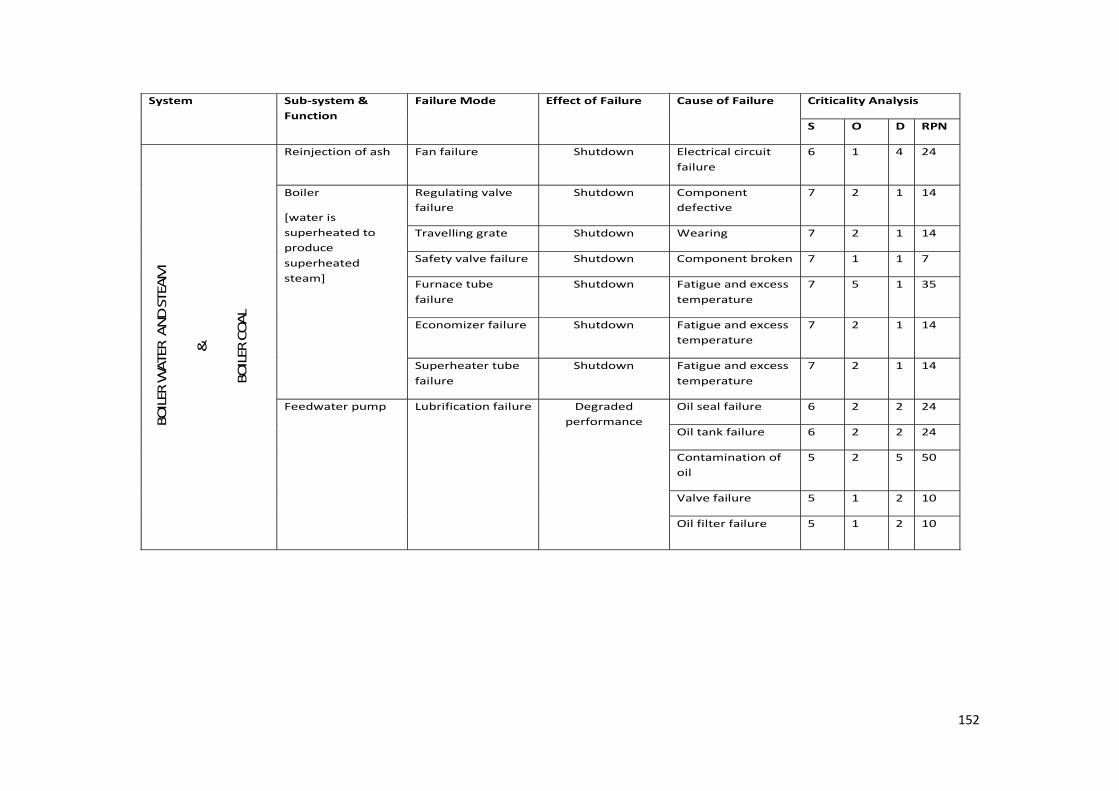
152
System Sub-system &
Function
Failure Mode Effect of Failure Cause of Failure Criticality Analysis
S O D RPN
BO
ILER W
ATER AN
D S
TEAM
&
BO
ILER C
OAL
Reinjection of ash Fan failure Shutdown Electrical circuit
failure
6 1 4 24
Boiler
[water is
superheated to
produce
superheated
steam]
Regulating valve
failure
Shutdown Component
defective
7 2 1 14
Travelling grate Shutdown Wearing 7 2 1 14
Safety valve failure Shutdown Component broken 7 1 1 7
Furnace tube
failure
Shutdown Fatigue and excess
temperature
7 5 1 35
Economizer failure Shutdown Fatigue and excess
temperature
7 2 1 14
Superheater tube
failure
Shutdown Fatigue and excess
temperature
7 2 1 14
Feedwater pump
Lubrification failure Degraded
performance
Oil seal failure 6 2 2 24
Oil tank failure 6 2 2 24
Contamination of
oil
5 2 5 50
Valve failure 5 1 2 10
Oil filter failure 5 1 2 10
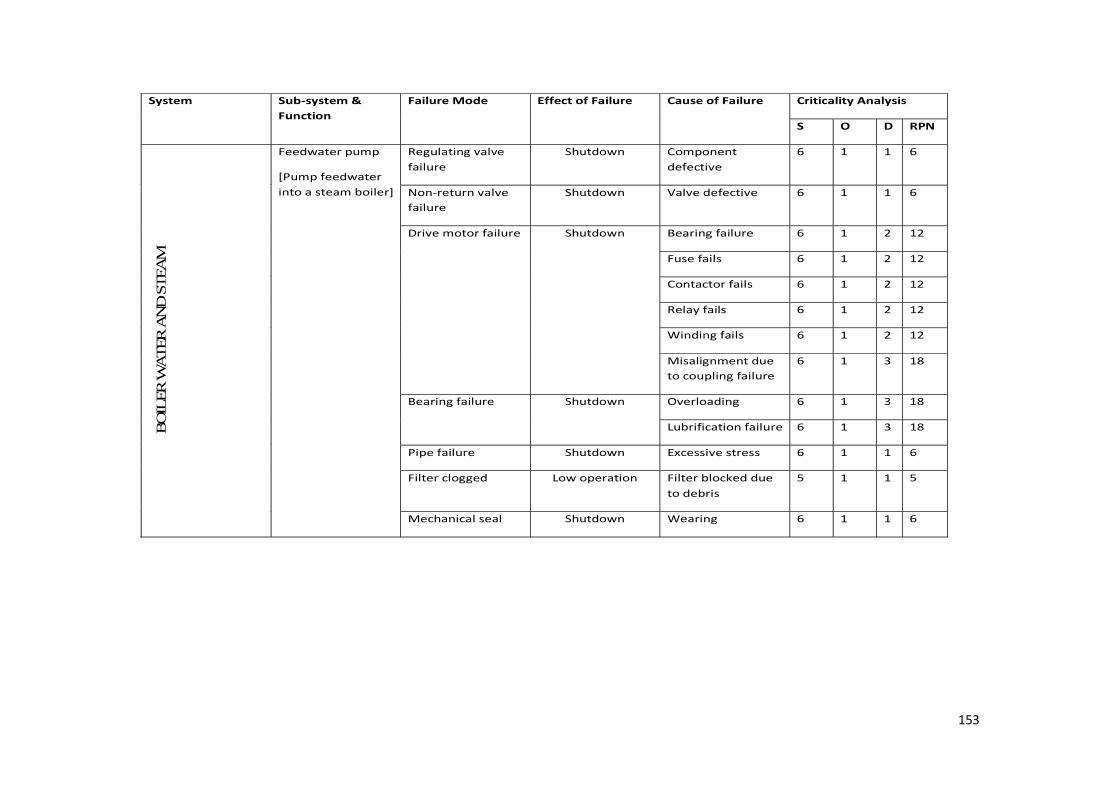
153
System Sub-system &
Function
Failure Mode Effect of Failure Cause of Failure Criticality Analysis
S O D RPN
BO
ILER
WA
TER
AN
D S
TEA
M
Feedwater pump
[Pump feedwater
into a steam boiler]
Regulating valve
failure
Shutdown Component
defective
6 1 1 6
Non-return valve
failure
Shutdown Valve defective 6 1 1 6
Drive motor failure Shutdown Bearing failure 6 1 2 12
Fuse fails 6 1 2 12
Contactor fails 6 1 2 12
Relay fails 6 1 2 12
Winding fails 6 1 2 12
Misalignment due
to coupling failure
6 1 3 18
Bearing failure Shutdown Overloading 6 1 3 18
Lubrification failure 6 1 3 18
Pipe failure Shutdown Excessive stress 6 1 1 6
Filter clogged Low operation Filter blocked due
to debris
5 1 1 5
Mechanical seal Shutdown Wearing 6 1 1 6
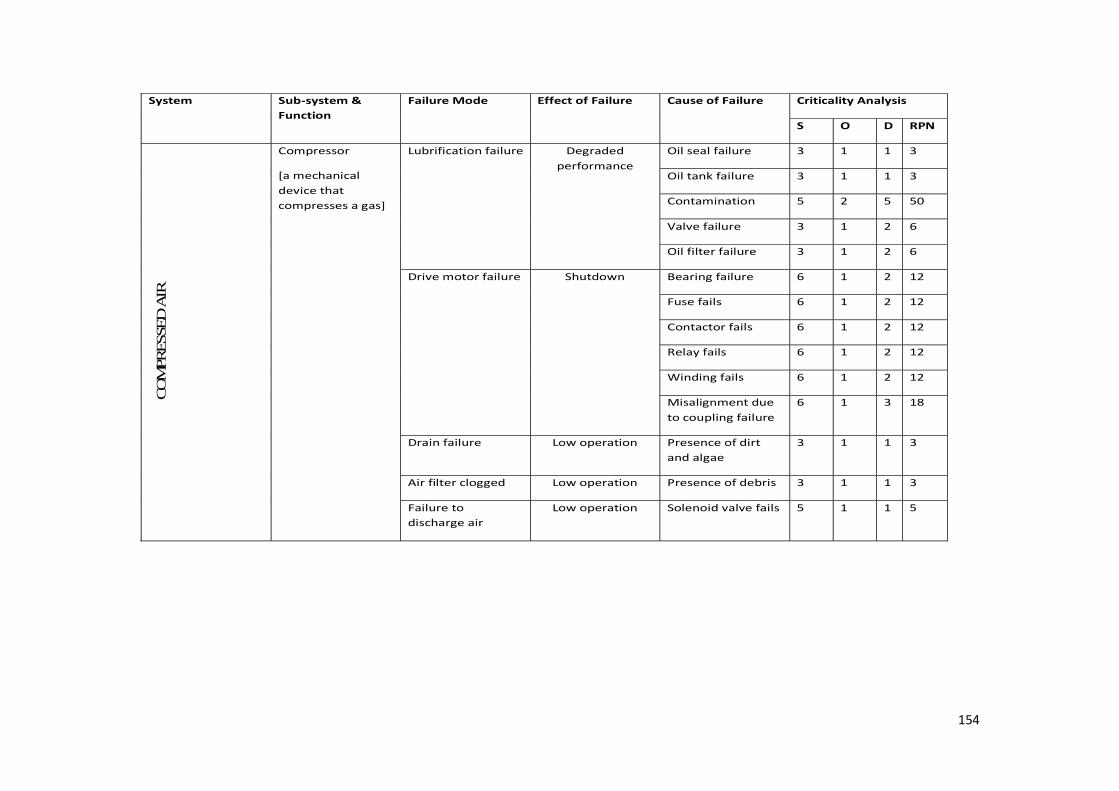
154
System Sub-system &
Function
Failure Mode Effect of Failure Cause of Failure Criticality Analysis
S O D RPN
CO
MPR
ESSE
D A
IR
Compressor
[a mechanical
device that
compresses a gas]
Lubrification failure Degraded
performance
Oil seal failure 3 1 1 3
Oil tank failure 3 1 1 3
Contamination 5 2 5 50
Valve failure 3 1 2 6
Oil filter failure 3 1 2 6
Drive motor failure Shutdown Bearing failure 6 1 2 12
Fuse fails 6 1 2 12
Contactor fails 6 1 2 12
Relay fails 6 1 2 12
Winding fails 6 1 2 12
Misalignment due
to coupling failure
6 1 3 18
Drain failure Low operation Presence of dirt
and algae
3 1 1 3
Air filter clogged Low operation Presence of debris 3 1 1 3
Failure to
discharge air
Low operation Solenoid valve fails 5 1 1 5
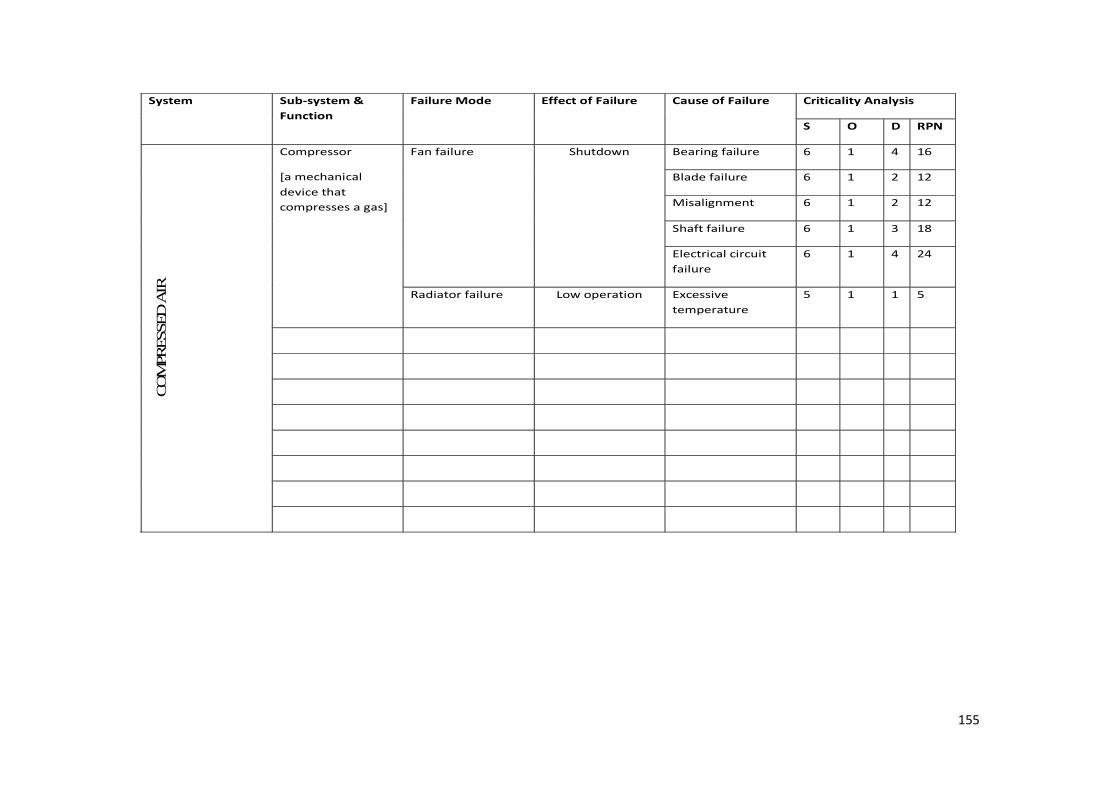
155
System Sub-system &
Function
Failure Mode Effect of Failure Cause of Failure Criticality Analysis
S O D RPN
CO
MPR
ESSED
AIR
Compressor
[a mechanical
device that
compresses a gas]
Fan failure Shutdown Bearing failure 6 1 4 16
Blade failure 6 1 2 12
Misalignment 6 1 2 12
Shaft failure 6 1 3 18
Electrical circuit
failure
6 1 4 24
Radiator failure Low operation Excessive
temperature
5 1 1 5

156
System Sub-system &
Function
Failure Mode Effect of Failure Cause of Failure Criticality Analysis
S O D RPN
RA
W W
ATER P
LA
NT
Clarifier
[Proper filtering of
water]
Rotating scraper
failure
Shutdown Fatigue 6 1 1 6
Drive motor failure Shutdown Bearing failure 6 1 2 12
Fuse fails 6 1 2 12
Contactor fails 6 1 2 12
Relay fails 6 1 2 12
Winding fails 6 1 2 12
Misalignment due
to coupling failure
6 1 3 18
Gear box failure Shutdown Seals fail 5 1 2 10
Wearing of gear 5 1 2 10
Gear clogged 5 1 2 10
Lubrification failure 5 1 2 10
Bearing failure 5 1 2 10
Tank failure Shutdown Tank clogged due
to debris
6 1` 1 6
Pump Valve failure Low operation Component fails 4 1 1 4
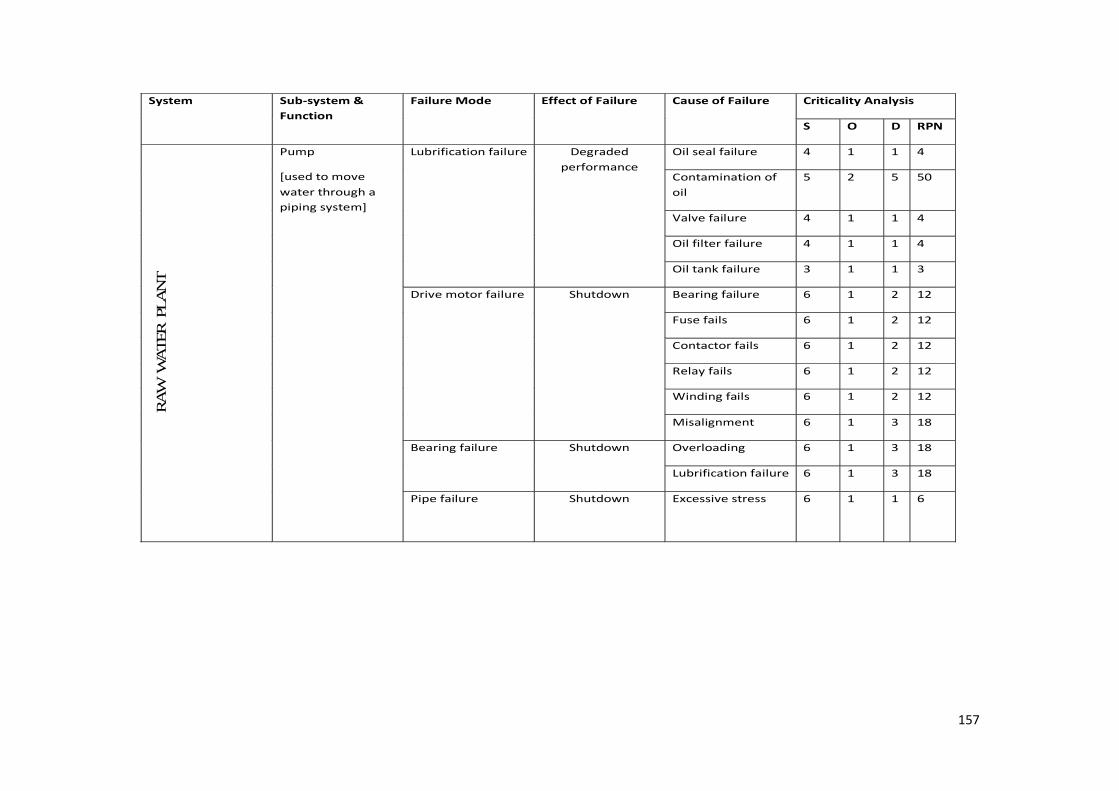
157
System Sub-system &
Function
Failure Mode Effect of Failure Cause of Failure Criticality Analysis
S O D RPN
RA
W W
ATER P
LA
NT
Pump
[used to move
water through a
piping system]
Lubrification failure Degraded
performance
Oil seal failure 4 1 1 4
Contamination of
oil
5 2 5 50
Valve failure 4 1 1 4
Oil filter failure 4 1 1 4
Oil tank failure 3 1 1 3
Drive motor failure Shutdown Bearing failure 6 1 2 12
Fuse fails 6 1 2 12
Contactor fails 6 1 2 12
Relay fails 6 1 2 12
Winding fails 6 1 2 12
Misalignment 6 1 3 18
Bearing failure Shutdown Overloading 6 1 3 18
Lubrification failure 6 1 3 18
Pipe failure
Shutdown Excessive stress 6 1 1 6
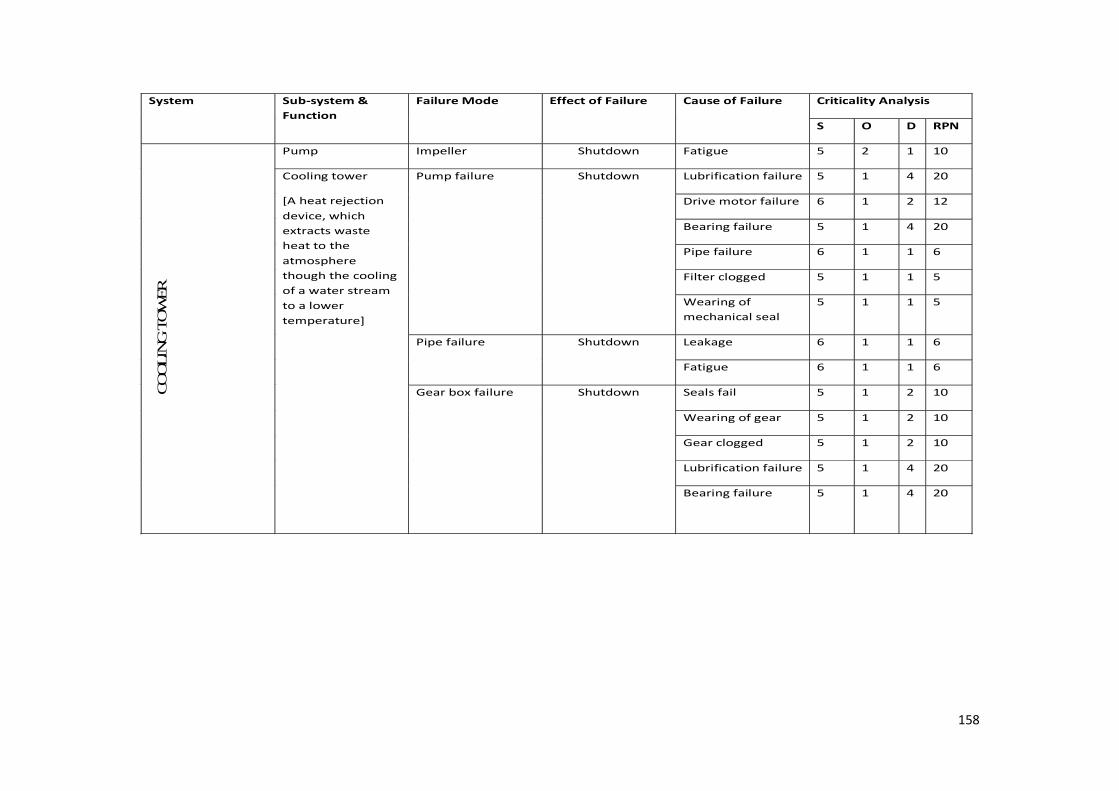
158
System Sub-system &
Function
Failure Mode Effect of Failure Cause of Failure Criticality Analysis
S O D RPN
CO
OLIN
G T
OW
ER
Pump Impeller Shutdown Fatigue 5 2 1 10
Cooling tower
[A heat rejection
device, which
extracts waste
heat to the
atmosphere
though the cooling
of a water stream
to a lower
temperature]
Pump failure Shutdown Lubrification failure 5 1 4 20
Drive motor failure 6 1 2 12
Bearing failure 5 1 4 20
Pipe failure 6 1 1 6
Filter clogged 5 1 1 5
Wearing of
mechanical seal
5 1 1 5
Pipe failure Shutdown Leakage 6 1 1 6
Fatigue 6 1 1 6
Gear box failure
Shutdown Seals fail 5 1 2 10
Wearing of gear 5 1 2 10
Gear clogged 5 1 2 10
Lubrification failure 5 1 4 20
Bearing failure 5 1 4 20

159
System Sub-system &
Function
Failure Mode Effect of Failure Cause of Failure Criticality Analysis
S O D RPN
CO
OLIN
G T
OW
ER
Cooling tower
[A heat rejection
device, which
extracts waste
heat to the
atmosphere
though the cooling
of a water stream
to a lower
temperature]
Drive motor failure Shutdown Bearing failure 6 1 2 12
Fuse fails 6 1 2 12
Contactor fails 6 1 2 12
Relay fails 6 1 2 12
Winding fails 6 1 2 12
Misalignment due
to coupling failure
6 1 3 18
Fan failure Shutdown Bearing failure 6 1 4 16
Blade failure 6 1 2 12
Misalignment 6 1 2 12
Electrical circuit 6 1 3 18
Gear Box 6 1 4 24
Sand filter
[For water
purification]
Pressure vessel
failure
Shutdown Corrosion 6 3 1 18
Valve failure Low operation Component
defective
4 3 1 12

160
System Sub-system &
Function
Failure Mode Effect of Failure Cause of Failure Criticality Analysis
S O D RPN
DEM
INERA
LIS
ED
WA
TER P
LA
NT
Pneumatic valve
[converting air
pressure into linear
or rotary motion]
Compressed air
failure
Shutdown Lubrification failure 6 1 2 12
Drain failure 3 1 1 3
Air filter clogged 3 1 1 3
Radiator failure 5 1 1 5
Drive motor failure 6 1 2 12
Actuator Low operation Component
defective
4 2 1 8
Sand filter
[For water
purification]
Pressure vessel
failure
Shutdown Corrosion 6 3 1 18
Valve failure Component
defective
4 3 1 12
Spray nozzle failure Shutdown Low pressure 6 1 1 6
Carbon filter
[Remove
impurities and
contaminants ]
Pressure vessel
failure
Shutdown Corrosion 6 3 1 18
Valve failure Low operation Component
defective
4 3 1 12
Pump
Valve failure Low operation Component fails 4 1 1 4
Impeller Shutdown Fatigue 5 2 1 10

161
System Sub-system &
Function
Failure Mode Effect of Failure Cause of Failure Criticality Analysis
S O D RPN
DEM
INERA
LIS
ED
WA
TER P
LA
NT
Pump
[used to move
water through a
piping system]
Lubrification failure Degraded
performance
Oil seal failure 4 1 1 4
Oil tank failure 3 1 1 3
Contamination 5 2 5 50
Valve failure 4 1 1 4
Oil filter failure 4 1 1 4
Drive motor failure Shutdown Bearing failure 6 1 2 12
Fuse fails 6 1 2 12
Contactor fails 6 1 2 12
Relay fails 6 1 2 12
Winding fails 6 1 2 12
Misalignment due
to coupling failure
6 1 3 18
Bearing failure Shutdown Overloading 6 1 3 18
Lubrification failure 6 1 3 18
Pipe failure Shutdown Excessive stress 6 1 1 6
Filter clogged Low operation Due to debris 4 1 1 4
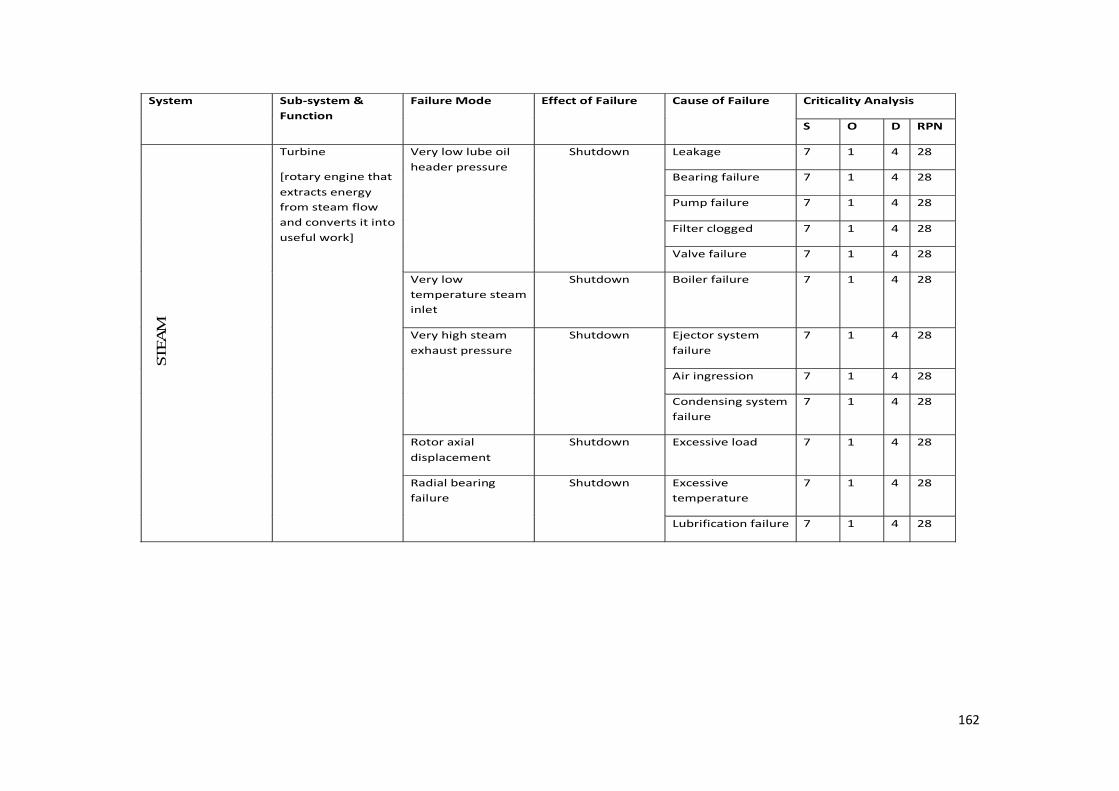
162
System Sub-system &
Function
Failure Mode Effect of Failure Cause of Failure Criticality Analysis
S O D RPN
STEA
M
Turbine
[rotary engine that
extracts energy
from steam flow
and converts it into
useful work]
Very low lube oil
header pressure
Shutdown Leakage 7 1 4 28
Bearing failure 7 1 4 28
Pump failure 7 1 4 28
Filter clogged 7 1 4 28
Valve failure 7 1 4 28
Very low
temperature steam
inlet
Shutdown Boiler failure 7 1 4 28
Very high steam
exhaust pressure
Shutdown Ejector system
failure
7 1 4 28
Air ingression 7 1 4 28
Condensing system
failure
7 1 4 28
Rotor axial
displacement
Shutdown Excessive load 7 1 4 28
Radial bearing
failure
Shutdown Excessive
temperature
7 1 4 28
Lubrification failure 7 1 4 28

163
System Sub-system &
Function
Failure Mode Effect of Failure Cause of Failure Criticality Analysis
S O D RPN
STEA
M
Turbine
[rotary engine that
extracts energy
from steam flow
and converts it into
useful work]
Journal bearing
failure
Shutdown High pressure 7 1 4 28
Fault with gland
condenser
7 1 4 28
Vacuum failure 7 1 4 28
Excessive
temperature
7 1 4 28
Thrust bearing
failure
Shutdown Overloading 7 1 4 28
Excessive
temperature
7 1 4 28
Coupling defect 7 1 4 28
Reducer
[ Decrease the rpm
of the rotor to
1500]
Gear bearing Shutdown Teeth failure 7 1 4 28
Bearing failure 7 1 4 28
Excessive vibration 7 1 4 28
Shaft failure 7 1 4 28
Radial bearing
Shutdown Lubrification failure 7 1 4 28

164
System Sub-system &
Function
Failure Mode Effect of Failure Cause of Failure Criticality Analysis
S O D RPN
STEA
M
Reducer
[ Decrease the rpm
of the rotor to
1500]
Radial bearing
Shutdown Excessive
temperature
7 1 4 28
Trust bearing Shutdown Coupling defect 7 1 4 28
Overloading 7 1 4 28
Excessive
temperature
7 1 4 28
Alternator
[converts
mechanical energy
to electrical energy
in the form of
alternating
current]
Cooling air
outlet(cold)
Shutdown Air inlet too cold 7 1 4 28
Cooler clogged 7 1 4 28
Fan failure 7 1 4 28
Generator bearing Shutdown Excessive
temperature
7 1 4 28
Misalignment 7 1 4 28
Bearing damaged 7 1 4 28
Overloading 7 1 4 28
Excessive vibration 7 1 4 28
Rotor damaged 7 1 4 28

165
System Sub-system &
Function
Failure Mode Effect of Failure Cause of Failure Criticality Analysis
S O D RPN
STEA
M
Alternator
[[converts
mechanical energy
to electrical energy
in the form of
alternating
current]
Generator winding Shutdown Excessive electric
load
7 1 4 28
Air cooler fault 7 1 4 28
Excessive
temperature
7 1 4 28
Cooling air
outlet(hot)
Shutdown Air inlet too hot 7 1 4 28
Cooler clogged 7 1 4 28
Fan failure 7 1 4 28
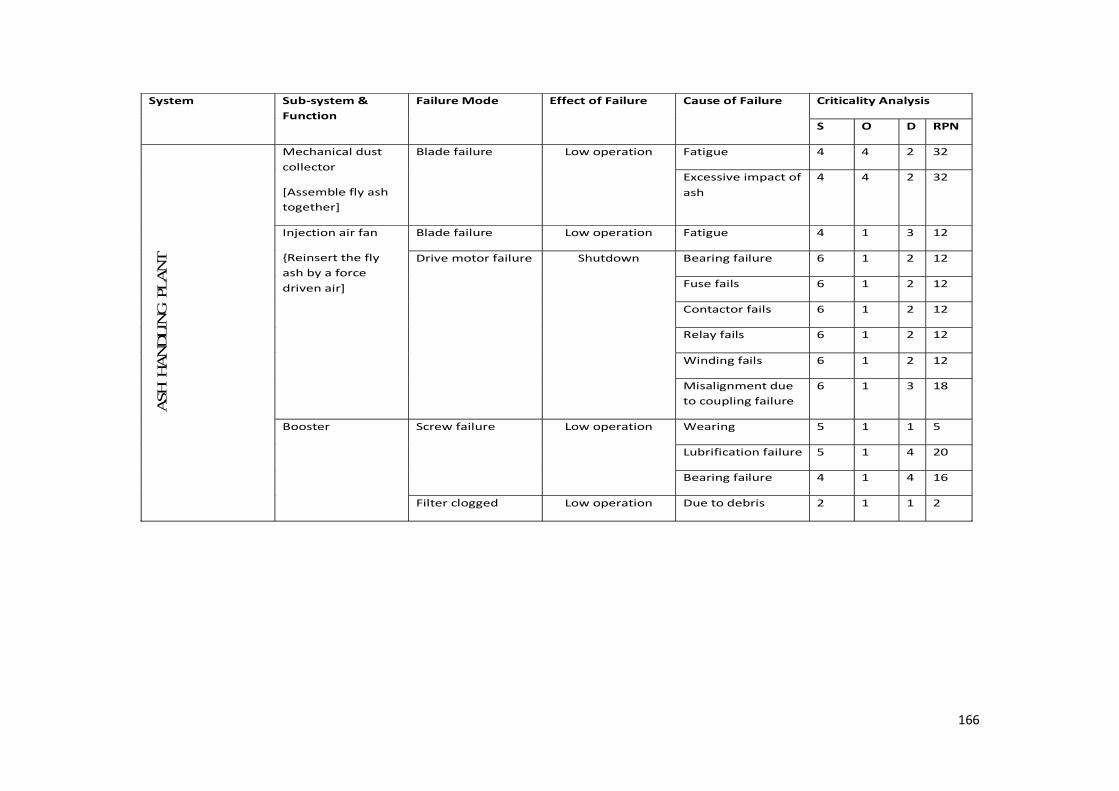
166
System Sub-system &
Function
Failure Mode Effect of Failure Cause of Failure Criticality Analysis
S O D RPN
ASH
HA
ND
LIN
G P
LA
NT
Mechanical dust
collector
[Assemble fly ash
together]
Blade failure Low operation Fatigue 4 4 2 32
Excessive impact of
ash
4 4 2 32
Injection air fan
{Reinsert the fly
ash by a force
driven air]
Blade failure Low operation Fatigue 4 1 3 12
Drive motor failure Shutdown Bearing failure 6 1 2 12
Fuse fails 6 1 2 12
Contactor fails 6 1 2 12
Relay fails 6 1 2 12
Winding fails 6 1 2 12
Misalignment due
to coupling failure
6 1 3 18
Booster Screw failure Low operation Wearing 5 1 1 5
Lubrification failure 5 1 4 20
Bearing failure 4 1 4 16
Filter clogged Low operation Due to debris 2 1 1 2
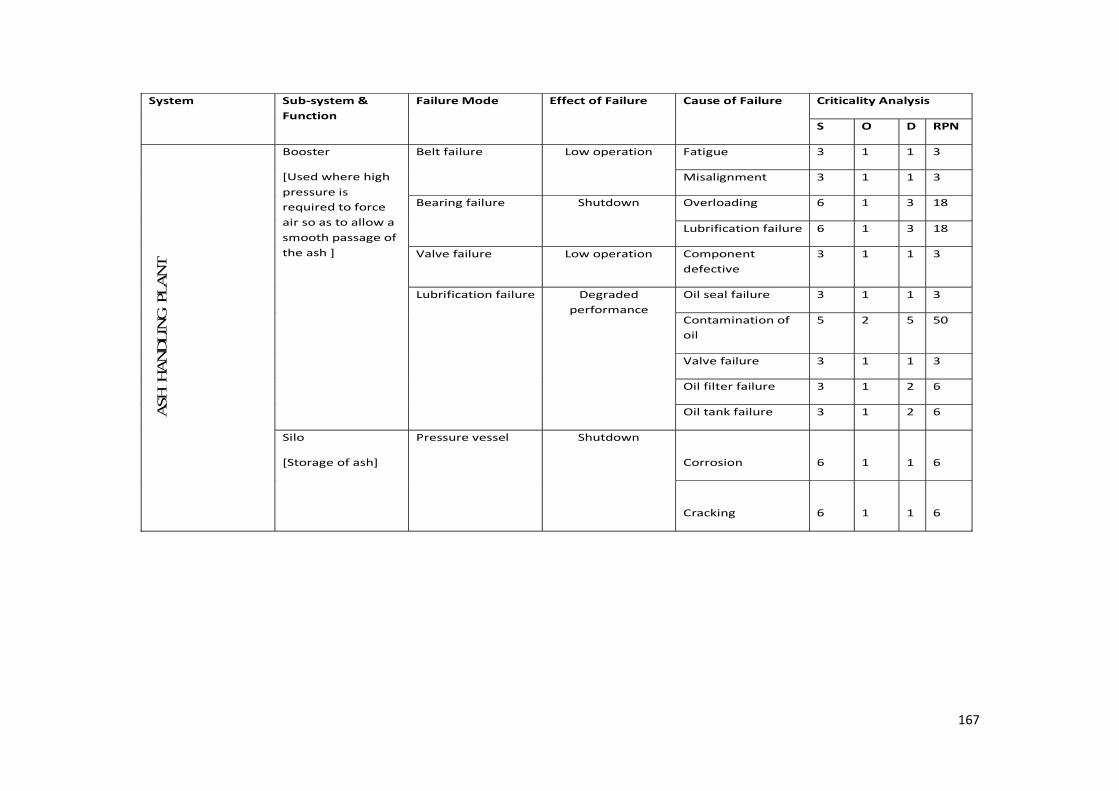
167
System Sub-system &
Function
Failure Mode Effect of Failure Cause of Failure Criticality Analysis
S O D RPN
ASH
HA
ND
LIN
G P
LA
NT
Booster
[Used where high
pressure is
required to force
air so as to allow a
smooth passage of
the ash ]
Belt failure Low operation Fatigue 3 1 1 3
Misalignment 3 1 1 3
Bearing failure Shutdown Overloading 6 1 3 18
Lubrification failure 6 1 3 18
Valve failure Low operation Component
defective
3 1 1 3
Lubrification failure Degraded
performance
Oil seal failure 3 1 1 3
Contamination of
oil
5 2 5 50
Valve failure 3 1 1 3
Oil filter failure 3 1 2 6
Oil tank failure 3 1 2 6
Silo
[Storage of ash]
Pressure vessel Shutdown
Corrosion
6
1
1
6
Cracking
6
1
1
6

168
System Sub-system &
Function
Failure Mode Effect of Failure Cause of Failure Criticality Analysis
S O D RPN
ASH
HA
ND
LIN
G P
LA
NT
Silo
[Storage of ash]
Filter clogged Low operation Due to debris 5 1 1 5
Pipe failure Shutdown Excessive stress 6 1 1 6
Compressed air
failure
Shutdown Lubrification failure 6 1 1 6
Drive motor failure 6 1 2 12
Drain failure 5 1 1 5
Air filter clogged 5 1 1 5
Failure to
discharge air
5 1 1 5
Fan failure Shutdown Bearing failure 6 1 4 16
Blade failure 6 1 2 12
Misalignment 6 1 2 12
Shaft failure 6 1 3 18
Electrical circuit
failure
6 1 4 24

169
System Sub-system &
Function
Failure Mode Effect of Failure Cause of Failure Criticality Analysis
S O D RPN
ASH
HA
ND
LIN
G P
LA
NT
Electrostatic
precipitator
[uses electrical
force to remove
dirt from flue
gases]
Transformer failure Shutdown Dielectric oil failure 6 1 5 30
Loose connection 5 1 2 10
Electrical
components fail
6 1 4 24
Pipe failure Shutdown Excessive stress 5 2 1 10
Plate failure Shutdown Misalignment 6 1 1 6
Hammer failure Shutdown Breaking 6 1 2 12
Bolt failure Shutdown Excessive vibration 6 2 3 36
Isolator failure Shutdown Cracking 6 2 1 12
Clogging failure Shutdown Due to dirt 6 2 1 12
Gear box failure Shutdown Bearing failure 5 1 4 20
Wearing of gear 5 1 2 10
Gear clogged 5 1 2 10
Seals fail 5 1 2 10
Lubrification failure 5 1 4 20

170
APPENDIX 3 – Suggested Maintenance Strategies
Table A.3: Suggested Maintenance Strategies
Sub-system
Failure mode
Cause of
failure
Actual
Maintenance
Strategies
Suggested
Maintenance
Strategies
RPN
Vibrating
table
Drive motor
failure
Relay fails Breakdown Preventive 12
Winding fails Breakdown Preventive 12
Misalignment
due to
coupling
Preventive Preventive 18
Limit switch failure
Sensor
actuation fails
Breakdown Breakdown 3
Spring failure Failure of
spring due to
excessive
stress
Breakdown Breakdown 3
Screener
Drive motor
failure
Bearing failure Preventive Preventive 12
Fuse fails Breakdown Preventive 12
Contactor fails Breakdown Preventive 12
Relay fails Breakdown Preventive 12
Winding fails Breakdown Preventive 12
Misalignment
due to
coupling
Preventive Preventive 18
Bearing
failure
Overloading Predictive Predictive 18
Lubrification
failure
Predictive Predictive
18

171
Sub-system
Failure mode
Cause of
failure
Actual
Maintenance
Strategies
Suggested
Maintenance
Strategies
RPN
Screener
Shock
absorber fails
Component
fails due to
excessive
stress
Preventive Preventive 10
Bolt failure Bolts broken Preventive Preventive 30
Loosening of
bolts due to
excessive
vibration
Preventive Preventive 30
Screen failure Misalignment Preventive Preventive 15
Conveyor
Sensor failure Jam sensor
fails
Breakdown Preventive 30
Rotational
sensor
Breakdown Breakdown
3
Bearing
failure
Overloading Predictive Predictive 18
Lubrification
failure
Predictive Predictive 18
Drive motor
failure
Bearing failure Preventive Preventive 12
Fuse fails Breakdown Preventive 12
Contactor fails Breakdown Preventive 12
Relay fails Breakdown Preventive 12
Winding fails Breakdown Preventive 12
Misalignment Preventive Preventive 18
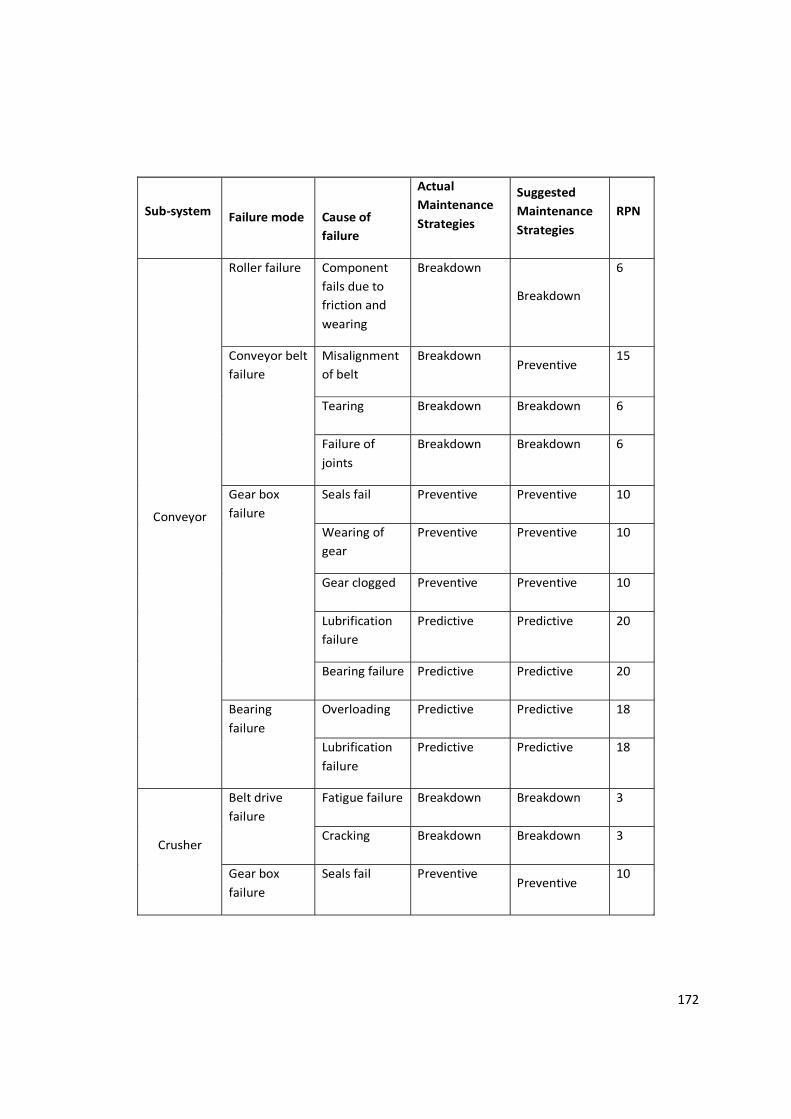
172
Sub-system
Failure mode
Cause of
failure
Actual
Maintenance
Strategies
Suggested
Maintenance
Strategies
RPN
Conveyor
Roller failure Component
fails due to
friction and
wearing
Breakdown
Breakdown
6
Conveyor belt
failure
Misalignment
of belt
Breakdown Preventive
15
Tearing Breakdown Breakdown 6
Failure of
joints
Breakdown Breakdown 6
Gear box
failure
Seals fail Preventive Preventive 10
Wearing of
gear
Preventive Preventive 10
Gear clogged Preventive Preventive 10
Lubrification
failure
Predictive Predictive 20
Bearing failure Predictive Predictive 20
Bearing
failure
Overloading Predictive Predictive 18
Lubrification
failure
Predictive Predictive 18
Crusher
Belt drive
failure
Fatigue failure Breakdown Breakdown 3
Cracking Breakdown Breakdown 3
Gear box
failure
Seals fail Preventive Preventive
10
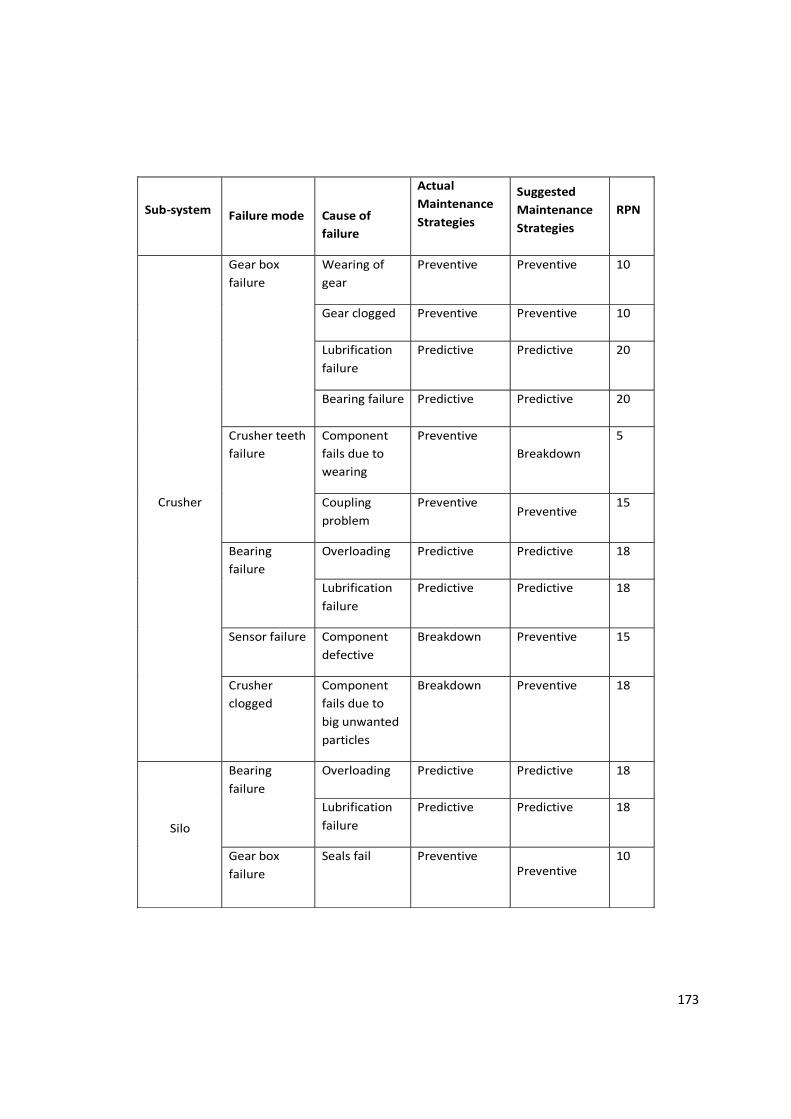
173
Sub-system
Failure mode
Cause of
failure
Actual
Maintenance
Strategies
Suggested
Maintenance
Strategies
RPN
Crusher
Gear box
failure
Wearing of
gear
Preventive Preventive 10
Gear clogged Preventive Preventive 10
Lubrification
failure
Predictive Predictive 20
Bearing failure Predictive Predictive 20
Crusher teeth
failure
Component
fails due to
wearing
Preventive
Breakdown
5
Coupling
problem
Preventive Preventive
15
Bearing
failure
Overloading Predictive Predictive 18
Lubrification
failure
Predictive Predictive 18
Sensor failure Component
defective
Breakdown Preventive 15
Crusher
clogged
Component
fails due to
big unwanted
particles
Breakdown Preventive 18
Silo
Bearing
failure
Overloading Predictive Predictive 18
Lubrification
failure
Predictive Predictive 18
Gear box
failure
Seals fail
Preventive
Preventive
10

174
Sub-system
Failure mode
Cause of
failure
Actual
Maintenance
Strategies
Suggested
Maintenance
Strategies
RPN
Silo
Gear box
failure
Wearing of
gear
Preventive Preventive 10
Gear clogged Preventive Preventive 10
Lubrification
failure
Predictive Predictive 20
Bearing failure Predictive Predictive 20
Drive motor
failure
Bearing failure Preventive Preventive 12
Fuse fails Breakdown Preventive 12
Contactor fails Breakdown Preventive 12
Relay fails Breakdown Preventive 12
Winding fails Breakdown Preventive 12
Misalignment
due to
coupling
Preventive Preventive 18
Extracting
screw failure
Wearing
problem
Preventive Breakdown
6
Coupling
problem due
to
misalignment
Preventive
Preventive
12
Fatigue Preventive Breakdown 6
Bearing failure Predictive Predictive 24
Sensor failure Defective Breakdown Preventive 15

175
Sub-system
Failure mode
Cause of
failure
Actual
Maintenance
Strategies
Suggested
Maintenance
Strategies
RPN
Shuttle
Conveyor
failure
Sensor failure Breakdown Preventive 30
Belt failure Breakdown Breakdown 6
Bearing failure Predictive Predictive 16
Roller failure Breakdown Breakdown 8
Gear box
failure
Predictive Predictive
16
Drive motor
failure
Preventive Preventive 10
Gear box
failure
Seals fail Preventive Preventive 10
Wearing of
gear
Preventive Preventive 10
Gear clogged Preventive Preventive 10
Lubrification
failure
Predictive Predictive 20
Bearing failure Predictive Predictive 20
Roller failure Wearing of
component
Breakdown Preventive 30
Sensor failure Defective
component
Breakdown Preventive 12
Drive motor
failure
Bearing failure Preventive Preventive 12
Fuse fails Breakdown Preventive 12
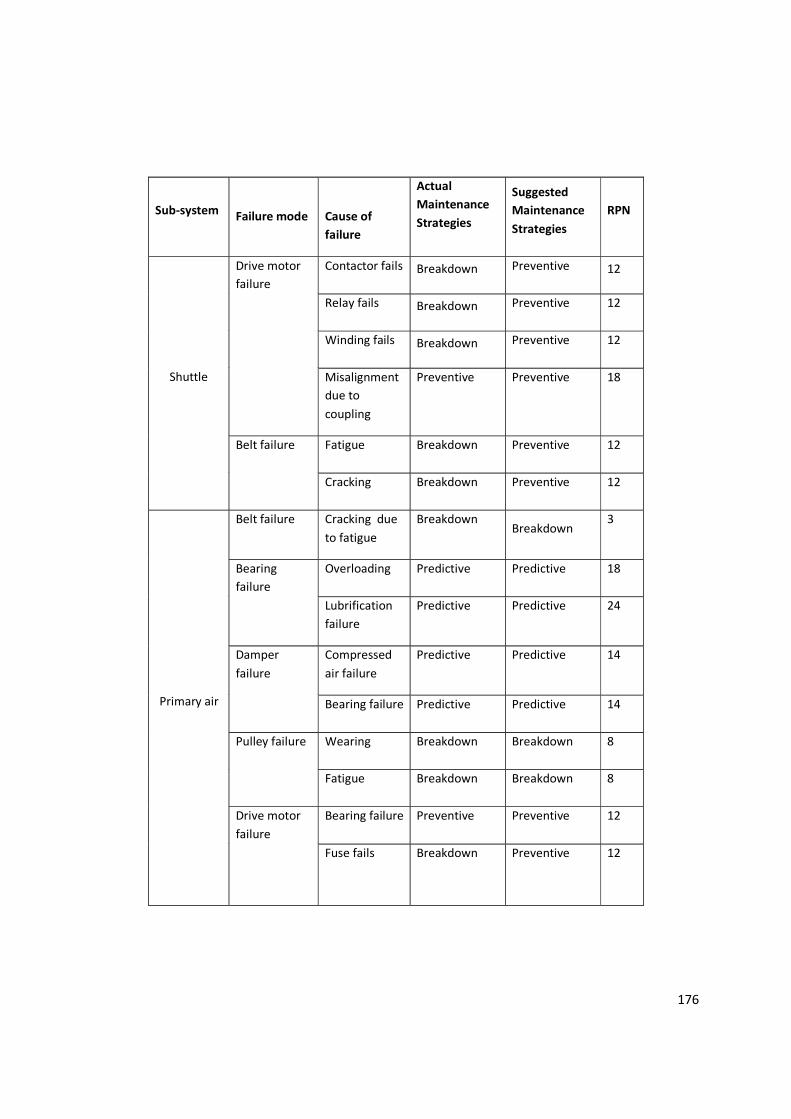
176
Sub-system
Failure mode
Cause of
failure
Actual
Maintenance
Strategies
Suggested
Maintenance
Strategies
RPN
Shuttle
Drive motor
failure
Contactor fails Breakdown Preventive 12
Relay fails Breakdown Preventive 12
Winding fails Breakdown Preventive 12
Misalignment
due to
coupling
Preventive Preventive 18
Belt failure Fatigue Breakdown Preventive 12
Cracking Breakdown Preventive 12
Primary air
Belt failure Cracking due
to fatigue
Breakdown Breakdown
3
Bearing
failure
Overloading Predictive Predictive 18
Lubrification
failure
Predictive Predictive 24
Damper
failure
Compressed
air failure
Predictive Predictive 14
Bearing failure Predictive Predictive 14
Pulley failure Wearing Breakdown Breakdown 8
Fatigue Breakdown Breakdown 8
Drive motor
failure
Bearing failure Preventive Preventive 12
Fuse fails
Breakdown Preventive 12

177
Sub-system
Failure mode
Cause of
failure
Actual
Maintenance
Strategies
Suggested
Maintenance
Strategies
RPN
Primary air
Drive motor
failure
Contactor fails Breakdown Preventive 12
Relay fails Breakdown Preventive 12
Winding fails Breakdown Preventive 12
Misalignment
due to
coupling
failure
Preventive Preventive 18
Fan failure Bearing failure Predictive Predictive 16
Blade failure Preventive Preventive 12
Misalignment Preventive Preventive 12
Shaft failure Preventive Preventive 18
Electrical
component
Preventive Preventive 24
Secondary
Air
Bearing
failure
Overloading Predictive Predictive 18
Lubrification
failure
Predictive Predictive 24
Pulley failure Wearing Breakdown Breakdown 8
Fatigue Breakdown Breakdown 8
Damper
failure
Compressed
air failure
Predictive Predictive 14
Bearing failure
Predictive Predictive 14

178
Sub-system
Failure mode
Cause of
failure
Actual
Maintenance
Strategies
Suggested
Maintenance
Strategies
RPN
Secondary
Air
Drive motor
failure
Bearing failure Preventive Preventive 12
Fuse fails Breakdown Preventive 12
Contactor fails Breakdown Preventive 12
Relay fails Breakdown Preventive 12
Winding fails Breakdown Preventive 12
Misalignment
due to
coupling
failure
Preventive Preventive 18
Fan failure Bearing failure Predictive Predictive 16
Blade failure Preventive Preventive 12
Misalignment Preventive Preventive 12
Shaft failure Preventive Preventive 18
Electrical
component
Preventive Preventive 24
Induced
Draught (ID)
fan
Bearing
failure
Overloading Predictive Predictive 18
Lubrification
failure
Predictive Predictive 18
Damper
failure
Compressed
air failure
Preventive Preventive
14
Bearing failure
Predictive
Predictive
14
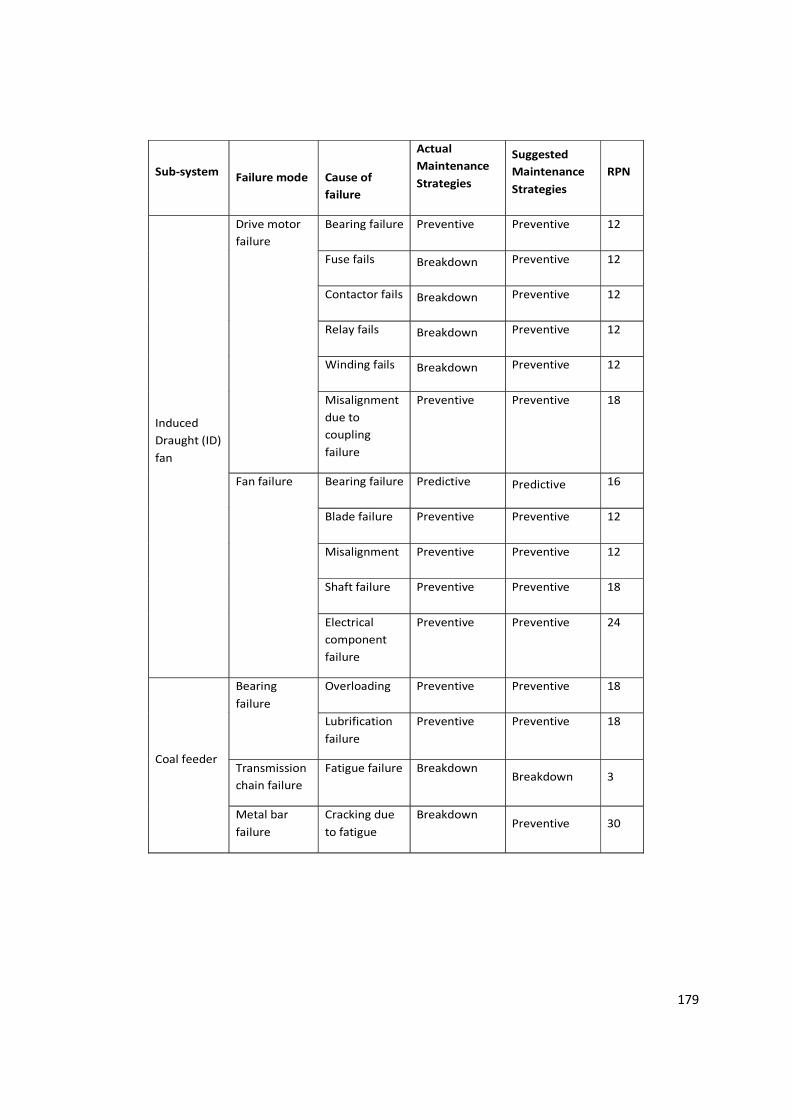
179
Sub-system
Failure mode
Cause of
failure
Actual
Maintenance
Strategies
Suggested
Maintenance
Strategies
RPN
Induced
Draught (ID)
fan
Drive motor
failure
Bearing failure Preventive Preventive 12
Fuse fails Breakdown Preventive 12
Contactor fails Breakdown Preventive 12
Relay fails Breakdown Preventive 12
Winding fails Breakdown Preventive 12
Misalignment
due to
coupling
failure
Preventive Preventive 18
Fan failure Bearing failure Predictive Predictive 16
Blade failure Preventive Preventive 12
Misalignment Preventive Preventive 12
Shaft failure Preventive Preventive 18
Electrical
component
failure
Preventive Preventive 24
Coal feeder
Bearing
failure
Overloading Preventive Preventive 18
Lubrification
failure
Preventive Preventive 18
Transmission
chain failure
Fatigue failure Breakdown Breakdown 3
Metal bar
failure
Cracking due
to fatigue
Breakdown Preventive 30

180
Sub-system
Failure mode
Cause of
failure
Actual
Maintenance
Strategies
Suggested
Maintenance
Strategies
RPN
Coal feeder
Drive motor
failure
Bearing failure Preventive Preventive 12
Fuse fails Breakdown Preventive 12
Contactor fails Breakdown Preventive 12
Relay fails Breakdown Preventive 12
Winding fails Breakdown Preventive 12
Misalignment
due to
coupling
failure
Preventive Preventive 18
Projection
plate
Wearing and
cracking
Breakdown Breakdown 5
Gear box
failure
Seals fail Preventive Preventive 10
Wearing of
gear
Preventive Preventive 10
Gear clogged Preventive Preventive 10
Lubrification
failure
Preventive Preventive 10
Bearing failure Preventive Preventive 10
Metal chain
failure
Fatigue failure Breakdown Preventive 18
Coal
spreader
Blade cylinder
failure
Fatigue Breakdown Breakdown 6
Transmission
belt failure
Fatigue and
wearing
Breakdown Breakdown 3

181
Sub-system
Failure mode
Cause of
failure
Actual
Maintenance
Strategies
Suggested
Maintenance
Strategies
RPN
Coal
spreader
Drive motor
failure
Bearing failure Preventive Preventive 12
Fuse fails Breakdown Preventive 12
Contactor fails Breakdown Preventive 12
Relay fails Breakdown Preventive 12
Winding fails Breakdown Preventive 12
Misalignment
due to
coupling
failure
Preventive Preventive 18
Bearing
failure
Overloading Preventive Preventive 18
Lubrification
failure
Preventive Preventive 18
Rotational
controller
failure
Component
defective
Breakdown Preventive
18
Reinjection
of ash
Belt failure
Cracking due
to fatigue
Breakdown
Breakdown 3
Bearing
failure
Overloading Predictive Predictive 18
Lubrification
failure
Predictive Predictive 18
Pulley failure Wearing Breakdown Breakdown 8
Fatigue
Breakdown Breakdown
8
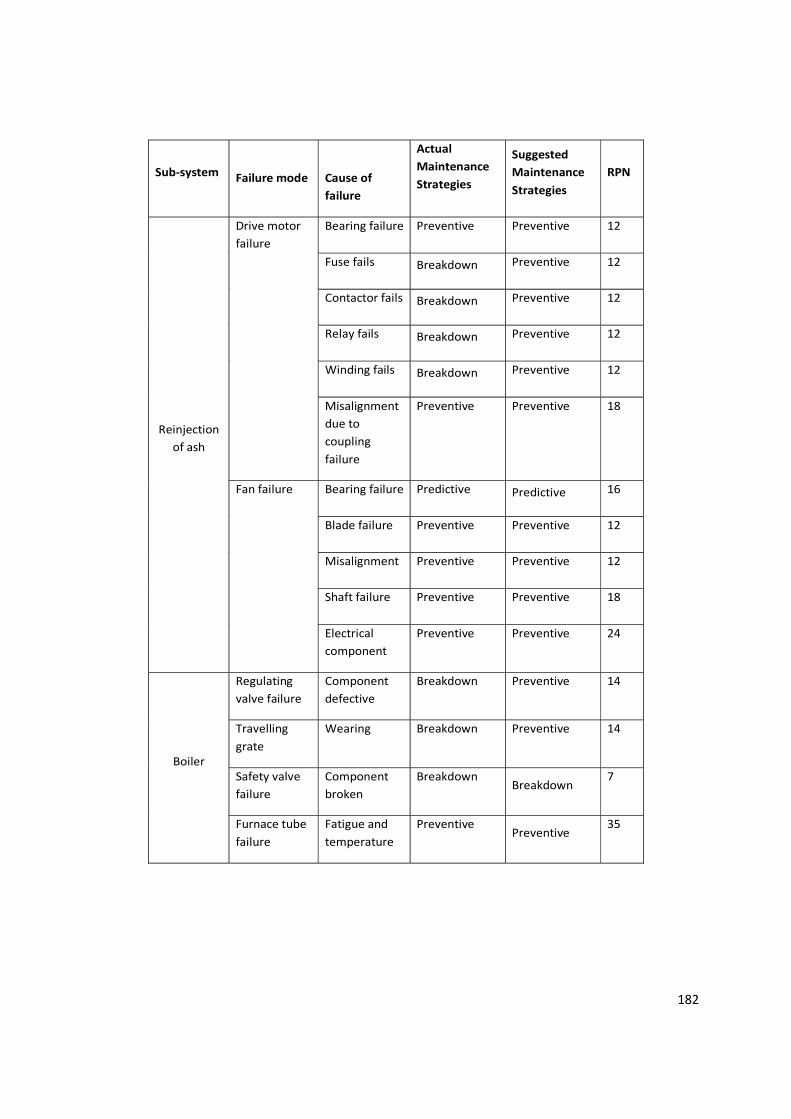
182
Sub-system
Failure mode
Cause of
failure
Actual
Maintenance
Strategies
Suggested
Maintenance
Strategies
RPN
Reinjection
of ash
Drive motor
failure
Bearing failure Preventive Preventive 12
Fuse fails Breakdown Preventive 12
Contactor fails Breakdown Preventive 12
Relay fails Breakdown Preventive 12
Winding fails Breakdown Preventive 12
Misalignment
due to
coupling
failure
Preventive Preventive 18
Fan failure Bearing failure Predictive Predictive 16
Blade failure Preventive Preventive 12
Misalignment Preventive Preventive 12
Shaft failure Preventive Preventive 18
Electrical
component
Preventive Preventive 24
Boiler
Regulating
valve failure
Component
defective
Breakdown Preventive 14
Travelling
grate
Wearing Breakdown Preventive 14
Safety valve
failure
Component
broken
Breakdown Breakdown
7
Furnace tube
failure
Fatigue and
temperature
Preventive Preventive
35

183
Sub-system
Failure mode
Cause of
failure
Actual
Maintenance
Strategies
Suggested
Maintenance
Strategies
RPN
Boiler
Economizer
failure
Fatigue and
excess
temperature
Breakdown Preventive 14
Superheated
tube failure
Fatigue and
excess
temperature
Breakdown Preventive 14
Feed water
pump
Lubrification
failure
Oil seal failure Breakdown Preventive 24
Oil tank fails Breakdown Preventive 24
Contamination Predictive Predictive 50
Valve failure Breakdown Preventive 10
Oil filter
failure
Breakdown Preventive 10
Regulating
valve failure
Component
defective
Breakdown Breakdown 6
Non-return
valve failure
Valve
defective
Breakdown Breakdown 6
Drive motor
failure
Bearing failure Preventive Preventive 12
Fuse fails Breakdown Preventive 12
Contactor fails Breakdown Preventive 12
Relay fails Breakdown Preventive 12
Winding fails Breakdown Preventive 12
Misalignment
due to
coupling
Preventive Preventive 18

184
Sub-system
Failure mode
Cause of
failure
Actual
Maintenance
Strategies
Suggested
Maintenance
Strategies
RPN
Feed water
pump
Bearing
failure
Overloading Predictive Predictive 18
Lubrification
failure
Predictive Predictive 18
Fan failure Bearing failure Preventive Preventive 16
Blade failure Preventive Preventive 12
Misalignment Preventive Preventive 12
Shaft failure Preventive Preventive 18
Electrical
component
Preventive Preventive 24
Pipe failure Excessive
stress
Breakdown Breakdown 6
Filter clogged Filter blocked
due to debris
Breakdown Breakdown 5
Mechanical
seal
Wearing Breakdown Breakdown 6
Compressor
Drive motor
failure
Bearing failure Preventive Preventive 12
Fuse fails Breakdown Preventive 12
Contactor fails Breakdown Preventive 12
Relay fails Breakdown Preventive 12
Winding fails Breakdown Preventive 12
Misalignment
due to
coupling
Preventive Preventive 18
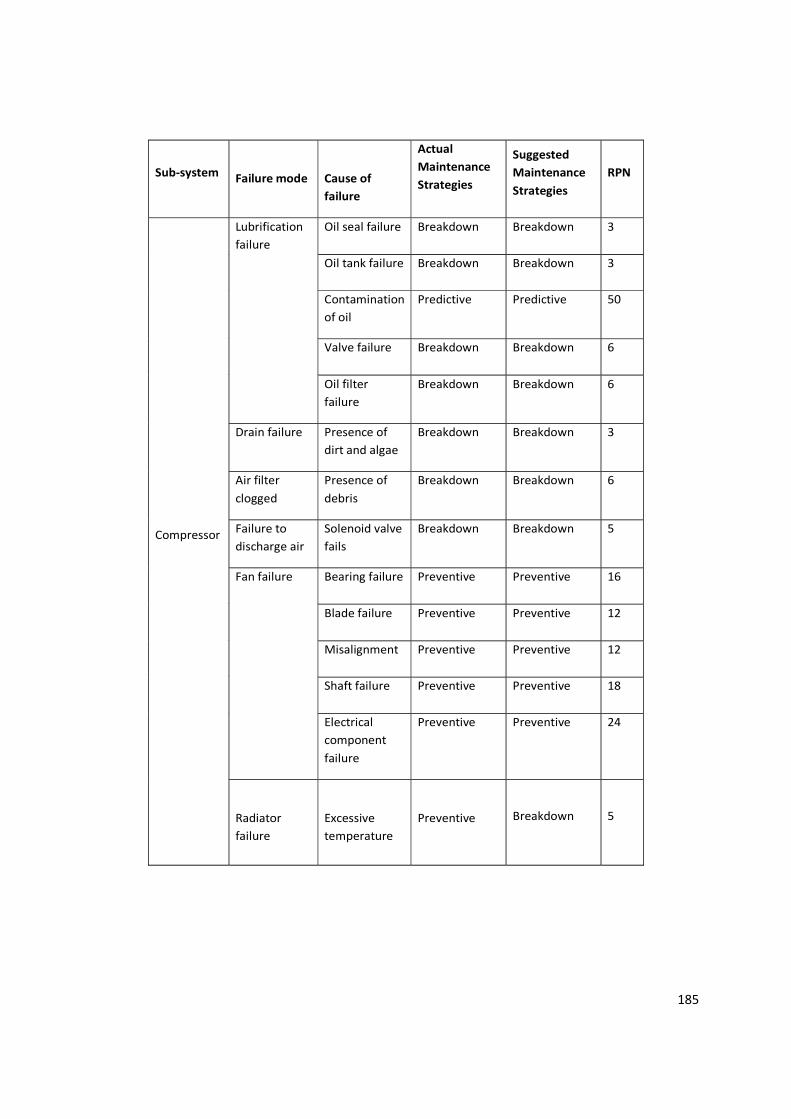
185
Sub-system
Failure mode
Cause of
failure
Actual
Maintenance
Strategies
Suggested
Maintenance
Strategies
RPN
Compressor
Lubrification
failure
Oil seal failure Breakdown Breakdown 3
Oil tank failure Breakdown Breakdown 3
Contamination
of oil
Predictive Predictive 50
Valve failure Breakdown Breakdown 6
Oil filter
failure
Breakdown Breakdown 6
Drain failure Presence of
dirt and algae
Breakdown Breakdown 3
Air filter
clogged
Presence of
debris
Breakdown Breakdown 6
Failure to
discharge air
Solenoid valve
fails
Breakdown Breakdown 5
Fan failure Bearing failure Preventive Preventive 16
Blade failure Preventive Preventive 12
Misalignment Preventive Preventive 12
Shaft failure Preventive Preventive 18
Electrical
component
failure
Preventive Preventive 24
Radiator
failure
Excessive
temperature
Preventive Breakdown 5

186
Sub-system
Failure mode
Cause of
failure
Actual
Maintenance
Strategies
Suggested
Maintenance
Strategies
RPN
Clarifier
Rotating
scraper
failure
Fatigue Breakdown
Breakdown
6
Drive motor
failure
Bearing failure Preventive Preventive 12
Fuse fails Breakdown Preventive 12
Contactor fails Breakdown Preventive 12
Relay fails Breakdown Preventive 12
Winding fails Breakdown Preventive 12
Misalignment
due to
coupling
Preventive Preventive 18
Gear box
failure
Seals fail Preventive Preventive 10
Wearing of
gear
Preventive Preventive 10
Gear clogged Preventive Preventive 10
Lubrification
failure
Preventive Preventive 10
Bearing failure Preventive Preventive 10
Tank failure Tank clogged
due to debris
Breakdown Breakdown 6
Pump
Valve failure Component
fails
Breakdown Breakdown 4
Impeller Fatigue Breakdown Preventive 10

187
Sub-system
Failure mode
Cause of
failure
Actual
Maintenance
Strategies
Suggested
Maintenance
Strategies
RPN
Pump
Lubrification
failure
Oil seal failure Breakdown Breakdown 4
Contamination
of oil
Predictive Predictive 50
Valve failure Breakdown Breakdown 4
Oil filter
failure
Breakdown Breakdown 4
Oil tank failure Breakdown Breakdown 3
Drive motor
failure
Bearing failure Preventive Preventive 12
Fuse fails Breakdown Preventive 12
Contactor fails Breakdown Preventive 12
Relay fails Breakdown Preventive 12
Winding fails Breakdown Preventive 12
Misalignment
due to
coupling
Preventive Preventive 18
Bearing
failure
Overloading Predictive Predictive 18
Lubrification
failure
Predictive Predictive 18
Filter clogged Due to debris Breakdown Breakdown 2
Pipe failure Excessive
stress
Breakdown Breakdown 6
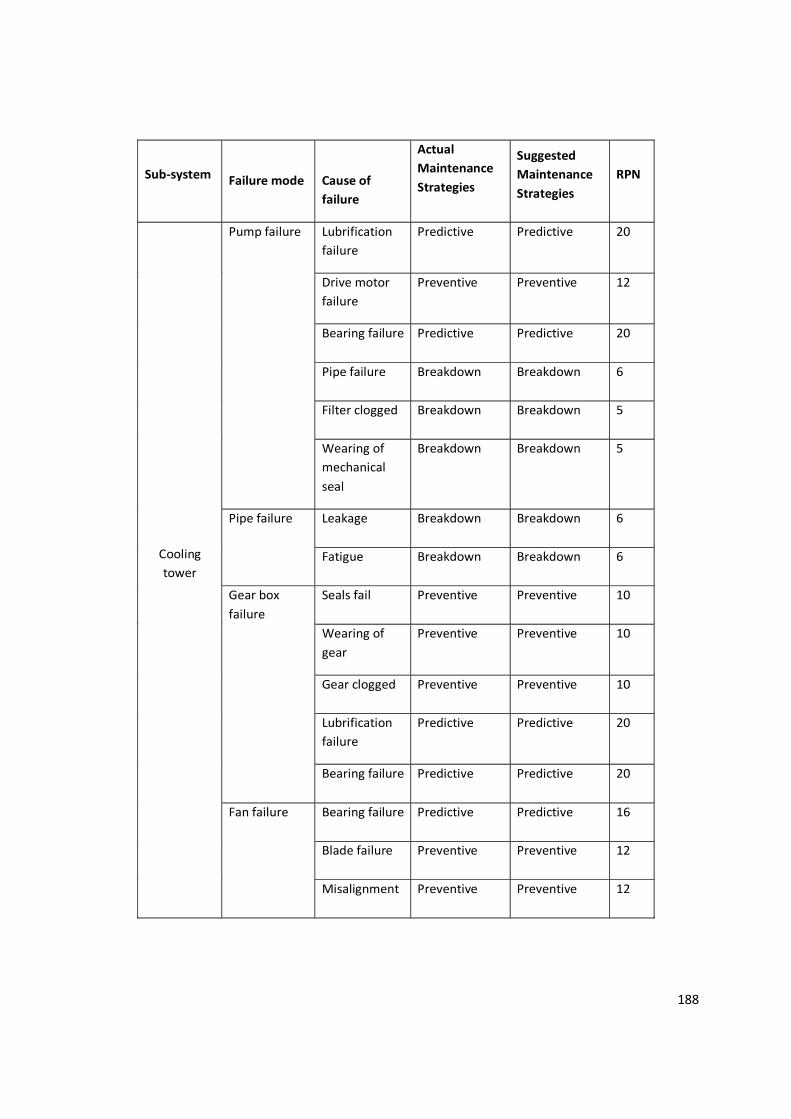
188
Sub-system
Failure mode
Cause of
failure
Actual
Maintenance
Strategies
Suggested
Maintenance
Strategies
RPN
Cooling
tower
Pump failure Lubrification
failure
Predictive Predictive 20
Drive motor
failure
Preventive Preventive 12
Bearing failure Predictive Predictive 20
Pipe failure Breakdown Breakdown 6
Filter clogged Breakdown Breakdown 5
Wearing of
mechanical
seal
Breakdown Breakdown 5
Pipe failure Leakage Breakdown Breakdown 6
Fatigue Breakdown Breakdown 6
Gear box
failure
Seals fail Preventive Preventive 10
Wearing of
gear
Preventive Preventive 10
Gear clogged Preventive Preventive 10
Lubrification
failure
Predictive Predictive 20
Bearing failure Predictive Predictive 20
Fan failure Bearing failure Predictive Predictive 16
Blade failure Preventive Preventive 12
Misalignment Preventive Preventive 12

189
Sub-system
Failure mode
Cause of
failure
Actual
Maintenance
Strategies
Suggested
Maintenance
Strategies
RPN
Cooling
tower
Fan failure Electrical
component
Preventive Preventive
18
Gear Box Predictive Predictive 24
Sand filter
Pressure
vessel failure
Corrosion Preventive Preventive 18
Valve failure Component
defective
Preventive Preventive 12
Spray nozzle
failure
Low pressure Preventive Breakdown
6
Carbon
filter
Pressure
vessel failure
Corrosion Preventive Preventive 18
Valve failure Component
defective
Preventive Preventive 12
Pneumatic
valve
Compressed
air failure
Lubrification
failure
Preventive Breakdown 6
Drain failure Preventive Breakdown 3
Air filter
clogged
Preventive Breakdown 6
Radiator
failure
Preventive Breakdown 5
Drive motor
failure
Preventive Breakdown 6
Actuator
Component
defective
Breakdown
Breakdown
8

190
Sub-system
Failure mode
Cause of
failure
Actual
Maintenance
Strategies
Suggested
Maintenance
Strategies
RPN
Turbine
Very low lube
oil header
pressure
Leakage Predictive Predictive 28
Bearing failure Predictive Predictive 28
Pump failure Predictive Predictive 28
Filter clogged Predictive Predictive 28
Valve failure Predictive Predictive 28
Very low
temperature
steam inlet
Boiler failure Predictive Predictive 28
Very high
steam
exhaust
pressure
Ejector
system failure
Predictive Predictive 28
Air ingression Predictive Predictive 28
Condensing
system failure
Predictive Predictive 28
Rotor axial
displacement
Excessive load Predictive Predictive 28
Radial
bearing
failure
Excessive
temperature
Predictive Predictive 28
Lubrification
failure
Predictive Predictive 28
Journal
bearing
failure
High pressure Predictive Predictive 28
Fault with
gland
condenser
Predictive Predictive 28
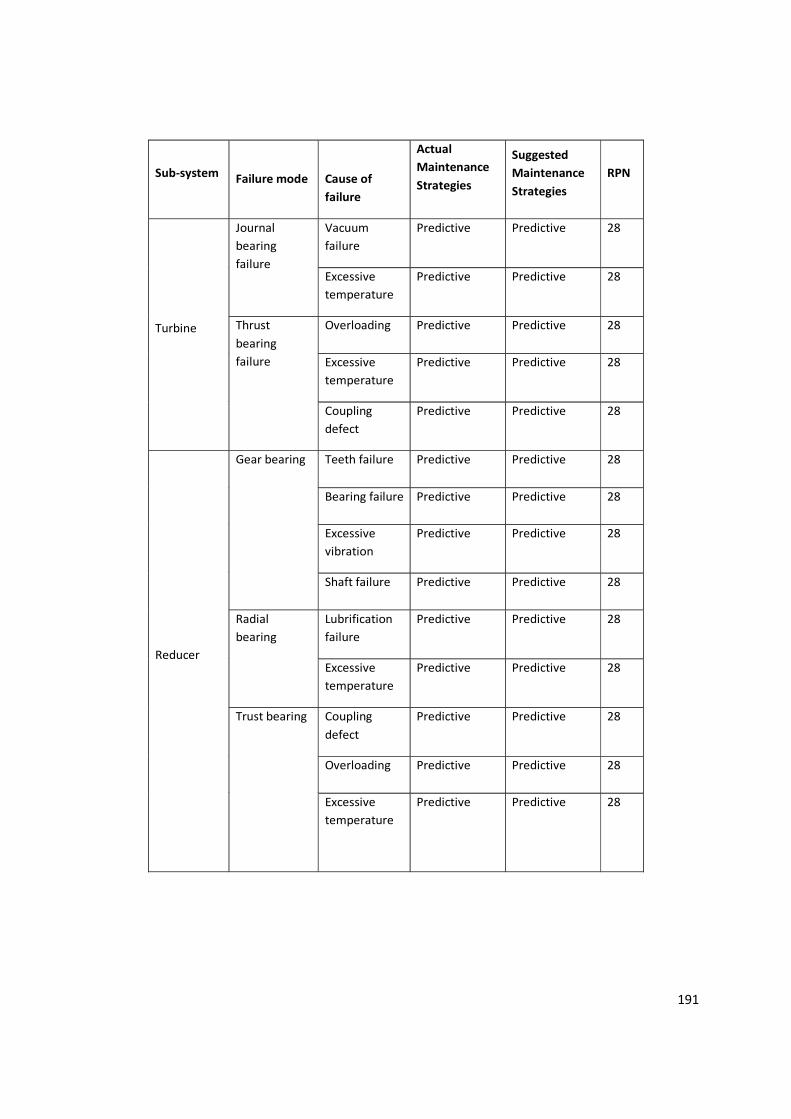
191
Sub-system
Failure mode
Cause of
failure
Actual
Maintenance
Strategies
Suggested
Maintenance
Strategies
RPN
Turbine
Journal
bearing
failure
Vacuum
failure
Predictive Predictive 28
Excessive
temperature
Predictive Predictive 28
Thrust
bearing
failure
Overloading Predictive Predictive 28
Excessive
temperature
Predictive Predictive 28
Coupling
defect
Predictive Predictive 28
Reducer
Gear bearing Teeth failure Predictive Predictive 28
Bearing failure Predictive Predictive 28
Excessive
vibration
Predictive Predictive 28
Shaft failure Predictive Predictive 28
Radial
bearing
Lubrification
failure
Predictive Predictive 28
Excessive
temperature
Predictive Predictive 28
Trust bearing Coupling
defect
Predictive Predictive 28
Overloading Predictive Predictive 28
Excessive
temperature
Predictive Predictive 28

192
Sub-system
Failure mode
Cause of
failure
Actual
Maintenance
Strategies
Suggested
Maintenance
Strategies
RPN
Alternator
Cooling air
outlet(cold)
Air inlet too
cold
Predictive Predictive 28
Cooler clogged Predictive Predictive 28
Fan failure Predictive Predictive 28
Generator
bearing
Excessive
temperature
Predictive Predictive 28
Misalignment Predictive Predictive 28
Bearing
damaged
Predictive Predictive 28
Overloading Predictive Predictive 28
Excessive
vibration
Predictive Predictive 28
Rotor
damaged
Predictive Predictive 28
Generator
winding
Excessive
electric load
Predictive Predictive 28
Air cooler fault Predictive Predictive 28
Excessive
temperature
Predictive Predictive 28
Cooling air
outlet(hot)
Air inlet too
hot
Predictive Predictive 28
Cooler clogged Predictive Predictive 28
Fan failure Predictive Predictive 28

193
Sub-system
Failure mode
Cause of
failure
Actual
Maintenance
Strategies
Suggested
Maintenance
Strategies
RPN
Mechanical
dust
collector
Blade failure Fatigue Preventive Preventive 32
Excessive
impact of ash
Preventive Preventive 32
Injection air
fan
Blade failure Fatigue Preventive Preventive 12
Drive motor
failure
Bearing failure Preventive Preventive 12
Fuse fails Breakdown Preventive 12
Contactor fails Breakdown Preventive 12
Relay fails Breakdown Preventive 12
Winding fails Breakdown Preventive 12
Misalignment
due to
coupling
failure
Preventive Preventive 18
Booster Screw failure Wearing Preventive Breakdown 5
Lubrification
failure
Predictive Predictive 20
Bearing failure Predictive Predictive 16
Filter clogged Due to debris Breakdown Breakdown 3
Belt failure
Fatigue Preventive Breakdown 3
Misalignment Preventive Breakdown
2

194
Sub-system
Failure mode
Cause of
failure
Actual
Maintenance
Strategies
Suggested
Maintenance
Strategies
RPN
Booster
Bearing
failure
Overloading Predictive Predictive 18
Lubrification
failure
Predictive Predictive 18
Lubrification
failure
Oil seal failure Breakdown Breakdown 4
Contamination
of oil
Predictive Predictive 50
Valve failure Breakdown Breakdown 4
Oil filter
failure
Breakdown Breakdown 4
Oil tank failure Breakdown Breakdown 3
Valve failure Component
defective
Breakdown Breakdown 3
Silo(Storage
of ash)
Pressure
vessel
Corrosion
Preventive Breakdown
6
Cracking
Preventive Breakdown
6
Filter clogged Due to debris Breakdown Breakdown 5
Pipe failure Excessive
stress
Breakdown Breakdown 6
Compressed
air failure
Lubrification
failure
Preventive Breakdown 6
Drive motor
failure
Preventive
Preventive 12
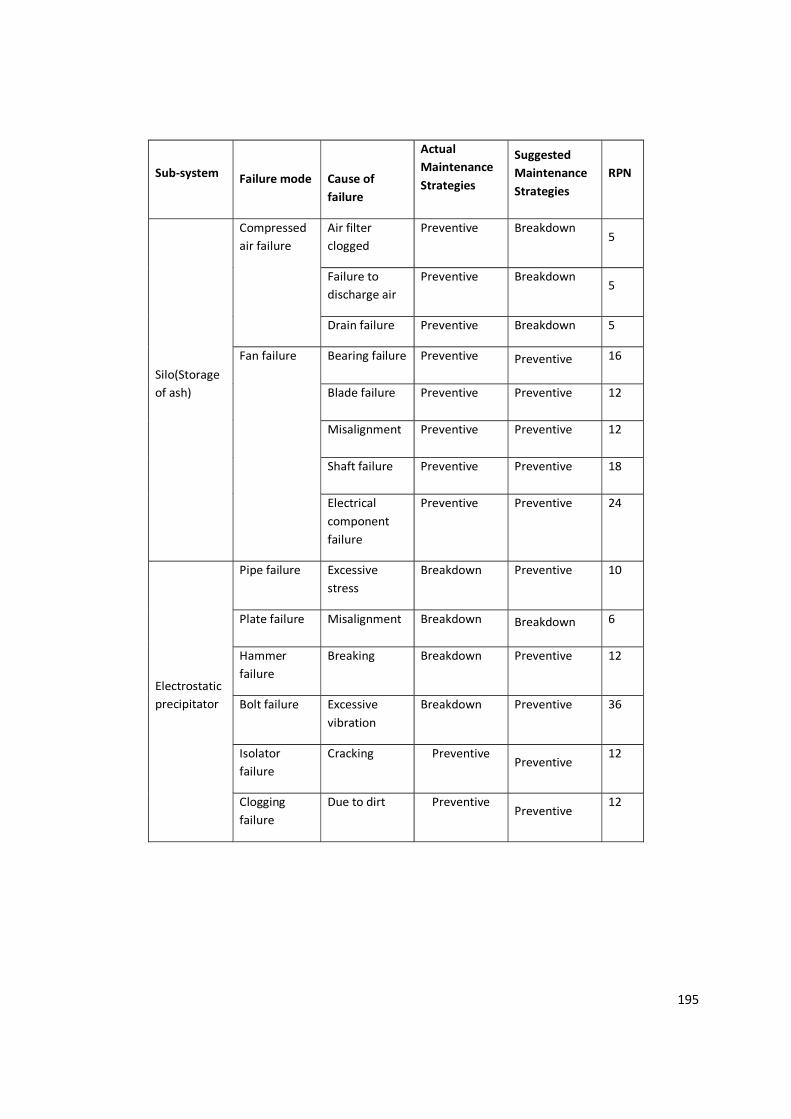
195
Sub-system
Failure mode
Cause of
failure
Actual
Maintenance
Strategies
Suggested
Maintenance
Strategies
RPN
Silo(Storage
of ash)
Compressed
air failure
Air filter
clogged
Preventive Breakdown 5
Failure to
discharge air
Preventive Breakdown 5
Drain failure Preventive Breakdown 5
Fan failure Bearing failure Preventive Preventive 16
Blade failure Preventive Preventive 12
Misalignment Preventive Preventive 12
Shaft failure Preventive Preventive 18
Electrical
component
failure
Preventive Preventive 24
Electrostatic
precipitator
Pipe failure Excessive
stress
Breakdown Preventive 10
Plate failure Misalignment Breakdown Breakdown 6
Hammer
failure
Breaking Breakdown Preventive 12
Bolt failure Excessive
vibration
Breakdown Preventive 36
Isolator
failure
Cracking Preventive Preventive
12
Clogging
failure
Due to dirt Preventive Preventive
12

196
Sub-system
Failure mode
Cause of
failure
Actual
Maintenance
Strategies
Suggested
Maintenance
Strategies
RPN
Electrostatic
precipitator
Gear box
failure
Seals fail Preventive Preventive 10
Wearing of
gear
Preventive Preventive 10
Gear clogged Breakdown Preventive 10
Lubrification
failure
Predictive Predictive 20
Bearing
failure
Predictive Predictive 20
Transformer
failure
Dielectric oil
failure
Predictive Predictive 30
Loose
connection
Preventive Preventive 10
Electrical
components
fail
Breakdown Preventive 24

197