analysing international tunnel costs - worcester polytechnic institute
TRANSCRIPT

i
WORCESTER POLYTECHNIC INSTITUTE
Analysing International Tunnel Costs
An Interactive Qualifying Project
Nathaniel Efron, Megan Read
2/29/2012
Stanley Selkow: Project Advisor

i
Abstract
Throughout the world, tunnels vary greatly in design, excavation, and completion resulting in a wide array of
prices. The current sentiment in Australia and New Zealand (ANZ) suggests that tunnel delivery is more
expensive there than in the rest of the world. Our goal was to identify key cost drivers, compare international
tunnelling costs, and gauge ANZ’s position for each driver. Through working with our sponsor, AECOM, we
compiled findings from data analysis, interviews, surveys, and case studies to accomplish this goal. We
discovered that tunnelling in ANZ is not statistically more expensive than in other nations, but that average
tunnelling costs are greater, especially for road and rail construction. We provided recommendations for potential
cost reduction in ANZ through investigation of several key cost drivers: geotechnical awareness, labour costs,
standardisation, market structure, project delivery, and client knowledge.
ii
Acknowledgements
Our team would like to thank the following individuals, organizations, and institutions for their help and support throughout our project:
Our sponsor, AECOM, for providing us with resources and guidance throughout our project and facilitating our research
o Specifically, our Project Manager Kate Woolley for her continual guidance and support; John
Cooper, Ed Rogers, Chris Boyd, Michael Skelton, Mark Bray, and Georgina Stobart for their continuous suggestions and help; and Jonathan Barnett for organizing this partnership and overseeing our project.
All of our interviewees who gave us their valuable time, ideas, and opinions.
Professor Stanley Selkow, from Worcester Polytechnic Institute, for his overall guidance and support throughout our project.
We would also like to acknowledge the outside help we received on both our proposal and final report, Professor
Seth Tuler from Worcester Polytechnic Institute, for his guidance in preparing our proposal, Debra Selkow for her
edits to our final report and presentation, and Daniel Duhaney for his contributions to our project.

iii
Executive Summary
Throughout the world tunnels interconnect cities, cut through mountains, transport water, and dive deep into mines.
These passageways help keep humanity interconnected and carry many resources we could not survive without. The
continuous use of tunnels by the world’s growing population necessitates both their upkeep and their expansion,
resulting in costly expenditures. The public sector throughout the world helps to financially support these expansive
projects and would greatly benefit from the quantification and reduction of costs. Every country constructs tunnels
with slightly different methods and has various associated cost factors. In Australia and New Zealand (ANZ) a
sentiment exists that constructing tunnels is significantly more expensive than in other parts of the world. Developing
a method for comparing tunnels internationally and identifying and quantifying the numerous variables that influence
tunnelling costs, could potentially result in reducing the cost of tunnel delivery and the fiscal burden on the public.
Tunnelling differs from the construction of other infrastructure in a plethora of ways. The main issues that distinguish
tunnels from other infrastructure arise from the risk involved with excavation through unknown ground conditions and
the numerous individual cost drivers that contribute to the overall cost. These cost drivers include, but are not limited
to the following direct and indirect factors, all of which must be accounted for in our analysis.
• Geology
• Excavation Type
• Materials/Plant
• End-Use
• Length
• Face Area
• Depth
• Lining Type
• Locality
• Labour Cost
• Health and Safety
Regulations
• Market
Competition
• Client Knowledge
• Government and
Public Support
• Contract Type
• Cost of Bidding
Geology can range from soft sands and gravel to extremely hard rock and often includes fault lines and water
permeation issues. A site investigation (SI) is completed during the initial design stages of a project to account for
and plan for various ground conditions. Varying geologies necessitate different methods of excavation, which include
cut and cover, drill and blast, roadheaders, and tunnel boring machines (TBMs). There are also an array of end-uses
for tunnels including road, rail, water, wastewater, cable, mining and scientific tunnels. Each end-use has its own
specifications and requirements for operation and safety. Every tunnel also has its own length, face area, depth, and
lining type and can pass through urban or rural locations. In addition to all of these variables, tunnelling is also
affected by many indirect factors often related to the country of construction as each differs in its labour costs, health
and safety regulations, environmental regulations, level of market competition, client knowledge, and amount of
government and public support. Varying contract types such as design and construct (D&C); design, build, operate
(DBO); build, own, operate (BOO); and public private partnerships (PPP) are also common in different countries and
affect the cost of bidding and financing. As illustrated by the quantity of variables listed above, tunnelling is a very
unique area of construction in which every excavation has its own challenges to surmount.
In addition to accounting for numerous cost drivers when evaluating tunnels domestically, international comparisons
add increased difficulty. This results from the need to convert currencies and account for inflation in each individual
country. Construction cost indices are not standardized globally and often comprise different costs and methods
depending on the country of origin.
Previous research completed on this topic has been scarce and generally lacks supportive data. An in-depth study
has been completed comparing tunnelling in the United Kingdom to other European countries. We used this study as
a base-line and related it to ANZ in comparison with the rest of the world. The only past research on construction in
ANZ was a paper comparing infrastructure costs in Australasia that did not focus on tunnelling. This paper had very
limited data and stated in its recommendations that future research is needed to confirm any of its conclusions. We
sought to build off of and expand upon this past research in order to accomplish our goals. The aim of this project
was to provide insight regarding whether tunnel delivery is more expensive in ANZ than the rest of the world, identify
the key cost drivers for tunnelling, and gauge ANZ’s position for each. We accomplished this goal through the
following objectives and deliverables.
1. Create an accurate method of comparing tunnel project cost-estimates using information derived from
interviews with cost estimators.
2. Determine whether tunnelling in ANZ is statistically more expensive than the rest of the world.
iv
3. Accurately define the key cost drivers (direct and indirect) that contribute to the overall cost of tunnel
project delivery through interviews and data collection.
4. Gauge Australia and New Zealand’s international position in terms of cost for each key driver.
5. Identify and establish any benefits associated with a higher cost rate in Australia.
6. Produce recommendations for the tunnelling industry in ANZ regarding cost reduction in constructing
tunnels.
In order to accomplish the above objectives we completed a literature search focused on gathering information
regarding the cost drivers of tunnelling. In addition we gathered extensive data on tender and outturn costs of tunnels
completed globally within the past 15 years. As a result of this archival search we compiled a database including 158
tunnels from 35 different countries evenly distributed throughout ANZ, Asia, the Americas, and Europe. These tunnels
were distributed through various categories including end-use, geology, size, location, and excavation type. To
normalize this broad set of data, we divided each project by length and volume and applied construction specific
indices to account for inflation and common exchange rates to make the data comparable in third quarter 2011
Australian dollars. The entire adjusted database was used for our preliminary cost comparison of tunnel costs in
Australia to those in the rest of the world.
A combination of statistical tests, averages, standard deviations, and graphs were used to assess and illustrate our
data. Tunnels were separated by tender and outturn costs and then compared by region, by end-use and region, and
by locality and end-use. Information from 11 interviews with industry professionals and 54 survey responses were
used to provide qualitative and quantitative information to supplement our data analysis and help support or negate
our claims. These interviews and surveys also served to identify and qualify the various cost drivers in ANZ in
contrast to the rest of the world. In addition, an individual project comparison was completed in which several tunnels
were evaluated from Australia, New Zealand, Asia, and Europe. These tunnels were selected based on similar
excavation types, end-uses, and locality in an attempt to assess the cost differences between very relatable tunnel
projects.
Conclusions and Recommendations
Data Collection and Analysis
Our research concluded that tunnel construction in Australia and New Zealand is not statistically more expensive than
the rest of the world when compared by region or end type due to a large variance in the sample means. It was found
that Australia does average higher than the rest of the world for construction of transportation tunnels, but not for
utility tunnels. The higher average cost found for transportation tunnels is significant since rail and road projects are
typically more publicized. This finding helps explain the opinion that tunnelling in Australia is more expensive than in
the rest of the world while the large range in costs in our database exemplifies the numerous cost drivers that
contribute to overall costs and the potential for cost reductions in ANZ.
Individual tunnel comparisons of six recent urban, TBM bored, rail projects supported the conclusion that tunnelling is
not more expensive in Australia. It was found that the costs per cubic meter of these tunnels were very similar and
differed by $70/m3. Since the excavation type and end-use were kept constant in this analysis and similar global
costs resulted, it is possible that these are key cost drivers for tunnelling. Although inferences about regions as a
whole should not be made from the results of this analysis, it still aids in understanding and illustrating the effects of
several cost factors on unit cost as well as the sensitivity in analysis with such a small dataset.
For future analysis, it is recommended that tunnel projects be divided into groups by end-use, then analysed with
location being the independent variable. The key to such a complex analysis is a large quantity of data and the
careful elimination of conflicting variables. Further separation by excavation types would be ideal with a larger data
set. It is also important to integrate findings from a variety of sources in order to counteract the lower reliability of
some data. Findings can then be qualified with multiple sources of information agree upon the same conclusion.
We recommend that AECOM continue to add projects and costs to the database to overcome the lack of statistical
significance related to not having enough data points and we feel that all future studies should exclude Australia and
New Zealand from co-analysis as a result of their contrasting cost drivers. We would also suggest consulting various
geotechnical engineers to produce a quantifiable geological difficulty rating scale which can be applied to each
tunnel. The analysis would further benefit from quantifying the cost of bidding versus the location and contract type.

v
This is a key factor that has come up in our qualitative analysis, but currently lacks quantitative information. These
factors could then be utilized for quantitative analysis of the database. We also recommend continuing to investigate
why a wide range of tunnelling costs exists within a country, specifically Australia, which could help lead to major cost
reductions.
Interviews and Surveys
Interviews and survey responses often agreed that tunnelling in Australia seems very expensive and provided
explanations for this feeling. The key cost drivers mentioned in these interactions were geology, labour,
materials/plant, safety and environmental regulations, government and public support, market structure, the cost of
composing bids, contract type, and client knowledge. Interviewees unanimously agreed with our conclusion that
Australia and New Zealand should be analysed separately. As a result we focused on Australian cost drivers in our
interviews and reported on potential for cost reductions that were focused on Australia.
In general, interviewees strongly felt that there were no tangible benefits to higher tunnelling costs in Australia.
Conversely, the majority of survey respondents had a wide range of possible benefits such as, higher worker
productivity, better construction safety records, greater adherence to environmental standards, reduced operation
and maintenance costs, better post-commissioning safety, and longer service life. The interviews suggested that
these benefits did not outweigh increased costs, but future investigation could further research these statements.
In order to supplement these data, it is important to continue qualitative research. We recommend compiling and
sending a lengthier, globalised survey which focuses in depth on the key areas of cost savings. In addition, this
survey should seek out cases of significant cost reduction in the global market that can be further studied and
possibly implemented in Australia.
Cost Drivers and Potential for Cost Reduction in Australia
The following list of key cost drivers were researched and are discussed below. Recommendations for these cost
drivers were also provided when relevant. Although this advice is aimed at the Australian market, some changes may
be applicable elsewhere in the world.
• Geology
• Labour
• Materials/Plant
• Safety and Environmental Regulations
• Market Structure
• Government/Public Support
• Client Knowledge
• Project Delivery
It was discovered that the design stage has a large potential for cost reductions in these categories, as at this point
in a project the scope of the project is not completely set. In addition large decisions such as choosing the alignment,
dimensions, and lining type during this stage can result in significant cost variance during construction.
Geology
Geology is the cited cause for the majority of cost overruns in tunnel construction. Ground conditions vary throughout
the world, with major problems being caused by water permeation, fault lines, very soft materials that will not support
themselves, and the variation of materials from soft sand or gravel to extremely hard rock. The conditions in Australia
are not overly difficult to excavate through in comparison with the rest of the world.
We advocate that during the early feasibility stage, clients significantly increase the amount of SI undertaken. We
recognise the issues with convincing clients to spend more money in the early stages of a project, when the overall
viability, constructability and financing is still unknown, but all of our research subjects described a direct correlation
between the amount of SI and cost savings. To accomplish this, we recommend providing more comprehensive
education to clients who are considering constructing any type of subsurface works. Although this issue is not
inherent to only Australia, it is an area that has marked as possessing a large potential for decreased risk and cost
reduction.
Labour
Labour costs typically account for 30-40% of the overall budget for a tunnelling project as described by our
interviewees. Variances in these costs between countries may account for a range in tunnelling costs. Labour prices
in Australia are reported as very high because of the value of the dollar, active unions, and employment competition
with the mining sector. Other countries with higher wages such as Europe and the United States will often import a
workforce from Asia in order to reduce labour costs, but this is not a viable option in Australia due to restrictions.

vi
Although there is increased education and productivity amongst Australian workers, we did not find that they were
substantial enough to counteract the costs of high wages.
A reduction in the amount of labour required to deliver a tunnel would result in cost savings in this area. Since the
largest labour costs are attributed to the construction workers rather than professional engineers, optimisation of
precast plants, increased technological efficiency and better management would be areas of potential cost reduction.
We also recommend collecting information on tunnel progress rates per unit length or area, and perform interviews
with construction managers in order to seek out inefficiencies and reduce labour.
Materials/Plant
Materials and plant costs are often very similar across regions. There are only a few main manufacturers that supply
the majority of international tunnelling, and as a result, only the associated shipping fees affect Australia. An option to
reduce costs in materials and plant that is being investigated in Asia is to move towards standardization instead of
optimization. This is an option for both a country as a whole, or for a single client who may be planning on building
many similar tunnels. Currently, huge inefficiencies exist in having to set up a custom plant for every job to
manufacture precast rings that are unique to a specific tunnel. In addition, equipment such as TBMs are typically only
used once and then sold back to the manufacturer for 5-15% of the purchase price, when it could be much cheaper to
simply refurbish the equipment between jobs. These changes could potentially reduce costs after the initial increase
needed to design tunnels around these pre-determined parts.
Safety and Environmental Regulations
Safety and environmental regulations are very similar throughout the world, with Europe typically being the first to
implement new standards and then they are adopted by the United States, Australia, New Zealand, and eventually
Asia. There are slightly different regulations based on the location of the project in either a rural or urban
environment, but safety and environmental regulations are relatively standardized throughout the world so there is not
much potential for cost reduction in this category. Some Australian tunnels have been noted as “over designed” and
“over specified” with regards to some safety features, and the removal of excess systems may help remove additional
costs.
Market Structure
The level of competition in the Australian tunnelling market is currently very limited, with only six major contractors,
three of which share the same parent company. In most other countries, tunnelling projects would have bids from
around 10 or more contractors, while in Australia this rarely exceeds four. The large project sizes in Australia for
tunnelling works makes it very difficult for smaller companies to contend with these larger contractors and also
necessitates the need for joint ventures between the larger contractors. This results in many projects where
contractors often end up bidding against themselves. The lack of competition in the Australian market would result in
increased costs for tunnelling works since these contractors do not have to be as aggressive in their bidding and may
be more complacent in this region than they are in other parts of the world. The construction of Legacy Way in
Brisbane marks the first international intervention in the Australian market. A Spanish and Italian joint venture greatly
undercut the bidding for the project. Currently this tunnel is under construction, but in the future it would be a good
case study for comparison of international tunnelling methods to those in Australia. International intervention in the
market may also increase the level of competition and lead to cost reductions.
Increasing market competition is a difficult problem to address because of the experience, knowledge and contacts
possessed by large domestic contractors. One option that could be exercised by clients would be to encourage
bidding from foreign contractors, which could help spur innovation and trigger cutting of unnecessary costs. Another
preferred alternative would be to analyse the effects of splitting large scale contracts into multiple, smaller contracts.
This would help spread the risk and allow smaller, less experienced contractors to enter the market. This is a
standard practice in places such as Singapore and Hong Kong, where a large tunnelling project might be split into 20
or more contracts that are won by different contractors and joint ventures. The same scale projects in Australia are
typically bid as a whole and go to a single contractor or joint venture resulting in decreased competition and
increased cost. A thorough analysis would be needed to determine if the cost reduction from increased competition
would exceed the increased cost of additional bids.
Government/Public Support
Government support helps to expedite the design phase and advance the project to excavation. If this support wavers
or shifts throughout a project, it can lead to changes in scope and time setbacks which cause cost overruns. Some

vii
projects can even be abandoned if they lack government support. One example is the Sydney metro, which was
cancelled after significant design work and investment. The amount of public support for a project is another indirect
variable that can greatly affect tunnelling costs. The lack of a favourable public opinion can result in a reduced
amount of traffic and can negatively affect the amount of government support on a project. One finding from our
interviews was that in general, Australians do not prefer to spend money on paying tolls to use tunnels even though it
may save them time and expenses in the long run. Based on these findings, it is very important to secure both
government and public support during the early stages of a tunnelling project in order to avoid potential cost
escalations.
Client Knowledge
In Australia, client knowledge is generally regarded by our survey respondents and interviewees an area for
improvement. Many clients are unaware of how to create tunnelling specifications which optimise cost saving
potentials because of the relative rarity of tunnels when compared to other infrastructure. As a result clients do not
understand the unique challenges related to tunnelling, and scopes for projects often include items that are not
necessary. Some clients are also very vague about what they want which can lead to issues when putting together
bids. The lack of experience amongst clients found in the Australian tunnelling market contrasts with the experience
of clients in Europe and Asia and could further explain higher costs in the region.
Similar to other client issues, the solution appears to be increased education. We feel that this recommendation of
client education will help to significantly reduce inefficiencies caused by misspecification and also reduce the number
of clients that needlessly spend money by hiring consultants too early in the planning process when not enough
information is known.
Project Delivery
Contract types in Australia have begun to move towards Private Public Partnerships (PPPs) within the last fifteen
years, which contrasts with the contract types in other nations. In addition other nations’ PPPs do not operate in the
same manner as those in Australia. In Australia these contracts require the private sectors to take on all risk and
provide all financing for a project instead of the government. This can lead to increased costs since the private sector
must account for a large contingency and also cannot secure bonds and financing at the lower rates available to the
government. The PPP model has had both successes and failures. The key advantage is that PPPs result in an
expedited start to a project, where there is less chance of projects being delayed after major political changes, but
several recent PPP projects have resulted in the private firm backing the project to declare bankruptcy. This is most
often a result of delusions about the successes of the project such as forecasting much higher traffic use of tolled
tunnels than is realistically possible. In general, it is believed that the PPP model requires some restructuring in order
for it to be successful for tunnelling projects.
The cost of bidding in Australia is also very high as a result of the PPP model. Since the private sector takes on the
risk for these contracts, they require a high level of cost certainty and result in higher design specifications during
bidding. Typically it costs a contractor 30 – 40 million dollars to put together a bid for the largest PPP tunnelling
projects in Australia. This cost is completely lost for any contractor that is not selected. The lost money must then be
recouped by subsequent projects, resulting in a cycle that increases the costs of every large project undertaken by
these companies. These large costs also negatively affect competition in the tunnelling market, as smaller contractors
cannot incur this debt for as long of a period of time as larger firms without becoming bankrupt.
Our recommendation is to continue encouraging the PPP model wherever possible as it helps produce projects that
otherwise may stagnate, but to revise the process to encourage competition and reduce cost inefficiencies. Although
PPPs have been criticised in the past for lack of post-construction revenue, we have found that financiers and
contractors have learned from this and are now more cautious when it comes to traffic forecasts and estimates. It
may be prudent to attempt to improve public opinion about the use of tolled road tunnels as well. Overall, our
concerns and recommendations lie with the risk allocation and high amount of money lost during the bidding process.
We would encourage a revision of the PPP model to partially place the risk associated with the contract back on the
government. With the ideal being a model where construction risk is allocated to the contractor and the post-
construction risk is split more evenly between the public and private parties of the contract. Our recommendation
regarding increased bidding costs is to conduct a cost-benefit analysis to ascertain if the higher cost certainty
resulting from a higher design percentage outweighs the increase in cost resulting from bids that have been lost.
Note: A frequently asked questions section, and a glossary of technical terminology are available in appendix A (7.1)
and Appendix B (7.2) respectively.
viii
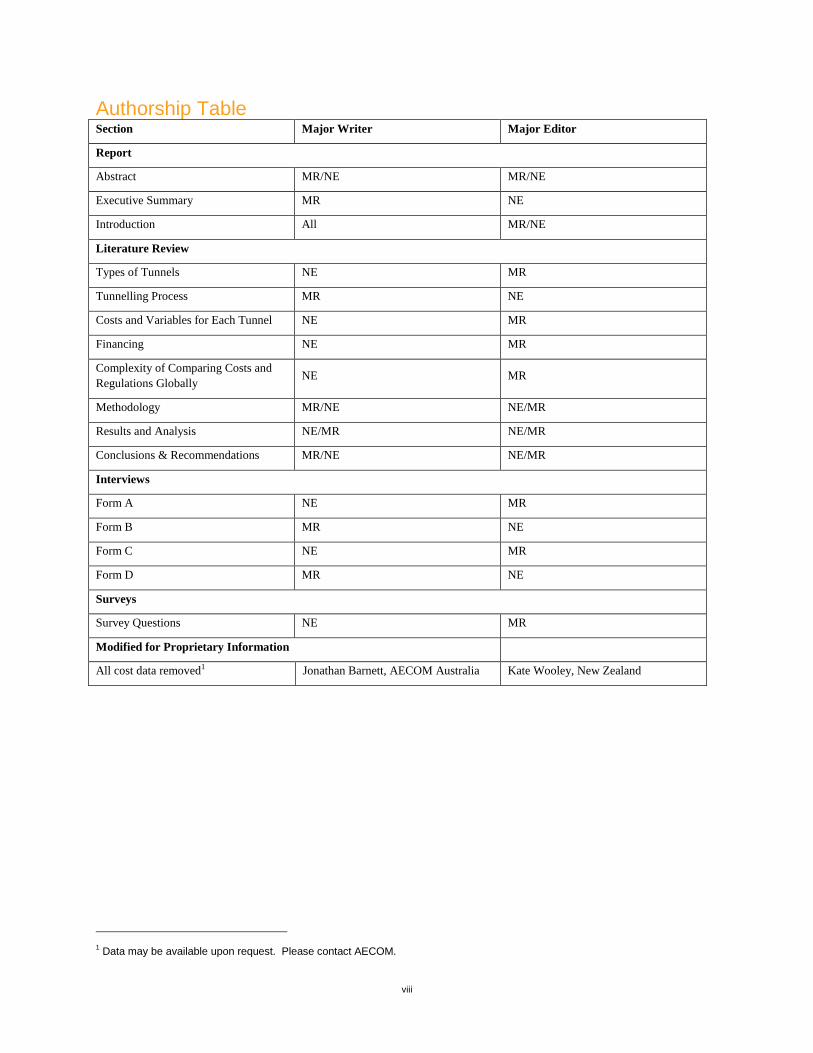
Authorship Table Section Major Writer Major Editor
Report
Abstract MR/NE MR/NE
Executive Summary MR NE
Introduction All MR/NE
Literature Review
Types of Tunnels NE MR
Tunnelling Process MR NE
Costs and Variables for Each Tunnel NE MR
Financing NE MR
Complexity of Comparing Costs and
Regulations Globally NE MR
Methodology MR/NE NE/MR
Results and Analysis NE/MR NE/MR
Conclusions & Recommendations MR/NE NE/MR
Interviews
Form A NE MR
Form B MR NE
Form C NE MR
Form D MR NE
Surveys
Survey Questions NE MR
Modified for Proprietary Information
All cost data removed1 Jonathan Barnett, AECOM Australia Kate Wooley, New Zealand
1 Data may be available upon request. Please contact AECOM.

ix
Table of Contents
Executive Summary iii Conclusions and Recommendations iv
Table of Contents ix 1.0 Introduction 1
1.1 Aims and Objectives 1 2.0 Literature Review 3
2.1 Types of Tunnels 3 2.1.1 Mining Tunnels 3 2.1.2 Water and Wastewater Tunnels 3 2.1.3 Transportation tunnels 3 2.1.4 Cable Tunnels 4 2.1.5 Scientific Tunnels 4
2.2 Tunnelling Process 4 2.2.1 Feasibility Study 5 2.2.2 Planning and Design 5 2.2.3 Construction 5 2.2.4 Commissioning 7
2.3 Cost and Variables for Each Tunnel 7 2.3.1 Geotechnical Risks and Substrate Determination 7 2.3.2 Locality 8 2.3.3 Design 8 2.3.4 Health / Safety Regulations 8 2.3.5 Environmental Regulations 9 2.3.6 Contingencies 9 2.3.7 Material/Labour 9
2.4 Financing 10 2.4.1 Project Delivery Methods 10
2.5 Complexity of Comparing Costs and Regulations Globally 11 2.6 Previous Studies 11 2.7 Summary 12
3.0 Methodology 13 3.1 Archival Research 13 3.2 Compiling the Database 13
3.2.1 Cost Conversion 14 3.2.2 Distance Normalization 14
3.3 Statistical Comparison of ANZ to the rest of the world 14 3.3.1 Identification and Removal of Erroneous Data 14 3.3.2 Data Analysis 15 3.3.3 Estimate to Final Price Comparison 15
3.4 Assessing the Position of the Tunnelling Industry 16 3.4.1 Interviews 16 3.4.2 Surveys 16 3.4.3 Analysis 16
3.5 Tunnel Case Studies 17 4.0 Results and Analysis 18
4.1 Tunnel Database Analysis 18 4.1.1 Costs of Tunnelling by Region 21 4.1.2 Costs of Tunnelling by End-Use and Region 24 4.1.3 Costs of Tunnelling by End-Use and Locality 27 4.1.4 Tunnel Component Breakdown 28 4.1.5 Limitations of Cost Data 29 4.1.6 Limitations of Non-Cost Data 29
4.2 Interviews and Survey Results 29 4.2.1 Interviews 29

x
4.2.2 Surveys 31 4.3 Individual Comparisons 37 4.4 Comparison of Australia and New Zealand 38 4.5 Investigation of Cost Escalation 39
4.5.1 Geology 39 4.5.2 Labour Costs 39 4.5.3 Market Competition and Bidding 41
5.0 Conclusions and Recommendations 42 5.1 Recommendations for Future Research 43
5.1.1 Data Collection 43 5.1.2 Analysis 43
5.2 Benefits of Tunnel Costs in Australia 43 5.3 Cost Drivers and Potential for Cost Reduction in Australia 44
5.3.1 Geology 44 5.3.2 Labour 44 5.3.3 Materials/Plant 45 5.3.4 Safety and Environmental Regulations 45 5.3.5 Market Structure 45 5.3.6 Government/Public Support 46 5.3.7 Project Delivery 46 5.3.8 Client Knowledge 47
6.0 Works Cited 48 7.0 Appendices 51
7.1 Appendix A: Frequently Asked Questions (FAQs) 52 7.2 Appendix B: Glossary 53 7.4 Appendix C: Gantt Chart 55 7.5 Appendix D: Interview Questionnaires 56
7.5.1 Form A 56 7.5.2 Form B (Cost Estimator) 57 7.5.3 Form C (Contractor) 59 7.5.4 Form D (Consultants) 63 7.5.5 Closing (All Forms) 65
7.6 Appendix E: Tunnels Research Survey 66 7.7 Appendix F: Survey Responses 70 7.8 Appendix G: Conversion Factors 85
7.8.1 Exchange Rates for 3rd Quarter 2011 85 7.8.2 Construction Price Indices and Inflation Rates 86
7.9 Appendix H: Countries in Tunnel Costs Database 92 7.10 Appendix I: Supplementary Data 93
7.10.1 Comparison with British Tunnelling Society Data 94 7.11 Appendix J: Monthly Labour Rates by Country 96
Table of Figures Figure 1: Tunnelling Process 4 Figure 2: Variables in Tunnelling Database 13 Figure 3: Tunnel Breakdown by Region 18 Figure 4:Tunnel Breakdown by Cost Type 18 Figure 5: Tunnel Breakdown by End-Use 19 Figure 6: Box Plot of Estimate Costs (AUD) 20 Figure 7: Box Plot of Final Costs (AUD) 20 Figure 8: Regional comparison of cost/m 21 Figure 9: Regional comparison of cost/m
3 21
Figure 10: Europe End-Uses Tunnel Breakdown (left) and ANZ End-Uses Tunnel Breakdown (right) - Estimates 23 Figure 11: Asia End-Uses Tunnel Breakdown - Estimates 23

xi
Figure 12: Transportation Tunnels Cost Comparison 25 Figure 13: Utility Tunnels Cost Comparison 26 Figure 14: Locality Comparison - Estimates 27 Figure 15: Locality Comparison – Final Costs 27 Figure 16 Road tunnel cost composition breakdown (left) and Rail tunnel cost composition breakdown (right) 28 Figure 17 Utility tunnel cost composition breakdown 28 Figure 18: Interview Breakdown 30 Figure 19: Survey Respondent Breakdown by Role (left) and Survey Respondent Breakdown by End-Use (right)
32 Figure 20: Survey Respondent Breakdown of Experience by Region 32 Figure 21: Survey Response Distribution for Contributors to Final Cost 33 Figure 22: Survey Response Distribution for Cost Reduction Opportunities 34 Figure 23: Survey Response - Is tunnelling more expensive in ANZ? (left); Survey Response – High Cost Source
(right) 35 Figure 24: Survey Response – Benefits to Higher Cost 36 Figure 25: Monthly Wages by Country [Source: http://www.worldsalaries.org] 40 Figure 26 Gantt Chart 55 Figure 27: Comparison between Cost/m and Tunnel OD 94 Figure 28: Comparison between Cost/m and Length 94 Figure 29: Comparison between Cost/m
3 and Tunnel OD 95
Table of Tables Table 1: Reported T-Test Results for Estimates and Final Costs by Region 22 Table 2: Percent Increase, Estimate to Final Cost 24 Table 3: T-Test Comparing End-Uses by Region 24 Table 4: Individual Comparisons, All costs given in average Q3-2011 AUD 37 Table 5: Average Estimate Costs by Country 41 Table 6 Exchange Rates for 3
rd Quarter 2011 85
Table 7 Construction price Indices 86 Table 8 Inflation Factors 90 Table 9 Countries in Tunnel Costs Database by Region 92 Table 10 Average Wages by Country and Profession 96 Table 11 Average Wages by Country 96

1
1.0 Introduction
Throughout the world, tunnels interconnect cities, cut through mountains, transport water and dive deep into mines.
These passages have become a necessary part of everyday life and because of their usefulness will only continue to
see increased usage and expansion in upcoming years. However, these construction projects are very expensive
ventures, costing from millions to billions of dollars (Harris, 2011). In addition, the costs and regulations associated
with tunnel construction can vary greatly from place to place and are very difficult to predict since construction occurs
underground in unknown territory.
According to AECOM, a global engineering and management support firm with branches in Australia and New
Zealand (ANZ), constructing tunnels in these regions is inexplicably expensive, sometimes costing as much as triple
the amount in other regions such as Europe. The large budgets associated with constructing tunnels can be broken
down into numerous cost drivers, such as the dimensions, end-use, excavation type, labour, materials, and
government and safety regulations, which can all vary greatly based on the location of the project. Limited
understanding of these cost drivers and whether or not they can be controlled contributes to the disparity in costs.
This analysis is further complicated by the immense scale of the tunnelling industry and also because these variables
are not strictly comparable across various locations.
An investigation into the costs of tunnelling would allow for possible reductions in costs which could greatly benefit
Australia and New Zealand. In the past, there have been similar studies to explain cost discrepancies of tunnels and
other infrastructure across Australasia. One similar study focused on comparing spending by scaling costs to 2010
dollars and then converting each cost to dollars per kilometre, but the amount of data used in this study was very
limited (Martin, 2011). Another example that parallels this research is a study that was conducted by the government
of the United Kingdom (UK). Tunnel costs were compared among European countries to discover whether
construction in the UK was more expensive and, if so, why (HM Treasury, 2010).
Although there has been research on infrastructure cost analysis, our goal is to expand upon past research and relate
it to ANZ. A tunnel database has been initiated by AECOM that organizes cost information from various projects
throughout Europe, Australia, New Zealand, and Asia. Additional information and organization of this database would
allow for a better understanding of the costs of tunnelling and would also help explain the regional price variation.
This information would benefit the local economy and societal infrastructure while concurrently aiding AECOM’s
clients in better understanding overall tunnelling costs.
We seek to determine whether tunnelling in ANZ is more expensive than in other regions, and if so, discover the key
cost drivers that are responsible for this high expense. We completed archival research to attempt to identify,
catalogue and integrate data for tunnels to expand the current AECOM database. This information was used to
compare costs between countries in dollars per kilometre and gauge ANZ’s position in comparison to other nations.
We then completed detailed analysis of tunnelling case studies from ANZ and other regions of the world in order to
better understand the relationships between individual cost drivers and final costs. These relationships are known to
be very complex and can have an excessive number of variables which are challenging to analyse. We also
interviewed knowledgeable cost estimators, contractors, and consultants from both the tunnelling division of AECOM
and the tunnelling industry to determine which cost drivers may account for budget variance. After compiling all of
the above information, we put together a set of recommendations for how ANZ can potentially reduce tunnelling costs
and established if there are any quantifiable benefits resulting from this higher cost.
1.1 Aims and Objectives
The following objectives outline the requirements to achieve the overall goal of the research.
1. Create an accurate method of comparing tunnel project cost-estimates using information derived from
interviews with cost estimators.
2. Determine whether tunnelling in ANZ is statistically more expensive than the rest of the world.
3. Accurately define the key cost drivers (direct and indirect) that contribute to the overall cost of tunnel project
delivery through interviews and data collection.
4. Gauge Australia and New Zealand’s international position in terms of cost for each key driver.
5. Identify and establish any benefits associated with a higher cost rate in Australia.

2
6. Produce recommendations for the tunnelling industry in ANZ regarding cost reduction in constructing
tunnels.
3
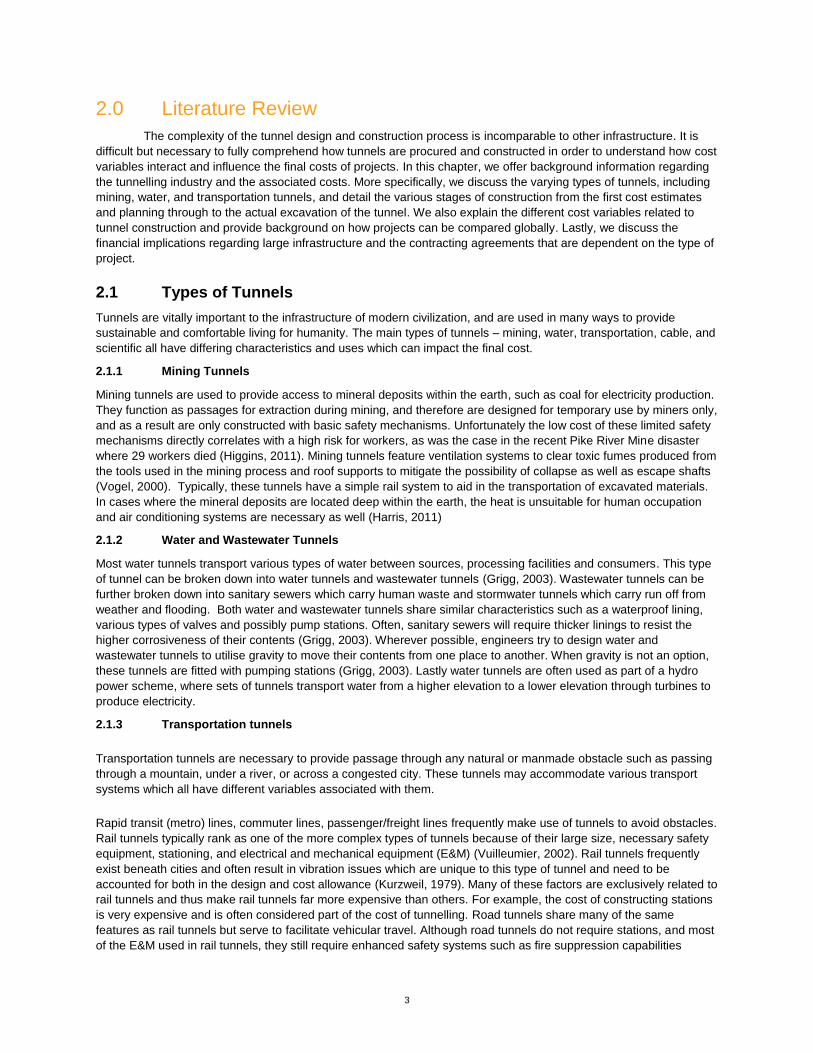
2.0 Literature Review
The complexity of the tunnel design and construction process is incomparable to other infrastructure. It is
difficult but necessary to fully comprehend how tunnels are procured and constructed in order to understand how cost
variables interact and influence the final costs of projects. In this chapter, we offer background information regarding
the tunnelling industry and the associated costs. More specifically, we discuss the varying types of tunnels, including
mining, water, and transportation tunnels, and detail the various stages of construction from the first cost estimates
and planning through to the actual excavation of the tunnel. We also explain the different cost variables related to
tunnel construction and provide background on how projects can be compared globally. Lastly, we discuss the
financial implications regarding large infrastructure and the contracting agreements that are dependent on the type of
project.
2.1 Types of Tunnels
Tunnels are vitally important to the infrastructure of modern civilization, and are used in many ways to provide
sustainable and comfortable living for humanity. The main types of tunnels – mining, water, transportation, cable, and
scientific all have differing characteristics and uses which can impact the final cost.
2.1.1 Mining Tunnels
Mining tunnels are used to provide access to mineral deposits within the earth, such as coal for electricity production.
They function as passages for extraction during mining, and therefore are designed for temporary use by miners only,
and as a result are only constructed with basic safety mechanisms. Unfortunately the low cost of these limited safety
mechanisms directly correlates with a high risk for workers, as was the case in the recent Pike River Mine disaster
where 29 workers died (Higgins, 2011). Mining tunnels feature ventilation systems to clear toxic fumes produced from
the tools used in the mining process and roof supports to mitigate the possibility of collapse as well as escape shafts
(Vogel, 2000). Typically, these tunnels have a simple rail system to aid in the transportation of excavated materials.
In cases where the mineral deposits are located deep within the earth, the heat is unsuitable for human occupation
and air conditioning systems are necessary as well (Harris, 2011)
2.1.2 Water and Wastewater Tunnels
Most water tunnels transport various types of water between sources, processing facilities and consumers. This type
of tunnel can be broken down into water tunnels and wastewater tunnels (Grigg, 2003). Wastewater tunnels can be
further broken down into sanitary sewers which carry human waste and stormwater tunnels which carry run off from
weather and flooding. Both water and wastewater tunnels share similar characteristics such as a waterproof lining,
various types of valves and possibly pump stations. Often, sanitary sewers will require thicker linings to resist the
higher corrosiveness of their contents (Grigg, 2003). Wherever possible, engineers try to design water and
wastewater tunnels to utilise gravity to move their contents from one place to another. When gravity is not an option,
these tunnels are fitted with pumping stations (Grigg, 2003). Lastly water tunnels are often used as part of a hydro
power scheme, where sets of tunnels transport water from a higher elevation to a lower elevation through turbines to
produce electricity.
2.1.3 Transportation tunnels
Transportation tunnels are necessary to provide passage through any natural or manmade obstacle such as passing
through a mountain, under a river, or across a congested city. These tunnels may accommodate various transport
systems which all have different variables associated with them.
Rapid transit (metro) lines, commuter lines, passenger/freight lines frequently make use of tunnels to avoid obstacles.
Rail tunnels typically rank as one of the more complex types of tunnels because of their large size, necessary safety
equipment, stationing, and electrical and mechanical equipment (E&M) (Vuilleumier, 2002). Rail tunnels frequently
exist beneath cities and often result in vibration issues which are unique to this type of tunnel and need to be
accounted for both in the design and cost allowance (Kurzweil, 1979). Many of these factors are exclusively related to
rail tunnels and thus make rail tunnels far more expensive than others. For example, the cost of constructing stations
is very expensive and is often considered part of the cost of tunnelling. Road tunnels share many of the same
features as rail tunnels but serve to facilitate vehicular travel. Although road tunnels do not require stations, and most
of the E&M used in rail tunnels, they still require enhanced safety systems such as fire suppression capabilities

4
(Vuilleumier, 2002). In many ways, the safety systems need to be more advanced in rail tunnels since the possibility
of a crash or fire is much higher. To account for this, road tunnels often have more frequent cross passages between
bores to let pedestrians escape, or sometimes have completely separate bores or refuges which can act as escape
passages and passages for fire fighters (Vuilleumier, 2002). Ventilation systems are also a key consideration made
with road tunnels, especially when located in a city where concerns about air quality are often expressed. These
ventilation systems are very advanced and often work in conjunction with the fire suppression systems to increase
safety. Some road tunnels utilise separate ventilation tunnels, and/or ventilation stacks which typically repurpose
shafts that were initially dug for excavation (Mashimo, 2002). These extra special requirements are characteristic of
transportation tunnels and typically result in an increased overall cost making them some of the most expensive
tunnels to build.
2.1.4 Cable Tunnels
Cable tunnels provide a means of delivering power or data from a distribution point to a client. Often times these
tunnels contain fibre optical cables to facilitate long distance telecommunication and computer networking or high
voltage electrical cables to meet the needs of growing demand in an area (Mainwaring, 2001). These tunnels may be
designed for personnel entry, but as technology has progressed utility tunnels have less need for attention and
consequently do not require human safety systems. The basic features required for cable tunnels are access shafts
for maintenance and an impermeable lining (Mainwaring, 2001). The relative simplicity of cable tunnels often results
in lower costs when compared to most other types of tunnels.
2.1.5 Scientific Tunnels
Scientific tunnels provide an underground environment for laboratories and equipment used by scientists to conduct
research and experiments. These tunnels are difficult to classify because of their rarity, and the unique requirements
for each one based on the type of experiments that the tunnels are designed for. One shared characteristic is that
these tunnels need to be constructed deep under solid rock in order to shield the experiments from background
radiation and allow for more accurate results (Lebrun, 2000). The rarity of this type of tunnel makes cost
characterisation and analysis difficult.
2.2 Tunnelling Process
Simply defined, a tunnel is any covered passageway. Yet, the process of constructing a tunnel is considered to be a
complex challenge in the field of civil engineering (Harris, 2011). The entire process of building tunnels, from the
preliminary feasibility study to the final commissioning, is a complex practice with many factors and potential issues to
address. The major difference between tunnels and other types of infrastructure is that they are underground. The
challenge when working underground is dealing with many unknown variables that can make construction difficult.
The breakdown of the tunnel delivery process is displayed in Figure 1.
Figure 1: Tunnelling Process
Feasibility Study
Planning and Design
Construction
Commissioning

5
2.2.1 Feasibility Study
The initial stage of tunnelling involves the implementation of a feasibility study, which involves site investigation (SI),
preliminary drawings, and rough cost estimates. The SI is especially important in tunnelling because all of the
construction occurs in the unknown expanse underground. In the SI, geological analysis is performed to judge what
the soil, rock types and parameters are in addition to potential risks such as faults, shear zones, ground water, and
underground services. Often a series of boreholes will be drilled in order to better assess these conditions. In the
majority of cases, the proposed tunnel will travel through multiple types of substrate and hazards, making this
process even more important. The more information that can be gathered regarding the geological aspects, the more
chance there is for avoiding delays and for obtaining more accurate cost estimates since potential issues can be
accounted for early on (Parker, 1996). During this stage a preliminary design is put together that is generally
considered to be around twenty percent complete depending on the owner’s specifications. This design begins to
address any planning issues that may be encountered and also allows for a rough cost estimate to be compiled which
is helpful to plan for and secure funding.
2.2.2 Planning and Design
As the tunnelling project advances, the feasibility study is used in order to put together various designs and also to
establish an estimate, or tender cost for the project. It is at this point that issues such as health and safety and
environmental regulations, consents, and overheads begin to be accounted for in both the design and budget. The
design will progress from a scheme design (50% complete), to a detailed design (60-80%) to a final issued for
construction (IFC) design (100%). With this final design complete, the tender cost for the proposed project can be
completed by a cost estimator who has the specialized experience working with construction costs. Throughout this
stage designers will often hold public consultations and contact various stakeholders to inform them about the design
process and lobby for support.
Depending on the owner’s preference and contract type, the contractor will typically get involved in the design
process before the drawings are IFC. The project owner will usually solicit bids part way through the design process
to either the public or a select group of contracting firms. These contractors will have a certain amount of time to
formulate their bids which are essentially representations of how much it would cost them to construct the tunnel, as
well as a complete construction schedule. The number of bids for each project can range depending on the number
of contractors available to carry out the project as well as their level of interest in the project. Typically the number of
bids ranges between two to ten for any given project. This process can be very competitive between firms, and
motivates contractors to build the tunnel for the least amount possible to maximise their own profits. More competition
in securing a bid will often result in lower prices for the tender costs. A balance exists between contractor’s profit and
the ability to be selected for the bid because typically the lowest bidder is selected by the project owner.
This is a complicated step since there needs to be a careful balance between detail and time. The plan for the project
requires enough detail for successful planning and investment gains, but if it is too specific this step can be overly
time consuming and expensive (HM Treasury, 2010).
2.2.3 Construction
After the completion of the planning phase, the project will advance to ground-breaking and construction. At this
stage there are many variables to account for. Each tunnel will have a different required set of materials depending
on its end-use and the ground type that will be encountered. The construction will require various amounts of material
depending on the length and size of the proposed structure. The ground type will also affect the linings and support
that the tunnel will need during and after excavation. All of these variables affect the overall complexity of the tunnel
and will influence the required workforce to complete the project. The excavation of a tunnel can be accomplished in
a variety of ways, including cut and cover, drill and blast, tunnel boring machines (TBMs), roadheaders, immersion, or
any combination of these methods. The method of excavation is selected in accordance with the geological analysis
completed in the feasibility study.
A cut and cover technique is a simple construction method that can be used for both urban and rural tunnelling
projects through soft ground such as clay, silt, sand or gravel. First a trench is excavated in the area where the tunnel
is to be constructed. Then the tunnel lining is constructed with a cast-in-place concrete structure. This structure is
waterproofed and then covered with the original soil up to ground level. This topsoil then needs to be compacted
using heavy vibrating rollers. Compacting has to be carefully carried out in order to avoid invoking too high a stress
on the tunnel structure below. This method is advantageous over other soft ground methods when there are

6
geological instabilities present in the soil, or when the tunnel must be constructed close to ground level, but can be
limited in urban settings (Mouratidis, 2008).
TBMs are also often used for either soft ground tunnels or soft rock where the drill and blast method cannot be
controlled. This multimillion-dollar piece of equipment has a circular plate equipped with disk cutters on one end that
act as the cutting teeth of the machine. The plate rotates as the machine advances forward and causes the disk
cutters to carve pieces out of the rock which it catches in a conveyor system. These machines can also serve the
dual purpose of supporting the tunnels as they move forward by drilling holes into the rock that workers fill with grout
and bolts to maintain the tunnels (Boardman, 1960). Short stand up time, or how long the ground can support itself
after excavation has occurred, is a common problem with soft ground tunnels and can result in cave-ins if not
properly addressed. For this reason, some tunnels are excavated using the top-heading-and-bench method. The top-
heading and bench method is when workers first dig a smaller tunnel called a top-heading then excavate below the
floor of the top-heading to create a bench. This lowers the risk of tunnel collapse and heightens worker safety. This
method is advantageous for gauging the stability of a material before proceeding in the construction. A metallic,
cylindrical piece of equipment called a shield is used to further reduce the risk of cave-ins as well by providing
temporary support to the surrounding earth. This is a temporary solution until a permanent lining of cast iron or
concrete can be installed as a lining for the tunnel (Boardman, 1960). Many TBMs have the ability to place precast
concrete, or cast iron rings into place as they continue to bore, which can increase safety and efficiency (Girmscheid,
2003). Another method of tunnelling called pipe-jacking is often used in small diameter tunnels. This method involves
using hydraulic jacks at the bottom of the shaft to push a prefabricated pipe through the tunnel behind the TBM or
excavator as it moves forward (Craig, 1983).
The drill and blast method is typically used for tunnels through hard rock and are created full-face, which involves
excavating the entire diameter of the tunnel at once. Workers use a scaffold called a jumbo to quickly place
explosives and increase safety. Drills that are mounted to the jumbo allow it to make several holes in the rock face,
which are then packed with explosives by workers. The amount of holes drilled and the type of explosive chosen
depends on the rock and tunnel type, but typically dynamite is used (Boardman, 1960). After the tunnel has been
completely evacuated, the charges are detonated and the noxious fumes are removed with a vacuum. The leftover
debris, called muck, is removed by workers in carts, after which the entire process begins again to advance the
tunnel (Boardman, 1960). The stand-up time for this variety of tunnels is usually measured in centuries and excess
support for the walls may not be necessary. Additional support in the form of bolts, sprayed concrete or rings of steel
beams could be needed though because of breaks or pockets of fractured rock. These inconsistencies could cause
potential problems if not addressed during the construction. One of the draw backs of this method is that it is not
favourable in urban conditions because of the noise and vibration associated with excavation (Ocak, 2010).
Roadheaders can also be used to tunnel through lower strength hard rock. This method can be advantageous to drill
and blast since blasting in urban locations in often restricted due to vibrations and difficulties in transport of blasting
agents (Ocak, 2010). These machines can weigh up to 120 tons which makes them stable and stiffer platforms for
excavating rock. They consist of a boom-mounted cutting head, a loading device, and a crawler travelling track.
Roadheaders also remove muck as they progress through excavation similar to TBMs. These machines have
significantly improved safety, reduced ground support requirements and require fewer personnel which make them an
ideal choice for constructing some tunnels. The main limitation of this method is that progress is often slower which
potentially results in a higher cost (Copur, 1998).
Immersion is the method used when creating tunnels underwater. First a trench is dredged into the riverbed or ocean
floor and then a tube is floated to the site and sunk in the prepared trench. These tubes are long, prefabricated
sections of the tunnel and are typically made of steel or concrete then sealed to keep water out. After multiple
sections have been placed, divers connect the sections and remove the water-tight seals. Any water that may have
leaked into the tunnel is pumped out and then the entire tunnel is covered with backfill to ensure it stays in place
(Boardman, 1960).
After, or often during excavation, the lining of the tunnel must be installed. The lining type will depend on the geology,
depth and end-use of the tunnel and it acts as both a structural support and a waterproofing layer. Traditionally,
tunnels have been constructed with spheroidal graphite iron (SGI) lining, which is a form of ductile iron. More recently
tunnels have been constructed with a cast in place, or in-situ, concrete lining, that varies in thickness depending on
the amount of structural support required (Deere, 1968). A newer technology, referred to as a sprayed concrete lining
(SCL), involves spraying concrete onto the walls of the tunnel. This can be combined with different types of
reinforcement, such as a steel mesh or some newer steel or poly-propylene fibres which are premixed with the
concrete (Austin, 1995). These linings in combination with the precast rings and pipe jacking methods detailed above
7
provide the structural support for all tunnels. Depending on the type of drainage system, some tunnels may also
require an impermeable waterproof lining which prevents the hydrostatic pressure from forcing water into the tunnel
(Deere, 1968).Tunnels fully above the water table do not have any special requirements in regards to providing
drainage, while tunnels that are partially or fully below the water table require advanced drainage systems to deal
with water permeation which is especially important for transportation and cable tunnels (Mahuet, 2000).
After the lining is secured, the final fit-out of the tunnel may commence. This varies widely depending on end-use of
the tunnel, but often includes the installation of E&M equipment, the laying of tracks or roadway, and the installation
of fire suppression and ventilation systems.
2.2.4 Commissioning
Once the construction of the tunnel concludes, all of the individual parts need to be tested and signed off. A pull out
test is often done to test the strength of supports in addition to lining thickness evaluations and waterproof membrane
checks. This series of tests confirms that the tunnel is safe to open and also evaluates all of the operation, electrical
and mechanical equipment in the completed structure. Every piece of the final tunnel and these various tests must
then be approved by the contractor, owner, and regulatory authorities before the final outturn cost of the project can
be compiled. After the completion of the tunnel there will still be costs to operate and maintain the infrastructure.
These costs will vary depending on the construction techniques, but are typically excluded from the reported final cost
of constructing a tunnel.
2.3 Cost and Variables for Each Tunnel
There are numerous factors associated with constructing tunnels, which can all heavily influence the total cost of
tunnelling. Overall, the key consideration is whether or not a cost variable will result in a statistically significant
variance across international borders. This essential consideration along with a means to measure some of the less
tangible variables is crucial in calculating the overall cost of tunnelling.
2.3.1 Geotechnical Risks and Substrate Determination
One of the largest cost factors associated with tunnel construction is determining what kinds of geological conditions
exist between the portals or shafts of a tunnel (Hoek, 1990). Modern geotechnical engineers utilize a variety of
imaging technologies and boring samples to determine rock type and groundwater penetration. These technologies
can provide an acceptable level of confidence in the type of rock that needs to be bored through, but this imaging is
neither comprehensive nor fully reliable (Das, 2006). Construction management firms will use past examples of
projects in any given region to help develop a proper percentage to allot for contingency to account for any ambiguity
in the substrate.
The indeterminacy of geotechnical imaging technologies makes the type of substrate one of the largest factors in the
variance of tunnelling costs. The ideal conditions to tunnel through are typically relatively soft homogenous rock, such
as the sandstone present around Sydney (Pells, 2002). The complexity increases when boring through gravels or
sands, because of the high permeability and low structural stiffness. Tunnelling becomes the most complex when
boring through heterogeneous substrates, such as a combination of hard rock, sands, and water pockets. This is
because it is difficult to precisely predict the regions that may cause problems, and the type of lining must be
designed to withstand all types of conditions (Hoek, 1990). Although substrate type can be a large risk to the cost of a
project, it cannot be attributed to the country where the tunnel is being constructed because of the wide range of rock
types that can exist in the same region (Kleberger 2006). It may be important to consider that some countries may
have mostly one type of rock which might make that country an outlier when comparing international substrates.
There have been cases of unexpected water penetration which have drastically increased the price of tunnelling and
severely reduced the profit for the contractor. One such case was during the construction of the Burnley tunnel, part
of Melbourne’s CityLink project. The Burnley tunnel passes deep beneath the Yarra River, and consequentially
resulted in having a very high water pressure surrounding the tunnel. As a result of unforeseen condition in the
design stage, some of the 1.8m thick concrete floor panels or inverts were lifted out of place by the water pressure,
causing the contractor to lose $154m in damages (Samuel, 2007). Problems like the Burnley tunnel cause
contractors to place higher percentage contingencies into the bid price than any other infrastructure projects. This
variance in the type of substrate present in different countries has a profound effect on the cost of tunnelling.

8
2.3.2 Locality
Location can be one of the most vital factors in the cost of a tunnel. It is easier to simplify tunnels into the
subcategories of urban and non-urban tunnels. Tunnels constructed in an urban area are often more expensive due
to a variety of factors. The purchasing of real estate and easements can cost significantly higher, in addition to the
cost of having multiple long term shaft site locations on the surface. Transportation of excavated materials, and
construction materials and equipment can be extremely challenging in a city. Often, transport equipment will have
limited hours or a weight limit while driving around the city. This often results in around-the-clock workdays to meet
these time parameters and minimise the high costs of surface level construction site overhead. Complications also
exist for non-urban tunnels such as the cost of long distance transport, or the construction of a plant nearby to
provide construction materials. Additionally, if the project is a significant distance away from the labour source, it will
be necessary to set up temporary housing and amenities for the workers or offer transportation and compensate the
workers for the cost of transit.
2.3.3 Design
The cost of designing and planning a tunnel in any given region may be susceptible to certain regulatory hurdles.
Some countries have much more stringent regulations regarding the design of infrastructure. This is necessary to
ensure that all safety regulations and the needs of the general population are met by the outcome of a project. This
process often involves many different organizations and overseeing bodies. In general, public input is also taken into
consideration through several rounds of contribution (Lieske 2008). In some countries such as the United States,
Australia and New Zealand, this process can take a significant amount of time, whereas in some less developed
countries the design process is not as highly developed and less drawn out Although some studies have tried to
quantify the amount of time that goes into the planning process, it is very difficult due to a large number of constantly
changing factors, such as contract type, government sentiment and a wide range of project types (Lenferin, 2009). In
addition to government regulation, the end-use and location of the tunnel always has a large effect on the amount of
time it takes to design a tunnel. Certain tunnels have more complicated systems which take more time to design and
approve, such as rail and road tunnels. Other tunnels may take a longer time to design due to complications with the
location, such as working in an urban environment where there are a large number of existing structures to work
around. Since the average monthly salary for engineers from the United Kingdom, Australia, United States, and New
Zealand ranged from $4,356 to $6195 in 2005 Australian dollars it is evident that the length of the design process can
have an immense effect on cost (“Engineer Salaries,” 2008).The high cost of designers combined with the variables
present in the type of planning process, end-use and location can lead to a wide variance in the costs of designing a
tunnel.
2.3.4 Health / Safety Regulations
There are various instances of health and safety regulations that can increase the cost of tunnelling. These safety
costs can be subdivided into construction costs and human safety features.
Companies are obligated to provide safety equipment and high levels of insurance. These costs may vary depending
on location, because different governments may have differing levels of worker safety regulations and also have
varying levels of enforcement. An example of a construction safety cost which must be considered is proper
ventilation, which is necessary to provide for the health of workers during construction. These costs can be very high
which often results in construction management companies making the bare minimum investment in safety required
by the regulations imposed by the government. Although these regulations have resulted in a great improvement in
safety statistics in many countries, other countries still lag behind in safety requirements (Hinze, 2008).
Additionally, there are costs associated with providing for the safety of people using a tunnel after construction. Some
of these features are dependent on the types of tunnel. In general, safety features are only necessary in vehicular,
rail and mining tunnels. These tunnels will require more portals and ventilation shafts than may be necessary during
the construction phase. One of the largest safety costs is associated with preventing and suppressing tunnel fires.
Protecting against fire involves detection and communication systems to determine the source of a fire. Tunnel fires
and smoke can spread rapidly, which necessitates fire suppression and ventilation systems. In addition, there is a
need for a means of egress and regular intervals to allow for the swift exit of individuals using the tunnel in question.
Lastly, there is a cost associated with protecting structural elements from fire so that the tunnel will not immediately
collapse in the event of a fire (Chow, 2007).

9
2.3.5 Environmental Regulations
Environmental regulations play a role in determining the cost of a tunnel as well. Some countries may have more
strict regulations which lengthen the planning process. Many countries utilize some type of a document called an
environmental impact assessment (EIA) which analyses the potential effects on the environment and can trigger
agencies to get involved in overseeing the design of a tunnel. In this case there may be costs associated with
cleanup, removal and disposal of waste products such as industrial waste and construction waste that may not
necessarily be required in other countries. Additionally, in countries that have environmentally protected regions, it
may be impossible to receive a permit to construct a tunnel in its most cost effective location (Gurtoo, 2007). This
could result in a high cost of constructing the tunnel in a different location. Other environmental issues also have
costs associated with them such as wetlands destruction and replication, and habitat destruction and rehabilitation.
Depending on the location, noise pollution may be regulated, and construction hours may be consequently limited
which would drive up costs. Lastly there are costs associated with harm to the environment by the construction
process such as unavoidable fines for air pollutants. The control measures required to mitigate against environmental
impacts may have a significant impact on the overall cost of the tunnel, and should also be considered in the planning
process in the interest of sustainability.
2.3.6 Contingencies
Although there is some variance in the way in which companies formulate bids for projects in different countries, most
international construction management firms will have a good idea of the local issues associated with bidding on a
project. Typically, due to unforeseen ground conditions that may result in delays, contractors assign a higher
contingency to tunnels than they do for other aboveground infrastructure. The differences in these methods should
not adversely affect the cost of tunnelling. However as stated above; there is some variance in the amount of money
reserved in contingency to budget for uncertainties and risks that may be greater in certain markets. Such risks can
include anything related to the design, procurement and construction of the tunnel in question (Touran 2003). This
can include be delays, failures, geotechnical issues, and natural disasters such as the incidence of earthquakes.
2.3.7 Material/Labour
The basis for estimating material and labour costs for all types of tunnels is a highly refined process and is well
practiced by companies that bid for contracts. In general, this method of estimation is fairly universal across any
international construction management companies and cost estimation companies (Xiang Gu 2010). There is an
issue with comparing data on tunnelling estimates across different contracting firms, because of a lack of
standardization in the industry. It is also important to note that methods of price index comparison between countries
can differ, and should be taken into account when using data from different sources.
Variance in the cost of materials depends on location as well. Although the variance of material costs may be
greatest when comparing international tunnelling projects, there may also be significant cost deviation between
projects located in the same country. Material costs can also vary depending on the type of tunnel because
comparing tunnel costs on the basis of unit length is impractical. For example, a water tunnel will simply require a
concrete shell, where a rail tunnel would require the shell, rails, emergency egress, lighting, fire safety systems, etc.
(Crighton 1992). In addition, the source of materials is a key factor that needs to be considered. Depending on the
local economy and market structure, materials may have to be sourced from further away which can be very
expensive. Another alternative that is often chosen for tunnelling projects is to have the contractor purchase a local
plant to manufacture the materials required for the construction of a particular large scale project.
The cost of labour and the productivity of the labour force are also significant parameters when it comes to variance
in overall costs of a tunnel. Government regulation, along with the state of the economy in a given region, can have a
profound effect on the cost of labour. Local and national governments can pass legislation requiring not only
minimum wages, but also benefits like health insurance, which over time can significantly increase cost of labour
(Riegger 2008). In addition, other factors such as the current labour market and the required education of the work
force may also be relevant. Australia and New Zealand are consistently ranked among the highest labour rates and
GDP per capita (Bureau of Labour Statistics). Given that around half of the cost associated with constructing a tunnel
comes from the cost of labour, it is evident that this parameter may be a significant source of cost discrepancies
across international borders (Presswire 2010). Because of this, some contracts elect to use migrant workers to
construct their tunnels. One such case was the construction of the Kárahnjúkar hydropower project in Iceland, where

10
the contractor set up temporary work camps and brought in a significant population of Chinese workers to construct a
dam and over 25 miles of tunnels (Bærenholdt, 2008).
2.4 Financing
Although there are many small privately funded tunnel projects which have traditional financing costs associated with
them, the majority of large scale infrastructure projects can only be financially feasible through government
sponsored partnerships. It can be very difficult to create a direct profit out of a road or train tunnel, because the
revenue made from tolls and tickets is based off of traffic/passenger estimates made before the start of the project
which aren’t always accurate and have been known to not cover the cost of constructing the tunnel. Typically, the
potential profits will not exceed the expenditures so these tunnels would not be constructed but the unaccounted for
costs of excess traffic, longer routes and lack of access can possibly make the construction of these tunnels
worthwhile. Although the inherent lack of fiscal self-sufficiency of course prompts the government’s investment, it
should be noted that this cost is transferred directly to the tax-payers. Traditionally, government investment in
infrastructure has remained steady at an average of just below 4 percent of GDP around the world. This is somewhat
higher in Australia which invests just below 6 percent of its GDP in infrastructure (Chan, 2009).
Government investment in tunnels typically comes from one of two sources, either pay-as-you-go (PAYGO), which is
public money from tax revenues, or capital-market financing, which is money borrowed from private sources such as
bonds. The breakdown of government investment in Australia in 2006-2007 is as follows, budget appropriations
(63%), government trading enterprises (GTEs) (32%) and public private partnerships (PPPs) (5%) (Chan, 2009).
Budget appropriations are funds set aside directly by legislating bodies to be used towards the construction of a
tunnel. GTEs are technically independent from government and raise investment funds through retained earnings,
government budget appropriations and borrowing. Although controversial in regard to the manner in which they are
governed, GTEs provide the ability to combat monopolies and provide services where financial risks may have
deterred private sector investment. Although PPPs only make up 5% of Australia’s infrastructure spending, evidence
suggests that the majority of large, recent tunnel construction has been procured by this method. Typically the
government will form a PPP with a private company to construct a tunnel and possibly operate it depending on the
type of contract agreement (further discussed in section 1.4.1). The government will typically provide the private
company with a grant, subsidy or tax break in return (Webb, 2002). PPPs are very controversial because of their high
transaction costs and possibly lack of competition in the bidding process. In addition, PPPs often require much higher
levels of design at the bidding stage which can draw out the bidding process, and increase costs for all the
contractors that place bids. Contrarily, PPPs can more effectively deliver tunnelling projects in a shorter timeframe,
and also extensively draw on public sector knowledge. The contractor is typically contractually obligated to provide a
tunnel which is rated to last a certain amount of time (usually 50-100 years). In addition the contractor is typically
compelled to provide any upgrades or repairs if the tunnel does not meet the required age rating at the end of the
partnership (Chan, 2009).
These financing vehicles are all surprisingly similar across most stable market governments, but the key issue with
financing transportation tunnels is that they are non-diversifiable risks. That is to say that their revenues come from a
single stream, and if the expected flow is not met once the tunnel opens there can be large problems making
sufficient revenue to continue operating the tunnel (Chan, 2009). As with any financing situation, the higher the risk,
the higher the cost of financing, which means that, transportation tunnels often have a higher cost of financing than
other types of tunnels which have a more predictable flow such as water or cable tunnels. All of the above financing
methods have very different strengths and weaknesses. Typically there is a balance of cost, risk and the time it takes
to complete a project. In general it is worthwhile to compare the breakdown of financing vehicles between different
countries to see if there is any correlation between the market price of tunnels and the distribution of asset allocation
techniques.
2.4.1 Project Delivery Methods
PPPs can be subdivided into further types of agreements between the contractor and the government which supplies
the funding. Design Construct (D&C) partnerships are formed when the government specifies how they want a tunnel
to be constructed and allow private contractors to bid on the construction of the tunnel. In this case the contractor
assumes all risk associated with design and construction and transfers the tunnel back into the government’s
ownership once completed. This is the most commonly found form of contract for tunnelling projects in ANZ. Design
Build Operate (DBO) is a similar partnership, but includes a contract with the constructor to operate the tunnel for a
specified time. Build Own Operate (BOO) is similar to DBO except the project is financed by the private sector and
11
once complete, the tunnel is operated by the same company that designed and constructed it. Build Own Operate
Transfer (BOOT) is very similar to BOO, but after a specified number of years (typically around 30), the tunnel is
transferred into government ownership. Lastly, an alliance is collaborative partnership where the contractor, a
designer, and the government agree to share the fiscal benefits and risks associated with constructing a tunnel, with
the project funded by government (Webb, 2002).
These types of agreements are very commonly used in specific types of tunnels such as road and rail tunnels. The
key difference between each type of agreement is where the risk is placed and for how long. This can have a huge
effect on the overall viability of the project and of course the final cost.
2.5 Complexity of Comparing Costs and Regulations Globally
For the purpose of analysis, tunnels are often generalised by country due to a lack of enough data to form
comparisons between different regions within a country. Although there are important cost variations within individual
countries, this classification allows for a simpler comparison between costs in individual countries and continents.
Each subdivided region within a country has its own variation on cost variables even though the applicability of the
majority of variables is dependent on country. An important variable to take into account when comparing
construction costs across international borders is the different cost of materials and labour. These can be estimated
by construction cost indices which account for the inflation in construction costs within a country. These indices have
been developed to allow for the comparison of methodology and data when forming a cost estimate for a contract.
These price indices can be measured in three different ways; by input, by output, or by seller. Input price indices
encompass the price of inputs and include the costs of wages. This method does not include changes in productivity,
increases in profitability or fluctuation of margins. As a result, this method is not fully reflective of increases in
construction costs. Output price indices measure the costs of each construction activity associated with completing a
project by taking the overall price of completed works. Seller price indices simply measure the final cost of
construction by averaging the cost paid by the owner. This can also be an issue because it encompasses some costs
that are not directly related to the construction industry, such as the cost of land, finance, and litigation.
Unfortunately, not all countries subscribe to the same philosophy, which causes problems when trying to
formulate comparisons. In addition, those data are not consistent, since some countries calculate their indices on a
monthly basis, while others calculate them on a quarterly basis. The combination of these factors makes it very
difficult to accurately compare the cost variables in construction. In addition, these indices do not include all of the
variables we are looking to compare in our study, since the indices only encompass material costs, labour costs, and
profit margins. Another issue that makes comparison difficult is that these data are not consistently secured from the
same sources. For instance, Australia’s data are derived from expenditures made by various government agencies,
while New Zealand’s data are derived from a small number of private construction firms. This is an issue because the
price the government might pay for a job can be vastly different from the price a private owner might pay for the same
job in the same country. All of these factors combine to produce somewhat imprecise cost comparison tools.
Since not all countries publish construction price indices other methods often need to be used. One alternative is to
utilise the index of a geographically, and economically similar country. Another method of comparison is to utilise
inflation factors which are based on the GDP of each country, and are widely available for every country. The
problem with this method is that it does not account for inflation in the construction industry, but rather in the country
as a whole.
Historically, Australia and New Zealand have had some of the highest cost indices when it comes to
constructing large scale civil projects. However this variation needs to be taken into account in this study so that
tunnel costs can be based off an even level not including externalities. The cost indices can be a useful tool in
incorporating complex cost data.
2.6 Previous Studies
In 2010, the United Kingdom (UK) completed a study of the varying costs of infrastructure in Europe. This review
showed that the costs of actual tunnel construction were not higher in the UK in comparison to similar European
countries, but the total costs of the projects were greater. The study concluded that the planning and pre-construction
phases of the project were the source of the heightened costs. This research looked at costs across a number of
sectors including high speed rail, railway stations, highways, tunnels, flood defences, and provides a well-rounded
example of how a cost factor such as design can influence a project budget. The UK report also listed examples of
“Best Practice” tunnels. One example was the Madrid Metro Rail. Several methods utilized in this project saved them

12
approximately 5%. First, the construction emphasized a short time program, which lasted for four years for a 56
kilometre tunnel and included the design and procurement stages. Second, there was a small management team of
public administration officials which cut back on supervision costs. Lastly, ten different lines shared overheads and
equipment for the whole Madrid network during the construction. These main advances account for the benefit of
streamlining the program and management (HM Treasury, 2010).
The British Tunnelling Society (BTS) conducted a specific cost study only encompassing tunnels. This analysis
looked at the costs of seven tunnels in the UK and 14 from Europe and investigated the various key cost drivers of
tunnelling. This study noted its limitations in lack of available data, the sources of its data, the reliability of the data,
the comparability of the data, and the difficulties of achieving a comparative cost baseline. The key tunnelling cost
drivers listed in the study included ground conditions, end use, location, third party constraints, length, diameter,
construction method, and spoil disposal. The data was also graphed showing cost per meter and cost per cubic meter
in relation to tunnel length and diameter. In conclusion, the BTS found that there was little evidence supporting the
notion that construction costs in the UK are substantially greater than those in comparable parts of Europe and
identified areas of cost escalation in tunnelling (British Tunnelling Society, 2010). A recent Danish study compared
the capital costs of various urban rail projects in Europe by route-kilometre. This study used the very simple approach
of collecting a small pool of data, converting the currencies and then comparing them on a cost/m basis. The report
concluded that the lack of accurate data was a handicap, and failed to address its initial research objectives
(Flyvbjerg, 2008). In addition to the small dataset, the main limitations of this report are that the researchers did not
remove stations from the comparison, and a significant portion of the data was for aboveground works.
There was only one previous construction cost comparison completed that included Australia. This study investigated
the last decade of public transport infrastructure projects in Australasia, ranging from 2000 to 2009. 33 public
transport modes (heavy rail, light rail and buses) were represented in the data which specifically included the
construction of major new lines and corridors, line extensions, track amplification, rail electrification, airport rail
connections and refurbishments of existing infrastructure. The data collected in the survey was scaled up to constant
2010 dollars using only Australian GDP rates, but recommended the use of construction indices in the future. It was
also concluded that further research was necessary in order to support or negate the conclusions of the report as the
data was very limited by public availability. In addition, this analysis focused on all infrastructures and further
investigation is necessary to make any conclusions specifically regarding tunnelling (Martin, 2011).
These previous studies all share several limitations. Some of these studies used various methods to account for
inflation and currency exchange. It was recommended from the majority of past research that costs be escalated with
construction price indices and that exchange rates are used from the year of the cost to make currencies comparable
in future analysis. Each one also only compared tunnels in one or two regions, whether it was Australasia, Europe,
or... A world wide comparison would add additional data points to the study and allow for a more complete analysis.
In addition, expanding the scope of the analysis would allow for more information to be compiled since it would not be
limited to one or two nations.
2.7 Summary
Evidently there are numerous variables that can affect the cost of tunnelling, and almost all of these
variables can be affected by location. In an ever-changing industry, it is not surprising that there has been a lack of
conformity in assessing the effects of a variety of variables on cost analysis. In contrast, improvements can be made
to our current understanding by the analysis of data. Utilizing existing data on tunnelling projects and integrating
those data into statistical analyses can help achieve the objective of linking the cost factors with the purportedly high
cost of tunnelling in Australia and New Zealand.

13
3.0 Methodology
The goal of this project was to provide insight regarding whether tunnel construction is more expensive in Australia
and New Zealand (ANZ) and, if so, which factors contribute to these high tunnelling costs. We accomplished this goal
by developing and expanding a database encompassing tender and outturn costs of tunnel construction and by
providing a method of comparing various international projects to those in Australia and New Zealand. The
programme we adhered to is found in Appendix C (1.1). In this chapter, we will discuss the methods used to achieve
this goal and to develop recommendations for AECOM regarding the heightened cost of tunnels in ANZ and possible
benefits of these higher costs.
3.1 Archival Research
We began this project by reading existing literature and research on the subject of costs of tunnelling projects
supplied by AECOM and our independent research. This encompassed many case studies and reports that
attempted to break down tunnel budgets and make them comparable across borders. From this literature we
ascertained some of the key drivers of tunnel costs. Using this knowledge, we completed an internet search and
archival research on tunnelling projects completed in the last 15 years in order to expand upon the tunnel database
for any of the variables that were publically available. We chose to use a 15 year timeframe in order to eliminate the
variance in cost due to the use of different technologies or the construction to very different standards. This database
was originally set up by an engineer in the tunnelling division of AECOM in order to better quantify tunnel costs and
compare various projects based on several variables (Figure 2). The database contains a general overview of
projects from the Americas, Asia, Europe, and ANZ, and is then is broken down into individual construction projects.
When available, the budget breakdowns for these individual projects were entered into the main database in separate
worksheets.
Figure 2: Variables in Tunnelling Database
3.2 Compiling the Database
We expanded upon the tunnel cost database by adding additional projects towards an overall goal of about 200
tunnels in various countries. This list was then narrowed down to the projects with the most extensive research and
most comprehensive and accurate cost data. Only projects where tunnelling was the majority of the right of way or
Components of Tunnel Database
Background
• Contractor
• Contract Type
• Location
• Urban vs Rural
• Geology
Design Inputs
• Diameter/Face Area
• Lining Type
• Excavation Type
• Length
• Depth
• End Use
Cost Inputs
• Tunnelling Works
Tender
• Whole Project
Tender
• Tunnelling Works
Outturn
• Whole project
Outturn

14
where the pure tunnelling costs could be extracted were used in the database. The information regarding these
projects was collected through publically available reports, case studies, and press releases along with confidential
internal data provided by AECOM and other contacts in the industry. The variety of locations, construction dates, and
project sizes necessitated conversion from the original costs of each project to present costs in USD and AUD per
metre and per metre cubed in order to make the projects comparable. AECOM intends to continue to update this
database in the future as new tunnels are completed.
3.2.1 Cost Conversion
In order to compare costs for nations around the world, the tender and outturn costs of each project needed to be
adjusted to account for the variance in price over time. Several different methods of price comparison were
considered, including Gross Domestic Product (GDP) deflator, Labour Cost Index (LCI), Producer Price Index (PPI),
Consumer Price Index (CPI), and various construction-based price indices. The GDP deflator accounted for inflation
as a whole for the country’s economy, which would not necessarily reflect the fluctuation in the construction industry.
The option of combining the LCI with the PPI or the CPI was also rejected based on this observation and a lack of
comparable data. We decided to move forward with construction price indices such as the Tender Price Index (TPI)
and the Construction Price Index, which best reflected how the price of materials needed to construct tunnels have
changed over time. These indices are published by individual countries, and are typically based off of the outturn
costs for common construction projects on a quarterly basis. The construction indices for each country are shown in
Appendix G (7.8): Table 7 and Table 8. Each cost was multiplied by this inflation factor to move costs to the third
quarter of 2011. This inflation factor was country specific, and the formula is shown below
The inflation factor was also multiplied by an average exchange rate for the third quarter of 2011 where applicable. All
currencies were converted to both Australian Dollars (AUD) and United States Dollars (USD). The Australian dollar
was chosen as the primary currency because of this study’s focus in Australia, and the USD was chosen because it is
the most common international comparison currency. These exchange rates can also be viewed in Appendix G: (7.8)
Table 6. A column titled inflation/exchange factor in the database was linked to a sheet with each country’s indices
and multiplied by the appropriate exchange factor. After accounting for inflation changes and converting to common
currencies, the final prices for each project were calculated in the present value estimate and present value final cost
columns in the database.
3.2.2 Distance Normalization
To account for the various sizes of projects in the database, costs were normalized by distance, and the length of
twin bored tunnels was doubled. This would theoretically allow a project spanning thousands of metres to be
compared with one that is only a few hundred. The industry standard has been to compare tunnels on a basis of cost
per meter, but we have also elected to compare the tunnels in our database by cost per meter cubed to account for
different bore sizes. The present value estimate and present value final cost columns were divided by the length of
each tunnel project in meters and entered into the present value estimate or final cost per meter length columns
respectively. These columns were then further normalized by dividing by the face area of each tunnel to account for
different bore sizes and to potentially eliminate the added costs associated with larger volume tunnels. These data
were entered into the present value estimate or final cost per cubic meter columns. These two sets of data were used
to compare tunnelling in ANZ to all of the international projects using statistical analysis.
3.3 Statistical Comparison of ANZ to the rest of the world
The finalized cost database was used in order to ascertain if tunnelling in ANZ is statistically more expensive than in
other nations. The normalized columns for estimate and final cost per meter were used in this analysis. When
comparing by region we reported values for cost per meter and cost per cubic meter. While for end use comparison
we found that the most accurate method of evaluation would be to use the cost/m data because of complications
involved in comparing cost/mᶟ, which is explained in section 4.1.5.
3.3.1 Identification and Removal of Erroneous Data
We found that the inclusion of some tunnels which included costs that were not purely related to tunnelling would
greatly skew out results. The data from these columns were graphed in a scatter plot to visually confirm the existence

15
of these data in the sets. Our solution to this problem was to run a test to identify bad data, then individually examine
the flagged data to determine if it should be omitted based on bad cost representations. We defined these data as
any cost/m which was outside of the fences derived from the following equations.
Where Q1 and Q3 represent the 25th and 75
th percentiles, respectively, of each separate dataset and IQ represents
the interquartile range which is defined as the upper quartile minus the lower quartile. The factor 3 is used to identify
the outer fences, while the factor 1.5 is used to identify the inner fences. For our analysis 3 was selected so that only
the extremes would be flagged (NIST/SEMATECH, 2012). As a result we would not remove any mildly expensive
tunnels that could potentially represent valid data. To perform this analysis we plotted the estimate cost/m and final
cost/m and separate box plots and set up upper and lower fences based off of the aforementioned equations to
exclude inaccurate data. An if-then test was written in Microsoft Excel to output a 1 if the value of a cost was greater
than or less than one of the fences, or 0 if it was within the boundary conditions. Each flagged outlier was then further
researched to categorize why it should be removed or kept. Tunnelling works with a substantial amount of other
works, lack of construction-based indices, or inaccurate dimensions for costs per cubic meter were excluded from our
statistical analysis. If there was no support for removing the flagged data, then the data was kept in the analysis. We
deemed this procedure necessary since the outlying costs were not evenly distributed across regions and could result
in one country appearing much more expensive than others. By removing these data from the set, we could remove
any costs that potentially included non-tunnel construction which were not comparable to others. This can be a risky
assumption to make, but it was a necessary step to take in order to qualify such a small dataset with such a high
variance.
3.3.2 Data Analysis
An unpaired, two tailed T test was completed in Microsoft Excel to determine if there was a statistical difference in
cost for the projects in ANZ compared to those throughout the rest of the world. The T-test either rejects or fails to
reject our null hypothesis (Ho), which was defined as: there is no statistical difference between tunnelling costs in
ANZ and those in the rest of the world. The ANZ costs versus the rest of the world costs for tunnelling will be used as
our two data sets. This test was selected because it compares the differences in means between two groups
(StatSoft, Inc., 2011). This allows us to account for variation within groups and exclude it from the analysis, which
was a major concern. A two-tailed test was selected since prior to the analysis as we did not expect one cost to be
greater than the other. An unpaired test was chosen because the samples were independent and contained different
sets of individual subjects (Lowry).
We rejected or failed to reject the null hypothesis based on the outputted p-value from the T-test. This value
represents the probability of error involved in rejecting the hypothesis of no differences between the two categories of
observations in the population. A higher p-value corresponds with less reliability in a result. For example, a value of
0.05 indicates that there is a 5% probability that the relation between the variables found in our sample is due to
random chance. This means that the results of our analysis could be replicated 95% of the time. Customarily, in many
areas of research, the p-value of 0.05 is treated as border-line acceptable error level. For this reason, we have
selected 0.05 as our critical value (StatSoft, Inc., 2011). If the calculated number resulting from our T-test is below
0.05 then the null hypothesis is rejected, while if the value is greater than 0.05 we fail to reject the null hypothesis
(Lowry). The T-test of ANZ versus overseas was then followed up by comparing ANZ to Europe, Asia, and the
Americas respectively. The first testing separated tunnels only by region into ANZ, Europe, Asia, and the Americas.
This wide range of data was then refined to compare tunnels by region and end-use and end-use and location type.
For all data sets, the means and standard error were reported and illustrated graphically.
3.3.3 Estimate to Final Price Comparison
The percentage increase from the tender cost to the outturn cost was also calculated by the below formula when
there was sufficient information:
16
This provided a method for comparing how cost was escalated or lowered for various projects, and identified data
that required further investigation for where there was a large gap between the two costs. In addition, this statistic
was compared between ANZ and the rest of the world in order to ascertain if cost escalation or savings was location
dependent.
3.4 Assessing the Position of the Tunnelling Industry
3.4.1 Interviews
In order to better understand the process of compiling costs and the possible cost discrepancy between ANZ and
other nations, we set up various interviews with contractors, cost estimators, and consultants from the tunnelling
industry. The questionnaires used can be found in Appendix D: (7.5). Depending on the background of the
interviewee, different interview questionnaires (forms) were used to acquire their knowledge. Form A was used with
all people interviewed and provides a brief explanation of our project along with some general background questions
about the interviewee’s experience. Form B focused on cost estimators and entailed questions about how a tender
price is put together and how this cost is broken down. Form C was directed at contractors and focused on questions
regarding how prices change throughout the tunnelling process and how final costs compare to estimated costs.
Form D was aimed at consultants and asked questions concerning how the design process is carried out and the
various costs that could be associated with it. All of the interviewees were asked if there were any specific cost
drivers that they believed escalated costs in ANZ and where they believed the greatest potential for cost reduction
was. If the interviewee had global experience, then they were questioned about if they felt tunnels in ANZ were more
expensive than the rest of the world and if so, whether there were any benefits to the higher cost. The information
gathered from these interviews was used to direct further research of tunnel projects, determine the major cost
drivers of tunnelling costs, and contribute to decisions as to how to break down and analyse the cost variables in the
database. Each interviewee was also individually ranked according to their international tunnelling experience by
each person who participated in each interview. The average ranking scores were used to weight their quantifiable
answers. Tunnelling experience was classified by both the amount of years they worked in the industry as well as
what extent of global experience they had.
Some of the potential risks we encountered during these interviews were protecting employee opinions and making
sure our results were unbiased. We accomplished this by wording our questions in a non-leading way and also
providing full confidentiality for all research subjects by not publishing any identifying information about the research
subjects. Knowing that confidentiality can be compromised by means other than reporting an interviewee’s name,
position, company or experience and information disclosed could reveal an identity to an interested knowledgeable
reader. We sent out all interview minutes which included statements that could potentially be used in the final paper
for approval which also ensured we were accurately representing how an individual feels. The ranking system was
also kept confidential, with only the final results displayed instead of the individually weighted numbers; therefore, it
would be impossible to identify a ranking with a specific employee.
3.4.2 Surveys
The qualitative information gained from interviews was supplemented with quantifiable data from a brief survey. The
questions in this survey varied depending on whether the respondent was a cost estimator, contractor, consultant, or
client and whether or not they had global experience. The set of questions asked in the survey can be found in
Appendix E: (7.6). These questions focused on whether or not the respondent believed tunnels were more expensive
in ANZ, how he or she would rank a list of cost factors regarding how they affected tunnel costs and the potential for
cost savings. The survey was compiled using Davis Langdon’s preferred survey software Zoomerang, which hosted
the survey online. The survey link was emailed to all people we interviewed and was also directly sent to another list
of tunnelling contacts in Australia and New Zealand that we accumulated from various sources with the hope that
they would pass the survey on to other contacts. The software then compiled all responses and comments in an
Excel spreadsheet for analysis
3.4.3 Analysis
Qualitative information from completed interviews along with quantitative results from surveys were used to support
or reject the above mentioned claim regarding if tunnels are higher priced here in Australia. The quantitative
information acquired from the survey was graphically analysed on the basis of the respondent’s profession, while the
qualitative directed further international research towards specific key drivers. These drivers represented areas of
cost escalation or cost savings and were further investigated to provide recommendations for ANZ.

17
3.5 Tunnel Case Studies
After the completion of the statistical analysis of the tunnelling database and interviews and surveys within the
tunnelling industry, we compared the individual cost breakdowns of relatable projects. Tunnels were matched for
comparison based on cost type, end-use, excavation type, locality, and contract type. We selected 7 similar case
studies in the database to analyse the pure TBM tunnelling costs including the cost of excavation, lining, and
contractor’s overhead, while eliminating all other unrelated costs. These tunnel projects were then compared across
different countries to analyse the factors that may go into variance in price, and where higher or lower costs may
come from. Information from interviews and surveys were used to support or negate these claims. These conclusions
from the above methods helped focus our research on how ANZ can reduce tunnelling costs for specific key drivers
and helped provide recommendations based on other countries’ practices. This information was also assimilated to
assess any possible benefits resulting from potentially higher costs in ANZ when applicable in order to possibly
provide reasoning for a higher cost in Australia.

18
4.0 Results and Analysis
This chapter begins by describing the finalised tunnelling cost database and progresses through several statistical
and graphical analyses of the assembled price information. From these tests and graphs, ANZ’s tunnelling costs are
compared to the rest of the world. This quantitative data analysis is then supplemented with discussion of our
interviews and graphs of survey responses. A case study is examined in which the pure tunnelling costs were
compared across several projects. Based on these findings, the validity of comparing ANZ as one entity to the rest of
the world is then debated, and Australia’s position for several key cost drivers was further investigated and reported
on.
4.1 Tunnel Database Analysis
After the original data collection, the tunnelling cost database encompassed almost 200 tunnels in 36 different
countries. This number was narrowed down to 158 tunnels in 35 different countries, including Australia, New Zealand,
United States, United Kingdom, Singapore, China, France, Mexico, and various others. The full listing is shown in
Appendix H (1.1), and the breakdown by region is shown in Figure 3.
Figure 3: Tunnel Breakdown by Region
Of the total 158 tunnels, 67 had estimate costs, 64 had final costs, and 27 had both. Figure 4 shows the breakdown
of costs in the database.
Figure 4:Tunnel Breakdown by Cost Type

19
Each tunnel also was broken down into its end-use type. These ranged from cable, sewer, and water tunnels to road
and rail tunnels. The main focus of this study was on rail and road tunnels because of their complexity and high costs.
There were also a few examples of mining tunnels and combined end-use tunnels. Figure 5 below displays the
percentages of each end-use in the overall database.
Figure 5: Tunnel Breakdown by End-Use
All costs were then converted to Australian and United States dollars for the third quarter of 2011 using the indices
displayed in Appendix G (7.8). All tables in the main report are displayed in AUD, while USD versions of the tables
are displayed in Appendix I (7.10).The construction price indices that were used to account for inflation did not
specifically encompass tunnelling materials, but rather construction industry materials and labour as a whole. This is
not the ideal method of accounting for changes in prices in the tunnelling industry, but there are not a sufficient
number of tunnelling price indices that go back 15 years to account for all of the tunnels in our database and the
complexity of establishing a tunnelling index would be beyond the scope of this report. Some of the dates for
estimates and final costs were also estimated based on newspaper articles and other publically available sources.
These non-exact dates could adversely affect the method used to account for inflation.
These compiled estimates and final costs for Australia and for the rest of the world were then graphed in a box plot
with fences as shown in Figure 6 and Figure 7 respectively. Any data points outside of the fences were deemed to be
potentially erroneous data, and were flagged for review. It is vitally important to review these flagged data because
they may contain valuable information and should not be removed unless there is a plausible explanation for why
they appeared. In this analysis, many of the costs we accumulated came with no breakdown or description of what
the cost encompassed. Factors such as operating and maintenance fees or rolling stock could have been included
without our knowledge. These are factors that we specifically removed from any costs that were separated into
various cost categories. Furthermore, a single extremely high cost project could greatly skew our cost comparison. If
one project is greatly increasing the mean of our set of numbers then our comparison would be flawed. These higher
points were further investigated in our case-study analysis. Based on this reasoning, we found it relevant to remove
these points if they represented either poor data points or data that should not be included in this analysis.

20
Figure 6: Box Plot of Estimate Costs (AUD)
Figure 7: Box Plot of Final Costs (AUD)

21
4.1.1 Costs of Tunnelling by Region
All cost information was broken down by region and according to whether it was an estimate or a final cost. These
numbers were then converted to cost per meter and cost per cubic meter. The averages for each region and the
standard deviations were reported in Appendix I (7.10). The estimates and final cost averages for cost per meter and
cost per cubic meter were then graphed by region, and standard error bars were used to illustrate the range in data
(Figure 8 and Figure 9).
Figure 8: Regional comparison of cost/m
Figure 9: Regional comparison of cost/m3
* Asia costs include one tunnel from South Africa

22
Figure 8 illustrates that costs per meter in ANZ appear to be lower than the rest of the world for estimates but slightly
higher when compared to final costs, which supports the current sentiment in ANZ that tunnelling is more expensive
even though it is only the outturn costs are more expensive. Costs per cubic meter are higher than the rest of the
world for both tender and outturn costs (Figure 9). Note the very high standard error bars for all values. The
overlapping of these error bars shows that there is no statistical difference between the data even though the
averages differ. This represents a large range in data which may be a result of the many variables not accounted for
in this analysis. The data suggests that Australia and New Zealand should not be grouped together since there is
such a wide variance between the final costs per meter. This analysis rejects the viability of future shared analysis,
and this stance is supported by the findings from the interviews we conducted.
4.1.1.1 T-test Analysis
Table 1 below displays the reported P-values for statistical T-tests that were completed. Additional T-tests comparing
ANZ to the rest of the world are shown in Appendix I (7.10). No significant difference was found between the means
of costs meter and per cubic meter for Australia and those for the rest of the world. The reported p-values for these T-
tests were greater than 0.05 so we failed to reject our null hypothesis that there is no statistical difference between
the two data sets. Although the mean for final cost per meter in Australia appeared higher than the rest of the world in
Figure 8, this test shows that there is no statistical difference between the two data sets. This could be a result of a
large range in costs in the dataset, or an inadequate quantity of tunnels.
Table 1: Reported T-Test Results for Estimates and Final Costs by Region
Estimates (AUD) Final Cost (AUD)
Comparison Cost/m Difference Cost/m3 Difference Cost/m Difference Cost/m
3 Difference
AU to Rest of the
world 0.1323 No 0.117 No 0.619 No 0.367 No
AU to Europe 0.012 Yes 0.313 No 0.337 No 0.059 No
AU to Americas 0.291 No 0.587 No 0.895 No 0.879 No
AU to Asia* 0.736 No 0.030 Yes 0.907 No 0.767 No
* Asia costs include one tunnel from South Africa
A possible way to narrow down this large range would be to evaluate tunnelling costs by other major cost drivers as
well as by region. It is also important to note that according to the T-test, estimates per meter in Australia are
statistically different than those in Europe, and estimates per cubic meter in Australia have a statistical difference
from those in Asia. As seen in Figure 8 and Figure 9, the average estimate cost per meter in Europe is higher than
that of Australia, and the average estimate cost per cubic meter in Asia lower than that of Australia. The data set for
the European estimates could have been affected by the large percentage of road and rail tunnels. As can be see
below in Figure 10 and Figure 11, end-use is distributed between cable, water, sewer, road, and rail for Australia and
Asia, but Europe contains majorly rail and road tunnels. The higher costs associated with constructing these tunnels
would be a possible explanation for why tunnels in Europe appear more expensive than those in Australia. Tunnelling
in Asia, on the other hand, appears to be less expensive than that in Australia. Possible explanations for this were
explored in interviews and surveys and reported below in section 4.2.

23
Figure 10: Europe End-Uses Tunnel Breakdown (left) and ANZ End-Uses Tunnel Breakdown (right) - Estimates
Figure 11: Asia End-Uses Tunnel Breakdown - Estimates
One limitation of using a T-test is that it operates under the assumption that the two samples are randomly drawn
from normally distributed populations and that the measures of which the two samples are composed are equal
interval (NIST/SEMATECH, 2012). The compiled data was mostly taken from publically available information which
could skew our sample population. This test also assumes that the numbers are directly comparable which, for some
tunnels they may not be, and this could also alter the result.
4.1.1.2 Percentage Increase, Estimate to Final
The below Table 2 shows the percent change from estimated costs to final outturn costs. This table helps explain the
divergence with Australian costs between estimate and final costs when compared internationally. Clearly this cost
escalation is not present in New Zealand, which helps confirm the theory that Australia and New Zealand should not
be co-analysed because of potentially different cost factors. A similarly large increase between estimate and final
costs can be clearly seen with tunnels in the Americas. European and tunnels seem to come out under their intended
budgets, which is notable since tunnels in Europe were by far the most expensive in the estimate table and were also
statistically more expensive in estimate cost per meter than Australia. This analysis suggests that contractors in
Europe have a better sense of final costs when placing bids. Another possible explanation is that tunnelling
companies in Europe better account for inflation and financing changes during the life of the project, but this area is
not encompassed in our study and merits further research. Asia also experiences similar decreases in project costs
from estimate to outturn. Note that this data is very limited as both estimates and final costs were difficult to find
during our research and is displayed in the number of projects column.

24
Table 2: Percent Increase, Estimate to Final Cost
Regional Comparison
Country Number of Projects Average Percent Increase
ANZ 9 33.29
Australia 7 43.92
New Zealand 2 -3.90
Rest of the World 13 -15.42
Europe 6 -9.05
Americas 2 9.30
Asia* 5 -37.92 * Asia costs include one tunnel from South Africa
4.1.2 Costs of Tunnelling by End-Use and Region
Tunnel costs were then compared by both end-use and region. A T-test was done to assess if any of the different
end-uses were statistically similar and could be combined for our analysis. The results are shown below in Table 3.
Table 3: T-Test Comparing End-Uses by Region
Reported P
Values Estimates (AUD) Final Cost (AUD)
Comparison Cost/m Difference Cost/m3 Difference Cost/m Difference Cost/m
3 Difference
Road to Rail 0.144 No 0.2685 No 0.541 No 0.053 No
Water & Sewer
to Cable 0.162 No 0.781 No 0.329 No 0.397 No
Transportation to
Utility
1.80E-
06 Yes 0.306 No 0.0338 Yes 0.357 No
As can be seen in the table, no statistical difference was found between road and rail tunnel costs, nor was there a
statistical difference between cable, sewer and water tunnel costs. A statistical difference was found between
transportation (road/rail) tunnels and utility (cable/sewer/water) tunnels. The complexity and added features of
transportation tunnels may attribute to this difference. This grouping is both statistically acceptable and necessary in
order to be able to compare the data with fewer variables. These groupings are also reasonable because road and
rail tunnels have many of the same features after rolling stock and stations have been removed, and cable, sewer,
and water tunnels are also very similar with only small differences in lining types.
The analysis that compared tunnels by end-use did not utilize the cost per cubic meter data. As seen in the above
Table 3, the T-test results were not consistent and these items could not be grouped together as they were with cost
per meter. This is the result of inconsistencies derived when dividing by the different face areas of the tunnels and as
a result would only partially account for the large cost differences between these two categories of tunnels.
The averages for each region and end-use were calculated and graphed. Standard error bars were used to represent
the variance in the sample mean based on the sample size in a 95% confidence interval using the following equation:
√
The z-value for a 95% confidence interval is 1.96, and n represents the sample size. Overlapping standard error bars
show that the data is similar, but non-overlapping error bars do not necessarily mean there is a statistical difference in
the data sets.

25
Figure 12: Transportation Tunnels Cost Comparison
* Asia costs include one tunnel from South Africa
Figure 12 displays the means with standard error bars of estimate and final costs per meter of transportation tunnels
by region. It is apparent from this graph that estimate costs for constructing these tunnel types in Australia are slightly
higher than those in the rest of the world, specifically in Asia. Some of the possible reasons for this are described in
Section 4.2. The high average estimate cost in Australia compared to New Zealand should also be noted. Since the
data was very limited for New Zealand road and rail tunnels, there is no statistical difference between the data sets,
but it is worthwhile to note the variation in support of our claim that Australia and New Zealand should not be placed
in one cast category. The final cost information further supports the conclusion that Australia is more expensive to
tunnel in than the rest of the world. Australia’s final costs per meter appear much more similar to the Americas and
higher than Europe or Asia, while the cost for final tunnels in Europe is much lower in comparison. For these tunnels,
no examples from New Zealand were present in our database so all conclusions must be made solely between
Australia and other countries from this graph. A T-test showed no statistical difference between the averages for
Australia and the rest of the world, but this could be due to the limited data set resultant from breaking down the
projects into end-use and region. The number of tunnels in each category, averages, standard errors, and T-test
information can be viewed in Appendix I (7.10).

26
Figure 13: Utility Tunnels Cost Comparison
* Asia costs include one tunnel from South Africa
The above graph, Figure 13, illustrates the means with standard error bars of the estimate and final cost per meter for
utility tunnels. This graph contrasts the transportation tunnels graph and shows that costs for cable, water, and sewer
tunnels in Australia are slightly lower or very similar to tunnels in the rest of the world. It is interesting to note that
these tunnels have more expensive estimated costs in Asia, where usually costs are very low. In addition, costs in
Australia and New Zealand are extremely similar for estimates. One possible reason for this is that both countries
have experience building this type of tunnel and there is less complexity in putting together an estimate for a cable,
water, or sewer tunnel than there is for road and rail tunnels. The final cost information agrees with the previous
conclusion that constructing utility tunnels in Australia is slightly less expensive than the rest of the world, and very
comparable to Europe, Asia, and the Americas. The cost discrepancy between Australia and New Zealand supports
the theory that the two should not be compared together as ANZ. This range may be accounted for by the large
standard error in the New Zealand data set. In our database, New Zealand only had two final costs for these types of
tunnels, one of which was a high-cost hydro tunnel and results in a high variance in the data.

27
4.1.3 Costs of Tunnelling by End-Use and Locality
The transportation tunnels and the utility tunnels from every country were each separated according to locality (urban
vs. rural). The average costs per meter for urban and rural tunnels were then reported and graphed with standard
error bars in Figure 14 and Figure 15.
Figure 14: Locality Comparison - Estimates
Figure 15: Locality Comparison – Final Costs
As seen above, for transportation tunnels it appears that there is no significant difference between urban and rural
costs per meter for both estimates and final costs. It is important to note that although the urban costs appear
consistently higher, the range of the error bars makes this inconclusive. Lastly, for utility tunnel costs, it appears that
urban tunnels average expensive, but the extra expense is not statistically relevant due to the error bars. This shows
that the cost differences attributed to this variable are not significant in comparison to other cost drivers; therefore, it
is not necessary in our analysis to compare tunnels by locality, but the differences should still be kept in mind.

28
4.1.4 Tunnel Component Breakdown
A selection of tunnel cost breakdowns, based on available data, were calculated as a percentage of the total cost of
tunnelling and graphed below. Figure 16 shows the averaged breakdown of four different international road tunnels,
along with a second chart showing the average breakdown of five different international rail tunnels. Similarly, Figure
17 shows the average breakdown of five different utility tunnels, encompassing sewer, water and cable.
Figure 16 Road tunnel cost composition breakdown (left) and Rail tunnel cost composition breakdown (right)
Figure 17 Utility tunnel cost composition breakdown
The above charts provide a baseline for evaluating the key differences between constructing different types of
tunnels. Although there wasn’t sufficient data to obtain an international comparison, this data can assist in future
analysis because it details the key costs such as excavation and P&G, and the insignificant costs such as lining and
some of the fit-out. The difference in the P&G between the road and rail tunnels may be attributed to the wide
definition of what falls in that category, as well as the small dataset. Additionally, the utility tunnels are strongly
influenced by the inclusion of a cable tunnel, which drastically increased the average M&E cost.

29
4.1.5 Limitations of Cost Data
The limitations associated with these data include that the majority were only publically available information and as a
result many costs do not have breakdowns or explain which items were specifically included in the price. For our data
collection, we accepted information on costs for tunnels as long as the majority of the works was in tunnelling. In the
database we have separate sets of columns for pure tunnelling costs, and for total project costs. Total project costs
often included sections of road, rail or bridges. These issues make cost comparison very difficult. We attempted to
remedy this by removing he costs for aboveground road, aboveground, and bridges from the data, but this may not
have removed all problematic data points since full cost breakdowns were not always available. It is safe to say that
this practice has raised the average costs for each region by a small amount. Our assumption is that given the
quantity of tunnels in each region, the variance between these higher costs is negligible. The data used were also
reduced in number by public availability as many project costs from more recent projects have not been released
from the private sector. One of the reasons for this is that contractors are hesitant to publish data for the most recent
seven years in order to maintain their competitive edge in the market, and also because after seven years it is much
harder to become hindered in litigation resultant from falsified data. Accordingly, cost data sourced from contractors
was of questionable quality. We believe this because contractors often modify their costs by removing some partially
related costs to make it seem like they met the budget on projects that they went over on. Lastly, our combined
estimate and final cost data was limited because a number of projects in the database are still under construction and
do not have final costs associated with them yet.
4.1.6 Limitations of Non-Cost Data
There are many limitations with the sourcing and analysis of non-cost data. One limitation involves using the diameter
of tunnels for normalization. Reported tunnel diameters often did not characterize the measurement as an inner or
outer diameter and for several other projects the face area had to be estimated based on number of lanes and height
requirements. For cut and cover and drill and blast excavated tunnels, a diameter measurement is often not
representative of the work or is not available. This would make the cost per cubic meter measurement for some
tunnels inaccurate. Similarly the amount of cross passages, shafts, and station excavations were inconsistently
included in the total bore lengths. When available, we noted the number and size of these additions, but often this
information was not publically disclosed. Similarly, it was often difficult to quantify the exact ratio of excavation types
in a project and therefore it was problematic to analyse the cost per meter cubed for each excavation segment.
Another potential limitation is the lack of comparability between different projects. We completed the analysis on the
basis that our sole variable was the location of the tunnels and end-use, this method does not account for an uneven
distribution of different factors within continents. We accounted for this by selecting specific tunnels with
comprehensive data to compare to similar projects in other countries as case-studies. In addition, we compared the
globalised cost of selected variables to get a basis for which variables influenced tunnel costs the most regardless of
location.
4.2 Interviews and Survey Results
4.2.1 Interviews
Although our interviews followed different patterns depending on the role of the interviewee in the tunnelling process,
we still received relatively consistent responses to the questions common across the different questionnaires. The
interviews were structured in such a way as to gauge the interviewee’s position and experience in the industry, then
determine their opinion on the main cost drivers for tunnels, ask them whether or not they agree with that the
perception that tunnelling in ANZ is more expensive, and finally determine where they think cost reductions are
possible. We interviewed a total of 11 people, two cost estimators, four contractors, and five consultants (Figure 18).
It is important to note that after we conducted our first few interviews we determined that Australia and New Zealand
should not be considered a single entity in our questions, so we decided to focus more on the costs and factors in
Australia compared to the rest of the world.

30
Figure 18: Interview Breakdown
4.2.1.1 Interview Responses
Invariably, almost every interviewee thought that the key cost drivers were some combination of the cost of labour,
bidding, and/or market structure. In addition they also consistently discounted the possibility of some other cost
drivers being relevant.
Geology was often a key concern by the interviewees when it came to discussing cost escalation over the life of the
project. Most responses indicated a need for more comprehensive site investigation but mentioned the reluctance to
spend money doing this in the feasibility stages of a project. It should be noted that no respondents characterised
Australia as having more difficult geology for tunnelling. In particular, some indicated that tunnelling in Asia was much
more geologically complex and certain parts of Australia, such as Sydney, are some of the easiest places to tunnel.
Labour was the key factor that mentioned by every interviewee. It is evident that labour costs in general are regarded
as more expensive in Australia. A few different reasons were given to explain this cost escalation. The first distinction
was that the cost of engineers and consultants was not the key labour cost, because of relatively average salaries
and the small ratio of the project devoted to design. We were told that the main labour costs were associated with the
workers who actually construct the tunnels. We were given two main explanations for this from different interviewees.
The first was that in order to compete with the mining tunnel workers, the contractors must give them a significant
amount of overtime per week. The high cost of overtime combined with the fact that most tunnels need to be
excavated 24 hours a day to meet schedule results in very high labour costs. Secondarily, the unions have an effect
on the wages paid to the tunnelling workers. It is difficult to do anything without the consent of the unions, whose
policies can vary depending on the state in Australia. One interviewee noted that overseas there are efforts to
significantly reduce the number of workers required to run TBMs and work in precast plants, which is promising for
cost reduction, but merits further research.
Health, safety and environmental regulations were not cited as a possible cost driver for several reasons. Many
international construction companies utilise in-house regulations no matter where in the world they work. Additionally,
some respondents noted that Australian standards can lag behind European standards, and New Zealand standards
can lag behind both.
Materials, plant and equipment were also not cited as a source of higher costs. Tunnelling materials have similar
costs around the world and the differences in cost are not very pronounced. In most cases in Australia, plant and
equipment for tunnelling is sourced from overseas so the only increased cost would be shipping which is typically
negligible.
Public and government support were also cited by some interviewees as a possible explanation for high tunnelling
costs in Australia. A change in government backing can delay or even cancel projects, resulting in cost overruns. It
was also noted that often a project that lacks support from the public will not have high usage. This can adversely

31
affect projected toll incomes and injure the financial status of the owner of the tunnel. Based on this finding, it appears
important to secure both government and public support early on for any tunnelling project.
Market structure was a key concern mentioned by some respondents. Contractors from Australia claimed that the
market here was very competitive, while conversely, consultants and cost estimators stated that there was extremely
limited competition in Australia. The problem seems to stem from the small size of the market. Leighton Holdings,
which encompasses John Holland, Thiess, and Leighton Contractors often ends up bidding against itself on many
contracts. Other contractors with the capacity to complete large tunnelling projects include Baulderstone and
Transfield, and McConnell Dowell has the capacity to complete smaller tunnelling projects. Typically there are 3-4
bidders for any contract, but the size of these contracts often necessitates the use of joint ventures between the
already sparse numbers of contractors. Most non-contractor interviewees felt that there was too much comfort in the
way these contractors operate their businesses, and thought their complacency was possibly a cost issue.
Contract types were often brought up as a possible component of high cost. The focus of our questioning was on
PPPs, which most respondents admitted were utilised in most large tunnelling projects in the last 15-20 years. Each
respondent had his or her own opinion on the role of PPPs and their sustainability as a project delivery device, but
the prevailing opinion was that they have both advantages and disadvantages. The key benefit is that PPPs result in
an expedited start to a project, where there is less chance of projects getting sidetracked after major political
changes. The disadvantage of PPPs is that it puts the risk of the project in the private sector instead of the public
sector as most people believe it should be. This increased risk along with the fact that private companies cannot
obtain bonds and financing at the same low rates available to government results in greater final costs for the whole
project.
The mention of the high cost of bidding in Australia as an impact to final costs seemed to be a common theme among
the responses from interviewees. The PPP contracts that are frequently used in Australia require a high level of cost
certainty and result in higher design specifications during bidding. As a result, bidding costs have been quoted as
high as 30 to 40 million dollars per contractor. This cost can be completely lost when they are not selected as the
winner of the bid, so this lost money needs to be recouped by subsequent projects. This cycle results in an increase
in the cost of every large project approximately equivalent to the combined cost of bidding for all the losing
contractors. Although all international bidding necessitates this added cost, the extremely high cost of compiling bids
in Australia tends to lead to a significantly larger increase.
We received a fairly mixed response after asking if he or she believed that the cost of constructing tunnels in ANZ
was more expensive. The most common response for this query was that they were unsure. This was to be expected,
and confirms the importance of this research area. We posed a follow up question to those who thought that
tunnelling in ANZ was more expensive than the rest of the world, which was whether they thought there was any
benefit to the increased costs. Every respondent said that there were no benefits to the increased cost, and the
response that we received from others was that tunnels are generally built to the same standard globally.
Throughout all of our interviews we were told that the main area in which cost savings can be made is the design
stage. Other stages of the procurement and construction process are fairly well refined and are quite lean since the
scope of the project is fixed at this point. This does not mean that the design process is not refined, but at this time
big picture decisions can be made which can potentially save a lot of money over the life of the project. Choices such
as the alignment, shaft location, material use, and a number of other properties can affect the final cost significantly.
Other interviewees indicated that during this stage there were often cost overruns associated with changes in the
scope. These major changes can possibly be attributed to the naivety of clients in Australia. Several international
correspondents indicated that clients tend to know what they want more in other parts the world than they do in
Australia.
4.2.2 Surveys
We received 54 complete or partial responses to the online survey sent out as of the 22nd
of February, 2012, the
collated responses can be seen in Appendix F (7.7). The assortment of the respondents’ roles in the tunnelling
process and the variety of end-uses that the respondents have experience working on are summarised in Figure
19.The breakdown of the regions in which respondents have delivered projects is shown in Figure 20.

32
Figure 19: Survey Respondent Breakdown by Role (left) and Survey Respondent Breakdown by End-Use (right)
Figure 20: Survey Respondent Breakdown of Experience by Region
As seen in the above graphs, we received a good proportion of responses from each role, as well as an excellent
distribution of responses from individuals who have worked on the main four types of tunnel end-use. Lastly the
regional distribution is more heavily oriented in ANZ, but has a good starting place in many other regions which will
help provide international perspective. The following chart (Figure 21) displays the sentiment of the survey
respondents as to the influence of eight different cost factors on final cost.

33
Figure 21: Survey Response Distribution for Contributors to Final Cost
As seen in the above chart, geology and excavation type are the primary choices for cost factors. This is good to
keep in mind when pursuing analysis. For example, given the choice, it would be prudent to choose to ignore the
effects of depth in favour of geological factors. It is also interesting to note the sentiment by cost estimators and
contractors that end-use does not have a very high correlation on the final cost of tunnelling. The final interesting
result from this analysis is the emphasis that clients put on the type of contract when compared to the remaining
parties. This is probably because of their familiarity with the issues related to contract agreements, whereas their
peers may not be as involved and are resultantly less informed. The next chart (Figure 22) shows potential cost
reduction opportunities in 11 different areas.

34
Figure 22: Survey Response Distribution for Cost Reduction Opportunities
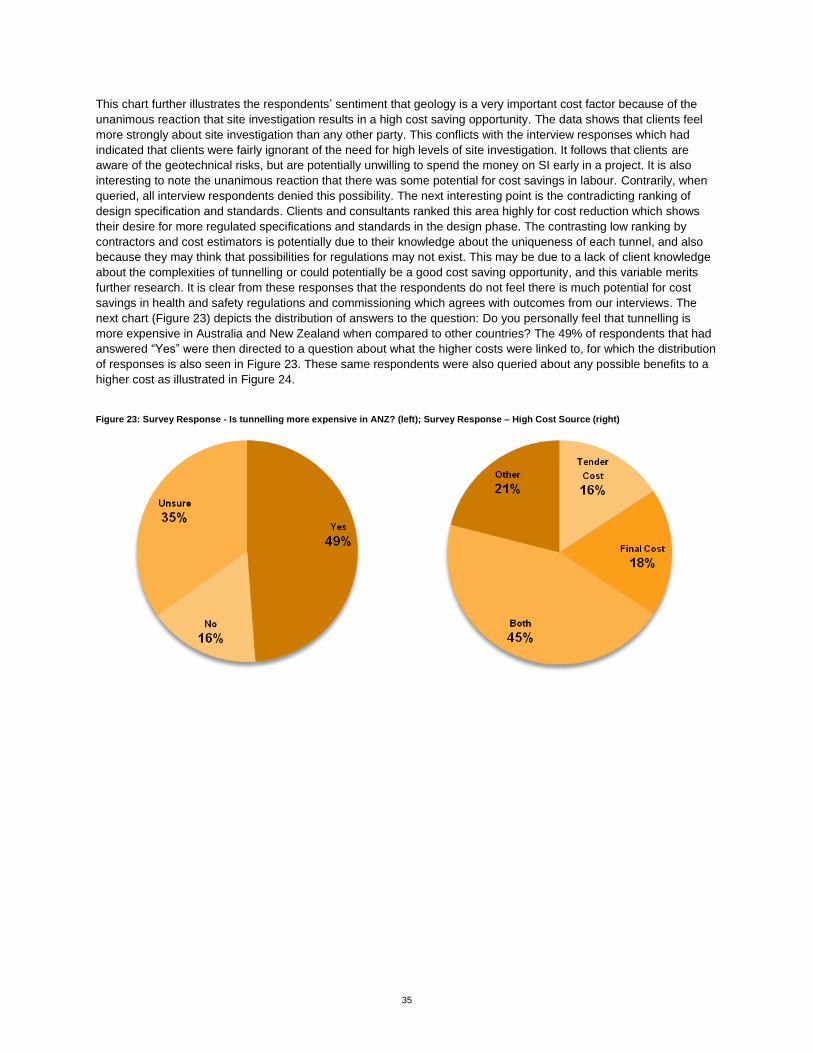
35
This chart further illustrates the respondents’ sentiment that geology is a very important cost factor because of the
unanimous reaction that site investigation results in a high cost saving opportunity. The data shows that clients feel
more strongly about site investigation than any other party. This conflicts with the interview responses which had
indicated that clients were fairly ignorant of the need for high levels of site investigation. It follows that clients are
aware of the geotechnical risks, but are potentially unwilling to spend the money on SI early in a project. It is also
interesting to note the unanimous reaction that there was some potential for cost savings in labour. Contrarily, when
queried, all interview respondents denied this possibility. The next interesting point is the contradicting ranking of
design specification and standards. Clients and consultants ranked this area highly for cost reduction which shows
their desire for more regulated specifications and standards in the design phase. The contrasting low ranking by
contractors and cost estimators is potentially due to their knowledge about the uniqueness of each tunnel, and also
because they may think that possibilities for regulations may not exist. This may be due to a lack of client knowledge
about the complexities of tunnelling or could potentially be a good cost saving opportunity, and this variable merits
further research. It is clear from these responses that the respondents do not feel there is much potential for cost
savings in health and safety regulations and commissioning which agrees with outcomes from our interviews. The
next chart (Figure 23) depicts the distribution of answers to the question: Do you personally feel that tunnelling is
more expensive in Australia and New Zealand when compared to other countries? The 49% of respondents that had
answered “Yes” were then directed to a question about what the higher costs were linked to, for which the distribution
of responses is also seen in Figure 23. These same respondents were also queried about any possible benefits to a
higher cost as illustrated in Figure 24.
Figure 23: Survey Response - Is tunnelling more expensive in ANZ? (left); Survey Response – High Cost Source (right)

36
Figure 24: Survey Response – Benefits to Higher Cost
Figure 23 (left) definitively shows the current sentiment in ANZ, which is highly characterised by uncertainty about the
cost of tunnelling (35%) and a general feeling that costs are higher (49%). Figure 23 (right) shows the areas where
respondents feel higher costs are coming from. This chart shows general uncertainty regarding whether estimates or
outturns contribute more to expenses with an even split between tender cost (16%) and final cost (18%), with 45% of
respondents claiming that both tender and final costs were the source of disparities. Figure 24 shows the distribution
of responses for benefits to a higher cost rate. In general there are no significant responses, but instead a fairly even
spread can be seen in each category. This suggests that there are probably some small benefits to a higher cost, but
these benefits are not very noticeable or quantifiable.

37
4.3 Individual Comparisons
Comparing specific examples of tunnel projects against similar global projects helps visualise both the global cost disparities as well as illustrate
the challenge of comparison with so many variables present. We randomly selected tunnels for comparison for which cost breakdowns were
available. Then we removed as many variables as possible, leaving only location, geology, and special circumstances to be discussed and
qualified. In our selection we chose recent TBM bored, urban, rail projects from around the world, and normalised them by distance and unit area.
The results of this analysis are shown in Table 4. The desired end result was to isolate the pure tunnelling costs, which solely included tunnel
excavation, lining, and contractor’s overhead and profit for the TBM segment of each tunnel.
Table 4: Individual Comparisons, All costs given in average Q3-2011 AUD
Cross River
Rail CBD Rail Link
Additional
Waterfront Harbour
Crossing
Toulouse
Metro
Noord-Zuidlijn
Line
University Link
(ULINK) MRT DTL3
Date Started Proposed Proposed Proposed Proposed April, 2003 2008 June, 2011
Date Finished Proposed Proposed Proposed Proposed Under
Construction
Under
Construction
Under
Construction
Location Brisbane,
Australia
Auckland, New
Zealand
Auckland, New
Zealand
Toulouse,
France
Amsterdam,
Netherlands
Seattle,
Washington Singapore
Locality Urban Urban Urban Urban Urban Urban Urban
End Use Rail Rail Rail Rail Rail Rail Rail
Type Length
(m) TBM 19000 TBM 5070 TBM 5700 TBM 15160 TBM 3800 TBM 6950 TBM 75600
Outer Diameter (m) 7.0 6.9 15.5 7.7 6.5 6.3 7.0
Depth (m) - 20 20-40 - 20-30 - -
Geology - Sandstone Sandstone - -
Clay, silt, sand,
gravel. Active
seismic region.
Soft Ground
Tunnelling
Estimate Cost/m
Tunnelling
Estimate Cost/m3

38
Although no determinate inferences can be made regarding generalising this data by region because of the extremely
limited data set, the comparison can is still valuable. It provides a method for analysing the factors contributing to the
costs and illustrates the complexity of comparing tunnels with numerous cost variables. Since all of the costs are
estimates, it can be inferred that the estimates were probably determined from previous benchmark rates utilised by
contractors, which are typically averaged from previous projects in the region. Some conclusions can be drawn from
these data to support or negate our previous conclusions as a result. As noted previously, this data should not be
taken without qualification but should be assimilated with other analyses to form a more comprehensive
understanding of the problem. It appears from this analysis that tunnelling in Australia and New Zealand is not greatly
more expensive than it is in other regions. This conclusion is very limited though from the small dataset used in the
comparison.
The first interesting finding from this analysis is the similarity in cost/m3 for the majority of the projects compared. The
Cross River Rail, Toulouse Metro, ULINK, and MRT DTL3 costs differ by only $70/m3 and. This is notable for several
reasons. Each project is of medium-long length which is in accord with our previous finding that start-up costs tend to
be normalised by the long length of the tunnels. This may suggest that other factors have more of a direct correlation
on cost rather than the isolated factors listed above. In addition, the diameters of the set only range from 6.3m to
7.7m, which allows for more direct comparison of costs. This helps explain the very low cost/m3 associated with the
Additional Waterfront Harbour Crossing. The extreme size of this tunnel will require much less material cost per cubic
meter and resultantly has a lower cost per cubic meter even though it has the highest cost per meter of the set. This
supports the argument that costs per meter do not adequately compare tunnels with different bore sizes. Tunnels
excavated by TBMs with specifically reported diameters are the best candidates for cost per cubic meter
comparisons. The significantly higher cost/m3 associated with the Noord-Zuidlijn Line can be partially explained by
the alignment chosen for this project. This tunnel travels straight under many historic buildings in Amsterdam, and
concerns about vibration and settling during the boring process resulted in a much slower construction schedule and
much higher costs. This also helps to demonstrate another facet of the complexity involved with comparing projects,
because of the unquantifiable variables that exist with every project. These results exemplify the complexity
associated with comparing tunnels across various cost factors and aids in explaining the high standard deviations
found in our database analysis. Since the excavation type and end-use were kept constant in this analysis and
resulted in similar global costs, it is possible that these are the key cost drivers for tunnelling rather than location.
4.4 Comparison of Australia and New Zealand
The results of our interviews first led us to believe that tunnelling costs in Australia should not be compared to New
Zealand for several reasons. Construction labour rates are very different in each country with Australia’s construction
salary averaging 1.42 times greater than that of New Zealand (“Engineer Salaries,” 2008). This can lead to a
significant cost differential between the two countries since we were told by our interviewees that the cost of labour
typically accounts for 30-40% of the overall cost. This may also be due to different strengths and role of unions in
each country. Another reason why the two countries should not be linked is that material costs vary widely between
the two. New Zealand was often cited in our interviews as having more expensive construction materials and plant
costs. Lastly, the data is difficult to analyse since New Zealand has only completed a small quantity of projects over
the past 15 years, and does not plan to construct a larger amount over the next 15 years.
Although many major variables can vary between the two countries, there are many variables which are similar and
might help explain why the countries are often related. One of these similarities is that both Australia and New
Zealand experience limited contracting market competition. Other parallels that exist between the countries are the
similar environmental, regulatory and bidding processes each has to go through before a tunnel can be constructed.
Our analysis of tunnel costs helps conclude that Australia appears to be more expensive than New Zealand, possibly
because of tunnelling labour costs. Although similarities between the Australian and New Zealand tunnel delivery cost
factors exist, the results of our interviews and statistical analysis firmly confirms that the two countries should not be
analysed as one entity.
39
4.5 Investigation of Cost Escalation
After quantitatively and qualitatively concluding that tunnels in Australia are among the more expensive tunnels in the
world, we investigated several sources of possible cost escalation. As a result from our literature review, acquisition
of tunnelling cost data, interviews, and surveys we selected the following list of variables to concentrate on:
Geology
Labour
Market Competition and Bidding
4.5.1 Geology
Unexpected geological factors are variables which cost escalation is often blamed on. It is evident that geological
problems can often result in delays as well as unforseen environmental problems which need to be fiscally accounted
for. Geology is very specific to a region, but not necessarily characteristic of a country, so it is difficult or impossible to
accurately analyse the average geology encountered in a country. The results of our interviews suggest that Australia
does not have particularly difficult geology to tunnel through, and tends to have fairly easy substrate to bore through
in some regions such as Sydney.
4.5.2 Labour Costs
The respondents from our survey ranked average labour costs as fourth out of a list of 11 cost factors on their
potential for cost savings. This indicator along with the assumptions made previously from our interview analysis
prompted further research into the causes and potential cost savings related to labour. In order to facilitate this
analysis, the net monthly income for workers in the mining, engineering and construction sectors was researched.
Figure 25 below displays the average wages for two countries from each of our comparison regions.

40
Figure 25: Monthly Wages by Country [Source: http://www.worldsalaries.org]
It is clear from this comparison that the United States, United Kingdom, and Australia have the most expensive
wages related to tunnelling. Although the available source data (Appendix J 0) is from 2005, we feel it is relevant to
our analysis since the majority of the tunnels in the database utilised labour from this time period. There is a similar
correlation between the average tunnel cost in each region (where data exists for more than one tunnel) and the
average wages for each country as seen in Table 5.
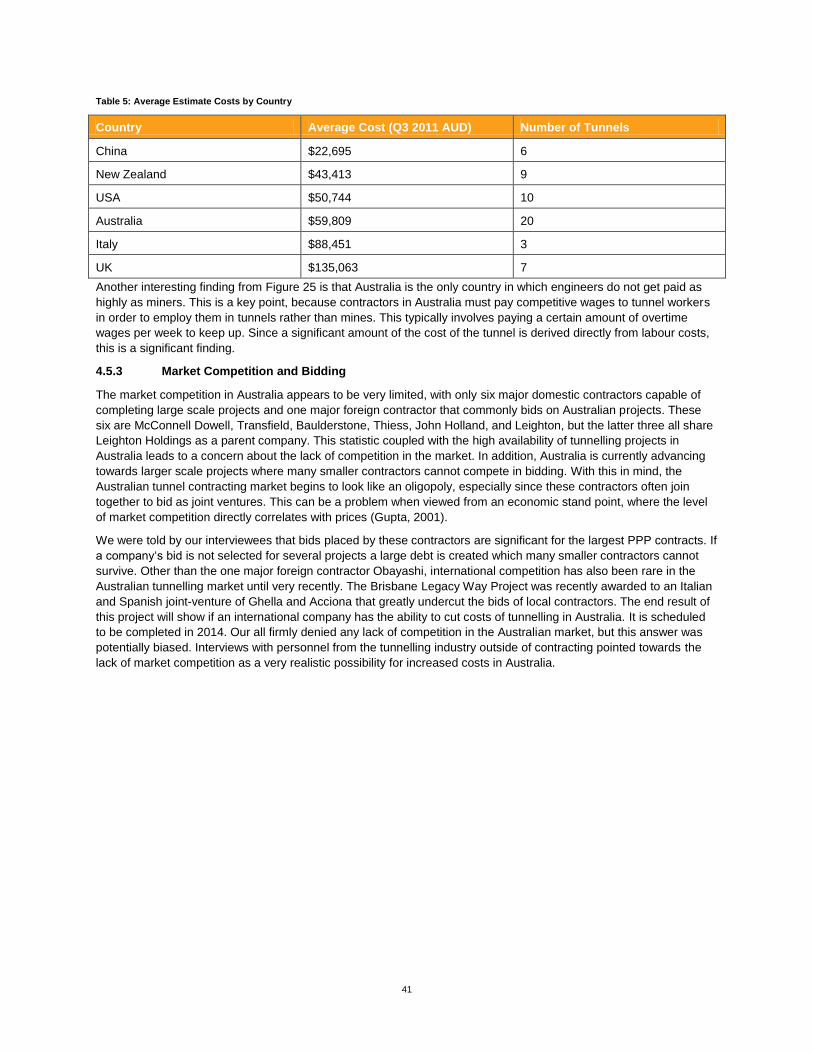
41
Table 5: Average Estimate Costs by Country
Country Average Cost (Q3 2011 AUD) Number of Tunnels
China $22,695 6
New Zealand $43,413 9
USA $50,744 10
Australia $59,809 20
Italy $88,451 3
UK $135,063 7
Another interesting finding from Figure 25 is that Australia is the only country in which engineers do not get paid as
highly as miners. This is a key point, because contractors in Australia must pay competitive wages to tunnel workers
in order to employ them in tunnels rather than mines. This typically involves paying a certain amount of overtime
wages per week to keep up. Since a significant amount of the cost of the tunnel is derived directly from labour costs,
this is a significant finding.
4.5.3 Market Competition and Bidding
The market competition in Australia appears to be very limited, with only six major domestic contractors capable of
completing large scale projects and one major foreign contractor that commonly bids on Australian projects. These
six are McConnell Dowell, Transfield, Baulderstone, Thiess, John Holland, and Leighton, but the latter three all share
Leighton Holdings as a parent company. This statistic coupled with the high availability of tunnelling projects in
Australia leads to a concern about the lack of competition in the market. In addition, Australia is currently advancing
towards larger scale projects where many smaller contractors cannot compete in bidding. With this in mind, the
Australian tunnel contracting market begins to look like an oligopoly, especially since these contractors often join
together to bid as joint ventures. This can be a problem when viewed from an economic stand point, where the level
of market competition directly correlates with prices (Gupta, 2001).
We were told by our interviewees that bids placed by these contractors are significant for the largest PPP contracts. If
a company‘s bid is not selected for several projects a large debt is created which many smaller contractors cannot
survive. Other than the one major foreign contractor Obayashi, international competition has also been rare in the
Australian tunnelling market until very recently. The Brisbane Legacy Way Project was recently awarded to an Italian
and Spanish joint-venture of Ghella and Acciona that greatly undercut the bids of local contractors. The end result of
this project will show if an international company has the ability to cut costs of tunnelling in Australia. It is scheduled
to be completed in 2014. Our all firmly denied any lack of competition in the Australian market, but this answer was
potentially biased. Interviews with personnel from the tunnelling industry outside of contracting pointed towards the
lack of market competition as a very realistic possibility for increased costs in Australia.

42
5.0 Conclusions and Recommendations
Our research concluded that tunnel construction in Australia and New Zealand is not statistically more expensive than
the rest of the world when compared by region or end type due to a large variance in the sample means. It was found
that Australia averages higher than the rest of the world for construction of transportation tunnels, but not for utility
tunnels. This analysis was based on 158 tunnel projects gathered from 35 countries throughout ANZ, Europe, the
Americas, and Asia. These costs were compared by region, end-use, and locality, and were separated according to
tender or outturn costs. The higher average cost found for transportation tunnels is significant since rail and road
projects are typically more publicized. This finding helps explain the sentiment that tunnelling in Australia is more
expensive than in the rest of the world. There was a large range in costs in our database which exemplifies the
numerous cost drivers that contribute to overall costs and the potential for cost reductions in ANZ.
Tunnel cost information gathered in our database was compared using a variety of methods to isolate the main
factors that contribute to cost disparity between regions. The initial comparison separated costs into estimates and
final costs and then divided tunnels by region, into ANZ, Europe, the Americas, and Asia. Costs for all projects were
divided by the tunnelling length to account for variation in size. This is the current standardized method for tunnel
comparison in the industry. Costs per cubic meter were also investigated by dividing costs per meter by the face area
of the tunnel. This helps to account for varying diameters of tunnels, but is not an accurate method for all projects due
to the existence of non-circular tunnels. The statistical test carried out on these data sets showed no statistical
difference for either costs per meter or costs per cubic meter.
Tunnels were then separated into end-uses – road, rail, sewer, water, and cable. No statistical difference was found
between road and rail tunnels, and no difference was found between sewer, water, and cable tunnels. This was
followed by a T-test comparing transportation tunnels to utility tunnels, where there was a statistical difference. This
supports the conclusion that tunnels can be separated into these two categories for any cost comparisons. Lastly,
these tunnels were further divided by locality into either urban or rural environments. The T-test comparing these
tunnels showed no statistical difference and a large range of costs was noted. This directs us to conclude that locality
is not as significant factor in tunnelling costs in comparison to other variables; however, this analysis did show that
the estimate costs of utility tunnels average slightly higher in urban regions than rural. The effect of different
excavation methods such as cut and cover, drill and blast, TBM, and roadheaders were also investigated. It was
found that during data collection, the variables and costs associated with different types of excavation within a single
tunnel were not consistent and merits further review in the future. Due to a limited data set, tunnels were not further
broken down in this analysis.
In order to remove as many variables as possible, we compared individual costs of six recent urban, TBM bored, rail
projects. These tunnels were compared using cost per meter and cost per cubic meter. It was found that the costs per
cubic meter of these tunnels were very similar and differed by only $70/m3. Since the excavation type and end-use
were kept constant in this analysis and similar global costs resulted, it is possible that these are key cost drivers for
tunnelling. Although inferences about regions as a whole should not be made from the results of this analysis, it still
aids in understanding and illustrating the effects of several cost factors on unit cost as well as the sensitivity in
analysis with such a small dataset.
Interviews with 11 individuals in the tunnelling industry and 54 responses to an online survey further identified the
sentiment that tunnelling in ANZ is very expensive and helped provide an explanation for this feeling. The potential for
cost escalation and cost reduction for several factors was ranked and discussed. The key cost drivers mentioned in
these interactions were geology, labour, materials/plant, safety and environmental regulations, government and
public support, market structure, the cost of bidding, contract type, and client knowledge. These factors related to
Australia only because the two were found to have many quantifiable differences and should not be grouped
together.
Everyone that we spoke with stated that he or she did not agree with grouping Australia and New Zealand together
for tunnelling cost comparisons. Many of the aforementioned cost drivers differ in Australia and New Zealand.
Australia is known for its higher labour costs, while New Zealand has significantly low wages in comparison. New
Zealand has much less active unions and as a result many of the tunnels there are less expensive than those in
Australia. New Zealand is also known to have very high costs for material and plant which is not apparent in
Australia. In addition, the costs reported in our database appeared to be very different and not comparable, especially

43
for road and rail tunnelling. The experience in tunnelling in New Zealand is also much less than that in Australia. The
market for tunnelling in New Zealand is not forecasted to greatly increase in future years and as a result there is
significantly less interest and potential for change in the country than there is for Australia. As a result we focused on
Australian cost drivers in our interviews and reported on potential for cost reductions only for Australia.
5.1 Recommendations for Future Research
5.1.1 Data Collection
We recommend that AECOM continue to add data to the database as it is made available on future projects. Over
time, this will help overcome some of the statistical insignificance related to not having enough data points. We also
recommend consolidating and optimising the database in several ways. First, we would suggest completely
separating the tunnel excavation types within individual projects because of the different variables and costs involved
with tunnels that are inconsistent across different excavation types. Second, we would suggest consulting various
knowledgeable geotechnical engineers to produce a quantifiable geological difficulty rating scale which can be
applied to each tunnel. These steps would help reduce or eliminate variables which would lead to a more statistically
significant analysis because it would address the two most influential drivers of tunnel cost. Lastly, the analysis could
benefit from the addition of a dataset that quantifies the cost of bidding versus the location and contract type. This is a
key factor that has come up in our qualitative analysis, but we have no quantitative information to back up this finding.
In order to supplement these data, it is important to continue qualitative research. Our next recommendation is to
produce and send out a lengthier, globalised survey which focuses in depth on the key areas of cost savings listed
above, but takes an international perspective. In addition, this survey should seek out cases of significant cost
reduction in the global market that can be further studied and possibly implemented in Australia.
We also recommend collecting data on tunnel progress rates per unit length or area, and perform interviews with
construction managers in order to seek out inefficiencies or possible anomalies in the data that might represent an
opportunity for labour reduction.
5.1.2 Analysis
Since the results of the qualitative portion of our survey suggest that in general, some end-uses are not comparable,
it would be best to divide the data up into groups by end-use, then analyse with location being the independent
variable. The key to such a complex analysis is a large quantity of data and the careful elimination of conflicting
variables.
We also recommend comparing bid prices with the type of project delivery method and performing a cost-benefit
analysis to determine if the added cost reliability is worth the increased price resulting from losing bids.
It is important in all analysis to focus on integrating findings from many different sources since in this case the quality
and reliability of the data is typically lower. Findings can then be qualified with multiple sources of information that
point towards the same conclusion.
We also recommend continuing to investigate why such a range in tunnelling costs exists within a country, especially
for Australia, which could help lead to major cost reductions.
Lastly, we feel that all future studies should exclude Australia and New Zealand from co-analysis as a result of their
contrasting cost drivers.
5.2 Benefits of Tunnel Costs in Australia
In general, few tangible benefits of higher tunnelling costs in Australia were recorded. Interviewees and survey
respondents were queried regarding if there was any increase in safety and productivity or any reduction in operation
and maintenance fees as a result of higher tunnelling costs in Australia. It seems from our analysis that there may be
some small benefits, but they are difficult to define or quantify such as. The few listed benefits regarded higher worker
productivity, better construction safety records, greater adherence to environmental standards, reduced operation
and maintenance costs, better post-commissioning safety, and longer service life. Interviews suggested that these
benefits did not outweigh increased costs, but future investigation could further research these statements.
44
5.3 Cost Drivers and Potential for Cost Reduction in Australia
The following list of key cost drivers were researched and are discussed below. Recommendations for these cost
drivers were also provided when relevant. Although this advice is aimed at the Australian market, some changes may
be applicable elsewhere in the world.
Geology
Labour
Materials/Plant
Safety and Environmental Regulations
Market Structure
Government/Public Support
Project Delivery
Client Knowledge
It was discovered that the design stage has a large potential for cost reductions in these categories, as at this point in
a project the scope of the project is not completely set. In addition large decisions such as choosing the alignment,
dimensions, and lining type during this stage can result in significant cost variance during construction. As the tunnel
progresses into the excavation stage it is much more difficult to make significant changes to the project that may
result in cost escalations.
5.3.1 Geology
Geological conditions are the cited cause for the majority of cost overruns in tunnel construction. The majority of our
interviewees stated that investment in the site investigation was very important and almost always comes backs with
a return. This is also a cost driver that is specific to tunnels, which differ greatly from other infrastructure because they
are underground through relatively unknown conditions. Geological conditions vary throughout the world, with major
problems being caused by water permeation, fault lines, very soft materials that will not support themselves, and the
variation of materials from soft sand or gravel to extremely hard rock. The conditions in Australia are not overly
difficult to excavate through in comparison with the rest of the world.
We advocate that during the early feasibility stage, clients significantly increase the amount of site and geotechnical
investigation undertaken. We recognise the fundamental problem encountered when trying to convince clients to
spend more money in the early stages of a project, when the overall viability, constructability and financing is still
unknown, but all of our research subjects described a direct correlation between the amount of SI and cost savings.
To accomplish this, we recommend providing more comprehensive education to clients who are considering
constructing any type of subsurface works. Although this issue is not inherent to Australia, it is still an area that has
almost unanimously been cited as an area which has one of the largest potentials for decreased risk and final cost
reduction.
5.3.2 Labour
Labour costs typically account for 30-40% of the overall budget for a tunnelling project as described by our
interviewees. Variances in these costs between countries may account for more expensive or less costly tunnelling.
Labour costs in Australia are reported as very high in comparison to other countries in the rest of the world, especially
Asia. The Australian dollar currently has a very high value, unions are very active in Australia, and there is
competition with the mining sector to employ labourers. As a result, wages are very high for tunnelling workers and a
significant amount of overtime is paid on every project. There is also a lack of hierarchy in pay scale in Australia,
where many tunnelling engineers and some management positions have very similar salaries to tunnellers. Other
countries with higher wages such as Europe and the United States will often import labour from Asia in order to
reduce labour costs, but this is not a viable option in Australia due to labour restrictions. Although there is increased
education and productivity amongst Australian workers, we did not find that they were substantial enough to
counteract the costs of high wages.
The often overlooked potential for cost savings in this area is a reduction in the amount of labour required to deliver a
tunnel. Since the largest labour costs are attributed to the construction workers rather than professional engineers,

45
reason suggests identifying ways to reduce construction labour. Optimisation of precast plants, increased
technological efficiency and better management can all help reduce the labour required to produce a project. We
would advise pursuing technologies which can help reduce labour requirements by the following:
Increasing TBM performance
Reducing TBM labour requirements
o More multitasking
o More mechanisation
Increasing equipment longevity
5.3.3 Materials/Plant
Materials and plant costs are often very similar across regions. There are only a few main manufacturers that supply
the majority of international tunnelling. As a result, the only major difference in cost for this factor in Australia is the
associated shipping fees. An option to reduce costs in materials and plant that is being investigated in Asia is to move
towards standardization instead of optimization. This would allow for more TBMs and roadheaders to be re-used and
would also result in standardized mass produced lining segments, which could potentially reduce costs after the initial
increase needed to design tunnels around these pre-determined parts.
In some Asian countries there is a trend towards standardisation of tunnels and their components that is worth
pursuing and assessing. This contrasts with the current practice where, it is financially worthwhile to spend the time
designing and optimising the thinnest possible tunnel lining and the smallest possible diameter. If the government
were to take a larger role in providing standard tunnel requirements, less time would need to be spent on design that
is specific to each alignment and geology. The economies of scale resultant from standardisation of tunnelling
components and equipment can potentially result in cost savings and decreased risk. This is true for both a country
as a whole, or for a single client who may be planning on building many similar tunnels. The resistance to this shift
would suggest that this might result in the overbuilding of some tunnels which don’t need thicker linings or a larger
diameter. While we can recognise the customisation required for different tunnels, the key benefit is that each tunnel
end-use could be built to the same diameter with the same precast concrete rings. This would result in tunnels that
would be able to share plant and equipment and would significantly reduce costs. As it stands, huge inefficiencies
exist in having to set up a custom plant for every job to manufacture precast rings that are unique to a specific tunnel.
In addition equipment such as TBMs are typically only used once and then sold back to the manufacturer for 5-15%
of the purchase price, when it could be much cheaper to simply refurbish the equipment between jobs. These are
very general examples, but they serve to augment the potential shift in thinking from optimisation to standardisation.
5.3.4 Safety and Environmental Regulations
Safety and Environmental regulations are very similar throughout the world. Typically Europe is the first to implement
new standards and then they are assimilated into the rest of the world. These regulations have also been cited as
slightly lower in Asia than the rest of the world. There are slightly different regulations based on the location of the
project in either a rural or urban environment, but safety and environmental regulations are relatively standardized
throughout the world and there is not much potential for cost reduction in this category. Some Australian tunnels have
been noted as “over designed” and “over specified” with regards to some safety features, and the removal of excess
systems may help to remove additional costs.
5.3.5 Market Structure
The level of competition in the Australian tunnelling market is currently very limited with little to no international
intervention. The major contractors in Australia are John Holland, Leighton Contractors, Thiess, Baulderstone,
Transfield, and McConnell Dowell. John Holland, Leighton Contractors, and Thiess are all part of the same parent
company, Leighton Holdings, and McConnell Dowell focuses on smaller tunnelling projects. In most other countries,
tunnelling projects would have bids from around 10 or more contractors, while in Australia this rarely exceeds 4. In
addition, contracting firms that are owned by the same company have been known to end up competing for the same
bid which could result in complacency. The large project sizes in Australia for tunnelling works makes it very difficult
for smaller companies to contend with these larger contractors and also necessitates the need for joint ventures
between the larger contractors. This results in many projects where contractors often end up bidding against
themselves. The lack of competition in the Australian market would result in increased costs for tunnelling works
since these contractors do not have to be as aggressive in their bidding and may be more complacent in this region
46
than they are in other parts of the world. The construction of Legacy Way in Brisbane marks the first international
intervention in the Australian market. A Spanish and Italian joint venture greatly undercut the bidding for the project.
Currently this tunnel is under construction, but in the future it would be a good case study for comparison of
international tunnelling methods to those in Australia. International intervention in the market may also increase the
level of competition and lead to cost reductions.
Increasing market competition is a difficult problem to address because of the experience, knowledge and contacts
possessed by large domestic contractors. Although this issue would typically call for government intervention and
regulation we believe there are other alternatives. One alternative that could be exercised by clients would be to
encourage bidding from foreign contractors, which could help spur innovation and trigger the cutting of unnecessary
costs. Another preferred alternative would be to analyse the effects of splitting large scale contracts into multiple,
smaller contracts. This would help spread the risk and allow smaller, less experienced contractors to enter the
market. This is a standard practice in places such as Singapore and Hong Kong, where a large tunnelling project
might be split into 20 or more contracts that are won by different contractors and joint ventures. The same scale
projects in Australia are almost always bid as a whole and go to a single contractor or joint venture which decreases
competition and has a direct correlation on cost. It is notable that this would need a thorough analysis to determine if
the cost reduction from increased competition would exceed the increased cost of additional bids. In this case client
education to inform government planning boards and private infrastructure consortiums of these potentials for cost
savings would be beneficial.
5.3.6 Government/Public Support
Legislation change during the lifetime of a tunnelling project can create possible delays and lead to increased costs.
Government support, especially during the early stages of the project, helps to expedite the design phase and
advance the project to excavation. If this support is lost or shifts in the middle of a project, it can lead to changes in
scope and time setbacks which cause cost overruns. Some projects can even be abandoned if they lack government
support such as the Sydney metro which was cancelled after significant design work, whose cost would have had to
have been absorbed into the costs of other projects. The amount of public support for a project is another indirect
variable that can greatly affect tunnelling costs. The lack of a favourable public opinion can result in a reduced
amount of traffic and can negatively affect the amount of government support on a project. One finding from our
interviews was that in general, Australians do not prefer to spend money on paying tolls to use tunnels even though it
may save them time and expenses in the long run. Based on these findings, it is very important to secure both
government and public support during the early stages of a tunnelling project in order to avoid potential cost
escalations.
5.3.7 Project Delivery
Contract types in Australia have begun to move towards Private Public Partnerships (PPPs) within the last fifteen to
twenty years which contrasts with the contract types in other nations. In addition other nations’ PPPs do not
necessarily match up with how PPPs in Australia operate. In Australia these contracts require the private sectors to
take on all of the risk and must provide all of the financing for a project instead of the government. This can lead to
increased costs since the private sector must account for a large contingency and also cannot secure bonds and
financing at the same low rates available to the government. The PPP model has had both successes and failures.
The key advantage is that PPPs result in an expedited start to a project, where there is less chance of projects being
delayed after major political changes. Several recent PPP projects have resulted in the private firm, which is backing
the project to become bankrupt. This is most often a result of delusions about the successes of the project. For
example, some of the completed projects forecasted much greater traffic use of tolled tunnels than was realistically
possible which skewed the profits for the investors. In general, it is believed that the PPP model requires some
restructuring in order for it to be successful for tunnelling projects.
The cost of bidding in Australia is also very high as a result of the PPP model. Since the private sector takes on the
risk for these contracts, they require a high level of cost certainty and result in higher design specifications during
bidding. Typically there is a significant cost to put together a bid for the largest PPP tunnelling projects in Australia.
This cost is completely lost for any contractor that is not selected as the winner or the bid. The lost money must then
be recouped by subsequent projects, resulting in a cycle that increases the costs of every large project undertaken by
these companies. These large costs also negatively affect competition in the tunnelling market, as smaller contractors
cannot incur this debt for as long of a period of time as larger firms without becoming bankrupt.

47
Our recommendation is to continue encouraging the PPP model wherever possible as it helps produce projects that
otherwise may stagnate, but to revise the process to encourage competition and reduce cost inefficiencies. Although
PPPs have been criticised in the past for lack of post-construction revenue, we believe that financiers and contractors
have learned from this and are now more cautious when it comes to traffic forecasts and estimates. It may be prudent
to attempt to improve public opinion about the use of tolled road tunnels, since our findings have indicated that people
in Australia tend to spend the time taking alternative routes rather than spend money on the toll. For the most part,
our concerns and recommendations lie with the risk allocation and high amount of money lost during the bidding
process. We would encourage a revision of the PPP model to partially place the risk associated with the contract
back on the government. Ideally, we would like to see a model where the construction risk is allocated to the
contractor, and the post-construction risk is split more evenly between the public and private parties of the contract.
This is necessary since governments can more sustainably handle financing a project because they can acquire
bonds at lower rates than private companies are able. Another issue with PPPs is that the high level of design
certainty required at bid necessitates a high expenditure to meet this standard. The cumulative value of the losing
bids must be made up in future bids which results in an inefficiency which needs to be addressed. Our
recommendation for this is to conduct a cost-benefit analysis in order to ascertain if the higher cost certainty resulting
from a higher design percentage outweighs the increase in cost resulting from bids that have been lost.
5.3.8 Client Knowledge
In Australia, client knowledge is generally regarded by our survey respondents and interviewees an area for
improvement. Many clients are unaware of how to create tunnelling specifications which optimise cost saving
potentials because of the relative rarity of tunnels when compared to other infrastructure that they have experience in.
As a result clients do not understand the unique challenges related to tunnelling, and scopes for projects often
include items that are not necessary. Some clients are also very vague about what they want which can lead to
issues when putting together bids. Currently, there is not a very high amount of interaction between contractors and
clients. The lack of experience amongst clients found in the Australian tunnelling market contrasts with the
experience of clients in Europe and Asia and could further explain higher costs in the region.
.As with other client side issues, the solution appears to be increased education. We feel that this recommendation of
client education will help to significantly reduce inefficiencies caused by misspecification and also reduce the number
of clients that needlessly spend money by hiring consultants too early in the planning process when not enough
information is known. In addition, bringing in a contractor earlier may induce extra costs, but could potentially aid
inexperienced clients in the design process and save money throughout the lifetime of the project.

48
6.0 Works Cited
American Society of Civil Engineers (ASCE). Holland tunnel. Retrieved 11/17, 2011, from
http://www.ascemetsection.org/content/view/333/866/
Anjula Gurtoo, S.J. Antony, (2007) "Environmental regulations: Indirect and unintended
consequences on economy and business", Management of Environmental Quality: An International Journal, Vol. 18
Iss: 6.
Austin, S. A., & Robins, P. J. (1995). Sprayed concrete: Properties, design, and application Whittles Publishing.
Bærenholdt, J. (2008). Mobility and place. Aldershot: Ashgate Publishing.
Boardman, F. W. (1960). Tunnels. New York, United States: Henry Z. Walck, Inc.
Bridge & Tunnel Construction in the US. (2010, January 6). M2 Presswire.
British Tunnelling Society. Infrastructure UK cost study tunnels. (October 2010).
CERN (2008). LHC: the Guide. CERN faq brochure.
Chan, C. Australian Government Productivity Commission, (2009). Public infrastructure financing: An international
perspective
Chow, W. K., Junmei, L., Kang, K., Kashef, A. H., Miclea, P. C., & Shen-Wen, C. (2007). International tunnel fire-
safety design practices. ASHRAE Journal
Copur, H.; Ozdemir, L. and Rostami, J. (1998). “Road-header Applications in Mining and Tunnelling industries.”
Society for Mining, Metallurgy and Exploration, 1998, Orlando, FL.
Craig, R. (1983). Pipe Jacking: A State-of-the-Art Review, Deere, D. U. (1968). Design of tunnel liners and support systems.
CRIGHTON, GS (01/01/1992). "TUNNEL DESIGN AND CONSTRUCTION". Proceedings of the Institution of Civil
Engineers. Civil engineering (0965-089X)
Engineer salaries - international comparison. (2008). Retrieved from http://www.worldsalaries.org/engineer.shtml
Evans, M., Paugam, S., & Prélis, J. A. (1995). Chunnel vision poverty, social exclusion and the debate on social
welfare in france and britain.
Flyvbjerg, B. (2008). Comparison of capital costs per route-kilometre in urban rail. (Doctoral dissertation, Delft
University of Technology).
Girmscheid, G. (2003). Tunnel boring machines. Practice Periodical on Structural Design and Construction, 8, 150.
Grigg, N. S. (2003). Water, wastewater and stormwater infrastructure management. Beca Raton, Florida: CRC Press LLC. Gupta, Srabana (2001). "The effect of bid rigging on prices: a study of the highway construction industry". Review of industrial organization (0889-938X)
Harris, W. (2011). How tunnels work. Retrieved November 10, 2011, from
http://science.howstuffworks.com/engineering/structural/tunnel.htm
Higgins, E. (2011, June, 27 2011). Miners dommed by fatal flaws. The Australian,

49
Hinze, Construction safety, Safety Science, Volume 46, Issue 4, April 2008
HM Treasury, I. U. (2010). Infrastructure cost review. HM Treasury.
Hoek, E., & Brown, E. T. (1990). Underground excavations in rock Spon Press.
Kleberger, J., Campos E Matos, A., Sousa, L. R., & ENGnetBASE. (2006). Geotechnical risk in rock tunnels.
Abingdon: Taylor & Francis Group.
Kurzweil, L. (1979). Ground-borne noise and vibration from underground rail systems. Journal of Sound and Vibration, 66(3), 363-370.
Lebrun, P. (2000). The large hadron collider, a megascience project. Paper presented at the Superconducting Materials for High-Energy Colliders. Proc. 38th INFN Eloisatron Workshop, 11-20. Lenferin, S. (2009). Government strategies for market involvement in road infrastructure planning: An international overview. Netherlands: University of Groningen.
Lieske, SN (2008). "PLANNING DECISION SUPPORT–AUSTRALIAN EXAMPLES."
Lowry, R. T-test for the significance of the difference between the means of two independent samples. Retrieved
February 10, 2012, from http://faculty.vassar.edu/lowry/ch11pt1.html
Mainwaring, G., Lam, Y., & Weng, L. (2001). The planning, design and construction of the tuas cable tunnel and
future power transmission cable tunnels in singapore. Paper presented at the PROCEEDINGS OF THE RAPID
EXCAVATION AND TUNNELING CONFERENCE, 647-658.
Mahuet, J. L. (2000). Waterproofing and drainage of underground structures.Tunnels Et Ouvrages Subterrains.
Martin, S. (2011). Reviewing the last decade of public transport infrastructure projects in Australasia. East Melbourne:
Parliament of Victoria.
Mashimo, H. (2002). State of the road tunnel safety technology in japan. Tunnelling and Underground Space Technology, 17(2), 145-152.
Michitsugu, I. (2005). Maintenance of the undersea section of the Seikan tunnel. Tunnelling and Underground Space
Technology, 20(2), 143-149. doi:10.1016/j.tust.2003.10.001
Mouratidis, A., 2008. The ‘Cut-and-Cover” and “Cover-and-Cut” Techniques in Highway Engineering, 13, 1-15.
NIST/SEMATECH. (2012). 7.1.6 What are outliers in the data? Retrieved February 13, 2012, from
http://www.itl.nist.gov/div898/handbook/prc/section1/prc16.htm
Ocak, I., Bilgin, N., 2010. Comparative studies on the performance of a roadheader, impact hammer and drilling and
blasting method in the excavation of metro station tunnels in Istanbul. Tunnelling and Underground Space
Technology, 25, 181-187.Seikan tunnel knowledge. Retrieved November 17, 2011, from
http://jr.hakodate.jp/global/english/train/tunnel/tunnel_omosiro.htm
Parker, H. W. 1996. Geotechnical Investigations, Chapter 4 of Tunnel Engineering Handbook, 2nd Edition, edited by
Kuesel & King, Chapman & Hall, New York.
Pells, P. (2002). Developments in the design of tunnels and caverns in the triassic rocks of the sydney region. International Journal of Rock Mechanics and Mining Sciences, 39(5), 569-587.
Riegger, M. H. (2008, July). Calculating the annual cost of labor: setting fees correctly and fine-tuning work schedules
help keep it in line. DVM Newsmagazine, 39(7), 52+. Retrieved from Touran, A. (2003). Calculation of contingency in
construction projects. 50(2)

50
Samuel, P. (2007, January 22). Melbourne citylink burnley tunnel cost fight. Tollroadsnews. Retrieved from
http://www.tollroadsnews.com/node/1773
StatSoft, Inc. (2011). Electronic Statistics Textbook. Tulsa, OK: StatSoft. WEB: http://www.statsoft.com/textbook/.
Victoria Department of Transport. (2008). The victorian transport plan.
Vogel, M., & Rast, H. P. (2000). AlpTransit’s safety in construction as a challenge: Health and safety aspects in very deep tunnel construction. Tunnelling and Underground Space Technology, 15(4), 481-484. doi:10.1016/S0886-7798(01)00018-9
Vuilleumier, F., Weatherill, A., & Crausaz, B. (2002). Safety aspects of railway and road tunnel: Example of the lötschberg railway tunnel and mont-blanc road tunnel. Tunnelling and Underground Space Technology, 17(2), 153-158.
Webb, R. Information and Research Services, (2002).Public private partnerships: An introduction (2002-03).
Australia: Department of the Parliamentary Library.
Xiang Gu. (2010). Research on the cost control and estimation of engineering management. Paper presented at the
Advanced Management Science (ICAMS), 2010 IEEE International Conference. 1, 497-499.

51
7.0 Appendices

52
7.1 Appendix A: Frequently Asked Questions (FAQs)
1. Where did the data come from?
a. The data comes from various confidential and publically available sources, such as internal cost
breakdowns, and press releases about contract awards.
2. How do you know if the data is reliable?
a. Wherever possible, the data has been chosen from the most reliable sources, such as directly from
the companies involved, or from public press-releases. Other potential limitations on the data are
discussed in sections 4.1.5and 4.1.6.
3. What is included in the cost of tunnelling?
a. This depends on the und-use of each tunnel and the availability of cost breakdowns. With the
exception of the individual comparisons section of the report (4.3), we included the controversial
factors such as the cost of stationing, mechanical and electrical equipment, land acquisition, and
contractors P&G in general since those factors are included in the tunnels for which we only had full
project costs.
4. What currency are the costs in?
a. Average 3Q 2011 AUD.

53
7.2 Appendix B: Glossary
Bench: The unexcavated ground on the lower face of
a tunnel.
Bore: The diameter of the excavated section.
Client: The project owner; for whom the tunnel is
being constructed.
Cross Passage: A tunnel used to connect adjacent,
parallel tunnels.
Cut and Cover (C&C): A method of tunnelling
involving the excavation of a trench, construction of
the lining, and the subsequent covering of the
structure.
Design & Construct (D&C): A method of
procurement, in which the design and construction
activities are contracted to a single contractor.
Drill and Blast (D&B): A method of excavation
involving the use of explosives.
Earth Pressure Balance (EPB): A type of TBM,
typically employed in permeable soils, which
increases the pressure in the cutting chamber to
balance the intake of water and prevent subsidence.
Electrical & Mechanical (E&M): All of the equipment
used in the final fit-out of a tunnel, from railroad tracks,
to ventilation systems.
End-Use: The designed service of the completed
tunnel.
Face: The area of the bore perpendicular to the drive
alignment.
Fault: Any fracture in the substrate through which the
tunnel is driven.
Fire Life Safety (FLS): A term used to describe the
safety systems of a tunnel.
Grout/Grouting: Used to fill in voids in porous
substrate to improve ground conditions.
Heading: The top section of an excavation which
typically is excavated before the bench
Immersed: An underwater tunnel, where
prefabricated tubes are floated into position then sunk
into an excavated trench and connected.
In-Situ Concrete: Concrete that is cast in place inside
the tunnel.
Ingress/Infiltration: Penetration of groundwater into
the tunnel.
Invert: The lowest point in the tunnel face.
Jumbo: Equipment on which drills are mounted for
D&B tunnelling.
Micro-tunnelling: a method of excavation for small
bores which does not involve trenches.
Mined Tunnel: Any tunnel excavated from
underground
Mixed Face: When 2 or more ground conditions lie in
the path of the drive.
Outturn: The final cost of a project.
Pipe Jacking: A method of excavation in which
hydraulic jacks force a pipe behind the excavator as it
moves forward.
Plant: The factory set up to manufacture tunnelling
components, such as precast concrete segments.
Polypropylene Fibre: Synthetic fibres often premixed
into concrete to add strength.
Preliminaries & General (P&G): A loosely defined
set of costs related to the contractor. Typically dealing
with provision for payment, overheads, risk, etc
Procurement: The activities undertaken by a client to
obtain a completed project.
Roadheader: A piece of excavation equipment that
consists of a cutting head mounted on an articulate
boom.
Rock Anchor/Bolt: Steel bars that are grouted into
drilled holes in the tunnel walls to provide long-term
support.
Segment: The prefabricated arc shaped component
that makes up the internal lining of a tunnel.
Settlement: The lateral movement of the ground
surface directly above a tunnel.
Shaft: The vertical excavation used to provide access
and ventilation to the tunnel.
Shield: Protective steel tube that encases the TBM
during soft-ground tunnelling.
Site Investigation (SI): A thorough investigation
encompassing, surface and subsurface exploration in
order to obtain all design parameters and address any
Spoil: The excavated material, displaced by the
tunnel.
Sprayed Concrete Lining (SCL) (Shotcrete):
Concrete sprayed pneumatically through a hose onto
the surface of a tunnel for fast stabilisation.

54
Stand-Up Time: The amount of time a tunnel can
support itself post-excavation, and before any type of
structural reinforcement or lining is installed.
Steel Fibre Reinforced (SFR): A type of concrete
lining, which is reinforced by steel fibres that are
premixed into the concrete.
Tender: The proposed price of a project, by the
contractor, based off of an estimate of the bill of
materials.
Tunnel Boring Machine (TBM): A machine used to
excavate tunnels with a circular diameter. TBMs
typically run along tracks and have rotating circular
cutting heads.

55
7.4 Appendix C: Gantt Chart
Figure 26 Gantt Chart

56
7.5 Appendix D: Interview Questionnaires
7.5.1 Form A
Background on us:
We are university students from a small engineering university called WPI in Massachusetts, USA. We have been in
Melbourne for the past three weeks working on the project described below as a requirement for our degree. We have
little under 5 weeks left in Melbourne and thank you for your time.
Background on project:
Perception in the industry and in particular by Government Agencies is that overall tunnelling costs in Australia and
New Zealand (ANZ) are significantly higher than the rest of the world, but particularly compared with Europe.
There have not been any comprehensive studies confirming or denying this perception, however visiting “experts”
have reinforced this viewpoint.
There is a general scarcity of data regarding recent tunnelling costs in the region.
Objectives of project:
Determine whether or not the hypothesis of higher ANZ tunnelling costs is true.
If true, determine the factors that contribute most heavily to the higher costs.
Determine what advantages (if any) result from higher tunnel costs.
In order to complete our objectives:
We will need qualitative data (from interviews) describing the direction in which to pursue further research.
We also need any possible non-confidential cost data regarding the breakdown of tunnel bids. (If Possible)
General Questions:
1. What is the role you have most commonly had on tunnel projects?
Contractor
Cost Estimator
Consultant
Other: Please Specify
2. How many years experience do you have in the tunnelling sector?
Less than 5 years
5-10 year
Over 10 years
3. Have you worked on any tunnelling projects outside of Australia?
If Yes, Specify which countries:
4. What types of end-uses have the tunnelling projects you been involved been for?
Rail
Road
Water

57
Sewer
Cable
Other: Please Specify
5. Can you explain your position in your company and what extent of involvement you have in the tunnelling
sector (In ANZ and globally)?
6. Have many tunnelling projects have you been involved in, and when did you start working on tunnelling
projects? (Which end-uses, cost range, project skill)
a. In the past 15 years?
7. Can you list the three most recent tunnelling projects that your firm has worked on, and explain your firm’s
extent of involvement with them?
8. How specifically does your firm differ from other firms?
a. And how has this affected your business model and methodology when it comes to preparing bids
and/or estimates (N/A to consultants)?
9. What percentage of your business is related to tunnelling or projects that require a component of tunnelling?
a. Is this percentage different globally than in ANZ, if so why?
10. What would you list as the main challenges encountered when constructing tunnels compared to other
infrastructure?
11. Have there been any recent (<15 years) technological advancements or improvements in procurement
proceedings in the field that have significantly affected the way you work on tunnelling projects?
7.5.2 Form B (Cost Estimator)
Compiling Estimates
1. When compiling a cost estimate, which main categories do you use to break down various costs?
2. Are there certain cost factors that are often indeterminate or less precise that cause a lot of variance in the
estimate?
3. Please rank the following according to how you think each contributes the most to the final estimate?
a. What type of project delivery system are you typically involved in, and what do you find most
advantageous about that/these type(s). (Design complexity, in-house resource availability, flexibility,
scheduling, time, politics, financial reasons.)
Fixed price Contract-
Cost plus-
Design & Construct-
Project Management Agreement-
Construction Management Agreement-
Managing Contractor Contract-
Warranted Maximum Price Contract-
Build Own Operate Transfer-
Contract Type/Procurement Rote -

58
(No Cost Correlation) 1 2 3 4 5 6 7 8 9 10 (Significant Cost Correlation)
Lining Type -
(No Cost Correlation) 1 2 3 4 5 6 7 8 9 10 (Significant Cost Correlation)
End-Use -
(No Cost Correlation) 1 2 3 4 5 6 7 8 9 10 (Significant Cost Correlation)
Excavation Type -
(No Cost Correlation) 1 2 3 4 5 6 7 8 9 10 (Significant Cost Correlation)
Geology -
(No Cost Correlation) 1 2 3 4 5 6 7 8 9 10 (Significant Cost Correlation)
Country of Construction -
(No Cost Correlation) 1 2 3 4 5 6 7 8 9 10 (Significant Cost Correlation)
Depth of Tunnel -
(No Cost Correlation) 1 2 3 4 5 6 7 8 9 10 (Significant Cost Correlation)
4. In your opinion, to what extent do each of these parts of the design and construction process can lead to the
greatest overall variance between estimated costs and final outturn costs on a scale of 1 to 10.
Preliminary Design/Bidding
Design
Construction
Post-Construction/commissioning
5. When compiling an estimate which indices do you use to account for inflation?
a. How long does a project need to take for you to consider the effects of inflation?
6. Over the past 15 years, has there been any major legislation in ANZ that has significantly affected the way in
which you compile estimates and the overall cost of tunnelling?
Indirect Factors and Regulations
1. How do you account for indirect factors? (ie. Market structure and capacity, governance and procurement
approach, etc.)
a. Do you feel any of these variables have a large effect on cost estimates in ANZ specifically?
b. How do you convert these qualitative factors into quantitative numbers?
2. How do you account for tunnelling in an urban environment vs. a rural one?
59
3. Are there any major differences that you have noticed in design standards or regulations between different
locations? in Australia (State legislation) or Overseas (If so specify which countries)?
With Regard to:
Health & Safety:
Design Specifications:
Material Specifications:
Environmental Regulations:
Labour costs:
Engineering skills and industry capacity:
If so to what extent to these affect the estimate?
Bid Involvement
1. How similar is the tender cost to the final cost?
a. What accounts for the difference in cost?
2. At which point of the bidding process do you typically become involved?
3. What is your level of involvement with the designer, and do you have any influence on the direction of the
project?
Tunnelling in ANZ vs. other parts of the world
1. Do you personally feel that tunnelling is more expensive in ANZ?
a. If so, what factors do you think attributes to this?
b. Do you feel that there are any resulting benefits? (less required maintenance, better safety record,
increased design life, increased efficiency)
c. Does it appear that certain types of tunnels are more expensive?
d. Do you have specific examples to support this?
e. Is there a difference in the approach to constructing tunnels in ANZ versus other parts of the world?
2. Do you agree with the statement that both cost estimates and final costs are more expensive in ANZ than the
rest of the world?
7.5.3 Form C (Contractor)
Industry/Market Structure:
1. There are few major tunnelling contractors in Australia. Do you think this is because there is such a small
market, or are there high barriers to entry?
a. With such a small market; how does that affect the sustainability of the business and the
methodology behind placing bids?
b. What would you describe as the biggest barrier to becoming a contractor in the tunnel market?
(Experience, project size, machinery, financing)
2. Can you describe the level of competition you have experienced among contractors when competing for a
bid in ANZ on a scale of 1 to 10 where 1 is not competitive at all and 10 means extremely competitive?
a. Is this affected by the size of the project?
60
b. Is this affected by the location of the project?
c. Does the level of competition significantly affect the tender costs of projects in ANZ compared to
other countries?
3. On average what ratio of your projects are bid as joint ventures or alliances?
a. If so, what are the advantages? (Greater chance of being selected for the bid, less financial risk,
wider expertise)
4. What would you list as the most noticeable differences between contracting in ANZ and contracting in other
parts of the world?
a. Does it appear that any of these differences attribute to variances in costs? (Follow up: do you have
any data to support this?)
Contract:
1. Do you find any significant differences in the procurement process in ANZ when compared to the rest of the
world? (Provide examples)
2. Have you worked on multiple types of contracts?
a. If so, what type of project delivery system do you typically choose, and what do you find most
advantageous about that/these type(s). (Design complexity, in-house resource availability, flexibility,
scheduling, time, politics, and financial reasons.)
Fixed price Contract-
Cost plus-
Design & Construct-
Project Management Agreement-
Construction Management Agreement-
Managing Contractor Contract-
Warranted/Guaranteed Maximum Price Contract-
PPP’s (Public Private Partnerships)
Build Own Operate Transfer
3. Can you quantify the time that goes into preparing a bid?
a. Can you give a breakdown (percentages or ratios) of how much time goes into each activity?
b. Which area do you think could see the biggest time savings?
4. Can you describe the number of people required to set up a bid, and their roles and level of involvement?
5. During which stages of the procurement process do you think the most time and money can be saved?
6. Please rank the following factors according to how you think each attributes the most to the final bid?
Contract Type -
(No Cost Correlation) 1 2 3 4 5 6 7 8 9 10 (Significant Cost Correlation)
Lining Type -

61
(No Cost Correlation) 1 2 3 4 5 6 7 8 9 10 (Significant Cost Correlation)
End-Use -
(No Cost Correlation) 1 2 3 4 5 6 7 8 9 10 (Significant Cost Correlation)
Excavation Type -
(No Cost Correlation) 1 2 3 4 5 6 7 8 9 10 (Significant Cost Correlation)
Geology -
(No Cost Correlation) 1 2 3 4 5 6 7 8 9 10 (Significant Cost Correlation)
Country of Construction -
(No Cost Correlation) 1 2 3 4 5 6 7 8 9 10 (Significant Cost Correlation)
Depth -
(No Cost Correlation) 1 2 3 4 5 6 7 8 9 10 (Significant Cost Correlation)
Design:
1. At which point in the design process do you typically get involved? (Study, concept, preliminary, detailed
design, final design...)
a. How integrated do you get into the design of a project? (Scale of 1 to 10, with 10 being completely
integrated and 1 being not involved)
2. How much flexibility do you have in design when working with a consultant? (Scale of 1 to 10)
a. Is this different when working on a government project?
3. Do you often see major changes to the scope during this stage that could result in cost escalation?
a. If so, is this more noticeable in Australia than in other countries?
4. Are there any major differences that you have noticed in design standards or regulations between different
locations in Australia (State legislation) or Overseas (If so specify which countries)?
With Regard to:
Health & Safety:
Design Specifications:
Material Specifications:
Environmental Regulations:
Labour costs:
Engineering skills and industry capacity:
How does each of these affect the estimate?
Regulations and Compliance:

62
1. To what extent do you feel that the cost of compliance with the following standards is noticeably higher in
ANZ than the rest of the world?
Environmental
Health and Safety
a. If so: Can you provide any specific examples?
2. Over the past 15 years, has there been any major legislation in ANZ that has significantly affected the way in
which you bid for contracts and the overall cost of tunnelling?
3. Most major tunnelling projects in ANZ are government sponsored. To what extent do you think this leads to
greater scrutiny and level of compliance?
a. If so: Does this increased compliance lead to significantly higher costs?
Risk and Contingency:
1. Does the country in which you are bidding on a project affect the amount of contingency you allocate in the
bid?
2. On average, what percentage of the bid price is left for contingency in your ANZ tunnelling projects?
a. How does that breakdown differ from other infrastructure projects?
b. How is that different from other parts of the world?
3. What timescale does a project have to be for you to consider the effects of inflation?
a. How exactly do you typically account for this, and is this different depending on location?
4. To what extent is risk dependent on geological uncertainty?
a. Is this more of a noticeable problem in ANZ when compared to other countries?
Inputs:
1. Do you source your materials locally for ANZ projects? What percentage of materials is sourced locally?
a. Do you see this as specific to ANZ, or is it standard around the world?
2. What percentage of your labour force typically is locally sourced? Is it more cost effective to bring in people
from other locations?
a. If so, is a specific skill in tunnelling projects necessary? (Specify)
3. Do you find the cost of labour to be particularly high in Australia, and if so is there any noticeable benefit?
(More skilled labour, more productivity)
4. Can you describe how financing is typically handled with your projects, and do you know of any major
differences in the way this is handled between ANZ and the rest of the world?
Construction:
1. Do you own, or rent the majority of your equipment? What percentage of each?
2. Have you encountered the ability to reuse specialized equipment like TBMs or are they typically only utilized
once for specific jobs?
a. If so, what is the typical life cycle of this high-cost machinery?
3. Do you find that the speed in which you complete the project is one of the most important factors for reducing
cost?
a. Does this affect the number of TBMs used in the construction process?
i. If so, how is this determined? (Cost-benefit analysis, arbitrarily, experience)

63
4. Can you describe the variance in the size of your workforce during the various stages of a project?
(Percentages if possible)
Preliminary Design/Bidding -
Design -
Construction -
Post-Construction/Commissioning -
5. Is there any major difference in insurance costs between countries you have built tunnels in?
6. Is it easier to stay on schedule in countries that have higher design standards?
a. If so: Do you think this is due to experience or higher reliability?
b. If not: Do you think this is because of more time required to meet regulations?
i. Also, do you think there is a benefit to this? (Better tunnel, more cost effective, better
safety record)
7. Do you often try to use prefabricated materials in your tunnelling projects? (Percentage if possible)
a. Is this common in ANZ vs. the rest of the world? Is this because of ANZ’s economic and market
ability to run these plants?
Project Scope / Outturn:
1. How often do projects come in under budget? (Percentages)
a. If rarely/never: Is this because any cost savings gets consumed by an increase in the scope?
b. If sometimes/most of the time: Is this because of an excessive contingency, or some other factor,
combination of factors?
2. Do you feel that tunnels in ANZ require less maintenance than tunnels in the rest of the world?
a. Is this because of improvements made in the design process, or the construction process? (Is it
worth it?)
3. In your opinion, for your ANZ tunnelling projects, which of the following areas often result in the greatest cost
escalation? (Scale of 1-10 if possible)
Feasibility –
Design -
Pre-construction -
Construction -
Commissioning –
4. Do you feel that these escalated costs have any long term value? (Such as a longer tunnel lifetime,
increased safety, increased efficiency, less maintenance)
7.5.4 Form D (Consultants)
Design:
1. Can you list and briefly describe your firm’s involvement in the three most recent tunnelling projects your firm
has designed?
2. To what extent does the design of a tunnel depend on indirect factors? (ie. Market structure and capacity,
governance and procurement approach, etc.)

64
a. Do you feel that any of these vary greatly in ANZ compared to other nations?If so specify countries
and factors
3. What kind of design changes would you make when designing a tunnel in an urban instead of a rural project?
a. To what extent do you believe that these changes greatly increase the cost of the tunnel?
4. How flexible is the design in a project when working in the private sector? (From 1 to 10 where 1 is not at all
flexible and 10 is extremely flexible)
a. Is this different when working on a government project? (If so how flexible is that on the same scale)
5. Do you often try to design for the use of prefabricated materials in your tunnelling projects? (If so what
percentage prefab)
a. Is this common in ANZ vs. The rest of the world? Is this because of ANZ’s economic and market
ability to run these plants?
b. What are the advantages to this in the design and construction process if any?
6. During which stages of the design process do you think the most time and money can be saved?
Regulations and Compliance:
1. To what extent do the government regulations and compliance affect the overall design of a tunnel in ANZ?
2. To what extent do the Environmental Impact Assessment and other environmental regulations affect the
design process, and how much time is typically consumed completing the process in ANZ?
3. Are there any major differences that you have noticed in design standards or regulations between different
countries? In Australia (State legislation) or Overseas (If so specify which countries)?
With Regard to:
Design Specifications:
Material Specifications:
Environmental Regulations:
Engineering skills and industry capacity:
If so to what extent do these affect the design? (Ranking if possible)
4. Over the past 15 years, has there been any major legislation in ANZ that has significantly affected the way in
which you design tunnels?
Risk and Contingency:
1. To what extent does the amount of site investigation and geological analysis affect tunnel design?
a. Do you believe that increased studies would favourably affect costs because of greater certainty?
b. In your opinion, is ANZ more challenging to tunnel in because of geological factors?
2. Because of the high level of geological uncertainty, are tunnels typically over designed with high safety
factors when compared to other infrastructure?
Project Scope / Outturn:
1. Do you feel that tunnels in ANZ are designed with higher standards than tunnels in the rest of the world?
(Better safety, more efficiency, less maintenance)
a. Is this because of improvements made in the design process, or the construction process? (Is it
worth it?)
Tunnelling in ANZ vs. other parts of the world

65
1. Do you personally feel that tunnelling is more expensive in ANZ?
a. If so, what factors do you think attribute to this?
b. Does it appear that certain types of tunnels are more expensive?
i. Do you have specific examples to support this?
c. Is there a difference in the approach to designing tunnels in ANZ versus other parts of the world?
7.5.5 Closing (All Forms)
Where do you see the key opportunities to reduce the cost of tunnel delivery in ANZ? (Rank by opportunity for cost
savings)
Design Low----------------------Medium----------------------High
SI / GI Low----------------------Medium----------------------High
Env. Remediation Low----------------------Medium----------------------High
Health & Safety Regs. Low----------------------Medium----------------------High
Materials Low----------------------Medium----------------------High
Labour Low----------------------Medium----------------------High
Enabling Works Low----------------------Medium----------------------High
Commissioning Low----------------------Medium----------------------High
Client Leadership Low----------------------Medium----------------------High
Procurement Stage Low----------------------Medium----------------------High
Supply Chain (Eng.) Low----------------------Medium----------------------High
________________ Low----------------------Medium----------------------High
________________ Low----------------------Medium----------------------High
________________ Low----------------------Medium----------------------High
Do you have any data that we could use to support these assumptions?
Are there any other contacts you would recommend us to speak with in regard to our project?

66
7.6 Appendix E: Tunnels Research Survey
We are three engineering students working on a university tunnel research project in collaboration with AECOM. Through our research, we seek to investigate the various factors that influence the cost of tunnelling projects in Australia and New Zealand. This preliminary survey will help provide qualitative information to guide our research. The survey takes less than 5 minutes to complete and your input is greatly appreciated.
Page 1 - Question 1 - Choice - One Answer (Bullets) [Mandatory]
How many years of experience do you have in the tunnelling sector?
Less than 5 years
5 - 10 years
10 - 20 years
Over 20 years
Page 1 - Question 2 - Choice - Multiple Answers (Bullets) [Mandatory] [Up To 2 Answers]
Have you worked on any tunnelling projects outside Australia?
No
Yes
If Yes, please specify which countries
Page 1 - Question 3 - Choice - Multiple Answers (Bullets) [Mandatory]
Which types of tunnel projects have you been involved in?
Rail (heavy/light/metro)
Road
Water / Hydro-power
Sewer / Wastewater
Cable
Pedestrian
Other, please specify
Page 1 - Question 4 - Choice - One Answer (Bullets) [Mandatory]
What is the role you have most commonly held on tunnel projects?
Contractor
Cost Estimator

67
Consultant
Client
Other, please specify
Page 2 - Question 5 - Rating Scale - Matrix [Mandatory]
Thinking about factors that can contribute to tunnel costs, please score the following according to how much of an influence you believe it has on the final cost of a tunnel project. (1=low, 5=high)
1 2 3 4 5 U n s u r e Contract Type
Lining Type
End-Use
Excavation Type
Geology
Country
Locality
Depth
Page 2 - Question 6 - Rating Scale - Matrix [Mandatory]
In your opinion, what do you believe are the key opportunities to reduce the cost of tunnel delivery in Australia and New Zealand? Please rank by opportunity for cost savings. (1=low, 5=high)
1 2 3 4 5 Un su r e Design Specifications &
Standards
Site/Ground Investigation
Environmental
Remediation
Health & Safety
Regulation
Materials
Labour
Enabling Works
Commissioning
Client Leadership &
Management
Procurement Strategy
Supply Chain & Capacity

68
Page 2 - Question 7 - Choice - One Answer (Bullets) [Mandatory]
Do you personally feel that tunnelling is more expensive in Australia and New Zealand when compared to other countries?
Yes [Skip to 3]
No [Skip to 4]
Unsure [Skip to 3]
Comments
Page 3 - Question 8 - Choice - Multiple Answers (Bullets)
Which benefits (if any) do you believe are associated with the higher cost of tunnels in Australia and New Zealand
No Benefits Exist
Faster Completion
Better Construction Safety Record
Greater Adherence to Environmental Standards
Reduced Operations and Maintenance Cost
Better Post-Commissioning Safety
Longer Service Life
Other, please specify
Page 4 - Question 9 - Open Ended - Comments Box
Would you like to make any further comments regarding tunnel costs that would be relevant to this research?
Page 4 - Question 10 - Name and Address (U.S)
If you would you like to be involved in more in-depth research regarding tunnel costs provide your email address below and we will contact you shortly.
Email Address
Page 4 - Question 11 - Name and Address (U.S)
If you would like to receive information on the results of this research please provide the following details.
Name
Company
Email Address

69
Page 4 - Heading
Thanks for completing the survey. If you could please pass the link to this survey on to any of your tunnelling colleagues to complete we would be very grateful.
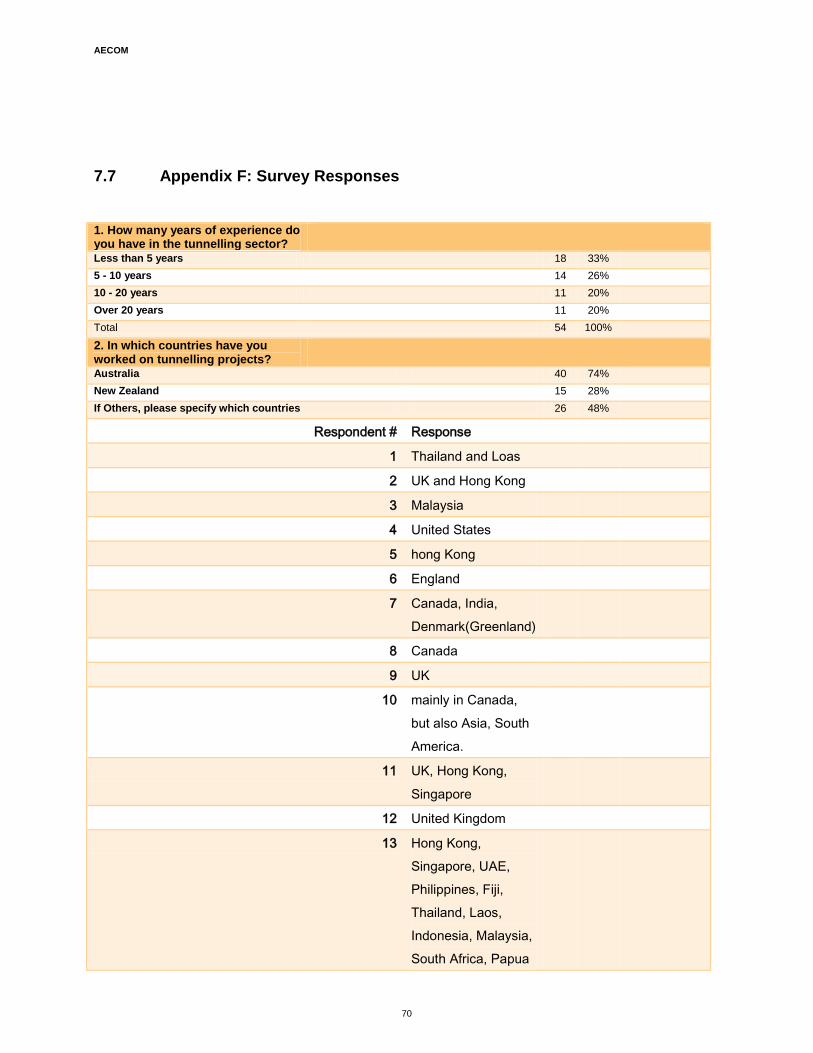
AECOM
70
7.7 Appendix F: Survey Responses
1. How many years of experience do you have in the tunnelling sector?
Less than 5 years 18 33%
5 - 10 years 14 26%
10 - 20 years 11 20%
Over 20 years 11 20%
Total 54 100%
2. In which countries have you worked on tunnelling projects?
Australia 40 74%
New Zealand 15 28%
If Others, please specify which countries 26 48%
Respondent # Response
1 Thailand and Loas
2 UK and Hong Kong
3 Malaysia
4 United States
5 hong Kong
6 England
7 Canada, India,
Denmark(Greenland)
8 Canada
9 UK
10 mainly in Canada,
but also Asia, South
America.
11 UK, Hong Kong,
Singapore
12 United Kingdom
13 Hong Kong,
Singapore, UAE,
Philippines, Fiji,
Thailand, Laos,
Indonesia, Malaysia,
South Africa, Papua

AECOM
71
New Guinea
14 Singapore
15 US
16 Papua New Guinea
17 Hong Kong,
Singaopre, Malaysia
18 United Kingdom,
Thailand
19 HK, Singapore,
Thailand
20 Sri Lanka,
21 None
22 UK
23 UK and Ireland
24 UK, USA, Malaysia,
Hong Kong,
Thailand, Singapore
25 UK
26 Philippines
3. Which types of tunnel projects have you been involved in?
Rail (heavy/light/metro) 25 46%
Road 30 56%
Water / Hydro-power 25 46%
Sewer / Wastewater 21 39%
Cable 8 15%
Pedestrian 8 15%
Other, please specify 2 4%
Respondent # Response
1 Only limited experience - two
cut and cover tunnels
2 Mine access and mining
4. What is the role you have most commonly held on tunnel projects?
Contractor 19 35%
Cost Estimator 5 9%
Consultant 26 48%
Client 8 15%
Other, please specify 6 11%

AECOM
72
Respondent # Response
1 Land use planning and
approvals
2 Mainly involved with
pavements in tunnels. I have
recently been doing some work
on Airport Link in Brisbane
assisting with the pavement
construction in the tunnel. That
project could provide some
excellent recent history and if I
can assist with providing
contacts let me know.
3 Engineer involed with lowering
tunnel floor, daylighting,
drainage & general
maintenance. No new tunnel.
4 Senior Mgmt
5 Design Engineer
6 Client Representative in
Alliance
5.) Thinking about factors that can contribute to tunnel costs, please score the following according to how much of an influence you believe it has on the final cost of a tunnel project.: Contract Type
Total*
What is the role you have most commonly held on tunnel projects?
Contractor Cost
Estimator Consultant Client
Other, please specify
41 14 4 18 8 4
1 1 1 0 0 0 0
(No Cost Correlation)
2 4 2 1 1 0 1
3 12 3 1 6 1 2
4 13 4 1 7 3 1
5 10 4 1 3 4 0

AECOM
73
(Significant Cost Correlation )
6 1 0 0 1 0 0
(Unsure)
5.) Thinking about factors that can contribute to tunnel costs, please score the following according to how much of an influence you believe it has on the final cost of a tunnel project.: Lining Type
Total*
What is the role you have most commonly held on tunnel projects?
Contractor Cost
Estimator Consultant Client
Other, please specify
41 14 4 18 8 4
1 0 0 0 0 0 0
(No Cost Correlation)
2 3 2 0 1 0 0
3 12 4 2 7 1 2
4 15 5 1 8 3 1
5 10 3 1 2 3 1
(Significant Cost Correlation)
6 1 0 0 0 1 0
(Unsure)
5.) Thinking about factors that can contribute to tunnel costs, please score the following according to how much of an influence you believe it has on the final cost of a tunnel project.: End Use
Total*
What is the role you have most commonly held on tunnel projects?
Contractor Cost
Estimator Consultant Client
Other, please specify
41 14 4 18 8 4
1 2 1 1 0 0 0
(No Cost Correlation)
2 3 2 0 1 0 0
3 8 4 0 2 1 1
4 14 2 2 8 3 0
5 11 5 1 6 2 3
(Significant Cost Correlation)
6 3 0 0 1 2 0
(Unsure)
5.) Thinking about factors that can contribute to tunnel costs, please score the following according to how much of an influence you believe it has on the final cost of a tunnel project.: Excavation Type

AECOM
74
Total*
What is the role you have most commonly held on tunnel projects?
Contractor Cost
Estimator Consultant Client
Other, please specify
41 14 4 18 8 4
1 0 0 0 0 0 0
(No Cost Correlation)
2 0 0 0 0 0 0
3 7 1 2 4 2 0
4 14 3 1 6 5 1
5 19 10 1 7 1 3
(Significant Cost Correlation)
6 1 0 0 1 0 0
(Unsure)
5.) Thinking about factors that can contribute to tunnel costs, please score the following according to how much of an influence you believe it has on the final cost of a tunnel project.: Geology
Total*
What is the role you have most commonly held on tunnel projects?
Contractor Cost
Estimator Consultant Client
Other, please specify
41 14 4 18 8 4
1 0 0 0 0 0 0
(No Cost Correlation)
2 0 0 0 0 0 0
3 2 0 0 1 1 0
4 8 1 1 5 1 0
5 30 13 3 11 6 4
(Significant Cost Correlation)
6 1 0 0 1 0 0
(Unsure)
5.) Thinking about factors that can contribute to tunnel costs, please score the following according to how much of an influence you believe it has on the final cost of a tunnel project.: Country of Construction
Total*
What is the role you have most commonly held on tunnel projects?
Contractor Cost
Estimator Consultant Client
Other, please specify
41 14 4 18 8 4
1 0 0 0 0 0 0

AECOM
75
(No Cost Correlation)
2 2 0 0 2 0 0
3 8 2 1 3 2 1
4 17 6 2 10 2 1
5 7 4 1 1 1 2
(Significant Cost Correlation)
6 7 2 0 2 3 0
(Unsure)
5.) Thinking about factors that can contribute to tunnel costs, please score the following according to how much of an influence you believe it has on the final cost of a tunnel project.: Locality (urban vs rural)
Total*
What is the role you have most commonly held on tunnel projects?
Contractor Cost
Estimator Consultant Client
Other, please specify
41 14 4 18 8 4
1 1 1 0 0 0 0
(No Cost Correlation)
2 1 0 0 1 0 0
3 7 3 0 3 1 2
4 16 7 1 7 3 0
5 13 3 2 5 3 2
(Significant Cost Correlation)
6 3 0 1 2 1 0
(Unsure)
5.) Thinking about factors that can contribute to tunnel costs, please score the following according to how much of an influence you believe it has on the final cost of a tunnel project.: Depth
Total*
What is the role you have most commonly held on tunnel projects?
Contractor Cost
Estimator Consultant Client
Other, please specify
41 14 4 18 8 4
1 0 0 0 0 0 0
(No Cost Correlation)
2 5 1 1 4 0 0
3 16 8 2 4 3 2
4 13 3 1 9 3 0

AECOM
76
5 5 2 0 0 1 2
(Significant Cost Correlation)
6 2 0 0 1 1 0
(Unsure)
6.) In your opinion, what do you believe are the key opportunities to reduce the cost of tunnel delivery in Australia and New Zealand? Please rank by opportunity for cost savings.: Design Specifications and Standards
Total* What is the role you have most commonly held on tunnel projects?
Contractor Cost Estimator
Consultant Client Other, please specify
43 16 5 18 8 4
1 2 2 1 0 0 0
(Minimal Cost Saving Opportunities)
2 6 3 0 2 0 1
3 8 2 1 4 1 0
4 17 8 2 6 4 2
5 6 1 0 3 2 1
(High Cost Saving Opportunities)
6 4 0 1 3 1 0
(Unsure)
6.) In your opinion, what do you believe are the key opportunities to reduce the cost of tunnel delivery in Australia and New Zealand? Please rank by opportunity for cost savings.: Site Investigation / Ground Investigation
Total* What is the role you have most commonly held on tunnel projects?
Contractor Cost Estimator
Consultant Client Other, please specify
43 16 5 18 8 4
1 0 0 0 0 0 0
(Minimal Cost Saving Opportunities)
2 2 1 1 0 0 1
3 5 2 0 2 1 1
4 21 8 3 10 3 1
5 13 5 1 5 3 1
(High Cost Saving Opportunities)
6 2 0 0 1 1 0

AECOM
77
(Unsure)
6.) In your opinion, what do you believe are the key opportunities to reduce the cost of tunnel delivery in Australia and New Zealand? Please rank by opportunity for cost savings.: Environmental Remediation
Total* What is the role you have most commonly held on tunnel projects?
Contractor Cost Estimator
Consultant Client Other, please specify
43 16 5 18 8 4
1 2 0 0 1 0 1
(Minimal Cost Saving Opportunities)
2 8 5 0 2 1 0
3 16 6 2 7 4 2
4 10 4 2 3 2 1
5 0 0 0 0 0 0
(High Cost Saving Opportunities)
6 7 1 1 5 1 0
(Unsure)
6.) In your opinion, what do you believe are the key opportunities to reduce the cost of tunnel delivery in Australia and New Zealand? Please rank by opportunity for cost savings.: Health and Safety Regulations
Total* What is the role you have most commonly held on tunnel projects?
Contractor Cost Estimator
Consultant Client Other, please specify
43 16 5 18 8 4
1 5 1 2 3 0 0
(Minimal Cost Saving Opportunities)
2 10 6 1 1 3 0
3 14 4 1 7 3 2
4 10 3 1 5 2 1
5 2 2 0 0 0 1
(High Cost Saving Opportunities)
6 2 0 0 2 0 0
(Unsure)
6.) In your opinion, what do you believe are the key opportunities to reduce the cost of tunnel delivery in Australia and New Zealand? Please rank by opportunity for cost savings.: Materials
Total* What is the role you have most commonly held on tunnel projects?
Contractor Cost Estimator
Consultant Client Other, please specify
43 16 5 18 8 4

AECOM
78
1 1 0 0 0 0 1
(Minimal Cost Saving Opportunities)
2 6 5 1 1 0 0
3 18 8 2 8 4 2
4 13 2 2 6 3 1
5 1 1 0 0 0 0
(High Cost Saving Opportunities)
6 4 0 0 3 1 0
(Unsure)
6.) In your opinion, what do you believe are the key opportunities to reduce the cost of tunnel delivery in Australia and New Zealand? Please rank by opportunity for cost savings.: Labour
Total* What is the role you have most commonly held on tunnel projects?
Contractor Cost Estimator
Consultant Client Other, please specify
43 16 5 18 8 4
1 1 0 0 0 0 1
(Minimal Cost Saving Opportunities)
2 4 4 0 0 0 0
3 13 3 3 5 4 2
4 15 5 0 10 2 0
5 7 4 2 1 1 1
(High Cost Saving Opportunities)
6 3 0 0 2 1 0
(Unsure)
6.) In your opinion, what do you believe are the key opportunities to reduce the cost of tunnel delivery in Australia and New Zealand? Please rank by opportunity for cost savings.: Enabling Works
Total* What is the role you have most commonly held on tunnel projects?
Contractor Cost Estimator
Consultant Client Other, please specify
43 16 5 18 8 4
1 0 0 0 0 0 0
(Minimal Cost Saving Opportunities)
2 3 2 0 1 0 0
3 20 9 2 6 4 2
4 10 4 1 6 1 1

AECOM
79
5 1 1 1 0 0 0
(High Cost Saving Opportunities)
6 9 0 1 5 3 1
(Unsure)
6.) In your opinion, what do you believe are the key opportunities to reduce the cost of tunnel delivery in Australia and New Zealand? Please rank by opportunity for cost savings.: Commissioning
Total* What is the role you have most commonly held on tunnel projects?
Contractor Cost Estimator
Consultant Client Other, please specify
43 16 5 18 8 4
1 3 0 0 2 0 1
(Minimal Cost Saving Opportunities)
2 8 5 2 2 1 0
3 18 7 2 6 4 2
4 4 1 0 3 1 0
5 1 1 0 1 0 0
(High Cost Saving Opportunities)
6 9 2 1 4 2 1
(Unsure)
6.) In your opinion, what do you believe are the key opportunities to reduce the cost of tunnel delivery in Australia and New Zealand? Please rank by opportunity for cost savings.: Client Leadership and Management
Total* What is the role you have most commonly held on tunnel projects?
Contractor Cost Estimator
Consultant Client Other, please specify
43 16 5 18 8 4
1 0 0 0 0 0 0
(Minimal Cost Saving Opportunities)
2 3 2 0 0 0 1
3 14 6 3 3 3 2
4 12 4 0 6 3 0
5 11 4 1 6 2 1
(High Cost Saving Opportunities)
6 3 0 1 3 0 0
(Unsure)
6.) In your opinion, what do you believe are the key opportunities to reduce the cost of tunnel delivery in Australia and New Zealand? Please rank by opportunity for cost savings.: Procurement Strategy
Total* What is the role you have most commonly held on tunnel projects?

AECOM
80
Contractor Cost Estimator
Consultant Client Other, please specify
43 16 5 18 8 4
1 0 0 0 0 0 0
(Minimal Cost Saving Opportunities)
2 1 0 0 1 0 0
3 13 7 4 3 1 1
4 18 7 1 7 5 1
5 8 2 0 5 2 1
(High Cost Saving Opportunities)
6 3 0 0 2 0 1
(Unsure)
6.) In your opinion, what do you believe are the key opportunities to reduce the cost of tunnel delivery in Australia and New Zealand? Please rank by opportunity for cost savings.: Supply Chain and Capacity (Engineers)
Total* What is the role you have most commonly held on tunnel projects?
Contractor Cost Estimator
Consultant Client Other, please specify
43 16 5 18 8 4
1 0 0 0 0 0 0
(Minimal Cost Saving Opportunities)
2 4 0 0 3 0 1
3 16 9 3 3 2 1
4 18 6 2 9 5 2
5 1 1 0 0 0 0
(High Cost Saving Opportunities)
6 4 0 0 3 1 0
(Unsure)
7. Do you personally feel that tunnelling is more expensive in Australia and New Zealand when compared to other countries? Yes 21 49%
No 7 16%
Unsure 15 35%
Total 43 100%
Respondent # Response
1 More so in Australia
2 Extremely So (Unions and rest of BULLSHIT)

AECOM
81
required to meet about 9 assorted standards
3 I assume we are comparing with non-western
countries which have cheaper labour and less
restrictions
4 Labour costs
5 Labour & Materials
6 High labour costs Distance from some suppliers
7 Labour in particular seems very high compared to
other countries
8 not working in area
9 This may be influenced by current high exchange rate
10 There are frequenst claims that costs are higher in
Australia, but when accurate and relevant
comparisons are drawn this is often found to be
untrue. Its important to compare apples with apples.
11 Since 2000, tunnelling costs in Australia have
increased 4-5 fold
12 - High labour cost base - Typically fire life & safety
best in world - Design (architectural)driving up
underground cost (ie stations)
13 Feedback from European colleagues (in particular
Spain).
14 Most probably because of our higher labour costs,
higher contractor margins and more stringent safety
and environmental compliance requirements
15 Probably similar compared with developed countries.
16 labour is more expensive.
8. Do you feel these higher costs are mainly due to:
a higher tender cost 6 17%
a higher final cost 7 20%
a combination of the higher tender and final costs
17 49%
Other, please specify 8 23%
Respondent # Response
1 Don't know if tunneling costs are higher in Aus/NZ.
2 unsure

AECOM
82
3 higher costs related to what?
4 Current Exchnage rates make costs look high
compared to UK for example.
5 Environmwnral, EIS
requirements
6 not familiar with NZ & Aus
7 See Q7
8 We dont think big enough or long term enough to
have a straegy that would allow efficiency in volume
9. Which benefits (if any) do you believe are associated with the higher cost of tunnels in Australia and New Zealand
No Benefits Exist 8 23%
Faster Completion 2 6%
Better Construction Safety Record 15 43%
Greater Adherence to Environmental Standards
15 43%
Reduced Operations and Maintenance Cost 10 29%
Better Post-Commissioning Safety 7 20%
Longer Service Life 11 31%
Other, please specify 7 20%
Respondent # Response
1 I am unsure
2 No knowledge
3 unsure
4 don't know the relative costs of this area compare to my area of work.
5 Higher safety standards e.g deluge rates and exit spacing in road
tunnels, than european standards have higher cost but potentially higher
benefits in a fire.
6 not familiar with NZ & Aus
7 Fire life and safety (road/rail
tunnels)
10. Would you like to make any further comments regarding tunnel costs that would be relevant to this research?
Respondent # Response
1 Integration of best practises and technologies accross various tunneling
clients. i.e Understanding what mining technologies are avaialble when
designing a water tunnel are important to best cost outcome.
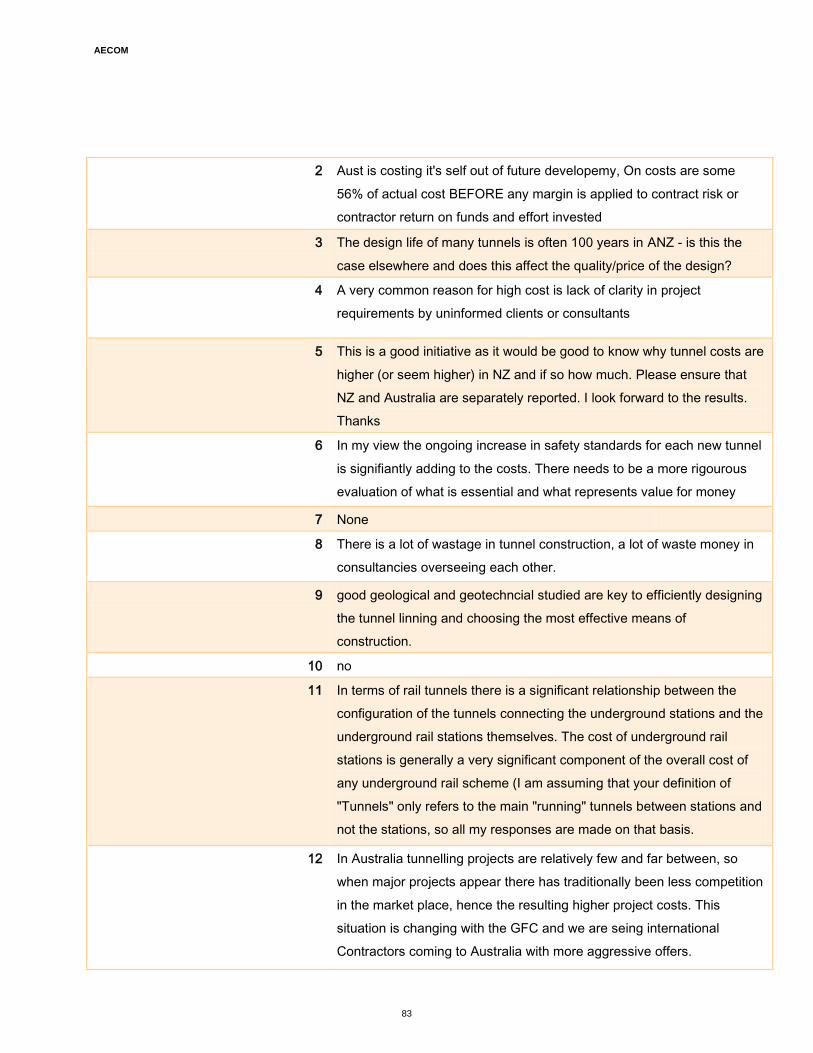
AECOM
83
2 Aust is costing it's self out of future developemy, On costs are some
56% of actual cost BEFORE any margin is applied to contract risk or
contractor return on funds and effort invested
3 The design life of many tunnels is often 100 years in ANZ - is this the
case elsewhere and does this affect the quality/price of the design?
4 A very common reason for high cost is lack of clarity in project
requirements by uninformed clients or consultants
5 This is a good initiative as it would be good to know why tunnel costs are
higher (or seem higher) in NZ and if so how much. Please ensure that
NZ and Australia are separately reported. I look forward to the results.
Thanks
6 In my view the ongoing increase in safety standards for each new tunnel
is signifiantly adding to the costs. There needs to be a more rigourous
evaluation of what is essential and what represents value for money
7 None
8 There is a lot of wastage in tunnel construction, a lot of waste money in
consultancies overseeing each other.
9 good geological and geotechncial studied are key to efficiently designing
the tunnel linning and choosing the most effective means of
construction.
10 no
11 In terms of rail tunnels there is a significant relationship between the
configuration of the tunnels connecting the underground stations and the
underground rail stations themselves. The cost of underground rail
stations is generally a very significant component of the overall cost of
any underground rail scheme (I am assuming that your definition of
"Tunnels" only refers to the main "running" tunnels between stations and
not the stations, so all my responses are made on that basis.
12 In Australia tunnelling projects are relatively few and far between, so
when major projects appear there has traditionally been less competition
in the market place, hence the resulting higher project costs. This
situation is changing with the GFC and we are seing international
Contractors coming to Australia with more aggressive offers.

AECOM
84
13 The main costs of construction are mainly with the construction of the
civil works. The main cost of the operation and maintenance relates to
the M&E systems in particular the Fire Life Safety systems and the ITS
systems.
14 Not at present

AECOM
85
7.8 Appendix G: Conversion Factors
7.8.1 Exchange Rates for 3rd Quarter 2011
Table 6 Exchange Rates for 3rd
Quarter 2011
Per United States Dollar United States Dollar per...
AUD 0.95075 1.051801
EUR 0.7066 1.415228
GBP 0.62056 1.611448
HKD 7.79294 0.128321
ILS 3.53892 0.282572
NZD 1.14978 0.869732
SGD 1.22342 0.817381
TWD 28.95654 0.034535
VND 20537.55 4.87E-05
ZAR 7.09617 0.140921
AED 3.67233 0.272307
IEP 0.7066 1.415228
JPY 77.77383 0.012858
DFL 1.78 0.561798
NOK 5.48637 0.18227
CHF 0.82307 1.214963
INR 45.79869 0.021835
MYR 3.01018 0.332206
DKK 5.26488 0.189938
KRW 1079.5 0.000926
FRF 0.7066 1.415228

AECOM
86
7.8.2 Construction Price Indices and Inflation Rates
Table 7 Construction price Indices
Eu
rop
ea
n U
nio
n
(27
co
un
trie
s)
Eu
rop
ea
n U
nio
n
(15
co
un
trie
s)
Ge
rma
ny
Ire
lan
d
Sp
ain
Fra
nc
e
Ita
ly
Neth
erl
an
ds
Sw
ed
en
Un
ite
d K
ing
do
m
No
rwa
y
Au
str
ali
a
Un
ite
d S
tate
s
New
Ze
ala
nd
Isra
el
Ch
ina
Ja
pa
n
Sw
itze
rla
nd
Q4 2011
: : : : : : : 115.5
0(p)
: : 130.3 159.6 99.1 : 252.9 1476 :
Q3 2011
119.69
119.53
115.6 91.1 126.96
124.88
:(cp) 115.47
125.9 : 129.13
159.4 98.8 1614 251.3 1452 132.6
Q2 2011
119 118.8
5
115.5 90.8 126.7
8
124.3
7
:(cp) 115.0
7(p)
125.4 118.6 128.64
159.5 98.4 1601 248.6 1425 : :
Q1 2011
118.3
2
118.1
6
114.4 91.8 125.6
3
123.6
5
:(cp) 114.5
7(p)
124.1 116.1
0(p)
127.23
156.8 98.5 1558 240.7 1385 : 131.2
Q4 2010
116.5
9
116.4
3
112.6 93.9 122.7
4
120.9
9
:(cp) 113.5
0(p)
123 115.7
0(p)
125.86
157.2 98.8 1539 234.3 1367 : :
Q3 2010
116.2
7
116.1
1
111.7 94 122.2
6(p)
120.4
2
:(c) 113.2
0(p)
122.6 115.8
0(p)
124.63
156.0 97.5 1533 232.8 1342 : 128.5
Q2 2010
116.2 116.0
6
111.7 93.4 122.3
8
119.9
9
:(c) 113.0
7(p)
122.4 116.0
0(p)
124.17
153.9 97.4 1521 232.3 1315 : :
Q1 2010
114.6
6
114.4
7
110.4 91.9 119.4
2
117.9 :(c) 112.2
7(p)
120.7 115.4 122.56
153.7 98.0 1519 231.2 1297 : 128.5
Q4 2009
114.0
8
113.8
7
109.3 91.2 118.7
9
117 :(c) 111.4 120 115 121.67
153.0 99.5 1515 226.4 1273 : :
Q3 2009
114.0
2
113.8
2
108.9 91 118.7
2
116.6
8
111.4
7
112.2 119.2 115 120.69
152.9 98.3 1494 224.0 1253 : 127.3
Q2 2009
114.0
6
113.8
7
109.3 91.9 118.5
6
116.4
2(e)
111.6
3
112.5
7
119 115.2 119.77
154.2 98.4 1486 216.8 1242 : :
Q1 2009
114.82
114.63
109.8 97.2 118.67
116.51(e)
111.93
113.26
118.4 116.9 119.67
157.3 101.8 1472 208.6 1245 101.3 126.6
Q4 2008
114.7
1
114.4
9
109.8 100 117.9
2
116.5
1(e)
111.3
7
112.4
3
117.8 116.7 119.46
161.3 102.6 1449 211.2 1281 : :
Q3 2008
115.5
9
115.3
7
110.6 101 120.4
6
118.4
3(e)
112.6 113.4
7
118.7 115.7 118.16
163.3 102.6 1436 230.8 1355 : 131.7
Q2 2008
113.7
6
113.5
4
108.6 103 118.2
1
116.2
5(e)
110.3
2
111.8
7
116.8 113.8 117.2 159.8 104.0 1405 222.4 1360 : :
Q1 2008
111.46
111.25
107.4 107 113.25
113.69(e)
108 110.1 114.1 112.2 116.07
156.6 105.2 1384 208.9 1239 110.2 129.1
Q4 2007
110.0
8
109.9
1
106.3 109 113.5
9
111.3
4(e)
106.8
3
107.7
7
113 109.9 114.29
153.5 106.4 1374 207.2 1150 : :
Q3 2007
109.5
4
109.3
9
106.5 111 112.3
1
110.7
6(e)
106.8 107.8
7
112.6 108.8 112 151.6 107.2 1358 197.0 1175 : 127.6
Q2 2007
109.0
7
108.9
7
106 113 112.5
5
109.9
9(e)
106.7 107.3 111.1 107.9 110.97
149.3 106.5 1340 191.8 1074 : :

AECOM
87
Q1 2007
107.7 107.6
4
104.3 114 110.2
9
108.4
7(e)
105.8 106.4
7
109 107 108.3 146.7 108.2 1335 186.1 1020 100.2 125.3
Q4 2006
106.0
2
105.9
5
104.1 113 108.3
4
106.8
1(e)
103.4
7
104.4
7
107.2 105.4 106.33
145.2 107.8 1330 183.2 990 : :
Q3 2006
105.3
8
105.3
6
102.7 112 108.0
9
106.3
5(e)
103.2
3
103.9 106 104.7 103.8 143.4 107.0 1310 187.2 985 : 123.3
Q2 2006
104.3
8
104.4 101.6 109 106.7
1
104.8
4(e)
102.8
7
102.5
3
104.5 104.5 102.93
141.0 106.1 1300 186.5 980 : :
Q1 2006
103.1 103.1
3
101.3 105 104.2
3
103.3
3(e)
101.5
5
101.8
3
102.4 104.5 101.93
138.8 105.7 1283 184.4 970 98.2 119.8
Q4 2005
101.2 101.1
9
100 104 100.7
1
101.3
0(e)
100.5 100.5 100.9 102.3 101.13
137.1 104.1 1273 178.9 970 : :
Q3 2005
100.4
3
100.4
3
100.2 100 100 99.98(e)
100.4
7
100.1
3
100.5 101.2 100.17
135.9 101.3 1248 179.6 963 : 118.7
Q2 2005
99.57 99.56 99.7 98.6 99.75 99.30(e)
99.9 99.73 99.8 99.3 99.7 134.8 99.3 1229 169.6 955 : :
Q1 2005
98.8 98.81 100.1 97 99.54 99.42 99.08 99.6 98.7 97.3 99.03 133.1 96.9 1210 165.6 945 97.8 115.8
Q4 2004
97.47 97.46 97.9 95.9 97.22 99.07(e)
97.57 99.13 97.5 95.9 97.84 130.3 96.3 1191 164.4 930 : :
Q3 2004
96.9 96.92 99 93.8 96.68 98.56(e)
97.03 99.13 97 94.9 97.2 127.1 94.4 1181 161.1 933 : 116.3
Q2 2004
95.92 95.97 99 90.6 95.63 97.98(e)
95.84 98.73 96.1 93.7 96.4 124.7 92.8 1165 160.6 952 : :
Q1 2004
94.02 94.08 96.8 87.9 92.7 95.28(e)
94.2 97.6 94.3 92.7 95.4 121.2 90.3 1144 155.9 940 97.7 113.4
Q4 2003
92.83 92.91 95.7 85.3 91.49 93.08(e)
92.57 98.03 93.5 92 94.4 116.7 88.5 1133 152.6 895 : :
Q3 2003
92.45 92.56 95.7 82.9 91.59 92.49(e)
92.4 98.2 93 91.3 93.96 115.2 86.8 1122 153.3 895 : 111.2
Q2 2003
91.98 92.09 96.6 80.4 91.12 92.20(e)
92.2 97.9 92.3 90.2 93.7 112.8 85.4 1121 149.1 878 : :
Q1 2003
91.19 91.32 95.9 77.8 90.89 91.55 91.93 97.83 91.7 88.6 93.5 109.8 85.1 1116 153.2 855 95.8 110.2
Q4 2002
90.21(s)
90.32 95.1 77 89.96 90.26(e)
90.1 97 90.4 88 92.17 108.1 83.2 1110 145.1 840 : :
Q3 2002
89.74(s)
89.85 95.2 74.5 89.62 89.96(e)
89.9 97.03 90.2 87 91.53 107.6 82.3 1111 143.1 875 : 110.7
Q2 2002
89.45(s)
89.57 95 73.5 89.09 89.06(e)
89.37 96.43 89.4 87.6 90.77 106.5 82.2 1113 141.9 890 : :
Q1 2002
87.80(s)
87.9 94.8 71.6 88.74 88.21(e)
89.1 96.04 88.2 82.4 90.14 105.5 81.7 1109 133.4 915 97.3 112.0
Q4 2001
86.79(s)
86.87 94.4 72.5 87.76 87.22(e)
86.73 94.6 87.4 81.8 89.17 104.4 81.8 1105 130.4 935 : :
Q3 2001
86.25(s)
86.34 94.5 72.1 88.2 87.00(e)
86.47 94.4 87.4 79.6 88.43 104.0 81.6 1094 132.7 945 : 114.2
Q2 2001
85.73(s)
85.82 94.4 70.8 88.05 86.52(e)
85.93 93.8 86.2 78.7 87.83 103.2 80.2 1075 131.3 960 : :
Q1 2001
84.65(s)
84.75 93.3 69.5 87.65 85.58 85.73 92.3 85.1 76.4 87.4 104.0 78.6 1065 130.3 990 98.7 115.5
Q4 83.42 83.51 94.2 65 86.38 84.97 85.1 91.2 83.9 73.7 85.7 104.3 77.7 1060 131.7 1020 : :

AECOM
88
2000 (s) (e)
Q3 2000
82.65(s)
82.75 93.9 62.4 85.88 84.58(e)
84.6 90.7 83.4 72.3 84.49 104.2 77.1 1039 130.4 1040 : 111.5
Q2 2000
82.36(s)
82.49 93.8 59.9 85.36 84.09(e)
84 89.33 82.7 73.2 83.47 104.3 76.7 1027 128.4 1057 : :
Q1 2000
81.27(s)
81.42 92.2 56.6 84.73 83.43(e)
83.63 88.73 81.5 71.4 82.93 103.7 76.0 1013 126.3 1079 100.0 108.1
Q4 1999
80.20(s)
80.33(s)
: : 82.73 82.21(e)
82.51(ei)
85.72(eip)
80.5 71.1 81.85(ei)
103.1 74.6 1008 125.8 : : :
Q3 1999
79.68(s)
79.81(s)
: : 82.36(ei)
81.82(e)
82.12(ei)
85.24(eip)
80 70.3 81.03(ei)
102.1 73.7 1000 124.3 : : 105.8
Q2 1999
78.76(s)
78.89(s)
: : 81.67(ei)
81.10(e)
81.78(ei)
84.35(eip)
79.6 68.6 80.76(ei)
101.3 73.3 987.762238
120.7 : : :
Q1 1999
77.84(s)
77.97(s)
: : 81.27 80.27(e)
81.18(ei)
83.82(eip)
78.9 66.9 80.47(ei)
100.4 72.3 990.384615
118.9 : 102.0 102.0
Q4 1998
76.90(s)
77.02(s)
: : 80.52(ei)
79.86(e)
81.13(ei)
83.45(eip)
78.6 64.7 80.11(ei)
99.6 71.6 990.384615
119.4 : : :
Q3 1998
76.36(s)
76.47(s)
: : 80.81(ei)
80.11(e)
80.81(ei)
83.69(eip)
78.2 62.7 79.19(ei)
98.7 70.4 991.258741
115.9 : : 100.0
Q2 1998
76.07(s)
76.19(s)
: : 80.88(ei)
80.44(e)
80.29(ei)
83.48(eip)
77.7 62.1 78.91(ei)
98.0 70.0 981.643357
114.3 : : :
Q1 1998
75.76(s)
75.88(s)
: : 80.78(ei)
80.35 79.96(ei)
83.16(eip)
76.8 61.7 77.59(ei)
97.0 69.2 973.776224
112.6 : 104.1 98.1
Q4 1997
75.37(s)
75.49(s)
: : 79.78(ei)
79.94(e)
82.46(ei)
81.81(eip)
76.4 60.2 77.20(ei)
95.9 69.3 972.027972
114.2 : : :
Q3 1997
74.92(s)
75.05(s)
: : 79.44(ei)
79.63(e)
82.22(ei)
81.71(eip)
75.9 59.4 76.94(ei)
95.2 69.0 966.783217
113.9 : : 95.7
Q2 1997
74.17(s)
74.29(s)
: : 79.18(ei)
79.00(e)
81.05(ei)
81.18(eip)
75.4 58.4 76.69(ei)
94.1 68.1 964.160839
110.2 : : :
Q1 1997
73.56(s)
73.69(s)
: : 79.09(ei)
78.42 80.87(ei)
80.84(eip)
75 57.1 75.93(ei)
93.3 67.6 970.27972
108.0 : 107.4 93.6
Q4 1996
73.15(s)
73.28(s)
: : 77.91(ei)
78.25(e)
80.68(ei)
80.10(eip)
74.4 57.2 75.48(ei)
92.0 67.3 974.65035
: : : :
Q3 1996
72.61(s)
72.74(s)
: : 77.75(ei)
77.83(e)
80.24(ei)
79.99(eip)
74.2 56.1 75.31(ei)
91.6 66.8 978.146853
: : : 91.1
Q2 1996
72.01(s)
72.15(s)
: : 77.79(ei)
77.56(e)
78.93(ei)
79.75(eip)
73.7 55.2 75.26(ei)
: 66.2 982.517482
: : : :
Q1 1996
71.51(s)
71.66(s)
: : 77.75(ei)
77.34(e)
78.75(ei)
79.65(eip)
73.2 54 74.76(ei)
: 65.7 975.524476
: : 107.8 89.8
Q4 1995
71.02(s)
71.18(s)
: : 75.93(ei)
77.01(e)
78.73(ei)
79.46(eip)
72.3 54 74.59(ei)
: 65.6 971.153846
: : : :
Q3 1995
70.97(s)
71.13(s)
: : 76.01(ei)
77.03(e)
78.69(ei)
79.57(eip)
71.8 53.9 74.64(ei)
: 65.6 952.797203
: : : :
Q2 1995
70.79(s)
70.96(s)
: : 75.78(ei)
77.03(e)
78.35(ei)
79.15(eip)
71 54 74.64(ei)
: 65.2 951.048951
: : : :
Q1 1995
70.27(s)
70.44(s)
: : 75.00(ei)
76.73(e)
77.36(ei)
78.67(eip)
70.4 53.9 73.66(ei)
: 64.8 949.300699
: : 109.7 :
Q4 1994
69.49(s)
69.66(s)
: : 72.74(ei)
75.51(e)
76.81(ei)
77.05(eip)
68.6 54.6 72.74(ei)
: 64.4 953.671329
: : : :
Q3 1994
69.23(s)
69.40(s)
: : 72.26(ei)
74.76(e)
77.02(ei)
76.82(eip)
68 54.5 71.89(ei)
: 63.1 947.552448
: : : :

AECOM
89
Q2 1994
68.82(s)
68.98(s)
: : 72.04(ei)
74.49(e)
76.83(ei)
76.82(eip)
67.3 53.7 70.27(ei)
: 62.1 945.804196
: : : :
Q1 1994
68.05(s)
68.21(s)
: : 71.64 73.88(e)
76.44(ei)
76.58(eip)
66.5 52.3 68.95(ei)
: 61.5 936.188811
: : 114.0 :
Q4 1993
66.89(s)
67.05(s)
: : 70.41(ei)
72.91(e)
74.50(ei)
75.41(eip)
66.5 51.5 68.75(ei)
: 61.1 928.321678
: : : :
Q3 1993
66.36(s)
66.52(s)
: : 70.17(ei)
72.74(e)
74.33(ei)
75.41(eip)
65.9 50.2 68.61(ei)
: 60.3 921.328671
: : : :
Q2 1993
66.07(s)
66.23(s)
: : 69.61(ei)
72.44(e)
74.11(ei)
75.18(eip)
66 50.1 68.58(ei)
: 59.7 920.454546
: : : :
Q1 1993
65.21(s)
65.37(s)
: : 69.26(ei)
71.58(e)
73.65(ei)
74.26(eip)
65.8 48.7 68.30(ei)
: 59.0 925.699301
: : 120.8 :
Q4 1992
62.38(s)
62.52(s)
: : 67.57(ei)
: 72.61(ei)
74.02(eip)
66.1 43.09(ei)
68.47(ei)
: 58.3 920.454546
: : : :
Q3 1992
62.53(s)
62.67(s)
: : 67.68(ei)
: 72.31(ei)
74.72(eip)
66 43.53(ei)
68.33(ei)
: 57.2 918.706294
: : : :
Q2 1992
61.63(s)
61.77(s)
: : 67.59(ei)
: 72.15(ei)
: 65.6 44.04(ei)
68.22(ei)
: 56.7 914.335664
: : : :
Q1 1992
61.43(s)
61.57(s)
: : 67.07(ei)
: 71.64(ei)
: 65.3 44.44(ei)
68.22(ei)
: 56.5 916.083916
: : 126.0 :
Q4 1991
60.78(s)
60.92(s)
: : 64.86(ei)
: 70.87(ei)
: 65.4 44.96(ei)
68.19(ei)
: 56.1 909.090909
: : : :
Q3 1991
60.75(s)
60.89(s)
: : 65.00(ei)
: 70.28(ei)
: 65.3 45.26(ei)
68.13(ei)
: 56.3 908.216783
: : : :
Q2 1991
60.13(s)
60.27(s)
: : 64.84(ei)
: 67.82(ei)
: 65.4 45.56(ei)
67.94(ei)
: 55.8 910.839161
: : : :
Q1 1991
59.55(s)
59.69(s)
: : 64.45(ei)
: 65.96(ei)
: 65 45.82(ei)
66.90(ei)
: 55.4 904.72028
: : 125.1 :
Q4 1990
58.72(s)
58.86(s)
: : 62.53(ei)
: 65.21(ei)
: 62.8 45.93(ei)
66.17(ei)
: 55.7 905.594406
: : : :
Q3 1990
58.27(s)
58.41(s)
: : 62.27(ei)
: 64.20(ei)
: 62 45.83(ei)
65.92(ei)
: 55.7 898.601399
: : : :
Q2 1990
57.59(s)
57.72(s)
: : 62.16(ei)
: 63.02(ei)
: 61 45.22(ei)
65.78(ei)
: 55.4 891.608392
: : : :
Q1 1990
56.72(s)
56.85(s)
: : 61.55(ei)
: 61.74(ei)
: 60.2 44.61(ei)
64.79(ei)
: 55.1 872.377622
: : 115.0 :
1988 : : : : : : : : : : : : : : : : 102.3 :
Data Sourc
e:
Euro Stat
Euro Stat
Euro Stat
Euro Stat
Euro Stat
Euro Stat
Euro Stat
Euro Stat
Euro Stat
Euro Stat
Euro Stat
Australian
Bureau of
Statistics
U.S. Censu
s Burea
u
Statistics
New Zeala
nd
Israel Centra
l Bureau of
Statistics
Davis Langdon & Seah
Japanese
Statistics
Bureau
Swiss Federal Office of Statistics

AECOM
90
Table 8 Inflation Factors
Country Name 2
01
0
20
09
20
08
20
07
20
06
20
05
20
04
20
03
20
02
20
01
20
00
19
99
19
98
19
97
19
96
19
95
19
94
19
93
19
92
19
91
19
90
Australia 100.00%
104.94%
104.39%
105.09%
104.87%
104.09%
103.26%
102.70%
103.15%
104.71%
102.56%
100.11%
101.28%
101.17%
102.18%
101.73%
101.21%
100.94%
101.17%
103.15%
107.10%
Canada 102.94%
98.07%
104.11%
103.19%
102.67%
103.31%
103.19%
103.28%
101.09%
101.12%
104.13%
101.75%
99.57%
101.20%
101.62%
102.26%
101.15%
101.44%
101.32%
102.95%
103.18%
Chile 114.37%
102.87%
100.24%
105.45%
112.42%
107.55%
107.48%
106.23%
104.17%
103.79%
104.56%
102.43%
101.93%
104.27%
102.73%
110.42%
113.73%
111.75%
112.89%
122.44%
122.46%
China 106.60%
99.41%
107.80%
107.60%
103.79%
103.93%
106.91%
102.61%
100.58%
102.05%
102.06%
98.75%
99.14%
101.51%
106.44%
113.74%
120.61%
115.12%
108.24%
106.85%
105.84%
Denmark 103.42%
100.36%
103.85%
102.28%
102.12%
102.88%
102.33%
101.65%
102.30%
102.50%
103.00%
101.68%
101.19%
101.99%
102.01%
101.26%
101.53%
100.67%
101.68%
102.68%
102.83%
France 100.81%
100.47%
102.54%
102.59%
102.14%
101.91%
101.67%
102.00%
102.22%
102.01%
101.57%
100.18%
101.03%
100.91%
101.46%
101.24%
101.13%
101.75%
101.93%
102.65%
102.76%
Germany 100.60%
101.17%
100.77%
101.63%
100.31%
100.62%
101.07%
101.10%
101.43%
101.13%
99.33%
100.19%
100.59%
100.26%
100.64%
102.01%
102.49%
103.98%
105.40%
103.09%
103.40%
Greece 101.71%
102.79%
104.72%
103.54%
102.52%
102.81%
102.95%
103.92%
103.40%
103.12%
103.40%
103.03%
105.20%
106.78%
107.34%
109.79%
111.18%
114.43%
114.80%
119.79%
120.69%
Hong Kong
100.49%
99.38%
101.46%
102.93%
99.71%
99.94%
96.46%
93.85%
96.54%
98.11%
96.36%
95.54%
100.78%
105.68%
105.76%
104.13%
106.47%
108.70%
109.93%
109.05%
107.50%
India 110.50%
107.54%
106.69%
105.75%
106.41%
104.18%
108.70%
103.56%
103.80%
103.03%
103.53%
103.80%
107.98%
106.46%
107.55%
109.08%
110.00%
109.81%
108.97%
113.73%
110.68%
Ireland 100.37%
95.97%
98.54%
101.10%
103.74%
102.52%
101.98%
102.78%
104.53%
105.52%
105.77%
103.86%
106.61%
103.86%
102.16%
103.03%
101.69%
105.18%
102.81%
101.80%
99.27%
Israel 101.06%
105.15%
101.38%
100.24%
102.04%
100.84%
99.99%
99.63%
104.15%
101.79%
101.56%
106.32%
107.11%
108.07%
110.06%
120.61%
112.70%
109.28%
113.54%
118.32%
115.90%
Italy 100.61%
102.27%
102.76%
102.57%
101.84%
102.06%
102.63%
103.12%
103.26%
102.96%
101.91%
101.78%
102.62%
102.56%
104.81%
104.97%
103.55%
103.91%
104.40%
107.54%
108.39%
Japan 97.84%
99.63%
98.99%
99.26%
99.10%
98.77%
98.92%
98.40%
98.45%
98.77%
98.27%
98.70%
99.97%
100.53%
99.37%
99.50%
100.12%
100.44%
101.59%
102.61%
102.63%
South Korea
103.73%
103.43%
102.91%
102.08%
99.86%
100.65%
103.03%
103.56%
103.23%
103.86%
105.01%
99.90%
105.82%
104.62%
105.12%
107.39%
107.84%
106.35%
107.62%
110.66%
110.52%
Laos 109.45%
97.65%
108.97%
107.28%
112.78%
101.90%
110.38%
115.73%
110.65%
108.60%
125.10%
227.97%
184.50%
119.35%
113.73%
119.69%
107.70%
111.18%
105.99%
112.97%
137.91%
Malaysia 105.09%
93.10%
110.34%
104.97%
103.88%
104.63%
106.01%
103.30%
103.13%
98.42%
108.86%
100.05%
108.50%
103.48%
103.68%
103.63%
103.94%
103.99%
102.41%
103.58%
103.81%
Mexico 104.37%
103.96%
106.33%
105.63%
106.69%
104.54%
109.07%
118.95%
106.96%
105.88%
112.10%
115.09%
115.39%
117.69%
130.74%
137.87%
108.47%
109.49%
114.41%
123.25%
128.13%
Netherlands
101.31%
99.60%
102.13%
101.85%
101.77%
102.43%
100.73%
102.18%
103.83%
105.10%
104.12%
101.78%
101.91%
102.64%
101.30%
102.06%
102.06%
101.60%
102.50%
103.12%
101.56%
New Zealand
100.00%
101.69%
103.40%
104.94%
104.24%
102.24%
103.17%
102.48%
100.22%
103.78%
102.99%
100.80%
101.40%
101.95%
101.35%
101.96%
101.87%
101.65%
101.96%
101.11%
102.46%
Norway 106.72%
94.45%
109.74%
102.39%
108.52%
108.65%
105.29%
102.97%
98.23%
101.73%
115.65%
106.62%
99.23%
102.80%
104.18%
103.04%
99.79%
102.29%
99.28%
102.18%
103.82%
Puerto Rico
100.00%
100.00%
100.00%
100.00%
100.00%
100.00%
100.00%
100.00%
100.00%
105.35%
103.06%
101.47%
106.36%
101.33%
103.91%
102.77%
103.18%
101.89%
102.58%
103.12%
104.32%
Qatar 100.00%
81.74%
109.26%
105.31%
118.52%
126.28%
111.38%
117.44%
103.06%
95.57%
100.00%
100.00%
100.00%
100.00%
100.00%
100.00%
100.00%
100.00%
100.00%
100.00%
100.00%

AECOM
91
Singapore
99.48%
100.29%
98.79%
106.40%
101.76%
102.06%
104.31%
98.47%
99.09%
97.84%
103.61%
95.20%
98.58%
101.20%
100.95%
102.83%
103.53%
103.45%
101.41%
104.14%
104.38%
South Africa
108.06%
107.16%
108.90%
108.06%
106.53%
105.44%
106.37%
105.55%
110.75%
107.67%
108.81%
107.07%
107.71%
108.11%
108.09%
110.25%
109.59%
113.09%
114.57%
115.73%
115.52%
Spain 100.97%
100.60%
102.40%
103.34%
104.12%
104.29%
104.02%
104.14%
104.31%
104.20%
103.45%
102.63%
102.48%
102.38%
103.46%
104.93%
103.88%
104.54%
106.71%
106.94%
107.33%
Sri Lanka
107.27%
105.88%
116.33%
114.03%
111.28%
110.42%
108.80%
105.15%
111.81%
113.66%
107.28%
104.16%
109.21%
108.92%
110.82%
109.30%
109.77%
109.88%
109.40%
110.62%
120.06%
Sweden 101.22%
101.82%
103.14%
102.76%
101.94%
100.89%
100.31%
101.77%
101.53%
102.37%
101.42%
100.90%
100.53%
101.52%
100.82%
103.72%
102.63%
103.24%
100.98%
108.98%
108.72%
Switzerland
100.07%
100.16%
102.44%
102.49%
102.06%
100.11%
100.57%
101.00%
100.47%
100.80%
101.13%
100.61%
100.29%
99.87%
100.19%
100.73%
101.27%
102.38%
102.02%
105.43%
104.60%
United Kingdom
102.94%
101.45%
102.97%
102.99%
103.05%
102.03%
102.52%
103.07%
103.10%
102.12%
101.19%
102.10%
102.22%
102.79%
103.62%
102.68%
101.58%
102.88%
103.76%
106.46%
107.73%
United States
100.81%
101.82%
102.18%
102.94%
103.25%
103.34%
102.83%
102.16%
101.62%
102.27%
102.16%
101.47%
101.32%
101.93%
101.77%
102.33%
102.04%
102.19%
102.11%
103.40%
103.79%
Venezuela, RB
146.68%
108.29%
130.46%
113.53%
117.90%
129.60%
133.95%
134.93%
133.02%
108.00%
129.45%
126.19%
118.89%
138.42%
215.52%
151.76%
162.89%
131.65%
128.24%
121.45%
141.74%
Vietnam 111.86%
106.03%
122.14%
108.24%
107.27%
108.19%
108.18%
106.69%
103.94%
101.95%
103.41%
105.73%
108.84%
106.60%
108.70%
117.04%
116.95%
117.41%
132.63%
172.55%
142.10%

AECOM
92
7.9 Appendix H: Countries in Tunnel Costs Database
Table 9 Countries in Tunnel Costs Database by Region
ANZ Europe The Americas Asia
Australia Denmark Canada China
New Zealand France Chile India
Germany Ecuador Israel
Greece Mexico Japan
Ireland Puerto Rico Laos
Italy United States of America Malaysia
Netherlands Venezuela Qatar
Norway
Singapore
Spain
South Africa
Sweden
South Korea
Switzerland
Sri Lanka
United Kingdom
Taiwan
United Arab Emirates
Vietnam

AECOM
93
7.10 Appendix I: Supplementary Data
Data is available from AECOM.
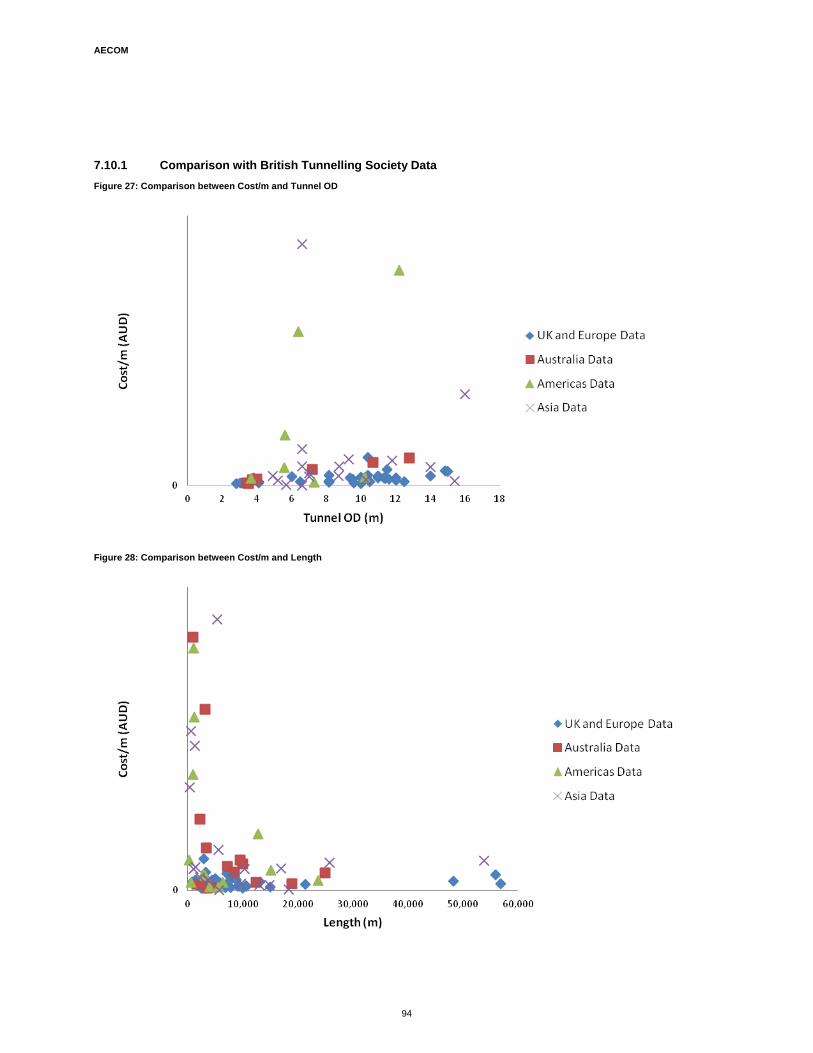
AECOM
94
7.10.1 Comparison with British Tunnelling Society Data
Figure 27: Comparison between Cost/m and Tunnel OD
Figure 28: Comparison between Cost/m and Length

AECOM
95
Figure 29: Comparison between Cost/m3 and Tunnel OD

AECOM
96
7.11 Appendix J: Monthly Labour Rates by Country
Table 10 Average Wages by Country and Profession
Wages by Profession (2005 AUD)
Country Profession Wage AUD
USA Construction 3398.735
U.K. Construction 3601.291
AUS Construction 3238.269
Italy Construction 2125.525
N.Z. Construction 2278.1
Taiwan Construction 1419.209
Mexico Construction 449.8326
China Construction 160.4666
USA Engineer 6195.063
U.K. Engineer 5557.143
AUS Engineer 4356.274
Italy Engineer 3311.925
N.Z. Engineer 0
Taiwan Engineer 2866.039
Mexico Engineer 1421.839
China Engineer 331.4556
USA Mining 3543.418
U.K. Mining 3819.631
AUS Mining 5052.067
Italy Mining 1627.026
N.Z. Mining N/A
Taiwan Mining 1203.5
Mexico Mining 484.0304
China Mining 190.7185
Table 11 Average Wages by Country
Average Wages (2005 AUD)
Country Profession Wage AUD
USA Average 4379.072
U.K. Average 4326.022
AUS Average 4215.537
Italy Average 2354.825
N.Z. Average 2278.1
Taiwan Average 1829.582
Mexico Average 785.2341
China Average 227.5469