analysing dielectric interphases in composites containing nano- and micro-particles
TRANSCRIPT

This content has been downloaded from IOPscience. Please scroll down to see the full text.
Download details:
IP Address: 155.247.166.234
This content was downloaded on 11/11/2014 at 22:51
Please note that terms and conditions apply.
Analysing dielectric interphases in composites containing nano- and micro-particles
View the table of contents for this issue, or go to the journal homepage for more
2009 J. Phys. D: Appl. Phys. 42 064004
(http://iopscience.iop.org/0022-3727/42/6/064004)
Home Search Collections Journals About Contact us My IOPscience

IOP PUBLISHING JOURNAL OF PHYSICS D: APPLIED PHYSICS
J. Phys. D: Appl. Phys. 42 (2009) 064004 (10pp) doi:10.1088/0022-3727/42/6/064004
Analysing dielectric interphases incomposites containing nano- andmicro-particlesB Hallouet1, P Desclaux1, B Wetzel2, A K Schlarb2 and R Pelster1
1 Fachrichtung 7.2, Experimentalphysik, Universitat des Saarlandes, Campus E 2.6, 66123 Saarbrucken,Germany2 Institut fur Verbundwerkstoffe GmbH (IVW), Erwin-Schrodinger-Straße, Gebaude 58,67663 Kaiserslautern, Germany
E-mail: [email protected] and [email protected]
Received 30 July 2008, in final form 24 November 2008Published 3 March 2009Online at stacks.iop.org/JPhysD/42/064004
AbstractWe have investigated a molecular relaxation process in a solid polymer filled with dispersedmagnetite particles (Fe3O4 in epoxy resin). In particular, we compare systems containingnano-particles with diameters between 20 and 30 nm and micro-particles with diametersbetween 0.5 and 5 µm. Temperature-dependent broadband dielectric spectroscopy in afrequency range between 50 Hz and 1 GHz reveals that the presence of nano- ormicro-particles does not affect the molecular dynamics, i.e. frequency, shape and thermalactivation of the relaxation process. However, there is a marked difference in the polymer’srelaxation strength, reflecting both the polarizability and the number of relaxing units. Thisquantity is evaluated from the measured effective data using the spectral representation, i.e. inspite of the complex microstructure we are able to separate unambiguously the contribution ofthe polarized conductive particles. While in the micro-composites the polymer matrix behavesbulk-like, its relaxation strength increases in the nano-composites, the deviation from the bulkvalue being proportional to the volume fraction of particles. We discuss the results in terms ofinterphases of thickness δ around particles and agglomerates, the volume fraction of whichincreases with increasing particle concentration and decreasing particle size.
1. Introduction
There is increasing interest in nano-composites due to theiruse in various fields, such as for biomedical applications [1–3]or in electrical engineering [4, 5]. For example, they can befound in thin film capacitors [6] or in sensors and actuators [7].Frequently such composites consist of particles, fibres or nano-tubes dispersed in a polymer matrix [8, 9]. In this way thecharacteristics of the polymer (low weight, mechanical qualityand processability) can be combined with that of the dispersedcomponent. The properties of nano-composites and the role oftheir internal interfaces have been addressed in a multiplicityof studies [10–13]. With decreasing particle size the propertiesof the interfaces become more important and finally startto influence the composite behaviour affecting permittivity,conductivity, electromechanical and optical properties [14].This can come along with changes in density, e.g. an increase
in free volume, as well as with chemical changes, as observedin nano-composites containing TiO2 particles in an epoxy resin(DGEBA) [15]: there can be bonds between reactive radicalson the particle surfaces and the matrix and a curing agentconcentration around the particles can lead to a surfeit ofunreacted epoxy resin.
In a previous paper dealing with nano-particles dispersedin an epoxy resin, we have reported on dielectric measurementsat room temperature [16]. A quantitative analysis of thespectra revealed a modification of the matrix permittivity thatwe attributed to the possible presence of interphases. Herethe term ‘interphase’ designates a local volume close to theinterfaces, where the properties of the polymer are altered(see figure 1). We now investigate the molecular dynamicsof the system in a range of temperatures. Furthermore, wehave prepared micro-composites and compare their behaviourwith that of the nano-composites in order to test the interphase
0022-3727/09/064004+10$30.00 1 © 2009 IOP Publishing Ltd Printed in the UK

J. Phys. D: Appl. Phys. 42 (2009) 064004 B Hallouet et al
hypothesis. We focus on the problem of how to detect andto analyse unambiguously changes in the dielectric response,which also depends on the complex microstructure of thesystem.
2. Experimental
2.1. Samples
The composites under study are magnetite (Fe3O4) particlesdispersed in an epoxide system. The particles, purchasedfrom Sigma-Aldrich, are either nano-particles with a meandiameter between 20 and 30 nm or micro-particles with amean diameter smaller than 5 µm. The epoxide systemconsists of a resin, Diglycidylether of Bisphenol A (DER 332),purchased from DOW Plastics and from Sigma-Aldrich, anda hardener, Diethylentriamin (DETA) purchased from DOWPlastics. The chosen mass ratio resin/hardener is 100 : 14. Themain characteristics of the components are given in table 1.
The sample preparation follows a three step-procedure [16].
(i) Dispersion of the particles in the epoxy resin resulting inconcentrated masterbatches. Both the micro- and the nano-particles are combined with resin by mechanical dispersiontechniques. Firstly, the powdery particles are incorporated intothe liquid epoxy. The resulting mixture is then homogenizedby a dissolver dispersion aggregate for 10 min. This devicegenerates high shear forces in the mixture due to the highspeed rotation of a metal disc. Entrapped air is removed byvacuum. After homogenization, the mixture of epoxy/micro-particles is further processed by the dissolver for another
Figure 1. Sketch of a composite with particles dispersed in apolymer matrix. The lines indicate possible interphases close to theparticle surfaces, where the properties of the matrix can be altered.
(This figure is in colour only in the electronic version)
Table 1. Main properties of the components.
Fe3O4 Fe3O4
Component DER332 DETA (nano) (micro)
Producer (nano) DOW DOW Sigma-Aldrich(micro) Sigma-Aldrich DOW Sigma-AldrichState (298.15 K/343.15 K) Crystalline/liquid Liquid Powder PowderMean particle diameter ≈ 20–30 nm ≈5 µmDensity (g cm−3) 1.16 0.95 5.10 4.95
30 min. Although this procedure is able to sufficiently dispersethe magnetite micro-particles, it cannot fully disperse the nano-particles. For the latter, an additional device is used, thetorus mill. The torus mill is a special type of ball mill. Themixture passes through a mixing chamber where hard zirconiabeads move and grind the nano-particle agglomerates in orderto decrease their size. The zirconia beads with a diameterof 1.2–1.7 mm remain in the mixing chamber. The nano-composite mixture is dispersed for 60 min in the torus mill.Each step of the dispersion procedure is performed undercontrolled conditions, i.e. at constant energy input, speedand temperature. Summarizing, an epoxy masterbatch with15 vol% micro-particle is manufactured by the dissolver, and asecond masterbatch that contains 11.5 vol% nano-particles isproduced by the torus mill. Each particle content represents themaximum number of particles that could be filled into the resinwithout losing processability of the mixture in the dispersionaggregates.(ii) Dilution of the masterbatch to obtain desired particleconcentrations. At first, both the initial masterbatch and thepure resin are maintained for 1 h under vacuum, in order toremove entrapped air. This is done at a high temperatureof 313.15 K to avoid resin crystallization and to diminish theviscosity of the resin. Then the masterbatch is diluted withpure resin, whereas both components are mixed for 30 minand evacuated for 1 h.(iii) Curing of the materials to gain solid samples. Thismixture is cured after adding the corresponding quantity ofDETA (mass ratio resin/hardener 100 : 14). In this last phasethe material is mixed for 5 min, cooled down rapidly to roomtemperature in order to slow down the polymerization processand degassed by vacuum for 3 min. The polymerization takesplace in a mould at room temperature. After 48 h the post cureis performed at 393.15 K for 1 h [17].
The samples obtained are solid and have a particlevolume concentration f = Vparticles/Vsample between 0% and10%. In figure 2 we show pictures of samples with 10%particles (obtained by transmission electronic microscopy).Agglomerates are visible, i.e. the spatial distribution of theparticles is not completely random.
2.2. Measurement technique
We use dielectric spectroscopy to determine the complexpermittivity ε = ε′ − ı ε′′ in a frequency range between 50 Hzand 1 GHz. A heater and a cooling system with liquid nitrogenallow us to perform temperature-dependent measurements.For more details we refer to [18].
2

J. Phys. D: Appl. Phys. 42 (2009) 064004 B Hallouet et al
Figure 2. TEM pictures. (a) A micro-composite with a particlefilling of f = 10%, (b) A nano-composite with a particle filling off = 10%, (c) A nano-composite with a particle filling of f = 2%(Reprinted from [16]). Note the different magnifications.
3. Dielectric measurements
We have measured the complex effective permittivity forthe micro- and nano-composites. In figures 3 and 4 wedisplay the respective real- and imaginary parts at room
Figure 3. Real (a) and imaginary (b) parts of the permittivity for anepoxy resin with Fe3O4 micro-particles for different volume fillingfactors at room temperature. α: 0%, β: 2%, γ : 4%, δ : 6%,ε: 8%, ζ : 10%.
temperature, which is below the glass transition temperature(TG = 404 K [19] of the pure matrix). Apart from slightlyhigher permittivity values for the micro-composites, both typesof composites show similar spectra, reflecting at superpositionof at least two processes.
• A broad relaxation process of the matrix polymer leads toa decrease in the permittivity from a static value εs to itshigh frequency value ε∞ and to a peak in the imaginarypart near 105 Hz. This process is observable in all samples.
• The permittivity and especially the relaxation strength ofthe samples increases with the particle content.
It is easy to understand that the polarization of the conductiveparticles contributes to the latter effect (if it is not its onlycause): mobile charges follow the alternating electric fieldand accumulate at the interfaces between the particles and theinsulating matrix. Thus the electric field inside the particlesbecomes negligibly small, the polarization is enhancedand the permittivity increases (Maxwell–Wagner–Sillarspolarization). This is the case in the so-called quasi-staticfrequency range below a characteristic polarization frequency,
3

J. Phys. D: Appl. Phys. 42 (2009) 064004 B Hallouet et al
Figure 4. Real (a) and imaginary (b) parts of the permittivity for anepoxy resin with Fe3O4 nano-particles for different volume fillingfactors at room temperature. α: 0%, β: 2%, γ : 4%, δ : 6%, ε: 8%,ζ : 10%.
νMWS, that is proportional to the particle conductivity. Its orderof magnitude is
νMWS � O(
σ
2πε0εm
), (1)
where ε0 = 8.854 × 10⁻¹² F m−1 denotes the permittivity ofvacuum, εm is the relative permittivity of the matrix and σp
the conductivity of the particles (see [16, 20, 21]). For thematrix permittivity εm � 3 holds (see figures 3 and 4). The dcconductivity of bulk magnetite is of the order ofσ � 300 S m−1
at room temperature, for thin films with a thickness of 30 nmit is σ � 30 S m−1 [22]. Taking the latter value we obtainνMWS = O(1011 Hz). Thus our spectra covering a frequencyrange up to 1 GHz are situated in the quasi-static regimeof the interfacial polarization process, at least in terms ofsingle particle polarization. Agglomerates may exhibit lowerconductivities due to contact resistances between the particlesand this would result in lower polarization frequencies. Butwe shall come back to this point later. In order to check thepossible presence of additional processes, we have investigatedthe shape and temperature dependence of the dielectric spectra.
(b)
(a)
Figure 5. Relaxation frequency νp at which the peak in ε′′eff is
observed versus the filling content for composites at two differenttemperatures: (a) micro-composites and (b) nano-composites.
3.1. Analysing the dynamics of the relaxation process
At first let us check whether the relaxation frequency νp, wherethe peak maximum in ε′′
eff is observed, depends on the particlecontent. In figure 5 we display the respective values for twodifferent temperatures, i.e. at room temperature and at 273 K.Neither for the micro- nor for the nano-composites can wenote a systematic change. The variation is rather small, i.e.νp varies at a maximum by a factor of 2 (corresponding to 0.3decades in frequency). This is negligible compared with thelarge broadening of the relaxation peaks having a half-widthof about 6 decades.
In the next step we analyse the influence of the particlecontent on the shape of the relaxation process. Figure 6 showsthe normalized imaginary part of the permittivity as a functionof the normalized frequency for the micro-(a) and nano-(b)composites at room temperature. On addition of particles theshape of the relaxation peak changes only slightly. So therelaxation process we observe is still that of the matrix polymerand there are no indications for an additional contribution.
4

J. Phys. D: Appl. Phys. 42 (2009) 064004 B Hallouet et al
Figure 6. Normalized imaginary part of permittivity versusnormalized frequency for an epoxy resin with Fe3O4 particles atroom temperature. Curves for various filling factors are displayed:(a) micro-composites and (b) nano-composites.
In order to study the thermal activation of therelaxation process, we have performed temperature-dependentmeasurements between 248 and 295 K. Upon cooling therelaxation process shifts to lower frequencies, i.e. themolecular dynamics slows down. Figure 7 displays thetemperature dependence of the relaxation frequency νp (thefrequency, where ε′′ takes its maximum value). For boththe nano- and the micro-composites an Arrhenius-like thermalactivation is observed,
ln(νp) = ln(ν∞) − EA
kB T, (2)
where EA is the activation energy, kB the Boltzmann constantand T the temperature. The activation energy is about EA =0.80 eV for the micro-composites and about EA = 0.73 eVfor the nano-composites. In both cases it does not dependsignificantly on the filling fraction. The small differencebetween the value for the micro-and the nano-compositesis probably due to the fact that the epoxy resins have been
Figure 7. Semilogarithmic plot of the relaxation frequencyversus inverse temperature for various volume filling factors:(a) micro-composites and (b) nano-composites.
purchased from two different companies, i.e. they are similarbut not identical (see table 1).
Summarizing, neither the shape nor the position or thethermal activation of the relaxation process is significantlyaffected by the addition of nano- or of micro-particles. So wealways observe the dipolar relaxation of the matrix polymer.The relaxation peak is not superimposed with additionalrelaxation or polarization peaks (e.g. interfacial polarizationprocess in agglomerates). We therefore proceed with aquantitative analysis of the remaining relaxation parameter,i.e. of the dielectric strength.
3.2. Analysing the strength of the relaxation
The only effect of the nano- and micro-particles seems to bethe enhancement of the permittivity (see figures 3 and 4). Boththe low and the high frequency limits of the permittivity, i.e.εs = εeff(ν � νp) and εeff,∞ = εeff(ν � νp), as well as therelaxation strength, εeff = εs − ε∞, increase with increasingparticle content. In order to point out the difficulties of a
5

J. Phys. D: Appl. Phys. 42 (2009) 064004 B Hallouet et al
Figure 8. Ratio of the high frequency values of effective permittivityover the matrix permittivity for the micro- and nano-composites.Comparison with two well-known effective medium models(equations (4) and (5)) describing randomly dispersed spheres.
quantitative analysis, we display the concentration dependenceof εeff,∞ in figure 8. These values were obtained by fittingthe measured spectra with the empirical formula of Havriliak–Negami [23, 24]:
εeff(ω) = εeff,∞ +εeff,s − εeff,∞
(1 + (ı ω τ)α)β, (3)
with τ being the relaxation time and α and β the shapeparameters (for details we refer to [16]). For comparisonwe also display two curves corresponding to theoreticalmodels describing a random spatial distribution of completelypolarized conductive spheres (when for the permittivity of theconductive particles |ε′
p − i · σp/(ε0ω)| � |εm| holds). Theseare the quasi-static limits of the Maxwell-Garnett formula:
εMGeff = 1 + 2f
1 − f· εm (4)
and of the Hanai–Bruggeman formula
εHBeff = 1
(1 − f )3· εm (5)
that apply for frequencies far below the characteristicfrequency νMWS of the interfacial polarization process (see (1)).While the Maxwell-Garnett formula is valid for monodispersespheres [25, 26], the Hanai–Bruggeman formula applies forspheres having a sufficiently broad size distribution [26]. Asexpected, both models fail, since the spatial distribution of theparticles is not random. The presence of agglomerates (seefigure 2) leads to an enhanced polarization. For the micro-composites this enhancement is more pronounced than for thenano-composites. But note that the increase in permittivitydepends not only on the number of agglomerates but also ontheir shape, i.e. on details of the actual microstructure. It isexactly this dependence on a complicated microstructure thatmakes it impossible to quantitatively analyse our measuredspectra with a simple effective medium formula.
But also in cases where no simple mixture rules apply orwhere the lack of information about the detailed microstructure
makes it impossible to calculate the effective permittivity, themeasured relaxation strengths can be analysed quantitatively.As already shown in [16], the spectral representation ofBergman, Milton and Fuchs can be used for this purpose. Itapplies for heterogeneous systems of two phases with complexpermittivity εp and εm that in our case correspond to particlesand matrix, respectively. For a non-percolating system likeours (there is no dc-conductivity), the effective permittivitycan be written as [27]
εeff =(
1 + f ·∫ 1
0
gf(n)
tε + ndn
)· εm with tε = 1
εp
εm− 1
,
(6)
where gf(n) � 0 is the so-called spectral density functioncharacterizing the microstructure at a given filling factor f ,i.e. form, size distribution, orientation and spatial distributionof the dispersed particles. For a single particle n wouldcorrespond to the depolarization factor; in a complex systemof interacting particles it is a variable in the range 0 � n � 1.In most practical cases the detailed microstructure and thusgf(n) are unknown, so that no effective medium formulacan be predicted. But the advantage of this representationis the fact that it allows to separate the influence of themicrostructure, characterized by gf(n), from that of thecomponents, characterized by their permittivities.
In the quasi-static limit, i.e. far below νMWS, the particlesare completely polarized, so that t = (εp/εm −1)−1 � 0 holds.Then equation (6) becomes
εeff
εm= 1 + f ·
∫ 1
0
gf(n)
ndn︸ ︷︷ ︸
=h(f )
. (7)
The ratio of the complex permittivities εeff/εm, i.e. of theeffective permittivity over the matrix permittivity, is thus afunction having real values h(f ) � 1. It only reflects aspecific microstructure but it is independent of εm and εp.As a consequence, the values of h(f ) do not depend onfrequency and are real numbers. Before using the aboveresult to analyse our composites, we shall briefly discuss theinfluence of agglomerates. Since the TEM pictures do not giveus any information about the quality of the contacts betweenagglomerating particles (see figure 2), we have to distinguishthree types, all of which have an impact on the polarization ofthe conductive phase and thus on the effective permittivity.
(i) Agglomerates with no electrical contact between theparticles. For example, this is the case when the primaryparticles are covered with a thin insulating polymer layer. Thisis still a system consisting of two phases (matrix and particles),the complex microstructure of which is described by a spectraldensity as discussed above.(ii) Agglomerates of particles with a perfect electrical contact.In this case the primary particles just form bigger particlesof various shapes. As already mentioned, not only the spatialdistribution of particles but also their form, size distribution andorientation are part of the microstructure and thus described bythe respective spectral density gf(n).
6
J. Phys. D: Appl. Phys. 42 (2009) 064004 B Hallouet et al
(iii) Agglomerates of particles with a non-perfect electricalcontact. This is the most complicated case, in which a chargetransport between particles occurs via contact resistances or viaa hopping process. This may lead to an additional interfacialpolarization process, the characteristic frequency of which liesbelow that of single particle polarization, νaggl < νMWS, i.e. farbelow 1011 Hz (see (1)). As we have shown in section 3.1 thereis no indication for such a process in our frequency windowfrom 50 Hz to 1 GHz (otherwise we would need to introducea third phase of ‘contact’ in order to describe the dielectricspectra correctly). If at all such an additional polarizationoccurs, νaggl � 50 Hz or νaggl � 1 GHz holds. In the first case,it simply does not contribute to the effective permittivity above50 Hz and (6) and (7) apply. In the second case, our frequencyrange is quasi-static with respect to νMWS and νaggl, so that theadditional interfacial polarization process in the agglomeratesleads to a further enhancement of the permittivity. Onceagain, we can consider the agglomerates as bigger particleshaving a very complex shape. In the quasi-static regime theyare completely polarized, so that their electrical properties(average conductivity of single particles and contacts) donot contribute to the measured effective permittivity. As aconsequence, the ratio of the effective permittivity over thematrix permittivity is only a function of the filling factor,εeff/εm = h(f ), reflecting the microstructure. Therefore, thequasi-static description in (7) is still valid, but with a spectraldensity function that is modified compared with that of cases(i) and (ii).
Summarizing, the effective permittivity depends on themicrostructure and the formation of agglomerates reflects inthe increase in permittivity compared with what is expectedfor a random spatial distribution of particles (see figure 8). Aslong as agglomerates do not lead to an additional interfacialprocess in the accessible frequency window, (7) applies in thequasi-static limit of single particle polarization (ν � νMWS).In the following, we shall use it to analyse our composites.
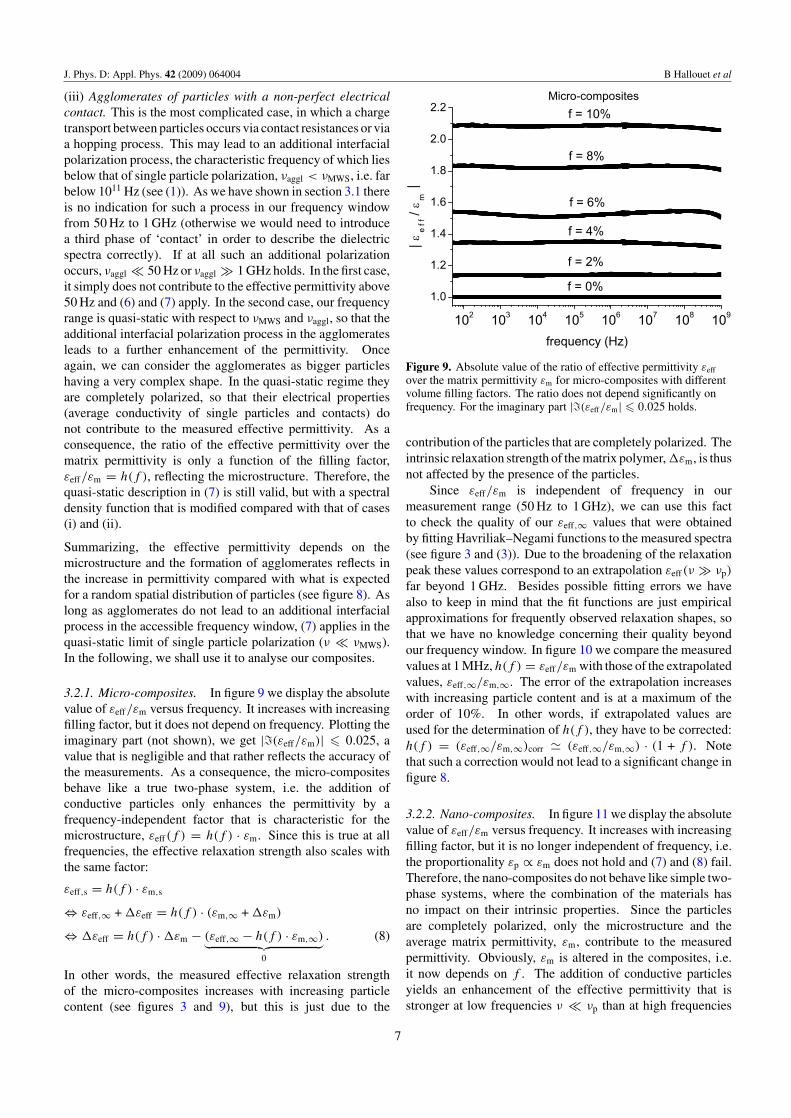
3.2.1. Micro-composites. In figure 9 we display the absolutevalue of εeff/εm versus frequency. It increases with increasingfilling factor, but it does not depend on frequency. Plotting theimaginary part (not shown), we get |�(εeff/εm)| � 0.025, avalue that is negligible and that rather reflects the accuracy ofthe measurements. As a consequence, the micro-compositesbehave like a true two-phase system, i.e. the addition ofconductive particles only enhances the permittivity by afrequency-independent factor that is characteristic for themicrostructure, εeff(f ) = h(f ) · εm. Since this is true at allfrequencies, the effective relaxation strength also scales withthe same factor:
εeff,s = h(f ) · εm,s
⇔ εeff,∞ + εeff = h(f ) · (εm,∞ + εm)
⇔ εeff = h(f ) · εm − (εeff,∞ − h(f ) · εm,∞)︸ ︷︷ ︸0
. (8)
In other words, the measured effective relaxation strengthof the micro-composites increases with increasing particlecontent (see figures 3 and 9), but this is just due to the
Figure 9. Absolute value of the ratio of effective permittivity εeff
over the matrix permittivity εm for micro-composites with differentvolume filling factors. The ratio does not depend significantly onfrequency. For the imaginary part |�(εeff/εm| � 0.025 holds.
contribution of the particles that are completely polarized. Theintrinsic relaxation strength of the matrix polymer, εm, is thusnot affected by the presence of the particles.
Since εeff/εm is independent of frequency in ourmeasurement range (50 Hz to 1 GHz), we can use this factto check the quality of our εeff,∞ values that were obtainedby fitting Havriliak–Negami functions to the measured spectra(see figure 3 and (3)). Due to the broadening of the relaxationpeak these values correspond to an extrapolation εeff(ν � νp)
far beyond 1 GHz. Besides possible fitting errors we havealso to keep in mind that the fit functions are just empiricalapproximations for frequently observed relaxation shapes, sothat we have no knowledge concerning their quality beyondour frequency window. In figure 10 we compare the measuredvalues at 1 MHz, h(f ) = εeff/εm with those of the extrapolatedvalues, εeff,∞/εm,∞. The error of the extrapolation increaseswith increasing particle content and is at a maximum of theorder of 10%. In other words, if extrapolated values areused for the determination of h(f ), they have to be corrected:h(f ) = (εeff,∞/εm,∞)corr � (εeff,∞/εm,∞) · (1 + f ). Notethat such a correction would not lead to a significant change infigure 8.
3.2.2. Nano-composites. In figure 11 we display the absolutevalue of εeff/εm versus frequency. It increases with increasingfilling factor, but it is no longer independent of frequency, i.e.the proportionality εp ∝ εm does not hold and (7) and (8) fail.Therefore, the nano-composites do not behave like simple two-phase systems, where the combination of the materials hasno impact on their intrinsic properties. Since the particlesare completely polarized, only the microstructure and theaverage matrix permittivity, εm, contribute to the measuredpermittivity. Obviously, εm is altered in the composites, i.e.it now depends on f . The addition of conductive particlesyields an enhancement of the effective permittivity that isstronger at low frequencies ν � νp than at high frequencies
7

J. Phys. D: Appl. Phys. 42 (2009) 064004 B Hallouet et al
Figure 10. Ratio h(f ) = εeff/εm versus the volume filling factor forthe micro-composites. As shown in figure 9 this ratio is independentof frequency. The deviation between the measured values at 1 MHzand the extrapolated high frequency values reflect the error ofextrapolation using Havriliak–Negami fits (see (3)): εeff,∞/εm,∞ hasto be multiplied by a factor of approximately (1 + f ) to get correctvalues.
Figure 11. Absolute value of the ratio of effective permittivity εeff
over the matrix permittivity εm for nano-composites with differentvolume filling factors. In contrast to the micro-composites the ratiodepends on frequency (compare with figure 9).
ν � νp (see figure 11). This means that the strength of therelaxation process is affected by the presence of the particles.In figure 12 we display the measured relaxation strength εeff
that increases as a function of the particle content. Thisincrease is due to two effects that superimpose: the first oneis simply the increase in polarization due to the presence ofcompletely polarized particles (as was the case for micro-composites). The second effect is a change in the intrinsicrelaxation strength of the matrix we would like to quantify.In order to do so, we can calculate the expected relaxationstrength, if no such additional effects were present, i.e. if thematrix permittivity would not change. In this case (8) applies,whereas the scaling factor h(f ) has to be taken far above the
Figure 12. Relaxation strength εeff as a function of the volumefilling factor. Solid cubes: measured data; open cubes: theoreticalvalues according to (9), where we have used experimentallydetermined values of h(f ) = εeff,∞/εm,∞. The solid lines are guideto the eyes. The dashed and dotted lines show corrections ofpossible systematic errors in the fit of experimental data (see text).
relaxation frequency νp:
[εeff(f )]calc = εeff,∞(f )
εm,∞︸ ︷︷ ︸h(f )
·εm. (9)
The comparison between these theoretical values and themeasured ones is shown in figure 12. The experimental valuesare much higher than those expected. Obviously,
εeff � h(f ) · εm · (1 + 5 · f )︸ ︷︷ ︸εm,comp(f )
(10)
holds, i.e. the addition of nano-particles affects the intrinsicrelaxation strength of the matrix polymer, εm,comp. Ina classical two-phase system this intrinsic property wouldremain unchanged and equal that of the bulk matrix, as wasthe case for the micro-composites. But in the nano-compositesthe situation is different. Starting from its initial value εm atf = 0, εm,comp changes gradually with increasing particlecontent.
Although this increase can already be noted unambigu-ously in figure 11, we would like to get an idea of how reliablethis analysis is from a quantitative point of view. So let ussuppose that the error in the fitting procedure that was usedto determine the relaxation strength and high frequency per-mittivity (see (3)) is similar to those we noted in the aboveanalysis of the micro-composites. In this case we would haveto correct the values of h(f ) by a factor of (1 + f ) (see aboveand figure 10) leading to a corresponding increase in the the-oretical values of (9) (see the dotted line in figure 12). Onthe other hand, if the fit yields too low values for εeff,∞, thevalues for ε must be too large (since εeff,∞ + ε = εeff,s hasto hold). For simplicity and since εeff and εeff,∞ are of thesame order of magnitude, we thus correct the εeff data by afactor of (1 − f ) leading to the dashed line in figure 12. Evenwith these corrections the difference between the experimental
8

J. Phys. D: Appl. Phys. 42 (2009) 064004 B Hallouet et al
values and the theoretical calculation persists. Only the factor(1 + 5 · f ) in (10) would change to (1 + 2.5 · f ). We thereforeconclude that the addition of nano-particles leads to an increasein the polymer’s intrinsic relaxation strength. The increase isproportional to the volume filling factor and at f = 10% ofthe order of 20–50%.
3.3. Global or local changes of the polymer matrix: theinfluence of agglomeration
As discussed in section 3, agglomerates can alter thecontribution of the conductive phase to the overall polarization,but this effect is taken into account in the effective mediumanalysis. Therefore, we were able to evaluate the intrinsicrelaxation strength of the polymer matrix, εm,comp(f ), thatdiffers from its bulk value. But do we observe a globalchange in the whole matrix polymer or are the modificationslocated close to the particle surfaces? Only in the latter casewould we speak of dielectric interphases (see figure 1). Sincethe measurements give us access only to volume averagedquantities, the data do not allow us to discern global and localchanges. But at least we want to discuss the consequences ofboth possibilities.
If the properties of the polymer are altered uniformly inthe matrix volume (global change), the relaxation strength isan intrinsic quantity that does not depend on the formation ofagglomerates. However, if the changes are located close tothe particle surfaces, the volume averaged value we evaluatedepends on the actual microstructure. In order to illustratethis, we have sketched different situations. Let us start withthe most simple case in figure 13(a) where we have non-agglomerating spherical particles of diameter d . These aresurrounded by an interphase layer of thickness δ with modifiedproperties compared with the bulk polymer. The volumefraction of the interphase layers, fip = f · {(1 + 2δ/d)3 − 1},is proportional to the volume filling fraction of the particles,f (here 0 � f � 0.1 holds). Thus it becomes only noticeablefor δ � d, i.e. when the spatial extension of the interphases isof the order of the particle size or even bigger. For δ � d
or at sufficiently high filling factors there is a percolation-like connection of the interphase regions, which eventuallycover the whole matrix volume. The other limiting caseof agglomerating particles forming bigger clusters of sizedaggl � δ is sketched in figure 13(c). In this case the interphasevolume with modified properties is smaller, so that changes inthe matrix properties are smaller compared with the situation infigure 13(a). The intermediate case in figure 13(b) is the mostrealistic one. There is a distribution of agglomerates, particleswith overlapping interphase regions and single particles. Itcorresponds to the actual situation in our composites (see theTEM pictures in figure 2).
Summarizing, the volume averaged properties of thematrix polymer depend on the spatial extension of theinterphase with respect to the particle size, δ/d , as well ason the degree of agglomeration. Only for δ/d � 1 doesthe interphase volume become noticeable and a change inthe relaxation strength may be detected. With increasingagglomeration the volume fraction of interphases decreases.
Figure 13. Sketches of a composite with particles dispersed in apolymer matrix showing different degrees of agglomeration. Whenthe particles are well dispersed (a), the volume fraction ofinterphases (dotted circles) is high and at sufficiently highconcentration it can cover the whole matrix volume. In the case ofhigh agglomeration (c), the volume fraction of interphases issmaller, so that the modification of the matrix is smaller. Therealistic case (b) consists of agglomerates, particles withoverlapping regions and single particles.
Since we have observed an enhancement of the relaxationstrength in our nano-composites, either the entire polymeris modified or at least δ � 20–30 nm holds. On the otherhand, the dielectric properties of the polymer in the micro-composites are not modified in a measurable way. If thereshould be interphase layers, their spatial extension must beinsignificant, i.e. δ � 5 µm should hold. In principle, theinterphase hypothesis might be tested by a systematic variation
9
J. Phys. D: Appl. Phys. 42 (2009) 064004 B Hallouet et al
of the particle size and of the degree of agglomeration, but forthe time being this is not feasible.
4. Conclusion
We have analysed a dielectric relaxation process of the matrixpolymer in micro- and nano-composites containing conductiveFe3O4 particles. Neither the shape nor the position or thethermal activation of the relaxation process is significantlyaffected by the addition of nano- or micro-particles, i.e.no additional relaxation or polarization mechanisms can bedetected. Although the non-random spatial distribution ofthe particles, i.e. the presence of agglomerates, does notpermit the use of simple effective medium formulae, aquantitative analysis of the relaxation strength is possibleusing the spectral representation. In doing so we are able toseparate unambiguously geometrical effects (the influence ofthe microstructure on the effective permittivity) from intrinsicones, i.e. we are able to determine the intrinsic relaxationstrength of the polymer phase. Only in the micro-compositesdoes the matrix polymer behave bulk-like. In the nano-composites, the intrinsic dielectric strength of the matrix,εm,comp, differs from its bulk value εm. Its increase isproportional to the volume filling factor of the nano-particles,εm,comp � εm · (1 + 5 · f ).
As we measure average values of the dielectric strength,we are not yet able to attribute it to a global or localchange in the matrix polymer. But the comparison betweenthe micro- and nano-composites, that only differ by theirparticle size, supports the interphase hypothesis: the totalarea of interfaces increases with increasing concentration anddecreasing particle size, Asurf ∝ f/d . The same would holdfor the volume fraction of hypothetical interphase layers ofthickness δ covering these surfaces, fip = f ·{(1+2δ/d)3 −1}.The above picture would explain that in the micro-compositesthe matrix polymer behaves bulk-like (δ < d), whereas thechanges become notable only in the nano-composites (δ > d).The higher the particle concentration, the more interphases arepresent leading to an increase in εm,comp compared with itsbulk value εm.
The underlying physical mechanism leading to theincrease in the intrinsic relaxation strength remains a matterof discussion. Several mechanisms might account for theobserved changes. The most interesting one would be that ofaltered interactions at the particle–matrix interfaces affectingthe molecular polarizability. But the addition of particlesduring the preparation of solid polymer samples might alsohave an effect on the structure of the polymer. The preparationconditions were chosen to obtain an amorphous polymer,but in order to exclude a partial crystallinity additionalDSC experiments are needed. In a similar way we mightimagine changes in the polymer density leading to an increasein free volume (as observed in [15]), a modification ofthe polymerization process, a reduced cross-link density orother chemical changes, which can be detected by infraredspectroscopy [15].
Finally, we would like to mention that it is also possible toevaluate the intrinsic permeability of the Fe3O4 particles in the
composites. For this purpose, a combination of dielectric andmagnetic measurements is needed [16]. Such a comparativeanalysis of the micro- and the nano-particles is in preparation.
Acknowledgments
The authors would like to thank J Schmauch for taking theTEM pictures.
References
[1] Wu D Y, Meure S and Solomon D 2008 Progr. Polym. Sci.33 479–522
[2] Zhang S, Huang C, Klein R J, Xia F, Zhang Q M andCheng Z-Y 2007 J. Intell. Mater. Syst. Struct. 18 133–45
[3] Corr S A, Rakovich Y P and Gun’Ko Y K 2008 NanoscaleRes. Lett. 3 87–104
[4] Chung D D L 2004 J. Mater. Sci. 39 2645–61[5] Tuncer E, Sauers I, James D R, Ellis A R, Paranthaman M P,
Goyal A and More K L 2007 Nanotechnology 18 325704[6] Ramesh S, Shutzberg B A, Huang C C, Gao J and
Giannelis E P 2003 IEEE Trans. Adv. Packag. 26 17–24[7] Li C, Thostenson E T and Chou T-W 2008 Compos. Sci.
Technol. 68 1227–49[8] Mdarhri A, Brosseau C and Carmona F 2007 J. Appl. Phys.
101 084111[9] Mdarhri A, Carmona F, Brosseau C and Delhaes P 2008
J. Appl. Phys. 103 054303[10] Balazs A C, Emrick T and Russell T P 2006 Science
314 1107–10[11] Schadler L S, Brinson L C and Sawyer W G 2007 J. Met. 59
53–60[12] Roy M, Nelson J K, MacCrone R K, Schadler L S, Reed C W,
Keefe R and Zenger W 2005 IEEE Trans. Dielectr. Electric.Insul. 12 629–42
[13] Lewis T J 2004 IEEE Trans. Dielectr. Electr. Insul.11 739–53
[14] Lewis T J 2005 J. Phys. D: Appl. Phys. 38 202–12[15] Nelson J K and Hu Y 2005 J. Phys. D: Appl. Phys
38 213–22[16] Hallouet B, Wetzel B and Pelster R 2007 J. Nanomater. 2007
34527[17] Hallouet B 2006 Simulationen und experimentelle
Untersuchungen der dielektrischen und magnetischenEigenschaften von Nanokompositen Master’s ThesisUniversitat des Saarlandes, Saarbrucken, Germany
[18] Pelster R 1995 IEEE Trans. Microw. Theory Technol.43 1494–501
[19] Kanzow J, Horn P S, Kirschmann M, Zaporojtchenko V,Dolgner K, Faupel F, Wehlack C and Possart W 2005Appl. Surf. Sci. 239 227–36
[20] Pelster R, Spanoudaki A and Kruse T 2004 J. Phys. D: Appl.Phys. 37 307–17
[21] Pelster R and Simon U 1999 Colloid Polym. Sci. 277 2–14[22] Sena S P, Lindley R A, Blythe H J, Sauer Ch, Al-Kafarji M
and Gehring G A 1997 J. Magn. Magn. Mater.176 111–26
[23] Havriliak S and Negami S 1966 J. Polym. Sci. C 239 14–99[24] Bottcher C J F and Bordewijk P 1978 Theory of Electric
Polarization: Dielectrics in Time-Dependent Fields vol 2(Amsterdam: Elsevier)
[25] Fu L, MacEdo P B and Resca L 1993 Phys. Rev. B47 13818–29
[26] Spanoudaki A and Pelster R 2001 Phys. Rev. B 64 642051–6[27] Shalaev V M 1996 Phys. Rep. 272 61–137
10