analyses of hydrogen storage materials and on-board · pdf file · 2014-03-18kurtis...
TRANSCRIPT

Analyses of Hydrogen Analyses of Hydrogen Storage Materials and OnStorage Materials and On--
Board SystemsBoard Systems
TIAX LLC15 Acorn Park
Cambridge, MA02140-2390
Tel. 617- 498-6108Fax 617-498-7054
www.TIAXLLC.comReference: D0268
© 2007 TIAX LLC
Hydrogen Delivery Analysis Meeting
May 8, 2007
Stephen LasherKurtis McKenneyYong YangBob RancatoreStefan UnnaschMatt Hooks
This presentation does not contain any proprietary or confidential information
Overview
1SL/042007/D0268 ST32_Lasher_H2 Storage_v1.ppt
Start date: June 2004End date: Sept 200941% Complete
TimelineBarriers addressed
B. CostC. EfficiencyK. System Life Cycle Assessments
Barriers
Total project fundingDOE share = $1.5MNo cost share
FY06 = $275k
FY07 = $300k (plan)
BudgetArgonne and other National Labs
Centers of Excellence and other developers
Tech Teams and other stakeholders
Collaboration

Objectives
2SL/042007/D0268 ST32_Lasher_H2 Storage_v1.ppt
This project provides an independent cost assessment of the hydrogen storage technologies being developed for the DOE Grand Challenge.
Technology FocusTechnology FocusObjectiveObjective DescriptionDescription
OverallHelp guide DOE and developers toward promising R&D and commercialization pathways by evaluating the status of the various on-board hydrogen storage technologies on a consistent basis
On-Board Cost Estimate
Estimate Bill-of-Material factory costs for the on-board storage system
• Cryo-compressed
• Liquid H2• AC
20052005 20062006 20072007
Evaluate or develop system-level designs to estimate weight, volume, and bottom-up factory cost for the on-board storage system
• Compressed H2(update)
• Liquid HC*
Evaluate or develop designs and cost inputs to estimate refueling cost and Well-to-Tank energy use and GHG emissions for the fuel chain
• SBH• Liquid HC*• AC*• Sodium Alanate*
• SBH
• Liquid H2(includes Cryo-compressed)
• Compressed H2
• Sodium Alanate
Off-Board Assessment
On-Board Assessment
* Results have not been generated to date. Note that previously analyzed systems will continually be updated based on feedback and new information.
SBH = Sodium Borohydride, HC = Hydrocarbon, AC = Activated Carbon

Approach On-Board Factory Cost Definition
3SL/042007/D0268 ST32_Lasher_H2 Storage_v1.ppt
We estimate an OEM factory cost, excluding OEM corporate charges for profit, sales and G&A expenses.
We assume a vertically integrated process for the manufacture of the tank, so no mark-up is included on those componentsRaw materials and BOP components are assumed to be purchased by the OEM and therefore include supplier mark-ups
Directlabor
DirectMaterials
FactoryExpense
GeneralExpense
SalesExpense
Profit
OEMPrice
Fixed Costs • Equipment and Plant Depreciation• Tooling Amortization• Equipment Maintenance• Utilities• Indirect Labor• Cost of capital
Variable Costs • Manufactured Materials• Purchased Materials• Fabrication Labor• Assembly Labor• Indirect Materials
DOE Cost Estimate (Factory Cost)
Corporate Expenses (example) • Research and Development• Sales and Marketing• General & Administration• Warranty• Taxes
Excluded from DOE Cost Estimate
OEM – Original Equipment ManufacturerG&A – General and Administration Expense

Approach On-Board Assessment Overview
4SL/042007/D0268 ST32_Lasher_H2 Storage_v1.ppt
The on-board cost and performance assessments are based on detailed technology assessment and bottom-up cost modeling.
TechnologyTechnologyAssessmentAssessment
Cost Model and Cost Model and EstimatesEstimates
Overall ModelOverall ModelRefinementRefinement
• Perform Literature Search
• Outline Assumptions• Develop System Requirements and Design Assumptions
• Obtain Developer Input
• Obtain Developer and Industry Feedback
• Revise Assumptions and Model Inputs
• Perform Sensitivity Analyses (“Best” and “Worst” cases)
• Develop BOM• Specify Manufacturing Processes and Equipment
• Determine Material and Processing Costs
• Develop Bulk Cost Assumptions
Tape Cast
AnodePowder Prep
VacuumPlasmaSpray
ElectrolyteSmall Powder
Prep
ScreenPrint
CathodeSmall Powder
Prep
Sinter in Air1400C Sinter in Air
Formingof
Interconnect
ShearInterconnect
VacuumPlasmaSpray
SlurrySpray
ScreenPrint
Slurry Spray
Slip Cast
Finish Edges
Note: Alternative production processes appear in gray to thebottom of actual production processes assumed
BrazePaint Braze
ontoInterconnect
Blanking /Slicing
QC LeakCheck
Interconnect
Fabrication
Electrolyte CathodeAnode
Stack Assembly
$0
$2
$4
$6
$8
$10
$12
$14
TIAX Base Case 5,000 psi 10,000 psi
Syst
em C
ost,
$/kW
h
Assembly &Inspection
BOP
Dehydriding Sub-system
Tank
Media
BOM = Bill of Materials

Approach On-Board Assessment Economic Assumptions
5SL/042007/D0268 ST32_Lasher_H2 Storage_v1.ppt
The cost of capital equipment, buildings, labor, utilities, etc. are included in our processing cost assessments.
Variable Cost ElementsMaterialDirect LaborUtility
Operating Fixed CostsTooling & FixturesMaintenanceOverhead LaborCost of Operating Capital
Non-Operating Fixed CostsEquipmentBuildingCost of Non-Operating Capital
Working Capital Including materials, labor, utility, tooling and maintenance costWorking capital period: 3 months
EquipmentBuilding
We assume 100% debt financed with an annual interest rate of 15%, 10-year equipment life, and 25-year building life.

Approach On-Board Cost Estimate Processing
6SL/042007/D0268 ST32_Lasher_H2 Storage_v1.ppt
Processing and assembly/inspection costs are derived from an understanding of the detailed process steps and their requirements.
Example: Processing Steps for Compressed TanksExample: Processing Steps for Compressed Tanks
Winding Process Winding Machine
LinerFabrication
PrePreg
Pressureliner
LinerSurface
Gel Coat
CF Winding
•Hoops•Helical•Polar
Cure /Cool down
UltrasonicInspection
GlassFiber
Out LayerWinding
PrePreg
EndDomes
Assembly
PressureTest
DimensionWeight
Inspection
Cure / Cool down
To system
assembly
X-Rayor
ComputedTomograph
y(CT)
Dry air Cleaning
Start
End
LinerFabrication
PrePreg
Pressureliner
LinerSurface
Gel Coat
CF Winding
•Hoops•Helical•Polar
Cure /Cool down
UltrasonicInspection
GlassFiber
Out LayerWinding
PrePreg
EndDomes
Assembly
PressureTest
DimensionWeight
Inspection
Cure / Cool down
To system
assembly
X-Rayor
ComputedTomograph
y(CT)
Dry air Cleaning
Start
End
Tank Material69%
Tank BOP25%
Tank Processing4%
Assembly & Inspection
2%
5,000 psi Storage System Factory Cost 5,000 psi Storage System Factory Cost BreakoutBreakout
Approach On-Board Cost Estimate Overview
7SL/042007/D0268 ST32_Lasher_H2 Storage_v1.ppt
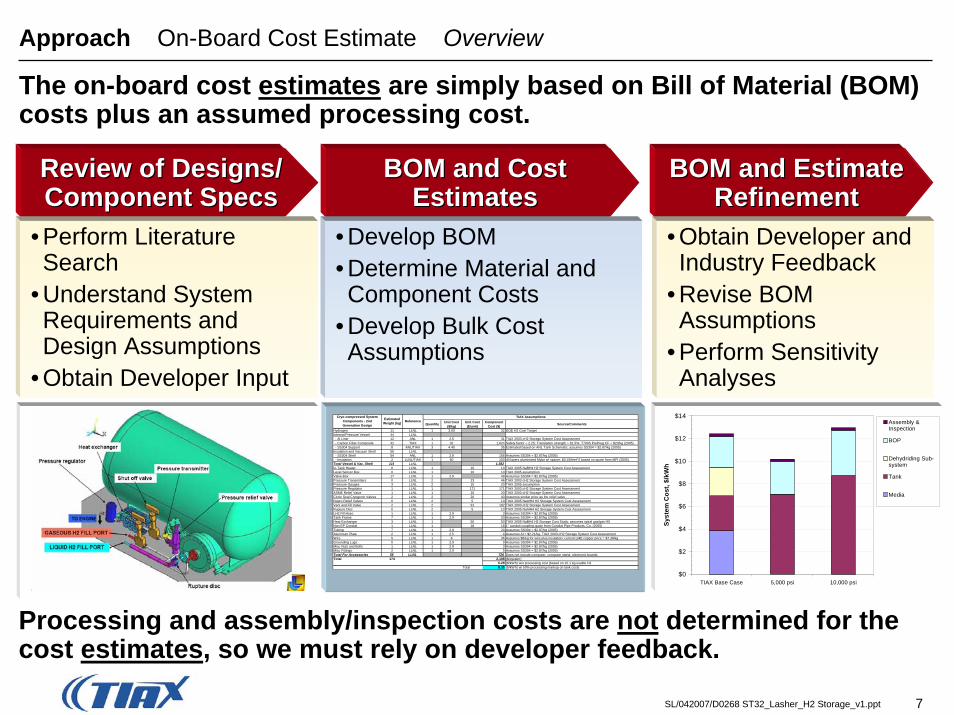
The on-board cost estimates are simply based on Bill of Material (BOM) costs plus an assumed processing cost.
Review of Designs/Review of Designs/Component SpecsComponent Specs
BOM and Cost BOM and Cost EstimatesEstimates
BOM and EstimateBOM and EstimateRefinementRefinement
• Perform Literature Search
• Understand System Requirements and Design Assumptions
• Obtain Developer Input
• Develop BOM• Determine Material and Component Costs
• Develop Bulk Cost Assumptions
• Obtain Developer and Industry Feedback
• Revise BOM Assumptions
• Perform Sensitivity Analyses
$0
$2
$4
$6
$8
$10
$12
$14
TIAX Base Case 5,000 psi 10,000 psi
Syst
em C
ost,
$/kW
h
Assembly &Inspection
BOP
Dehydriding Sub-system
Tank
Media
Quantity Unit Cost ($/kg)
Unit Cost ($/unit)
Component Cost ($) Source/Comments
Hydrogen 11 LLNL 1 3.00 32 DOE H2 Cost TargetInternal Pressure Vessel 44 LLNL - Al Liner 12 ANL 1 2.5 31 TIAX 2003 cH2 Storage System Cost Assessment - Carbon Fiber Composite 32 TIAX 1 32 1,024 Safety factor = 2.25; Translation strength = 81.5%; T700S PrePreg CF = $20/kg (2005) - SS304 Support 8 ANL/TIAX 3 4.40 35 Estimated based on ANL Tank Schematic; assumes SS304 = $2.87/kg (2005)Insulation and Vacuum Shell 56 LLNL - SS304 Shell 54 ANL 1 2.9 156 Assumes SS304 = $2.87/kg (2005) - Insulation 2 LLNL/TIAX 1 50 103 40 layers aluminized Mylar w/ spacer; $0.15/feet^2 based on quote from MPI (2005)Total Vessel & Vac. Shell 119 LLNL 1,382In-Tank Heater 0 LLNL 1 10 10 TIAX 2005 NaBH4 H2 Storage System Cost AssessmentLevel Sensor Box 0 LLNL 1 10 10 TIAX 2005 assumptionValve Box 17 LLNL 1 2.9 49 Assumes SS304 = $2.87/kg (2005)Pressure Transmitters 0 LLNL 2 23 46 TIAX 2003 cH2 Storage System Cost AssessmentPressure Gauges 3 LLNL 2 10 20 TIAX 2005 assumptionPressure Regulator 1 LLNL 1 171 171 TIAX 2003 cH2 Storage System Cost AssessmentASME Relief Valve 1 LLNL 1 20 20 TIAX 2003 cH2 Storage System Cost AssessmentCircle Seal Cryogenic Valves 2 LLNL 2 20 40 Assumes similar price as the relief valveNupro Relief Valves 0 LLNL 2 5 10 TIAX 2005 NaAlH4 H2 Storage System Cost AssessmentVent and Fill Valve 2 LLNL 2 91 182 TIAX 2003 cH2 Storage System Cost AssessmentRupture Disc 0 LLNL 2 5 10 TIAX 2005 NaAlH4 H2 Storage System Cost AssessmentLH2 Fill Hose 1 LLNL 1 2.9 3 Assumes SS304 = $2.87/kg (2005)Tank Frame 7 LLNL 1 2.9 20 Assumes SS304 = $2.87/kg (2005)Heat Exchanger 3 LLNL 1 50 50 TIAX 2005 NaBH4 H2 Storage Cost Study; assumes spiral gas/gas HXNon EP Conduit 1 LLNL 1 18 18 1" conduit coupling quote from Conduit Pipe Products, Co. (2005)Tubing 7 LLNL 1 2.9 20 Assumes SS304 = $2.87/kg (2005)Aluminum Plate 2 LLNL 1 2.5 4 Assumes Al = $2.21/kg, TIAX 2003 cH2 Storage System Cost AssessmentWire 5 LLNL 1 8 36 Assumes $8/kg for wire plus insulation; current LME copper price = $7.39/kgGrounding Lugs 0 LLNL 1 2.9 0 Assumes SS304 = $2.87/kg (2005)Misc Nuts and Bolts 1 LLNL 1 2.9 3 Assumes SS304 = $2.87/kg (2005)Misc Fittings 2 LLNL 1 2.9 5 Assumes SS304 = $2.87/kg (2005)Total For Accessories 55 LLNL 726 Does not include computer, computer stand, electronic boardsTotal 174 2,108 ($/system)
6.29 ($/kWh) w/o processing cost (based on 10.1 kg usable H2Total 8.35 ($/kWh) w/ 50% processing markup on tank costs
Cryo-compressed System Components - 2nd Generation Design
Estimated Weight (kg) Reference
TIAX Assumptions
Processing and assembly/inspection costs are not determined for the cost estimates, so we must rely on developer feedback.

8SL/042007/D0268 ST32_Lasher_H2 Storage_v1.ppt
The off-board assessment makes use of existing models to calculate cost and performance for each technology on a consistent basis.
Approach Off-Board Assessment Overview
Process Simulation
Energy requirementsEquipment size/ specs
H2A Model
Equivalent hydrogen selling price
Conceptual Design
System layout and equipment requirements
Capital Cost EstimatesSite Plans
Safety equipment, site prep, land costs
High and low volume equipment costs
Air (POX only)
Nat. Gas
Water
FuelReformer PSA
H2-rich gas
H2-poor gas
CatalyticBurner
HeatColdWater
99.99% pure H2
LowPressureStorage
MediumPressureStorage
HighPressureStorage
Flowcntrlr
Flowcntrlr
Flowcntrlr
Dispenser
To Vehicle
CO2H2O
Compressor with intercoolers
CoolingTower
0
10
20
30
40
50
cH2, CentralNG,
TubeTrailer
cH2, CentralNG, LH2
cH2, CentralNG, Pipeline
cH2, On-siteElectrolyzer,
US Power Mix
cH2, On-siteNG SR
cH2, On-siteNG SR, MHV
Hyd
roge
n C
ost,
$/G
J (L
HV) Margin
TransportationOperation, MaintenanceCapitalEnergy Costs
Includes local fueling station and central plant costs
WTT energy useWTT GHG
0 1 2 3 4 5 6
cH2, natural gas, FCV
Ethanol, corn, FCV
Methanol, natural gas, FCV
Gasoline, petroleum, FCV
Diesel, petroleum, HEV
Gasoline, petroleum, HEV
Diesel, petroleum, ICEV
Gasoline, petroleum, ICEV
Primary Energy (LHV), MJ/mi
Petroleum Other Fossil Fuel Non Fossil Fuel
Tape Cast
AnodePowder Prep
VacuumPlasmaSpray
ElectrolyteSmall Powder
Prep
ScreenPrint
CathodeSmall Powder
Prep
Sinter in Air1400C Sinter in Air
Formingof
Interconnect
ShearInterconnect
VacuumPlasmaSpray
SlurrySpray
ScreenPrint
Slurry Spray
Slip Cast
Finish Edges
Note: Alternative production processes appear in gray to thebottom of actual production processes assumed
BrazePaint Braze
ontoInterconnect
Blanking /Slicing
QC LeakCheck
Interconnect
Fabrication
Electrolyte CathodeAnode
Stack Assembly
Fuel Station Perimeter
Electrolyzer or SMR,High-PressureCompressor
H2 High PressureCascade Storage
System
Gaseous FuelDispensing Islands
Underground Piping with shared conduit
Vent
Building
Covered Fueling Island
CNG High PressureCascade Storage System
Fire Detector
Property of:TIAX LLC
1061 De Anza Blvd.Cupertino, CA 95014
Task 5 CNG/Hydrogen Fueling
Site Plan - Fueling Station
Hydrogen and CNG fueling station
SIZE DWG BY DWG NO REV
A Stefan Unnasch B0228 - S0022 1
SCALE 1" = 8 ft 5 Jan 2004 SHEET 1 OF 110 ft
Security FenceNG line in
GREET Model

Approach Off-Board Assessment Steps
9SL/042007/D0268 ST32_Lasher_H2 Storage_v1.ppt
The off-board assessment for Sodium Borohydride (SBH) requires evaluation of regeneration, delivery and forecourt technologies.
H2 is supplied “over-the-fence”
May include electrolysis
Today's processes may not recycle all spent material
Spent Material
Carrier
Forecourt
Carrier
Delivery(Terminal and Trucking)
Regeneration
Spent Matl.
Carrier
Spent Matl.
Waste
Transportation of the carrier and spent material in same truckTerminal storage may be required at the regeneration site
May include carrier and spent material storage and dispensing (loading and off-loading)Or compressed hydrogen dispensing
Raw Material
300 psi H2
Electricity

Progress On-Board Cost Estimates System Schematics
10SL/042007/D0268 ST32_Lasher_H2 Storage_v1.ppt
Fundamental system requirements and basic schematics were acquired from literature, industry and National Labs.
Activated Carbon (AXActivated Carbon (AX--21)21)
Liquid HLiquid H22 CryoCryo--compressedcompressed
Figure from LLNL, 2006
Figure from ANL, 2006
Figure from Linde
Al liner (AX-21) Al foam
MLVSI Support
Al ShellMLVSICarbon Fiber
In-tank Al Heat Exchanger
Al liner (AX-21) Al foam
MLVSI Support
Al ShellMLVSICarbon Fiber
In-tank Al Heat Exchanger

Progress On-Board Cost Estimates Design Assumptions (AC Example)
11SL/042007/D0268 ST32_Lasher_H2 Storage_v1.ppt
For each cost estimate, we relied on system-level design assumptions from literature and discussions with National Labs and developers.
Sub-System Parts List Specifications Basis/Comments
Hydrogen 5.6 kg usable ANL drive-cycle modeling
Activated Carbon (AX-21) 42 kg usable H2/ m3, 300 kg/m3 bulk dens, 2800 m2/g, 0.1 W/m-K
Al foam 2 wt% Al-2024 foam, 2.4 W/m-K
In-tank LN2 Heat ExchangerAl-2024, 9.5 mm OD, 1.2 mm thick
tubes, 0.9 mm thick tube sheets, 107 tubes
ANL AC tank design; similar in style to NaAlH4 in–tank heat exchanger, but functionally used to cool the tank with LN2 during refueling
SS Filters Sintered SS Not mentioned by ANL, assumed necessary (similar to NaAlH4)
Al liner 2 mm Al alloy ANL AC tank design
CF Composite T700S, 60% fiber by vol, 1600 kg/m3, 2.25 SF TIAX assumptions based on previous high-pressure tank designs
CF Composite Layer Thickness 7 mm TIAX netting analysis for 175L, 200 bar, 82% translation strength
MLVSI 10-5 torr vacuum, 1 W heat transfer rate through insulation (~5 W total) ANL AC tank design (same as cryo-compressed tank)
MLVSI Layers 35 Preliminary TIAX estimate based on cryo-compressed tank, adjusted for new tank surface area and temperatures
MLVSI support Composite material Low thermal conductivity material required
Al outer shell 3 mm Al alloy ANL AC tank design
BOP Regulators, valves, fill port, etc 200 bar pressure Assumed same as for cryo-compressed tank, although pressure is
40% lower
Tank
ANL AC modeling for 200 bar, 100 K, and 50 K temp. swingMedia
* Part lists for other systems shown in backup slides

Progress On-Board Cost Estimates Critical Cost Drivers (AC Example)
12SL/042007/D0268 ST32_Lasher_H2 Storage_v1.ppt
From BOM cost estimates, we calculated total system costs and identified key sub-systems and cost drivers.
BOP25%
Carbon Fiber23%
Packed Media / H2
Stored23%
Balance of Tank12%
Processing17%
$0 $100 $200 $300 $400 $500 $600 $700
All others
MLVSI
Pressure Regulator
Vent and Fill Valve
Process Cost
Activated Carbon (AX-21)
Carbon Fiber Composite
Cost per System
Activated Carbon System Cost, 5.6 kg HActivated Carbon System Cost, 5.6 kg H22 -- $2,900$2,900 Activated Carbon Cost Components Pareto, 5.6 kg HActivated Carbon Cost Components Pareto, 5.6 kg H22
PRELIMINARY
Note: It is not clear what processing cost to use for carbon fiber tanks with MLVSI (e.g., cryo-compressed and activated carbon) but developers comments indicate that processing costs could be somewhere between 10-100% of the tank material costs. We chose 50% for now, but we will be refining this based on further developer discussions.
Critical cost drivers such as carbon fiber, activated carbon, and processing cost will be evaluated in more detail for the AC system.
Progress Off-Board Assessment H2A Carrier Model
13SL/042007/D0268 ST32_Lasher_H2 Storage_v1.ppt
The H2A Carrier model was used to allow for direct cost comparison to compressed and liquid H2 fuel options.
Most financial assumptions are maintained from the original H2A Model
New calculation tabs were added as part of the DOE Delivery ProjectRegeneration – calculates material regeneration costs based on capital and operating costs of a central plantTrucking – calculates trucking costs for all novel carriersStorage Terminal – calculates required storage for fresh and spent materialsForecourt – calculates forecourt station costs for fueling vehicles with novel carrier storage
Calculation tabs were populated with inputs based on industry and developer feedback
TIAX made initial estimates consistent with H2A methodologyModel and estimates were reviewed with developersModel inputs and results were updated

Progress Off-Board Assessment Regeneration Process
14SL/042007/D0268 ST32_Lasher_H2 Storage_v1.ppt
We evaluated a regeneration process for SBH that reflects existing technology but is not currently being used at the industrial-scale.
275 °C,1 bar
NaBH4
25 °C, 1 bar
B(OCH3)3
350 °C,1 bar
H2O
80 °C,1 bar
H3BO3
MeOH, H2O
25 °C, 1 bar
3 NaOCH3
Mineral Oil
1 Na
3 Na H2O
2 H2
Regeneration Process Schematic for SBH PlantRegeneration Process Schematic for SBH Plant
NaBH4
NaBO2
Inputs
Recycle
Outputs
Legend
H2O, H2, OH-
250 °C, 4.4 bar
4 NaH
97 Wh
NaCl Electrolysis “over the fence”
3 NaOH3/2 H2
1/2 H2SO4
1/2 Na2SO4

Preliminary Results On-Board Cost Estimates Comparison
15SL/042007/D0268 ST32_Lasher_H2 Storage_v1.ppt
$0
$2
$4
$6
$8
$10
$12
$14
$16
$18
$20
Cryo-Compressed
LH2 ActivatedCarbon AX-21
SodiumBorohydride
SodiumAlanate
5,000 psi 10,000 psi
Syst
em C
ost,
$/kW
h
Processing
BOP
Water RecoverySub-system
Catalytic Reactor
Dehydriding Sub-system
Tank
Media / H2
10.7 kg LH2Capacity (10.1 kg
Useable1 LH2)
2007 Target ($6/kWh)
~5.6 kg H2Capacity/ Usable
PRELIMINARY
2010 Target ($4/kWh)
The cryo-compressed and LH2 systems are projected to be cheaper than pressurized-only options; AC will have similar costs to pressurized-only.
Cost Estimates Only Note: 5,000 and 10,000 psia Cases based on: Carlson, E., et al. (TIAX), “Cost Analyses of Fuel Cell Stacks/Systems”, Merit Review, Philadelphia, PA, May 24-27, 2004. Adjusted for <100% carbon fiber translational strength.

Preliminary Results On-Board Cost Estimates Comparison (5.6 kg/H2 Basis)
16SL/042007/D0268 ST32_Lasher_H2 Storage_v1.ppt
$0
$2
$4
$6
$8
$10
$12
$14
$16
$18
$20
Cryo-Compressed
LH2 ActivatedCarbon AX-
21
SodiumBorohydride
SodiumAlanate
5,000 psi 10,000 psi
Syst
em C
ost,
$/kW
h
Processing
BOP
Water RecoverySub-system
Catalytic Reactor
Dehydriding Sub-system
Tank
Media / H2
Normalized for 5.6 kg
Usable1 LH2
Cost Estimates Only
~5.6 kg H2Capacity/ Usable
PRELIMINARY
2007 Target ($6/kWh)
2010 Target ($4/kWh)
However, the cryo-compressed system is estimated to be just 17% cheaper than a 5,000 psi tank system when normalized for 5.6 kg H2.
Note: 5,000 and 10,000 psia Cases based on: Carlson, E., et al. (TIAX), “Cost Analyses of Fuel Cell Stacks/Systems”, Merit Review, Philadelphia, PA, May 24-27, 2004. Adjusted for <100% carbon fiber translational strength.

Preliminary Results On-Board Cost Estimates Cryo-compressed Sensitivity
17SL/042007/D0268 ST32_Lasher_H2 Storage_v1.ppt
Single- and multi-variable sensitivity analyses are used to estimate the dependence and sensitivity of cost on/to the critical cost drivers.
CryoCryo--Compressed Key Variable AssumptionsCompressed Key Variable AssumptionsKey Key Sensitivity Sensitivity ParametersParameters BaseBase--
lineline MinMin MaxMax Comments/SourceComments/Source
CF Composite Cost ($/lb)
14.6
Processing Markup (%)2 50% 10% 100%
Min equivalent to compressed-only tanks; max based on cryo-tank developer comments
Safety Factor 2.25 1.80 3.00
Baseline assumes a typical industry factorMin and max based on Quantum and Dynatek, respectively
CF Translation Strength (%)
81.5% 78% 85%Estimates reported by Quantum for 5,000 psi tanks
SS304 Cost ($/kg) 2.7 2.1 3.1 Baseline from TIAX
(2003) inflated to 2005$
90
170
12.8 25.5
Includes Epoxy (1.27x CF)Baseline from TIAX (2003) inflated to 2005$Min and max based on developer input
Fill Port Cost ($) 90 170
Industry interviews (2003), inflated to 2005$Need to develop bottom up cost for min
Regulator Cost ($) 140 200 Industry interviews
(2003), inflated to 2005$
6 7 8 9 10 11 12
T700S FiberComposite Cost
ProcessingCost
Safety Factor
SS304 Cost
Fill Port Cost
CF TranslationStrength
Insulation Cost
Regulator Cost
CryoCryo--compressed System Singlecompressed System Single--variable variable Sensitivity Analysis (10.7 kg LHSensitivity Analysis (10.7 kg LH22 Capacity)Capacity)
Baseline = $8.35 /kWh
1The processing cost markup is applied to the tank cost. 8.4
1.5
9.9
$/kWh
Mean
Std. Dev.
TIAX Baseline
System Cost
AC System MultiAC System Multi--variable Sensitivity Analysisvariable Sensitivity Analysis
PRELIMINARY$/kWh

Preliminary Results On-Board Cost Estimates LH2 Sensitivity
18SL/042007/D0268 ST32_Lasher_H2 Storage_v1.ppt
The processing cost markup uncertainty has the most significant impact on the liquid hydrogen system cost.
LHLH22 System SingleSystem Single--variable Sensitivity variable Sensitivity Analysis (10.7 kg HAnalysis (10.7 kg H22 Capacity)Capacity)
1 Costs per kWh are based on a projected 336 kWh (10.1 kg) “usable”hydrogen assuming 94% drive cycle utilization (ANL). A drive cycle utilization calculation should be performed specifically for the LH2 system.2 The processing cost markup is applied to the tank cost.
System Cost $/kWh
Mean 5.1
0.3Std. Dev.
TIAX Baseline 4.9
AC System MultiAC System Multi--variable Sensitivity Analysisvariable Sensitivity Analysis
Liquid HLiquid H22 Storage Key Variable AssumptionsStorage Key Variable AssumptionsKey Key Sensitivity Sensitivity ParametersParameters BaseBase--
lineline MinMin MaxMax CommentsComments
Processing Markup (%)2 50% 10% 100%
Min equivalent to compressed-only tanks; max based on cryo-tank developer comments
Boil-off Management 320 240 400
TIAX estimate; need to obtain more specific material types/weights from Linde or BMW for bottom up analysis
90
SS304 Cost ($/kg) 2.7 2.1 3.1 Baseline from TIAX
(2003) inflated to 2005$
170
Fill Port Cost ($) 90 170
Industry interviews (2003), inflated to 2005$Need to develop bottom up cost for min
Regulator Cost ($) 140 200 Industry interviews
(2003), inflated to 2005$
2 3 4 5 6 7 8
ProcessingCost
SS304 Cost
Fill Port Cost
Boil-OffManagement
InsulationCost
RegulatorCost
$/kWh
Baseline = $4.94/kWh
PRELIMINARY

Preliminary Results On-Board Cost Estimates AC Sensitivity
19SL/042007/D0268 ST32_Lasher_H2 Storage_v1.ppt
The AC storage media, carbon fiber and processing cost assumptions show the most significant variability in overall cost.
13 14 15 16 17 18 19 20
Processing Cost
CF CompositeCost ($/lbs)
Storage MediaCost ($/lbs)
Safety Factor
Fill Port Cost ($)
Insulation Cost
CF TranslationStrength (%)
$/kWh
AC System SingleAC System Single--variable Sensitivity variable Sensitivity Analysis (5.6 kg HAnalysis (5.6 kg H22 Capacity)Capacity)
Baseline = $15.6 /kWh
AC HAC H22 Storage Key Variable AssumptionsStorage Key Variable AssumptionsKey Key Sensitivity Sensitivity ParametersParameters BaseBase--
lineline MinMin MaxMax CommentsComments
Processing Markup (%)1 50%
14.6
7
2.25
90
81.5%
10% 100%Min equivalent to compressed-only tanks; max based on cryo-tank developer comments
CF Composite Cost ($/lb)
12.8 25.5
Includes Epoxy (1.27x CF)Baseline from TIAX (2003) inflated to 2005$Min and max based on developer input
AC Media Cost ($/lbs) 4 10
Cost estimate from Kansai Coke and Chemical Co DTI (1996), projected for high volume and 2005$
Fill Port Cost ($) 90 170
Safety Factor 1.80 3.0
Baseline assumes a typical industry factorMin and max based on Quantum and Dynatek, respectively
CF Translation Strength (%)
Industry interviews (2003), inflated to 2005$Need to develop bottom up cost for min
78% 85%Estimates reported by Quantum for 5,000 psi tanks
1The processing cost markup is applied to the tank cost. 15.6
1.9
17.3
$/kWh
Mean
Std. Dev.
TIAX Baseline
System Cost
AC System MultiAC System Multi--variable Sensitivity Analysisvariable Sensitivity Analysis
PRELIMINARY

Preliminary Results Off-Board Assessment WTT Comparison
20SL/042007/D0268 ST32_Lasher_H2 Storage_v1.ppt
0
2
4
6
8
10
12
cH2 (pipeline) LH2 SBH
Equi
vale
nt H
2 Se
lling
Pric
e, $
/kg
Forecourt
Delivery
Central Plant /Regeneration
Preliminary results indicate that the equivalent H2 price for SBH will be ~2.5 times more expensive than liquid or compressed hydrogen.
HH22 Selling Price Comparison Selling Price Comparison –– Preliminary ResultsPreliminary Results11
PRELIMINARY
1 These results are based on natural gas steam reforming as the sources for the hydrogen. Production and delivery efficiency (LHV) assumptions include: steam reformer = 74%, pipeline power = 3 kWh/kg, liquefier power = 8.6 kWh/kg. Cost assumptions include: 100 km truck delivery from a central plant to the forecourt designed for 1500 kg/day H2, SBH plant = 470 TPD (100 TPD H2 equivalent), Hydrogen plant = 300 TPD.

Preliminary Results Off-Board Assessment WTT Comparison
21SL/042007/D0268 ST32_Lasher_H2 Storage_v1.ppt
WTT primary energy inputs for SBH based on “current technology” are even more energy intensive than electrolysis pathways.
0.0 1.0 2.0 3.0 4.0 5.0
SBH: Na + H2 Electrolysis, Truck
cH2: On-Site Electrolysis, U.S. Mix
cH2: Central NG SR, LH2
cH2: Central NG SR, TT
cH2: Central NG SR, Pipeline
Gasoline: Petroleum
WTT Energy, J/J fuel (LHV)
Fuel Other Fossil Fuel Petroleum Non Fossil Fuel ““EfficiencyEfficiency””
75%
58%
54%
47%
27%
22%
WTT Energy Comparison WTT Energy Comparison –– Preliminary ResultsPreliminary Results11
PRELIMINARY
1 These results are based on natural gas steam reforming or water electrolysis with grid power as the sources for the hydrogen. Production and delivery efficiency (LHV) assumptions include: steam reformer = 74%, electrolyzer = 70%, pipeline power = 3 kWh/kg, liquefier power = 8.6 kWh/kg.

Future Work FY07
22SL/042007/D0268 ST32_Lasher_H2 Storage_v1.ppt
We are in the process of finalizing the AC, cryo-compressed, and LH2on-board results and conducting the off-board assessment.
Finalize results for the on-board cryo-compressed, liquid H2 and AC systems, including:
Solicit additional developer feedback, especially regarding processing costs Develop more detailed cost estimates for key cost variablesEvaluate and compare system weight breakout to ANL and developers estimates
Finalize results for LH2 and SBH and start off-board analyses for liquid HC, alanate and AC systems
Determine WTT energy use and GHG emissions for each fuel chainEstimate “refueling cost” and storage system “ownership cost”Consider vehicle integration impacts
Continue to work with DOE, H2A, other analysis projects, developers, National Labs, and Tech Teams to revise and improve past system models

Summary
23SL/042007/D0268 ST32_Lasher_H2 Storage_v1.ppt
We have completed certain aspects of on-board and off-board evaluations for eight hydrogen storage technologies.
Analysis To DateAnalysis To Date cHcH22 AlanateAlanate SBHSBH CryoCryo--compcomp LHLH22 ACAC MgHMgH22
√
√
√
WTT analysis tool1 √Overall
√ ∗
Liquid Liquid HCHC
√ WIP
WIP
√ ∗
WIP
Review developer estimates √ √ √ √
√ ∗
√
√
√ ∗
√ ∗
WIP
Independent performance assessment (wt, vol) √ √ √
On-Board
Review developer estimates √ √
√
√ ∗
Off-Board
√ ∗
Develop process flow diagrams and system energy balances √
Independent performance assessment (energy, GHG) √
Independent cost assessment √
Develop process flow diagrams and system energy balances √ √ √
Independent cost assessment √ √ √
Solicit input on TIAX analysis √ √ WIP
WIPWIPInterim report
= Not part of current SOW= Work in progress
* Preliminary results under review.1 Working with ANL and H2A participants on separate WTT analysis tools. WIP

Acknowledgement
24SL/042007/D0268 ST32_Lasher_H2 Storage_v1.ppt