analyses of adsorption behavior of co2, ch4, and n2 on
TRANSCRIPT
Analyses of Adsorption Behavior of CO2,CH4, and N2 on Different Types of BETAZeolites
The adsorption equilibrium and kinetics of CO2, CH4, and N2 on three types ofBETA zeolites were investigated at different temperatures and a defined partialpressure range from dynamic breakthrough experiments. The adsorbed amountfollowed the decreasing order of CO2 > CH4 > N2 for all studied materials. For thesame ratio of SiO2/Al2O3, the Na-BETA-25 zeolite showed a higher uptake capaci-ty than H-BETA-25, due to the presence of a Na+ cationic center. Comparing thesame H+ compensation cation, zeolite H-BETA-25 expressed a slightly higheradsorption capacity than H-BETA-150. Regarding the selectivity of gases, basedon their affinity constants, H-BETA-150 displayed the best ability. The adsorptionkinetics was considered using the zero-length-column (ZLC) technique. Responsesurface methodology (RSM) was applied to evaluate the interactions betweenadsorption parameters and to describe the process.
Keywords: Adsorption equilibrium, Natural gas upgrading, Response surface methodology,Zeolite BETA, Zero-length-column technique
Received: July 26, 2018; revised: September 24, 2018; accepted: November 20, 2018
DOI: 10.1002/ceat.201800386
1 Introduction
1.1 Biogas Upgrading and Natural Gas Purification
The separation and purification of industrial commodities, e.g.,gases, fine chemicals, and fresh water, are conjoined with high-energy-cost projects (15 % of global energy production) andthe demands of such products are estimated to have a triplerise by 2050 [1]. While carbon dioxide (CO2) has a strongereffect than other gases on energy fields to implement successfulseparation and purification technologies, it is also one of themain causes of climate change. So, carbon capture and storage(CCS) is a vital step in different processes including natural gassweetening, biogas upgrading, landfill gas purification, and alsopost-combustion processes [2–5].
Among all of these technologies, biogas has a significantimportance as a promising renewable energy source and ischaracterized by economical costs. While the composition ofbiogas depends on the sludge and the operation conditions ofthe digestion process, CH4 and CO2 are two main parts of bio-gas. It also contains some other contaminations (less than 4 %)including N2, H2O, H2S, NH3, O2, and siloxane [6]. Thus, inthe way of biogas upgrading, these contaminants should beeliminated for applications as a high-quality fuel and a promis-ing replacement for fossil fuels [7]. Among all of the pollutantsof biogas, CO2 is the major one, and the costs of its removal isa most critical step in the upgrading process (CO2 content lessthan 3 vol %) [8].
On the other hand, while natural gas is one of the favorableenergy sources in the world, the applications of this energysource has still some problems because of the presence of sever-al impurities such as nitrogen and CO2 [5, 9]. Beside of its toxiceffects, CO2 corrodes the transportation and storage systems inthe presence of water. Also, the significant amounts of nitrogenin the natural gas should be purified to meet the pipeline qual-ity for minimum heating value specifications, typically > 90 %methane [9, 10]. As a result, the natural gas upgrading shouldbe implemented during the sweeting processes to meet the‘‘pipeline-quality’’ methane.
Chem. Eng. Technol. 2019, 42, No. 2, 327–342 ª 2019 WILEY-VCH Verlag GmbH & Co. KGaA, Weinheim www.cet-journal.com
Adriano Henrique1,2,3
Mohsen Karimi1,2,3,*
Jose A.C. Silva2,3
Alırio E. Rodrigues1
Supporting Informationavailable online
–1Adriano Henrique, Dr. Mohsen Karimi, Prof. Jose A.C. Silva, Prof. Alır-io E. [email protected] of Porto, Laboratory of Separation and Reaction Engineer-ing (LSRE), Associate Laboratory LSRE/LCM, Department of ChemicalEngineering, Faculty of Engineering, Rua Dr. Roberto Frias, 4099-002Porto, Portugal.2Adriano Henrique, Dr. Mohsen Karimi, Prof. Jose A.C. SilvaInstituto Politecnico de Bragança, Laboratory of Separation andReaction Engineering (LSRE), Associate Laboratory LSRE/LCM,Department of Chemical and Biological Technology, Campus deSanta Apolonia, 5300-857 Braganca, Portugal.3Adriano Henrique, Dr. Mohsen Karimi, Prof. Jose A.C. SilvaGrupo de Processos e Produtos Sustentaveis, Centro de Investigaçaode Montanha (CIMO), Campus de Santa Apolonia, 5300-253 Bragan-ca, Portugal.
Research Article 327

1.2 Purification and Upgrading Techniques
Biogas upgrading in methane is a requisite step for its applica-tions as a vehicle fuel, industrial usages, and in the nationalgrids, which is primarily achieved by CO2 and nitrogen elimi-nation [11]. Currently, several methods are in use on the com-mercial scale for biogas upgrading to meet ‘’’pipeline-quality’’criteria. These techniques are categorized as physical (e.g., pres-sure swing adsorption) [12, 13], chemical (e.g., amine scrub-bing) [14], membrane-based process [15], cryogenic process[16], and chemical conversion [17].
Among these methods, adsorption processes by solid porouscrystalline materials due to the environmental criteria and low-er capital costs have become an increasingly competitive andfavorable strategy for small- to medium-scale operations. Also,studies are ongoing to achieve the industrial scale [18]. In thisprocess, a component in the gas stream due to the physical orvan der Waals forces transfers to the surface of solid porousmaterials, then it is trapped by the available cavities. Gassequestration by physical adsorption is employed by varioussolid adsorbents, including porous carbons [19], metal organicframework materials [20–23], zeolites [24, 25], lithium zircon-ate [26], and silicon-based mesoporous materials [27]. Amongthe most favorable ones are zeolites due to their high uptakecapacity, low preparation cost, and easy synthesis.
1.3 Zeolites
Zeolites are microporous crystalline aluminosilicates and havea well-defined 3D framework structure with a TO4 (T is nor-mally Si or Al) tetrahedral corner, by sharing a basic buildingunit. These tetrahedral basic units can form moieties with6-rings, 8-rings or even 12-rings [28, 29]. Considering theregeneration conditions of zeolites after several usages, theirabilities for liquid and gaseous media, and also their uniquemolecular sieving properties, these adsorbents are among themost promising ones [30]. Moreover, compensation of alumi-num atoms which are present inside the zeolite frameworkwith exchangeable cations (often alkali cations) in the porespace gives structurally tuned zeolites, and enables them toadsorb a wide range of gas molecules, including CO2, CH4, andN2.
According to the International Zeolite Association (IZA),more than 250 unique zeolites topologies are reported [31].Here, BETA zeolite has been considered as adsorbent materialbecause of its superior structural features. This adsorbent wasfirst synthesized by Wadlinger et al. [32], using tetraethylam-monium cation (TEA) as an organic structure, directing agent(SDA) at the mobile research and development laboratories.After that, the structural determination of BETA zeolite waspresented for the first time by Treacy and Newsam [33]. Basedon their study, BETA has a very open crystalline structure withhigh surface area and consists of 3D interconnected large pores,with both sinusoidal and linear channels (diameters of0.55 ·0.55 nm and 0.76 ·0.64 nm, respectively) [33].
Also, ion-exchange capacities and abilities should be synthe-sized at a wide chemical composition, i.e., SiO2/Al2O3 ratios[33–35]. This quality makes it a valuable candidate for CO2
adsorption because of the control of this molar ratio by adjust-ing the number of acid sites and the hydrophilic/hydrophobiccharacter of this adsorbent. These combined superior charac-teristics introduce BETA zeolite as an admissible material fordifferent applications in the petrochemical and fine chemistry,biomass and environmental chemistry [36].
In the literature, there are only a few studies on CO2 selectiv-ity over other gases regarding equilibrium separation usingzeolite BETA [37–41]. First, Xu et al. [37] studied the adsorp-tion of CO2, CH4, and N2 on BETA zeolite by the exchange ofcompensation cations (H+ and Na+ forms) at 273 K and 303 Kand also at 0–1 bar, by employing a static volumetric system.They showed that the Na+ form contributes to higher adsorbedamounts than the H+ form for all considered gases. They alsostudied the adsorption of CO2, CH4, and N2 on the BETA zeo-lite with monoethanol amine (MEA, 40 wt %) incorporatedframework (MEA(40)-b) at 303 K and 1 bar. They observedthat the CO2/CH4, CO2/N2, and CH4/N2 selectivities weremuch better than for BETA zeolite without MEA [38].
Also, Huang et al. [39] considered the adsorption equilibri-um of CO2 and CH4 under high pressure of up to 20 bar atdifferent temperatures (308.1, 318.1, and 328.1 K) by a staticvolumetric apparatus on the zeolite BETA and found that ithad a much higher preferential adsorption for CO2 than forCH4. In addition, Yang et al. [38] reported the adsorptionbehavior of CO2 on BETA zeolites, which were compensatedwith different earth metal cations (alkali and alkaline), in series.The adsorption capacity of CO2 decreased in the order ofK+ > Na+ > Li+ > Ba2+ > Ca2+ = Cs+ > Mg2+.
On the other hand, BETA zeolite is a strong and robustadsorbent which is widely used in catalysis. One of the mainfeatures of BETA zeolite is its ability to be synthesized in acompletely de-aluminated form, which improves its hydropho-bicity character to the same order of activated carbons [40]. Inthis way, in the industries of natural gas sweeting and biogasupgrading to separate CO2/N2/CH4, which contained a per-centage of water, it can be a favorable adsorbent. Thus, in thisstudy, the adsorption of CO2/CH4/N2 at different Si/Al ratiosand cations was investigated, and it was proved that this adsor-bent has reasonable sorption capacity even when the Si/Al ratiochanges. This means that apart from having lower adsorptioncapacities for CO2 relatively to highly hydrophilic zeolites, suchas zeolites 4A, 5A, and 13X, the capability of BETA zeolite tobe completely de-aluminated is beneficial for such processes.
1.4 Kinetic Measurement
An adsorption process includes one or more than one adsorb-ate which is fixed through physical or chemical bonds onto anadsorbent [43, 44]. This process as an efficient and environ-mentally friendly technique has attracted much attention in thewastewater treatment process [45, 46], and gas separation andpurification [47–50], to remove impurities from water or gas.In this way, it is required to develop the adsorption kinetics toevaluate the predicted adsorption parameters with experimen-tal adsorbent values. Regarding the adsorption kinetics, thereare several techniques including batch, shallow-bed or single-particle methods and zero-length column (ZLC) to determine
Chem. Eng. Technol. 2019, 42, No. 2, 327–342 ª 2019 WILEY-VCH Verlag GmbH & Co. KGaA, Weinheim www.cet-journal.com
Research Article 328

the kinetics parameters [51]. In this study, the ZLC techniquewas employed as an easy and fast experimental method forkinetics measurement. The ZLC is a differential bed of particles(adsorbents) which is primarily saturated and provides reliableresults [52].
1.5 Objectives
A series of breakthrough experiments in a fixed bed were per-formed to study the dynamics of CO2, CH4, and N2 in threetypes of commercial BETA zeolite samples, namely, H-BETA-25,H-BETA-150, and Na-BETA-25. The isotherms were collectedfrom the breakthrough data, and the evaluation of adsorptionvalues was performed by the Langmuir model to determine theadsorption parameters including equilibrium constants, heat ofadsorption, Henry’s constants, and saturation capacities.Adsorption kinetics was also studied on all BETA zeolites forCO2 adsorbate by the ZLC technique. Finally, the response sur-face methodology (RSM) was applied by using a second-orderequation to describe the behavior of the adsorption process andto investigate interactions of the main parameters.
2 Materials and Methods
2.1 Materials
All BETA zeolites were provided by the German company Sud-Chemie, currently acquired by Clariant International Ltd. Thesupplied materials were characterized by the SiO2/Al2O3 ratio(H-BETA-25, H-BETA-150) and/or compensation cations(Na-BETA-25). In addition, the utilized gases including CO2,CH4, and N2 as adsorbate and He as inert gas were supplied byAir Liquide, in the following purities: CO2 N48 (99.998 %),methane N35 (99.95 %), nitrogen N50 (99.999 %), and heliumALPHAGAZ 2 (99.9998 %). The physical properties of thesegases are reported in Tab. 1.
2.2 Zeolite BETA Samples
H-BETA-25 and H-BETA-150 were in the pellet form, withapproximately 20 % of binder, while Na-BETA-25 was in pow-der form and was transformed to the small agglomerates forfixed-bed adsorption. In this way, the powder materials werecompressed into tablets by means of an infrared tablet pressmachine (under 2 t for 5 min), then they were divided to smallagglomerates and sieved. More details about this procedure arereported in the Sect. S1 of the Supporting Information.
2.3 Physical Characterization
The characterization of adsorbents was performed by N2
adsorption and mercury porosimetry studies. The N2 adsorp-tion was carried out at 77 K on a Micrometrics ASAP 2420, todetermine the Brunauer-Emmett-Teller (BET) surface area,total area, and pore volume [53]. The N2 isotherms are pre-sented in Fig. 1. As can be observed, the adsorbents reveal type-IV isotherms with a hysteresis loop of the H4 type, based onIUPAC classification [54]. The mercury porosimetry studieswere performed on a Micromeritics AutoPore IV 9500, at apressure of 0.5–33 000 psia to determine the textural propertiesof the pellets, e.g., density and porosity. The data are summa-rized in Tab. 2, and the pore size distribution is reported inSect. S2.
Chem. Eng. Technol. 2019, 42, No. 2, 327–342 ª 2019 WILEY-VCH Verlag GmbH & Co. KGaA, Weinheim www.cet-journal.com
Table 1. Physicochemical properties of the studied adsorbates [62].
Adsorbate Kinetic diameter [Å] Dipole moment [·1018 esu cm] Quadrupole moment [·1026 esu cm2] Polarizability [·1026 cm3]
CO2 3.30 0.00 4.30 26.50
CH4 3.80 0.00 0.00 26.00
N2 3.64 0.00 1.52 17.60
Table 2. Physical properties of BETA zeolites, mercury porosim-etry data, and N2 adsorption data.
Structure type H-BETA-25 H-BETA-150 Na-BETA-25
Physical characteristics
Pellet diameter [mm] 3.17 1.59 –
Pellet length [mm] » 2 » 4 –
Diameter sieve [mm] – – 4.75a)–2.00b)
Mercury porosimetry data
Average pore diameter[Å]
242 130 –
Bulk density (at0.51 psia) [g mL–1]
0.69 1.01 –
Apparent (skeletal)density [g mL–1]
1.40 1.21 –
Porosity [%] 50.59 16.87 –
N2 adsorption data
BET surface area[m2g–1]
440.53 516.80 594.39
Total area in pores[m2g–1]
114.23 118.87 131.75
Total volume in pores[cm3g–1]
0.60 0.40 0.48
a)Agglomerates used in adsorption studies; b)agglomerates usedin ZLC studies.
Research Article 329

2.4 Breakthrough Measurements
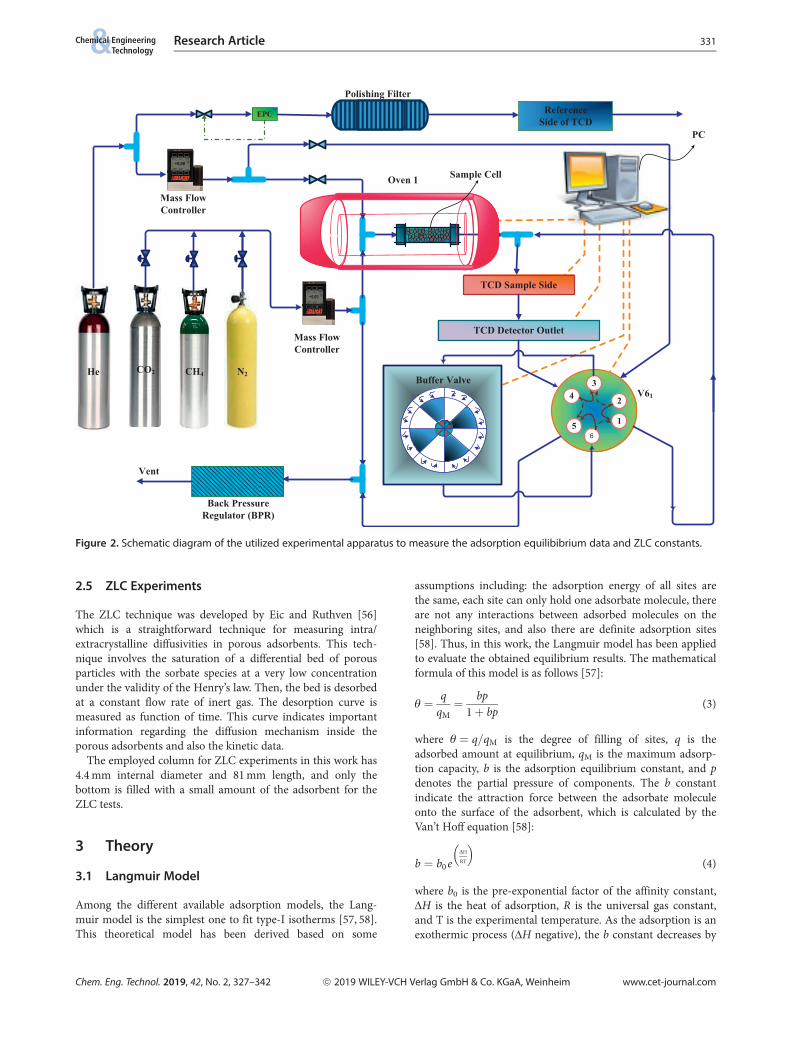
Studies on fixed-bed adsorption of CO2, CH4, and N2 were per-formed on a home-made apparatus, as presented in Fig. 2.More details can be found in a previous study [21].
The experimental unit consists of a gas chromatograph,where the adsorption column is placed in an oven equippedwith a thermal conductivity detector (TCD). Helium as the car-rier gas enters to the system by two different streams. One ismixed with the adsorbate species (CO2, CH4, or N2) to dilutethe inlet flow for the column at a fixed partial pressure, and theother one is a pure helium stream employed to desorb the fixedbed. The flow rates are set up by mass flow controllers (MFC).In addition, the pressure of the system is controlled by a back-pressure regulator (BPR). The outlet stream is sent to the TCD,which measures the concentration of all gases.
The experiments involve three main steps: activation of sam-ples, adsorption process, and analysis of data. During the firststep, the adsorbent is activated by heating the bed from ambi-ent temperature to 473 K for a period of at least 12 h, underpure helium flow, to remove the impurities and moisture insidethe porous adsorbent material. Then, in the second step, a con-stant flow rate of the mixture (carrier gas and adsorbate) isdirected by a three-way valve to the system for the measure-ment of a typical breakthrough curve at a fixed temperatureand partial pressure.
In this work, six different adsorption pressures have beentested at three temperatures for all studied samples. The outletstream of the bed passes through the TCD. The recorded datais used to set up the breakthrough curve of the experiments.Then, by applying a mass balance on the breakthrough curve,the equilibrium loading is obtained for a specific temperatureand partial pressure of adsorbates by the following equation:
Qadsorbate ¼1
madsorbentZ ts
0Fgas;in � Fgas;out� �
dt �ygas;feedPb eT Vb
ZRgTb�
ygas;feedPb Vd
ZRgTb
" #
(1)
Here, madsorbent1), ts, Fgas,in, ygas,feed, PP, and Vb are the mass
of adsorbent in the bed, saturation time of the bed, molar flowrate of adsorbate at the inlet of the bed, molar fraction ofadsorbate in the feed stream, partial pressure, and bed volume,respectively. Vd and Tb represent the dead volume and temper-ature of the bed at equilibrium condition, respectively. In addi-tion, eT is the total porosity of the bed, which is calculated bythe following equation [55]:
eT ¼ eb þ 1� ebð Þep (2)
where ep is the particle porosity and eb is the packed-bedporosity. Finally, the desorption process takes place by switch-ing the gas flow rate to the carrier gas (He) to desorb the adsor-bates (CO2, CH4, and N2) from the bed. The employed columnfor measuring the breakthrough curves had 10 mm internaldiameter and 120 mm length and was entirely filled with theadsorbent materials.
Chem. Eng. Technol. 2019, 42, No. 2, 327–342 ª 2019 WILEY-VCH Verlag GmbH & Co. KGaA, Weinheim www.cet-journal.com
Figure 1. Nitrogen isotherms of adsorption-desorption of(a) H-BETA-25, (b) H-BETA-150, (c) Na-BETA at 77 K.
–1) List of symbols at the end of the paper.
Research Article 330
2.5 ZLC Experiments
The ZLC technique was developed by Eic and Ruthven [56]which is a straightforward technique for measuring intra/extracrystalline diffusivities in porous adsorbents. This tech-nique involves the saturation of a differential bed of porousparticles with the sorbate species at a very low concentrationunder the validity of the Henry’s law. Then, the bed is desorbedat a constant flow rate of inert gas. The desorption curve ismeasured as function of time. This curve indicates importantinformation regarding the diffusion mechanism inside theporous adsorbents and also the kinetic data.
The employed column for ZLC experiments in this work has4.4 mm internal diameter and 81 mm length, and only thebottom is filled with a small amount of the adsorbent for theZLC tests.
3 Theory
3.1 Langmuir Model
Among the different available adsorption models, the Lang-muir model is the simplest one to fit type-I isotherms [57, 58].This theoretical model has been derived based on some
assumptions including: the adsorption energy of all sites arethe same, each site can only hold one adsorbate molecule, thereare not any interactions between adsorbed molecules on theneighboring sites, and also there are definite adsorption sites[58]. Thus, in this work, the Langmuir model has been appliedto evaluate the obtained equilibrium results. The mathematicalformula of this model is as follows [57]:
q ¼ qqM¼ bp
1þ bp(3)
where q ¼ q=qM is the degree of filling of sites, q is theadsorbed amount at equilibrium, qM is the maximum adsorp-tion capacity, b is the adsorption equilibrium constant, and pdenotes the partial pressure of components. The b constantindicate the attraction force between the adsorbate moleculeonto the surface of the adsorbent, which is calculated by theVan’t Hoff equation [58]:
b ¼ b0 eDH
RT
� �(4)
where b0 is the pre-exponential factor of the affinity constant,DH is the heat of adsorption, R is the universal gas constant,and T is the experimental temperature. As the adsorption is anexothermic process (DH negative), the b constant decreases by
Chem. Eng. Technol. 2019, 42, No. 2, 327–342 ª 2019 WILEY-VCH Verlag GmbH & Co. KGaA, Weinheim www.cet-journal.com
Polishing Filter
CO2He
EPC Reference Side of TCD
Mass FlowController
4
5
3
2
16
Mass FlowController
TCD Sample Side
TCD Detector Outlet
Vent
Buffer Valve
Oven 1 Sample Cell
PC
V61
Back Pressure Regulator (BPR)
CH4 N2
Figure 2. Schematic diagram of the utilized experimental apparatus to measure the adsorption equilibibrium data and ZLC constants.
Research Article 331

increasing temperature. Henry’s law can be obtained from theLangmuir isotherm at a very low partial pressure:
q ¼ qmbp ¼ Hp (5)
where H is the Henry constant.
3.2 ZLC Model
The simple form of the ZLC model after applying some as-sumptions can be presented by a linear equation in a semi-logplot [56]:
LnCout
C0
� �¼ Ln
2L
b21 þ L L� 1ð Þ
!� tdif b
21t (6)
where
b1cot b1ð Þ þ L� 1 ¼ 0 (7)
Co is the saturation concentration of the ZLC cell, Cout is theoutlet concentration of ZLC, t is the time, tdif is the diffusiontime constant, J1(b1) and J0(b1) are Bessel functions of first andzero order, and L is a model parameter.
The diffusional time constant (tdif) and the L parameterdepend on the diffusion control mechanism. For systems undermicropore diffusion control, tdif and L are represented byEqs. (8) and (9), while for macropore diffusion control, theseparameters are calculated by Eqs. (10) and (11).
tdif :micropore ¼DC
r2C
� �t (8)
Lmicroporo ¼13
FKVS
r2C
DC(9)
tdif :macroporo ¼DP
R2P 1þ Kð Þ
� �t (10)
Lmacroporo ¼13
FVS
R2P
DP(11)
where DC is the crystal diffusivity, rC is the crystal radius, Fdenotes the flow rate of purge gases, K is Henry’s law constant(dimensionless), VS is the volume of the adsorbent, Dp meansthe macropore diffusivity and Rp the pellet radius.
Macropore diffusion is generally a combination of Knudsendiffusivity in series with molecular diffusion, so it can be calcu-lated by:
DP ¼1
GP1
Dm
þ 1
DK
� � (12)
where Gp is the tortuosity, Dm is the molecular diffusivity, andDK denotes the Knudsen diffusivity, which is obtained by:
DK ¼ 9700rporoTM
� �1
2
(13)
T is the temperature and M the molecular weight.
However, if the ZLC experiments are performed in the equi-librium regime, the following equation is valid:
LnCC0
� �¼ � F
KVSt (14)
3.3 Response Surface Methodology (RSM)
RSM for statistical analysis of the adsorption process wasapplied for investigation, analysis, and verification of experi-mental results as well as determining the interaction effects ofthe main independent variables. In this process, adsorptiontemperature (T) and adsorbate partial pressure (Pcom) have themain influence on the adsorption behavior, thus, they havebeen chosen as model factors. On the other hand, the adsorp-tion capacity of adsorbents (Q) which is the objective functionof the adsorption process, has been considered as modelresponse. To this goal, a polynomial function is applied to themathematical-statistical treatment of experimental data, and byconsidering two independent variables, a second-order twoindependent polynomial function is derived as follows:
y ¼ b0 þ b1x1 þ b2x2 þ b12x1x2 þ b11x21 þ b22x2
2 þ e (15)
Here, y is the response value; x1 and x2 are the independentvariables, which are defined in the range of [0–1] as coded val-ues for model factors; b0 is the intercept coefficient, b1 and b2
represent the linear coefficients of independent variables, andb11 and b22 display the quadratic coefficients of the main fac-tors. The interaction effect between these variables is expressedby b12 and the residual error is considered in the last term e[59]. The b coefficients of Eq. (15) are calculated by applyingthe least square method and multiple regression analysis withthe lowest possible residual error and it contributes to a generalcorrelation for prognostication of other required values.
In the next step, analysis of variance (ANOVA) and lack-of-fit are applied for statistical evaluation of the model as well asassessment of the fitness of the quadratic model to detect thesignificance of the regression model for experimental results[60]. In this way, the ANOVA results determine the significantmodel for statistical analysis of the adsorption process whichshould have a non-significant lack-of-fit and acceptable p-val-ues. In the last step, the accuracy of the model is evaluated byconsidering the adjusted coefficient of determination (Adj-R2)[61].
4 Results and Discussion
4.1 Adsorption Isotherms
As previously mentioned in this work, the adsorption equilibri-um isotherms for single components, namely, CO2, CH4,andN2, were measured by a breakthrough technique. Experimentaldata were collected at different temperatures, 313 K, 373 K, and423 K, and various partial pressures in the range of0.33–4.16 bar. The experimental conditions of all performed
Chem. Eng. Technol. 2019, 42, No. 2, 327–342 ª 2019 WILEY-VCH Verlag GmbH & Co. KGaA, Weinheim www.cet-journal.com
Research Article 332
runs, including flow rates of adsorbates and helium, partialpressure of adsorbate, and total pressure of the process, whichhave been the same for all samples, are reported in Tab. 3.
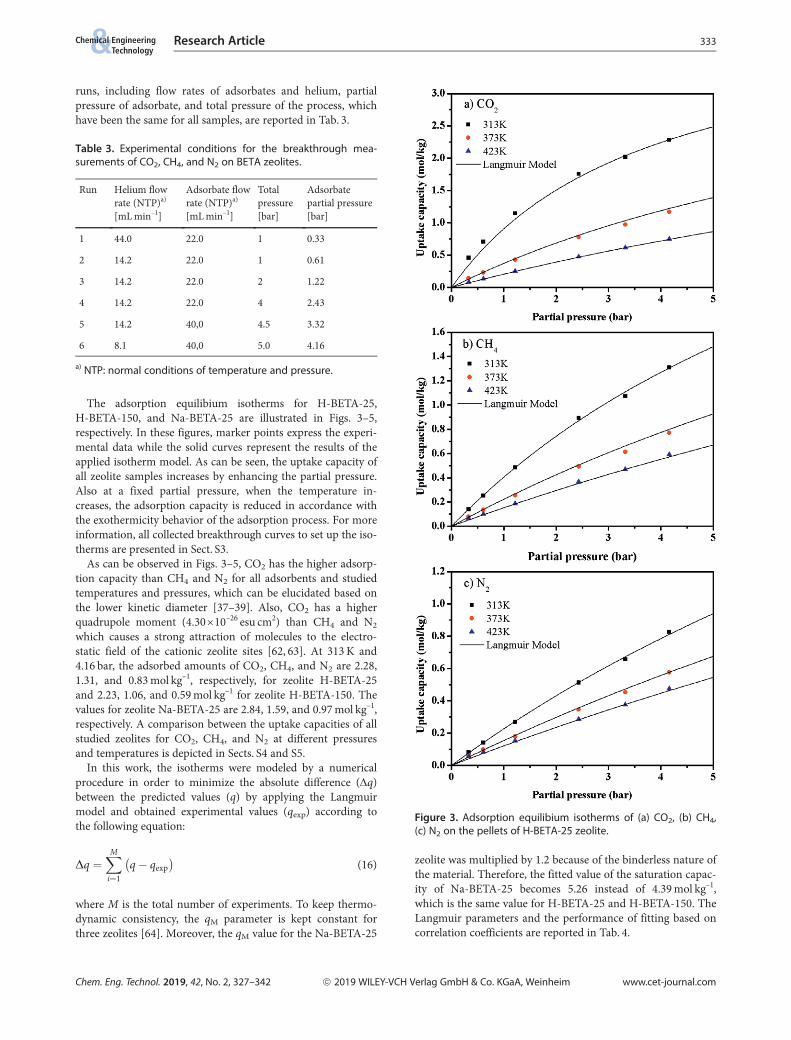
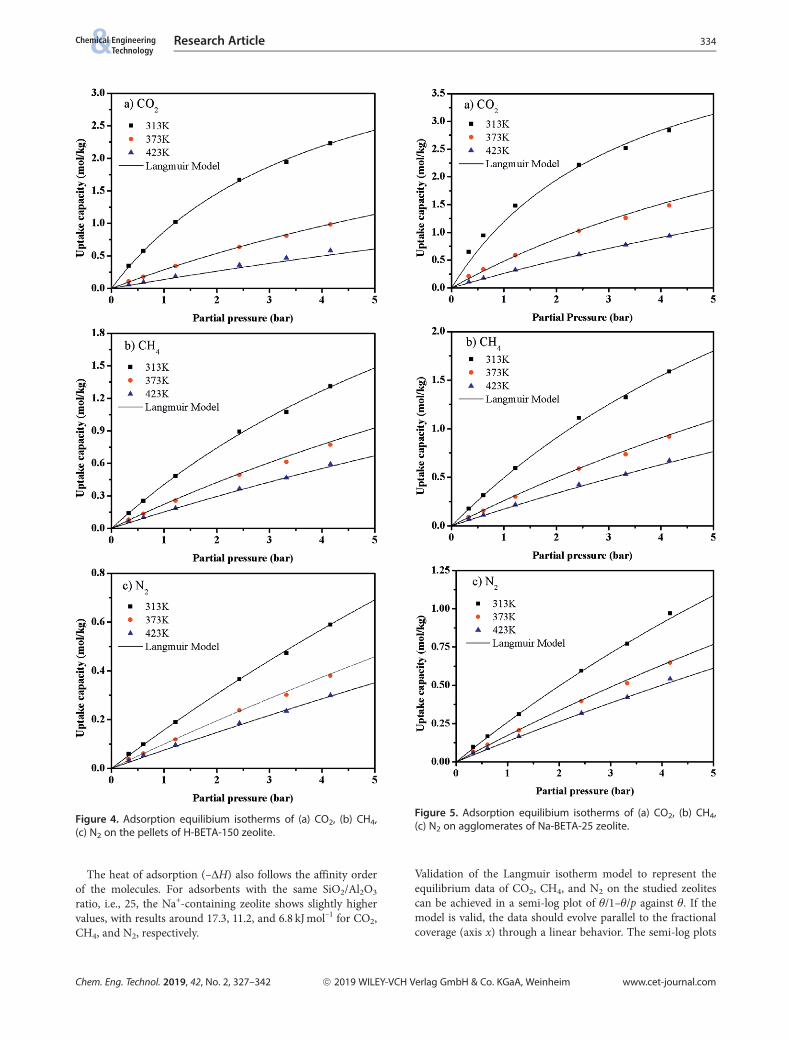
The adsorption equilibium isotherms for H-BETA-25,H-BETA-150, and Na-BETA-25 are illustrated in Figs. 3–5,respectively. In these figures, marker points express the experi-mental data while the solid curves represent the results of theapplied isotherm model. As can be seen, the uptake capacity ofall zeolite samples increases by enhancing the partial pressure.Also at a fixed partial pressure, when the temperature in-creases, the adsorption capacity is reduced in accordance withthe exothermicity behavior of the adsorption process. For moreinformation, all collected breakthrough curves to set up the iso-therms are presented in Sect. S3.
As can be observed in Figs. 3–5, CO2 has the higher adsorp-tion capacity than CH4 and N2 for all adsorbents and studiedtemperatures and pressures, which can be elucidated based onthe lower kinetic diameter [37–39]. Also, CO2 has a higherquadrupole moment (4.30 ·10–26 esu cm2) than CH4 and N2
which causes a strong attraction of molecules to the electro-static field of the cationic zeolite sites [62, 63]. At 313 K and4.16 bar, the adsorbed amounts of CO2, CH4, and N2 are 2.28,1.31, and 0.83 mol kg–1, respectively, for zeolite H-BETA-25and 2.23, 1.06, and 0.59 mol kg–1 for zeolite H-BETA-150. Thevalues for zeolite Na-BETA-25 are 2.84, 1.59, and 0.97 mol kg–1,respectively. A comparison between the uptake capacities of allstudied zeolites for CO2, CH4, and N2 at different pressuresand temperatures is depicted in Sects. S4 and S5.
In this work, the isotherms were modeled by a numericalprocedure in order to minimize the absolute difference (Dq)between the predicted values (q) by applying the Langmuirmodel and obtained experimental values (qexp) according tothe following equation:
Dq ¼XMi¼1
q� qexp� �
(16)
where M is the total number of experiments. To keep thermo-dynamic consistency, the qM parameter is kept constant forthree zeolites [64]. Moreover, the qM value for the Na-BETA-25
zeolite was multiplied by 1.2 because of the binderless nature ofthe material. Therefore, the fitted value of the saturation capac-ity of Na-BETA-25 becomes 5.26 instead of 4.39 mol kg–1,which is the same value for H-BETA-25 and H-BETA-150. TheLangmuir parameters and the performance of fitting based oncorrelation coefficients are reported in Tab. 4.
Chem. Eng. Technol. 2019, 42, No. 2, 327–342 ª 2019 WILEY-VCH Verlag GmbH & Co. KGaA, Weinheim www.cet-journal.com
Table 3. Experimental conditions for the breakthrough mea-surements of CO2, CH4, and N2 on BETA zeolites.
Run Helium flowrate (NTP)a)
[mL min–1]
Adsorbate flowrate (NTP)a)
[mL min–1]
Totalpressure[bar]
Adsorbatepartial pressure[bar]
1 44.0 22.0 1 0.33
2 14.2 22.0 1 0.61
3 14.2 22.0 2 1.22
4 14.2 22.0 4 2.43
5 14.2 40,0 4.5 3.32
6 8.1 40,0 5.0 4.16
a) NTP: normal conditions of temperature and pressure.
Figure 3. Adsorption equilibium isotherms of (a) CO2, (b) CH4,(c) N2 on the pellets of H-BETA-25 zeolite.
Research Article 333
The heat of adsorption (–DH) also follows the affinity orderof the molecules. For adsorbents with the same SiO2/Al2O3
ratio, i.e., 25, the Na+-containing zeolite shows slightly highervalues, with results around 17.3, 11.2, and 6.8 kJ mol–1 for CO2,CH4, and N2, respectively.
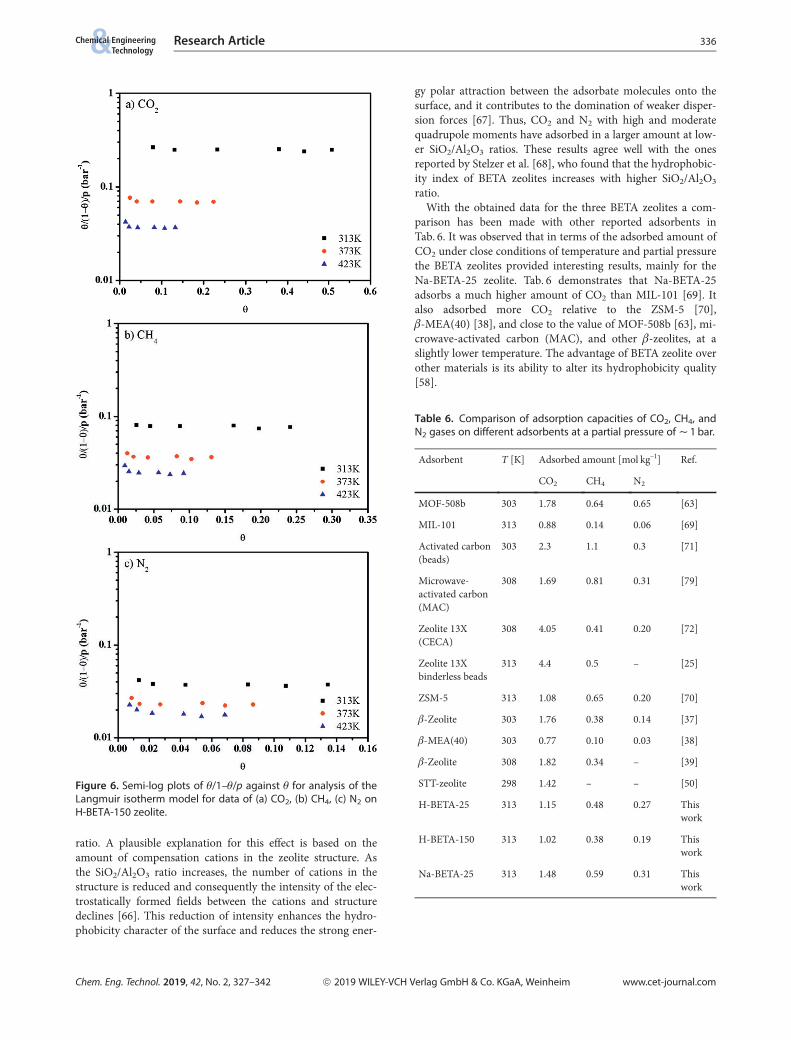
Validation of the Langmuir isotherm model to represent theequilibrium data of CO2, CH4, and N2 on the studied zeolitescan be achieved in a semi-log plot of q/1–q/p against q. If themodel is valid, the data should evolve parallel to the fractionalcoverage (axis x) through a linear behavior. The semi-log plots
Chem. Eng. Technol. 2019, 42, No. 2, 327–342 ª 2019 WILEY-VCH Verlag GmbH & Co. KGaA, Weinheim www.cet-journal.com
Figure 4. Adsorption equilibium isotherms of (a) CO2, (b) CH4,(c) N2 on the pellets of H-BETA-150 zeolite.
Figure 5. Adsorption equilibium isotherms of (a) CO2, (b) CH4,(c) N2 on agglomerates of Na-BETA-25 zeolite.
Research Article 334

of H-BETA-150 for CO2, CH4, and N2 are illustrated in Fig. 6.As can be observed, for all gases the experimental data evolvenearly in a horizontal line for the considered range of tempera-ture and partial pressure. Therefore, it can be confirmed thatthe Langmuir model is able to predict the adsorption equilibri-um of CO2, CH4, and N2 gases. Similar results for H-BETA-25and Na-BETA-25 zeolites are reported in Sect. S6.
Tab. 5 indicates the selectivity for CO2/CH4, CO2/N2, andCH4/N2. The separation factor is constant and it can be calcu-lated in terms of the sorption selectivity S as follows:
SAB
� �¼ bA
bB¼ bA
0 e�DHA
RT
� �
bB0 e
�DHB
RT
� � (17)
where A is the most adsorbed component.As can be observed in Tab. 5, the selectivity of all studied
samples has a descending order, i.e., CH4/N2 < CO2/CH4
< CO2/N2, for all three recorded temperatures. Also, theH-BETA-150 zeolite has the highest selectivity among all sam-ples at a temperature of 313 K, with values of 6.65, 3.24, and2.05. At the same temperature, the H-BETA-25 zeolite showedthe lowest selectivity values (4.79, 2.56, and 1.87). By increasingthe temperature, the selectivity values decrease and at 423 K,the selectivity for the CH4/N2 system is very low, almost closeto 1.
The cation exchange from H+ to Na+ enhances the adsorp-tion of CO2 molecules more than in the other two gases. Thehigher loading of CO2 can be explained by the strong interac-tion of CO2 and the Na+ in the framework [65]. The Na cationneutralizes the acidity of the zeolite framework by developingthe basicity on the structure, which improves the acid adsorp-tion of CO2. Thus, the Na-BETA zeolite is considered to pro-
vide two kinds of adsorption sites for the CO2 molecules: thestrong adsorption on the cationic site and the poor adsorptionon its pore wall. Regarding the other two gases, an increase inthe adsorbed amount of CH4 and N2 molecules contributes tothe polarizing power of the cation. The generated force by itselectrostatic field has a greater intensity than the obtained elec-trostatic field by the H cation.
By analyzing zeolites with the same compensation H+ cation,it was found that the parameter b and also the values ofHenry’s law are higher for the zeolite with lower SiO2/Al2O3
Chem. Eng. Technol. 2019, 42, No. 2, 327–342 ª 2019 WILEY-VCH Verlag GmbH & Co. KGaA, Weinheim www.cet-journal.com
Table 4. Parameters of the Langmuir model for the adsorption isotherms on BETA zeolites.
H-BETA-25 H-BETA-150 Na-BETA-25
CO2 CH4 N2 CO2 CH4 N2 CO2 CH4 N2
qmax [mol kg–1] 4.39 4.39 4.39 4.39 4.39 4.39 5.26 5.26 5.26
–DH [kJ mol–1] 16.76 10.41 6.55 20.53 11.77 7.63 17.31 11.21 6.84
b0 [bar–1] 4.17 ·10–4 1.86 ·10–3 4.39 ·10–3 9.34 ·10–5 8.32 ·10–4 1.97 ·10–3 3.80 ·10–4 1.40 ·10–3 3.77 ·10–3
Temperature 313 K
b [bar–1] 0.2606 0.1017 0.0544 0.2482 0.0765 0.0373 0.2928 0.1039 0.0520
H [mol kg–1bar–1] 1.145 0.447 0.239 1.090 0.336 0.164 1.542 0.547 0.274
Temperature 373 K
b [bar–1] 0.0925 0.0534 0.0363 0.0698 0.0370 0.0233 0.1006 0.0520 0.0341
H [mol kg–1bar–1] 0.407 0.235 0.159 0.307 0.163 0.102 0.529 0.274 0.180
Temperature 423 K
b [bar–1] 0.0489 0.0359 0.0283 0.0320 0.0236 0.0174 0.0520 0.0339 0.0263
H [mol kg–1bar–1] 0.215 0.158 0.124 0.140 0.104 0.076 0.274 0.179 0.138
SDq [mol kg–1] 0.606 0.235 0.139 0.326 0.153 0.088 0.880 0.244 0.160
Table 5. Selectivity of gases in the BETA zeolites.
Solids temperature[K]
Selectivity
CO2/CH4 CO2/N2 CH4/N2
H-BETA-25
313 2.56 4.79 1.87
373 1.73 2.55 1.47
423 1.36 1.73 1.27
H-BETA-150
313 3.24 6.65 2.05
373 1.89 3.00 1.59
423 1.35 1.84 1.36
Na-BETA-25
313 2.82 5.63 2.00
373 1.93 2.95 1.52
423 1.53 1.98 1.29
Research Article 335
ratio. A plausible explanation for this effect is based on theamount of compensation cations in the zeolite structure. Asthe SiO2/Al2O3 ratio increases, the number of cations in thestructure is reduced and consequently the intensity of the elec-trostatically formed fields between the cations and structuredeclines [66]. This reduction of intensity enhances the hydro-phobicity character of the surface and reduces the strong ener-
gy polar attraction between the adsorbate molecules onto thesurface, and it contributes to the domination of weaker disper-sion forces [67]. Thus, CO2 and N2 with high and moderatequadrupole moments have adsorbed in a larger amount at low-er SiO2/Al2O3 ratios. These results agree well with the onesreported by Stelzer et al. [68], who found that the hydrophobic-ity index of BETA zeolites increases with higher SiO2/Al2O3
ratio.With the obtained data for the three BETA zeolites a com-
parison has been made with other reported adsorbents inTab. 6. It was observed that in terms of the adsorbed amount ofCO2 under close conditions of temperature and partial pressurethe BETA zeolites provided interesting results, mainly for theNa-BETA-25 zeolite. Tab. 6 demonstrates that Na-BETA-25adsorbs a much higher amount of CO2 than MIL-101 [69]. Italso adsorbed more CO2 relative to the ZSM-5 [70],b-MEA(40) [38], and close to the value of MOF-508b [63], mi-crowave-activated carbon (MAC), and other b-zeolites, at aslightly lower temperature. The advantage of BETA zeolite overother materials is its ability to alter its hydrophobicity quality[58].
Chem. Eng. Technol. 2019, 42, No. 2, 327–342 ª 2019 WILEY-VCH Verlag GmbH & Co. KGaA, Weinheim www.cet-journal.com
Figure 6. Semi-log plots of q/1–q/p against q for analysis of theLangmuir isotherm model for data of (a) CO2, (b) CH4, (c) N2 onH-BETA-150 zeolite.
Table 6. Comparison of adsorption capacities of CO2, CH4, andN2 gases on different adsorbents at a partial pressure of ~ 1 bar.
Adsorbent T [K] Adsorbed amount [mol kg–1] Ref.
CO2 CH4 N2
MOF-508b 303 1.78 0.64 0.65 [63]
MIL-101 313 0.88 0.14 0.06 [69]
Activated carbon(beads)
303 2.3 1.1 0.3 [71]
Microwave-activated carbon(MAC)
308 1.69 0.81 0.31 [79]
Zeolite 13X(CECA)
308 4.05 0.41 0.20 [72]
Zeolite 13Xbinderless beads
313 4.4 0.5 – [25]
ZSM-5 313 1.08 0.65 0.20 [70]
b-Zeolite 303 1.76 0.38 0.14 [37]
b-MEA(40) 303 0.77 0.10 0.03 [38]
b-Zeolite 308 1.82 0.34 – [39]
STT-zeolite 298 1.42 – – [50]
H-BETA-25 313 1.15 0.48 0.27 Thiswork
H-BETA-150 313 1.02 0.38 0.19 Thiswork
Na-BETA-25 313 1.48 0.59 0.31 Thiswork
Research Article 336

4.2 Kinetics of Adsorption
The ZLC studies were performed for CO2 adsorption for allthree zeolites, and before preliminary calculations can be maderegarding the diffusion mechanism of CO2 in the BETA zeolite.As the BETA zeolite is considered a large-pore zeolite, it wasassumed initially that the mass transfer resistance occursmainly in the macropores; thus, the performed desorption timeof the ZLC experiment in pellets [51], can be estimated by:
t ¼ 7 · 10�2 RP 1þ Kð ÞDP
(18)
where K is the dimensionless Henry’s law constant, which isdefined as:
K ¼ rP
eP
� �H ¼ rP
eP
� �qMbRT (19)
The expected time of the ZLC experiment for the H-BETA-150 zeolite was obtained as around 9 s. In this way, the physicalproperties of the pellet (Tab. 2) and the adsorption equilibriumparameters (given in Tab. 4) were considered. Also, a value of0.643 cm2s–1 based on Marrero and Mason [73] for the molecu-lar diffusivity of CO2-He at 313 K as well as a value of 2 for tor-tuosity were assumed. For the H-BETA-150 zeolite, theexpected time of the ZLC experiment decreased to approxi-mately 5 s. These results proved that the expected time of ZLCexperiments is very short and makes it difficult to obtain thekinetic information from the ZLC desorption curves.
Tab. 7 summarizes the ZLC experimental conditions includ-ing CO2 saturation partial pressure, temperature, and purgeflow rates with He. Before the experiments, blank runs wereperformed at flow rates of 30 and 50 mL min–1. The resultssignified that the cleaning of the ZLC cell occurs very fast.
Fig. 7 a shows the desorption curves for flow rates of 30 and50 mL min–1 on H-BETA-25. The results for H-BETA-150 andNa-BETA-25 have been reported in Sect. 7. The results for Itcan be seen from the semi-log plots that the desorption curvesare straight lines passing through the horizontal axis, indicatingthat experiments were performed in an equilibrium regime.Another observed feature in ZLC experiments is the existenceof a proportionality between the slope of the desorption curvesand value of the purge flow rate. This proportionality isobtained by multiplying the time values of each curve and therespective purge flow rate F; thus, if the curves have an overlapon the semi-log plot, it is a clear indicator for equilibriumregime. This behavior can be observed in Figs. 7 b, S16 b, andS17 b. These results illustrate that the ZLC data is independent
fromDC=r2C or DP=R2
P 1þ Kð Þ, and it is not feasible to obtainany kinetic information from the desorption curves. This alsomeans that the contact time of gas, inside the column (F=KVS)is much smaller than the diffusional time constant(DP=R2
P 1þ Kð Þ) [51].When the ZLC experiments are in the equilibrium regime,
the system is governed by Eq. (14), and the dimensionlessHenry’s law constant K can be estimated. Then, by using the Kvalues, the ratio of rP=eP is calculated by Eq. (19). The esti-mated values of the experimental slope, dimensionless Henry’sconstants K, and rP=eP ratios are reported in Tab. 8, for allsamples. As can be observed, the H-BETA-25 zeolite has thelowest slope compared to the other zeolites with an absolutevalue of 0.1013 and, consequently, it has the highest Henry’sconstant with 416.72.
To determine the rP=eP relation, according to the physicalproperties presented in Tab. 2 the value of 5.98 is obtained forthe H-BETA-150 zeolite, which is about half of the determinedvalue by the ZLC technique. Some explanations can be givenfor this anomalous behavior, based on the physical propertiesof materials. The obtained values for Henry’s constant are reli-
Chem. Eng. Technol. 2019, 42, No. 2, 327–342 ª 2019 WILEY-VCH Verlag GmbH & Co. KGaA, Weinheim www.cet-journal.com
Figure 7. ZLC desorption curves of CO2 at 313 K on the pelletsof H-BETA-25 zeolite. (a) Semi-log plots of C=C0 vs. time t, (b)semi-log plots of C=C0 vs. time ·Ft.
Table 7. ZLC experimental conditions.
Pressure of the system [bar] 1.00
Partial pressure CO2 [bar] 0.03
Temperature [K] 313
Purge flow rates (NTP) [mL min–1] 30, 50
Research Article 337
able if there are no errors in the purge flow, also consideringthat the Langmuir model is fitted well in the experimental mea-sured isotherms. Thus, it can be considered that the obtaineddifference for the rP=eP ratio is related to the values of rp andep which have been determined by the mercury porosimetrytechnique, or due to the margin of error. However, if the poros-imetry values are correct, these results indicate that the mea-sured Henry’s constant by the ZLC technique differs by abouthalf of the measured value with the obtained adsorption equi-librium from breakthrough curves.
4.3 RSM Analysis
4.3.1 Adsorption Analysis by RSM
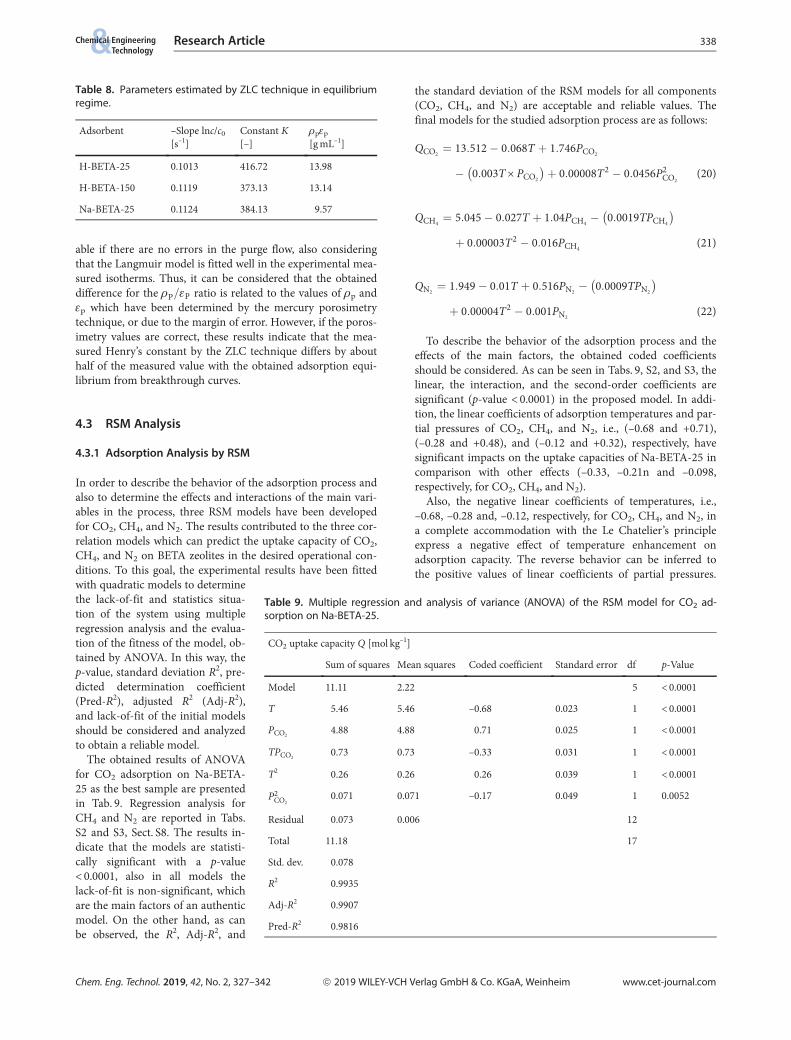
In order to describe the behavior of the adsorption process andalso to determine the effects and interactions of the main vari-ables in the process, three RSM models have been developedfor CO2, CH4, and N2. The results contributed to the three cor-relation models which can predict the uptake capacity of CO2,CH4, and N2 on BETA zeolites in the desired operational con-ditions. To this goal, the experimental results have been fittedwith quadratic models to determinethe lack-of-fit and statistics situa-tion of the system using multipleregression analysis and the evalua-tion of the fitness of the model, ob-tained by ANOVA. In this way, thep-value, standard deviation R2, pre-dicted determination coefficient(Pred-R2), adjusted R2 (Adj-R2),and lack-of-fit of the initial modelsshould be considered and analyzedto obtain a reliable model.
The obtained results of ANOVAfor CO2 adsorption on Na-BETA-25 as the best sample are presentedin Tab. 9. Regression analysis forCH4 and N2 are reported in Tabs.S2 and S3, Sect. S8. The results in-dicate that the models are statisti-cally significant with a p-value< 0.0001, also in all models thelack-of-fit is non-significant, whichare the main factors of an authenticmodel. On the other hand, as canbe observed, the R2, Adj-R2, and
the standard deviation of the RSM models for all components(CO2, CH4, and N2) are acceptable and reliable values. Thefinal models for the studied adsorption process are as follows:
QCO2¼ 13:512� 0:068T þ 1:746PCO2
� 0:003T · PCO2
� �þ 0:00008T2 � 0:0456P2
CO2(20)
QCH4¼ 5:045� 0:027T þ 1:04PCH4
� 0:0019TPCH4
� �þ 0:00003T2 � 0:016PCH4
(21)
QN2¼ 1:949� 0:01T þ 0:516PN2
� 0:0009TPN2
� �þ 0:00004T2 � 0:001PN2
(22)
To describe the behavior of the adsorption process and theeffects of the main factors, the obtained coded coefficientsshould be considered. As can be seen in Tabs. 9, S2, and S3, thelinear, the interaction, and the second-order coefficients aresignificant (p-value < 0.0001) in the proposed model. In addi-tion, the linear coefficients of adsorption temperatures and par-tial pressures of CO2, CH4, and N2, i.e., (–0.68 and +0.71),(–0.28 and +0.48), and (–0.12 and +0.32), respectively, havesignificant impacts on the uptake capacities of Na-BETA-25 incomparison with other effects (–0.33, –0.21n and –0.098,respectively, for CO2, CH4, and N2).
Also, the negative linear coefficients of temperatures, i.e.,–0.68, –0.28 and, –0.12, respectively, for CO2, CH4, and N2, ina complete accommodation with the Le Chatelier’s principleexpress a negative effect of temperature enhancement onadsorption capacity. The reverse behavior can be inferred tothe positive values of linear coefficients of partial pressures.
Chem. Eng. Technol. 2019, 42, No. 2, 327–342 ª 2019 WILEY-VCH Verlag GmbH & Co. KGaA, Weinheim www.cet-journal.com
Table 8. Parameters estimated by ZLC technique in equilibriumregime.
Adsorbent –Slope lnc/c0
[s–1]Constant K[–]
rpep
[g mL–1]
H-BETA-25 0.1013 416.72 13.98
H-BETA-150 0.1119 373.13 13.14
Na-BETA-25 0.1124 384.13 9.57
Table 9. Multiple regression and analysis of variance (ANOVA) of the RSM model for CO2 ad-sorption on Na-BETA-25.
CO2 uptake capacity Q [mol kg–1]
Sum of squares Mean squares Coded coefficient Standard error df p-Value
Model 11.11 2.22 5 < 0.0001
T 5.46 5.46 –0.68 0.023 1 < 0.0001
PCO24.88 4.88 0.71 0.025 1 < 0.0001
TPCO20.73 0.73 –0.33 0.031 1 < 0.0001
T2 0.26 0.26 0.26 0.039 1 < 0.0001
P2CO2
0.071 0.071 –0.17 0.049 1 0.0052
Residual 0.073 0.006 12
Total 11.18 17
Std. dev. 0.078
R2 0.9935
Adj-R2 0.9907
Pred-R2 0.9816
Research Article 338

Based on the values of the interaction coefficients (–0.33, –0.21,and –0.098, respectively, for CO2, CH4, and N2), it can bederived that the pressure increment has a lower effect on theuptake capacity of the process at higher temperatures. Theresults are listed in Tab. S1. To have a better understanding ofthe process behavior, 3D plots of the system are depicted inFig. 8, based on the main factors and response surface for CO2,CH4, and N2 adsorption on Na-BETA-25.
As can be expected, the enhancement of partial pressure andthe reduction of the temperature process increased the uptakecapacity of adsorbents, which agrees well with Le Chatelier’sprinciple.
4.3.2 Analysis of the Integrated System by RSM
In the next step, the RSM ability to predict the uptake capacityof zeolites BETA zeolites was considered as an integrated sys-tem. In recent years, several studies about intelligent modelslike artificial neural network (ANN), adaptive neuro fuzzyinference system (ANFIS), and support vector machine (SVM)to predict CO2 adsorption on activated carbons and amine-solutions were conducted [74–78]. To the best of our knowl-edge, no study has been published about single-componentadsorption by zeolites.
In a similar trend with the previous section, adsorption tem-peratures and partial pressures of the process were consideredas independent variables of the systems (input factors). Theuptake capacities of all studied zeolites (H-BETA-25, Na-BETA-25, and H-BETA-150) were determined as a responsesurface. Then, by using multiple regression analysis and theevaluation of the fitness of the model to a quadratic polyno-mial, ANOVA was obtained. The results for CO2 adsorptionare reported in Tab. 10 whereas those for CH4 and N2 areexpressed in Tabs. S4 and S5 in Sect. 8.
As can be found, the proposed RSM model has acceptablevalues for R2, Adj-R2, Pred-R2, and standard deviation, i.e.,0.942, 0.936, 0.924, and 0.18, respectively. In addition, theobtained model is significant while the lack-of-fit is non-signif-
Chem. Eng. Technol. 2019, 42, No. 2, 327–342 ª 2019 WILEY-VCH Verlag GmbH & Co. KGaA, Weinheim www.cet-journal.com
Table 10. Analysis of variance (ANOVA) of the proposed modelfor CO2 capture on the studied zeolites as an integrated system.
CO2 capture capacity Q [mol kg–1]
Sum ofsquares
Meansquares
Codedcoefficient
Standarderror
df p-Value
Model 25.09 5.02 5 <0.0001
T 12.17 12.17 –0.59 0.030 1 <0.0001
PCO210.93 10.93 0.62 0.033 1 <0.0001
TPCO22.01 2.01 –0.32 0.040 1 <0.0001
T2 0.69 0.69 0.24 0.052 1 <0.0001
P2CO2
0.14 0.14 –0.14 0.065 1 0.0417
Residual 1.53 0.032 48
Pure er-ror
1.34 0.037
Std. dev. 0.18
R2 0.9424
Adj-R2 0.9364
Pred-R2 0.9247
a)
b)
c)
Figure 8. Response surface plots for (a) CO2, (b) CH4, (c) N2 ad-sorption capacity (mol kg–1) as a function of the independentvariables Pp and T.
Research Article 339
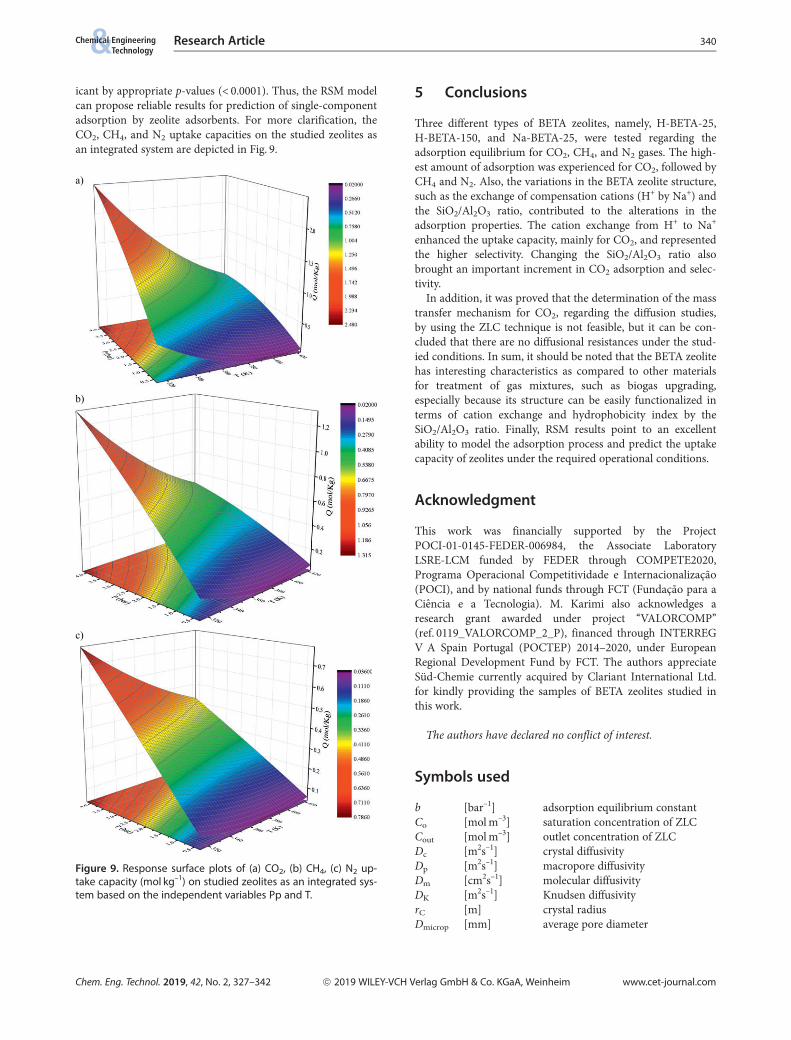
icant by appropriate p-values (< 0.0001). Thus, the RSM modelcan propose reliable results for prediction of single-componentadsorption by zeolite adsorbents. For more clarification, theCO2, CH4, and N2 uptake capacities on the studied zeolites asan integrated system are depicted in Fig. 9.
5 Conclusions
Three different types of BETA zeolites, namely, H-BETA-25,H-BETA-150, and Na-BETA-25, were tested regarding theadsorption equilibrium for CO2, CH4, and N2 gases. The high-est amount of adsorption was experienced for CO2, followed byCH4 and N2. Also, the variations in the BETA zeolite structure,such as the exchange of compensation cations (H+ by Na+) andthe SiO2/Al2O3 ratio, contributed to the alterations in theadsorption properties. The cation exchange from H+ to Na+
enhanced the uptake capacity, mainly for CO2, and representedthe higher selectivity. Changing the SiO2/Al2O3 ratio alsobrought an important increment in CO2 adsorption and selec-tivity.
In addition, it was proved that the determination of the masstransfer mechanism for CO2, regarding the diffusion studies,by using the ZLC technique is not feasible, but it can be con-cluded that there are no diffusional resistances under the stud-ied conditions. In sum, it should be noted that the BETA zeolitehas interesting characteristics as compared to other materialsfor treatment of gas mixtures, such as biogas upgrading,especially because its structure can be easily functionalized interms of cation exchange and hydrophobicity index by theSiO2/Al2O3 ratio. Finally, RSM results point to an excellentability to model the adsorption process and predict the uptakecapacity of zeolites under the required operational conditions.
Acknowledgment
This work was financially supported by the ProjectPOCI-01-0145-FEDER-006984, the Associate LaboratoryLSRE-LCM funded by FEDER through COMPETE2020,Programa Operacional Competitividade e Internacionalizaçao(POCI), and by national funds through FCT (Fundaçao para aCiencia e a Tecnologia). M. Karimi also acknowledges aresearch grant awarded under project ‘‘VALORCOMP’’(ref. 0119_VALORCOMP_2_P), financed through INTERREGV A Spain Portugal (POCTEP) 2014–2020, under EuropeanRegional Development Fund by FCT. The authors appreciateSud-Chemie currently acquired by Clariant International Ltd.for kindly providing the samples of BETA zeolites studied inthis work.
The authors have declared no conflict of interest.
Symbols used
b [bar–1] adsorption equilibrium constantCo [mol m–3] saturation concentration of ZLCCout [mol m–3] outlet concentration of ZLCDc [m2s–1] crystal diffusivityDp [m2s–1] macropore diffusivityDm [cm2s–1] molecular diffusivityDK [m2s–1] Knudsen diffusivityrC [m] crystal radiusDmicrop [mm] average pore diameter
Chem. Eng. Technol. 2019, 42, No. 2, 327–342 ª 2019 WILEY-VCH Verlag GmbH & Co. KGaA, Weinheim www.cet-journal.com
a)
b)
c)
Figure 9. Response surface plots of (a) CO2, (b) CH4, (c) N2 up-take capacity (mol kg–1) on studied zeolites as an integrated sys-tem based on the independent variables Pp and T.
Research Article 340
F [mL min–1] flow rate of purge gasesFgas,in [mL min–1] molar flow rate of adsorbate at the
bed inletFgas,out [mL min–1] molar flow rate of adsorbate at the
bed outletH [mol kg–1bar–1] Henry’s constantDH [kJ mol–1] heat of adsorptionK [–] Henry’s law constantM [g mmol–1] molecular weightmadsorbent [g] mass of adsorbent in the bedP [bar] partial pressure of componentPb [bar] pressure of bed at equilibriumPCH4 [bar] partial pressure of methanePCO2 [bar] partial pressure of carbon dioxidePP [bar] partial pressurePN2 [bar] partial pressure of nitrogenq [mol kg–1] adsorption capacity at equilibrium
conditionqM [mol kg–1] maximum adsorption capacityR2 [–] regression coefficientRP [cm] pellet radiusSBET [m2g–1] specific surface areaSext [m2g–1] external surface areaSmicrop [m2g–1] microporous surface areatb [min] breakthrough timets [min] saturation timeTb [K] temperature of bed at equilibriumVb [cm3] bed volumeVd [cm3] dead volumeVmicrop [mm3g–1] micropore volumeVS [m3] volume of adsorbentVTotal [mm3] total pore volumeWmic [nm] width of microporeygas,feed [–] molar fraction of adsorbate in feed
streamZ [–] gas (adsorbate) compressibility
factor at Pb and Tb
Greek letters
a [–] sticking coefficiente [–] residual erroreb [–] packed bed porosityep [–] particle porosityeT [–] total porosity of bedtdif [–] diffusion time constantGp [–] tortuosity
Subscripts and superscripts
Ads. adsorbentmin minuteTot total
Abbreviations
ANFIS adaptive neuro fuzzy inference systemANN artificial neural networkANOVA analysis of varianceRSM response surface methodology
SVM support vector machineZLC zero-length column
References
[1] P. Taylor, Energy Technology Perspectives 2010 – Scenariosand Strategies to 2050 74, International Energy Agency, Paris2010.
[2] P. Nugent, Y. Belmabkhout, S. D. Burd, A. J. Cairns,R. Luebke, K. Forrest, T. Pham, S. Ma, B. Space, L. Wojtas,M. Eddaoudi, M. J. Zaworotko, Nature 2013, 495, 80–84.
[3] M. Karimi, M. R. Rahimpour, R. Rafiei, M. Jafari, D. Iran-shahi, A. Shariati, J. Nat. Gas Sci. Eng. 2014, 17, 136–150.
[4] A. Khakpay, F. Rahmani, S. Nouranian, P. Scovazzo, J. Phys.Chem. C 2017, 121, 12308–12320.
[5] M. Karimi, J. A. C. Silva, C. Gonçalves, J. L. Diaz de Tuesta,A. E. Rodrigues, H. T. Gomes, Ind. Eng. Chem. Res. 2018, 57,11154–11166.
[6] T. Remy, E. Gobechiya, D. Danaci, S. A. Peter, P. Xiao,L. Van Tendeloo, S. Couck, J. Shang, C. E. A. Kirschhock,R. K. Singh, J. A. Martens, G. V. Baron, P. A. Webley, J. F. M.Denayer, RSC Adv. 2014, 4, 62511–62524.
[7] M. Ravina, G. J. Genon, Cleaner Prod. 2015, 102, 115–126.[8] C. A. Grande, A. E. Rodrigues, Ind. Eng. Chem. Res. 2007,
46, 7844–7848.[9] M. Karimi, M. R. Rahimpour, D. Iranshahi, Chem. Eng.
Technol. 2018, 41, 1–14.[10] J. P. Gutierrez, E. L. A. Ruiz, E. Erdmann, J. Nat. Gas Sci.
Eng. 2017, 38, 187–194.[11] J. Pires, V. K. Saini, M. L. Pinto, Environ. Sci. Technol. 2008,
42, 8727–8732.[12] M. P. S. Santos, C. A. Grande, A. E. Rodrigues, Ind. Eng.
Chem. Res. 2011, 50, 974–985.[13] M. P. S. Santos, C. A. Grande, A. E. Rodrigues, Ind. Eng.
Chem. Res. 2013, 52, 5445–5454.[14] D. Georgiou, P. D. Petrolekas, S. Hatzixanthis, A. Aivasidis,
J. Hazard. Mater. 2007, 144, 369–376.[15] P. H. M. Feron, A. E. Jansen, R. Klaassen, Energy Convers.
Manage. 1992, 33, 421–428.[16] M. J. Cogbill, G. P. Marsh, Energy Convers. Manage. 1992,
33, 487–494.[17] C. Song, Catal. Today 2006, 115, 2–32.[18] R. Ben-Mansour, M. A. Habib, O. E. Bamidele, M. Basha,
N. A. A. Qasem, A. Peedikakkal, T. Laoui, M. Ali, Appl.Energy 2016, 161, 225–255.
[19] T. Chronopoulos, Y. Fernandez-Diez, M. M. Maroto-Valer,R. Ocone, D. A. Reay, Microporous Mesoporous Mater. 2014,197, 288–290.
[20] Y. Lin, C. Kong, Q. Zhang, L. Chen, Adv. Energy Mater.2017, 7, 1601296.
[21] L. Bastin, P. S. Barcia, E. J. Hurtado, J. A. C. Silva, A. E. Ro-drigues, B. J. Chen, Phys. Chem. C 2008, 112, 1575–1581.
[22] R. Sabouni, H. Kazemian, S. Rohani, Chem. Eng. Technol.2012, 35, 1085–1092.
[23] R. Sabouni, H. Kazemian, S. Rohani, Environ. Sci. Technol.2013, 47, 9372–9380.
[24] J. A. C. Silva, A. F. Cunha, K. Schumann, A. E. Rodrigues,Microporous Mesoporous Mater. 2014, 187, 100–107.
Chem. Eng. Technol. 2019, 42, No. 2, 327–342 ª 2019 WILEY-VCH Verlag GmbH & Co. KGaA, Weinheim www.cet-journal.com
Research Article 341

[25] J. A. C. Silva, K. Schumann, A. E. Rodrigues, MicroporousMesoporous Mater. 2012, 158, 219–228.
[26] E. Ochoa-Fernandez, M. Ronning, T. Grande, D. Chen,Chem. Mater. 2006, 18, 1383–1385.
[27] S. N. Kim, W. J. Son, J. S. Choi, W. S. Ahn, MicroporousMesoporous Mater. 2008, 115, 497–503.
[28] Introduction to Zeolite Molecular Sieves, 3rd ed. (Eds: J. Cej-ka, H. van Bekkum, A. Corma, F. Schueth), Elsevier, Oxford2007.
[29] B. Smit, T. L. M. Maesen, Chem. Rev. 2008, 108, 4125–4184.[30] S. Choi, J. H. Drese, C. W. Jones, ChemSusChem 2009, 2,
796–854.[31] International Zeolite Association, Database of Zeolite Struc-
tures, http://www.iza-structure.org/databases/[32] R. L. Wadlinger, G. T. Kerr, E. J. Rosinski, U.S. Patent
3308069, 1967.[33] M. M. J. Treacy, J. M. Newsam, Nature 1988, 332, 249–251.[34] A. Corma, L. T. Nemeth, M. Renz, S. Valencia, Nature 2001,
412, 423–425.[35] J. D. Lewis, S. van de Vyver, A. J. Crisci, W. R. Gunther, V. K.
Michaelis, R. G. Griffin, Y. Roman-Leshkov, ChemSusChem2014, 7, 2255–2265.
[36] C. Martinez, A. Corma, Coord. Chem. Rev. 2011, 255,1558–1580.
[37] X. Xu, X. Zhao, L. Sun, X. Liu, J. Nat. Gas Chem. 2008, 17,391–396.
[38] X. Xu, X. Zhao, L. Sun, X. Liu, J. Nat. Gas Chem. 2009, 18,167–172.
[39] Z. Huang, L. Xu, J. H. Li, G. M. Guo, Y. Wang, J. Chem. Eng.Data 2010, 55, 2123–2127.
[40] J. Stelzer, M. Paulus, M. Hunger, J. Weitkamp, MicroporousMesoporous Mater. 1998, 22, 1–8.
[41] S. T. Yang, J. Kim, W. S. Ahn, Microporous MesoporousMater. 2010, 135, 90–94.
[42] H. S. You, H. Jin, Y. H. Mo, S. E. Park, Mater. Lett. 2013, 108,106–109.
[43] L. Largitte, R. Pasquier, Chem. Eng. Res. Des. 2016, 109,495–504.
[44] S. Ghanbari, B. Vaferi, Mater. Sci Poland 2017, 35, 486–495.[45] S. Ghanbari, B. Vaferi, Acta Astronaut. 2015, 112, 19–28.[46] S. G. Pakdehi, B. Vaferi, Desalin. Water Treat. 2016, 57,
18286–18292.[47] H. Maghsoudi, Adsorption 2015, 21, 547–556.[48] F. Karamouz, H. Maghsoudi, R. Yegani, Chem. Eng. Technol.
2018, 41, 1767–1775.[49] M. J. Vaezi, A. A. Babaluo, H. Maghsoudi, J. Nat. Gas Sci.
Eng. 2018, 52, 423–431.[50] H. Maghsoudi, A. Aidani, Adsorption 2017, 23, 963–969.[51] J. A. C. Silva, A. E. Rodrigues, Chem. Eng. Technol. 2015, 38,
2335–2339.[52] Diffusion in Nanoporous Materials (Eds: J. Kaerger, D. M.
Ruthven, D. Theodorou), John Wiley & Sons, New York2012.
[53] S. Brunauer, P. H. Emmett, E. Teller, J. Am. Chem. Soc. 1938,60, 309–319.
[54] M. Thommes, K. Kaneko, A. V. Neimark, J. P. Olivier,F. Rodriguez-Reinoso, J. Rouquerol, K. S. W. Sing, Pure Appl.Chem. 2015, 87, 1051–1069.
[55] J. M. Becnel, C. E. Holland, J. McIntyre, M. A. Matthews,J. A. Ritter, American Society for Engineering Education An-nual Conference & Exposition, Montreal, Quebec, Canada,2002.
[56] M. Eic, D. M. Ruthven, Zeolites 1988, 8, 40–45.[57] I. Langmuir, J. Am. Chem. Soc. 1916, 38, 2221–2295.[58] D. M. Ruthven, Principles of Adsorption and Adsorption
Processes, John Wiley & Sons, New York 1984.[59] A. Wahby, J. Ramos-Fernandez, M. Martinez-Escandell,
A. Sepulveda-Escribano, J. Silvestre-Albero, F. Rodriguez-Reinoso, ChemSusChem 2010, 3, 974–981.
[60] S. Garcıa, M. V. Gil, J. J. Pis, F. Rubiera, C. Pevida, Int.J. Greenhouse Gas Control 2013, 12, 35–43.
[61] D. Bas, I. H. Boyaci, J. Food Eng. 2007, 78, 836–845.[62] T. C. Golden, S. Sircar, J. Colloid Interface Sci. 1994, 162,
182–188.[63] P. S. Barcia, L. Bastin, E. J. Hurtado, J. A. C. Silva, A. E. Ro-
drigues, B. L. Chen, Sep. Sci. Technol. 2008, 43, 3494–3521.[64] R. T. Yang, Gas Separation by Adsorption Processes, Butter-
worth, Boston 1987.[65] S. K. Wirawan, D. Creaser, Microporous Mesoporous Mater.
2006, 91, 196–205.[66] T. Kawai, K. Tsutsumi, Colloid Polym. Sci. 1992, 270,
711–715.[67] M. Sakuth, J. Meyer, J. Gmehling, Chem. Eng. Process. 1998,
37, 267–277.[68] J. Stelzer, M. Paulus, M. Hunger, J. Weitkamp, Microporous
Mesoporous Mater. 1998, 22, 1–8.[69] Y. Zhang, W. Su, Y. Sun, J. Liu, X. Liu, X. Wang, J. Chem.
Eng. Data 2015, 60, 2951–2957.[70] P. J. E. Harlick, F. H. Tezel, Sep. Purif. Technol. 2003, 33,
199–210.[71] Y. J. Wu, Y. Yang, X. M. Kong, P. Li, J. G. Yu, A. M. Ribeiro,
A. E. Rodrigues, J. Chem. Eng. Data 2015, 60, 2684–2693.[72] S. Cavenati, C. A. Grande, A. E. Rodrigues, J. Chem. Eng.
Data 2004, 49, 1095–1101.[73] T. R. Marrero, E. A. Mason, J. Phys. Chem. Ref. Data 1972,
1, 3. DOI: https://doi.org/10.1063/1.3253094[74] Q. Zhou, Y. Wu, C. W. Chan, P. Tontiwachwuthikul, Eng.
Appl. Artif. Intell. 2011, 24, 673–685.[75] Q. Zhou, C. W. Chan, P. Tontiwachwuthikul, Fuzzy Sets Syst.
2010, 161, 2597–2611.[76] C. Nwaoha, K. Odoh, E. Ikpatt, R. Orji, R. Idem, J. Environ.
Chem. Eng. 2017, 5, 5588–5598.[77] H. Saghafi, M. M. Ghiasi, A. H. Mohammadi, Int. J. Green-
house Gas Control 2017, 62, 23–30.[78] S. K. Jha, J. Bilalovic, A. Jha, N. Patel, H. Zhang, Renewable
Sustainable Energy Rev. 2017, 77, 297–317.[79] H. Yi, F. Li, P. Ning, X. Tang, J. Peng, Y. Li, H. Deng, Chem.
Eng. J. 2013, 215/216, 635–642.
Chem. Eng. Technol. 2019, 42, No. 2, 327–342 ª 2019 WILEY-VCH Verlag GmbH & Co. KGaA, Weinheim www.cet-journal.com
Research Article 342