analog electronics design to improve performance of ... · pdf fileanalog electronics design...
TRANSCRIPT
1SNAA284A–December 2015–Revised March 2016Submit Documentation Feedback
Copyright © 2015–2016, Texas Instruments Incorporated
Analog Electronics Design to Improve Performance of Ultrasonic Gas FlowMeter
All trademarks are the property of their respective owners.
Application ReportSNAA284A–December 2015–Revised March 2016
Analog Electronics Design to Improve Performance ofUltrasonic Gas Flow Meter
Bahram Mirshab
ABSTRACTTransit-time ultrasonic gas flow meters have gained acceptance in applications for gas transferdistribution. Advantages of this technology include: wide measuring range, relatively high accuracy, goodrepeatability, negligible pressure drop, general insensitivity to liquid contaminants, insensitivity tofluctuations of the gas composition, and low maintenance.
This application note covers the operating principals of ultrasonic gas flow measurement using theTDC1000 integrated ultrasonic analog-front-end (AFE) device and the TDC7200 precision integrated timerdevice. It covers additional external circuitry required for boosting transducer drive pulses in gas flowmeter application. The benefits of the complementary external circuits are discussed, namely driving thetransducer with more energy without the requirement for inductors, and the robust filter and gain stage.
Contents1 Basics of Operation on Ultrasonic Gas Flow Sensor ................................................................... 22 Gas Flow Sensor Interfacing Electronics Circuits ....................................................................... 43 Summary .................................................................................................................... 164 References .................................................................................................................. 17
List of Figures
1 Ultrasonic Gas Sensor Geometry With Reflector in the Acoustic Path ............................................... 22 Ultrasonic Gas Sensor Geometry With No Reflector in the Acoustic Path........................................... 23 Transmit and Receive Sequence to Measure the Difference Between the TOF for Upstream and
Downstream .................................................................................................................. 34 Block Diagram of the Interface Circuitry for Gas Flow Applications .................................................. 55 Simplified Diagram of the TDC1000 Receiver Path..................................................................... 56 External Balanced Differential Transducer Driver Circuit to Increase the Excitation Energy Delivered to a
Transducer.................................................................................................................... 77 Output Waveform of the Differential Driver Circuit ...................................................................... 88 Block Diagram of a Differential Transducer Driver Circuit With Sensor Interface ................................... 99 The Åckerberg-Mossberg Filter .......................................................................................... 1110 AC Coupling of the Path From AM_OUT to COMPIN to Filter Offset Voltage of the Filter....................... 1211 Retrofitted TDC1000-GASEVM Board Used to Obtain Preliminary Data........................................... 1212 Modification of TDC1000 Receiver Path to Include the External Filter/Gain Stage Between LNAOUT and
COMPIN Pins of TDC1000................................................................................................ 1313 The Signal From a Pair of 200 kHz Audiowell Gas Transducers Placed at 8 cm Apart at the COMPIN Pin
of TDC1000 ................................................................................................................. 1414 TDC1000 Setup Tab, Settings Not Shown in Red Font are the GUI Default Values ............................. 1415 TDC1000 Tab Configuration, Settings Not Shown in Red Font is the GUI Default Values ...................... 1516 TDC7200 Tab Configuration, Settings Not Shown in Red Font is the GUI Default Values ...................... 1517 Normalized Delta-TOF at Zero Flow (Air) in Room Temperature for Over 14,000 Samples..................... 16

FLOW
Transducer A
Transducer B
D L
FLOW
Transducer A Transducer B
D
½ L
½ L
Basics of Operation on Ultrasonic Gas Flow Sensor www.ti.com
2 SNAA284A–December 2015–Revised March 2016Submit Documentation Feedback
Copyright © 2015–2016, Texas Instruments Incorporated
Analog Electronics Design to Improve Performance of Ultrasonic Gas FlowMeter
List of Tables
1 Description of the Enquired External Passive Components ........................................................... 62 Signal Levels at the Receiver versus the Distance Between the Transducers, Audiowell Gas Transducer,
17 TX Pulse, 212 kHz Excitation Frequency, 3.2 V VDD and 100-kΩ Resistor in Series in TX Path to theTransducer.................................................................................................................... 7
3 Summarized Component Values for the Åckerberg-Mossberg Topology........................................... 114 Appendix 1: Ultrasonic Gas Flow Transducer Manufacturers ........................................................ 17
1 Basics of Operation on Ultrasonic Gas Flow Sensor
1.1 Ultrasonic Gas Flow Meter SensorIn Figure 1 and Figure 2 below, two types of ultrasonic gas flow sensors with different geometry aredisplayed. The piezoceramic transducers used in gas flow meter applications have resonance frequenciesin the range of 100 kHz to 500 kHz. This frequency range provides optimal tradeoff between accuracy andsignal attenuation factor in the gas medium. Traditional excitation pulses in the range of 12 V or higher areused to drive the transducers, since the attenuation of ultrasonic signal (pressure pulses) through gasmedium is very large, depending on the geometry of the sensor. However, it is possible to use a lowerexcitation voltage to generate ultrasonic pressure pulses with the proper mechanical design of the sensor:transducers mounting geometry and optimal distance between the transducers. The Q factor, the ratio ofthe resonance frequency over the bandwidth, also plays an important role; higher Q factor transducerswould be required.
The measurement sequence begins by transmitting and receiving acoustic pressure pulses by a pair ofpiezoelectric transducers, A and B, at an angle θ with respect to the center axis of pipe.
Figure 1. Ultrasonic Gas Sensor Geometry With Reflector in the Acoustic Path
Figure 2. Ultrasonic Gas Sensor Geometry With No Reflector in the Acoustic Path
Qualifying threshold setting
- mV
STOP
RX
START
TOFAB TOFBA
Downstream measurement sequnce
Upstream measurement sequence
TRIGGER
TX
www.ti.com Basics of Operation on Ultrasonic Gas Flow Sensor
3SNAA284A–December 2015–Revised March 2016Submit Documentation Feedback
Copyright © 2015–2016, Texas Instruments Incorporated
Analog Electronics Design to Improve Performance of Ultrasonic Gas FlowMeter
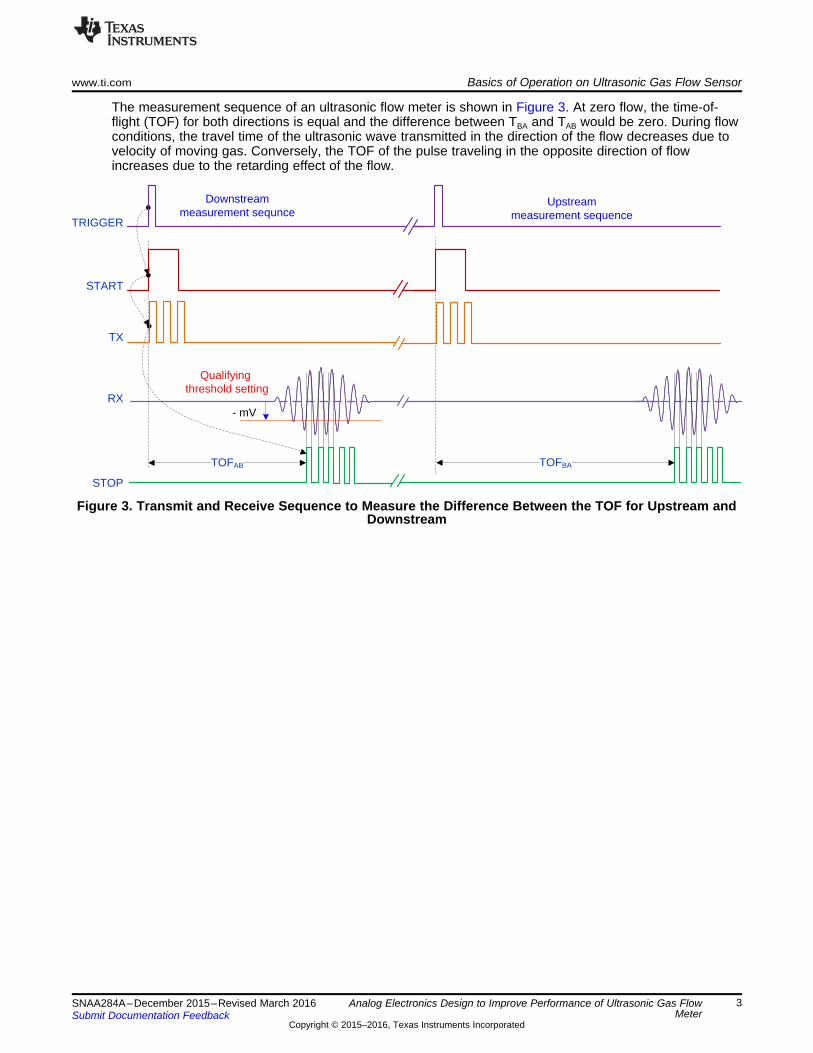
The measurement sequence of an ultrasonic flow meter is shown in Figure 3. At zero flow, the time-of-flight (TOF) for both directions is equal and the difference between TBA and TAB would be zero. During flowconditions, the travel time of the ultrasonic wave transmitted in the direction of the flow decreases due tovelocity of moving gas. Conversely, the TOF of the pulse traveling in the opposite direction of flowincreases due to the retarding effect of the flow.
Figure 3. Transmit and Receive Sequence to Measure the Difference Between the TOF for Upstream andDownstream
BA AB
AB BA AB BA AB BA
T TL 1 1 L L TC
2 T T 2 T T 2 T T
§ · § · § · ' ¨ ¸ ¨ ¸ ¨ ¸
u u© ¹ © ¹ © ¹
AB BA
L 1 1V
2 cos T T
§ · ¨ ¸
T © ¹
BAL
TC V cos
§ · ¨ ¸
T© ¹
ABL
TC V cos
§ · ¨ ¸
T© ¹
Basics of Operation on Ultrasonic Gas Flow Sensor www.ti.com
4 SNAA284A–December 2015–Revised March 2016Submit Documentation Feedback
Copyright © 2015–2016, Texas Instruments Incorporated
Analog Electronics Design to Improve Performance of Ultrasonic Gas FlowMeter
1.2 Volumetric Flow CalculationsTransit times in the upstream and downstream directions may be calculated as:
where• C = speed of sound in the medium (about 300 m/s to 400 m/s in gas)• V = average velocity of the medium in the pipe (1)
Given the speed of sound is constant between the up and down measurement then:
(2)
Using the above relation, the speed of sound can be calculated with the following equation:
(3)
(4)
The relationship for calculating the volumetric flow rate is:
Q = K*V*A
where• K = pipe calibration factor depending on the sensor• V = average velocity though of the fluid in the pipe• A = cross-sectional area of the meter pipe (5)
2 Gas Flow Sensor Interfacing Electronics Circuits
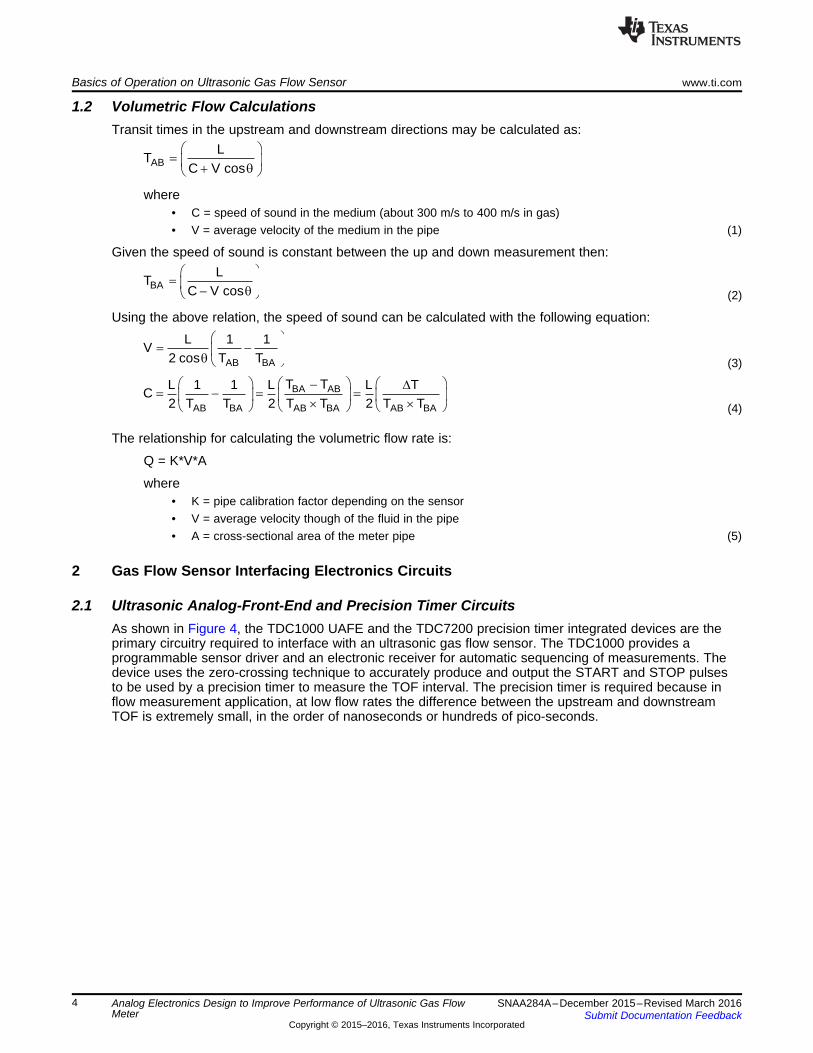
2.1 Ultrasonic Analog-Front-End and Precision Timer CircuitsAs shown in Figure 4, the TDC1000 UAFE and the TDC7200 precision timer integrated devices are theprimary circuitry required to interface with an ultrasonic gas flow sensor. The TDC1000 provides aprogrammable sensor driver and an electronic receiver for automatic sequencing of measurements. Thedevice uses the zero-crossing technique to accurately produce and output the START and STOP pulsesto be used by a precision timer to measure the TOF interval. The precision timer is required because inflow measurement application, at low flow rates the difference between the upstream and downstreamTOF is extremely small, in the order of nanoseconds or hundreds of pico-seconds.
-
+-
+
LNAPGA
500
30 pF
9 N
C 3
R3
C4
C5
R4
VCOM
-
+
-
+
-
+
2.5 pF
2.5 pF
C6
RX1
RX2
C1
C2
Rg
TDC1000 internal
R1
R2
External gain setting CAP or Resistor
TDC1000 internal
TDC1000 internal
External HP filter cap
External LP filter
Z-Cross
THcompLNAOUT PGAIN
PGAOUT COMPIN
MUX
THLDDAC
Diff Drive&
Sensor Interface
Precision Ring Oscillator
Registers
SPI
TDC7200TRIGGER
STOP
START
RegistersSM
TDC1000
Z_CROSS
TX Generator
MUX
Event Manager
PGALNA
SPI
RX1
RX2
TX1
TX2
AFLT
VCOM VCOM
Temperature Sensor
Interface
DAC
VCOM
Tranducer A
Transducer B
8-MHz OSC
MUX
Bypass
Bypass
POR
RTD1RTD2
RREF
MSP430XXXMCU
SPI
SPI
SPI
Active band-pass filter with gain
VCOM
www.ti.com Gas Flow Sensor Interfacing Electronics Circuits
5SNAA284A–December 2015–Revised March 2016Submit Documentation Feedback
Copyright © 2015–2016, Texas Instruments Incorporated
Analog Electronics Design to Improve Performance of Ultrasonic Gas FlowMeter
Figure 4. Block Diagram of the Interface Circuitry for Gas Flow Applications
The signal at the receiver side must be amplified because of the large attenuation of the ultrasonic signalamplitude traveling through the gas medium. The TDC1000 device includes a programmable integratedgain stage with built-in programmable on-time control feature for low-power operation. In the followingsection additional sensor interface circuits and external active filter circuits are described to enhance theperformance of the TDC1000 UAFE device.
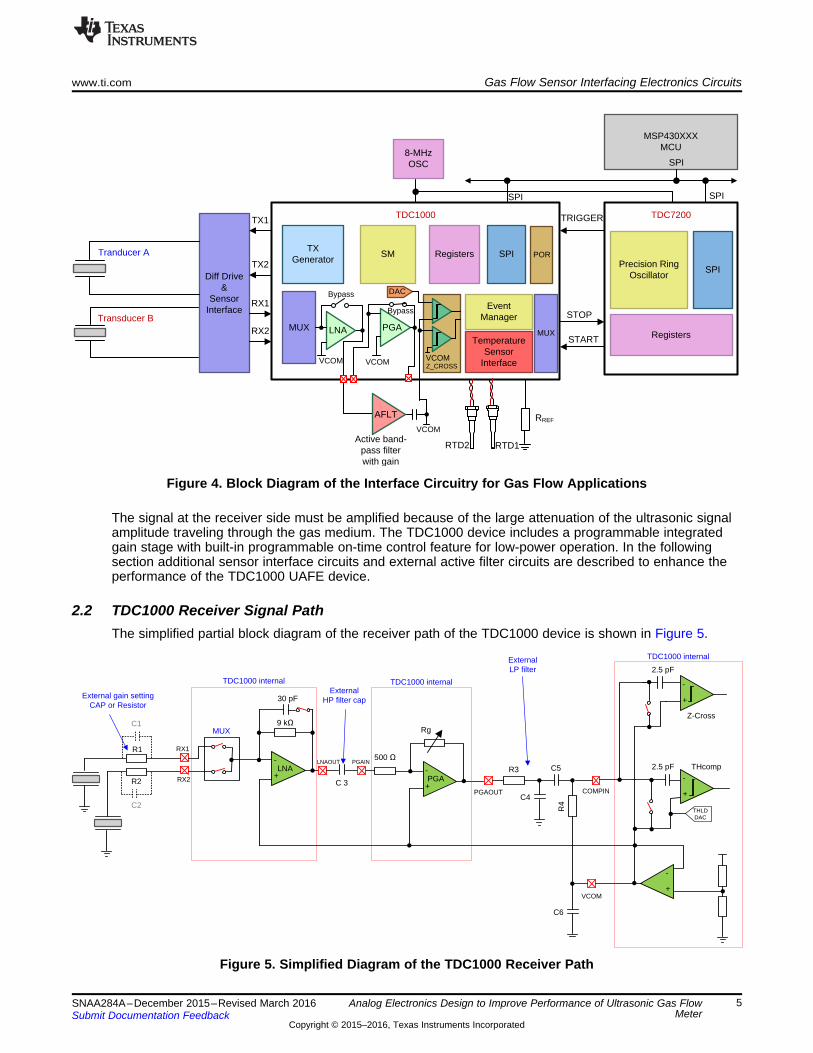
2.2 TDC1000 Receiver Signal PathThe simplified partial block diagram of the receiver path of the TDC1000 device is shown in Figure 5.
Figure 5. Simplified Diagram of the TDC1000 Receiver Path

1fc ; phase shift arctan(2 R3
2¦ &
44
R3 C I Su u u
Su u
1 1fc ; phase shift arctan
¦ 2 500 C 33 2 0 C I
Su :u Su u :u
OUTLNA
IN
V s C1 (or C2) 9 kG
V 1 s 30 pF 9 ku u :
u u :
LNA9 k
GR1 (or R2)
:
Gas Flow Sensor Interfacing Electronics Circuits www.ti.com
6 SNAA284A–December 2015–Revised March 2016Submit Documentation Feedback
Copyright © 2015–2016, Texas Instruments Incorporated
Analog Electronics Design to Improve Performance of Ultrasonic Gas FlowMeter
The external required components are listed in Table 1.
Table 1. Description of the Enquired External Passive Components
Parameter Description Equation CommentsR1 and R2 LNA feedback loop
gainResistive feedback mode isintended for gas applications
C1 and C2 LNA feedback loopgain
Capacitive feedback mode isintended for water applications
C3 High pass filter cap External cap of high pass filter(combined with 500 Ω internalresistor)
R3, C4 Low pass filter External low pass filter
The signal from a one MHz receiver transducer in a 15 to 30 mm diameter pipe containing water istypically in the range of 50 to 300 mV. For water applications the LNA should be used in capacitivefeedback mode with values of C1 (and C2) equal to 300 pF. The gain of the signal at the LNA would beabout 20 dB.
Unlike the water flow application, the signal in gas application from the receiver transducer is in the rangeof 100 μV to 50 mV and is much smaller in amplitude than in water application. The resonant frequency ofthe sensor in gas flow application is typically in the 200 kHz range. Using the LNA in capacitive mode withvalues of C1 and C2 as given above would result in further attenuation of the signal. Much higher valuesof C1 and C2 could be used, but as a consequence, the LNA may go unstable under certain operatingconditions. For gas applications the LNA should be operated in the resistive feedback mode. Using R1and R2 equal to 800 Ω would provide an LNA gain of approximately 20 dB. For the low pass filter using 21nF for C3 would set the corner frequency of the high-pass filter in the receiver path to about 15.2 kHz. Theusers should tune the components of the filters for best noise performance based on the resonancefrequency of the particular transducers used in the application.
2.3 Improving Signal-To-Noise Ratio (SNR) in the ReceiverIf the amplitude of the signal at the receiver side is very low (micro volt range), adding only an additionalexternal gain stage in the receiver signal chain might not be sufficient because extensively amplifying avery weak signal would amplify the noise in the path at the same time, degrading the signal-to-noise(SNR) ratio of the receiver path. Therefore, to improve the SNR, the approach should include increasingthe signal amplitude from the receiver as well as adding an additional gain circuit in the signal chain.
The signal amplitude at the receiver can be increased by applying higher energy excitation pulses to thetransmitter transducer. One approach is to boost the voltage level of the transmitter by using a DC-DCboost converter of some type. In the next section we use a differential driver circuit instead to drive thetransducer with more energy.
TX1
TX2
-
+
-
+
VDDVDD
ENB
ENB
5 N
5 N
5 N
5 N
5 N
5 N 3.6 V
200
200
10 0
10 0
TDC1000
200
3.6 V
Transducer
OPA2357
OPA2357
www.ti.com Gas Flow Sensor Interfacing Electronics Circuits
7SNAA284A–December 2015–Revised March 2016Submit Documentation Feedback
Copyright © 2015–2016, Texas Instruments Incorporated
Analog Electronics Design to Improve Performance of Ultrasonic Gas FlowMeter
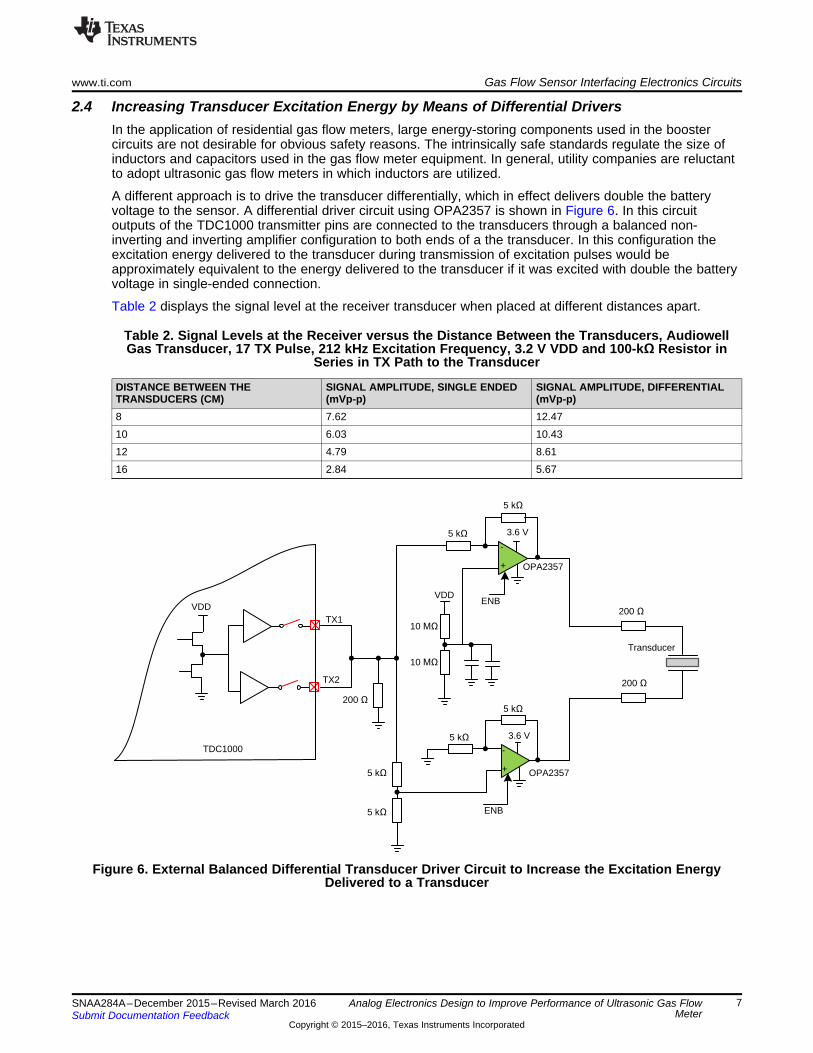
2.4 Increasing Transducer Excitation Energy by Means of Differential DriversIn the application of residential gas flow meters, large energy-storing components used in the boostercircuits are not desirable for obvious safety reasons. The intrinsically safe standards regulate the size ofinductors and capacitors used in the gas flow meter equipment. In general, utility companies are reluctantto adopt ultrasonic gas flow meters in which inductors are utilized.
A different approach is to drive the transducer differentially, which in effect delivers double the batteryvoltage to the sensor. A differential driver circuit using OPA2357 is shown in Figure 6. In this circuitoutputs of the TDC1000 transmitter pins are connected to the transducers through a balanced non-inverting and inverting amplifier configuration to both ends of a the transducer. In this configuration theexcitation energy delivered to the transducer during transmission of excitation pulses would beapproximately equivalent to the energy delivered to the transducer if it was excited with double the batteryvoltage in single-ended connection.
Table 2 displays the signal level at the receiver transducer when placed at different distances apart.
Table 2. Signal Levels at the Receiver versus the Distance Between the Transducers, AudiowellGas Transducer, 17 TX Pulse, 212 kHz Excitation Frequency, 3.2 V VDD and 100-kΩ Resistor in
Series in TX Path to the Transducer
DISTANCE BETWEEN THETRANSDUCERS (CM)
SIGNAL AMPLITUDE, SINGLE ENDED(mVp-p)
SIGNAL AMPLITUDE, DIFFERENTIAL(mVp-p)
8 7.62 12.4710 6.03 10.4312 4.79 8.6116 2.84 5.67
Figure 6. External Balanced Differential Transducer Driver Circuit to Increase the Excitation EnergyDelivered to a Transducer
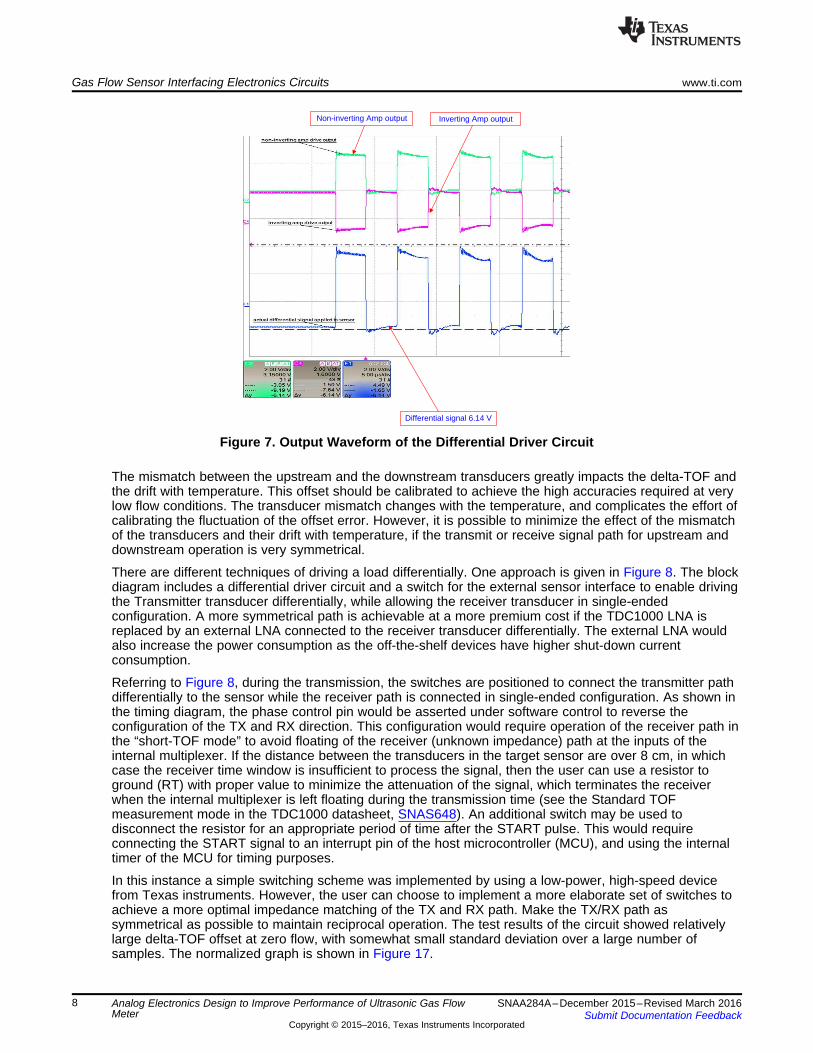
Non-inverting Amp output Inverting Amp output
Differential signal 6.14 V
Gas Flow Sensor Interfacing Electronics Circuits www.ti.com
8 SNAA284A–December 2015–Revised March 2016Submit Documentation Feedback
Copyright © 2015–2016, Texas Instruments Incorporated
Analog Electronics Design to Improve Performance of Ultrasonic Gas FlowMeter
Figure 7. Output Waveform of the Differential Driver Circuit
The mismatch between the upstream and the downstream transducers greatly impacts the delta-TOF andthe drift with temperature. This offset should be calibrated to achieve the high accuracies required at verylow flow conditions. The transducer mismatch changes with the temperature, and complicates the effort ofcalibrating the fluctuation of the offset error. However, it is possible to minimize the effect of the mismatchof the transducers and their drift with temperature, if the transmit or receive signal path for upstream anddownstream operation is very symmetrical.
There are different techniques of driving a load differentially. One approach is given in Figure 8. The blockdiagram includes a differential driver circuit and a switch for the external sensor interface to enable drivingthe Transmitter transducer differentially, while allowing the receiver transducer in single-endedconfiguration. A more symmetrical path is achievable at a more premium cost if the TDC1000 LNA isreplaced by an external LNA connected to the receiver transducer differentially. The external LNA wouldalso increase the power consumption as the off-the-shelf devices have higher shut-down currentconsumption.
Referring to Figure 8, during the transmission, the switches are positioned to connect the transmitter pathdifferentially to the sensor while the receiver path is connected in single-ended configuration. As shown inthe timing diagram, the phase control pin would be asserted under software control to reverse theconfiguration of the TX and RX direction. This configuration would require operation of the receiver path inthe “short-TOF mode” to avoid floating of the receiver (unknown impedance) path at the inputs of theinternal multiplexer. If the distance between the transducers in the target sensor are over 8 cm, in whichcase the receiver time window is insufficient to process the signal, then the user can use a resistor toground (RT) with proper value to minimize the attenuation of the signal, which terminates the receiverwhen the internal multiplexer is left floating during the transmission time (see the Standard TOFmeasurement mode in the TDC1000 datasheet, SNAS648). An additional switch may be used todisconnect the resistor for an appropriate period of time after the START pulse. This would requireconnecting the START signal to an interrupt pin of the host microcontroller (MCU), and using the internaltimer of the MCU for timing purposes.
In this instance a simple switching scheme was implemented by using a low-power, high-speed devicefrom Texas instruments. However, the user can choose to implement a more elaborate set of switches toachieve a more optimal impedance matching of the TX and RX path. Make the TX/RX path assymmetrical as possible to maintain reciprocal operation. The test results of the circuit showed relativelylarge delta-TOF offset at zero flow, with somewhat small standard deviation over a large number ofsamples. The normalized graph is shown in Figure 17.

PHAB_BA
TX1
TX2
-
+
-
+
VDDVDD
ENB
ENB
R8
R9
R5
R2
R3
R4 3.6 V
R10
R11
R6
R7
TDC1000
R1
3.6 V
XDUC A
OPA2357
OPA2357
GPIO
GPIO
-
+LNA
30 pF
9 N
R12RX1
RX2
VCOM
Resistive feedback mode
TDC1000
PHAB_BA
HI-Z HI-Z HI-ZTX1/TX2
RX1/RX2
A :B
B :A
TRIGGER
PHAB_BA
RT
C2C1
TsuTsu
XDUC B
C3
C4
C5
C6
NC
www.ti.com Gas Flow Sensor Interfacing Electronics Circuits
9SNAA284A–December 2015–Revised March 2016Submit Documentation Feedback
Copyright © 2015–2016, Texas Instruments Incorporated
Analog Electronics Design to Improve Performance of Ultrasonic Gas FlowMeter
Figure 8. Block Diagram of a Differential Transducer Driver Circuit With Sensor Interface
The values used in the test circuit:• R8 = R4 = R9 = R5 = R2 = R3 = 5 KΩ• R10 = R11 = R1 = 100 Ω• R12 = 200 Ω• C3 = C4 = C5 = C6 = 10 pF
01
¦2 RC
S
Gas Flow Sensor Interfacing Electronics Circuits www.ti.com
10 SNAA284A–December 2015–Revised March 2016Submit Documentation Feedback
Copyright © 2015–2016, Texas Instruments Incorporated
Analog Electronics Design to Improve Performance of Ultrasonic Gas FlowMeter
2.5 Power Consumption ConsiderationsThe average current consumption of the TDC1000 for a given number of settings — number of TX,receiver on time, number of averaging, and so forth — can be calculated using the calculator SNAC070spread sheet. For a typical single downstream/upstream measurement the combined average powerconsumption of the TDC1000 AFE and TDC7200 (precision timer) devices is approximately 3 to 5 µA.With the additional external circuit mentioned above, power consumption will increase slightly. Theexternal amplifier includes a shutdown pin for power cycling to reduce the average current consumption ofthe device. However, the amplifiers should to be kept in the on state during the upstream and downstreamacquisition to maintain the known impedance during this period. The power consumption of the analogswitch used in the external circuit is very low, making it a suitable choice for battery operated flow meterapplications.
2.6 Implementation of an External Active Filter and Gain StageImportant considerations include the most appropriate location in the signal chain to place the externalgain stage and the key specifications required for the selection of the operational amplifier. A batteryoperated gas flow meter using 200-kHz transducers requires an amplifier with a shutdown pin, very lowshutdown current consumption (nA range), very low offset voltage (μA range), sufficient bandwidth (over 1MHz), a proper slew rate (10 V/us or higher), and relatively low voltage and current noise specifications.Finding a part with all the conditions mentioned above is a limiting factor. The two Texas Instrumentsdevices considered in this article are the LMV881 and OPA2357 devices. The offset voltages for theseamplifiers are not in the micro amp range; therefore, AC coupling is required to avoid introduction of errorin delta-TOF due to the offset voltage of the selected operation amplifier.
Various active filtering topologies can be considered in the receiver signal path of the TDC1000 device forgas applications. In any case, the circuit has to meet the design goal of passing gas sensor signals in thefrequency range of 100 kHz to 500 kHz and must provide enough gain to have a high-fidelity signal withpeak-to-peak amplitude of about 2 V to obtain a zero-flow TOF standard deviation of a few hundredpicoseconds.
The circuit was designed for a pair of 200-kHz Audiowell gas transducers. The Audiowell transducerswere housed in a pipe and placed 8 cm from each other. The amplitude of signal at the receiver using thedifferential driver concept with twelve TX pulses of approximately 3.6 V was measured to be around 13mV. To simplify the design, the filter stage was placed between the LNAOUT and COMPIN pins,bypassing the PGA and the filters shown in Figure 5 altogether. The center frequency of the filter wasdesigned to be about 200 kHz, with 3-dB corner frequencies of about 180 kHz and 226 kHz . Potentialunwanted signals to be filtered out include 50 Hz and 60 Hz coupled from surrounding power lines,harmonics from crosstalk, and high frequency signals in the MHz and GHz range from wireless equipmentused in the smart meters.
The Åckerberg-Mossberg filter shown in Figure 9 is utilized. For more information please see theapplication note SNAA287. The benefit of this topology is that the center frequency can be increased tothe largest resonant frequency of gas sensors without experiencing unpredictable selectivity factor Q andgain errors. A change in the center frequency does not noticeably alter the selectivity factor and gain. Thispermits the designer to quickly adjust to a change in the distance between the ultrasonic gas transducersas there is no complex math to be completed after the initial setup of the gain stage. In addition, a notch atany frequency below the center frequency can be designed without affecting the center frequency, mid-band gain and selectivity factor Q if required.
This topology consists of two active integrators: the inverting Miller integrator and the non-invertingintegrator with active compensation. These two integrators compensate each other by reducing the errorsin the selectivity factor Q due to the inherent frequency-dependent gain of non-ideal amplifier. Theselectivity factor Q is crucial in gas applications where a received signal at the resonant frequency of thegas sensors is required to be amplified by at least 20 dB using the limited GBW provided by the amplifierdevice. Minimum selectivity factor error requires that:
C2= C3= C and (6)R3= R6= R (7)
Where the gas sensor resonant frequency is represented by Equation 8:
(8)

zero 0c
¦ ¦a
C2
C3
LNAOUT
AM_NOTCH_OUT
±
+
C1
OPA2357
±
+
OPA2357
VCOM
VCOM
±
+
VCOM
R2
R6
R5
R3
R4
OPA2357
R1
ENB
ENB
ENB
AM_OUT
RC
www.ti.com Gas Flow Sensor Interfacing Electronics Circuits
11SNAA284A–December 2015–Revised March 2016Submit Documentation Feedback
Copyright © 2015–2016, Texas Instruments Incorporated
Analog Electronics Design to Improve Performance of Ultrasonic Gas FlowMeter
The filter is stable if the input of the Miller integrator is fed by the negative feedback loop provided by theunity-gain inverter if:
R4= R5= R3= R6= R (9)
Figure 9. The Åckerberg-Mossberg Filter
The Åckerberg-Mossberg topology in Figure 9 creates an arbitrary notch via voltage feedforward thatprovides a clearer signal when either crosstalk or harmonics linger on the output signal. This notch doesnot affect the poles of the transfer function and is designed by feeding a portion of the input signal into thevirtual ground node of the Miller integrator and the non-inverting integrator. It is governed by the followingequation:
C1= aC and R1= R⁄c. (10)
Where:
a Determines the high-frequency gain and
c Determines the low-frequency gain.
The frequency of the transmission zero is represented by Equation 11:
where• a Determines the high-frequency gain and• c Determines the low-frequency gain (11)
Resistor R_2 = QR sets the selectivity factor. The component values are summarized in Table 3.
Table 3. Summarized Component Values for the Åckerberg-Mossberg Topology
Component Value For 200kHz using FLTOUT DescriptionR,C 1⁄(2πf_0 ) 795.775E-9 1/Hz Set the cut-off frequency.C1 aC 1 nF Sets the high-frequency gain.R1 R⁄c 7.68 kΩ Sets the low-frequency gain.R2 QR 25 kΩ Sets the selectivity factor.
Audio well gas transudes
Differential driver and sensor interface circuit
Filter/gain circuit
Filter/gain circuit connection to theTDC1000-GASEVM receiver path
by removing C3
Cout1
1.5 k
8 k
VCOM
AM_OUT COMP_IN
2.7 nFRout1
Rout2
Gas Flow Sensor Interfacing Electronics Circuits www.ti.com
12 SNAA284A–December 2015–Revised March 2016Submit Documentation Feedback
Copyright © 2015–2016, Texas Instruments Incorporated
Analog Electronics Design to Improve Performance of Ultrasonic Gas FlowMeter
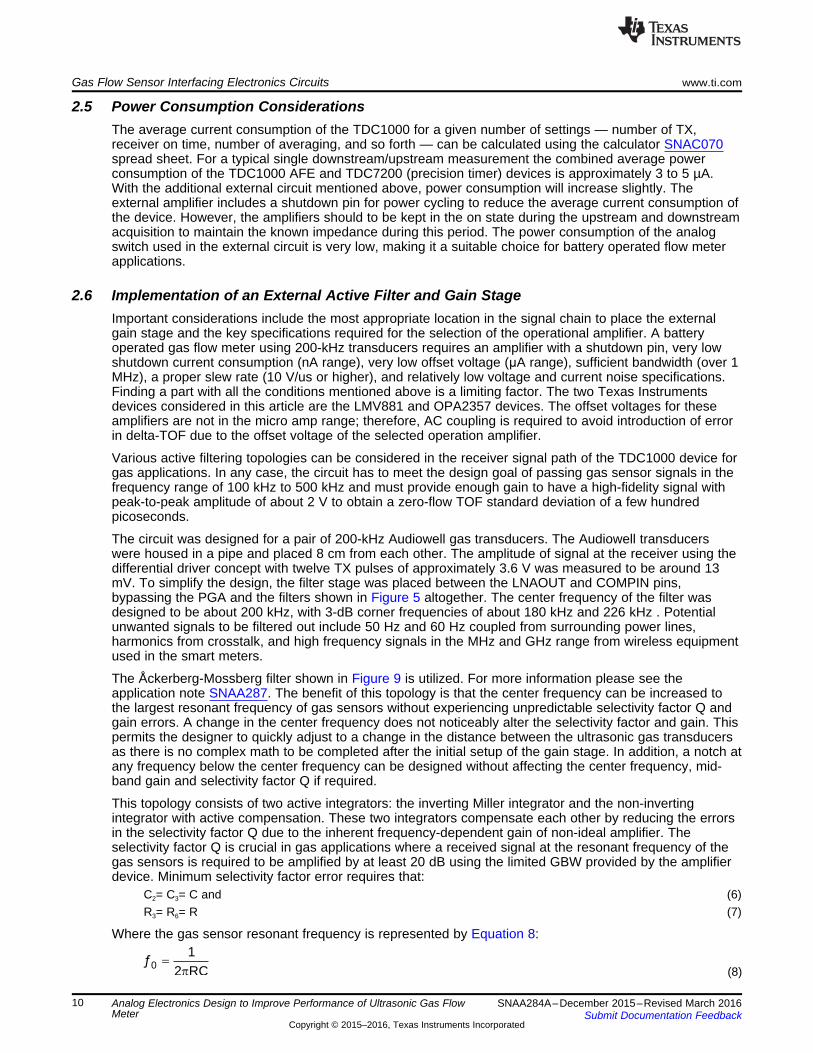
The designer can instead use the AM_OUT node instead of the AM_NOTCH_OUT node if for whateverreason only the bandpass response is wanted. The AM_OUT output node has an almost identicalresponse as the AM_NOTCH_OUT node except for the presence of the notch at the chosen frequency. Ifthe AM_OUT node is used as the output, place resistor R_C = 1.1 kΩ as shown in Figure 9.
Figure 10 shows the biasing circuitry to center the output signal at VCOM. AC coupling is used to filter theoffset voltage of the Åckerberg-Mossberg gain stage. The cut-off frequency of the low-pass biasingcircuitry (C_out1 and R_out1) is 40 kHz and so a gas transducer echo is not noticeably attenuated.R_out2 stabilizes the VCOM buffer.
Figure 10. AC Coupling of the Path From AM_OUT to COMPIN to Filter Offset Voltage of the Filter
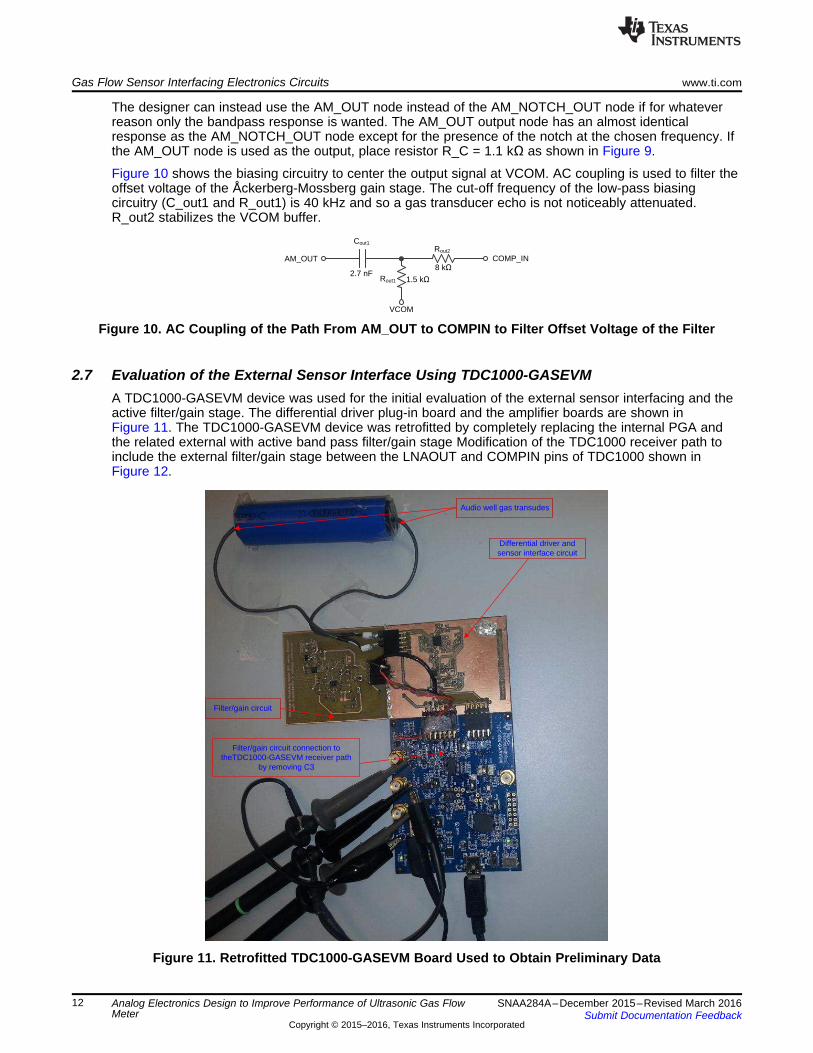
2.7 Evaluation of the External Sensor Interface Using TDC1000-GASEVMA TDC1000-GASEVM device was used for the initial evaluation of the external sensor interfacing and theactive filter/gain stage. The differential driver plug-in board and the amplifier boards are shown inFigure 11. The TDC1000-GASEVM device was retrofitted by completely replacing the internal PGA andthe related external with active band pass filter/gain stage Modification of the TDC1000 receiver path toinclude the external filter/gain stage between the LNAOUT and COMPIN pins of TDC1000 shown inFigure 12.
Figure 11. Retrofitted TDC1000-GASEVM Board Used to Obtain Preliminary Data
-
+LNA
30 pF
9 N
VCOM
-
+
-
+
-
+
2.5 pF
2.5 pF
RX1
RX2
TDC1000 internal
R1
R2
External LNA gain setting resistor
(resistive feedback mode)
TDC1000 internal
Z-Cross
THcompLNAOUT
COMPIN
MUX
THLDDAC
C2
C3
C1
R4
R3
-
+OPA2357
-
+OPA2357
R2
-
+OPA2357
R2
R7
R6
External gain/filter stage
R8
R5
ENBENBENB
C2
10 nF
www.ti.com Gas Flow Sensor Interfacing Electronics Circuits
13SNAA284A–December 2015–Revised March 2016Submit Documentation Feedback
Copyright © 2015–2016, Texas Instruments Incorporated
Analog Electronics Design to Improve Performance of Ultrasonic Gas FlowMeter
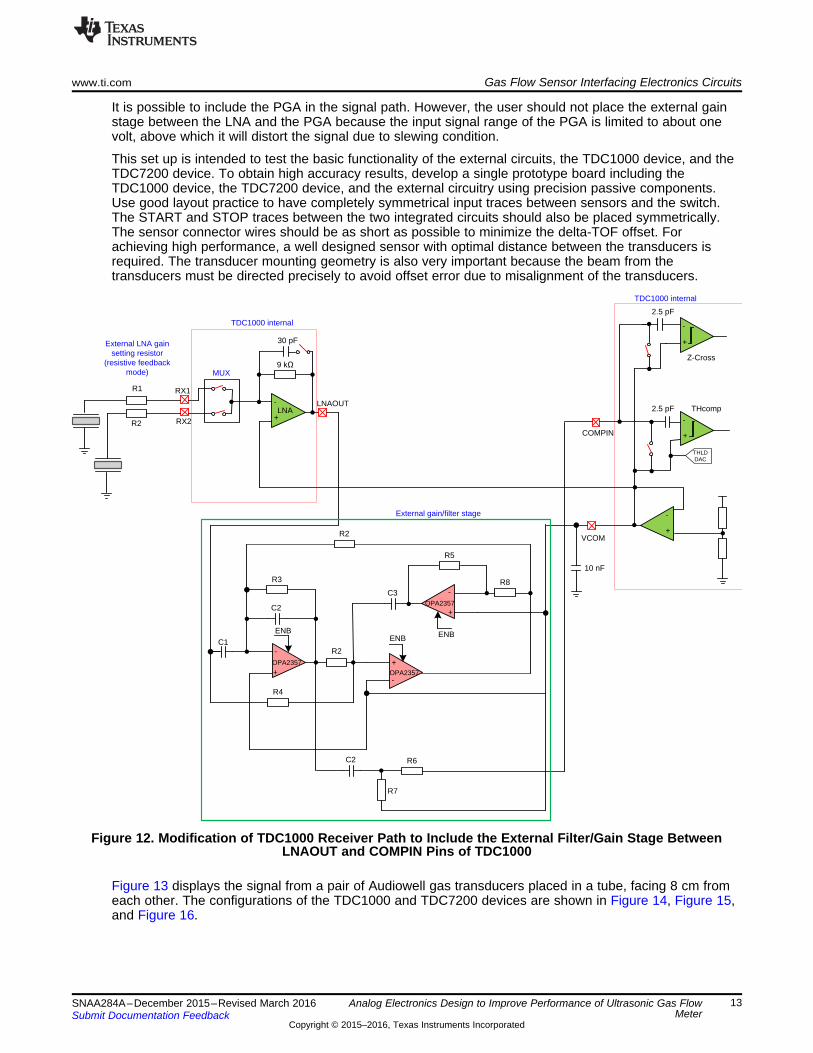
It is possible to include the PGA in the signal path. However, the user should not place the external gainstage between the LNA and the PGA because the input signal range of the PGA is limited to about onevolt, above which it will distort the signal due to slewing condition.
This set up is intended to test the basic functionality of the external circuits, the TDC1000 device, and theTDC7200 device. To obtain high accuracy results, develop a single prototype board including theTDC1000 device, the TDC7200 device, and the external circuitry using precision passive components.Use good layout practice to have completely symmetrical input traces between sensors and the switch.The START and STOP traces between the two integrated circuits should also be placed symmetrically.The sensor connector wires should be as short as possible to minimize the delta-TOF offset. Forachieving high performance, a well designed sensor with optimal distance between the transducers isrequired. The transducer mounting geometry is also very important because the beam from thetransducers must be directed precisely to avoid offset error due to misalignment of the transducers.
Figure 12. Modification of TDC1000 Receiver Path to Include the External Filter/Gain Stage BetweenLNAOUT and COMPIN Pins of TDC1000
Figure 13 displays the signal from a pair of Audiowell gas transducers placed in a tube, facing 8 cm fromeach other. The configurations of the TDC1000 and TDC7200 devices are shown in Figure 14, Figure 15,and Figure 16.

Gas Flow Sensor Interfacing Electronics Circuits www.ti.com
14 SNAA284A–December 2015–Revised March 2016Submit Documentation Feedback
Copyright © 2015–2016, Texas Instruments Incorporated
Analog Electronics Design to Improve Performance of Ultrasonic Gas FlowMeter
Figure 13. The Signal From a Pair of 200 kHz Audiowell Gas Transducers Placed at 8 cm Apart at theCOMPIN Pin of TDC1000
Figure 14. TDC1000 Setup Tab, Settings Not Shown in Red Font are the GUI Default Values

www.ti.com Gas Flow Sensor Interfacing Electronics Circuits
15SNAA284A–December 2015–Revised March 2016Submit Documentation Feedback
Copyright © 2015–2016, Texas Instruments Incorporated
Analog Electronics Design to Improve Performance of Ultrasonic Gas FlowMeter
Figure 15. TDC1000 Tab Configuration, Settings Not Shown in Red Font is the GUI Default Values
Figure 16. TDC7200 Tab Configuration, Settings Not Shown in Red Font is the GUI Default Values

Summary www.ti.com
16 SNAA284A–December 2015–Revised March 2016Submit Documentation Feedback
Copyright © 2015–2016, Texas Instruments Incorporated
Analog Electronics Design to Improve Performance of Ultrasonic Gas FlowMeter
Figure 17. Normalized Delta-TOF at Zero Flow (Air) in Room Temperature for Over 14,000 Samples
3 SummaryIn this application note the design of analog interfacing circuitry for ultrasonic gas flow transducers ispresented. The solution includes the TDC1000 and the TDC7200 integrated ultrasonic interface deviceswith some additional external senor interfacing, in addition to filter and gain stages. The benefits of thecombined differential drive and the external filter and gain stage are presented. Some basic tests indicatethat the receiver signal strength is approximately doubled when the transducer excitation pulses areapplied differentially to the transmitter transducer. The plot of delta-TOF of over 140000 samples showedrelatively large fixed offset. The standard deviation of the normalized delta-TOF of over 14000 samples atroom temperature is approximately one nanosecond.
www.ti.com References
17SNAA284A–December 2015–Revised March 2016Submit Documentation Feedback
Copyright © 2015–2016, Texas Instruments Incorporated
Analog Electronics Design to Improve Performance of Ultrasonic Gas FlowMeter
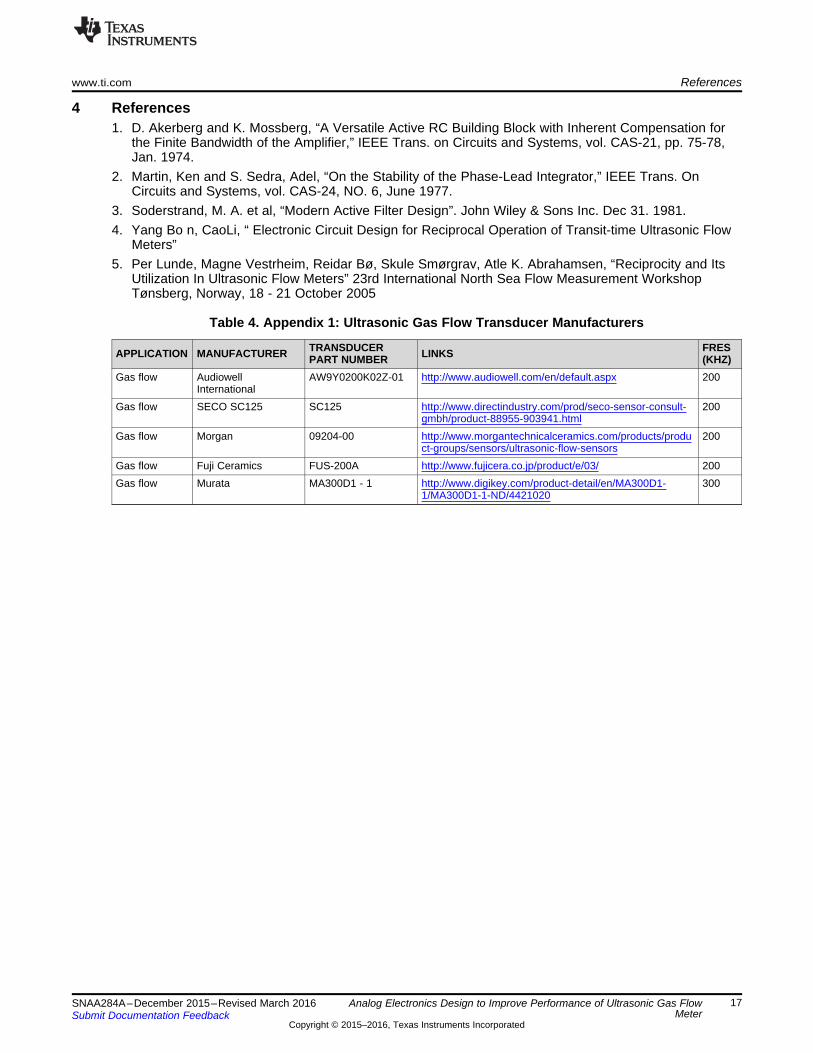
4 References1. D. Akerberg and K. Mossberg, “A Versatile Active RC Building Block with Inherent Compensation for
the Finite Bandwidth of the Amplifier,” IEEE Trans. on Circuits and Systems, vol. CAS-21, pp. 75-78,Jan. 1974.
2. Martin, Ken and S. Sedra, Adel, “On the Stability of the Phase-Lead Integrator,” IEEE Trans. OnCircuits and Systems, vol. CAS-24, NO. 6, June 1977.
3. Soderstrand, M. A. et al, “Modern Active Filter Design”. John Wiley & Sons Inc. Dec 31. 1981.4. Yang Bo n, CaoLi, “ Electronic Circuit Design for Reciprocal Operation of Transit-time Ultrasonic Flow
Meters”5. Per Lunde, Magne Vestrheim, Reidar Bø, Skule Smørgrav, Atle K. Abrahamsen, “Reciprocity and Its
Utilization In Ultrasonic Flow Meters” 23rd International North Sea Flow Measurement WorkshopTønsberg, Norway, 18 - 21 October 2005
Table 4. Appendix 1: Ultrasonic Gas Flow Transducer Manufacturers
APPLICATION MANUFACTURER TRANSDUCERPART NUMBER LINKS FRES
(KHZ)Gas flow Audiowell
InternationalAW9Y0200K02Z-01 http://www.audiowell.com/en/default.aspx 200
Gas flow SECO SC125 SC125 http://www.directindustry.com/prod/seco-sensor-consult-gmbh/product-88955-903941.html
200
Gas flow Morgan 09204-00 http://www.morgantechnicalceramics.com/products/product-groups/sensors/ultrasonic-flow-sensors
200
Gas flow Fuji Ceramics FUS-200A http://www.fujicera.co.jp/product/e/03/ 200Gas flow Murata MA300D1 - 1 http://www.digikey.com/product-detail/en/MA300D1-
1/MA300D1-1-ND/4421020300
Revision History www.ti.com
18 SNAA284A–December 2015–Revised March 2016Submit Documentation Feedback
Copyright © 2015–2016, Texas Instruments Incorporated
Revision History
Revision HistoryNOTE: Page numbers for previous revisions may differ from page numbers in the current version.
Changes from Original (December 2015) to A Revision ................................................................................................ Page
• Updated the Åckerberg-Mossberg Filter image...................................................................................... 11• Updated figure 12........................................................................................................................ 13

IMPORTANT NOTICE
Texas Instruments Incorporated and its subsidiaries (TI) reserve the right to make corrections, enhancements, improvements and otherchanges to its semiconductor products and services per JESD46, latest issue, and to discontinue any product or service per JESD48, latestissue. Buyers should obtain the latest relevant information before placing orders and should verify that such information is current andcomplete. All semiconductor products (also referred to herein as “components”) are sold subject to TI’s terms and conditions of salesupplied at the time of order acknowledgment.TI warrants performance of its components to the specifications applicable at the time of sale, in accordance with the warranty in TI’s termsand conditions of sale of semiconductor products. Testing and other quality control techniques are used to the extent TI deems necessaryto support this warranty. Except where mandated by applicable law, testing of all parameters of each component is not necessarilyperformed.TI assumes no liability for applications assistance or the design of Buyers’ products. Buyers are responsible for their products andapplications using TI components. To minimize the risks associated with Buyers’ products and applications, Buyers should provideadequate design and operating safeguards.TI does not warrant or represent that any license, either express or implied, is granted under any patent right, copyright, mask work right, orother intellectual property right relating to any combination, machine, or process in which TI components or services are used. Informationpublished by TI regarding third-party products or services does not constitute a license to use such products or services or a warranty orendorsement thereof. Use of such information may require a license from a third party under the patents or other intellectual property of thethird party, or a license from TI under the patents or other intellectual property of TI.Reproduction of significant portions of TI information in TI data books or data sheets is permissible only if reproduction is without alterationand is accompanied by all associated warranties, conditions, limitations, and notices. TI is not responsible or liable for such altereddocumentation. Information of third parties may be subject to additional restrictions.Resale of TI components or services with statements different from or beyond the parameters stated by TI for that component or servicevoids all express and any implied warranties for the associated TI component or service and is an unfair and deceptive business practice.TI is not responsible or liable for any such statements.Buyer acknowledges and agrees that it is solely responsible for compliance with all legal, regulatory and safety-related requirementsconcerning its products, and any use of TI components in its applications, notwithstanding any applications-related information or supportthat may be provided by TI. Buyer represents and agrees that it has all the necessary expertise to create and implement safeguards whichanticipate dangerous consequences of failures, monitor failures and their consequences, lessen the likelihood of failures that might causeharm and take appropriate remedial actions. Buyer will fully indemnify TI and its representatives against any damages arising out of the useof any TI components in safety-critical applications.In some cases, TI components may be promoted specifically to facilitate safety-related applications. With such components, TI’s goal is tohelp enable customers to design and create their own end-product solutions that meet applicable functional safety standards andrequirements. Nonetheless, such components are subject to these terms.No TI components are authorized for use in FDA Class III (or similar life-critical medical equipment) unless authorized officers of the partieshave executed a special agreement specifically governing such use.Only those TI components which TI has specifically designated as military grade or “enhanced plastic” are designed and intended for use inmilitary/aerospace applications or environments. Buyer acknowledges and agrees that any military or aerospace use of TI componentswhich have not been so designated is solely at the Buyer's risk, and that Buyer is solely responsible for compliance with all legal andregulatory requirements in connection with such use.TI has specifically designated certain components as meeting ISO/TS16949 requirements, mainly for automotive use. In any case of use ofnon-designated products, TI will not be responsible for any failure to meet ISO/TS16949.
Products ApplicationsAudio www.ti.com/audio Automotive and Transportation www.ti.com/automotiveAmplifiers amplifier.ti.com Communications and Telecom www.ti.com/communicationsData Converters dataconverter.ti.com Computers and Peripherals www.ti.com/computersDLP® Products www.dlp.com Consumer Electronics www.ti.com/consumer-appsDSP dsp.ti.com Energy and Lighting www.ti.com/energyClocks and Timers www.ti.com/clocks Industrial www.ti.com/industrialInterface interface.ti.com Medical www.ti.com/medicalLogic logic.ti.com Security www.ti.com/securityPower Mgmt power.ti.com Space, Avionics and Defense www.ti.com/space-avionics-defenseMicrocontrollers microcontroller.ti.com Video and Imaging www.ti.com/videoRFID www.ti-rfid.comOMAP Applications Processors www.ti.com/omap TI E2E Community e2e.ti.comWireless Connectivity www.ti.com/wirelessconnectivity
Mailing Address: Texas Instruments, Post Office Box 655303, Dallas, Texas 75265Copyright © 2016, Texas Instruments Incorporated