anaerobic treatment of wastewater in a uasb reactor
TRANSCRIPT
ANAEROBIC TREATMENT OF WASTEWATER IN A UASB REACTOR
LARISA KORSAK
LICENTIATE THESIS IN CHEMICAL ENGINEERING
DEPARTMENT OF CHEMICAL ENGINEERING AND TECHNOLOGY
STOCKHOLM, SWEDEN
DECEMBER 2008
Anaerobic Treatment of Wastewater in a UASB reactor Larisa Korsak Licentiate Thesis in Chemical Engineering Department of Chemical Engineering and Technology Division of Chemical Engineering Royal Institute of Technology Stockholm, Sweden TRITA-CHE Report 2008:71 ISSN 1654-1081 ISBN 978-91-7415-178-7 Copyright © 2008 by Larisa Korsak
i
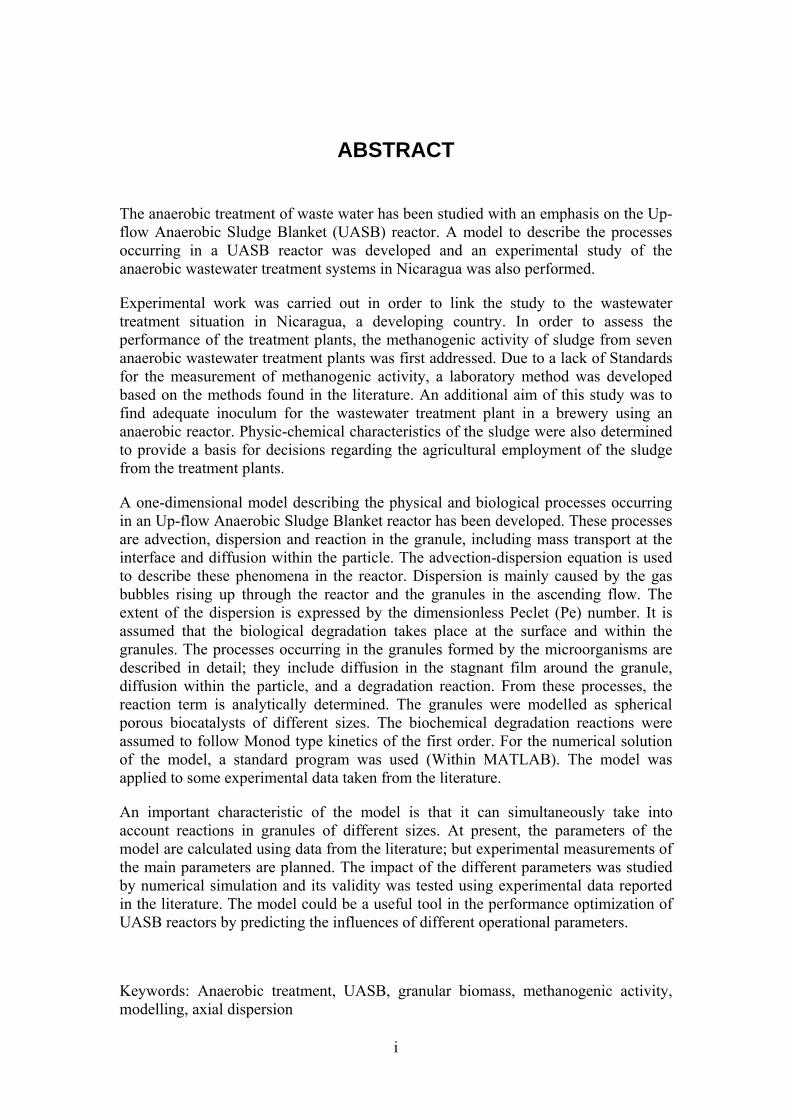
ABSTRACT
The anaerobic treatment of waste water has been studied with an emphasis on the Up- flow Anaerobic Sludge Blanket (UASB) reactor. A model to describe the processes occurring in a UASB reactor was developed and an experimental study of the anaerobic wastewater treatment systems in Nicaragua was also performed.
Experimental work was carried out in order to link the study to the wastewater treatment situation in Nicaragua, a developing country. In order to assess the performance of the treatment plants, the methanogenic activity of sludge from seven anaerobic wastewater treatment plants was first addressed. Due to a lack of Standards for the measurement of methanogenic activity, a laboratory method was developed based on the methods found in the literature. An additional aim of this study was to find adequate inoculum for the wastewater treatment plant in a brewery using an anaerobic reactor. Physic-chemical characteristics of the sludge were also determined to provide a basis for decisions regarding the agricultural employment of the sludge from the treatment plants.
A one-dimensional model describing the physical and biological processes occurring in an Up-flow Anaerobic Sludge Blanket reactor has been developed. These processes are advection, dispersion and reaction in the granule, including mass transport at the interface and diffusion within the particle. The advection-dispersion equation is used to describe these phenomena in the reactor. Dispersion is mainly caused by the gas bubbles rising up through the reactor and the granules in the ascending flow. The extent of the dispersion is expressed by the dimensionless Peclet (Pe) number. It is assumed that the biological degradation takes place at the surface and within the granules. The processes occurring in the granules formed by the microorganisms are described in detail; they include diffusion in the stagnant film around the granule, diffusion within the particle, and a degradation reaction. From these processes, the reaction term is analytically determined. The granules were modelled as spherical porous biocatalysts of different sizes. The biochemical degradation reactions were assumed to follow Monod type kinetics of the first order. For the numerical solution of the model, a standard program was used (Within MATLAB). The model was applied to some experimental data taken from the literature.
An important characteristic of the model is that it can simultaneously take into account reactions in granules of different sizes. At present, the parameters of the model are calculated using data from the literature; but experimental measurements of the main parameters are planned. The impact of the different parameters was studied by numerical simulation and its validity was tested using experimental data reported in the literature. The model could be a useful tool in the performance optimization of UASB reactors by predicting the influences of different operational parameters.
Keywords: Anaerobic treatment, UASB, granular biomass, methanogenic activity, modelling, axial dispersion
i

LIST OF PAPERS
This thesis includes four papers (appended at the end of the thesis) and referred to in the text by roman numerals from I to IV:
Paper I
Korsak L. and L. Moreno, 2003. Wastewater treatment in Nicaragua. In Proceeding of the 9th IWA Specialised Conference “Design, Operation and Economics of Large Wastewater Treatment Plants”, September 1-4, 2003, Praha, Czech Republic
Paper II
Korsak L. and L. Moreno, 2005. Alternatives of Sludge Use in Nicaragua. In Proceeding of the 27th Annual HWEA Conference “New Technical Knowledge for Clean Water”, February 16-18, 2005, Honolulu, Hawaii
Paper III
Korsak L. and L. Moreno, 2006. Evaluation of anaerobic sludge activity in wastewater treatment plants in Nicaragua. In Proceeding of the 8th International Conference of Wessex Institute of Technology, UK, WATER POLLUTION-2006: Modeling, Monitoring and Management, Bologna, Italy, Ed. C.A. Brebbia and J.S. Antunes do Carmo, pp. 571–580. Bologna, Italy. ISBN 1-84564-042-X.
Paper IV
Korsak L., A. Cabezas and L. Moreno, 2008. A Model of kinetics and mass transfer in an UASB reactor. In Proceeding of the 4th International Conference on Environmental Science and Technology (ICEST2008), Houston, USA (In press)
ii
ACKNOWLEDGMENT
This work was carried out in a cooperation program between the Departments of Chemical Engineering of the Royal Institute of Technology, Stockholm, and the National University of Engineering, Managua, with financial support from the research division of the Swedish International Development Agency (SIDA/SAREC), without which this study would not have been possible.
I would like to express a deep gratitude to the following persons:
• My supervisor, Associate Professor Luis Moreno, for his unconditional support, encouragement and guidance all the time during this work.
• My Nicaraguan and Swedish colleagues and friends for being always ready to help and to share knowledge; for useful advices, interesting discussions and nice coffee breaks; all these made a pleasant staying in Sweden.
• My family, for love and patience.
iii
TABLE OF CONTENT
1 INTRODUCTION.................................................................................................1
1.1 Objectives......................................................................................................2
2 ANAEROBIC PROCESS .....................................................................................3
2.1 Classification of Anaerobic Types of Treatments .....................................3 2.1.1 Suspended growth treatment processes .....................................................3 2.1.2 Attached growth anaerobic treatment reactors ..........................................4
2.2 Anaerobic Digestion.....................................................................................4
2.3 Kinetic Considerations. Monod type equations. .......................................7
2.4 Specific methanogenic activity test.............................................................7 2.4.1 Test medium and other conditions.............................................................8
3 EXPERIMENTAL SECTION............................................................................10
3.1 Introduction................................................................................................10
3.2 Experimental Work ...................................................................................11 3.2.1 Determination of sludge properties. Sludge utilisation............................12 3.2.2 Characterization of wastewater and sludge. Treatment performance ......13 3.2.2.1 Methanogenic activity test ...................................................................15
3.3 Results and discussion ...............................................................................16 3.3.1 Sludge utilisation .....................................................................................16 3.3.2 Characterization of wastewater and sludge..............................................18
3.4 Conclusions of the Experimetal Part........................................................22
4 THE UASB REACTOR ......................................................................................24
4.1 Brief structural description.......................................................................24
4.2 Processes and Conditions in the Reactor .................................................25
4.3 Process Modelling ......................................................................................27 4.3.1 Flow model ..............................................................................................27 4.3.2 Biofilm reactor model ..............................................................................29 4.3.3 Different models of the structure of the biofilm ......................................30
5 MODEL OF UASB .............................................................................................32
5.1 The System to be Modelled .......................................................................32
5.2 Conceptual Model ......................................................................................32
5.3 Mathematical Model..................................................................................34 5.3.1 Mass balance of substrate in the bulk liquid............................................34 5.3.2 Mass balance of substrate inside the granule...........................................35 5.3.3 Mass transfer ............................................................................................36
5.4 Evaluation of the Reaction Rate Constant...............................................39 5.4.1 Reactor with uniform granules of constant size.......................................39
iv
5.4.2 Reactor with granules of different size ....................................................39
6 STUDY OF THE UASB. SOME PRELIMINARY CALCULATIONS ............41
6.1 Determination of the Parameters of the Model.......................................41 6.1.1 Dispersion estimations .............................................................................41 6.1.2 Reaction rate term, K ...............................................................................44
6.2 Application of the model ...........................................................................48
Influence of the main parameters on the UASB performance ..........................49 6.2.1 Effect of dispersion ..................................................................................49 6.2.2 Effect of the up-flow velocity ..................................................................50 6.2.3 Effect of reaction rate...............................................................................51
6.3 Simulations Using the Transient Model...................................................51
6.4 Model Application to two real cases.........................................................52 6.4.1 Description of the data source (Alvarez et al, 2006) ...............................53 6.4.2 Results for the municipal wastewater treatment ......................................53 6.4.3 Description of the data source (Caixeta et al, 2002) ................................55 6.4.4 Results for the slaughterhouse wastewater treatment ..............................56
7 CONCLUSIONS .................................................................................................57
8 REFERENCES ...................................................................................................58
v

1
1 INTRODUCTION
Water is one of the most valuable natural resources in the world. Unfortunately, it is being rapidly contaminated and urgent measures need to be taken for avoid its damage. In many countries, wastewater is released directly to lakes and rivers without treatment, and environmentally and economically feasible methods for wastewater treatment, are therefore, urgently needed.
A large number of technologies have been developed to achieve pollutant removal from wastewater. Both aerobic and anaerobic wastewater treatment systems are currently in use. They can be seen as complementary to each other, since in some situations anaerobic systems can not fulfil the requirements of effluent quality. The aerobic treatment processes were predominant in the biological treatment of wastewater up to the seventies. Interest in anaerobic processes emerged 10-15 years later due to the increase in energy costs. The anaerobic treatment of wastewater does not consume energy but can even produce energy through methane generation. The two major advantages of anaerobic wastewater treatment, which explain its progress at the expense of the classic aerobic treatment, are less sludge growth and considerable energy saving.
The Up-flow Anaerobic Sludge Blanket (UASB) reactor is considered to be one of the most successful anaerobic systems, capable of forming dense aggregates by auto immobilisation and consequently allowing high-rate reactor performance (Kaluzhnyi et al, 2006). Its primary use is in the treatment of high concentration industrial wastewaters, but it can be also used in the treatment of municipal wastewater which has a lower contaminant strength (Leitão, 2004). Because of its simple design, easy construction and maintenance, low operating cost and ability to withstand fluctuations in pH, temperature and influent substrate concentration, it has gained in popularity (Alvarez et al, 2006).
The UASB technology was developed for wastewater treatment in the past 20 years. It is especially attractive in tropical countries where the relatively high ambient temperature is close to the optimum for the mesophilic methanogenic bacteria (Leitão, 2004). During this period, a significant effort was made to understand the mass transfer and kinetic processes taking place inside the anaerobic reactor (Chou et al, 2004; Gonzalez-Gill et al, 2001; Gonzalez-Gill et al, 2002; Peña et al, 2006). The modelling of anaerobic digestion has also been an active research area in the last decade.
Different models have been proposed to describe the complex processes in the microbial ecosystem of a UASB reactor, the flow pattern inside the system, and the reaction kinetics within the biological granule. It was found that hydraulics, degradation kinetics, and diffusion processes play important roles in the degradation of the wastewater. Using the diffusion concept, the concentration of solid particle along the blanket height was determined by Narnoli and Mehrotra (1996). The results of this work make it possible to determine the reactor height for optimum removal. Zeng et al (2005) contributed to the development of a comprehensive model taking into account both the hydraulics and biokinetics of the anaerobic process. They found
that the dispersion coefficient is proportional to the reactor height raised to a constant power and is almost a linear function of the up-flow velocity. An integrated dispersed plug flow model was developed by Kaluzhnyi et al (2006), taking into account the granular sludge formation along the reactor height and based on a balance between dispersion, sedimentation, and convection processes. The model validated with a results from an experimental study on the treatment of high strength cheese whey in a UASB reactor demonstrates that sludge settlability and the growth characteristics of both protein-degrading and acetotrophic bacteria are the most important factors influencing on the output of the model.
Most of the models proposed in the literature are for steady state conditions in the reactor. However, Vlyssides et al (2007) proposed a dynamic model for transient conditions that can be used to assist in the operation of biogas plants.
With regard to the processes inside the granules, models using multilayer or homogeneous granule structures have been proposed; the reaction is described by first order and zero order reaction rates based mainly on the Monod kinetics model (Tartakovsky and Guiot 1997; Perez et al, 2005). The influence of the granular size was evaluated by Wu and Hickey (1997); according to them, the response of the UASB reactor is very sensitive to the granule size.
In Nicaragua, the extent of wastewater treatment is still very small. However, the discharge of untreated wastewater to the environment is diminishing. Nowadays, there are more than 30 small treatment plants for municipal wastewater (ENACAL, 2007). Oxidation lagoons, septic tanks, and Imhoff tanks are commonly used in many locations throughout Latin America including Nicaragua (CEPIS-OPS-OMS, 2000). Recent wastewater treatment plants are combinations of an Imhoff tank with an up flow anaerobic filter or septic tank; some Up-flow Anaerobic Sludge Blanket (UASB) reactors have also been constructed.
In the Nicaraguan capital, Managua city, a large aerobic wastewater treatment plant for municipal residues is under construction. In private urbanizations, several small and medium UASB reactors have been built. Unfortunately, these facilities do not perform properly due to a lack of control and monitoring.
However, the continuous raises in the number of wastewater treatment plants create a problem of sludge disposal, which cannot be ignored. Alternative uses for the sludge should be found before it becomes a public health concern.
1.1 Objectives The general objective of this work has been to study the processes occurring in the up- flow anaerobic blanket (UASB) reactor and to develop a model that can predict its dynamic behaviour, which could be used to improve the performance of existing systems and to help in the design of new facilities. At present, the model parameters have been calculated using data from the literature, but we plan to make experimental measurements of the main parameters (e.g., dispersion, reaction kinetics, sludge generation).
2
2 ANAEROBIC PROCESS
The final objective of the biological treatment of wastewater is the transformation of dissolved and particulate organic constituents into acceptable end products such as carbon dioxide, methane and new organic materials. Suspended and non-settleable colloidal solids and micro-organisms are incorporated into a biological floc or biofilm. Nutrients such as nitrogen and phosphorus are transformed or removed during the treatment due biochemical reactions. In industrial wastewater, some of the constituents may be toxic to microorganisms, so some type of pre-treatment could be required prior to the biological treatment.
The removal and stabilization of dissolved and particulate carbonaceous organic matter found in wastewater are carried out biologically using a variety of micro-organisms, principally bacteria. In anaerobic digestion, these micro-organisms convert organic matter into simple end products and additional biomass following the general equation for anaerobic biological degradation (Romero, 1999):
organic matter + nutrients new cells + CH4 + CO2 Bacteria
Anaerobic digestion is one of the oldest technologies for stabilising wastewaters and sludge. It has been applied since the end of the 19th century, mainly for the treatment of household waste (water) in septic tanks, for the treatment of slurries in digesters and for the treatment of sewage sludge in municipal treatment plants.
The interest in the use of anaerobic treatment processes can be addressed by considering the advantages and disadvantages of these processes. The principal advantages of the anaerobic treatment are the fact that the process is net energy producer instead of an energy user, its low biomass production, the low nutrient requirements and the high volumetric loadings possible. The disadvantages of the anaerobic compared with anaerobic processes are mainly operational considerations, such as long start up time, the possible need to neutralize the acidity by adding alkali; and that further treatment may be required, e.g. effluent polishing to improve the quality of the treated water (Tchobanoglous, 2003).
2.1 Classification of Anaerobic Types of Treatments The principal biological processes used for anaerobic wastewater treatment can be divided into two main groups: suspended growth and attached growth (or biofilm) processes. The operation of these processes depends on the performance of the micro-organisms, the specific reactions and their reaction kinetics, the need for nutrients, and other environmental factors affecting their behaviour (Tchobanoglous, 2003).
2.1.1 Suspended growth treatment processes In suspended growth systems, the bacteria are suspended in the digester through some kind of mixing. Three types of anaerobic suspended growth treatment processes are known: (1) the complete-mix suspended growth anaerobic digester, (2) the anaerobic contact process, and (3) the anaerobic sequencing batch reactor. In the completely mixed anaerobic reactor it is not possible to recycle and concentrate of the biomass, so the sludge retention time (SRT) is the same as the hydraulic retention time (HRT).
3
This type of process is suitable for particulate, colloidal and soluble wastes, and even toxic wastes may be handled after dilution. A disadvantage of this method is the requirement of a large digester volume, to provide the necessary SRT (Gerardi, 2003). In the anaerobic contact processes, the sludge is separated from treated water and can be recycled (return) to the tank, so that the SRT is longer than the HRT and the reactor volume can be reduced. In the anaerobic sequencing batch reactor (ASBR), the reaction and the solid-liquid separation occur in the same tank; four steps take place during the operation of an ASBR: feed, reaction, settling and effluent withdrawal by decanting (Tchobanoglous, 2003). The removal efficiency of an ASBR reactor depends on the development of a good settling granulated sludge.
The up-flow anaerobic sludge blanket reactor (UASB) is one of the most notable developments in anaerobic treatment process technology, regarding suspended growth processes. It was proposed in the late 1970s in the Netherlands by Lettinga and his co-workers. The success of the UASB process lies in the formation of a dense granulated sludge. The solid concentration can range from 50 to 100 g/L at the bottom of the reactor and from 5 to 40 g/L at the top. A well developed sludge blanket allows the use of higher volumetric COD loadings than other anaerobic processes (Lettinga et al, 1980).
The conventional UASB reactor concept showed severe limitations, mainly owing to problems related to mass transfer resistance and/or the existence of concentration gradients inside the systems. If the biogas production rate drops, e.g. for low-strength or cold wastewater, the degree of mixing must be raised hydraulically to ensure the required mass transfer (van Lier et al, 2001).
2.1.2 Attached growth anaerobic treatment reactors Attached growth anaerobic treatment reactors can be divided into two groups: with up flow and down flow of treated water. Up flow attached growth anaerobic treatment reactors differ in the type of packing and the degree of bed expansion. Down flow attached growth reactors differ only in the packing material used and these can be random or tubular plastic.
There are three types of up flow attached growth processes: 1) The up flow packed bed reactor, where the pack material is fixed and the wastewater flows between the packing covered by the biofilm. The packing material can be rock or synthetic plastic. 2) The anaerobic expanded bed reactor (AEBR) which uses a fine-grain sand to support the biofilm growth. Recycling is used to provide up flow velocities, and the bed expansion may reach 20 percent of the original volume. 3) The fluidized-bed reactor (FBR), in which fluidization and mixing of the packing material occurs. The FBR is operated at high up flow liquid velocities of about 20m/h and provides about 100 percent bed expansion (Tchobanoglous, 2003).
2.2 Anaerobic Digestion Until relatively recently, the study of the microbiological degradability of organic pollutants was focused on aerobic systems. This is evident in the widespread use of the BOD test (Biochemical Oxygen Demand) as an index of the organic pollution potential of domestic, industrial and agricultural wastewaters. It had been commonly
4
assumed that organic contaminants, which could be aerobically biodegraded, in anaerobic ecosystems would be accumulated since no degradation would be occur. More recent laboratory investigations of the organic degradability potential of pure cultures or consortia of anaerobic microorganisms have indicated that anaerobic species are much more metabolically versatile than was previously believed (Colleran and Pender, 2002)
Anaerobic microorganisms survive and degrade substrates most efficiently when the oxidation-reduction potential (ORP) of their environment is between -400 and -200 mV. Even small amounts of dissolved oxygen in an anaerobic digester increase the ORP of the sludge and reduce the anaerobic activity. Sludge and wastewaters fed to an anaerobic reactor should therefore contain no molecular oxygen. Settled and thickened sludge usually have no the residual dissolved oxygen. These sludges typically have a low ORP (-300 to -100 mV) (Gerardi, 2003)
Anaerobic digestion is a complex biogenic process involving a large number of microbial populations, which are often linked by their individual substrates and products.
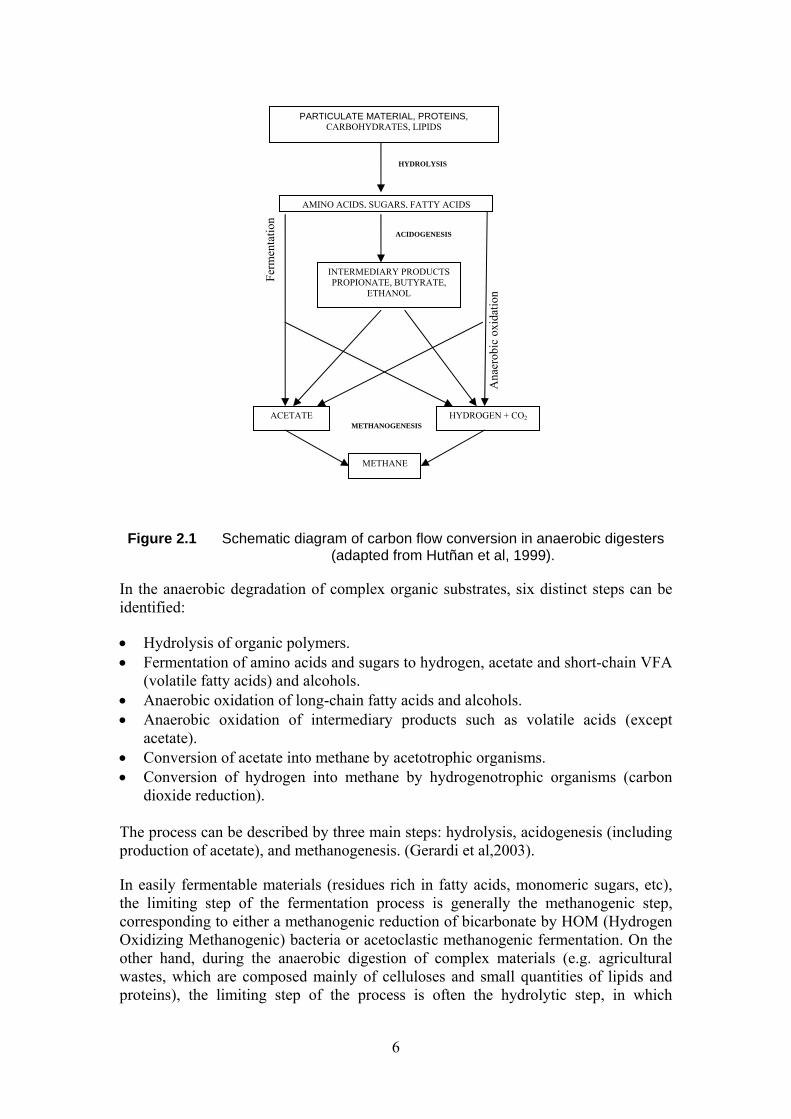
Methanogen has a limited substrate range, so in order to achieve the degradation of the variety of organic components present in a wastewater, a coordinated and sequential process should take place, where the complex substrate is converted into a simple intermediate products, as shown in Figure 2.1.
The first group of organisms of anaerobic digestion is hydrolytic fermentative (acidogenic) bacteria. These bacteria hydrolyze the complex polymers to organic acids, alcohols, sugar, hydrogen, and carbon dioxide. The second group convert the fermentation products of the previous step into acetate and carbon dioxide; the microbial community involved in this process are hydrogen producing and acetogenic organisms. The third group is the methanogens, they convert simple compounds (acetic acid, methanol, and carbon dioxide plus hydrogen) into methane (Hutñan et al, 1999).
5
Ana
erob
ic o
xida
tion
Ferm
enta
tion
AMINO ACIDS, SUGARS, FATTY ACIDS
HYDROLYSIS
INTERMEDIARY PRODUCTS PROPIONATE, BUTYRATE,
ETHANOL
ACETATE HYDROGEN + CO2
METHANE
METHANOGENESIS
ACIDOGENESIS
PARTICULATE MATERIAL, PROTEINS, CARBOHYDRATES, LIPIDS
Figure 2.1 Schematic diagram of carbon flow conversion in anaerobic digesters (adapted from Hutñan et al, 1999).
In the anaerobic degradation of complex organic substrates, six distinct steps can be identified:
• Hydrolysis of organic polymers. • Fermentation of amino acids and sugars to hydrogen, acetate and short-chain VFA
(volatile fatty acids) and alcohols. • Anaerobic oxidation of long-chain fatty acids and alcohols. • Anaerobic oxidation of intermediary products such as volatile acids (except
acetate). • Conversion of acetate into methane by acetotrophic organisms. • Conversion of hydrogen into methane by hydrogenotrophic organisms (carbon
dioxide reduction). The process can be described by three main steps: hydrolysis, acidogenesis (including production of acetate), and methanogenesis. (Gerardi et al,2003).
In easily fermentable materials (residues rich in fatty acids, monomeric sugars, etc), the limiting step of the fermentation process is generally the methanogenic step, corresponding to either a methanogenic reduction of bicarbonate by HOM (Hydrogen Oxidizing Methanogenic) bacteria or acetoclastic methanogenic fermentation. On the other hand, during the anaerobic digestion of complex materials (e.g. agricultural wastes, which are composed mainly of celluloses and small quantities of lipids and proteins), the limiting step of the process is often the hydrolytic step, in which
6
polymeric materials split into smaller fragments or into their monomers (Soto et al, 1993).
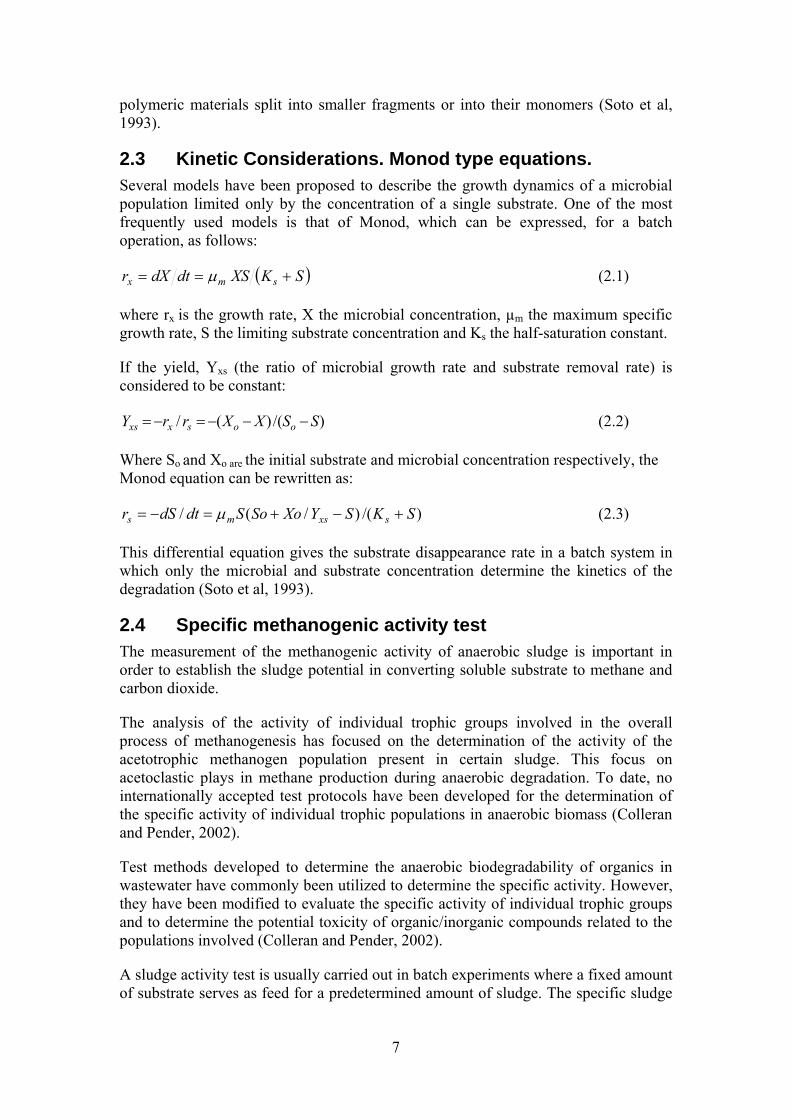
2.3 Kinetic Considerations. Monod type equations. Several models have been proposed to describe the growth dynamics of a microbial population limited only by the concentration of a single substrate. One of the most frequently used models is that of Monod, which can be expressed, for a batch operation, as follows:
( )SKXSdtdXr smx +== μ (2.1)
where rx is the growth rate, X the microbial concentration, µm the maximum specific growth rate, S the limiting substrate concentration and Ks the half-saturation constant.
If the yield, Yxs (the ratio of microbial growth rate and substrate removal rate) is considered to be constant:
)/()(/ SSXXrrY oosxxs −−−=−= (2.2)
Where So and Xo are the initial substrate and microbial concentration respectively, the Monod equation can be rewritten as:
)/()/(/ SKSYXoSoSdtdSr sxsms +−+=−= μ (2.3)
This differential equation gives the substrate disappearance rate in a batch system in which only the microbial and substrate concentration determine the kinetics of the degradation (Soto et al, 1993).
2.4 Specific methanogenic activity test The measurement of the methanogenic activity of anaerobic sludge is important in order to establish the sludge potential in converting soluble substrate to methane and carbon dioxide.
The analysis of the activity of individual trophic groups involved in the overall process of methanogenesis has focused on the determination of the activity of the acetotrophic methanogen population present in certain sludge. This focus on acetoclastic plays in methane production during anaerobic degradation. To date, no internationally accepted test protocols have been developed for the determination of the specific activity of individual trophic populations in anaerobic biomass (Colleran and Pender, 2002).
Test methods developed to determine the anaerobic biodegradability of organics in wastewater have commonly been utilized to determine the specific activity. However, they have been modified to evaluate the specific activity of individual trophic groups and to determine the potential toxicity of organic/inorganic compounds related to the populations involved (Colleran and Pender, 2002).
A sludge activity test is usually carried out in batch experiments where a fixed amount of substrate serves as feed for a predetermined amount of sludge. The specific sludge
7
activity is estimated from the methane production rate or the substrate depletion rate and the amount of sludge present.
The operational methodology applied in each case varies widely. Often, the procedure is established as a result of an empirical development based on previous experiments (Soto et al, 1993). A number of factors should be taken into account when planning the measurement of methanogenic activity, such as for example, pH, temperature, initial substrate concentration and inoculum size.
2.4.1 Test medium and other conditions Since anaerobic biodegradability tests require the growth of a microorganisms present in the test sludge, the medium used in these tests should provide all the inorganic nutrients required for growth. By contrast, the determination of the specific activity of anaerobic sludge should utilize a non-growth anaerobic medium in order to evaluate the “actual” activity of the population of microorganisms within the evaluated sample. It is very important to define the initial substrate concentrations utilized in the test: it should be sufficiently high to allow product formation, but it cannot be present at an inhibitory level concentration. The time of the test depends on the kind of sludge sample. The activity of the sludge from a high-rate industrial wastewater digester is higher than that of sewage sludge and the tests are generally accomplished within 1 to 2 weeks.
The pH of the environment is a key factor in the growth of organisms. Most bacteria cannot tolerate pH levels above 9.5 or below 4.0. Generally, the optimum pH for bacterial growth lies between 6.5 and 7.5.
Temperature. Since anaerobic digesters typically operate under mesophilic or thermophilic conditions, there is a need to define the conditions of sludge handling, storage etc. prior to carrying out biodegradability, activity or toxicity tests. Thermophilic reactor sludge is particularly susceptible to exposure to low temperatures. If the sludge sample is stored at a low temperature, activity tests may present long lag phases in order to achieve a re-acclimatisation of the sludge population to the thermophilic test temperature.
Initial substrate concentration. It is necessary for S be higher than the estimated values for Ks. A volatile fatty acids (VFA) mixture (acetic, propionic and butyric) is generally used, and their corresponding Ks values are within the range 0.05-0.2 g.l-1 (Henze and Harremoes, 1983). Soto et al (1993) proposed a VFA mixture concentration of 2.0, 0.5 and 0.5 g.1-1 of acetic, propionic and butyric acids respectively.
Inoculum size. The minimum inoculum size that allows the kinetic behaviour to be represented by a zero order model is derived from equation 2.3:
)(/0 SSYX oxs −>> and (2.4) sKS >>
From both conditions, the inoculum size can be calculated as:
xsoo YSX = (2.5)
8
That implies that for the measurement period (Soto et al., 1993). )( SSoSo −>>
For example, based on the data of Harper and Pohland (1986), the Yxs value for an acetoclastic culture enriched in Methanosarcina ssp is 0.04 g VSS.g-1 COD; if the initial acetate concentration is fixed to 2.0 g. l-1, the necessary inoculum size will be 0.08 g VSS (Methanosarcina ssp).l-1.
However, it must be kept in mind that only a fraction of the inoculated microorganisms will be able to produce methane. The maximum activity of the pure or enriched methanogenic cultures is about 10 g COD .g-1 VSS. day-1 (Harper and Pohland, 1986), while the observed activity in both industrial and laboratory digesters ranges between 0.1 and 1.0 g COD.g-1 VSS (Dolfing and Bloemen, 1985; Field et al., 1988).
The measurement of anaerobic sludge activity can be considered in two different ways: an overall measurement that gives information about the whole degradative activity or activity measurements for each stage of the process (Soto et al., 1993). The interest in and application of each of them is quite different. A methanogenic activity measurement (overall activity) allows, for instance, the selection of an adapted sludge to be used as inoculum in an anaerobic digester, whereas individual activity determinations of each stage make it possible to detect potential unbalanced situations among the different bacterial species or to determine the relative significance of the different steps of the process.
9

3 EXPERIMENTAL SECTION
In this chapter, we describe first the general state of the wastewater treatment in Nicaragua (paper I). Afterwards, the properties of the sludge generated in the plants are addressed regarding the possible utilization or disposal of the sludge, since the amount of that is continuously increasing and larger increases are expected in the future (Paper II).
In addition, a study concerning the methanogenic activity and sludge properties in several plants was performed for two reasons: a) several of the treatment plants in Nicaragua are not working in an appropriate way and only few of them where evaluated in past; b) to improve the performance a methodology is required to make it possible to select existing sludge that could be used as innoculum of new or in operating plants (Paper III).
3.1 Introduction In Nicaragua only a small portion of all the wastewater produced is treated. According to the Nicaraguan Institute of Aqueducts and Sewage (ENACAL), only 12% of the cities which possess a system of potable water have municipal wastewater systems (ENACAL, Report, 2001). Although there exist 30 plants (not including small and medium private domestic facilities) for treating mixed wastewater, the capacity for water treatment is still not enough in the country. The city of Managua, which has 20% of the population of Nicaragua, has a sanitary sewage system, but it still does not have a wastewater treatment system; all the liquid wastes are discharged into the Xolotlan Lake. By the end of 2008, the inauguration of a large wastewater treatment plant in Managua is expected.
The existing municipal wastewater treatments units include stabilization lagoons, septic tanks, Imhoff tanks (Navarro, 2002) and the remaining facilities are two-step treatments: Imhoff following by up flow anaerobic filters (ENACAL, Report, 2002). Experimental stations for wastewater treatment by constructed wetlands are working in four small municipalities. Relatively recently, some industries have introduced treatment to meet the regulations established for the discharge of industrial wastewaters. Different anaerobic treatments, chemical coagulation, and activated sludge are the main technologies used by the industries to treat their effluents.
Information regarding the capacity and performance of the treatment plants is scarce and difficult to access. This information is partially presented in Paper 1. According to an evaluation made by Aragon (1997), almost all lagoons work outside the permissible level, the amount of the BOD and suspended solids being above the limit established by the Ministry of Environment and Natural Resources (MARENA).
The potential benefits of the anaerobic wastewater treatment make it a very attractive alternative for a developing country. The gas (methane) produced can be collected and utilised as an energy source. In addition, the small volume of sludge produced is stable and fixes nutrients, which may serve as fertilisers (Marin, 1999). This could be very convenient for developing the agriculture in a country like Nicaragua. The construction cost of UASB reactor is in the range of U$20-40 per capita (Sperling,
10
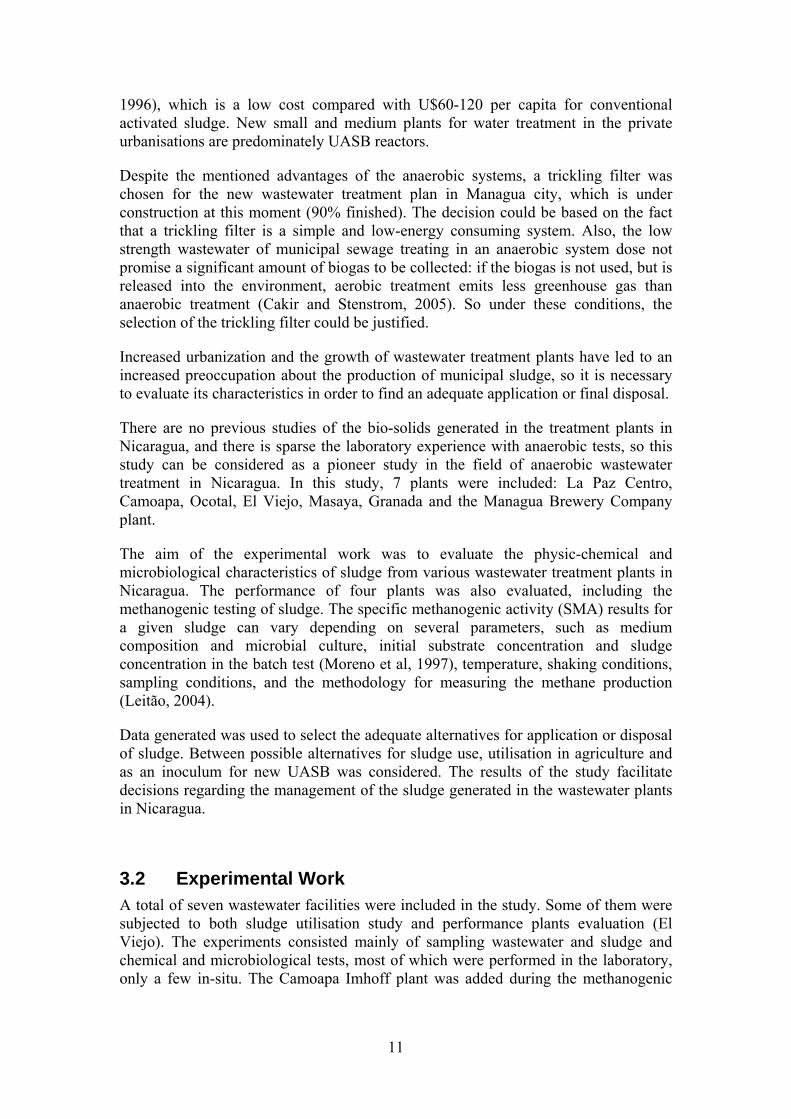
1996), which is a low cost compared with U$60-120 per capita for conventional activated sludge. New small and medium plants for water treatment in the private urbanisations are predominately UASB reactors.
Despite the mentioned advantages of the anaerobic systems, a trickling filter was chosen for the new wastewater treatment plan in Managua city, which is under construction at this moment (90% finished). The decision could be based on the fact that a trickling filter is a simple and low-energy consuming system. Also, the low strength wastewater of municipal sewage treating in an anaerobic system dose not promise a significant amount of biogas to be collected: if the biogas is not used, but is released into the environment, aerobic treatment emits less greenhouse gas than anaerobic treatment (Cakir and Stenstrom, 2005). So under these conditions, the selection of the trickling filter could be justified.
Increased urbanization and the growth of wastewater treatment plants have led to an increased preoccupation about the production of municipal sludge, so it is necessary to evaluate its characteristics in order to find an adequate application or final disposal.
There are no previous studies of the bio-solids generated in the treatment plants in Nicaragua, and there is sparse the laboratory experience with anaerobic tests, so this study can be considered as a pioneer study in the field of anaerobic wastewater treatment in Nicaragua. In this study, 7 plants were included: La Paz Centro, Camoapa, Ocotal, El Viejo, Masaya, Granada and the Managua Brewery Company plant.
The aim of the experimental work was to evaluate the physic-chemical and microbiological characteristics of sludge from various wastewater treatment plants in Nicaragua. The performance of four plants was also evaluated, including the methanogenic testing of sludge. The specific methanogenic activity (SMA) results for a given sludge can vary depending on several parameters, such as medium composition and microbial culture, initial substrate concentration and sludge concentration in the batch test (Moreno et al, 1997), temperature, shaking conditions, sampling conditions, and the methodology for measuring the methane production (Leitão, 2004).
Data generated was used to select the adequate alternatives for application or disposal of sludge. Between possible alternatives for sludge use, utilisation in agriculture and as an inoculum for new UASB was considered. The results of the study facilitate decisions regarding the management of the sludge generated in the wastewater plants in Nicaragua.
3.2 Experimental Work A total of seven wastewater facilities were included in the study. Some of them were subjected to both sludge utilisation study and performance plants evaluation (El Viejo). The experiments consisted mainly of sampling wastewater and sludge and chemical and microbiological tests, most of which were performed in the laboratory, only a few in-situ. The Camoapa Imhoff plant was added during the methanogenic
11
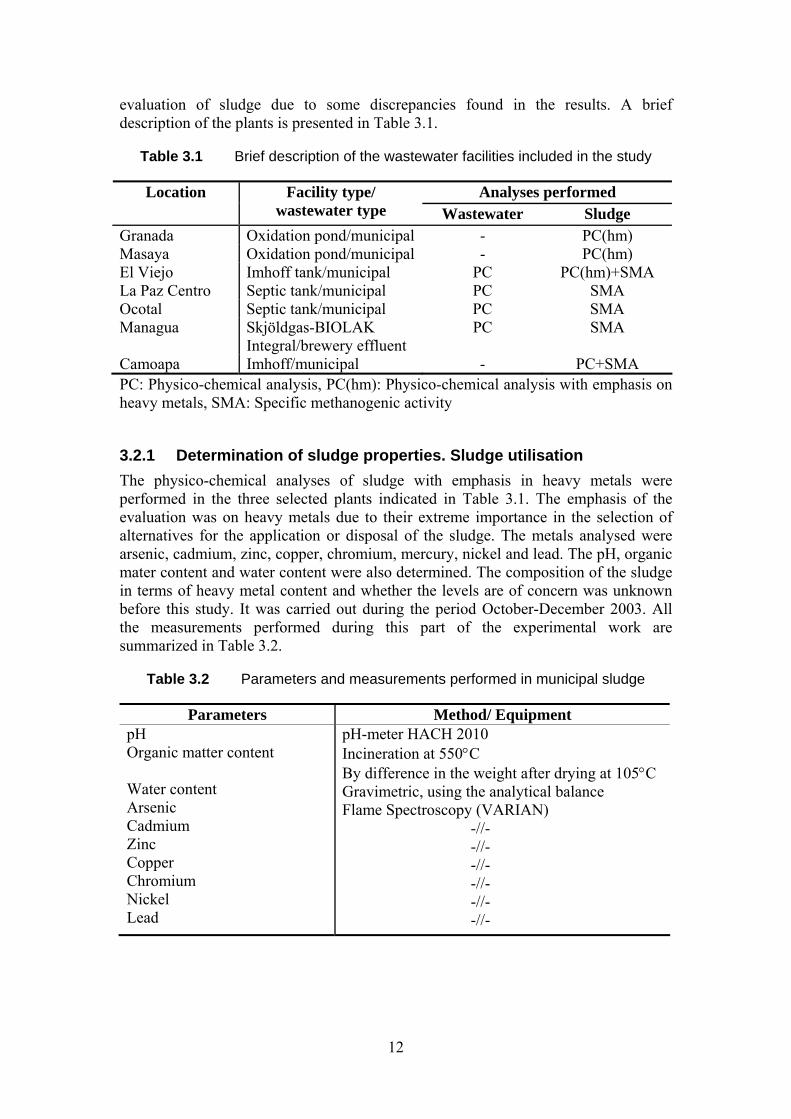
evaluation of sludge due to some discrepancies found in the results. A brief description of the plants is presented in Table 3.1.
Table 3.1 Brief description of the wastewater facilities included in the study
Analyses performed Location Facility type/ wastewater type Wastewater Sludge
Granada Oxidation pond/municipal - PC(hm) Masaya Oxidation pond/municipal - PC(hm) El Viejo Imhoff tank/municipal PC PC(hm)+SMA La Paz Centro Septic tank/municipal PC SMA Ocotal Septic tank/municipal PC SMA Managua Skjöldgas-BIOLAK
Integral/brewery effluent PC SMA
Camoapa Imhoff/municipal - PC+SMA PC: Physico-chemical analysis, PC(hm): Physico-chemical analysis with emphasis on heavy metals, SMA: Specific methanogenic activity
3.2.1 Determination of sludge properties. Sludge utilisation The physico-chemical analyses of sludge with emphasis in heavy metals were performed in the three selected plants indicated in Table 3.1. The emphasis of the evaluation was on heavy metals due to their extreme importance in the selection of alternatives for the application or disposal of the sludge. The metals analysed were arsenic, cadmium, zinc, copper, chromium, mercury, nickel and lead. The pH, organic mater content and water content were also determined. The composition of the sludge in terms of heavy metal content and whether the levels are of concern was unknown before this study. It was carried out during the period October-December 2003. All the measurements performed during this part of the experimental work are summarized in Table 3.2.
Table 3.2 Parameters and measurements performed in municipal sludge
Parameters Method/ Equipment pH Organic matter content Water content Arsenic Cadmium Zinc Copper Chromium Nickel Lead
pH-meter HACH 2010 Incineration at 550°C By difference in the weight after drying at 105°C Gravimetric, using the analytical balance Flame Spectroscopy (VARIAN)
-//- -//- -//- -//- -//- -//-
12
3.2.2 Characterization of wastewater and sludge. Treatment plant performance
Three municipal and one industrial (brewery) wastewater treatment plant were selected to evaluate their performance in terms of removal efficiency and sludge characterization. The municipal treatment plants included in this study were suggested by National Institute of Aqueduct and Sewage (ENACAL). The choice was based on the fact that these plants were relatively new and not subjected to any previous study describing integrally their performances. The brewery treatment plant was having problems in the organic matter removal; poor sludge formation in the plant was observed. Inoculation was considered as a possible solution to promote the sludge formation. This study lasted from January 2005- March 2006.
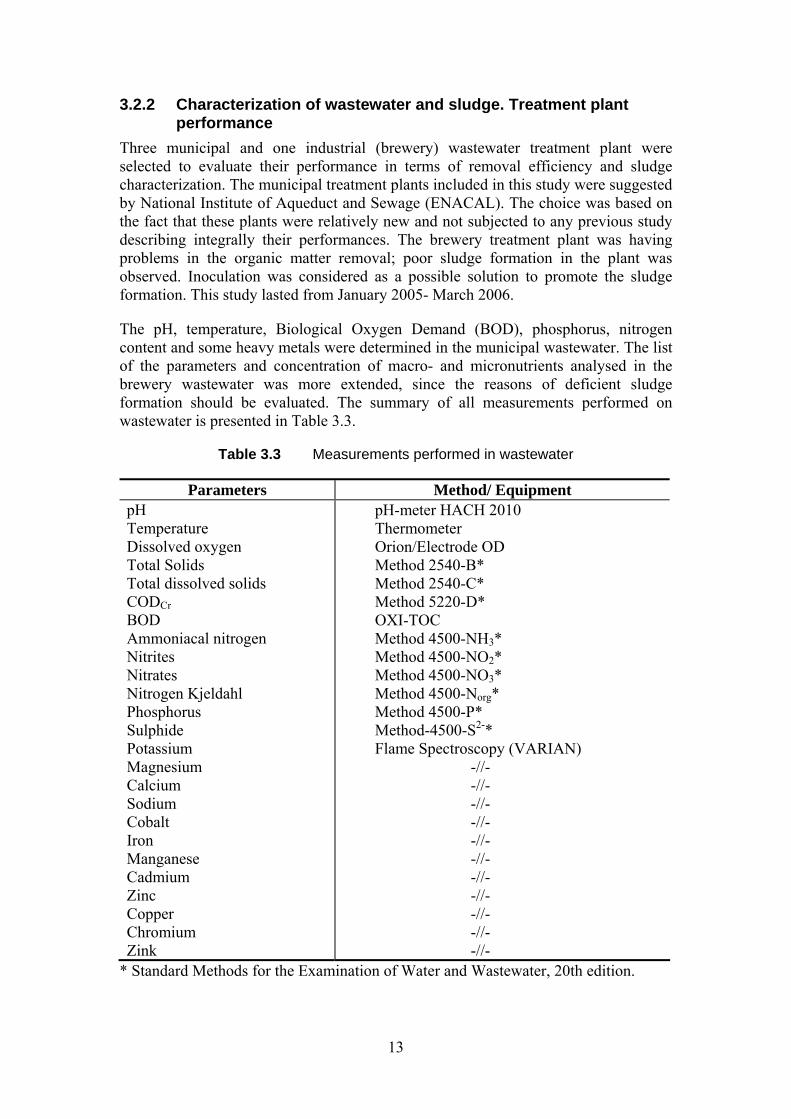
The pH, temperature, Biological Oxygen Demand (BOD), phosphorus, nitrogen content and some heavy metals were determined in the municipal wastewater. The list of the parameters and concentration of macro- and micronutrients analysed in the brewery wastewater was more extended, since the reasons of deficient sludge formation should be evaluated. The summary of all measurements performed on wastewater is presented in Table 3.3.
Table 3.3 Measurements performed in wastewater
Parameters Method/ Equipment pH Temperature Dissolved oxygen Total Solids Total dissolved solids CODCr BOD Ammoniacal nitrogen Nitrites Nitrates Nitrogen Kjeldahl Phosphorus Sulphide Potassium Magnesium Calcium Sodium Cobalt Iron Manganese Cadmium Zinc Copper Chromium Zink
pH-meter HACH 2010 Thermometer Orion/Electrode OD Method 2540-B* Method 2540-C* Method 5220-D* OXI-TOC Method 4500-NH3* Method 4500-NO2* Method 4500-NO3* Method 4500-Norg* Method 4500-P* Method-4500-S2-* Flame Spectroscopy (VARIAN)
-//- -//- -//- -//- -//- -//- -//- -//- -//- -//- -//-
* Standard Methods for the Examination of Water and Wastewater, 20th edition.
13

The laboratory experiments with sludge were carried out as follows: firstly, fresh sludge was studied with respect to density, temperature, Oxide-Reduction potential (ORP), pH, Volatile Suspended Solids (VSS) and Total Suspended Solids (TSS). Secondly, the methanogenic activity test was carried out.
Table 3.4 Measurements performed in sludge
Parameters Method/ Equipment pH Density Temperature RP VSS TSS VSS/TSS Arsenic Cadmium Zinc Copper Chromium Nickel Lead SMA
pH-meter HACH 2010 Gravimetric, using the analytical balance Thermometer Orion/Electrode ORP Triode Method 2540-D Method 2540-E
- Flame Spectroscopy (VARIAN)
-//- -//- -//- -//- -//- -//-
No standardised, experimental laboratory set
The samples of sludge were taken with a special device designed in the laboratory and then preserved in ice or refrigerator at 4°C while the analyses were being carried out. Physico-chemical measurements made in triplicate and methanogenic activity tests in duplicate. The chemicals used were reagent grade from Merck (Germany). The characteristics of the plants included in this study are shortly described in Table 3.1.
The treatment plant in the brewery is based on the Skjöldgas-BIOLAK Integral system that consists of anaerobic-aerobic stages with water recycling and a buffer basin for pH-neutralization and acidizing. The anaerobic process is integrated in a basin covered by a gas hood with a special plastic cover. The gas hood is blown up by the biogas produced in the system. Figure 3.1 shows a picture of the system.
Figure 3.1 Wastewater treatment system in the brewery plant
14

3.2.2.1 Methanogenic activity test The standardisation of the SMA test procedure is actually still under development, so the emphasis was on the establishment of the procedure for SMA determination in the laboratory. The selection of the sludge to be used as inoculum for the brewery plant was considered.
The SMA determination procedure was defined in the laboratory. It was based on the procedure described by Jawed (1999) as proposed by Soto et al. (1993) and is described below. The scheme and a photograph of the experimental set-up are shown in Figure 3.2 and Figure 3.3 respectively. The system for the methanogenic activity test consisted of six flasks submerged in a water bath with temperature control. The test was conducted at 35±2˚C. Continuous mixing of the sludge in the digestion flask was maintained using magnetic stirrers. A known amount of sludge (corresponding to a concentration of VSS = 1.5 g/l was transferred into a 500 ml serum bottle. The substrate solution was prepared with distilled water; oxygen was purged from each flask during 10 minutes with nitrogen gas. An appropriate quantity of substrate was used so as to obtain initial COD levels of about 2.5 g/l. The acetic acid neutralised by sodium the growth of biomass during the test period and for the sake of reproducibility of the experiments (Soto et al, 1993). The tests were made in duplicate. NaHCO3 was added to maintain the pH in a normal range of operation, 6.8-7.2. Direct methane gas production was measured using a Mariotte flask filled with 10% NaOH solution. The method is based on the liquid displacement.
Figure 3.2 Scheme of methanogenic activity test set-up
The methanogenic activity was calculated on the basis of the product formation, i.e. methane, and expressed as g CH4-COD per g VSS per day as follows:
dtCHdV
fVSMA
RVSS
)(1 4
)(ρ= (5.1)
where V(CH4) is the cumulative methane production [ml], ρ(VSS) is the density of the sludge [gml-1], t is time [day], VR is the useful reactor volume [ml], and f is a
15
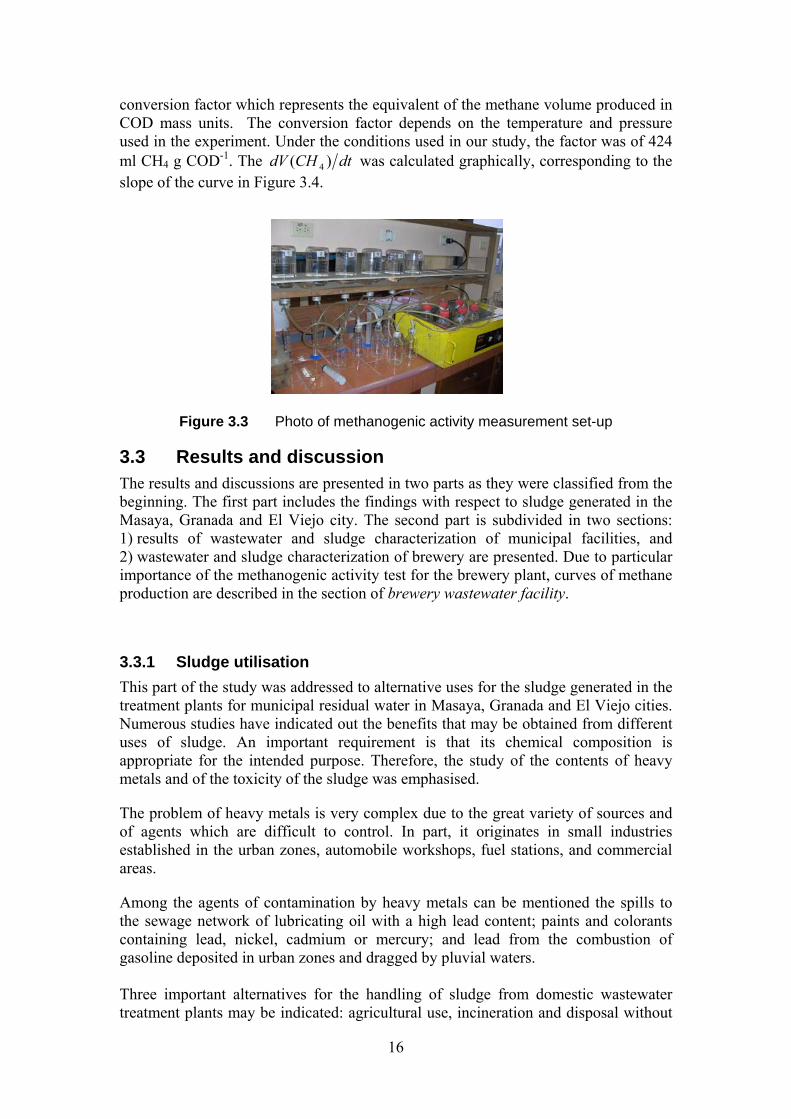
conversion factor which represents the equivalent of the methane volume produced in COD mass units. The conversion factor depends on the temperature and pressure used in the experiment. Under the conditions used in our study, the factor was of 424 ml CH4 g COD-1. The dtCHdV )( 4 was calculated graphically, corresponding to the slope of the curve in Figure 3.4.
Figure 3.3 Photo of methanogenic activity measurement set-up
3.3 Results and discussion The results and discussions are presented in two parts as they were classified from the beginning. The first part includes the findings with respect to sludge generated in the Masaya, Granada and El Viejo city. The second part is subdivided in two sections: 1) results of wastewater and sludge characterization of municipal facilities, and 2) wastewater and sludge characterization of brewery are presented. Due to particular importance of the methanogenic activity test for the brewery plant, curves of methane production are described in the section of brewery wastewater facility.
3.3.1 Sludge utilisation This part of the study was addressed to alternative uses for the sludge generated in the treatment plants for municipal residual water in Masaya, Granada and El Viejo cities. Numerous studies have indicated out the benefits that may be obtained from different uses of sludge. An important requirement is that its chemical composition is appropriate for the intended purpose. Therefore, the study of the contents of heavy metals and of the toxicity of the sludge was emphasised.
The problem of heavy metals is very complex due to the great variety of sources and of agents which are difficult to control. In part, it originates in small industries established in the urban zones, automobile workshops, fuel stations, and commercial areas.
Among the agents of contamination by heavy metals can be mentioned the spills to the sewage network of lubricating oil with a high lead content; paints and colorants containing lead, nickel, cadmium or mercury; and lead from the combustion of gasoline deposited in urban zones and dragged by pluvial waters. Three important alternatives for the handling of sludge from domestic wastewater treatment plants may be indicated: agricultural use, incineration and disposal without
16
any exploitation of its potentialities as spill to the sea, landfill or other sludge disposal options.
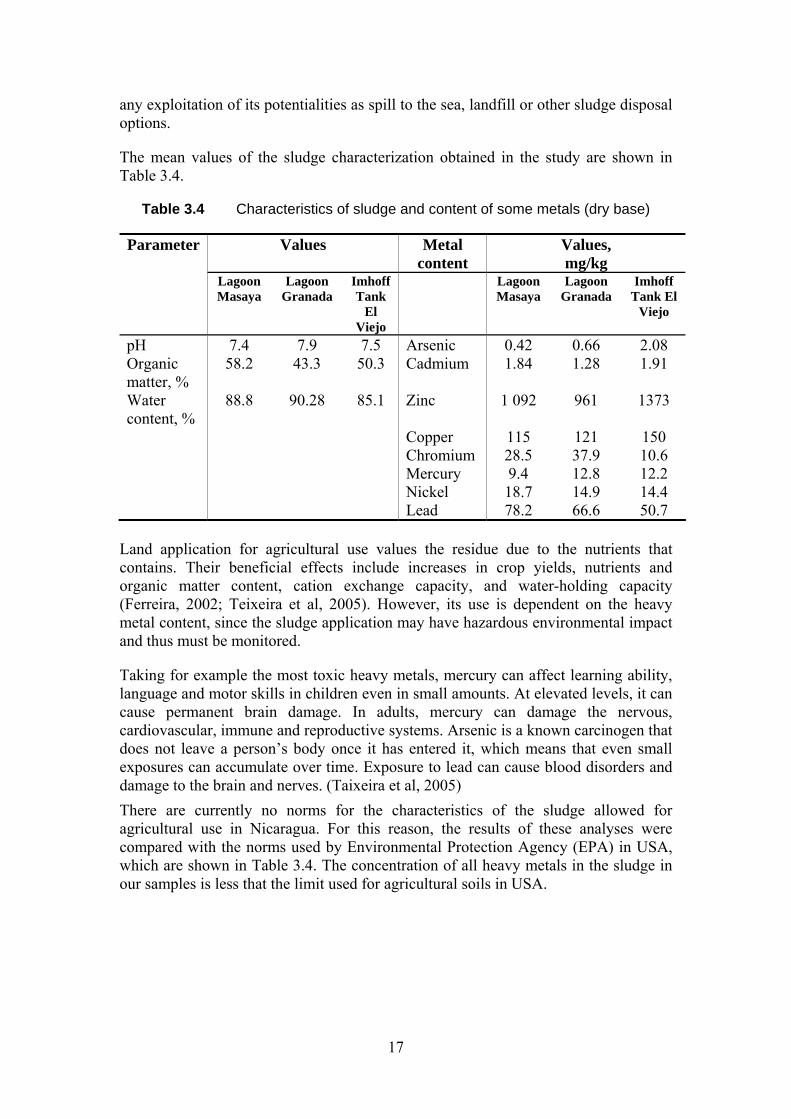
The mean values of the sludge characterization obtained in the study are shown in Table 3.4.
Table 3.4 Characteristics of sludge and content of some metals (dry base)
Parameter Values Metal content
Values, mg/kg
Lagoon Masaya
Lagoon Granada
Imhoff Tank
El Viejo
Lagoon Masaya
Lagoon Granada
Imhoff Tank El
Viejo
pH 7.4 7.9 7.5 Arsenic 0.42 0.66 2.08 Organic matter, %
58.2 43.3 50.3 Cadmium 1.84 1.28 1.91
Water content, %
88.8 90.28 85.1 Zinc 1 092 961 1373
Copper 115 121 150 Chromium 28.5 37.9 10.6 Mercury 9.4 12.8 12.2 Nickel 18.7 14.9 14.4 Lead 78.2 66.6 50.7
Land application for agricultural use values the residue due to the nutrients that contains. Their beneficial effects include increases in crop yields, nutrients and organic matter content, cation exchange capacity, and water-holding capacity (Ferreira, 2002; Teixeira et al, 2005). However, its use is dependent on the heavy metal content, since the sludge application may have hazardous environmental impact and thus must be monitored.
Taking for example the most toxic heavy metals, mercury can affect learning ability, language and motor skills in children even in small amounts. At elevated levels, it can cause permanent brain damage. In adults, mercury can damage the nervous, cardiovascular, immune and reproductive systems. Arsenic is a known carcinogen that does not leave a person’s body once it has entered it, which means that even small exposures can accumulate over time. Exposure to lead can cause blood disorders and damage to the brain and nerves. (Taixeira et al, 2005) There are currently no norms for the characteristics of the sludge allowed for agricultural use in Nicaragua. For this reason, the results of these analyses were compared with the norms used by Environmental Protection Agency (EPA) in USA, which are shown in Table 3.4. The concentration of all heavy metals in the sludge in our samples is less that the limit used for agricultural soils in USA.
17
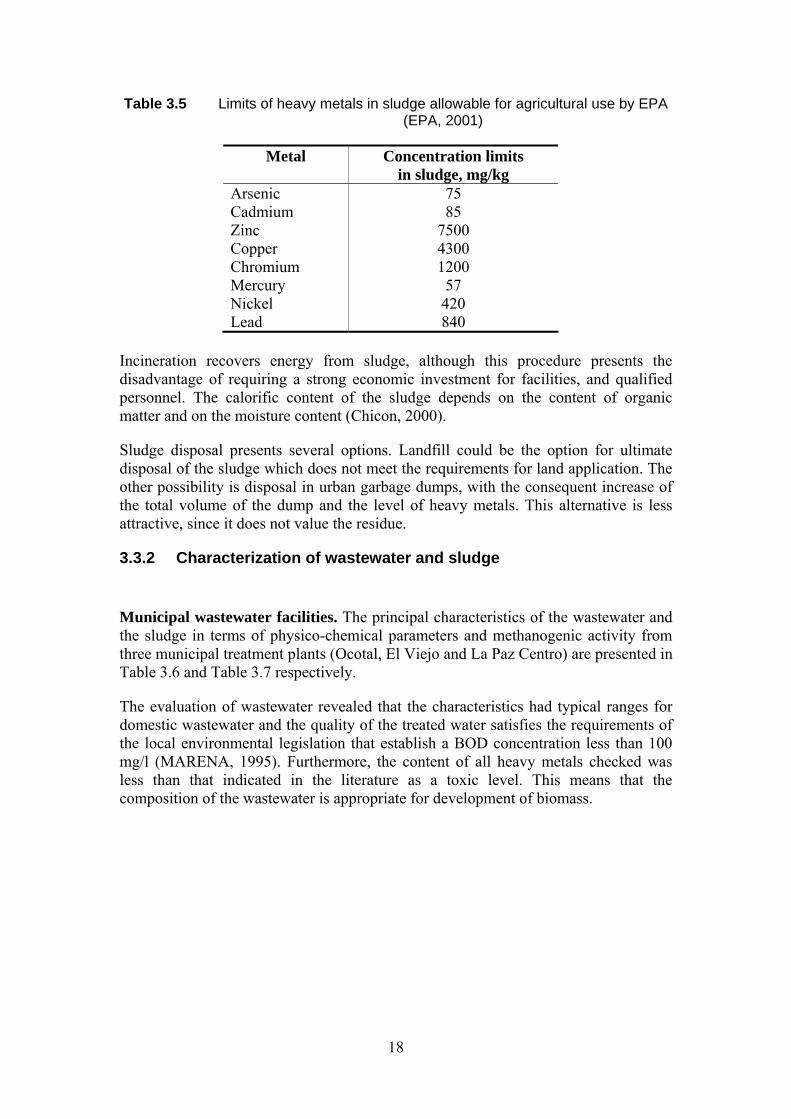
Table 3.5 Limits of heavy metals in sludge allowable for agricultural use by EPA (EPA, 2001)
Metal
Concentration limits in sludge, mg/kg
Arsenic 75 Cadmium 85 Zinc 7500 Copper 4300 Chromium 1200 Mercury 57 Nickel 420 Lead 840
Incineration recovers energy from sludge, although this procedure presents the disadvantage of requiring a strong economic investment for facilities, and qualified personnel. The calorific content of the sludge depends on the content of organic matter and on the moisture content (Chicon, 2000).
Sludge disposal presents several options. Landfill could be the option for ultimate disposal of the sludge which does not meet the requirements for land application. The other possibility is disposal in urban garbage dumps, with the consequent increase of the total volume of the dump and the level of heavy metals. This alternative is less attractive, since it does not value the residue.
3.3.2 Characterization of wastewater and sludge
Municipal wastewater facilities. The principal characteristics of the wastewater and the sludge in terms of physico-chemical parameters and methanogenic activity from three municipal treatment plants (Ocotal, El Viejo and La Paz Centro) are presented in Table 3.6 and Table 3.7 respectively.
The evaluation of wastewater revealed that the characteristics had typical ranges for domestic wastewater and the quality of the treated water satisfies the requirements of the local environmental legislation that establish a BOD concentration less than 100 mg/l (MARENA, 1995). Furthermore, the content of all heavy metals checked was less than that indicated in the literature as a toxic level. This means that the composition of the wastewater is appropriate for development of biomass.
18
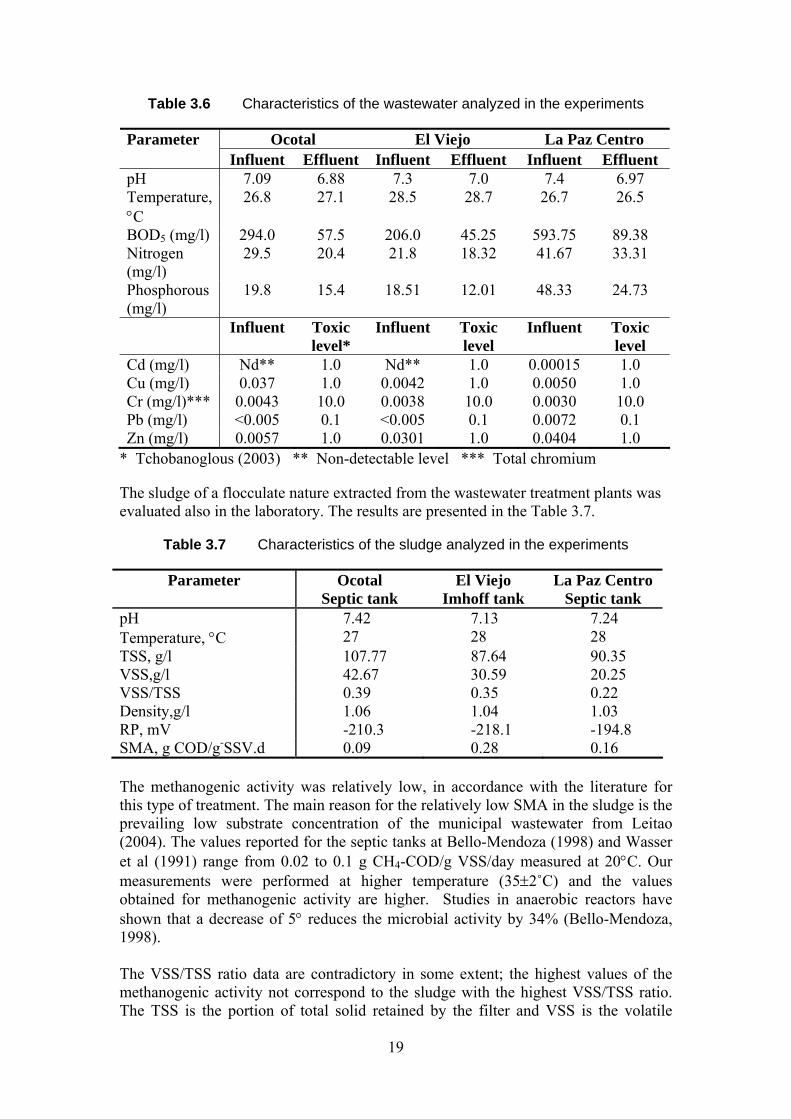
Table 3.6 Characteristics of the wastewater analyzed in the experiments
Ocotal El Viejo La Paz Centro Parameter Influent Effluent Influent Effluent Influent Effluent
pH 7.09 6.88 7.3 7.0 7.4 6.97 Temperature, °C
26.8 27.1 28.5 28.7 26.7 26.5
BOD5 (mg/l) 294.0 57.5 206.0 45.25 593.75 89.38 Nitrogen (mg/l)
29.5 20.4 21.8 18.32 41.67 33.31
Phosphorous (mg/l)
19.8 15.4 18.51 12.01 48.33 24.73
Influent Toxic level*
Influent Toxic level
Influent Toxic level
Cd (mg/l) Nd** 1.0 Nd** 1.0 0.00015 1.0 Cu (mg/l) 0.037 1.0 0.0042 1.0 0.0050 1.0 Cr (mg/l)*** 0.0043 10.0 0.0038 10.0 0.0030 10.0 Pb (mg/l) <0.005 0.1 <0.005 0.1 0.0072 0.1 Zn (mg/l) 0.0057 1.0 0.0301 1.0 0.0404 1.0
* Tchobanoglous (2003) ** Non-detectable level *** Total chromium
The sludge of a flocculate nature extracted from the wastewater treatment plants was evaluated also in the laboratory. The results are presented in the Table 3.7.
Table 3.7 Characteristics of the sludge analyzed in the experiments
Parameter Ocotal Septic tank
El Viejo Imhoff tank
La Paz Centro Septic tank
pH 7.42 7.13 7.24 Temperature, °C 27 28 28 TSS, g/l 107.77 87.64 90.35 VSS,g/l 42.67 30.59 20.25 VSS/TSS 0.39 0.35 0.22 Density,g/l 1.06 1.04 1.03 RP, mV -210.3 -218.1 -194.8 SMA, g COD/g-SSV.d 0.09 0.28 0.16 The methanogenic activity was relatively low, in accordance with the literature for this type of treatment. The main reason for the relatively low SMA in the sludge is the prevailing low substrate concentration of the municipal wastewater from Leitao (2004). The values reported for the septic tanks at Bello-Mendoza (1998) and Wasser et al (1991) range from 0.02 to 0.1 g CH4-COD/g VSS/day measured at 20°C. Our measurements were performed at higher temperature (35±2˚C) and the values obtained for methanogenic activity are higher. Studies in anaerobic reactors have shown that a decrease of 5° reduces the microbial activity by 34% (Bello-Mendoza, 1998). The VSS/TSS ratio data are contradictory in some extent; the highest values of the methanogenic activity not correspond to the sludge with the highest VSS/TSS ratio. The TSS is the portion of total solid retained by the filter and VSS is the volatile
19
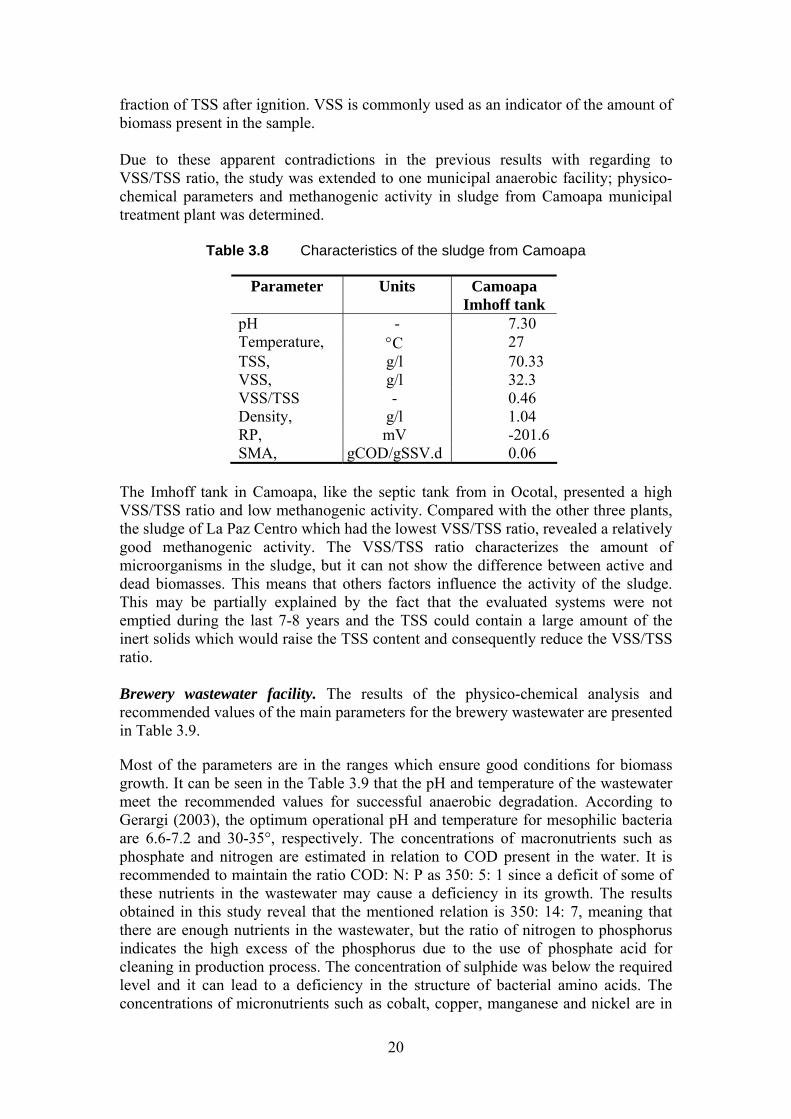
fraction of TSS after ignition. VSS is commonly used as an indicator of the amount of biomass present in the sample. Due to these apparent contradictions in the previous results with regarding to VSS/TSS ratio, the study was extended to one municipal anaerobic facility; physico-chemical parameters and methanogenic activity in sludge from Camoapa municipal treatment plant was determined.
Table 3.8 Characteristics of the sludge from Camoapa
Parameter Units Camoapa Imhoff tank
pH - 7.30 Temperature, °C 27 TSS, g/l 70.33 VSS, g/l 32.3 VSS/TSS - 0.46 Density, g/l 1.04 RP, mV -201.6SMA, gCOD/gSSV.d 0.06
The Imhoff tank in Camoapa, like the septic tank from in Ocotal, presented a high VSS/TSS ratio and low methanogenic activity. Compared with the other three plants, the sludge of La Paz Centro which had the lowest VSS/TSS ratio, revealed a relatively good methanogenic activity. The VSS/TSS ratio characterizes the amount of microorganisms in the sludge, but it can not show the difference between active and dead biomasses. This means that others factors influence the activity of the sludge. This may be partially explained by the fact that the evaluated systems were not emptied during the last 7-8 years and the TSS could contain a large amount of the inert solids which would raise the TSS content and consequently reduce the VSS/TSS ratio. Brewery wastewater facility. The results of the physico-chemical analysis and recommended values of the main parameters for the brewery wastewater are presented in Table 3.9.
Most of the parameters are in the ranges which ensure good conditions for biomass growth. It can be seen in the Table 3.9 that the pH and temperature of the wastewater meet the recommended values for successful anaerobic degradation. According to Gerargi (2003), the optimum operational pH and temperature for mesophilic bacteria are 6.6-7.2 and 30-35°, respectively. The concentrations of macronutrients such as phosphate and nitrogen are estimated in relation to COD present in the water. It is recommended to maintain the ratio COD: N: P as 350: 5: 1 since a deficit of some of these nutrients in the wastewater may cause a deficiency in its growth. The results obtained in this study reveal that the mentioned relation is 350: 14: 7, meaning that there are enough nutrients in the wastewater, but the ratio of nitrogen to phosphorus indicates the high excess of the phosphorus due to the use of phosphate acid for cleaning in production process. The concentration of sulphide was below the required level and it can lead to a deficiency in the structure of bacterial amino acids. The concentrations of micronutrients such as cobalt, copper, manganese and nickel are in
20
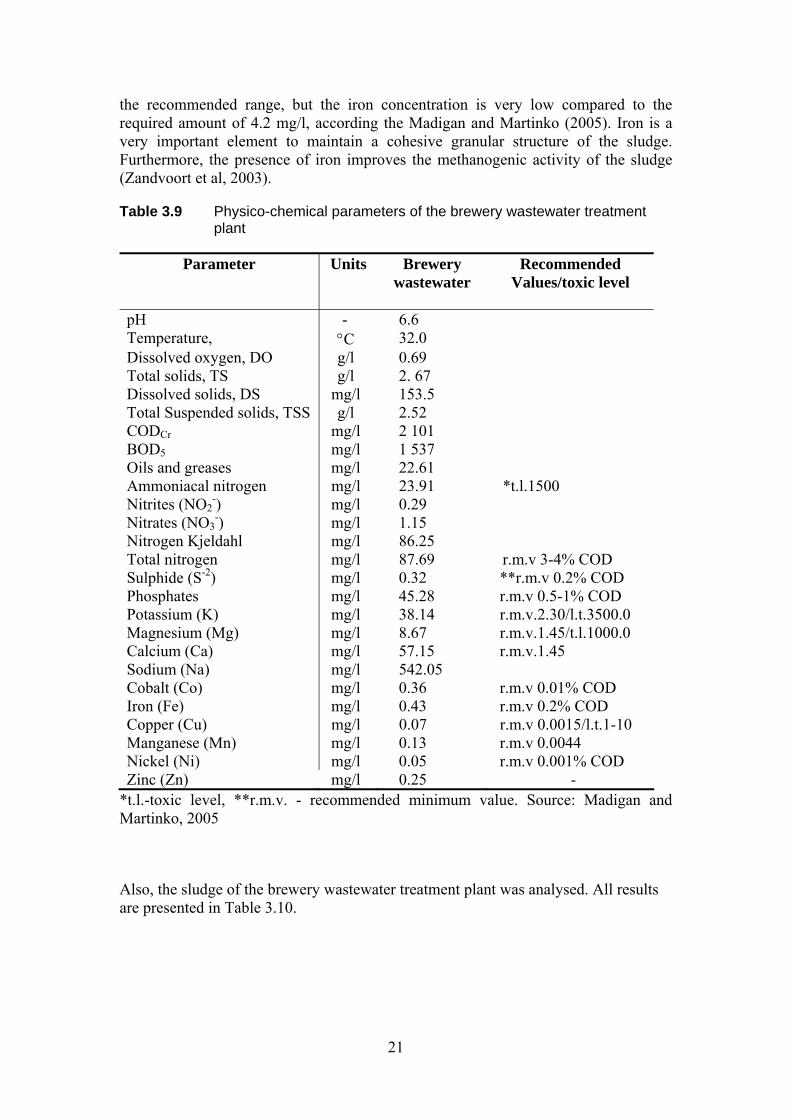
the recommended range, but the iron concentration is very low compared to the required amount of 4.2 mg/l, according the Madigan and Martinko (2005). Iron is a very important element to maintain a cohesive granular structure of the sludge. Furthermore, the presence of iron improves the methanogenic activity of the sludge (Zandvoort et al, 2003).
Table 3.9 Physico-chemical parameters of the brewery wastewater treatment plant
Parameter Units Brewery wastewater
Recommended Values/toxic level
pH - 6.6 Temperature, °C 32.0 Dissolved oxygen, DO g/l 0.69 Total solids, TS g/l 2. 67 Dissolved solids, DS mg/l 153.5 Total Suspended solids, TSS g/l 2.52 CODCr mg/l 2 101 BOD5 mg/l 1 537 Oils and greases mg/l 22.61 Ammoniacal nitrogen mg/l 23.91 *t.l.1500 Nitrites (NO2
-) mg/l 0.29 Nitrates (NO3
-) mg/l 1.15 Nitrogen Kjeldahl mg/l 86.25 Total nitrogen mg/l 87.69 r.m.v 3-4% COD Sulphide (S-2) mg/l 0.32 **r.m.v 0.2% COD Phosphates mg/l 45.28 r.m.v 0.5-1% COD Potassium (K) mg/l 38.14 r.m.v.2.30/l.t.3500.0 Magnesium (Mg) mg/l 8.67 r.m.v.1.45/t.l.1000.0 Calcium (Ca) mg/l 57.15 r.m.v.1.45 Sodium (Na) mg/l 542.05 Cobalt (Co) mg/l 0.36 r.m.v 0.01% COD Iron (Fe) mg/l 0.43 r.m.v 0.2% COD Copper (Cu) mg/l 0.07 r.m.v 0.0015/l.t.1-10 Manganese (Mn) mg/l 0.13 r.m.v 0.0044 Nickel (Ni) mg/l 0.05 r.m.v 0.001% COD Zinc (Zn) mg/l 0.25 -
*t.l.-toxic level, **r.m.v. - recommended minimum value. Source: Madigan and Martinko, 2005
Also, the sludge of the brewery wastewater treatment plant was analysed. All results are presented in Table 3.10.
21
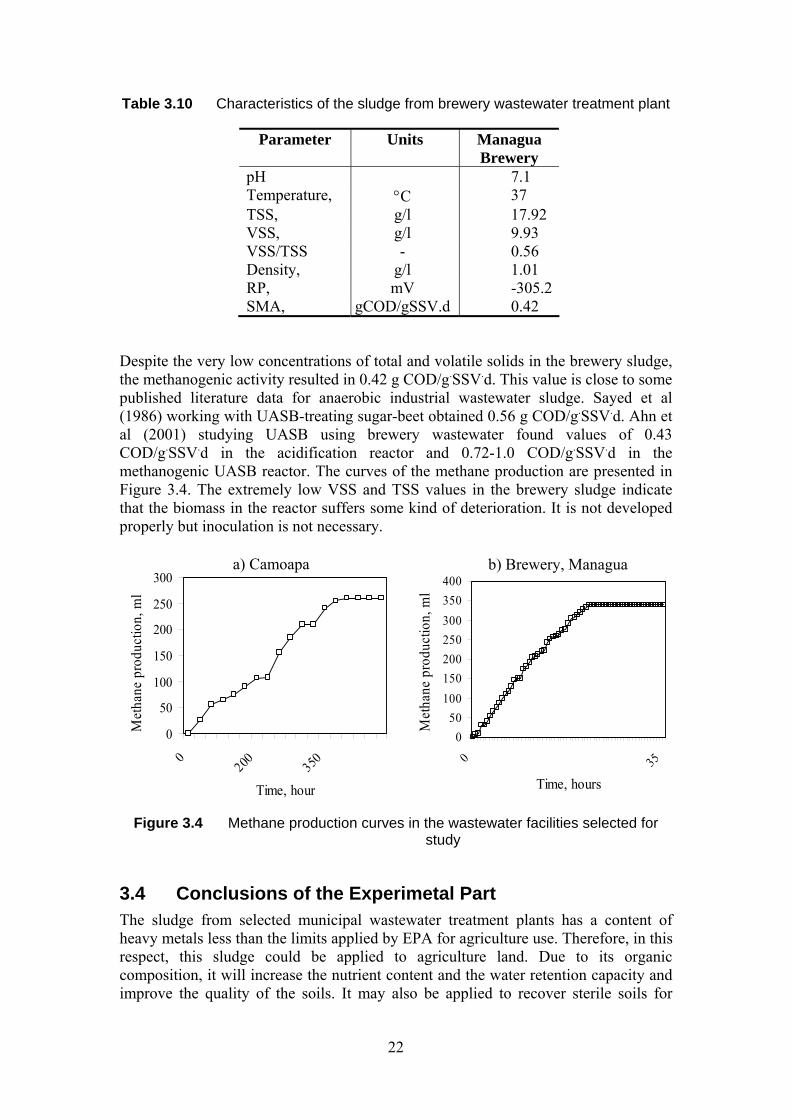
Table 3.10 Characteristics of the sludge from brewery wastewater treatment plant
Parameter Units Managua Brewery
pH 7.1 Temperature, °C 37 TSS, g/l 17.92 VSS, g/l 9.93 VSS/TSS - 0.56 Density, g/l 1.01 RP, mV -305.2SMA, gCOD/gSSV.d 0.42
Despite the very low concentrations of total and volatile solids in the brewery sludge, the methanogenic activity resulted in 0.42 g COD/g.SSV.d. This value is close to some published literature data for anaerobic industrial wastewater sludge. Sayed et al (1986) working with UASB-treating sugar-beet obtained 0.56 g COD/g.SSV.d. Ahn et al (2001) studying UASB using brewery wastewater found values of 0.43 COD/g.SSV.d in the acidification reactor and 0.72-1.0 COD/g.SSV.d in the methanogenic UASB reactor. The curves of the methane production are presented in Figure 3.4. The extremely low VSS and TSS values in the brewery sludge indicate that the biomass in the reactor suffers some kind of deterioration. It is not developed properly but inoculation is not necessary.
0
50
100
150
200
250
300
0200 350
Time, hour
Met
hane
pro
duct
ion,
ml
050
100150200250300350400
0 35
Time, hours
Met
hane
pro
duct
ion,
ml
a) Camoapa b) Brewery, Managua
Figure 3.4 Methane production curves in the wastewater facilities selected for study
3.4 Conclusions of the Experimetal Part The sludge from selected municipal wastewater treatment plants has a content of heavy metals less than the limits applied by EPA for agriculture use. Therefore, in this respect, this sludge could be applied to agriculture land. Due to its organic composition, it will increase the nutrient content and the water retention capacity and improve the quality of the soils. It may also be applied to recover sterile soils for
22
forest soils to improve vegetal cover and therefore, soil infiltration capacity (Marx, 1995; Teixeira, 2005).
The application of sludge to agricultural soils must be controlled, because in addition to the nutrient contribution (carbon, nitrogen, sulphur and phosphorus) and micronutrients (zinc, iron and cupper), non beneficial metals like cadmium, mercury, and lead are added. They may be highly toxic for vegetal or animal live. In the long term, the very small amounts of toxic metals may accumulate and significant contamination levels may be reached.
The performance of the selected municipal wastewater treatment plants is satisfactory, because the required water purification is achieved; the quality of the effluent is at the recommended level. If inoculum were needed, according to the values of the methanogenic activity, the sludge of the El Viejo could be proposed as inoculum for the wastewater treatment plant. The physico-chemical conditions in the brewery wastewater treatment plant partial fulfil the requirements for the growth of biomass. The concentration of sulphides and iron are below the required level. However, the methanogenic activity revealed the presence of the methanogenic bacteria and inoculation is not necessary. The removal efficiency of organic matter is not satisfactory and the problem of low concentration of the biomass should be studied by analysing the hydraulic regime in the reactor.
23
4 THE UASB REACTOR
In this chapter, the up-flow anaerobic sludge blanket (UASB) process is initially described with an emphasis on the main characteristics of the reactor itself and of the involved process. Later, the processes occurring in the UASB and how they may influence the performance of the treatment are presented and discussed. The different models found in the literature are also briefly discussed. This description focuses on the main mechanisms considered in the model and how the corresponding parameters may be determined.
4.1 Brief structural description
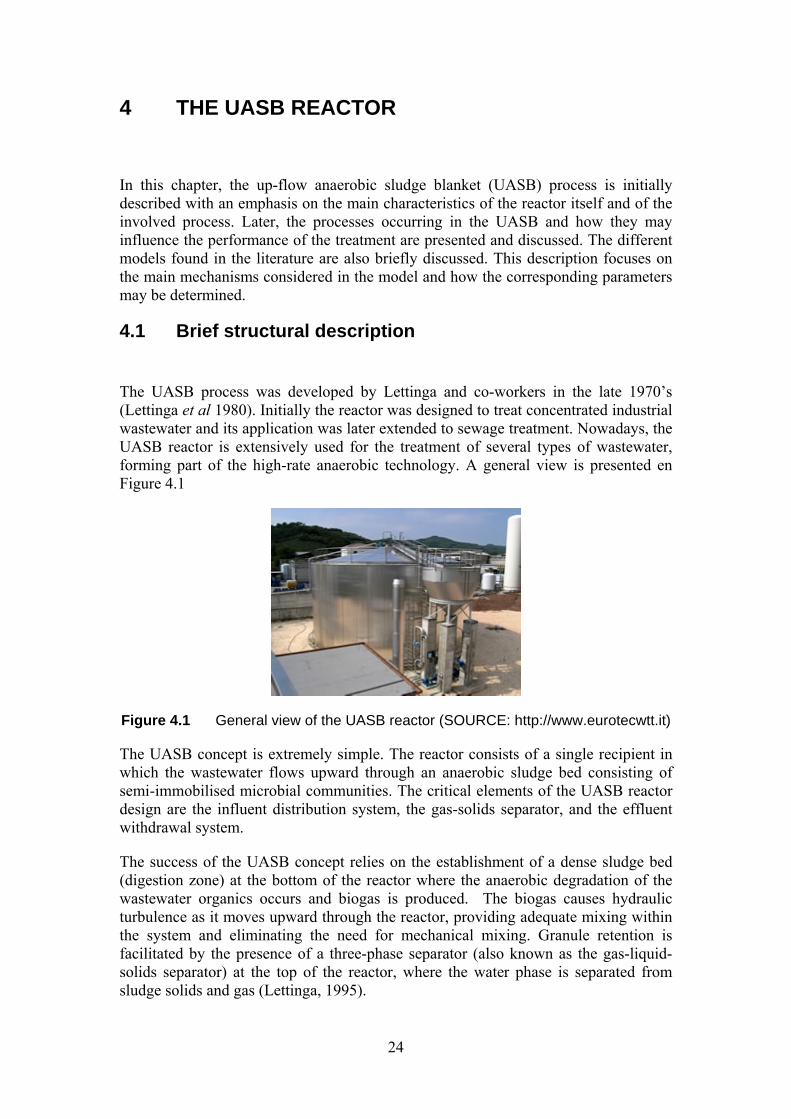
The UASB process was developed by Lettinga and co-workers in the late 1970’s (Lettinga et al 1980). Initially the reactor was designed to treat concentrated industrial wastewater and its application was later extended to sewage treatment. Nowadays, the UASB reactor is extensively used for the treatment of several types of wastewater, forming part of the high-rate anaerobic technology. A general view is presented en Figure 4.1
Figure 4.1 General view of the UASB reactor (SOURCE: http://www.eurotecwtt.it)
The UASB concept is extremely simple. The reactor consists of a single recipient in which the wastewater flows upward through an anaerobic sludge bed consisting of semi-immobilised microbial communities. The critical elements of the UASB reactor design are the influent distribution system, the gas-solids separator, and the effluent withdrawal system.
The success of the UASB concept relies on the establishment of a dense sludge bed (digestion zone) at the bottom of the reactor where the anaerobic degradation of the wastewater organics occurs and biogas is produced. The biogas causes hydraulic turbulence as it moves upward through the reactor, providing adequate mixing within the system and eliminating the need for mechanical mixing. Granule retention is facilitated by the presence of a three-phase separator (also known as the gas-liquid-solids separator) at the top of the reactor, where the water phase is separated from sludge solids and gas (Lettinga, 1995).
24
The sludge bed is basically formed by the accumulation of incoming suspended solids and bacterial growth. Under certain conditions in anaerobic medium and up-flow hydraulics, bacteria can naturally aggregate in flocs and granules. The size of the granulated sludge particles ranges from 1.0 to 3.0 mm in diameter (Chou, 2005; Veronez et al, 2005; Vlyssides et al, 2008; Yetilmezsoy, 2008). Since these aggregates have much higher settling velocities (20-80 mh-1) than the up-flow velocities (vup= 0.1-1m h-1), large biomass quantities can accumulate at the bottom. In this way, a high sludge loading rate (SLR) can be applied (up to 5 g COD gVSS-1 day-
1) with a relatively short hydraulic retention time (HRT), less than 4 hours (Kalyuzhnyi et al, 2006).
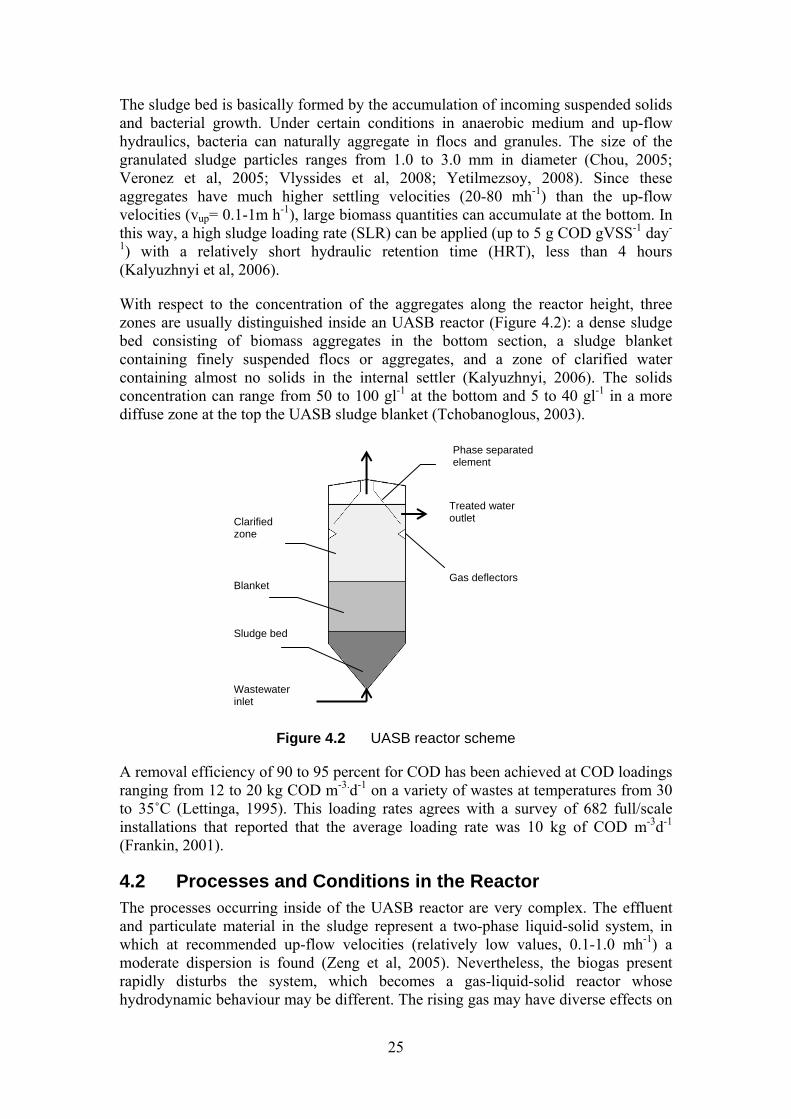
With respect to the concentration of the aggregates along the reactor height, three zones are usually distinguished inside an UASB reactor (Figure 4.2): a dense sludge bed consisting of biomass aggregates in the bottom section, a sludge blanket containing finely suspended flocs or aggregates, and a zone of clarified water containing almost no solids in the internal settler (Kalyuzhnyi, 2006). The solids concentration can range from 50 to 100 gl-1 at the bottom and 5 to 40 gl-1 in a more diffuse zone at the top the UASB sludge blanket (Tchobanoglous, 2003).
Phase separated element
Wastewater inlet
Treated water outlet Clarified
zone
Blanket Gas deflectors
Sludge bed
Figure 4.2 UASB reactor scheme
A removal efficiency of 90 to 95 percent for COD has been achieved at COD loadings ranging from 12 to 20 kg COD m-3.d-1 on a variety of wastes at temperatures from 30 to 35˚C (Lettinga, 1995). This loading rates agrees with a survey of 682 full/scale installations that reported that the average loading rate was 10 kg of COD m-3d-1 (Frankin, 2001).
4.2 Processes and Conditions in the Reactor The processes occurring inside of the UASB reactor are very complex. The effluent and particulate material in the sludge represent a two-phase liquid-solid system, in which at recommended up-flow velocities (relatively low values, 0.1-1.0 mh-1) a moderate dispersion is found (Zeng et al, 2005). Nevertheless, the biogas present rapidly disturbs the system, which becomes a gas-liquid-solid reactor whose hydrodynamic behaviour may be different. The rising gas may have diverse effects on
25
the overall performance of the reactor: it provides good wastewater-biomass contact in UASB systems by mixing but; on the other hand, it can cause a loss of biomass through flotation and turbulences. Gonzalez-Gil (2001) indicates the importance of considering that the gas production contributes more than the up-flow velocities to the mixing in the reactor.
The hydraulic rate variations alter the performance of the treatment process in the reactor for two reasons: one of which is directly related to the hydraulic retention time (HRT). At a high up-flow velocity, the wastewater passes faster through the reactor and the expected organic matter reduction cannot be achieved. However, high velocities can improve the dispersion (mixing) in the reactor and enhance the mass transfer coefficient in the film in such a way that the final performance of the reactor increases.
As indicated above, the UASB reactor favours the formation of densely packed biofilm particles (granules) that normally include millions of organisms per gram of biomass. None of the individual species forming these micro-ecosystems is capable to completely degrade the substrates coming with influent water. Complete degradation of waste involves a series of interactions between the present species (Liu et al, 2002).
In order to reach the expected degradation of organic matter in the sludge aggregates, it is important to maintain the conditions under which anaerobic granules grow and perform properly. The organic substrate loading rate (OLR) should be reasonably high: at low OLR, microorganisms are subject to nutrient starvation, while a very high OLR sustains a fast microbial growth (Bitton, 1999).
The most frequently used approach to describe substrate degradation within the granules is the widely known biofilm theory. According to this theory, the rate of substrate conversion is limited by the rate of transport of substrate into the biofilm. When the biofilm is become thick, a mass-transfer limitation can occur, resulting in an overall limitation of the reactor capacity. Under these conditions, the influx of substrate and/or outflux of products may become the rate-determining step (Gonzalez-Gil, 2001).
In the bulk liquid, the substrate is transported by flow. Near the surface of the biofilm there is a boundary layer where the flow changes from turbulent to laminar or stagnant. The mass transfer between the turbulent flow in the bulk liquid and the surface of the biofilm (i.e. the external mass transfer) takes place by liquid film diffusion. The transport of substrate within the biofilm is controlled by molecular diffusion (i.e. internal mass transfer). If the rate of transport of substrate to the surface of the biofilm is the same as the rate of removal of substrate in the biofilm, no accumulation takes place on the surface, (Christiansen, 1995).
Many studies have been developed in order to determine the impact of both diffusion and mass transfer resistance on substrate utilization within the anaerobic granules. Gonzalez-Gil (2001) reported that external mass-transfer limitations are not important under the conditions normally encountered in anaerobic bioreactors (up-flow velocity greater than 1mh-1). However, the reduction in the liquid-phase mass-transfer resistance and the reduction of the Ks values with increasing up-flow velocity may be attributed to enhanced mixing of the liquid and the sludge bed. The effect of the flow velocity may then be attributed to the reduction of preferential channelling of the
26
influent wastewater and not to any direct effect on transport phenomena in the anaerobic biofilm. Further, it is important to consider that the gas production will contribute more than the flow velocity to the mixing in the reactor (Gonzalez-Gil, 2001).
Molecular diffusion (internal mass transport) has been considered to be the major transport mechanism in an anaerobic biofilm and it is considered that the values of the internal mass transfer coefficient remain constant regardless of the hydrodynamic conditions in the bulk liquid, at least in the laminar regime (Brito, 1999). Ting and Huang (2006) indicate that the overall rate of nitrate removal in the UASB reactors depends on the nternal mass transfer resistance and that this should not be neglected. In experiments carried out in anaerobic biofilms under steady-state conditions, it was found that the diffusivity is lower than the corresponding value in water (Kitsos et al, 1992).
The radius of the granules and the biomass concentration have a high impact on the relative substrate-uptake rate (Gonzalez-Gil, 2001). Huang et al (2003) analysed the processes kinetics of an UASB reactor and the size of the granule, and they concluded that, when the reactor is operated at a higher superficial flow velocity, the diffusional distance from the bulk fluid to the liquid-granule interface can be reduced, resulting in a higher COD removal efficiency and a larger granule size.
4.3 Process Modelling The conditions for sludge granulation, blanket formation, sludge retention and sludge washout in the reactor are governed mostly by fluid dynamics and the composition of the feed (Narnoli and Mehrota, 1996). According to Saravanan et al (2006), in order to develop mathematical models for UASB reactors, it is important to analyse the flow pattern inside the reactor and the reaction kinetics within the biological granules. In general, models for UASB reactors consist of two parts: 1) a fluid flow model and 2) a reactor model.
4.3.1 Flow model A lot of fluid flow models for the UASB reactor have been developed where investigators promoted various ideas, sometimes differing with regard to the processes and phenomenon that take place inside the UASB. The UASB reactor consists of three parts, during modelling, and the first two zones of a UASB reactor have been described in the models by two completely stirred tanks and by a plug flow with the internal settler (Bolle et al, 1986). Wu and Hickey (1997) considered the reactor to be non-ideal CSTR by using a combination of an ideal CSTR together with a dead zone and a bypass flow. In other cases, continuous stirred reactors (CSTR) with some degree of short-circuiting have been used. However, Zeng et al (2005) demonstrated the importance of axial dispersion modeling in simulating hydrodynamic processes in anaerobic reactor According to him, industrial UASB reactors cannot be adequately described by an ideal mixing (CSTR) model because of the existence of significant substrate, volatile fatty acids, and pH gradients. Zeng et al. found that the dispersion coefficient was proportional to a constant raised to a power of the reactor height and also that these was an almost linear dependence of the dispersion coefficient on the liquid up-flow velocity, i.e. the numerical value of
27
dispersion coefficient (Dm) decreases from the bottom to the top of the sludge bed and in the liquid zone as described in the following expression:
Lz
upm VD 009.003.1 11.1= (4.1)
Narnoly and Mehrotra (1996), attempting to improve the UASB reactor design, developed the diffusion concept of sludge distribution through the height of the blanket dependent on gas bubble formation. They presented an explicit expression for the diffusion coefficient:
2
2 1 ⎟⎟⎠
⎞⎜⎜⎝
⎛−=
−qB
M eAqD (4.2)
where A and B are constants (A= 20 [m]; B = 0.55 [m3m-2h-1]) determined form the experimental data of Sayed et al. (1987). DM is the dispersion coefficient [m2h-1]; and q is a surface gas production (gas flux) [m3m-2h-1]. The expression has been found to be valid for of experimental data available in the literature for solid concentrations in the sludge blanket zone of UASB reactors. It was used by Kalyuzhnyi et al.(2005) to describe the dispersion of solids throughout the reactor height.
Singhal et al (1998) reported that a simple two-zone axial dispersion model adequately describes the fluid flow characteristics of an UASB reactor. They assumed that the flow patterns in these compartments represent axially dispersed zones. The extents of the mixing in these zones are reflected by their Peclet number (Pe):
A
up
DLV
Pe⋅
= (4.3)
where Vup is the flow velocity, L is the height of the reactor and DA is the dispersion coefficient. When the axial dispersion is a minimum (Pe→∞), the compartment approaches plug flow behaviour. On the other hand, when the axial dispersion is a maximum (the compartment is well mixed; Pe→0), the compartment approaches the ideal well-mixed behaviour. The lowest and the highest values represent the extreme degrees of mixing and consequently in the dispersion. When Pe is low, a high dispersion can produce negative effects such as back mixing, influent recirculation and consequently a reduction in treatment efficiency. The effect of dispersion on the reaction rate is normally not included in the models. This may be considered by modifying the coefficient of mass transfer in the film around the particle. At high Pe, the dispersion effect in the liquid film is negligible.
Peña et al (2006) evaluated the overall hydrodynamic behaviour of a full scale UASB focusing on the macro-mixing processes of the reactor. A multiple linear correlation between Peclet number (Pe), up-flow velocity, Vup [mh-1] and biogas production rate, Qb [m3h-1] was found:
bup QVPe 3.04.83.10 −−= (4.4)
This confirms asserts that, the mixing internal intensity in UASB is a function of both liquid up-flow velocity and biogas production rate. It was suggested that, in order to
28
sustain a good removal efficiency, the optimal Pe to operate a UASB hydraulically should be in the range of 1.4< Pe< 5.1.
4.3.2 Biofilm reactor model Various models are available for the evaluation of complex microbial ecosystems. Frequently, the biofilm reactor is described as a system with three separate phases: the biofilm, the gas phase and the liquid phase, where normally the steady-state is reached at complete-mix, plug or non-ideal conditions in the UASB reactor. The substrate is added to the reactor by liquid flow and the reactivity of the aggregates is modelled by Monod kinetics.
According to Saravanan (2006), substrate degradation in the bioreactor is dependent on the observed reaction rate, which is normally less than the rate predicted by the reaction kinetics. The reason for this difference is that the substrate concentration actually available to the microorganisms is less than the substrate concentration present in the bulk liquid because of the control exerted by molecular diffusion on the penetration of substrate into the biofilm. It is important to consider the rate-determining step while developing models.
Looking for a simplification and a better understanding of the models, Perez et al (2005) assumed zero-order kinetics for the conversion in the biogranules if the reactor substrate concentrations are sufficiently high. The analytical solution, in a simple form, was obtained separately for fully and partially penetrated biofilm.
Rauch et al. (1999) presented the concept of the simplified mixed-culture biofilm model. Substrate in the bulk liquid is directly transferred to the biofilm surface, neglecting the influence of the stagnant liquid film diffusion, and is then transported further into the biofilm by molecular diffusion. The critical assumption made in the simplified mixed-culture biofilm model is that there is a homogeneous distribution of the bacterial species. The biofilm compartment consists of two phases: the liquid phase, in which the dissolved substances are transported by diffusion, and the solid matrix, which consists of several species of bacteria as well as of particulate substrate and inert material. The substrate in the film is simultaneously utilized by the bacteria for growth. If the substrate does not fully penetrate the biofilm, the reaction is considered to be diffusion-limited, i.e. the reaction is taking place only up to a certain depth in the biofilm.
Huang et al (2003) proposed a kinetic model that accounts for the mass fraction of methanogens and granule size distribution in the UASB reactor, where a non-inhibitory substrate with a different superficial flow velocity was used. It was concluded that methanogens are the rate-limiting step for easily anaerobically degraded substrates.It was also found that when an UASB reactor was operated at a higher superficial flow velocity, the diffusional distance from the bulk fluid to the liquid-granule interface was reduced and a higher COD removal efficiency and a larger granule size was reached. It was also suggested that the effect of the mass transfer resistance of the substrate sucrose on the overall rate of substrate removal should not be neglected.
However, Gonzalez-Gill (2001) also investigated transport limitations in anaerobic granular sludge. According to him, the external mass-transport resistance is not rate-limiting for an anaerobic granule sludge. This could be explained by taking into
29
account relatively low substrate concentrations commonly found in wastewaters. The biofilm thickness in most anaerobic system (smaller than 1x10⁻³m) and not very high specific methanogenic activity on acetate ranging from 0.4 to 0.6 g CH4-COD VSS.d, mean that, in practice, diffusion limitations may not be very important. Hence, the conversion of the rate-limiting substrate will be controlled mainly by its biological kinetics. These experimental results confirm the generally accepted assumption that diffusion is the predominant transport process in anaerobic biofilms.
4.3.3 Different models of the structure of the biofilm Different models of the structure of the biofilm were found in the literature:
Multi-layer model
Saranavan ((2006) developed a model assuming a 3-layered structure, as proposed by MacLeod et al (1990). MacLeod’s findings were supported and confirmed by fluorescence in situ hybridization using 16S rRNA targeted oligonucleotides. The outer layer consists of acidogens, the middle layer of acetogens and hydrogen utilizing methanogens and the inner layer of acetoclastic methanogens.
Syntrophic micro-colony model
This model is based in the fact that synergistic requirements drive bacteria to form granules in which different species function in a synergistic manner and can easily survive. The study of Huang et.al (2003) indicates, with references to Chartrain and Zeikus (1986) and Thiele et al (1988), that the acidogens and methanogens grow syntrophically and homogeneously. Thus, the anaerobic degradation of a substrate should exhibit two main reaction steps, i.e. the substrate is first degraded to volatile fatty acids (VFA) by acidogens, and the VFAs formed are then further degraded to methane and carbon dioxide by methanogens.
Non-layered structure
In contrast to the multi-layer model, anaerobic granules with a non-layered structure have also been reported. There is evidence that a layered structure of the UASB granules develops with carbohydrates and that a non-layered granule is formed when the substrate has a rate-limiting hydrolytic or fermentative step. According to Batstone et al (2004), when protein is used as substrate, a low density and unlayered structure throughout the granule is formed. Granule cluster structure
Recently, the structure of anaerobic granules of an expanded granular bed (EGSB) reactor was studied by Gonzalez-Gil et al (2001). They found black spherical granules having numerous whitish spots on their surfaces. High magnification electron microscopy showed that the white clusters consisted mainly of acetate-utilizing methanogens and that the black matrix consisted of Syntrophic species and hydrogenotrophic methanogens. According to these authors, a cluster structure is advantageous over a layered structure. The granules which were grown in the effluent containing soluble as well as particulate protein had a homogeneous structure.
30
It can thus be concluded that there are two key factors which determine the structure of a granule: the nature of the organic compounds present in the wastewater and the kinetics of substrate degradation.
Granular size and its distributions
Batstone and Keller (2001) and Saravanan and Sreeksishnan (2007) agree that the granular size ranges between 0.5and 4 mm. Most of the kinetic models formulated for UASB reactors assume a uniform granule size rather than a granule size distribution. Nevertheless, the granule size measured from the bottom to the top of the sludge bed varies remarkably (Grotenhuis et al, 1991). Huang et al (2006) reported granule size in a UASB reactor. According to him, in the lower part of the sludge-bed zone the diameter was larger than in the middle and upper parts of the sludge bed zone; the values obtained being 1.73-2.21mm; 1.71-1.88 mm; and 1.61-1.84 mm respectively. In this case, the particles are quite similar in size. On the other hand, Saravanan et al (2006) reported that the sludge bed could be completely mixed even at different column heights.
31
5 MODEL OF UASB
In this chapter, the system to be modelled is first presented. Afterwards, the conceptual model is developed indicating the main assumptions used in the model and the order of the degradation reaction is discussed. After the conceptual model has been clearly defined, the mathematical model is formulated. The differential mass balance for the substrate in the bulk liquid in the reactor and the concentration of substrate within the granule are presented.
Therefore, the equation for the concentration within the granule is solved as a function of the bulk concentration around the granule. On the basis of this analytical solution and the granule size distribution, the reaction rate per bed volume is determined. Some preliminary calculations have been performed using the developed model. The influence of the organic loading rate on the removal efficiency has, for instance, been analysed. The impact of different size distributions on the reaction kinetics was also addressed.
5.1 The System to be Modelled The system to be modelled is an Up-flow Anaerobic Sludge Blanket reactor (UASB) described in detail in Chapter 4.
The model describes the mass balance for the substrate in the bulk fluid in the reactor, including advection and dispersion along the reactor. It also describes the mass transfer between the granules of anaerobic sludge and organic matter dissolved in the liquid. The relationship between the mass transport in the stagnant fluid around the anaerobic aggregate and the fluid velocities is also addressed. It is initially assumed that the particles have the same size, but this is later relaxed in favour of a particle size distribution.
5.2 Conceptual Model Due to the complexity of the microbial ecosystems in which several physical, chemical, and biological processes take place simultaneously, it is necessary to make some simplifications to be able to evaluate the system. Hence a series of assumption were proposed:
1. All processes inside the reactor are considered to depend only on the vertical axis (z), i.e. it is one-dimensional model.
2. The reactor volume is not divided in zones, since the division of the reactor into different zones is diffuse and to some extent arbitrary. However some parameters can vary along the height of the reactor; e.g., dispersion and particle densities (Figure 5.1).
3. The model is transient, i.e., the concentration of organic matter varies with time and location in the reactor.
4. The system is isothermal and the substrate consists basically of biodegradable soluble substances.
32
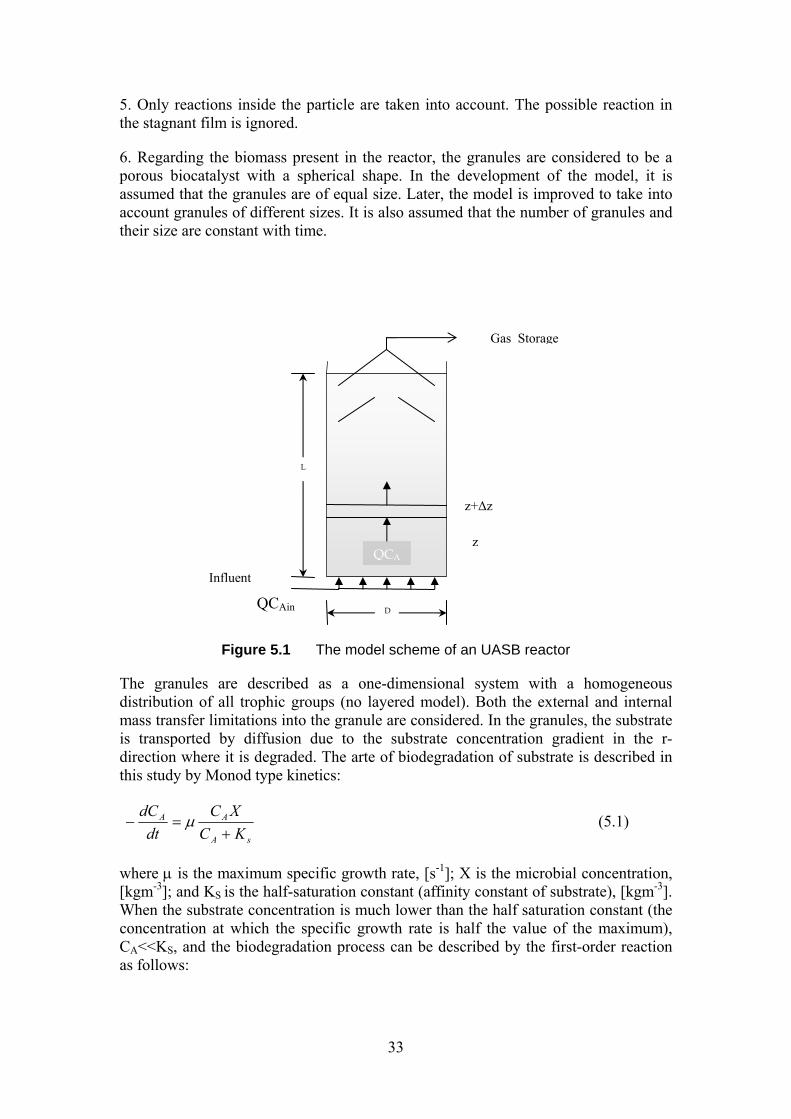
5. Only reactions inside the particle are taken into account. The possible reaction in the stagnant film is ignored.
6. Regarding the biomass present in the reactor, the granules are considered to be a porous biocatalyst with a spherical shape. In the development of the model, it is assumed that the granules are of equal size. Later, the model is improved to take into account granules of different sizes. It is also assumed that the number of granules and their size are constant with time.
Figure 5.1 The model scheme of an UASB reactor
The granules are described as a one-dimensional system with a homogeneous distribution of all trophic groups (no layered model). Both the external and internal mass transfer limitations into the granule are considered. In the granules, the substrate is transported by diffusion due to the substrate concentration gradient in the r-direction where it is degraded. The arte of biodegradation of substrate is described in this study by Monod type kinetics:
sA
AA
KCXC
dtdC
+=− μ (5.1)
where μ is the maximum specific growth rate, [s-1]; X is the microbial concentration, [kgm-3]; and KS is the half-saturation constant (affinity constant of substrate), [kgm-3]. When the substrate concentration is much lower than the half saturation constant (the concentration at which the specific growth rate is half the value of the maximum), CA<<KS, and the biodegradation process can be described by the first-order reaction as follows:
QCAin
z
z+Δz
L
QCA
D
Influent
Gas Storage
33
As
Ar kC
KXC
R ==− μ (5.2)
where Rr is the reaction rate.
If the substrate concentration is much higher than the intrinsic half saturation constant, CA>>KS, the consumption of organic matter obeys a zero-order reaction and the mathematical expression is:
kXRr ==− maxμ (5.3)
In this study, a first-order reaction was considered, but some applications are also made for the zero-order reaction.
5.3 Mathematical Model
5.3.1 Mass balance of substrate in the bulk liquid A mass balance in a differential longitudinal element of the reactor was developed, as shown in Figure 5.1. The advection-dispersion equation was used to describe the process in the reactor. The equation in transient state is the following:
AAA
SA KC
zCV
zCD
tC
−∂∂
−∂∂
=∂∂
2
2 (5.4)
where Ds is the dispersion coefficient of substrate A, [m2s-1]; CA is the concentration of substrate in the bulk water, [kgm-3]; V is the up-flow velocity, [ms-1]; K is a reaction rate constant [s-1]; z is the axial direction of the reactor, and t is the time of observation, [s].
The term on the left-hand side is the accumulation of substrate in the differential element in the bed, expressed as [kgm-3 s-1]. The first term on the right-hand side takes into account the dispersion of the substrate in the bed. The second term corresponds to the transport of substrate by advection (flow) and the last term is the reaction term, i.e. the amount of substrate that is depleted per unit of bed volume in unit time.
a) Initial and boundary conditions in a transient state:
As initial conditions, the concentration of the substrate in the reactor, CA, at zero time is considered to be Cain, which could be a function of z. For t>0, a constant mass flux of substrate is assumed at the reactor inlet (z = 0), i.e. the substrate flows into the reactor at z = 0 by the convection and diffusion. At the reactor outlet, it is assumed that the substrate leaves the reactor only by convection, i.e. the substrate concentration gradient is zero at z = L.
The following initial and boundary conditions are applied in the model:
IC: (5.5)
0=t AinA CC =
34
BC1: 0=z0
00=
+=
∂−=
z
ASzAA dz
CDVCVC (5.6)
BC2: Lz = 0=∂∂
zCA (5.7)
where L is the height of the reactor, [m] (see Figure 5.1).
The model was developed in base to the processes occurring in a UASB reactor, that we considered to be most important. The model describes the advection, the dispersion, and the biological degradation of the organic matter, including mass transport at the interface and diffusion within the granules.
For the numerical solution of the model, a standard function within MATLAB, pdepe, was used. This program solves initial-boundary values problems for systems of parabolic and elliptic partial differential equation (PDEs) on one space, z-direction in our case, and time.
In the steady-state, the left-hand term of equation (5.4) is equal to zero and the organic matter concentration varies solely as a function of reactor height. The balance for the compounds can be written as:
02
2=−
∂∂
−∂∂
AAA
S KCz
CVzCD (5.8)
b) Boundary conditions in a steady state
The same boundary conditions as those proposed for the transient state are valid and are applied in the model for steady state:
BC1: z = 0 +=
+=
∂−=
000
z
ASzAA dz
CDCVVC (5.9)
BC2: z = L 0=∂∂
zCA (5.10)
The solution developed for transient conditions has been used to solve the steady state simulations running the code for very long time to be sure that steady state conditions were reached.
5.3.2 Mass balance of substrate inside the granule The basis of the assumptions stated above, where the anaerobic granule of sludge was considered to be a porous biocatalyst with a spherical shape, the mass balance for substrate A was developed as shown in Figure 5.2.
Applying the mass balance for the substrate in the particle, the following equation was obtained:
35
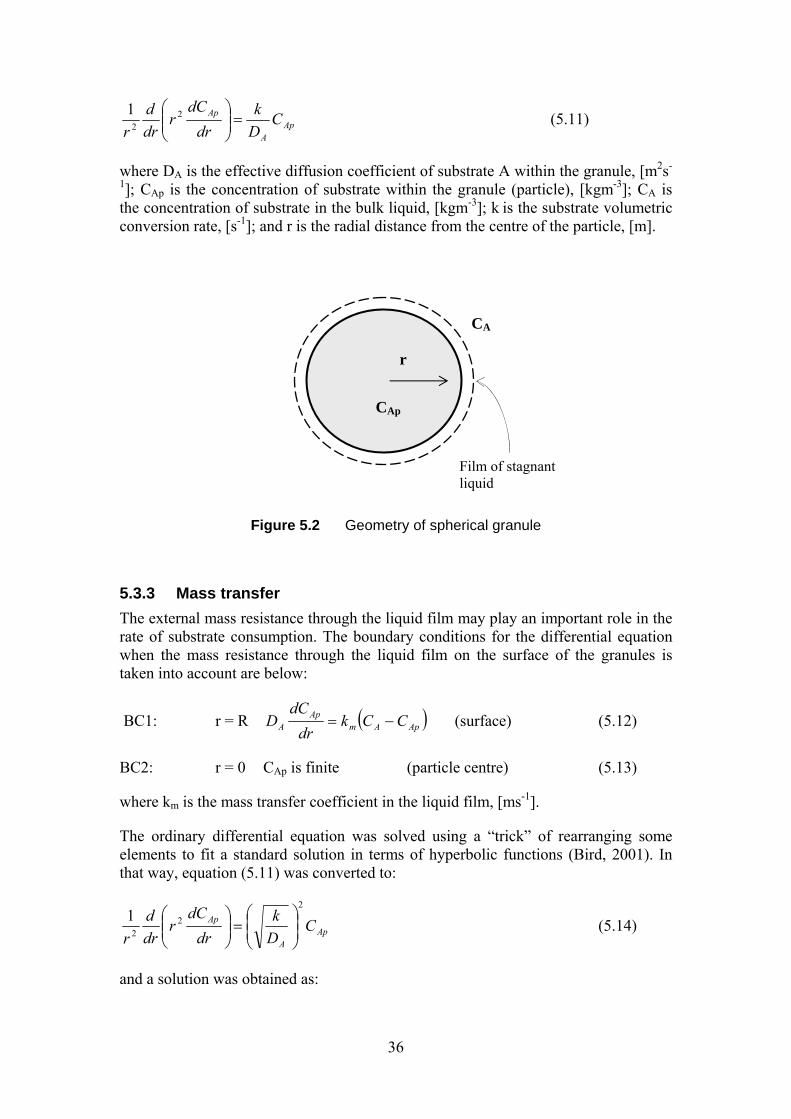
ApA
Ap CDk
drdC
rdrd
r=⎟⎟
⎠
⎞⎜⎜⎝
⎛ 22
1 (5.11)
where DA is the effective diffusion coefficient of substrate A within the granule, [m2s-
1]; CAp is the concentration of substrate within the granule (particle), [kgm-3]; CA is the concentration of substrate in the bulk liquid, [kgm-3]; k is the substrate volumetric conversion rate, [s-1]; and r is the radial distance from the centre of the particle, [m].
Film of stagnant liquid
CA
CAp
r
Figure 5.2 Geometry of spherical granule
5.3.3 Mass transfer The external mass resistance through the liquid film may play an important role in the rate of substrate consumption. The boundary conditions for the differential equation when the mass resistance through the liquid film on the surface of the granules is taken into account are below:
BC1: r = R ( ApAmAp
A CCkdr
dCD −= ) (surface) (5.12)
BC2: r = 0 CAp is finite (particle centre) (5.13)
where km is the mass transfer coefficient in the liquid film, [ms-1].
The ordinary differential equation was solved using a “trick” of rearranging some elements to fit a standard solution in terms of hyperbolic functions (Bird, 2001). In that way, equation (5.11) was converted to:
ApA
Ap CDk
drdC
rdrd
r
2
22
1⎟⎟⎠
⎞⎜⎜⎝
⎛=⎟⎟
⎠
⎞⎜⎜⎝
⎛ (5.14)
and a solution was obtained as:
36
⎟⎟⎠
⎞⎜⎜⎝
⎛+⎟
⎟⎠
⎞⎜⎜⎝
⎛= r
Dk
rC
rDk
rC
CAA
Ap sinhcosh 21 (5.15)
Applying the boundary conditions, the constants C1 and C2 were found and the analytical solution is presented by the following expression:
( ) ( )( )⎥⎥⎥⎥⎥⎥
⎦
⎤
⎢⎢⎢⎢⎢⎢
⎣
⎡
−⋅
⎟⎠⎞
⎜⎝⎛ ⋅⎟
⎟
⎠
⎞
⎜⎜
⎝
⎛−
=
=
φφφ
φ
sinhcosh
sinh12
A
A
RrApm
A
Ap
D
Rr
C
Ck
rR
CC
(5.16)
where RDk
A
=φ is the Thiele modulus (dimensionless value). (5.17)
In order to be able to determine the concentration of substrate inside the particle, equation (5.16) was solved for r=R, RrApC == , and the term representing the concentration at the surface may thus be eliminated. The following expression was obtained:
( ) ( )( ) ( )φφφφ
φ
sinhsinhcosh
sinh
RkDRrRk
rR
CC
A
m
A
Ap
+−⋅
⎟⎠⎞
⎜⎝⎛ ⋅
= (5.18)
To obtain the mass flow of organic matter into the particle, W [kgs-1], through the granule surface at r= R, where W is a key entity when the kinetics and catalysis is studied:
( )( ) ⎟⎟
⎠
⎞⎜⎜⎝
⎛
+−
−=
φφφφφφφ
πsinhsinhcosh
sinhcosh4 2
mA
AAmAR RkD
DCkRW (5.19)
In the case of a high degree of mixing (high mass transfer coefficient), the mass transfer resistance in the stagnant liquid film around the granules may be negligible. This means that the degradation of the substrate is controlled by the processes within the granule, and that the substrate concentration at the particle surface is the concentration of the substrate in the bulk liquid. In this case, therefore, the boundary conditions are:
BC1: r = R (particle surface) (5.20) ApA CC =
BC2: r = 0 CAp is finite (particle centre) (5.21)
Applying these conditions to equation 5.15, we obtain the expression:
37
⎟⎟⎠
⎞⎜⎜⎝
⎛⎟⎠⎞
⎜⎝⎛= φφ sinhsinh
Rr
rR
CC
A
Ap (5.22)
Resolving for the mass flow of organic matter into the particle, W [kgs-1], based on the mass flux at the granule surface was obtained:
( )φφπ coth14 −= AAAR CRDW (5.23)
The result gives the rate of conversion of substrate A in a single catalyst particle of radius R in terms of the parameters describing the diffusing and reaction processes.
When no liquid film was considered on the surface of the granule, in the absence of diffusion resistance inside of the granules, the rate of conversion (WAR) is equal to the maximum substrate conversion rate in the reactor (Wmax). This rate is given by the product of the volume of the particle and the volumetric reaction rate within the granule:
( AKCRW −= 3max 3
4π ) (5.24)
Taking the ratio maxWWAR , the effectiveness factor may be obtained:
( 1coth32 −= φφ
φη ) (5.25)
The effectiveness factor is the quantity by which Wmax has to be multiplied to account for the intraparticle diffusion resistance to the overall conversion process.
When a liquid film is present, the expression for the effectiveness factor is more complex.
The analytical solution for zero-order in the absence of the stagnant liquid film around the granules was obtained using the same boundary conditions (5.20) and (5.21). The following expression was obtained:
Ars
PA CD
XrC += max2
6μ
(5.26)
where μmax is the maximum specific growth rate, [s-1]; X is the biomass concentration in the sludge bed zone, [kgm-3]; Ds is the diffusion coefficient, [m2s-1]; CAr is the substrate concentration within the particles at r = 0, [kgm-3]; and r is the radial distance from the centre of the granule, [m].
38
5.4 Evaluation of the Reaction Rate Constant
5.4.1 Reactor with uniform granules of constant size Considering the number of particles per unit bed-volume as Np and the mass flow into an individual granule according to equation (5.19), the kinetic constant K is determined as:
( )( ) ⎥
⎦
⎤⎢⎣
⎡+−
−=
φφφφφφφπ
sinhsinhcoshsinhcosh4 2
mA
Apm RkD
DNkRK (5.27)
where K is the kinetic constant rate, [s-1]; R is the particle radius, [m]; km is the mass transfer coefficient in the stagnant liquid film, [ms-1]; Np is the number of particles per unit bed volume, [m-3] and DA is a diffusion coefficient in the particle, [m2s-1].
If the volume occupied by particles with respect to the total bed volume is , the number of particles per unit bed volume, Np can be expressed as:
pΘ
3
p
34
RN p
π
Θ= (5.28)
where is the fraction of the total volume occupied by the granule and R is the particle radius, [m]. Introducing equation (5.28) into equation (5.27) yields the equation that allows the conversion constant rate to be calculated as follows:
pΘ
( )( ) ⎥
⎦
⎤⎢⎣
⎡+−
−Θ=
φφφφφφφ
sinhsinhcoshsinhcosh
3 p
mA
Am RkD
DR
kK (5.29)
5.4.2 Reactor with granules of different size In the real situation inside the bioreactor, the granules are not of the same size, but their distribution can be described by means of e.g., a discrete distribution. The quantified distribution of granules is based on the volume fraction of each group of a given particle size, e.g. fvol,1, fvol,2, fvol,3, fvol,I, which allows us to extend the distribution to any number of particle sizes. In this study, it is assumed that the granules are of three sizes (0.5, 1.0 and 2.0 mm) and that the volumetric fractions of each group are 0.2, 0.4 and 0.4 respectively, as shown in Figure 5.3. The extension to a larger number of size groups is straightforward.
39

0
0.1
0.2
0.3
0.4
0.5
0.5 1 2
Particle size, mm
Vol
umet
ic fr
actio
n
Figure 5.3 Discrete particle size distributions
The number of particles per unit volume for each particle size is estimated by mean of the following equation:
3
,p
34
i
ivolpi
R
fN
π
⋅Θ= (5.30)
and the final expression to obtain the kinetic constant is:
( )( )∑ ⎥
⎦
⎤⎢⎣
⎡+−
−⋅Θ=
i imiiiiiA
iiiA
i
ivolmi kRD
DR
fkK
φφφφφφφ
sinhsinhcoshsinhcosh3 ,p (5.31)
where fvol,i is the volumetric fraction of particles of size i; Ri is the radius of the particles of size I, [m]; kmi is the mass transfer coefficient, [ms-1] for particles of size i; and Npi is the number of particles of size i per bed volume, [m-3].
40
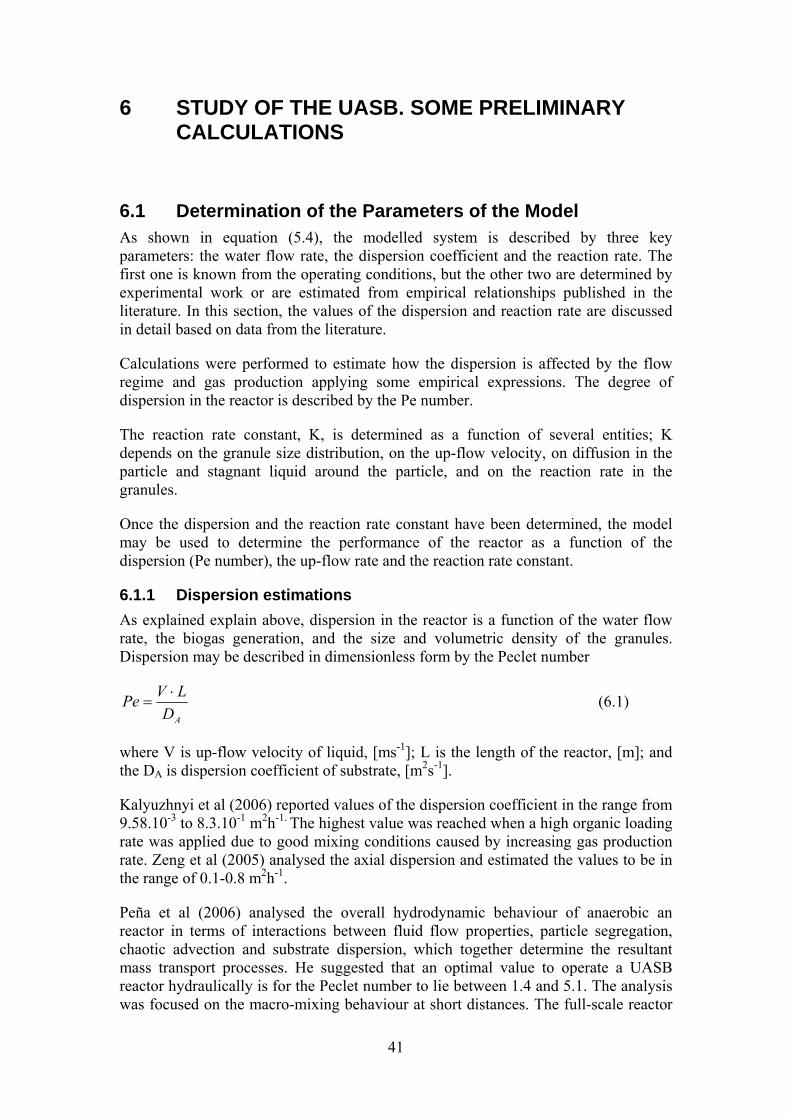
6 STUDY OF THE UASB. SOME PRELIMINARY CALCULATIONS
6.1 Determination of the Parameters of the Model As shown in equation (5.4), the modelled system is described by three key parameters: the water flow rate, the dispersion coefficient and the reaction rate. The first one is known from the operating conditions, but the other two are determined by experimental work or are estimated from empirical relationships published in the literature. In this section, the values of the dispersion and reaction rate are discussed in detail based on data from the literature.
Calculations were performed to estimate how the dispersion is affected by the flow regime and gas production applying some empirical expressions. The degree of dispersion in the reactor is described by the Pe number.
The reaction rate constant, K, is determined as a function of several entities; K depends on the granule size distribution, on the up-flow velocity, on diffusion in the particle and stagnant liquid around the particle, and on the reaction rate in the granules.
Once the dispersion and the reaction rate constant have been determined, the model may be used to determine the performance of the reactor as a function of the dispersion (Pe number), the up-flow rate and the reaction rate constant.
6.1.1 Dispersion estimations As explained explain above, dispersion in the reactor is a function of the water flow rate, the biogas generation, and the size and volumetric density of the granules. Dispersion may be described in dimensionless form by the Peclet number
ADLVPe ⋅
= (6.1)
where V is up-flow velocity of liquid, [ms-1]; L is the length of the reactor, [m]; and the DA is dispersion coefficient of substrate, [m2s-1].
Kalyuzhnyi et al (2006) reported values of the dispersion coefficient in the range from 9.58.10-3 to 8.3.10-1 m2h-1. The highest value was reached when a high organic loading rate was applied due to good mixing conditions caused by increasing gas production rate. Zeng et al (2005) analysed the axial dispersion and estimated the values to be in the range of 0.1-0.8 m2h-1.
Peña et al (2006) analysed the overall hydrodynamic behaviour of anaerobic an reactor in terms of interactions between fluid flow properties, particle segregation, chaotic advection and substrate dispersion, which together determine the resultant mass transport processes. He suggested that an optimal value to operate a UASB reactor hydraulically is for the Peclet number to lie between 1.4 and 5.1. The analysis was focused on the macro-mixing behaviour at short distances. The full-scale reactor
41
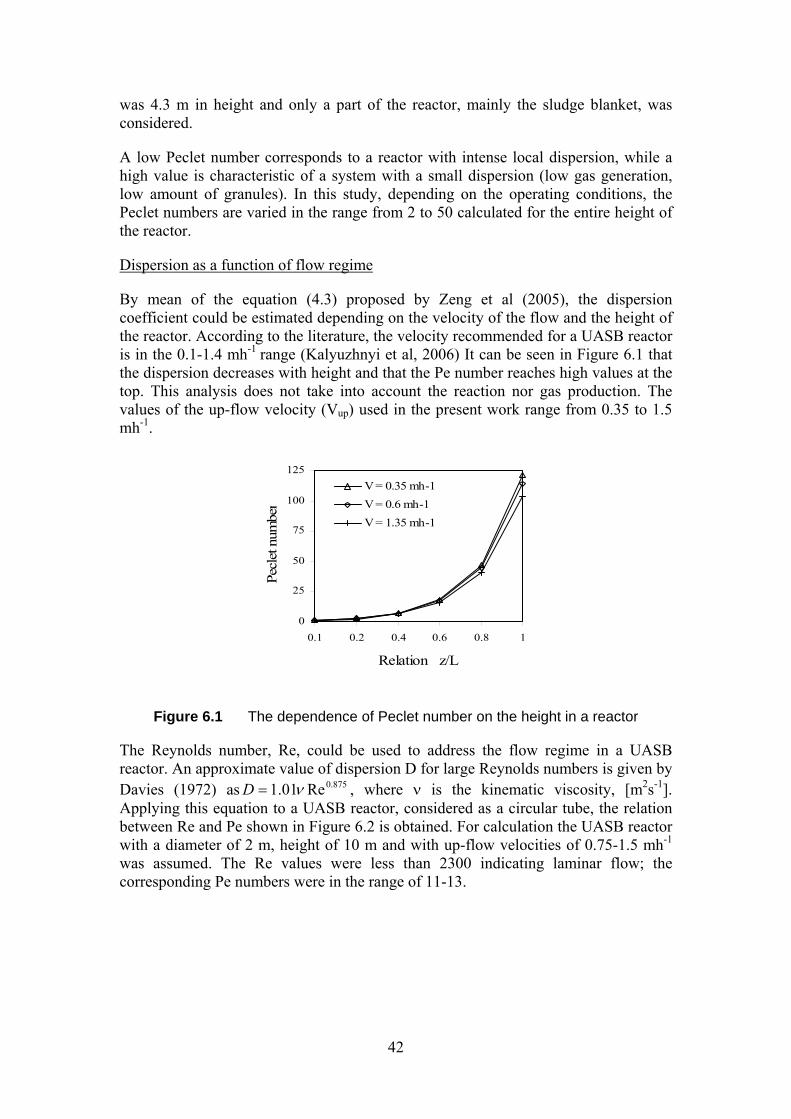
was 4.3 m in height and only a part of the reactor, mainly the sludge blanket, was considered.
A low Peclet number corresponds to a reactor with intense local dispersion, while a high value is characteristic of a system with a small dispersion (low gas generation, low amount of granules). In this study, depending on the operating conditions, the Peclet numbers are varied in the range from 2 to 50 calculated for the entire height of the reactor.
Dispersion as a function of flow regime
By mean of the equation (4.3) proposed by Zeng et al (2005), the dispersion coefficient could be estimated depending on the velocity of the flow and the height of the reactor. According to the literature, the velocity recommended for a UASB reactor is in the 0.1-1.4 mh-1 range (Kalyuzhnyi et al, 2006) It can be seen in Figure 6.1 that the dispersion decreases with height and that the Pe number reaches high values at the top. This analysis does not take into account the reaction nor gas production. The values of the up-flow velocity (Vup) used in the present work range from 0.35 to 1.5 mh-1.
0
25
50
75
100
125
0.1 0.2 0.4 0.6 0.8 1
Relation z/L
Pecl
et n
umbe
r
V = 0.35 mh-1V = 0.6 mh-1V = 1.35 mh-1
Figure 6.1 The dependence of Peclet number on the height in a reactor
The Reynolds number, Re, could be used to address the flow regime in a UASB reactor. An approximate value of dispersion D for large Reynolds numbers is given by Davies (1972) as , where ν is the kinematic viscosity, [m2s-1]. Applying this equation to a UASB reactor, considered as a circular tube, the relation between Re and Pe shown in Figure 6.2 is obtained. For calculation the UASB reactor with a diameter of 2 m, height of 10 m and with up-flow velocities of 0.75-1.5 mh-1 was assumed. The Re values were less than 2300 indicating laminar flow; the corresponding Pe numbers were in the range of 11-13.
875.0Re01.1 ν=D
42
02468
10121416
100 1000 10000
Re number
Pe
num
ber
Figure 6.2 Peclet number as a function of Reynolds number
Dispersion as a function of gas flux
The dispersion and the gas flux in the sludge bed were related to each other by an empirical relationship developed by Narnoli and Mehrotra (1997) using a diffusion concept, equation 4.2. However, the degree of mixing in a UASB reactor is a function of both biogas production rate and liquid up-flow velocity, equation 4.4 (Peña, 2006). According to Gonzalez-Gil (2001), it is important to consider that the gas production contributes more than the flow velocity to the mixing in reactor; and the gas production per unit surface area is directly related to the height of the reactor so that in tall and thin reactors the gas load (m3m-2h-1) can be very high. There are several empirical relationships where the influences of these two factors are taken into account (Peña, 2006). The Peclet number is shown as a function of gas production (Narnoli and Mehrota, 1997) and for gas production together with flow velocity (Peña et al, 2006) is presented in Figure 6.3.
43
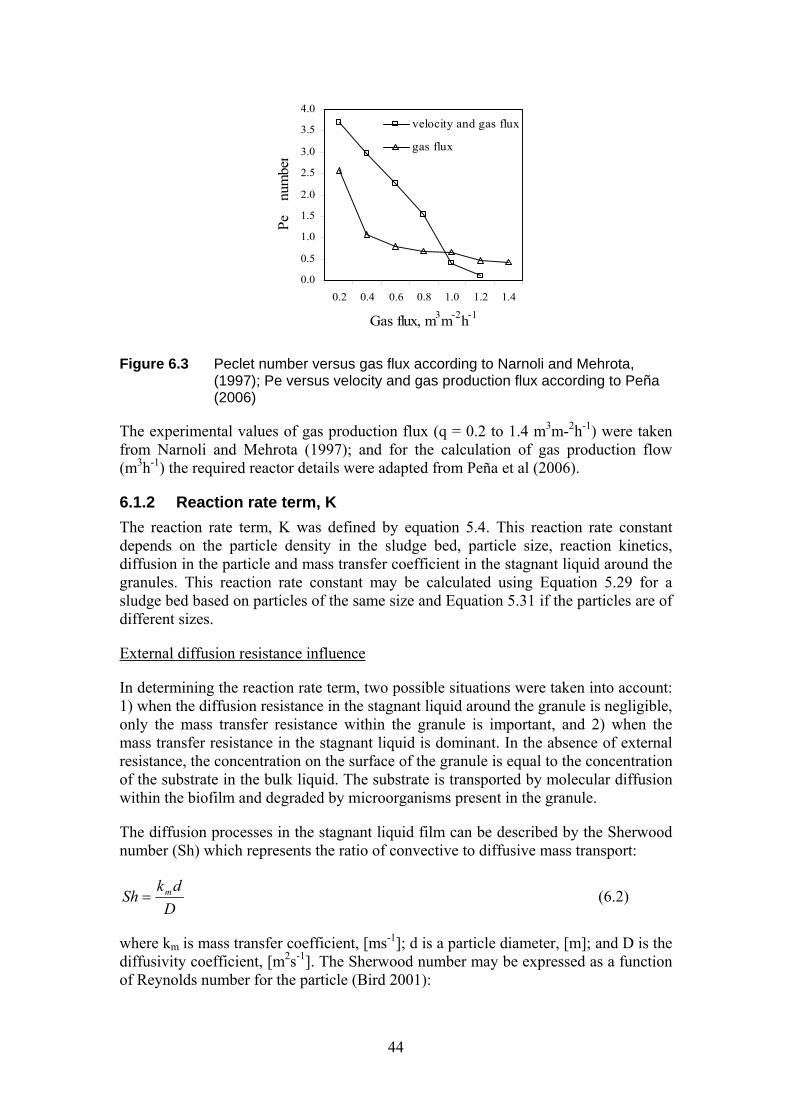
0.0
0.5
1.0
1.5
2.0
2.5
3.0
3.5
4.0
0.2 0.4 0.6 0.8 1.0 1.2 1.4
Gas flux, m3m-2h-1
Pe
num
ber
velocity and gas flux
gas flux
Figure 6.3 Peclet number versus gas flux according to Narnoli and Mehrota, (1997); Pe versus velocity and gas production flux according to Peña (2006)
The experimental values of gas production flux (q = 0.2 to 1.4 m3m-2h-1) were taken from Narnoli and Mehrota (1997); and for the calculation of gas production flow (m3h-1) the required reactor details were adapted from Peña et al (2006).
6.1.2 Reaction rate term, K The reaction rate term, K was defined by equation 5.4. This reaction rate constant depends on the particle density in the sludge bed, particle size, reaction kinetics, diffusion in the particle and mass transfer coefficient in the stagnant liquid around the granules. This reaction rate constant may be calculated using Equation 5.29 for a sludge bed based on particles of the same size and Equation 5.31 if the particles are of different sizes.
External diffusion resistance influence
In determining the reaction rate term, two possible situations were taken into account: 1) when the diffusion resistance in the stagnant liquid around the granule is negligible, only the mass transfer resistance within the granule is important, and 2) when the mass transfer resistance in the stagnant liquid is dominant. In the absence of external resistance, the concentration on the surface of the granule is equal to the concentration of the substrate in the bulk liquid. The substrate is transported by molecular diffusion within the biofilm and degraded by microorganisms present in the granule.
The diffusion processes in the stagnant liquid film can be described by the Sherwood number (Sh) which represents the ratio of convective to diffusive mass transport:
Ddk
Sh m= (6.2)
where km is mass transfer coefficient, [ms-1]; d is a particle diameter, [m]; and D is the diffusivity coefficient, [m2s-1]. The Sherwood number may be expressed as a function of Reynolds number for the particle (Bird 2001):
44

3/1)(Re991.02 ScSh pm += (6.3)
where Sc is the Schmidt number, which represents the physical properties of the liquid and is given by
DDSc υ
=ρμ
= (6.4)
where are the viscosity [kg/m.h] and the density [kg/m3] of the liquid respectively; and
ρμ andυ is the kinematic viscosity, [m2h-1]. The Reynolds number for a
particle (Rep) is written as
υ=
μρ
=ududRep (6.5)
where u is the relative velocity of the particle (here assumed as the liquid up-flow velocity), [mh-1]; and d is a particle diameter, [m].
The particle Reynolds number is used to indicate whether the boundary layer around a particle is turbulent or laminar. In this study, the Rep was calculated for a velocity of 0.7 mh-1, a particle diameter of 1.5x10⁻³ m and a water kinematic viscosity of 3.2x10⁻³ m2h-1 at 25°C. A value of 0.33 was obtained, being Rep<1 it suggests that the liquid flow around the granules is laminar (Tchobanoglous, 2003).
The Sc number was calculated for water at 25°C using a value of 6.48x10⁻⁶ m2d-1 for the diffusion coefficient for an organic molecule into the biofilm as reported by Tartakovsky and Guiot (1997). Introducing the values for Sc and Rep in Equation 6.3, Sh was determined to be 17.2. From this value, the mass transfer coefficient km was estimated, e.g. for a 1.5 mm particle diameter, to be 0.074 md-1.
If there is no flow passing around the granules, Sh is equal to 2. The value of Sh= 17.2 thus means that, under the actual conditions, the mass transfer rate would be 8 times higher than that at rest. According to Gonzalez-Gill (2001), the external mass transfer limitations may play an important role in the anaerobic granular biomass at km values lower than 0.3 md-1. According to empirical relations, it corresponds to an up-flow velocity less than 1 mh-1, conditions normally encountered in a UASB reactor. This suggests that mass transfer resistance in the liquid film could play a strong role in substrate utilization in UASB reactor systems (Wu el al, 1995). It should be noted that this conclusion was obtain on the basis of the flow regime alone; biogas generation was not taken into account.
When the granule is surrounded by a stagnant liquid layer, the concentration of the substrate in the surface is less than that in the bulk liquid, because of the mass transfer resistance in the stagnant liquid. For the sake of comparison, the concentration profiles inside the particles without and with the stagnant liquid film are shown in Figure 6.4 a) and b). The transfer coefficient, km was assumed to be 0.3 md-1 as suggested by Gonzalez-Gil (2000) to demonstrate that the external resistance could be ignored at a high value of km; and the value of 0.5.10-4 md-1 was arbitrarily taken to show how a low value of km affects the concentration of the substrate inside the
45
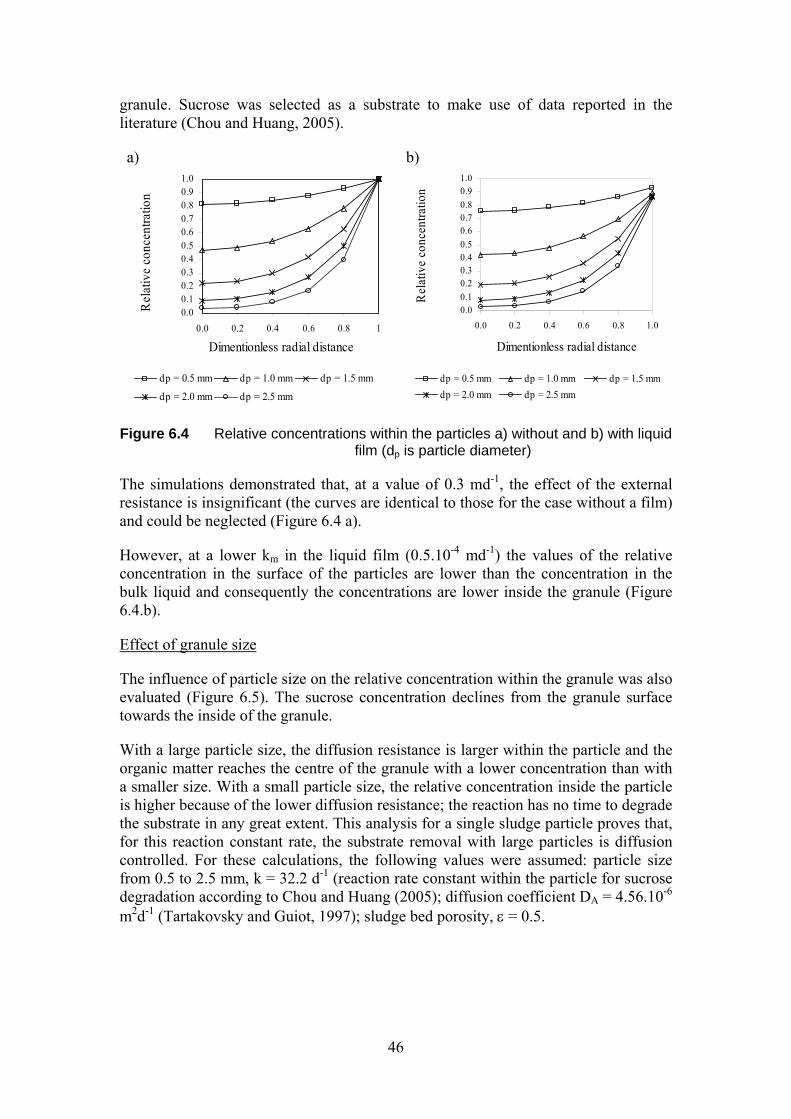
granule. Sucrose was selected as a substrate to make use of data reported in the literature (Chou and Huang, 2005).
a)
0.00.10.20.30.40.50.60.70.80.91.0
0.0 0.2 0.4 0.6 0.8 1
Dimentionless radial distance
Rel
ativ
e co
ncen
tratio
n
dp = 0.5 mm dp = 1.0 mm dp = 1.5 mm
dp = 2.0 mm dp = 2.5 mm
b)
0.00.10.20.30.40.50.60.70.80.91.0
0.0 0.2 0.4 0.6 0.8 1.0
Dimentionless radial distance
Rel
ativ
e co
ncen
tratio
n
dp = 0.5 mm dp = 1.0 mm dp = 1.5 mmdp = 2.0 mm dp = 2.5 mm
Figure 6.4 Relative concentrations within the particles a) without and b) with liquid film (dp is particle diameter)
The simulations demonstrated that, at a value of 0.3 md-1, the effect of the external resistance is insignificant (the curves are identical to those for the case without a film) and could be neglected (Figure 6.4 a).
However, at a lower km in the liquid film (0.5.10-4 md-1) the values of the relative concentration in the surface of the particles are lower than the concentration in the bulk liquid and consequently the concentrations are lower inside the granule (Figure 6.4.b).
Effect of granule size
The influence of particle size on the relative concentration within the granule was also evaluated (Figure 6.5). The sucrose concentration declines from the granule surface towards the inside of the granule.
With a large particle size, the diffusion resistance is larger within the particle and the organic matter reaches the centre of the granule with a lower concentration than with a smaller size. With a small particle size, the relative concentration inside the particle is higher because of the lower diffusion resistance; the reaction has no time to degrade the substrate in any great extent. This analysis for a single sludge particle proves that, for this reaction constant rate, the substrate removal with large particles is diffusion controlled. For these calculations, the following values were assumed: particle size from 0.5 to 2.5 mm, k = 32.2 d-1 (reaction rate constant within the particle for sucrose degradation according to Chou and Huang (2005); diffusion coefficient DA = 4.56.10-6 m2d-1 (Tartakovsky and Guiot, 1997); sludge bed porosity, ε = 0.5.
46
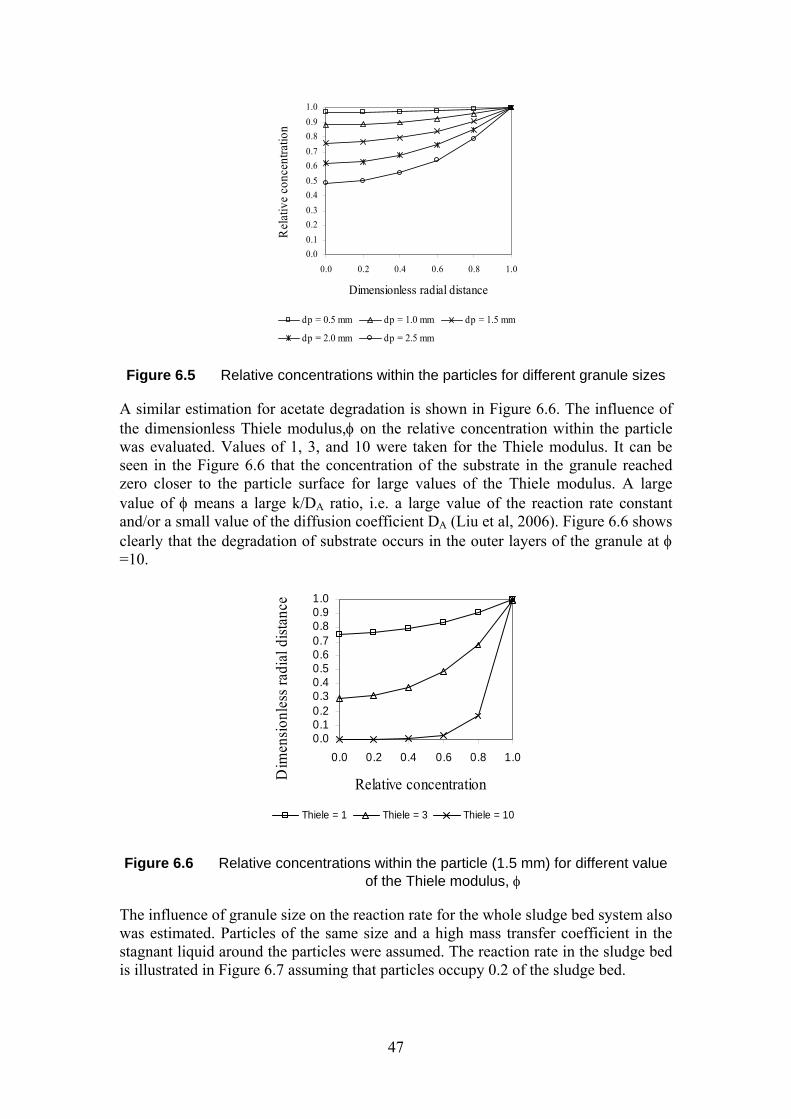
0.00.10.20.30.40.50.60.70.80.91.0
0.0 0.2 0.4 0.6 0.8 1.
Dimensionless radial distanceR
elat
ive
conc
entra
tion
0
dp = 0.5 mm dp = 1.0 mm dp = 1.5 mm
dp = 2.0 mm dp = 2.5 mm
Figure 6.5 Relative concentrations within the particles for different granule sizes
A similar estimation for acetate degradation is shown in Figure 6.6. The influence of the dimensionless Thiele modulus,φ on the relative concentration within the particle was evaluated. Values of 1, 3, and 10 were taken for the Thiele modulus. It can be seen in the Figure 6.6 that the concentration of the substrate in the granule reached zero closer to the particle surface for large values of the Thiele modulus. A large value of φ means a large k/DA ratio, i.e. a large value of the reaction rate constant and/or a small value of the diffusion coefficient DA (Liu et al, 2006). Figure 6.6 shows clearly that the degradation of substrate occurs in the outer layers of the granule at φ =10.
0.00.10.20.30.40.50.60.70.80.91.0
0.0 0.2 0.4 0.6 0.8 1.0
Relative concentration Dim
ensio
nles
s rad
ial d
istan
ce
Thiele = 1 Thiele = 3 Thiele = 10
Figure 6.6 Relative concentrations within the particle (1.5 mm) for different value of the Thiele modulus, φ
The influence of granule size on the reaction rate for the whole sludge bed system also was estimated. Particles of the same size and a high mass transfer coefficient in the stagnant liquid around the particles were assumed. The reaction rate in the sludge bed is illustrated in Figure 6.7 assuming that particles occupy 0.2 of the sludge bed.
47
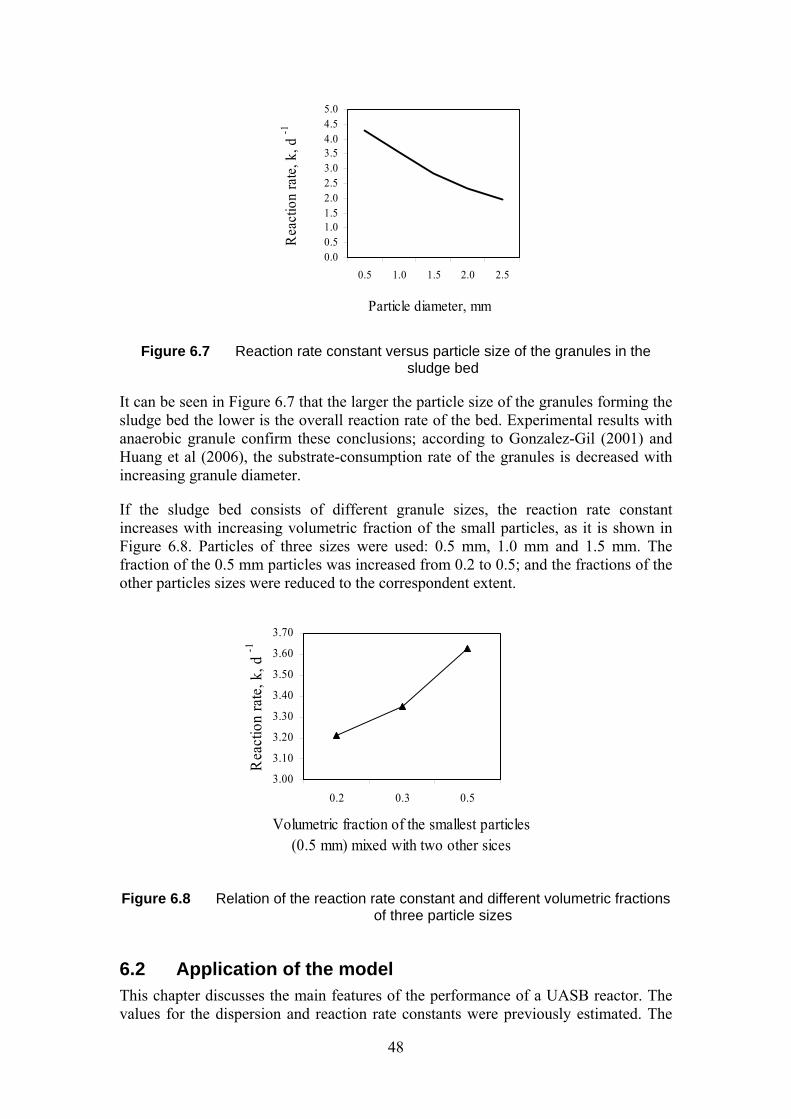
0.00.51.01.52.02.53.03.54.04.55.0
0.5 1.0 1.5 2.0 2.5
Particle diameter, mmR
eact
ion
rate
, k, d
-1
Figure 6.7 Reaction rate constant versus particle size of the granules in the sludge bed
It can be seen in Figure 6.7 that the larger the particle size of the granules forming the sludge bed the lower is the overall reaction rate of the bed. Experimental results with anaerobic granule confirm these conclusions; according to Gonzalez-Gil (2001) and Huang et al (2006), the substrate-consumption rate of the granules is decreased with increasing granule diameter.
If the sludge bed consists of different granule sizes, the reaction rate constant increases with increasing volumetric fraction of the small particles, as it is shown in Figure 6.8. Particles of three sizes were used: 0.5 mm, 1.0 mm and 1.5 mm. The fraction of the 0.5 mm particles was increased from 0.2 to 0.5; and the fractions of the other particles sizes were reduced to the correspondent extent.
3.00
3.10
3.20
3.30
3.40
3.50
3.60
3.70
0.2 0.3 0.5
Volumetric fraction of the smallest particles (0.5 mm) mixed with two other sices
Rea
ctio
n ra
te, k
, d-1
Figure 6.8 Relation of the reaction rate constant and different volumetric fractions of three particle sizes
6.2 Application of the model This chapter discusses the main features of the performance of a UASB reactor. The values for the dispersion and reaction rate constants were previously estimated. The
48

impact of the Pe number, the up-flow velocity inside the reactor and the reaction rate on the reactor performance is then addressed. This was studied by changing the concentration of the effluent (treated) water. The model is applied to two real cases using experimental data published in the literature by Caixeta et al (2002) and Alvarez et al (2006).
Influence of the main parameters on the UASB performance The simulations were performed using the values shown in Table 6.1. The solution for the transient model was used in these cases, but a very long process time was used to ensure that the steady-state had been reached.
The values applied in the simulations are closely related to the values found in the literature for experiments focused on the kinetics and on the values calculated above. The range of variation of the main model parameters is presented in Table 6.1. The simulations were carried out with two fixed parameters (shaded values) and one parameter value was varied in the interval shown in the table.
Table 6.1 Range of variation of the model parameter
Parameters Units Parameters values Pe Vup K
- mh-1
d-1
2 0.35 1.5
10 0.7 2.3
50 1.5 5.0
6.2.1 Effect of dispersion It can be seen in Figure 6.9 that at high Peclet number the mixing at the reactor entrance is low; the substrate concentration at the reactor bottom is very similar to the inlet concentration. The removal for this option is the highest that is indicated by the lowest value of the outlet concentration. The degradation rate is large at the bottom, as may be observed by the larger value of the slope at the bottom. Simulations with Pe=50 correspond to a system close to a plug-flow regime. According to Batstone et al (2005), if Monod of first-order kinetics dominates the processes of degradation, plug flow reactors can be much more effective than those completely or almost completely mixed. On the other hand, to maintain a high Peclet number (plug flow) in the UASB full-scale reactor is impossible, due to the gas production which enormously increases the degree of mixing.
49

Figure 6.9 Relative concentration of substrate in the UASB as a function of the height reactor for different Peclet numbers
When the Peclet number is very low, the concentration at the reactor inlet decreases due to the mixing between the incoming water and the water in the sludge blanket at the bottom. The high dispersion breaks down the concentration gradient. The outlet concentration of substrate shows poor removal efficiency as compared with the other Pe values used in this study. Simulations with Pe=2 provide evidence that excessive mixing reduces the effective treatment removal due to possible back mixing.
Simulations with Pe number values of 50 and 2 correspond to the extreme situations. Intermediate values of Pe may perhaps approach more closely the behaviour inside the reactor for real cases.
In the performed simulations for different dispersion (different Pe numbers), the reaction rate in the reactor was taken to be constant. This is not exactly the actual situation, since the mass transfer between the granules and the bulk liquid is influenced by the dispersion and this consequently affects the efficiency of the treatment. The model can account for the variation in the mass transfer coefficient in the stagnant film, km, with mixing and this can easily be included in the model if data is available. As discussed above, the mass transfer coefficient is a function of the Re and the dispersion in the reactor, but data showing the impact of the mixing on the mass transfer are missing.
At high Pe number (low mixing in the bed), the reaction rate is lower due to a deficient mass transfer in the film, and the substrate removal is lower than it was obtained in the simulations. At low Pe (higher mixing in the bed), the picture would be the opposite.
6.2.2 Effect of the up-flow velocity The up-flow velocity is related to the hydraulic retention time (HRT; a larger up-flow velocity giving a smaller HRT. A laminar flow pattern inside the reactor is expected for the flow velocities usually found in anaerobic biodegradation systems. The up-flow velocity alters the dispersion in the reactor, but its effect is small. If the velocity is increased by a factor 3, the Peclet number varies by only about 12% (see Figure 6.2). Therefore, the up-flow velocity has no large impact on the mass transfer coefficient around the granules under the typical performance conditions of the UASB reactor. On the other hand, the increase in velocity reduces the HRT and the removal
50
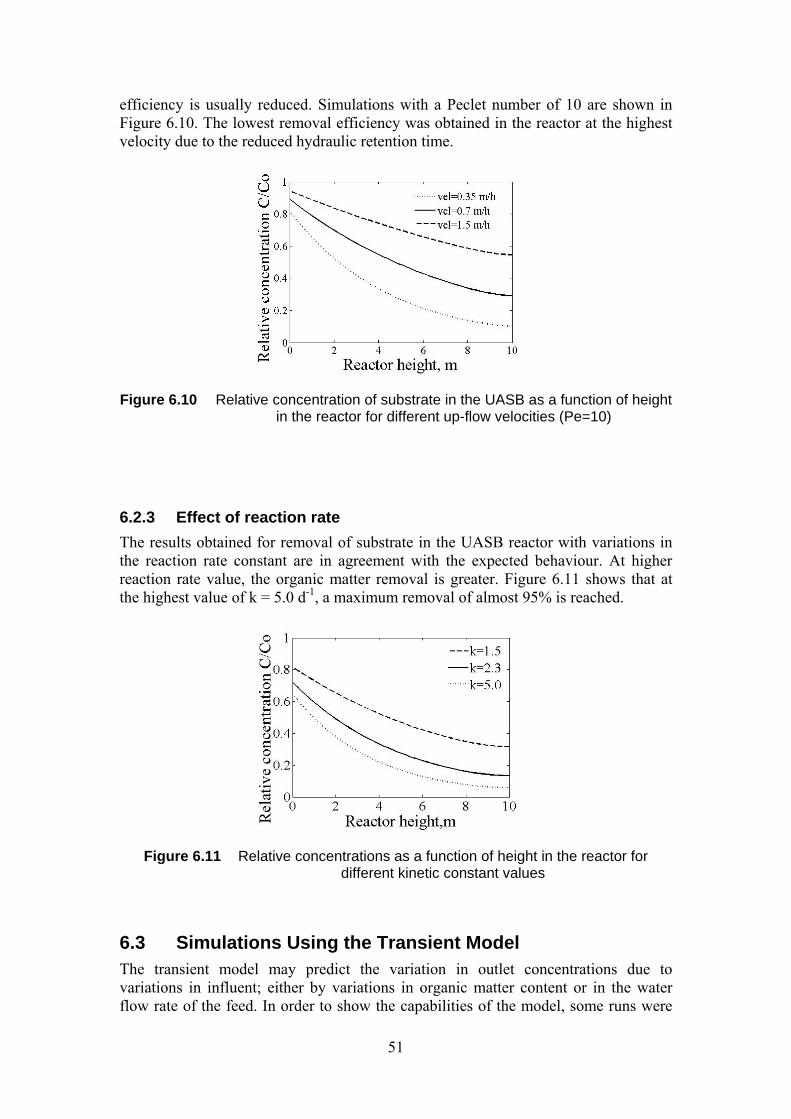
efficiency is usually reduced. Simulations with a Peclet number of 10 are shown in Figure 6.10. The lowest removal efficiency was obtained in the reactor at the highest velocity due to the reduced hydraulic retention time.
Figure 6.10 Relative concentration of substrate in the UASB as a function of height in the reactor for different up-flow velocities (Pe=10)
6.2.3 Effect of reaction rate The results obtained for removal of substrate in the UASB reactor with variations in the reaction rate constant are in agreement with the expected behaviour. At higher reaction rate value, the organic matter removal is greater. Figure 6.11 shows that at the highest value of k = 5.0 d-1, a maximum removal of almost 95% is reached.
Figure 6.11 Relative concentrations as a function of height in the reactor for different kinetic constant values
6.3 Simulations Using the Transient Model The transient model may predict the variation in outlet concentrations due to variations in influent; either by variations in organic matter content or in the water flow rate of the feed. In order to show the capabilities of the model, some runs were
51

performed varying the inlet concentration of substrate. Initially, the model was run with a given inlet concentration for a long time until steady-state conditions were reached. At a given time, the inlet concentration was increased to a new value. The breakthrough concentration from the reactor top was then determined as a function of time.
The simulation was done for the central values (shaded) in Table 6.1 with an initial concentration at the inlet of 500 mg/l, which was then increased to 1000 mg/l. The initial concentration in the reactor was zero. At the start, the outlet concentration started to increase taking some time to reach a stationary state (0.13 kgm-3) as shown in Figure 6.12. When the inlet concentration was changed, the outlet concentration increased to a new value (0.26 kgm-3). The system needed about 0.5 days to stabilise after a change in the inlet concentration. From the simulations, it is observed that the outlet concentration shows the expected behaviour as a function of time, as result of changes in the inlet concentration. This demonstrates the capability of the model to predict this type of variation. A higher flow rate increases the Reynolds number calculated for the particle. Therefore the values of the mass transfer coefficient in the film increase according to equation 6.3. It has been assumed that the microorganism activity remains constant. However, changes in substrate concentration may imply changes in the microorganisms activity due to the new conditions (e.g., the new organic load).
Figure 6.12 Outlet organic concentration change as a function of time with increasing organic content of influent
6.4 Model Application to two real cases The model was applied to two experimental data sets. The first was reported by Alvarez et al (2006), where the performance of an UASB reactor treating diluted municipal wastewater was analysed; and the second was reported by Caixeta et al (2002) with data for slaughterhouse wastewater treated by UASB reactor. These two data sources were selected to evaluate whether the developed model may be used to describe both municipal and complex industrial wastewater.
52
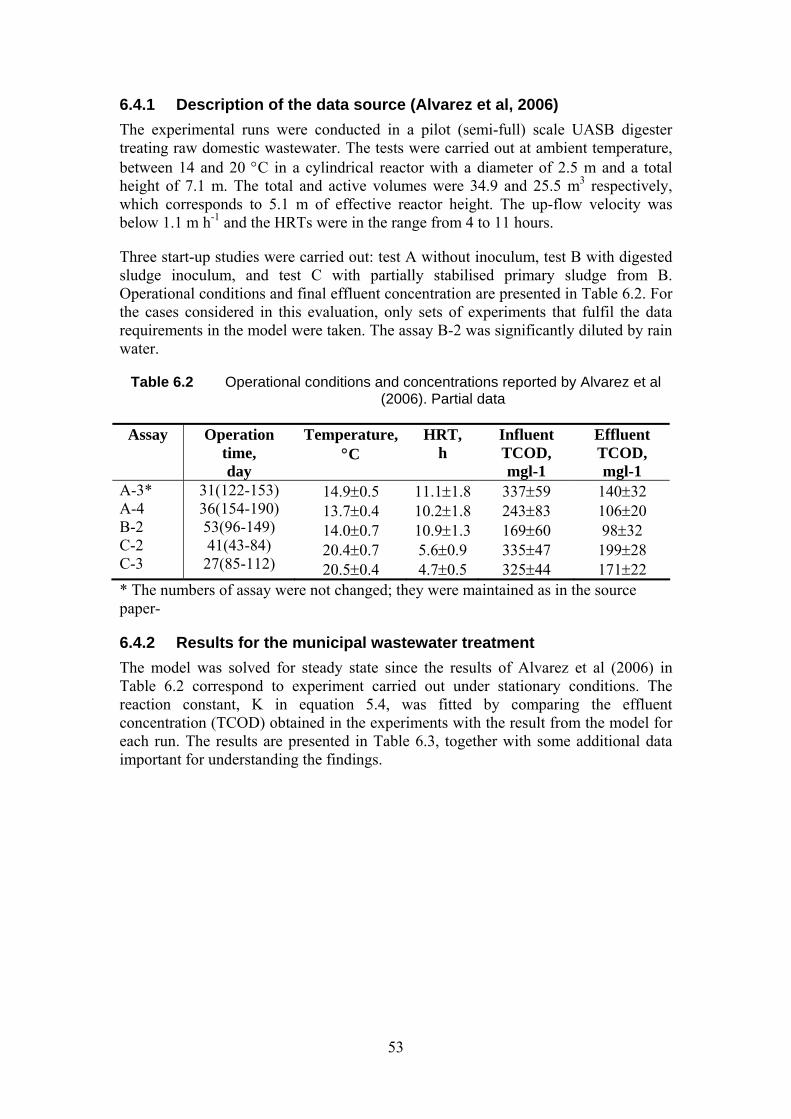
6.4.1 Description of the data source (Alvarez et al, 2006) The experimental runs were conducted in a pilot (semi-full) scale UASB digester treating raw domestic wastewater. The tests were carried out at ambient temperature, between 14 and 20 °C in a cylindrical reactor with a diameter of 2.5 m and a total height of 7.1 m. The total and active volumes were 34.9 and 25.5 m3 respectively, which corresponds to 5.1 m of effective reactor height. The up-flow velocity was below 1.1 m h-1 and the HRTs were in the range from 4 to 11 hours.
Three start-up studies were carried out: test A without inoculum, test B with digested sludge inoculum, and test C with partially stabilised primary sludge from B. Operational conditions and final effluent concentration are presented in Table 6.2. For the cases considered in this evaluation, only sets of experiments that fulfil the data requirements in the model were taken. The assay B-2 was significantly diluted by rain water.
Table 6.2 Operational conditions and concentrations reported by Alvarez et al (2006). Partial data
Assay Operation time, day
Temperature, °C
HRT, h
Influent TCOD, mgl-1
Effluent TCOD, mgl-1
A-3* A-4 B-2 C-2 C-3
31(122-153) 36(154-190) 53(96-149) 41(43-84)
27(85-112)
14.9±0.5 13.7±0.4 14.0±0.7 20.4±0.7 20.5±0.4
11.1±1.8 10.2±1.8 10.9±1.3 5.6±0.9 4.7±0.5
337±59 243±83 169±60 335±47 325±44
140±32 106±20 98±32
199±28 171±22
* The numbers of assay were not changed; they were maintained as in the source paper-
6.4.2 Results for the municipal wastewater treatment The model was solved for steady state since the results of Alvarez et al (2006) in Table 6.2 correspond to experiment carried out under stationary conditions. The reaction constant, K in equation 5.4, was fitted by comparing the effluent concentration (TCOD) obtained in the experiments with the result from the model for each run. The results are presented in Table 6.3, together with some additional data important for understanding the findings.
53
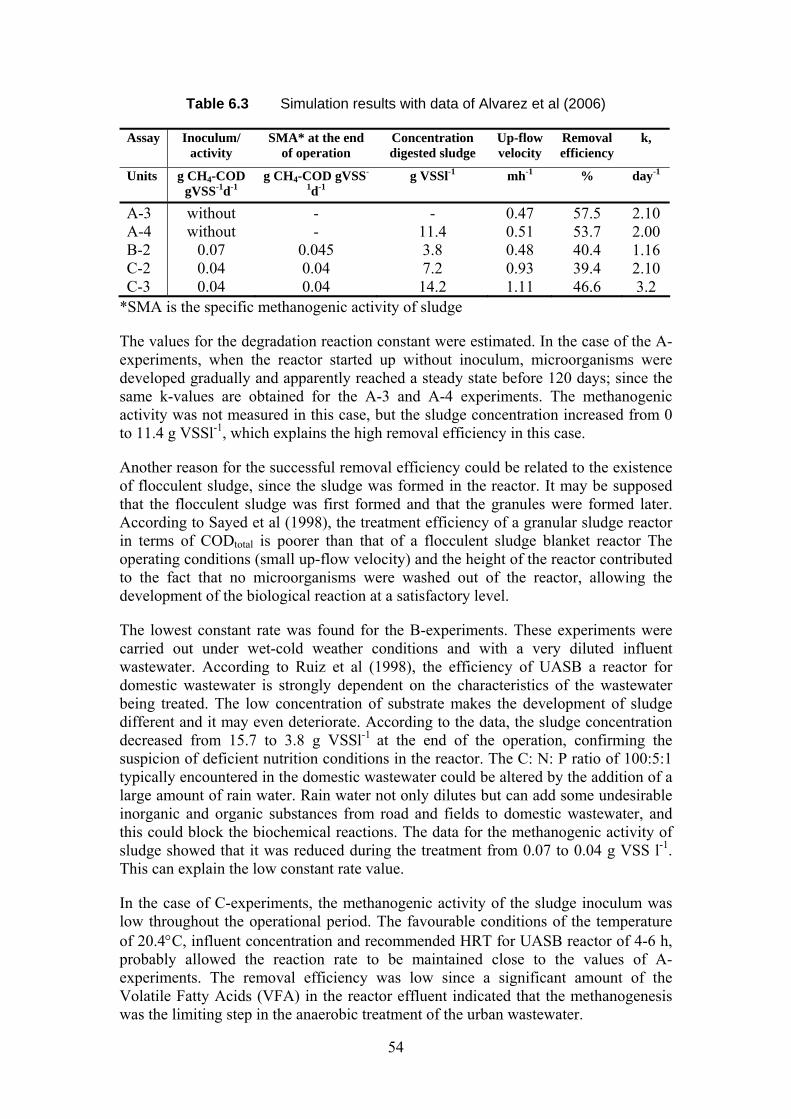
Table 6.3 Simulation results with data of Alvarez et al (2006)
Assay Inoculum/ activity
SMA* at the end of operation
Concentration digested sludge
Up-flow velocity
Removal efficiency
k,
Units g CH4-COD gVSS-1d-1
g CH4-COD gVSS-
1d-1 g VSSl-1
mh-1 % day-1
A-3 A-4 B-2 C-2 C-3
without without
0.07 0.04 0.04
- -
0.045 0.04 0.04
- 11.4 3.8 7.2
14.2
0.47 0.51 0.48 0.93 1.11
57.5 53.7 40.4 39.4 46.6
2.10 2.00 1.16 2.10 3.2
*SMA is the specific methanogenic activity of sludge
The values for the degradation reaction constant were estimated. In the case of the A-experiments, when the reactor started up without inoculum, microorganisms were developed gradually and apparently reached a steady state before 120 days; since the same k-values are obtained for the A-3 and A-4 experiments. The methanogenic activity was not measured in this case, but the sludge concentration increased from 0 to 11.4 g VSSl-1, which explains the high removal efficiency in this case.
Another reason for the successful removal efficiency could be related to the existence of flocculent sludge, since the sludge was formed in the reactor. It may be supposed that the flocculent sludge was first formed and that the granules were formed later. According to Sayed et al (1998), the treatment efficiency of a granular sludge reactor in terms of CODtotal is poorer than that of a flocculent sludge blanket reactor The operating conditions (small up-flow velocity) and the height of the reactor contributed to the fact that no microorganisms were washed out of the reactor, allowing the development of the biological reaction at a satisfactory level.
The lowest constant rate was found for the B-experiments. These experiments were carried out under wet-cold weather conditions and with a very diluted influent wastewater. According to Ruiz et al (1998), the efficiency of UASB a reactor for domestic wastewater is strongly dependent on the characteristics of the wastewater being treated. The low concentration of substrate makes the development of sludge different and it may even deteriorate. According to the data, the sludge concentration decreased from 15.7 to 3.8 g VSSl-1 at the end of the operation, confirming the suspicion of deficient nutrition conditions in the reactor. The C: N: P ratio of 100:5:1 typically encountered in the domestic wastewater could be altered by the addition of a large amount of rain water. Rain water not only dilutes but can add some undesirable inorganic and organic substances from road and fields to domestic wastewater, and this could block the biochemical reactions. The data for the methanogenic activity of sludge showed that it was reduced during the treatment from 0.07 to 0.04 g VSS l-1. This can explain the low constant rate value.
In the case of C-experiments, the methanogenic activity of the sludge inoculum was low throughout the operational period. The favourable conditions of the temperature of 20.4°C, influent concentration and recommended HRT for UASB reactor of 4-6 h, probably allowed the reaction rate to be maintained close to the values of A-experiments. The removal efficiency was low since a significant amount of the Volatile Fatty Acids (VFA) in the reactor effluent indicated that the methanogenesis was the limiting step in the anaerobic treatment of the urban wastewater.
54
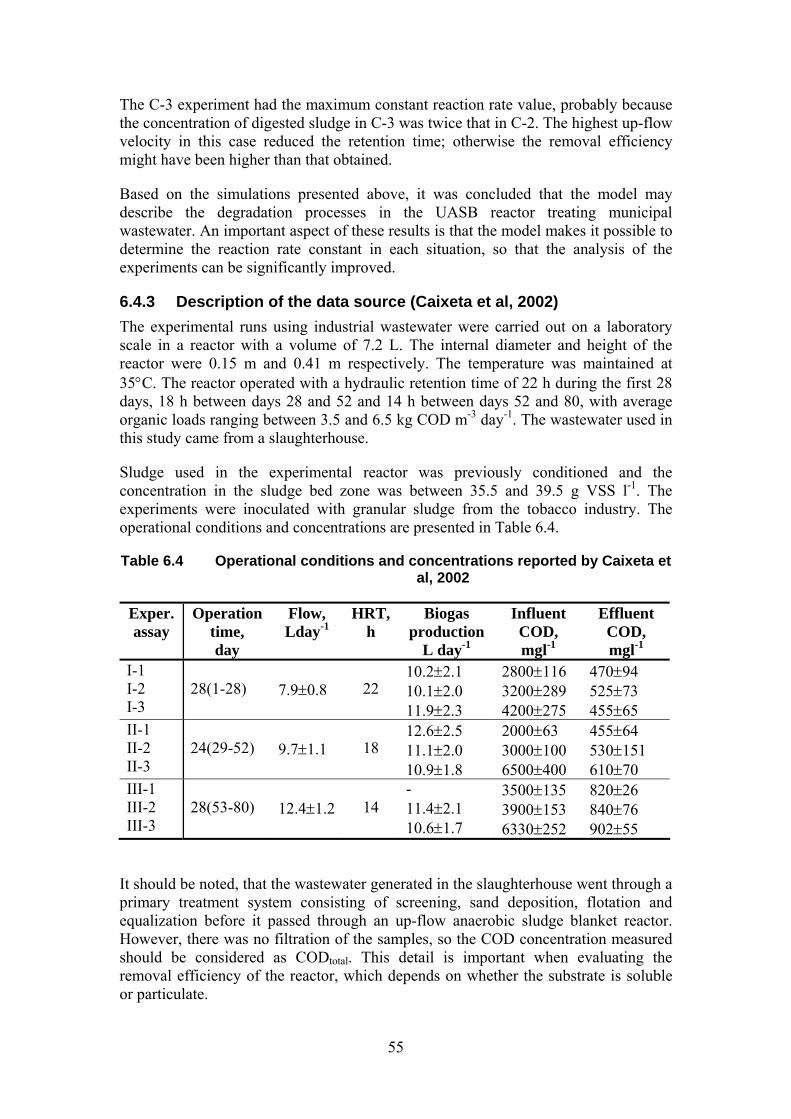
The C-3 experiment had the maximum constant reaction rate value, probably because the concentration of digested sludge in C-3 was twice that in C-2. The highest up-flow velocity in this case reduced the retention time; otherwise the removal efficiency might have been higher than that obtained.
Based on the simulations presented above, it was concluded that the model may describe the degradation processes in the UASB reactor treating municipal wastewater. An important aspect of these results is that the model makes it possible to determine the reaction rate constant in each situation, so that the analysis of the experiments can be significantly improved.
6.4.3 Description of the data source (Caixeta et al, 2002) The experimental runs using industrial wastewater were carried out on a laboratory scale in a reactor with a volume of 7.2 L. The internal diameter and height of the reactor were 0.15 m and 0.41 m respectively. The temperature was maintained at 35°C. The reactor operated with a hydraulic retention time of 22 h during the first 28 days, 18 h between days 28 and 52 and 14 h between days 52 and 80, with average organic loads ranging between 3.5 and 6.5 kg COD m-3 day-1. The wastewater used in this study came from a slaughterhouse.
Sludge used in the experimental reactor was previously conditioned and the concentration in the sludge bed zone was between 35.5 and 39.5 g VSS l-1. The experiments were inoculated with granular sludge from the tobacco industry. The operational conditions and concentrations are presented in Table 6.4.
Table 6.4 Operational conditions and concentrations reported by Caixeta et al, 2002
Exper. assay
Operation time, day
Flow, Lday-1
HRT, h
Biogas production
L day-1
Influent COD, mgl-1
Effluent COD, mgl-1
I-1 I-2 I-3
28(1-28)
7.9±0.8
22
10.2±2.1 10.1±2.0 11.9±2.3
2800±116 3200±289 4200±275
470±94 525±73 455±65
II-1 II-2 II-3
24(29-52)
9.7±1.1
18
12.6±2.5 11.1±2.0 10.9±1.8
2000±63 3000±100 6500±400
455±64 530±151 610±70
III-1 III-2 III-3
28(53-80)
12.4±1.2
14
- 11.4±2.1 10.6±1.7
3500±135 3900±153 6330±252
820±26 840±76 902±55
It should be noted, that the wastewater generated in the slaughterhouse went through a primary treatment system consisting of screening, sand deposition, flotation and equalization before it passed through an up-flow anaerobic sludge blanket reactor. However, there was no filtration of the samples, so the COD concentration measured should be considered as CODtotal. This detail is important when evaluating the removal efficiency of the reactor, which depends on whether the substrate is soluble or particulate.
55
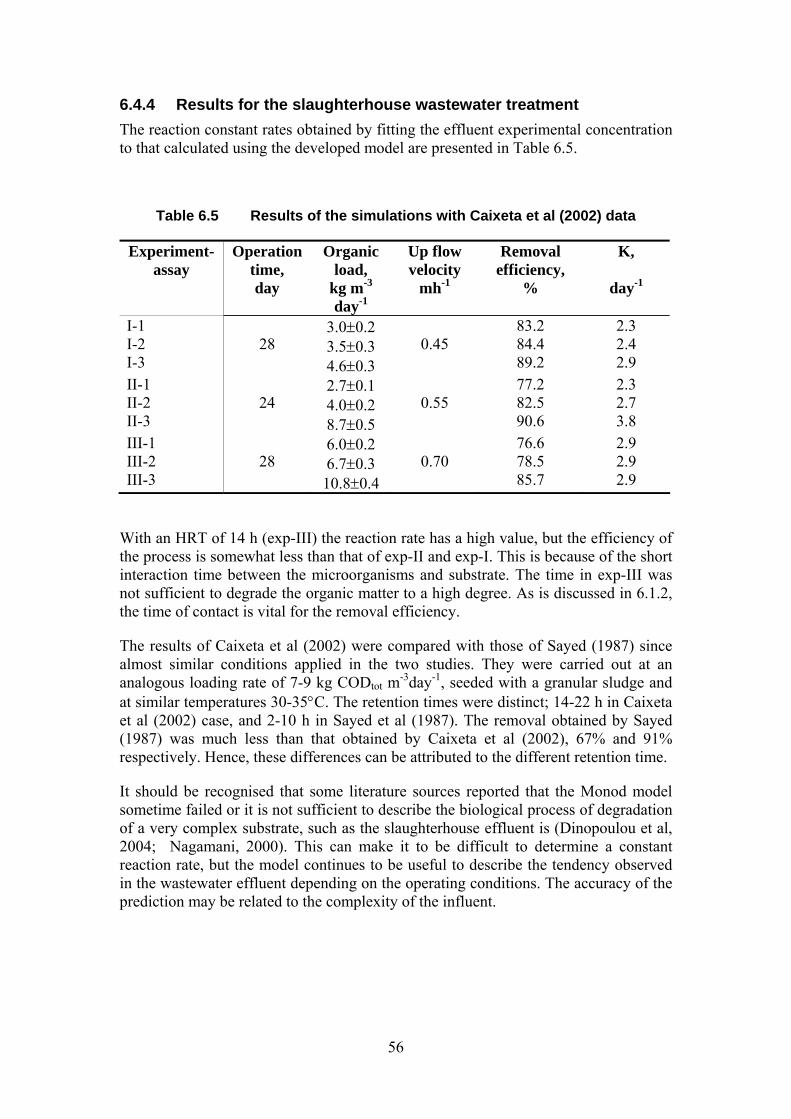
6.4.4 Results for the slaughterhouse wastewater treatment The reaction constant rates obtained by fitting the effluent experimental concentration to that calculated using the developed model are presented in Table 6.5.
Table 6.5 Results of the simulations with Caixeta et al (2002) data
Experiment-assay
Operation time, day
Organic load,
kg m-3 day-1
Up flow velocity
mh-1
Removal efficiency,
%
K,
day-1
I-1 I-2 I-3
28
3.0±0.2 3.5±0.3 4.6±0.3
0.45
83.2 84.4 89.2
2.3 2.4 2.9
II-1 II-2 II-3
24
2.7±0.1 4.0±0.2 8.7±0.5
0.55
77.2 82.5 90.6
2.3 2.7 3.8
III-1 III-2 III-3
28
6.0±0.2 6.7±0.3
10.8±0.4
0.70
76.6 78.5 85.7
2.9 2.9 2.9
With an HRT of 14 h (exp-III) the reaction rate has a high value, but the efficiency of the process is somewhat less than that of exp-II and exp-I. This is because of the short interaction time between the microorganisms and substrate. The time in exp-III was not sufficient to degrade the organic matter to a high degree. As is discussed in 6.1.2, the time of contact is vital for the removal efficiency.
The results of Caixeta et al (2002) were compared with those of Sayed (1987) since almost similar conditions applied in the two studies. They were carried out at an analogous loading rate of 7-9 kg CODtot m-3day-1, seeded with a granular sludge and at similar temperatures 30-35°C. The retention times were distinct; 14-22 h in Caixeta et al (2002) case, and 2-10 h in Sayed et al (1987). The removal obtained by Sayed (1987) was much less than that obtained by Caixeta et al (2002), 67% and 91% respectively. Hence, these differences can be attributed to the different retention time.
It should be recognised that some literature sources reported that the Monod model sometime failed or it is not sufficient to describe the biological process of degradation of a very complex substrate, such as the slaughterhouse effluent is (Dinopoulou et al, 2004; Nagamani, 2000). This can make it to be difficult to determine a constant reaction rate, but the model continues to be useful to describe the tendency observed in the wastewater effluent depending on the operating conditions. The accuracy of the prediction may be related to the complexity of the influent.
56
7 CONCLUSIONS
The composition of sludge generated in three wastewater treatment plants was evaluated. It is concluded that the sludge could be used, for instance, as soil conditioner to improve the soil quality without any risk for the environment.
The physico-chemical properties and methanogenic activity of sludge from seven treatment plants were determined. The highest activity was found in the sludge from the treatment plan in El Viejo city, which means that this sludge could be used as inoculum in new treatment plants. Very useful experience was acquired working with sludge from the municipal treatment plants.
In the case of the brewery wastewater treatment plant, the deficient concentrations of sulphide and iron were probably the reason for the unsatisfactory granular sludge formation. The addition of these elements to the anaerobic reactor was suggested to the authorities of the treatment plant. The hydraulic regime in the anaerobic unit should also be revised.
A model was developed for an up-flow anaerobic sludge blanket (UASB) reactor which can be used to predict the dynamic behaviour of the processes occurring in the reactor, improving the performance of existing systems and helping in the design of new facilities. An important characteristic of the model is that it takes into account in detail the mechanisms occurring in the granule and can handle sludge formed by particles of different sizes acting simultaneously.
The model takes into account the convective, dispersive and biological degradation mechanisms. The main parameters required for the model are, therefore the dispersion and the global reaction rate in addition to the up-flow velocity. These parameters can be experimentally determined. The amount of the sludge and the size of the granules are important parameters influencing the reaction rate.
The model was used to evaluate experiments on laboratory and pilot scales and it was found that the developed model is clearly able to describe the processes occurring in a UASB reactor. At present, the model has been tested with data from the literature, but an experimental determination of the key parameters is in progress.
57

8 REFERENCES
Alvarez, J.A., I. Ruiz, M. Gomez, J. Presas and M. Soto, 2006. Start-up alternatives and performance of an UASB pilot plant treating diluted municipal wastewater at low temperature. Bioresource Technology, 97, 1640-1649. Aragon, K.,1997. Evaluación de los sistemas de lagunas de estabilización recién rehabilitadas por INAA. Diploma work, Department of Chemical Engineering, National University of Engineering, Managua, Nicaragua Batstone, D., J.Hernandez, and J.Schmidt, 2005. Hydraulics of Laboratory and Full-scale up-flow anaerobic sludge blanket (UASB) reactors. Communication to the edotor. Willey Inter-Science, www.interscince.willey.com. Batstone D.J. and J.Keller, 2001. Variation of bulk properties of anaerobic granules with wastewater type. Water research, 35, 7, 1723-1729. Bello-Mendoza, R. and M.Castillo-Rivera, 1998. Start-up of an Anaerobic Hybrid (UASB/Filter) reactor treating wastewater from a coffee processing plant. Anaerobe, 4, 219-225 Bird, R., W.E. Stewart and E.N.Lighfoot, 2001. Transport phenomena. John Wiley & Sons, Second edition, New York. §C.5. Bitton, G., 1999. Wastewater microbiology. New York, W Bolle WL, J. van Breugel, G. van Eybergen, N. Kossen and W. van Gils,1986.An integral dynamic model for the UASB reactor. Biotechnology and Bioengineering 28:1621–1636. Brito, A.G. and L.F.Melo, 1999. Mass Transfer coefficients within anaerobic biofilms: effects of external liquid velocity. Water Research, 33, 17, 3673-3678 Caixeta, C.E., M. Cammarota, A. Xavier, 2002. Slaughterhouse wastewater treatment: evaluation of a new three-phase separation system in a UASP reactor. Bioresource Technology, 81, 61-69. Cakir, F.Y. and M.K.Stenstrom., 2005. Greenhouse gas production: a comparison between aerobic and anaerobic wastewater treatment technology. Water Research, 39, 4197-4203 CEPIS-OPS-OMS, 2000. Evaluación de los Servicios de Agua Potable y Saneamiento en Las Americas. Panamerican Centre of Sanitary Engineering and Environmental Science (CEPIS), Lima, Peru
58
Chartrain, M. and J.G.Zeikus, 1986. Microbial ecophisiology of whey biomethanation: characterization of bacterial trophic populations and prevalent species in continuous cultures. Appl.Eviron.Microbiol, 51, 188-196 Chicon, L., 2000. Metales pesados en lodos de aguas residuals urbanas, Doctored Diploma work, Department Environmental Engineering, University of Malaga. Christiansen, P., L.Hollesen and P.Harremoes, 1995. Liquid film diffusion on reaction rate in submerged biofilters. Water Research, 29, 3, 947-952 Chou, H.H. and J.S.Huang, 2005-1. Role of mass transfer resistance in overall substrate removal rate in up flow anaerobic sludge bed reactors. Journal of Environmental Engineering ASCE/APRIL Chou, H.H. and J.S.Huang, 2005-2. Comparative granule characteristics and biokinetics of sucrose-fed and phenol-fed UASB reactors. Chemosphere, 59, 107-116 Chou, H.H., J.S.Huang and W.F.Hong, 2004. Temperature dependency of granule characteristics of sucrose-fed ad phenol-fed UASB reactors. Chem.Technol. Biotechnol, 79, 797-808 Colleran E. and S.Pender, 2002. Anaerobic biodegradability, methanogenic activity and toxicity test systems: defining the test conditions. [email protected] Dinopoulou, G., R.Sterritt and J.Lester, 2004.Anaerobic acidogenesis of a complex wastewater: Kinetics of growth, inhibition, and product formation. Biotechnology and Bioengineering, 31: 9, 969-978 Dolfing J. and W.Bloemen, 1985. Activity measurement as a tool to characterize the microbial composition of methanogenic environments. Journal of Microbiological Methods, 4, 1-12 ENACAL, 2001. "Situación actual de los sistemas agua potable y alcantarillado sanitario", report. Empresa Nicaragüense de Acueductos y Alcantarillados ENACAL, Nicaragua (In Spanish) ENACAL, 2007. "Inventario de Plantas de Tratamiento de Agua residual domestica en Nicaragua", report. Empresa Nicaragüense de Acueductos y Alcantarillados ENACAL, Nicaragua (In Spanish) Environmental Protection Agency, USA, 2001. Standards for the use or disposal of Sewage Sludge. 40 CFR, parts 503, section 503.13, tables 1,2,3 y 4. Ferreira, E, 2002. Nitrogen contribution of sewage sludge to nutrition of crops, using nuclear techniques, Proceedings 17th WCSS 14-21 August 2002, Thailand. Field J., R.Sierra and Lettinga G., 1988. Ensayos Anaerobios. Proc.4th Symp .on Wastewater Anaerobic Treatment, Villadolid, Spain, 52-81
59
Frankin, RJ., 2001. Full-scale experiences with anaerobic treatment of industrial wastewater. Wat. Sci.Tech., 44, 1-6 Gerardi M., 2003.The microbiology of anaerobic digestion. A John Wiley & Sons, Inc., Publication, New Jersey, USA Gonzalez-Gil, G., Seghezzo, L., Lettinga, G., Kleerebezem, R., 2001. Kinetics and Mass-transfer phenomena in anaerobic granular sludge. Biotechnol Bioeng, 73, 125-134 Gonzalez-Gil, G., Kleerebezem, R., Lettinga, G., 2002. Assessment of metabolic properties and kinetics parameters of methanogenic sludge by on-line methane production rate measurements. Appl. Microbiol. Biotechnol, 58, 248-254 Grotenhuis, J.T., J.C.Kissel, C.M.Plugge, J.M.Stams and A.J.Zehnder, 1991. Role of substrate in particle size distribution of methanogenic granular sludge in UASB reactors. Wat. Res., 25, 21-27 Huang, Ju-Sheng; Charng-Gwo, Jih, Shin-Dow, Lin, and Wen-Huei. Ting, 2003. Process kinetics of UASB reactors treating non-inhibitory substrate. J Chem Technol Biotechnol, 78, 762-772 Huang, Ju-Sheng; Hsin-Hsien, Chou,; Reiko, Ohara, Wu and Chun-Sheng, 2006. Consecutive reaction kinetics involving a layered structure of the granule in UASB reactors. Water Research, 40, 2947-2957 Hutñan M., L.Mrafkova, M.Drtil. and J.Derco, 1999. Methanogenic and nonmethanogenic activity of granulated sludge in anaerobic baffled reactor. Chemical Papers, 53 (6),374-378. Jawed M. and V.Tare, 1999. Microbial composition assessment if anaerobic biomass through methanogenic activity tests. Water SA, 25(3), 345-350 Kalyushnyi, V., V.V Fedorovich, and P.Lens, 2006. Dispersed plug flow model for upflow anaerobic sludge bed reactors with focus on granular sludge dynamics. Industrial Microbiology and Biotechnology, 33, 221-237. Kitsos HM, RS Roberts, W J. Jones and TG. Tornabene, (1992). An experimental study of mass diffusion and reaction rate in an anaerobic biofilm. Biotechnol Bioeng 39:1141-1146 Leitão, R., 2004. Robustness of UASB reactor treating sewage under tropical conditions. Thesis doctoral. Wageningen University, Wageningen, Netherlands. Lettinga, G.A., F.M.Van Velsen, S.W.Hobma, W.J.Zeeuw and A.Klapwijk, 1980. Use of the Up flow Sludge Blanket (USB) Reactor Concept for Biological Wastewater Treatment. Biotechnology and Bioengineering, 22, 699-734. Lettinga, G., 1995. Anaerobic digestion and wastewater treatment systems. Antonie van Leeuwenhoek, 67 (3), 3-28
60
Liu, Y., H-L, Xu, K-Y, Show and J-H, Tay, 2002. Anaerobic granulation technology for wastewater treatment. World Journal of Microbiology and Biotechnology, 18: 99-113 Liu, Y-H., Y-I. He, S-C. Yang, 2006. The settling characteristics and mean settling velocity of granular sludge in upflow anaerobic sludge blanket (UASB) like reactors. Biotechnology Lett, 28, 1673-1678. Macleod, F.A., S.R.Guiot, J.W.Costerton, 1990. Layered structure of bacterial aggregates produced in un up-flow anaerobic sludge bed and filter reactor. Appl.Eviron.Microbiol, 56, 1598-1607 Madigan, M. and J.Martinko, 2005. Brock. biology of Microorganisms. Person education, 11th Ed. MARENA, 1995. Disposiciones para la descarga de aguas residuales domesticas, industriales y agropecuarias en receptores naturales de agua. Gaceta, el órgano oficial del Gobierno de Nicaragua. Marin, P., 1999. Design and start up of an anaerobic fluidised bed reactor. Water Scienc, 40(8), 63-70 Marx, D.H, 1995. Application of municipal sewage sludge to forest and degraded Land. “Agricultural utilisation. Urban and Industrial by–products”. ASA, special publication,.58, USA. MorenoCaselles, J., M.PerezMurcia, A.PerezEspinosa and R.Moral, 1997. Heavy metal pollution in sewage sludges and agricultural impact. Fresenius Environmental Bulletin, 6, (9-10), 519-524 Narnoli, S.K. and Indu Mehrotra, 1996. Sludge blanke of UASB reactor: mathematical simulation. Water Research, 31 (4), 715-726, 1997 Peña, M.R., D.D.Mara, and G. P.Avella, 2006. Dispersion and treatment performance analysis of an UASB reactor under different hydraulic loading rates. Water Research, 40, 445-452 Navarro Y., 2002. Diagnóstico preliminar de los Sistemas de tratamiento de agua residuales domésticos administrados por ENACAL. Managua, Nicaragua. Pérez, J., C.Picioreanu, M.Loosdrecht, 2005. Modelling biofilm and flock diffusion processes based of analytical solution of reaction-diffusion equation. Water Research, 39, 1311-1323 Romero, J.A, 1999. Tratamiento de aguas residuales por lagunas de estabilización. 3ª Edición. Editorial escuela colombiana de Ingeniería, Alfaomega, México.
61
Ruiz, I., M.Soto, M.C.Veiga, P.Ligero, A.Vega and R.Blazquez, 1998. Performance of and biomass characterisation in UASB reactor treating domestic wastewater at ambient temperatura. Water SA, 24 (3), 215-221 Saravanan, V.and Sreekrishnan, T.R., 2007. A mathematical model for a hybrid anaerobic reactor. Journal of Environmental Management, doi:10.1016/j.jenvman.2007.01.036 Saravanan, V., Sreekrishnan, T.R., 2006. Modelling anaerobic biofilm reactors - A review. Journal of Environmental Management, 81, 1-18 Sayed S., L. van Campen and G.Lettinga, 1987 Anaerobic Treatment of Slaughterhouse Waste Using a Granular Sludge UASB Reactor. Biological Wastes Vol. 21, 11-28 Singhal A., J.Gomes, V.Praveen and K.Ramachandran, 1998. Axial Dispersion Model for Upflow Anaerobic Sludge Blanket Reactors, Biotechnol. Prog, 14 (4), 645-648, 1998 Soto M., R.Mendez and J.Lema, 1993. Methanogenic and nonmethanogenic activity test. Theoretical basis and experimental set up. Water Research, 27(8), 1361-1376. Sperling, M., 1996. Comparison among the most frequently used systems for wastewater treatment in developing countries. Water Science and Technology, 33(3), 59-72 Standard Methods for the Examination of Water and Wastewater, 1998. APHA-AWWA-WPCF, 20th edition. Tartakovsky, B. and S. R.Guiot,. 1997. “Modeling and analysis of layered stationary anaerobic granular biofilms.” Biotechnol. Bioeng., 54~2, 122–130. Teixeira, ST., WJ.Melo and E.T.Silva, 2005. Heavy metals in a degraded soil treated with sludge from water treatment plant. Sci.Agric., 62, (5), 498-501 Tchobanoglous G., F.Burton and H.Stensel, 2003. Wastewater engineering. Treatment and reuse. Metcalf & Eddy, 4th edition, USA. Thiele, J.H., M.Chartrain and J.G.Zeikus, 1988. Control of interspecies electron flow during anaerobic digestion: role of flock formation in Syntrophic methanogenesis. Appl.Eviron.Microbiol, 54, 10-19 Ting, Wen and Ju-Sheng Huang, 2006. Influence of mass transfer resistance on overall nitrate removal rate in upflow sludge bed reactor. Chemosphere, 65, 148-158 Van Lier, J.B., P.N.L.Lens and P.L.W.Hulshoff, 2001. Anaerobic treatment for C and S removal in “zero-discharge” paper mills: effects of design on S removal efficiencies. Water Science and Technology, 44, 189-195
62
63
Veronez, RG., AA.Orra, M.Ribeiro, M.Zaiat, SM.Ratusznei and AD.Rodriguez, 2005. A simplified analysis of granule behavior in ASBR and UASN reactors treating low-strength synthetic wastewater. Brazilian Journal of Chemical Engineering, 22, (3), 361-369. Vlyssides, A., E.M.Barampouti and S.Mai, 2007. An alternative approach of UASB dynamic modelling, AIChE Journal, 53, 12, 3269-3276 Vlyssides, A., E.M.Barampouti and S.Mai, 2008. Determination of granule size in a UASB reactor, Journal of Environmental Managment, 86, 660-664 Wasser R., C.Orozco, V.C.Antarero and O.Mesias, 1991.Experiencias sobre el tratamiento anaerobio de las aguas residuales del café en Matagalpa. Proc.Seminar-Workshop on Treatment of Agro-industrial Wastewaters. Cali, Colombia,. Wu, M.M., C.Griddle and R.F.Hickey, 1995. Mass transfer and temperature effects on substrate utilization by brewery granules. Environmental Engineering, 46, 465-475 Wu, M.M.and Hickey R.F, 1997. Dynamic model for UASB reactor including reactor hydraulics, reaction and diffusion. Environmental Engineering, 123, 244-252. Yetilmezsoy, K. and S.Sakar, 2008. Development of empirical models for performance evaluation of UASB reactors treating poultry manure wastewater under different operational conditions. J. Hazardous materials, 153, 532-543 Zandvoort, M., R.Geerts, G.Lettinga and P.Lens, 2003. Methanol degradation in granular sludge reactors at sub-optimal metal concentrations: role of iron, nickel and cobalt. Enzyme and microbial technology, 33, (2-3), 190-198. Zeng, Y., S.J.Mu., S.J.Lou, B.Tartakovsky, S.R.Guiot and P.Wu, 2005. Hydraulic modeling and axial dispersion analysis of UASB reactor. Biochemical Engineering Journal 25, 113-123