anaerobic digestion related r&d research summary for wsu...
TRANSCRIPT

2011–2013
Anaerobic Digestion Related R&D Research Summary for WSU
ARC/WSDA Appendix-A Funds
Craig Frear, Manuel Garcia-
Perez, Chad Kruger, Shulin
Chen
June 30th, 2013

June 30, 2013 ANAEROBIC DIGESTION RELATED R&D RESEARCH SUMMARY
FOR WSU ARC/WSDA APPENDIX-A FUNDS
ii
EXECUTIVE SUMMARY
Washington State University in partnership with the Washington State Department of
Agriculture conducted targeted applied research and extension related to anaerobic digestion and
other energy conversion technologies for dairy, animal and organic waste during the 2011–2013
biennium. Research and extension activities were designed to address the present and future
technical needs of our dairies, emerging clean technology industries, and rural communities. This
report summarizes the major data and conclusions from work in eight general areas.
1. Nutrient recovery from dairy manure
Nutrient recovery has the potential to provide dairy farmers with an economically viable option
for reducing negative air and water quality impacts from current manure management practices.
Various technologies are in development in the United States, each with their own opportunities
and challenges. Work in the last two years focused on two parallel efforts: a more established
effort to commercialize a novel nutrient recovery technology that is incorporated within an
anaerobic digestion platform, and a newer effort to explore opportunities to incorporate nutrient
recovery into the bio-char platform. Within the anaerobic digestion platform, significant progress
has been made over the last two years towards commercializing the novel AIR-TRAP nutrient
recovery technology developed at Washington State University. Currently, four facilities (3
dairies and 1 poultry facility) have operational commercial-scale AIR-TRAP systems. While
demonstration has shown existing technical and economic hurdles that still need to be overcome,
this represents the most facilities using any combined nitrogen and phosphorus nutrient
technology at the commercial scale within the United States.
Within bio-char platform, Washington State University researchers investigated several specific
strategies aimed at improving the ability of bio-chars to recover phosphorus and nitrogen from
dairy liquid wastes. First, they explored whether adding iron and calcium to bio-chars produced
from the pyrolysis of anaerobically digested dairy manure fiber could improve the bio-char’s
ability to recover phosphate from a liquid waste stream. The highest removal of phosphate, 53%
after 12 hours, resulted when calcium was added to the dairy manure fiber prior to pyrolysis. A
separate set of experiments were conducted to examine the effect pyrolysis temperature had on
oxygen complexes formed on bio-char surfaces by post-pyrolysis air oxidation, with the best
results obtained at 250°C. These oxygen complexes are an indicator of ammonium removal
capabilities as shown by experiments that determined a linear correlation between oxygen
complexes and ammonium removal capabilities.
Using the data collected in these experiments, researchers determined the approximate amount of
nitrogen and phosphorus that could be removed from a hypothetical 1,000 cow dairy operation
using a bio-char filtration system that could be deployed via a truck trailer to adsorb nutrients
prior to field application of effluent. Results indicated that approximately 1–5 tons of char per
day would be required if a concentration of 50–100 mg (P)/L was assumed (this assumes that
80–90% of phosphorus exists as colloidal solids that can be removed by other methods). If all
the phosphorus is assumed to be ionic phosphate, approximately 10–20 tons of bio-char per day
would be required.

June 30, 2013 ANAEROBIC DIGESTION RELATED R&D RESEARCH SUMMARY
FOR WSU ARC/WSDA APPENDIX-A FUNDS
iii
Similar estimations were made of the amount of modified char required to treat dairy effluent at
various total ammonia nitrogen (TAN) loadings at a hypothetical 1,000 cow dairy operation,
assuming an upper limit of 1.5 g/L ammonia in effluent, with 200–500 mg/L after NR. Results
indicated that 5–40 tons per day of oxidized char would be required to treat the effluent
produced, with a maximum of 115 tons. Though the lower range is reasonable, the upper range
would likely lead to significant material handling difficulty. An additional concern is competitive
inhibition of ammonium recovery by sodium (Na) and K, both of which are present in significant
quantities. Based on these results, effective ammonium filtration may be feasible if ideal
conditions for the generation of high surface area and high acidity chars can be achieved at
pyrolysis temperatures between 550 and 600°C and oxidation for less than 1 hr at a temperature
of approximately 250°C. Any filtration system developed will depend heavily on the final
concentration of TAN requiring filtration and the concentration of competing cations such as Na
and K present in the effluent.
2. Anaerobic sequence batch reactors
Anaerobically digesting flushed dairy manure requires larger digesters than scraped manure to
handle the volume of influent needing treatment, raising costs. To address this, various
techniques have been developed to reduce the substrate volume by separating the liquid and solid
fractions. Unfortunately, this results in a loss of up to half of the organic matter, reducing
digester performance. An alternate approach to minimize the required reactor size is an anaerobic
sequence batch reactor approach, developed at Washington State University. By utilizing dairy
manure fiber as a biofilm, biogas production is enhanced and a high rate process, requiring less
volume, is achieved. Results indicated that a low hydraulic retention time of 4–6 days and
relatively high organic loading rate of 0.5–1.3 g VSloaded/L/day was achievable in the anaerobic
sequence batch reactor at a temperature of 22°C.
Researchers subsequently investigated the microbial community dominating at this low hydraulic
retention time and temperature, to better understand the factors contributing to AD performance.
Analysis with 16S rRNA and terminal restriction fragment length polymorphism indicated the
reactor had established a population dominated by Methanosarcina. This is notable since
Methanosarcina are known to create a more stable and efficient anaerobic process.
Methanosarcina, the most versatile methanogens, have a higher substrate utilization rate, growth
rate and cell yield when exposed to an environment with relatively high acetate and hydrogen
concentration, such as is experienced in dilute manure treated at short hydraulic retention times.
3. Biogas purification within the anaerobic digestion-nutrient recovery platform
In the Pacific Northwest low received electrical prices negatively impact the economics of
anaerobic digestion projects. One way to improve economics and ensure that additional
anaerobic digestion projects are installed is to develop simple and inexpensive ways to upgrade
biogas to renewable natural gas or pipeline quality gas which receives a higher price.
Consequently, biogas purification within the AIR-TRAP nutrient recovery system was
investigated. The effluent coming out of the nutrient recovery system has been stripped of carbon
dioxide via aeration and high temperature, which increases the pH of the effluent to greater than

June 30, 2013 ANAEROBIC DIGESTION RELATED R&D RESEARCH SUMMARY
FOR WSU ARC/WSDA APPENDIX-A FUNDS
iv
9.7. At this high pH, the effluent can be used to remove hydrogen sulfide and carbon dioxide
from raw biogas derived from dairy manure and other organic substrates. Researchers utilized a
bubble column reactor as the absorption column because it is relatively inexpensive to build and
easy to maintain. Researchers achieved nearly 100% removal of hydrogen sulfide by optimizing
the bubble column reactor for hydrogen sulfide removal, through a combination of large bubbles,
high flow rate, and low effluent height. Commercialization of this technique for the complete
removal of hydrogen sulfide is currently underway with the assistance of DVO Inc., with the
ultimate goal of removing both hydrogen sulfide and carbon dioxide from raw biogas.
4. Anaerobic digestion on small dairies
Unfortunately, anaerobic digestion is currently not a viable option for small scale dairy
operations utilizing the traditional business model of electrical generation. In this project,
researchers installed and tested of a new design on a boutique diary operation located near
Seattle, Washington. As Cherry Valley Dairy transitioned to a boutique model, it was looking to
anaerobic digestion to improve waste management and sustainability of its operation, while
reducing odors and generating renewable heat energy. To meet these needs, Washington State
University and Andgar Corp. designed a new, lower cost, anaerobic digestion reactor. Instead of
utilizing an expensive engine to produce electricity and heat, the biogas was used to produce
thermal energy for the heating/chilling of Cherry Valley Dairy’s new micro-processing facility
via a boiler and condenser. The unit was installed and began operation in July of 2012. As of
mid-July 2012, it was operating at temperature (~ 38°C) and producing biogas. As of March
2013, the unit was making approximately 100 cubic feet of biogas per day. Unfortunately, the
biogas was of poor quality, containing less than 10% methane. The team is currently seeking
additional funding for further evaluation of management, financial and environmental
implications.
5. Pretreatment of fibrous feedstock for entry into digester
Pretreatment is one way to improve the digestibility of cellulosic material, including dairy
manure and lignocellulosic wastes such as lawn clippings. Improving digestibility through
pretreatment of the fiber could improve digester efficiency and raise biogas production.
Therefore, researchers investigated the effects of three pretreatment techniques on grass samples:
soaking aqueous ammonia pretreatment, ozone pretreatment and the combination of soaking
aqueous ammonia and ozone pretreatment. Enzymatic hydrolysis showed that the highest sugar
recovery (~ 90%) resulted from the combination of the two pretreatments. Although the soaking
aqueous ammonia did not achieve the highest biogas production, the authors tentatively
recommend this pretreatment as the best option for pretreating dairy manure fiber, based on the
fact that this process does not require any special handling, as well as the potential for synergies
when integrated with the AIR-TRAP nutrient recovery system. Further techno-economical
analysis will be required to support this conclusion, and additional experiments are planned to
see how this pretreatment effects the anaerobic digestion of dairy manure fiber.

June 30, 2013 ANAEROBIC DIGESTION RELATED R&D RESEARCH SUMMARY
FOR WSU ARC/WSDA APPENDIX-A FUNDS
v
6. Anaerobic digestion of algal biomass residues with nutrient recycling
As interest continues to intensify in lipid extraction from algae for energy production, there is a
parallel interest developing in anaerobic digestion of algal biomass residues that remain.
Scientists at Washington State University working alongside scientists at the National
Renewable Energy Laboratory investigated the biochemical methane potential of five algal
strains including Chlorella vulgaris, Phaeodactylum tricornutum, Nannochloropsis sp.,
Nannochloropsis salina, and Nanofrustulum sp., Eustigmatophyceae, Bacillariophyceae, and
Chlorophyceae. Five different solvents were utilized for extracting the lipid from the cell. The
studies performed at Washington State University resulted in a number of key findings. One
unexpected conclusion was the significant inhibitory effect that a few of the solvents had when
the extracted biomass was anaerobically digested. In the most extreme example, use of the
solvent chloroform/methanol solvent resulted in almost no methane production when the algal
biomass was digested.
Other research will facilitate ongoing research on digestion of algal biomass. A linear
relationship between specific methane potential and ash-free lipid content was determined,
showing the strong relationship between long chain fatty acid content and methane production.
This may reduce the need for costly and time-consuming biochemical methane potential studies
on microalgae biomass. Another important parameter that effected biogas production was the
inoculum to substrate ratio. As this ratio increased, so did the biogas production, though the
presence of long chain fatty acids had inhibitory effects on the biogas production. This provides
further evidence that long chain fatty acids should be monitored for successful digestion of algal
biomass.
7. Extension and support for transfer of anaerobic digestion technologies
Extension and support for transfer of anaerobic digestion technologies is instrumental for the
continued adoption of anaerobic digestion in the region and the development of the anaerobic
digestion industry. Dr. Frear continued to lead project development, Pro Forma analysis and pre-
engineering efforts for several projects including the PacifiClean and Outlook POD projects in
the State of Washington. In addition, Dr. Frear has continued to explore more sustainable ways
to produce desired nutrient recovery co-products with the help of industry leaders, scientists at
the Prosser campus, and farmers. Finally, Dr. Frear attended and presented at 17 conferences
throughout this biennium to promote the adoption of anaerobic digestion and nutrient recovery.
Another important aspect of this project was to provide information to governmental leaders and
others on anaerobic digestion and nutrient recovery. With this goal in mind, the extension team
produced a nutrient recovery webinar, an anaerobic digestion/nutrient recovery field day, a
nutrient recovery fact sheet, a financial fact sheet, an anaerobic digestion project overview video,
and an anaerobic digestion workshop at the Bioenergy Research Symposium. This strategy
combined “in person” opportunities to ask questions and generate discussion of issues, along
with “durable” products such as the video that individuals can return to over time, or use in their
own work. Each of these educational tools was aimed at broadening the understanding of
anaerobic digestion and nutrient recovery, with both general information on the rationale, and in-
depth information on specific topics (e.g. economics, various technologies, end use of products).

June 30, 2013 ANAEROBIC DIGESTION RELATED R&D RESEARCH SUMMARY
FOR WSU ARC/WSDA APPENDIX-A FUNDS
vi
Hopefully, these efforts will provide policy makers with a better understanding of the positive
impacts anaerobic digestion and nutrient recovery can have on waste management, renewable
energy generation, and nutrient mitigation.
8. Smaller projects on various anaerobic digestion topics
In addition to the seven major bodies of work, researchers at Washington State University
carried out several smaller projects, including explorations of (1) psychrophilic (low
temperature) anaerobic digestion, (2) carboxylate platforms, and (3) methane super-saturation.
While mesophilic anaerobic digestion is more efficient than digestion at lower temperatures, it
can be problematic to operate stably in regions with cold temperatures during winter months due
to thermal constraints and economics. Therefore, researchers isolated high performance
psychrophilic consortium from low temperature environments. Results indicated that microbial
consortium sampled from well-established digesters located in Heilongjiang, China showed the
highest production of biogas. If ongoing microbial analysis confirms that the anaerobic bacteria
found in these digesters are in fact psychrophilic, these populations will be used in ongoing work
on psychrophilic anaerobic digestion.
A separate investigation was conducted to see whether or not algal biomass could be
anaerobically digested to produce carboxylic acids since these products are used in the
production of polymers, pharmaceuticals, solvents, and food additives. The research used a
mixed culture of cow rumen bacteria for the transformation of microalgal biomass to
carboxylates using anaerobic sequence batch reactor technology. Results indicated that a
maximum total carboxylic acid concentration of 14.68±0.31 g/L liquid was achieved after a 20
day digestion period. Production of carboxylates was impacted by the hydraulic retention time,
with the highest production occurring at a hydraulic retention time of 12 days. Given that many
studies have suggested that the biogas potential from algal biomass is too small to be viable, this
research suggests that carboxylate salts may represent a better production goal. Construction of a
clone library to determine the bacterial community that is dominating during the 12 day
hydraulic retention time is currently underway.
The final study that was conducted investigated ways to reduce methane supersaturation in
effluent from anaerobic digestion. Methane supersaturation occurs when methane remains
dissolved within the effluent during the anaerobic digestion process. Other researchers have
reported that this can account for roughly 40 to more than 60% of the theoretical methane
potential in the reactors (Agrawal et al. 1997; Souza et al. 2011) (Singh et al. 1998). This reduces
the renewable energy production and greenhouse gas mitigation impact of digesters. To
investigate low-cost methods for reducing methane supersaturation, researchers utilized a
vacuum pump to treat the digester effluent from a continuous stirred-tank reactor. Results
indicated that over 10 ml of CH4/L could be removed at a temperature of 55°C. In addition, a
relatively high percentage of dissolved carbon dioxide was recovered during the experiments,
which simultaneously raised the pH of the effluent above 9. This is an important side effect since
it indicates that the process might generate benefits if integrated with ammonia stripping. In
some nutrient recovery technologies, alkali, a relatively expensive input, is used to raise the pH
and enable recovery of nitrogen. An economic analysis will need to be carried out to determine

June 30, 2013 ANAEROBIC DIGESTION RELATED R&D RESEARCH SUMMARY
FOR WSU ARC/WSDA APPENDIX-A FUNDS
vii
whether degassing through a vacuum pump (with associated energy costs) should replace the
alkali used in traditional ammonia stripping techniques.
Links to more detailed data analyses for each of these projects will be available on an anaerobic
digestion website hosted by Washington State University’s Center for Sustaining Agriculture and
Natural Resources, currently under construction.

June 30, 2013 ANAEROBIC DIGESTION RELATED R&D RESEARCH SUMMARY
FOR WSU ARC/WSDA APPENDIX-A FUNDS
viii
Table of Contents
Page
EXECUTIVE SUMMARY II
1. Nutrient recovery from dairy manure ii
2. Anaerobic sequence batch reactors iii
3. Biogas purification within the anaerobic digestion-nutrient recovery platform iii
4. Anaerobic digestion on small dairies iv
5. Pretreatment of fibrous feedstock for entry into digester iv
6. Anaerobic digestion of algal biomass residues with nutrient recycling v
7. Extension and support for transfer of anaerobic digestion technologies v
8. Smaller projects on various anaerobic digestion topics vi
LIST OF FIGURES AND TABLES XI
Figures xi
Tables xiv
CHAPTER 1: NUTRIENT RECOVERY WITHIN ANAEROBIC DIGESTION AND BIO-CHAR PLATFORMS 1
1.1 Nutrient recovery within the anaerobic digestion application 1 1.1.1 Introduction 1 1.1.2 Background 1 1.1.3 Commercialization progress and performance 6
1.2 Nutrient recovery within bio-char platform 8 1.2.1 Introduction 8 1.2.2 Background 8 1.2.3 Experimental tests to modify bio-chars 9 1.2.4 Implications for future directions of the research 15
CHAPTER 2: FLUSH DAIRY AND ANAEROBIC SEQUENCE BATCH REACTOR APPROACH 17
2.1 Introduction 17 2.2 Developing novel ways to enhance biogas production using anaerobic sequence batch reactor technology and dairy manure fiber 18 2.3 Conclusions 22

June 30, 2013 ANAEROBIC DIGESTION RELATED R&D RESEARCH SUMMARY
FOR WSU ARC/WSDA APPENDIX-A FUNDS
ix
CHAPTER 3: BIOGAS PURIFICATION WITHIN THE ANAEROBIC DIGESTION/NUTRIENT RECOVERY PLATFORM 23
3.1 Introduction 23 3.2 The selective removal of hydrogen sulfide over carbon dioxide from biogas in a bubble column reactor 25 3.3 Conclusions 27
CHAPTER 4: ANAEROBIC DIGESTION ON SMALL-SIZED DAIRIES 28 4.1 Introduction 28 4.2 Demonstration of a small-scale digester at a dairy in an urban setting 30 4.3 Conclusions 31
CHAPTER 5: PRETREATMENT OF FIBROUS FEEDSTOCK FOR ENTRY INTO DIGESTER 32
5.1 Introduction 32 5.2 Pretreatment of lignocellulosic material 33 5.3 Pretreatment and anaerobic digestion 35 5.4 Pretreatment and composition analysis of lawn grass 37 5.5 Developing pretreatment technologies for improved enzymatic hydrolysis 38 5.6 Utilizing untreated and pretreated grass clippings for methane production 38 5.7 Conclusions 39
CHAPTER 6: ANAEROBIC DIGESTION OF ALGAL BIOMASS RESIDUES WITH NUTRIENT RECYCLE 41
6.1 Introduction 41 6.2 Whole cell microalgae and lipid-extracted microalgae residue 42 6.3 Bench-scale and scale-up microalgae digestion 42 6.4 Conclusions 48
CHAPTER 7: ANAEROBIC DIGESTION EXTENSION - TECH TRANSFER PROJECT 49
CHAPTER 8: MISCELLANEOUS RESEARCH 53
8.1 Psychrophilic anaerobic digestion 53 8.1.1 Introduction 53 8.1.2 Biogas production from various low temperature sources 54 8.1.2.1 Results and discussion 54 8.1.2.2 Conclusions 55 8.1.3 Enhancing biogas production of psychrophilic anaerobic digestion with the addition of trace elements 56 8.1.3.1 Results and discussion 56 8.1.3.2 Conclusions 57
8.2 Carboxylate Platforms 58 8.2.1 Introduction 58 8.2.2 Materials and methods 59 8.2.2.1 Feedstock and inoculum source 59 8.2.2.2 Bioreactor construction and performance monitoring 60 8.2.2.3 Analytical methods 62 8.2.2.4 Molecular analysis of bacterial communities 63

June 30, 2013 ANAEROBIC DIGESTION RELATED R&D RESEARCH SUMMARY
FOR WSU ARC/WSDA APPENDIX-A FUNDS
x
8.2.2.5 Nucleotide sequence accession numbers 63 8.2.3 Results and discussion 64 8.2.3.1 Characteristics of S. dimorphus biomass 64 8.2.2.2 Carboxylic acids production in anaerobic sequence batch reactor with different hydraulic retention times 64 8.2.2.3 Terminal restriction fragment length polymorphism analysis of bacterial community at different hydraulic retention time 66 8.2.4 Conclusions 67
8.3 Methane Super-saturation 68 8.3.1 Introduction 68 8.3.2 Materials and methods 68 8.3.3 Results and discussion 70 8.3.4 Conclusions 72

June 30, 2013 ANAEROBIC DIGESTION RELATED R&D RESEARCH SUMMARY
FOR WSU ARC/WSDA APPENDIX-A FUNDS
xi
List of Figures and Tables
Page
Figures
Figure 1.1: Integrated pyrolysis-AD systems for the production of methane (CH4),
heat, and bio-char enriched in nutrients and clean water. ..................................9
Figure 1.2: Diagram of treatments to screen pre- and post-pyrolysis treatment of bio-
chars .................................................................................................................10
Figure 1.3: Formation of carboxylic acid groups under different oxidation conditions ....11
Figure 1.4: Ammonium adsorption vs. total carboxylic groups from ozone oxidation .....12
Figure 1.5: Portable lagoon filtering system ......................................................................14
Figure 1.6: Concentration profile for adsorption with Ca-infused bio-char in a packed
bed column .......................................................................................................15
Figure 2.1: Different manure management strategies available for dairy operations ........17
Figure 2.2: Scanning electron microscope rod and coccoid microbial cells attached to
the fiber (left) and fluorescence in situ hybridization image shows
fermentative bacteria attached on the surface of fiber and methanogens
distributed on the outer layer of biofilm (right) ...............................................19
Figure 2.3: ASBR process divided into six stages to enhance the retention of biomass
for improved biogas production and digester efficiency (Wang et al. 2011) 20
Figure 2.4: Phylogenetic relationship among 18 OTUs with partial 16S rRNA gene
sequences of known methanogenic Archaea based on the neighbor-joining
analysis .............................................................................................................22
Figure 3.1: Multiple paths through which biogas can be used as renewable energy/fuel
(Weiland 2006) ...............................................................................................24
Figure 3.2: Ammonia and P recovery system with attached H2S and CO2 removal .........24
Figure 3.3: H2S removal efficiency using an airstone sparger (C1) and inlet orifice
(C2); photographs were taken with a high speed camera in water ...................26
Figure 3.4: Affect of effluent height (left) and superficially velocity (right) on the H2S
removal efficiency and G/L ratio .....................................................................26
Figure 4.1: Capital cost per cow of different digester configurations (AgSTAR 2010) ...28
Figure 4.2: Small to medium sized dairy operations in WA ..............................................29

June 30, 2013 ANAEROBIC DIGESTION RELATED R&D RESEARCH SUMMARY
FOR WSU ARC/WSDA APPENDIX-A FUNDS
xii
Figure 4.3: Small-scale vertical mixed plug flow digester with a hot water heater for
heat generation located CVD near Seattle, WA ...............................................30
Figure 5.1: Schematic of the role of pretreatment in the conversion of biomass to fuel
(Kumar et al. 2009) ..........................................................................................32
Figure 5.2: The structure of a cellulosome (Schwarz 2001) .............................................35
Figure 5.3: Biomethane productions of different grass treatments ...................................39
Figure 6.1: Algae cultivation with AD and nutrient recycle—either whole cell or
residue ..............................................................................................................42
Figure 6.2: Relationship between ash-free lipid content and SMP for microalgae
biomass ............................................................................................................44
Figure 6.3: Biogas production curves for digestion of NS1 (A) and NS2 (B) at various
I/S ratios ...........................................................................................................44
Figure 6.4: Effects of dosing Ca on CH4 production from NS1 (left) and NS2 biomass
(right) ..............................................................................................................45
Figure 6.5: Biogas production curves from BMP tests on whole cell biomass .................46
Figure 6.6: CH4 production during digestion of N1 treated with different solvents A:
Chloroform/methanol (2:1); B: Hexane/isopropanol (3:2); C:
Dichloroethane/methanol (1:1); D: Dichloroethane/ethanol (1:1); E:
Acetone/Dichloroethane (1:1) .........................................................................46
Figure 6.7: CH4 production from NS1 (top) and NS2 (bottom) digester at different
OLR..................................................................................................................47
Figure 8.1.1: Biogas production from 10 low temperature consortiums (triplicate) ........55
Figure 8.1.2: Biogas production of SH inoculated digester (left) and LD inoculated
digester (right) ................................................................................................57
Figure 8.2.1: Overview of the CBP from algal biomass to carboxylate salts ....................59
Figure 8.2.2: Schematic of the fermentation process with attached monitoring system ...61
Figure 8.2.3: The total acid concentration for the lab-scale ASBR bioreactor at a 12-
day HRT ...........................................................................................................65
Figure 8.2.4: T-RFLP pattern of PCR-amplified nearly full-length bacterial 16S rRNA
genes of different HRTs digested with the restriction enzyme Hae III ...........66
Figure 8.3.1: CSTR reactor with attached vacuum pump and gas collection system ........69
Figure 8.3.2: D-CH4 recovery at various temperatures and mixing speeds .......................70
Figure 8.3.3: Recovery of D-CO2 (left) and D-H2S (right) at various temperatures and
mixing speeds...................................................................................................71

June 30, 2013 ANAEROBIC DIGESTION RELATED R&D RESEARCH SUMMARY
FOR WSU ARC/WSDA APPENDIX-A FUNDS
xiii
Figure 8.3.4: pH of the effluent at various temperatures and mixing speeds ....................72

June 30, 2013 ANAEROBIC DIGESTION RELATED R&D RESEARCH SUMMARY
FOR WSU ARC/WSDA APPENDIX-A FUNDS
xiv
Tables
Table 1.1: Summary of P removal and mineral leaching from various treated chars ........10
Table 1.2: Annual tons of char required to remove ionic phosphorous from the effluent
water of 1,000 cows dairy given different retention rates ..............................12
Table 1.3: Annual char required to remove TAN from solution in a 1,000 cow dairy
(left) and metal cation concentrations in digester effluent based on dairy
manure (right) ..................................................................................................13
Table 1.5: Char requirements, packed bed adsorption model ............................................15
Table 5.1: CH4 yield from the AD of different plant material (Braun et al. 2010) ...........32
Table 5.2: The commonly used parameters for different pretreatment techniques
reported in the literature (Gao 2012) ..............................................................34
Table 5.3: Compositional analysis of untreated and pretreated grass ................................37
Table 5.4: Sugar recovery of lawn grass after different pretreatments ..............................38
Table 6.1: BMP and performance indicators for studied biomass .....................................43
Table 8.1.1: Biogas potential generated from different microbial consortium ..................54
Table 8.2.1: Operational parameters and characteristics of un-extracted algal biomass
samples .............................................................................................................61
Table 8.3.1: Operational conditions of the experiments ....................................................69

1
CHAPTER 1: NUTRIENT RECOVERY WITHIN
ANAEROBIC DIGESTION AND BIO-CHAR
PLATFORMS
1.1 Nutrient recovery within the anaerobic digestion application
Craig Frear and Quanbao Zhao
1.1.1 Introduction
One objective of the work carried out in partnership with the Washington State Department of
Agriculture (WSDA) was to continue to advance the concept of integrating anaerobic digestion
(AD) and nutrient management. This included a major effort to continue commercialization of
the patented Washington State University (WSU) nutrient recovery (NR) system. This objective
fused outreach and extension with ongoing laboratory research focused on confirming and
improving commercial-scale performance. Highlights include a draft fact sheet describing the
rationale for AD and NR—one which is summarized here. This factsheet was instrumental for
our use in extension efforts with environmental protection agency (EPA) national and Region 9
and 10 offices, who dealt with emerging dairy nutrient issues. In addition, commercial units of
the WSU technology were constructed at four facilities across the United States (US): Lynden,
Washington State (WA), Enumclaw, WA, Chilton, Wisconsin, and Fort Recover, Ohio, with
engineered plans for several other locations.
1.1.2 Background
Manure management and environmental issues in the United States
As of 2010, the US had a considerable percentage of its cow inventory in concentrated animal
feeding operations (CAFOs), with 3,350 dairies greater than 500 cows and 740 greater than
2,000 (EPA 2010). In addition to producing milk, each dairy cow produces approximately 60 kg
total nitrogen (N), 30 kg ammonia, and 7 kg phosphorus (P) as manure annually (ASAE 2005).
Unfortunately, this liquid manure is expensive to transport (Heathwaite et al. 2000). Therefore,
dairy manure and its nutrient load are generally land applied to nearby fields, which can lead to
excess applications of N and/or P. Nationally, in 2000, only 1% of large CAFOs (those with
more than 1000 animal units) were applying phosphorus at agronomic rates, while only 23%
were applying nitrogen at agronomic rates (USDA-ERS 2009). A recent study of manure
application to field corn (the receiving crop for more than half of all applied manure) confirmed
that the vast majority of dairies applied to fewer acres than would be needed to meet best
management practices for nutrient management (USDA-ERS 2011).
Current manure management patterns contribute to a number of significant air and water quality
concerns including the following:

June 30, 2013 ANAEROBIC DIGESTION RELATED R&D RESEARCH SUMMARY
FOR WSU ARC/WSDA APPENDIX-A FUNDS
2
Phosphorus eutrophication: Levels of soil P in localized areas throughout US have become
critical, elevating concerns about runoff to waterways (Kiely 1997). At typical concentrations
of 200–700 mg P/L, dairy wastewater runoff can easily cause total P levels in waterways to
exceed 100 µg P/L, a level considered sufficient for provision of nutrient enrichment to biota
(Bektas et al. 2004). Nitrogen eutrophication: Losses of N can also occur via soils runoff,
and/or leaching. These processes can occur at manure storage sites, as well as field
application sites. A considerable body of literature concludes that as N-load increases beyond
plant assimilation needs, N losses to the environment accelerate (Ferguson et al. 1991;
Vanotti et al. 1994; Schlegel et al. 1996; Dobermann 2007). Once lost from agricultural
systems, nitrogen can migrate to lakes, rivers, estuaries, and coastal oceans. Overabundant
nutrients can then lead to excessive growth of algae and aquatic weeds and subsequent
oxygen shortages (Carpenter et al. 1998), fish toxicity (Ward et al. 2005), habitat loss (NRC
1993; Jeppesen et al. 1998) and decreased species diversity (Sutton et al. 1993).
Ammonia volatilization and small diameter particulate matter: On dairies and feedlots, an
estimated 70% of total N in manure is lost as ammonia during manure management and
application (CAST 2002). In the US, it is estimated that as much as 25% of all gaseous
ammonia emissions originate from ruminant animals (CAST, 2002). Ammonia is highly
reactive and contributes to the development of small diameter particulate matter (PM 2.5)
that has detrimental effects on overall air quality (Erisman et al. 2004) and human/animal
health (McCubbin et al. 2002; Archibeque et al. 2007).
Nitrate pollution: Nitrates can also accumulate in the soil and migrate to the water supply
where they can induce blue baby syndrome in infants under six months of age (Mary H.
Ward et al. 2005)
Greenhouse gas emissions: Although dairy CAFOs create direct and indirect emissions of
greenhouse gas emissions (GHGs) throughout the production process (10–11 MT CO2e/cow
per year) (US-EPA, 2008; Oleson et al, 2006), a significant proportion of these emissions
occur during manure management.
Nutrient overloading issues in dairy regions of the western United States
Many of these water and air quality issues are acutely evident in the Yakima Valley of WA,
which has a high concentration of both dairy and cropland agriculture. Nutrient overloading has
become a concern, and the US-EPA (2012) recently released its Lower Yakima Valley Nitrate
Study that assessed likely sources of nitrate pollution (20% of wells > 10 mg/L)—including dairy
farms and crop fields—in Lower Yakima Valley groundwater and drinking water wells. N
eutrophication concerns are also present, particularly because the Middle Columbia River bull
trout and the Middle Columbia steelhead (both listed under the Endangered Species Act) spawn
or rear in this watershed. Separately, air quality monitoring results have indicated that the
Yakima River Basin presently exceeds the 15 μg/m3 annual and/or 35 μg/m
3 twenty-four hour
PM 2.5 Standard (US-EPA 2004).
Other dairy-intensive areas of the PNW and West are dealing with similar issues. Along the
Canadian-U.S. border in Western WA, recent concerns over high nitrate levels in the regional
Abbotsford-Sumas aquifer (R. Mitchell et al. 2005) have placed added pressure on dairies and
other producers. N-loading and nitrate issues have also received increased attention in diary
intensive regions of California, and Pecos Valley, New Mexico. In the Tulare Lake Basin and

June 30, 2013 ANAEROBIC DIGESTION RELATED R&D RESEARCH SUMMARY
FOR WSU ARC/WSDA APPENDIX-A FUNDS
3
Salinas Valley of California, Viers et al. (2012) estimated that the vast majority of nitrate loading
occurred during the application of manure and inorganic fertilizer to fields, where roughly a third
of the N applied to crop fields was derived from dairy manure sources since dairy commodities
are the top economic producers in Tulare Lake Basin.
There are many factors that contribute to nutrient overloading, despite the negative
environmental impacts:
Expense of transporting manure to distant fields. This is particularly true for liquid
manure, but also applies to “dry” manure, which contains significant moisture (Henry et
al. 1960; Heathwaite et al. 2000; Ribaudo et al. 2003) (Henry and Seagraves 1960;
Ribaudo et al. 2003; Heathwaite et al. 2000);
Reluctance to apply manure to food crops due to environmental and food safety concerns
(Guan et al. 2003), largely limiting the land base available for manure application to
forage fields (USDA-ERS 2009)
Variability in the nutrient content and form in stored manure and the timing of nutrient
availability to plants (especially for N) can lead producers to apply extra manure and/or
supplement with inorganic fertilizer (Power et al. 2001; Davis et al. 2002; Eghball et al.
2002; Alva et al. 2006)
The nitrogen-phosphorus-potassium (NPK) ratio of manure may not match the ratio
needed by crops, necessitating additional inorganic fertilizer for proper nutrient balance
(USDA-ERS 2009; Frear et al. 2011)
Broadcasting, a widely used and economical manure application method may encourage
nutrient loss and runoff (USDA-ERS 2009)
Crop producers’ tendency to target nutrient application toward high-yield goals, rather
than average yields (USDA ERS 2009)
Manure is not necessarily bad, and in fact has a high potential value because of the nutrients it
contains. Many crop producers use manure alongside organic fertilizers to improve NPK blend
application timing, or to reduce the economic risk associated with volatile spikes in fertilizer
prices (USDA-ERS 2011). However, nutrients in manure are only valuable when there is a
nearby market for those nutrients - and meanwhile, dairy producers have to dispose of manure in
a way that complies with stringent storage and application regulations that often specify loading
rates and timing. This generates highly localized markets for manure with crop producers in
some areas paying for manure while crop producers in other areas require dairies to pay them for
accepting the manure. Manure management is thus a major consideration for dairy producers,
with high potential costs in areas where there are few crop producers willing to accept manure
(USDA ERS 2009).

June 30, 2013 ANAEROBIC DIGESTION RELATED R&D RESEARCH SUMMARY
FOR WSU ARC/WSDA APPENDIX-A FUNDS
4
Recovering, concentrating, and partitioning nutrients from manures
Based on the increasing costs of nutrient management for dairy manure, increasing attention is
being paid to the development of commercially viable nutrient recovery technologies. Although
no technologies are widely commercialized at present, several nitrogen and phosphorus recovery
technologies have recently emerged that have the potential to improve nutrient management on
dairies. Some of these technologies are most appropriately used on untreated dairy manure, while
others are to be combined with anaerobic digestion (AD) as part of an AD system.
Benefits and challenges to nutrient recovery
Nutrient recovery technologies produce concentrated nutrient products that can be more
economically transported than manure. In some cases, the nutrient recovery processes generate a
product, which is more stable, homogenous and predictable than manure. This can make the
products more appealing to crop producers, who can store them, better control application rates,
and in some cases control application method. Blending of nutrient recovery products, with or
without inorganic fertilizers, has the potential to produce products with desired NPK balances
and other characteristics. Lastly, processing time for these nutrient products and (in some cases)
exposure to high temperatures can diminish real and perceived environmental and food safety
risks that lead some crop growers to avoid manures. Some nutrient recovery products, such as
struvite and ammonium sulfate, are pathogen-inert chemicals.
However, in practice, most nutrient recovery products are still in development. Products from
various technological processes are still often heterogeneous, have inconsistent form, and may
require further processing to dry or make product handling and application manageable. And
products with diminished (but not eliminated) pathogen risks may still be unappealing to food
crop producers.
In addition, markets for these products have not yet matured due to limited availability and
unproven fertilizer efficacy. Further development of dewatering technologies and consistency of
fertilizer form, function, and performance are needed. Together, these steps could lead to market
development and increased revenues adequate to provide cost-recovery for implementation of
nutrient recovery processes.
In addition to the nutrient products, nutrient recovery processes leave a nutrient-poor wastewater
that is less likely to exceed required nutrient regulations on nearby limited soils. However, the
wastewater that results from the AD-nutrient recovery process is even more nutrient-dilute than
it was prior to treatment, and is thus more expensive to transport if transport is still required for
nutrient management. It is also difficult to apply precisely, and the NPK ratios are actually more
unbalanced than manure, with much higher ratios of potassium and other salts. Thus, it will be
essential that cropland receiving the low-nutrient wastewater be effectively monitored for salt
content. Changes in crop selection and rotation on dairy forage fields may be necessary to
accommodate the distinctive characteristics of the nutrient-diluted wastewater.

June 30, 2013 ANAEROBIC DIGESTION RELATED R&D RESEARCH SUMMARY
FOR WSU ARC/WSDA APPENDIX-A FUNDS
5
The role of nutrient recovery in achieving environmental quality
Regulation has played an important role in CAFO nutrient management and undoubtedly will
continue to do so. However, there are limits to the effectiveness of a purely regulatory approach.
As Aillery and colleagues (2005) have pointed out, tighter regulation to protect water quality of
nitrogen in manure applied to cropland has the potential to induce changes to manure
management that reduce losses of N-nitrate by trading them for losses of N-ammonia (currently
unregulated), with negative impacts to air quality. Implementing regulatory strategies for nutrient
management without viable technology options to concentrate and export nitrogen from dairies
will likely encourage further examples of this type of shifting.
Implementing nutrient recovery technology may be a cost-effective approach to improving
nutrient management at a watershed level, through the replacement of imported chemical
nutrients by crop farms with manure-derived nutrients already in the watershed. However, it is
important to note that nutrients can still be lost from nutrient recovery products or from nutrient-
diluted wastewater, especially if these are applied with improper application rates or timing.
Nutrient recovery technology thus needs to be part of a comprehensive strategy at the watershed
level to address issues of nutrient balance, equitable distribution of costs and benefits, and
improved nutrient application timing and methodology.
Anaerobic digestion and nutrient recovery
On its own, AD is not a nutrient recovery technology. The AD process creates an anaerobic
environment (without oxygen) in which naturally occurring microorganisms convert complex
organic materials in manure and other wet organic wastes such as food processing wastes to
biogas, a source of renewable energy (US-EPA 2006). The process also reduces greenhouse gas
(GHG) emissions, decreases odors, stabilizes waste, and decreases pathogen counts, (Martin and
Roos 2007; US-EPA 2004; US-EPA 2005; US-EPA 2008). Although the process changes the
form of nitrogen and phosphorus in manure, it does not appreciably decrease the total amount of
nutrients, most of which are concentrated in the liquid effluent that is a product of the AD
process (Frear et al. 2012).
An increasing number of dairies that practice AD have begun to import and co-digest food
wastes along with manure in order to enhance biogas production and/or AD project profitability.
However, this practice often exacerbates the existing nutrient management concern by increasing
the import of nutrients to the dairy. In a study of co-digestion, Frear et al. (2012) showed that
supplementing manure with 16% organic wastes by volume at a dairy in Washington State
increased nitrogen and phosphorus by 57 and 23%, respectively.1
AD also creates unique opportunities for nutrient recovery. In addition to transforming nutrients
from organic to inorganic forms, the AD process can assist in nutrient recovery by providing
important process inputs such as heat, electricity and processing infrastructure. It also alters the
effluent’s ammonia and solids concentration, temperature and form of phosphorus (Frear et al.
2012). In return, the nutrient recovery process can assist the AD process by generating a
combined system that can lessen dairy producers’ nutrient concerns—something AD alone
1 Co-digestion also produced a 110% increase in biogas and a tripling of gross revenues from anaerobic digestion, with 72% of
all gross revenues directly attributable to outside organics digestion.

June 30, 2013 ANAEROBIC DIGESTION RELATED R&D RESEARCH SUMMARY
FOR WSU ARC/WSDA APPENDIX-A FUNDS
6
simply cannot do. Furthermore, potential income from the sale of recovered nutrients contributes
to the economic feasibility of an AD project. Galinato et al. (2013) showed that income from
nutrient and fiber products can represent a substantial portion of a digester’s gross revenue.
Nutrient recovery technologies also have the potential to stimulate adoption rates for AD.
Adoption rates have been slow, with just over 150 digesters in operation on dairy farms in the
U.S. as of May 2013, representing only 4% of dairy cows (US-EPA 2006). This number would
need to increase considerably to meet the joint U.S. - dairy industry goal for the dairy industry to
reduce its climate impact by 25% by the year 2020 (Innovation Center for U.S. Dairy 2011).
Integrated nutrient recovery technologies have the potential to address one of producers’ top
concerns related to AD adoption, and thus may be more appealing than stand-alone AD
technologies. As one dairy farmer in the Pacific Northwest stated, “We don’t necessarily want to
be energy producers. We want to milk cows. But…if an anaerobic digester can help us solve our
[nutrient management-related] manure problems, producing energy and mitigating greenhouse
gas emissions will be welcome side benefits.”
A combined AD-nutrient recovery system has greater capital and operating costs, but also
(depending on the system) the potential to generate greater revenues and profits. This “add-on”
nutrient recovery technology reflects an ongoing trend to use AD technologies as a “platform”
for other technologies that work synergistically to provide operational and economic benefits.
Refined natural gas is probably the most developed of these add-on technologies, and has been
particularly important for improving project economics in regions with low electricity prices.
1.1.3 Commercialization progress and performance
As noted, four facilities (3 dairies and 1 poultry) now have commercial WSU NR systems
working in concert with AD units. Under funding from this Appendix A and United States
Department of Agriculture (USDA) Natural Resources Conservation Service (NRCS), key
deliverables included fact sheets summarizing the techno-economic and performance capabilities
as well as a field day in July 2013 to showcase both the factsheets and the system. Due to
construction delays and ongoing process improvements, these factsheets are only now being
developed and unfortunately performance goals (70% ammonia recovery) have not yet been
realized. Current operation remains at 40–50% ammonia recovery. However, on-going
engineering and science efforts are aimed at improving the performance and reducing costs.
Future factsheets will therefore hopefully be able to document achievement of techno-economic
goals and identify key determinants of positive economics, including scale and pricing.
Submission of fact sheets is planned for the end of June with the field day scheduled for July
10th
.
Specific accomplishments this biennium include:
Construction and operation of two facilities in WA—FPE Renewables in Lynden WA
and Rainier Biogas in Enumclaw, WA (as well as completion of a third dairy facility in
Chilton, WI; coming on-line in late spring 2013).
While performance at both WA facilities is still on the order of 40–50% ammonia
recovery, insufficient hydraulic retention time has been identified as a key cause for this.

June 30, 2013 ANAEROBIC DIGESTION RELATED R&D RESEARCH SUMMARY
FOR WSU ARC/WSDA APPENDIX-A FUNDS
7
Hydraulic retention time is being increased through additional operating capacity
(Lynden) and/or attempting to maintain design flow (Enumclaw).
Engineering solutions have been developed to address additional technical hurdles related
to foaming, modulating flow, noise reduction, acid pH control, cold climate operation,
etc.
Difficulties in operating NR alongside co-digestion have been discovered, with co-
digestion in general resulting in less complete digestion. This leads to an effluent that
contains organics and has a lower pH, making NR more difficult. While it has been
difficult to solve this issue, it does show the fine linkages between AD and NR. In
particular, effective, complete AD is an important precursor for effective NR.
Numerous discussions, testing and awarded grants continue to make progress towards
developing the markets for nutrient recovery products. This process is still on-going, and
somewhat complicates the production of techno-economic factsheets.
Numerous linkages between dairies, regulators, the dairy industry and project developers
have been cultivated. If system performance can be improved and capital and operating
costs reduced, these relationships will be important to future adoption of NR
technologies.
Integration of the final biogas scrubbing/pH return step was proved in laboratory, pilot-
scale and now at commercial scale—allowing for near 100% scrubbing of hydrogen
sulfide (H2S) and return of effluent pH to near neutral.
Designs for a large 8,000–12,000 cow AD facility with complete NR are moving forward
in Outlook, WA thanks to the considerable outreach/extension efforts, along with the data
available from the commercial NR facilities currently in operation.

8
1.2 Nutrient recovery within bio-char platform
Mathew Smith, Waled Suliman and Manuel Garcia-Perez
1.2.1 Introduction
Nitrogen and phosphorus are in relatively high concentrations within dairy manure. As a result,
the amount of N and P accumulates in lagoons and then is normally land-applied, often in excess
of the amounts required by crops. This can result in runoff of excess N and P and leaching of
nutrients to groundwater and poses a real risk to the environmental quality of the PNW. Led by
Dr. Manuel Garcia-Perez, our team at WSU studied the efficacy of inexpensive bio-chars to
remove N and P from anaerobic digester effluents and increase soil cation/anion exchange
capacity.
1.2.2 Background
Because bio-chars are significantly more stable than the fast- and slow-cycling fractions of soil
organic matter, the effects of bio-char additions to soil can have significant long-term benefits on
soil fertility and carbon (C) sequestration (Lehmann et al. 2006; Lehmann 2007). It is also
known that acidic functional groups on the surface of bio-char can significantly increase N
adsorption capacity. These functional groups can be generated with oxidizing agents such as
steam and carbon dioxide (CO2) at high temperatures (300–700°C) or with ozone at room
temperature (Lehmann et al. 2011).
The adsorption of P in the form of phosphate depends on the cations found in the ash part of bio-
char (Agyei et al. 2000; Agyei et al. 2002; Namasivayam et al. 2004; Oguz 2005; Lu et al. 2009;
Xue et al. 2009). The addition of appropriate metal ions to the structure of the biomass should
aid in creating additional basic sites on the char surface which will become positively charged in
solution and attract anions to the surface.
If bio-char produced from the pyrolysis of digested fibers and woody biomass can be
economically activated to enhance its capacity to retain nutrients (N and P) from digester
effluent, then a biochar platform could help reduce the environmental footprint of dairy
operations. Figure 1. shows a scheme of the integrated system proposed with the stream
numbered.

June 30, 2013 ANAEROBIC DIGESTION RELATED R&D RESEARCH SUMMARY
FOR WSU ARC/WSDA APPENDIX-A FUNDS
9
Figure 1.1: Integrated pyrolysis-AD systems for the production of methane (CH4), heat, and bio-
char enriched in nutrients and clean water
1.2.3 Experimental tests to modify bio-chars
1.2.3.1 Evaluation of bio-chars with high surface area, calcium oxide, and iron sulphate/oxide
for phosphate removal
Preparation: AD fiber was first dried at 105°C for 24 hrs and ground. 100 g of ground sample
was acid washed in a 2% nitric acid solution to remove metal impurities. The sample was mixed
with 1 L of solution comprising 30 mL of 70% nitric acid (source) and 18 Mohm purified water
and stirred for 2 hrs. A series of preliminary calcium (Ca) and iron (Fe) additions were carried
out following the scheme outlined in
Figure 1.2.
June 30, 2013 ANAEROBIC DIGESTION RELATED R&D RESEARCH SUMMARY
FOR WSU ARC/WSDA APPENDIX-A FUNDS
10
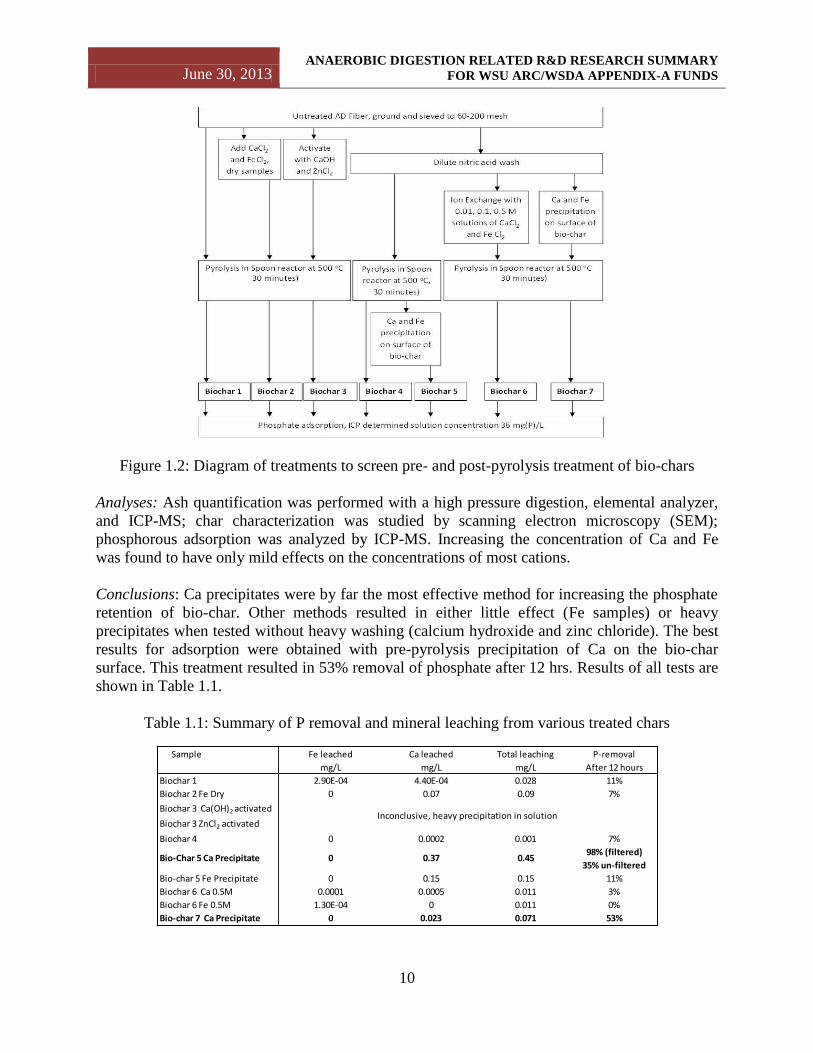
Figure 1.2: Diagram of treatments to screen pre- and post-pyrolysis treatment of bio-chars
Analyses: Ash quantification was performed with a high pressure digestion, elemental analyzer,
and ICP-MS; char characterization was studied by scanning electron microscopy (SEM);
phosphorous adsorption was analyzed by ICP-MS. Increasing the concentration of Ca and Fe
was found to have only mild effects on the concentrations of most cations.
Conclusions: Ca precipitates were by far the most effective method for increasing the phosphate
retention of bio-char. Other methods resulted in either little effect (Fe samples) or heavy
precipitates when tested without heavy washing (calcium hydroxide and zinc chloride). The best
results for adsorption were obtained with pre-pyrolysis precipitation of Ca on the bio-char
surface. This treatment resulted in 53% removal of phosphate after 12 hrs. Results of all tests are
shown in Table 1.1.
Table 1.1: Summary of P removal and mineral leaching from various treated chars
Sample Fe leached Ca leached Total leaching P-removal
mg/L mg/L mg/L After 12 hours
Biochar 1 2.90E-04 4.40E-04 0.028 11%
Biochar 2 Fe Dry 0 0.07 0.09 7%
Biochar 3 Ca(OH)2 activated
Biochar 3 ZnCl2 activated
Biochar 4 0 0.0002 0.001 7%
98% (filtered)
35% un-filtered
Bio-char 5 Fe Precipitate 0 0.15 0.15 11%
Biochar 6 Ca 0.5M 0.0001 0.0005 0.011 3%
Biochar 6 Fe 0.5M 1.30E-04 0 0.011 0%
Bio-char 7 Ca Precipitate 0 0.023 0.071 53%
Inconclusive, heavy precipitation in solution
0 0.37 0.45Bio-Char 5 Ca Precipitate

June 30, 2013 ANAEROBIC DIGESTION RELATED R&D RESEARCH SUMMARY
FOR WSU ARC/WSDA APPENDIX-A FUNDS
11
1.2.3.2 Evaluation of the potential of low temperature oxidation to generate acidic functional
groups on bio-chars
The purpose of this study was to examine the effect of pyrolysis temperature on oxygen
complexes formed on bio-char surfaces by a post-pyrolysis air oxidation at 250°C. Bio-char
samples were produced under six different temperature regimes and then oxidized via air at
250°C for 30 mins. The oxygen functional groups were investigated by X-ray photoelectron
spectroscopy (XPS). Results showed the formation of various oxygenated functional groups
(carbonyl, carboxyl and hydroxyl) on the surface of oxidized bio-chars.
Preparation: Two dairy fiber samples were collected. Each sample was ground and three
independent oxidation methods were tested including cold plasma, ozone, and oxygen at 200–
350°C. Two different woody feedstocks (hybrid poplar and pine) were initially air-dried and
milled to 590 µm. Thereafter, the samples were slow-pyrolyzed at varying temperatures (350,
400, 450, 500, 550 and 600°C). Charring time was 30 mins, and charring batches consisted of <
1 g of air-dried, ground biomass. Nitrogen (N2) was used as a purge gas. Half of the produced
bio-chars were then exposed to air at 250°C in order to oxidize and add oxygenated functional
groups to the surfaces. The effect of each oxidation on the total carboxylic acid groups present
on the char surface is given in Figure 1.4.
Figure 1.3: Formation of carboxylic acid groups under different oxidation conditions
Conclusions: The best results were obtained by air oxidation, with 250°C being the most
effective temperature tested (see Figure 1.4). At increasing temperatures, lower acid
concentrations were detected due to the poor thermal stability of these groups. For example, at
350oC these groups were no longer stable on the surface and no longer detected by titration. The
value in determining carboxylic acid groups from the previous results showed a direct, linear
correlation between the quantity of acid groups detected by titration and the removal of
ammonium from a single component system, as shown in Figure 1.5.
-5
0
5
10
15
20
25
30
35
40
45
Raw AW O3 CP O2-250 O2-275 O2-300 O2-350
Car
bo
xylic
aci
d g
rou
ps
(c-m
ol/
kg)
Oxidition Treatment

June 30, 2013 ANAEROBIC DIGESTION RELATED R&D RESEARCH SUMMARY
FOR WSU ARC/WSDA APPENDIX-A FUNDS
12
Figure 1.4: Ammonium adsorption vs. total carboxylic groups from ozone oxidation
1.2.3.3 Evaluation of nitrogen and phosphate removal in waste streams from anaerobic digesters
Based on the ionic phosphate retention results obtained using model phosphate solutions, Table 1
was created to show the annual tons of char required to remove phosphate at a given
concentration from the effluent water produced by a 1,000 cow dairy. These results are based on
the assumption that each cow produces 32 gallons of effluent per day. These results indicate that
approximately 1–5 tons of char per day would be required at a concentration of 50–100 mp
(P)/L. This concentration assumes that 80–90% of P exists as colloidal solids that can be
removed by other methods such as filtration or gravity settling. If all of the P is assumed to be
ionic phosphate, 10–20 tons of char per day would be required to treat a 500 mg (P)/L waste
stream.
Table 1.2: Annual tons of char required to remove ionic phosphorous from the effluent water of
1,000 cows dairy given different retention rates
y = 0.9782xR² = 0.811
0
100
200
300
400
500
0 100 200 300 400 500
NH
4-N
ad
sorp
tio
n p
H 6
.3 (
um
ol/
g)
Total Carboxylic Groups
10 kg/ton 15 kg/ton 20 kg/ton
1 13 9 7
10 133 89 67
20 267 178 133
50 667 444 333
100 1333 889 667
150 2000 1333 1000
200 2666 1777 1333
500 6665 4444 3333
Annual tons of char for 1000 cow AD system
Phosphate Retention on Char
Ionic Phosphorous
Concentration
(mg/L)
June 30, 2013 ANAEROBIC DIGESTION RELATED R&D RESEARCH SUMMARY
FOR WSU ARC/WSDA APPENDIX-A FUNDS
13
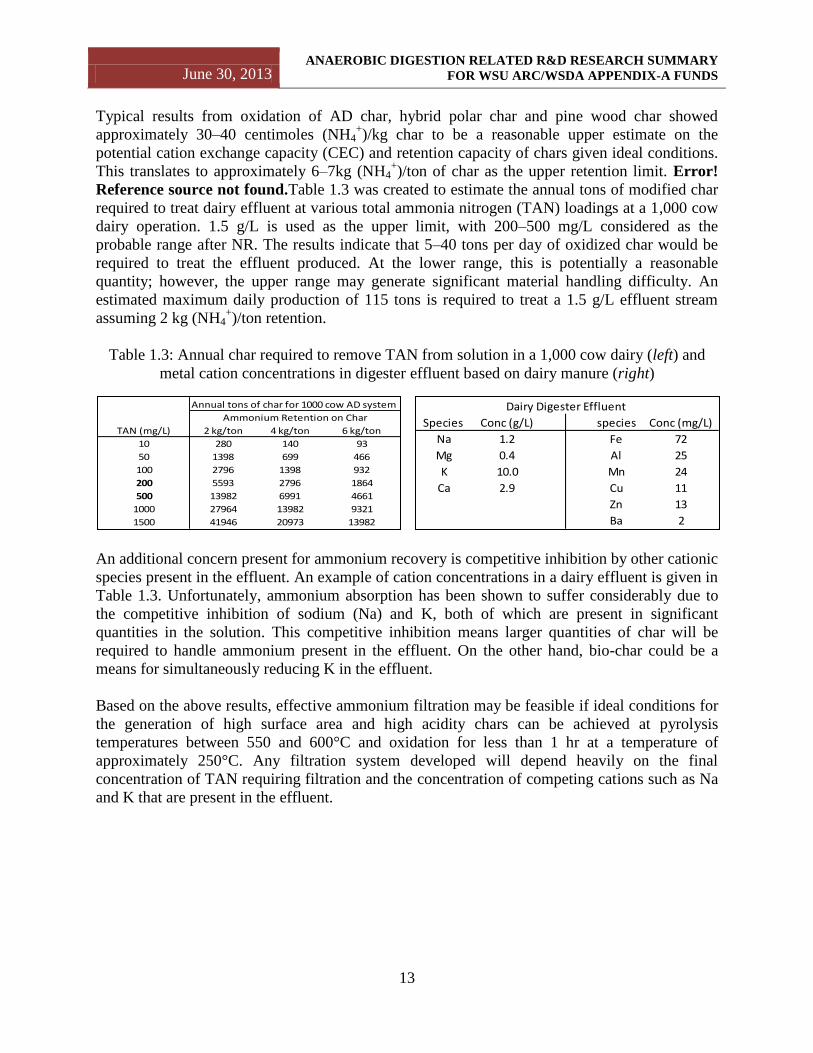
Typical results from oxidation of AD char, hybrid polar char and pine wood char showed
approximately 30–40 centimoles (NH4+)/kg char to be a reasonable upper estimate on the
potential cation exchange capacity (CEC) and retention capacity of chars given ideal conditions.
This translates to approximately 6–7kg (NH4+)/ton of char as the upper retention limit. Error!
Reference source not found.Table 1.3 was created to estimate the annual tons of modified char
required to treat dairy effluent at various total ammonia nitrogen (TAN) loadings at a 1,000 cow
dairy operation. 1.5 g/L is used as the upper limit, with 200–500 mg/L considered as the
probable range after NR. The results indicate that 5–40 tons per day of oxidized char would be
required to treat the effluent produced. At the lower range, this is potentially a reasonable
quantity; however, the upper range may generate significant material handling difficulty. An
estimated maximum daily production of 115 tons is required to treat a 1.5 g/L effluent stream
assuming 2 kg (NH4+)/ton retention.
Table 1.3: Annual char required to remove TAN from solution in a 1,000 cow dairy (left) and
metal cation concentrations in digester effluent based on dairy manure (right)
An additional concern present for ammonium recovery is competitive inhibition by other cationic
species present in the effluent. An example of cation concentrations in a dairy effluent is given in
Table 1.3. Unfortunately, ammonium absorption has been shown to suffer considerably due to
the competitive inhibition of sodium (Na) and K, both of which are present in significant
quantities in the solution. This competitive inhibition means larger quantities of char will be
required to handle ammonium present in the effluent. On the other hand, bio-char could be a
means for simultaneously reducing K in the effluent.
Based on the above results, effective ammonium filtration may be feasible if ideal conditions for
the generation of high surface area and high acidity chars can be achieved at pyrolysis
temperatures between 550 and 600°C and oxidation for less than 1 hr at a temperature of
approximately 250°C. Any filtration system developed will depend heavily on the final
concentration of TAN requiring filtration and the concentration of competing cations such as Na
and K that are present in the effluent.
2 kg/ton 4 kg/ton 6 kg/ton
10 280 140 93
50 1398 699 466
100 2796 1398 932
200 5593 2796 1864
500 13982 6991 4661
1000 27964 13982 9321
1500 41946 20973 13982
TAN (mg/L)
Annual tons of char for 1000 cow AD system
Ammonium Retention on Char Species Conc (g/L) species Conc (mg/L)
Na 1.2 Fe 72
Mg 0.4 Al 25
K 10.0 Mn 24
Ca 2.9 Cu 11
Zn 13
Ba 2
Dairy Digester Effluent

June 30, 2013 ANAEROBIC DIGESTION RELATED R&D RESEARCH SUMMARY
FOR WSU ARC/WSDA APPENDIX-A FUNDS
14
1.2.3.4 Design model for a portable packed bed adsorption column for phosphorus removal
Based on the results obtained from experimental studies, researchers examined the feasibility of
a filter that could be deployed via a tractor trailer to smaller dairies to pump and filter lagoon
water. The concept is shown in Figure 1.. To be feasible, the filter should be able to handle at
least a month of production in under 8 hrs (1 day’s work) with removal of at least 75% P. This
was tested using the scenario of a 100 cow dairy, producing 12 m3
of waste water containing 1.5
kg/m3 phosphate. Under these conditions, 21.98 tons of char would be required; details can be
seen in Table 1.1.
Figure 1.5: Portable lagoon filtering system
Using the adsorption data for the bio-char with Ca precipitation at pH 12 (data not shown), the 8-
hour solution concentration profile was generated (Figure 1.7). The list of variables and outputs
is given in Table 1.4. From these results it is apparent that total removal of phosphate is not
possible given a 2 hr residence time. To achieve total initial reduction of phosphate, a residence
time of at least 5 hrs would be required. If a 2 hr residence time is maintained, filtration of 360
m3 of water would result in total phosphate reduction of approximately 60%. This translates to
removal of 312 kg P from the effluent. At this level, the market value of phosphate is insufficient
to support the cost of filtration. Thus, additional economic or regulatory incentives will be
required to advance this concept.

June 30, 2013 ANAEROBIC DIGESTION RELATED R&D RESEARCH SUMMARY
FOR WSU ARC/WSDA APPENDIX-A FUNDS
15
Table 1.1: Char requirements,
packed bed adsorption model
Figure 1.1: Concentration profile for adsorption with Ca-infused
bio-char in a packed bed column
1.2.4 Implications for future directions of the research
Overall, results from this project suggest that Ca can be precipitated at a reasonable pH of 9–9.5
in sufficient quantities to generate significant phosphate retention capacity of bio-chars.
Investigation of methods to incorporate this modification scheme into AD processes could result
in viable technology.
Oxidation results suggest that use of air at 25°C can be a highly effective method of increasing
the cation exchange capacity of anaerobically digested diary fiber bio-char and other bio-chars.
Therefore, development of carboxylic groups is an important factor in increasing cation
exchange capacity and has a narrow range where formation kinetics are rapid and the final
product is comparatively stable. 250°C appears to be an effective temperature for creating stable
carboxylic groups without significantly deteriorating the sample. The pyrolysis temperature
seems to have a critical role in defining the oxidation capability of the bio-char produced. Both
treatment methods identified in this work are technically viable without large additional capital
expenditures. Development and integration of technologies to support these modifications should
be investigated.
Based on the ionic phosphate retention results obtained using model phosphate solutions, it was
shown the annual tons of char required to remove phosphate at a given concentration from the
effluent water produced by a 1,000 cow dairy operation. Results indicated that approximately 1–
5 tons of char per day would be required at a concentration of 50–100 mp (P)/L, a concentration
which assumes that 80–90% of P exists as colloidal solids that can be removed by other methods.
0
0.2
0.4
0.6
0.8
1
1.2
0 2 4 6 8 10
So
luti
on
ph
osp
ha
te c
on
cen
tra
tio
n
Filtration time hours
2 hour residence time
5 hour residence time
Variable Values
Cows 100
Water/day (m3) 11.968
Water (m3)/month 359.04
kg (PO4)/m3 1.5
ρpb (kg/m3) 300
K (1/hr) 0.45
qm (kg/kg) 0.0245
b (m3/kg) 150
Tons Char (tons) 21.98
Volume of Char (m3) 73.27
radius of filter (m) 1.25
hight of total filter (m) 14.93
# of filter units 4.00
hight of filter units (m) 3.73
ν (m/hr) 7.46
June 30, 2013 ANAEROBIC DIGESTION RELATED R&D RESEARCH SUMMARY
FOR WSU ARC/WSDA APPENDIX-A FUNDS
16
If all the P is assumed to be ionic phosphate, a production of approximately 10–20 tons of bio-
char per day would be required to fully treat a 500 mg (P)/L waste stream.
Similar estimations made of the amount of modified char required to treat dairy effluent at
various total ammonia nitrogen (TAN) loadings at a 1,000 cow dairy operation were less
promising. Assuming an upper limit of 1.5 g/L ammonia in effluent, with 200–500 mg/L after
NR, results indicated that 5–40 tons per day of oxidized char would be required to treat the
effluent produced, with a maximum of 115 tons. Though the lower range is reasonable, the upper
range would likely lead to significant material handling difficulty. An additional concern present
for ammonium recovery is competitive inhibition by sodium (Na) and K, both of which are
present in significant quantities in the effluent. Based on these results, effective ammonium
filtration may be feasible if ideal conditions for the generation of high surface area and high
acidity chars can be achieved at pyrolysis temperatures between 550 and 600°C and oxidation for
less than 1 hr at a temperature of approximately 250°C. Any filtration system developed will
depend heavily on the final concentration of TAN requiring filtration and the concentration of
competing cations such as Na and K that are present in the effluent.

June 30, 2013 ANAEROBIC DIGESTION RELATED R&D RESEARCH SUMMARY
FOR WSU ARC/WSDA APPENDIX-A FUNDS
17
CHAPTER 2: FLUSH DAIRY AND ANAEROBIC
SEQUENCE BATCH REACTOR APPROACH
Jingwei Ma, Liang Yu, Quanbao Zhao, Craig Frear and Shulin Chen
2.1 Introduction
There are three generally used systems for collecting and storing manure at dairy operations,
including dry, scrape, and flush systems (see Figure 2.1). Of the three systems, flushed systems,
which utilize copious amounts of recycled wastewater to dilute the manure for ease of transport
through and around the farm (Frear et al. 2011), are generally the preferred strategy. This is
because flush systems reduce labor and mechanical failure compared to dry and scrape systems.
In particular, flushed systems have become increasingly popular on large dairy operations that
need to move the manure long distances between far flung barns. Since most digesters operate on
large dairies, due to economics, a common type of feedstock encountered at dairy AD operations
is flushed manure.
Figure 2.1: Different manure management strategies available for dairy operations
Unfortunately, flushed systems often require much larger downstream treatment systems because
of the enormous volume of water they use. When flushing is coupled with AD, the size and
heating requirement for the digester are vastly increased compared to scrape systems. This
directly affects the economics of the AD operation. As a result of these economic constraints,
farms wanting to implement AD have been either forced to switch to a scrape system or utilize
modified or new digester technologies. The most common commercially applied modification
separates the liquid and solid phase, spinning off the supernatant liquid and thickening the solid
sludge fraction, thereby concentrating the manure to 6–10% Total Solids (TS) and reducing the
volume of manure needing treatment. This higher concentration of manure is most commonly
Flush Scrape Dry

June 30, 2013 ANAEROBIC DIGESTION RELATED R&D RESEARCH SUMMARY
FOR WSU ARC/WSDA APPENDIX-A FUNDS
18
treated in a plug-flow digester while the liquid portion goes back to the flush tower system,
untreated, for reuse on the farm.
However, research has shown that the removal of the liquid phase before digestion, can
drastically reduce CH4 production – by roughly 50%) since biogas generating compounds are
equally distributed between the solid and liquid phases of the flushed dairy manure (Frear et al.
2011). This reduction in CH4 capture can negatively impact GHG mitigation efforts since a large
portion of the organic material will decompose naturally, releasing CH4.
A second approach has also been proposed. This approach separates out the solids and treat only
the liquid portion of the flushed manure in a fixed-film, high rate reactor. Artificial supporting
media is used in this type of reactor to promote microbial growth in the form of biofilms with the
goal of enhancing the efficiency of the reactor to handle the high volume of liquid. As with the
previous technique, CH4 production is reduced because the solid phase goes untreated. In
addition, potential clogging of the supporting media requires a strict screening process prior to
digestion, impacting the viability of the process (Wilkie et al. 2004).
The significant drawbacks of both existing systems mean that technical innovations in digester
design could still improve the economics and utilize the full potential of the organic material
available in flushed dairy manure.
2.2 Developing novel ways to enhance biogas production using anaerobic sequence batch reactor
technology and dairy manure fiber
Since the fibrous solids contained in dairy manure have been shown to act as effective natural
biomass carriers for high rate and simultaneous methanation of both solid and liquid phases
(Frear et al. 2011), the use of natural bio-films to enhance the biogas potential were investigated
at WSU. Figure 2.2 illustrates the presence of anaerobic microbes attached to the fiber contained
in flushed dairy manure. The high affinity of microbes to dairy manure fibrous solids could
replace the need for costly supporting media in AD and lead to effective approaches for treating
both the solid and liquid phases.

June 30, 2013 ANAEROBIC DIGESTION RELATED R&D RESEARCH SUMMARY
FOR WSU ARC/WSDA APPENDIX-A FUNDS
19
Figure 2.2: Scanning electron microscope rod and coccoid microbial cells attached to the fiber
(left) and fluorescence in situ hybridization image shows fermentative bacteria attached on the
surface of fiber and methanogens distributed on the outer layer of biofilm (right)
Building upon previous research, an anaerobic sequencing batch reactor (ASBR) was developed
to retain the active biomass through gravity settling and selection pressure. The fiber, known to
harbor anaerobic microorganisms, was used as a supporting system to increase biomass retention
in the reactor. Figure 2.3 depicts the ASBR process. The study revealed bipolar effects on active
biomass retention in SBR; both short and long settling time were able to retain high
concentrations of active microbes (Wang et al. 2011). The results from this investigation led to a
novel bacterial retention technology that could reduce the cost, maintenance and clogging issues
hindering the adaptation of artificial support media. It also has the potential to increase digester
efficiency.

June 30, 2013 ANAEROBIC DIGESTION RELATED R&D RESEARCH SUMMARY
FOR WSU ARC/WSDA APPENDIX-A FUNDS
20
Figure 2.3: ASBR process divided into six stages to enhance the retention of biomass for
improved biogas production and digester efficiency (Wang et al. 2011)
Thereafter, the use of fibrous material as a natural biomass carrier was investigated in the ASBR
at psychrophilic temperature (22°C), since research has shown that an effective energy balance
for such dilute waste streams is most attainable at lower temperatures (Wilkie et al. 2004). This
could potentially allow digesters to be deployed in agriculture settings that experience more
dramatic temperature changes (e.g. northern latitudes). Results from this research showed that an
ASBR not only improved CH4 production but also reduced the necessary HRT and temperature
required to achieve a similar treating efficiency when compared with current technologies (Ma et
al. 2013). A kinetic model that was developed indicated the best HRT and organic loading rate
(OLR) were 4–6 days and 0.5–1.3 g VSloaded/L/day, respectively.
Step 6:
Cycle
repetition
Step 1: Feeding
Step 2: Reaction
Step 3: Desludge
Step 4: Settling
Step 5: Discharge

June 30, 2013 ANAEROBIC DIGESTION RELATED R&D RESEARCH SUMMARY
FOR WSU ARC/WSDA APPENDIX-A FUNDS
21
After the optimal HRT and OLR were achieved, an investigation was performed to identify the
species of methanogens dominating the digestion process at the low HRT and temperature. This
is important because a high level of methanogen activity is necessary to maintain an efficient AD
process and avoid the accumulation of volatile fatty acids (VFA) (acetate) and hydrogen, two of
the most important methanation substrates. Through analysis using 16S rRNA and terminal
restriction fragment length polymorphism (T-FRLP), the ASBR operating at short HRT’s was
shown to be capable of establishing a Methanosarcina predominated population. This is notable
as Methanosarcina can lead to a more stable and efficient anaerobic process. Methanosarcina,
the most versatile methanogens, have a higher substrate utilization rate, growth rate and cell
yield when exposed to an environment with relatively high acetate and hydrogen concentration,
such as is experienced in dilute manure treated at short HRT. This allows them to handle
environmental changes that other species (i.e. Methanosaeta) cannot. Figure 2.4 illustrates the
cluster of assigned operational taxonomic units (OTU), which indicated that Methanosarcina
was the dominant methane producing Archaea in the ASBR digester.

June 30, 2013 ANAEROBIC DIGESTION RELATED R&D RESEARCH SUMMARY
FOR WSU ARC/WSDA APPENDIX-A FUNDS
22
Figure 2.4: Phylogenetic relationship among 18 OTUs with partial 16S rRNA gene sequences of
known methanogenic Archaea based on the neighbor-joining analysis
2.3 Conclusions
This study provided insight into how the anaerobic community will shift in response to
operational parameters. At the optimal HRT of 4–6 days and OLR of 0.5–1.3 g VSloaded/L/day in
an ASBR reactor at a temperature of 22°C, analysis using 16S rRNA and T-FRLP indicated that
the ASBR had established a population dominated by Methanosarcina. Beyond this specific
study, the techniques utilized here to investigate anaerobic community shifts should provide a
basis for identifying pathways for improved biogas and co-product production in the future.
OTU-03 (JQ684535) (5 clones)
uncultured Methanomicrobiales (AB236081.1)
OTU-04 (JQ684592) (11 clones)
Methanolinea sp. (JN836394.1)
Methanolinea sp. (AB447467.1)
Methanosphaerula palustris (EU156000.1)
OTU-11 (JQ684579)
Methanomicrobiales (JN836393.1)
OTU-08 (JQ684598) (4 clones)
Methanospirillum hungatei (AY196683.1)
OTU-12 (JQ684583) OTU-13 (JQ684585)
OTU-09 (JQ684568) (4 clones)
Methanospirillum lacunae (AB517986.1)
OTU-05 (JQ684537) (12 clones)
Methanosaeta sp. (HQ133141.1)
OTU-07 (JQ684558) (15 clones)
uncultured Methanosarcinales (CU917405.1)
Methanosaeta thermophila (AB071701.1)
Methanosarcina lacustris
(AF432127.1) Methanosarcina mazei (DSM 2053)
Methanosarcina siciliae (FR733698.1)
uncultured Methanosarcina sp. (AB636574.1)
OTU-01 (JQ684634) (49 clones)
OTU-15 (JQ684610)
uncultured Methanosarcinaceae (AJ879017.1)
Methanotorris formicicus (AB100884.1) OTU-16 (JQ684623)
Methanobacterium alcaliphilum
(AB496639.1) OTU-18 (JQ684644)
OTU-06 (JQ684539)
uncultured Methanobacteriaceae (FJ579962.1)
OTU-14 (JQ684593)
uncultured Methanobacteriaceae (FJ579348.1)
Methanobacterium beijingense (AY552778.3)
OTU-17 (JQ684635) (3 clones)
OTU-02 (JQ684557) (2 clones)
Methanobacterium formicicum (DSMZ1535)
Methanobacterium petrolearium (AB542742.1)
OTU-10 (JQ684560)
Methanobacterium kanagiense (AB368917.1)
100
100
100
100
100
99
100
100
92
99
90
82
88
61
100
100
71
93
97
100
100
58
99
100
100 99
71 96
50
100
100 97
98
99
99
99
71
0.05
Methanomicrobiales
23.68%
Methanosarcinales
68.42%
Methanobacteriales
7.89%

June 30, 2013 ANAEROBIC DIGESTION RELATED R&D RESEARCH SUMMARY
FOR WSU ARC/WSDA APPENDIX-A FUNDS
23
CHAPTER 3: BIOGAS PURIFICATION WITHIN
THE ANAEROBIC DIGESTION/NUTRIENT
RECOVERY PLATFORM
Nicholas Kennedy, Quanbao Zhao, Craig Frear and Shulin Chen
3.1 Introduction
Biogas derived from the AD of dairy manure consists of CH4 (55–70%) and contaminants
including CO2 (30–45%), low concentrations of H2S (300–4,500 ppm) and trace levels of
halogenated hydrocarbons, N2, oxygen (O2), organic silicon and water vapor (Liebrand et al.
2009). The three main contaminants CO2, H2S and water vapor can lead to problems when
utilizing biogas as a renewable source of energy such as RNG (de Hullu et al. 2008), even
though these impurities are lower in concentration in biogas than in biogas from sewage sludge
or landfills.
CO2 is not detrimental to equipment or human health, but it does decrease the energy potential of
biogas due to its inert nature. H2S, which is produced by the breakdown of proteins and other
sulfur-containing compounds during hydrolysis, is detrimental to an internal combustion engine
as well as to the environment and human health. Even at low concentrations, H2S has an
unpleasant odor and can be life threatening (Speece 1996). Furthermore, this contaminant is
highly undesirable in energy-recovery processes because it converts to unhealthy and
environmentally hazardous sulfur dioxide and sulfuric acid (Abatzoglou et al. 2009). Unless they
are removed, these H2S-derived contaminants limit the use of biogas to on-site combined heat
and power (CHP), whereas many economic assessments have suggested that a higher value use
is possible and beneficial for projects utilizing AD (Murphy et al. 2004; Liebrand et al. 2009;
Coppedge et al. 2012). Figure 3.1 describes some of the different pathways. Note that higher
profit potential is achievable when the biogas is upgraded to pipeline quality gas or renewable
natural gas (RNG).
Many techniques that were originally developed in the natural gas and oil industries to remove
contaminants have been adopted for biogas upgrading, including water scrubbing, chemical
absorbents, pressure swing adsorption, and cryogenic absorption, among others. (Kapdi et al.
2005). Unfortunately, all these techniques require complicated and often expensive infrastructure
to achieve the amount of cleaning required by the natural gas pipeline and transportation vehicles
(de Hullu et al. 2008). This has severely hampered the adoption of biogas upgrading on dairy
farms in the US. As of 2011, there were only six digesters in the US upgrading biogas for use as
a higher value fuel (Kennedy 2012). Therefore, cheaper techniques are needed to facilitate
biogas upgrading on dairy farms and other organic waste facilities.

June 30, 2013 ANAEROBIC DIGESTION RELATED R&D RESEARCH SUMMARY
FOR WSU ARC/WSDA APPENDIX-A FUNDS
24
Figure 3.1: Multiple paths through which biogas can be used as renewable energy/fuel (Weiland
2006)
Novel approach to biogas upgrading at organic AD facilities
One appropriate method that could be used to remove both H2S and CO2, would be to use the
alkaline effluent that is produced as a byproduct of the combined AD and ammonia recovery
(Zhao et al. 2012) process being developed by WSU. This alkaline effluent can be used as an
inexpensive, on-site absorbent not requiring regeneration (a requirement of many other physical
and physiochemical absorption methods), while at the same time returning the AD effluent pH
back to near neutral pH < 7.5 in preparation for land application (Zhao et al. 2012). Figure 3.2
depicts the AD and ammonia recovery process with the proposed H2S and CO2 removal process.
Figure 3.2: Ammonia and P recovery system with attached H2S and CO2 removal
Research into the selective removal of H2S over CO2 was conducted using a bubble column
reactor to treat biogas using effluent from the AD and ammonia recovery processes. Because the
biogas to effluent ratio of the combined system (AD/NR) is fixed at around 20:1 (biogas to
liquid), a major goal of this study was to determine whether 100% removal of H2S was possible
at this given ratio. Selectively removing H2S over CO2 was investigated because H2S is the most
problematic impurity. In addition to selectively removing H2S over CO2, experiments were

June 30, 2013 ANAEROBIC DIGESTION RELATED R&D RESEARCH SUMMARY
FOR WSU ARC/WSDA APPENDIX-A FUNDS
25
performed to remove both H2S and CO2 from the biogas by regenerating the absorbent once it
was saturated with the impurities. The efficiency of this process was then tested at pilot-scale,
with the help of DVO Inc., at a digester located in Brillion, Wisconsin.
3.2 The selective removal of hydrogen sulfide over carbon dioxide from biogas in a bubble
column reactor
The first experiments were conducted to see if the selective removal of H2S over CO2 from
biogas was possible using the alkaline effluent from nutrient recovery as the absorbing media.
The solubility of H2S is only about three times greater than that of CO2 in water. With such
similar physical properties, mass transfer becomes a particularly important factor to selectively
remove H2S over CO2. In the majority of applications where a bubble column is utilized, the gas-
side mass transfer can be regarded as negligible (Kantarci et al. 2005). Unfortunately, H2S has
been found to have a dominant gas-side resistance to mass transfer (Garner et al. 1958; Bendall
et al. 1983; Yih et al. 1987; Srinivasan et al. 1988). This is why most selective H2S purification is
performed in an absorption apparatus that favors a gas-film controlled process (e.g. packed bed,
spray tower) (Wallin et al. 1993). However, CO2 has dominant resistance to mass transfer on the
liquid-side, a feature that can be exploited in a bubble column. This resistance can be attributed
to CO2 having a slow initial reaction in solution, unlike H2S.
Bubble columns have many advantages over other absorption apparatuses including excellent
mixing and mass transfer characteristics, lack of moving parts, easy temperature control, little
maintenance, elimination of clogging issues and low costs of construction and operation
(Kantarci et al. 2005). Disadvantages include an inability to easily control the gas-film, short gas
phase residence time, back mixing in both the gas and liquid phases, and chaotic mixing
characteristics that can make scale up difficult (Deckwer et al. 1992). These disadvantages may
deter the use of bubble columns for biogas upgrading using more expensive alkaline solvents
(e.g. NaOH, CaO) that require regeneration. However, since the alkaline effluent used in this
study is a byproduct (and therefore relatively free), it is believed that the advantages far outweigh
the disadvantages. Three major factors were tested to determine if the selective removal of H2S
over CO2 from biogas could be enhanced in a simple bubble column reactor by (1) sparger
configuration, (2) effluent height, and (3) biogas superficial velocity (flow rate).
The sparger configuration played an important role in selectively removing H2S because large
bubbles decreased the absorption of CO2 into the effluent. Both H2S and CO2 contribute
hydronium upon absorption, decreasing the effluent pH over time (see Figure 3.3). For H2S to be
completely removed from biogas a pH above 9 must be maintained and therefore, resisting the
absorption of CO2 is critical. Significant differences in the volume of biogas that could be
purified per volume of effluent can be seen in Figure 3.3 when using an airstone sparger
compared with an inlet orifice sparger. The inlet orifice sparger was able to resist the absorption
of CO2, which in turn allowed a greater quantity of H2S to be absorbed. In addition to the two
sparger configurations, plastic pall rings were used inside the bubble column to mimic a packed
bubble column. This configuration should break up the bubbles and allow for more consistent
absorption into the effluent. To the surprise of the researchers, this reduced H2S removal
efficiency, supporting the conclusion that larger bubbles either promote the absorption of H2S or
decrease the absorption of CO2. As Figure 3.3 indicates, the gas to liquid ratio, at around 100%

June 30, 2013 ANAEROBIC DIGESTION RELATED R&D RESEARCH SUMMARY
FOR WSU ARC/WSDA APPENDIX-A FUNDS
26
removal, improved when the inlet orifice sparger was utilized compared to the airstone sparger,
providing further evidence that selectivity was enhanced by inducing large bubbles in the bubble
column.
C1
C2
Figure 3.3: H2S removal efficiency using an airstone sparger (C1) and inlet orifice (C2);
photographs were taken with a high speed camera in water
Figure 3.4: Affect of effluent height (left) and superficially velocity (right) on the H2S removal
efficiency and G/L ratio
Based on these initial results, the inlet orifice sparger (C2) was used to complete two additional
selectivity tests. First, the effluent height was varied while holding the superficial gas velocity
constant. Figure 3.4 (left) illustrates that selectivity increased as effluent height decreased. This
could be attributed to an increased reaction time between the bubble and the pretreated effluent

June 30, 2013 ANAEROBIC DIGESTION RELATED R&D RESEARCH SUMMARY
FOR WSU ARC/WSDA APPENDIX-A FUNDS
27
as the effluent height was increased, which allowed more CO2 to absorb and thus a faster drop in
the pH.
Second, effluent height was held constant and the superficial velocity was altered. The results
indicated that an increase in superficial velocity improved the selective removal of H2S over CO2
from biogas (Figure 3.4 right). This result has also been found in other research (Wallin et al.
1993). The results from these three experiments provide ways to easily increase the volume of
biogas being purified of H2S.
3.3 Conclusions
The experiments conducted by WSU and DVO Inc. researchers and engineers provide
compelling support for the use of this low cost and abundant absorbent that is a byproduct of
nutrient recovery. In AD systems using the commercially proven ammonia stripping technology,
a high pH effluent will be in continual supply. Instead of directly sending it to the lagoon for
storage, this effluent can be used to upgrade biogas on dairy farms where other technologies are
not practical or viable. One patent has been filed and further scale up of this technique is
currently under investigation for both CO2 and H2S removal from raw biogas.

June 30, 2013 ANAEROBIC DIGESTION RELATED R&D RESEARCH SUMMARY
FOR WSU ARC/WSDA APPENDIX-A FUNDS
28
CHAPTER 4: ANAEROBIC DIGESTION ON
SMALL-SIZED DAIRIES
Craig Frear and Chad Kruger
4.1 Introduction
AD provides waste management solutions to a wide variety of different urban waste streams
including agricultural waste, municipal wastewater, and food waste. In the US, most digesters
treating agricultural wastes are located on large scale livestock operations (> 500 animals) and
with an increase from 100 digesters in 2005 to 171 digesters in 2010 (EPA 2010). This same
growth, however, has not occurred on small livestock operations (< 200 animals) because capital
costs become prohibitively expensive on small dairies. Some studies suggest that AD is
economically viable only on dairies with more than 500 animals while other studies have shown
that AD can be viable on livestock operations between 200–400 animals (Mehta 2002). Figure
4.1 shows how the economics of AD hinder the adoption of digesters on small-scale livestock
operations.
Figure 4.1: Capital cost per cow of different digester configurations (AgSTAR 2010)
A study conducted by the USDA in 2007 showed that in the PNW of the US (WA, Oregon,
Idaho, Montana, and Wyoming) there were 22,744 small-scale livestock operations (categorized
by any operation that had gross annual sales of $10,000 to $499,999) (USDA 2011). This
represents a significant potential source of renewable energy that could be generated from

June 30, 2013 ANAEROBIC DIGESTION RELATED R&D RESEARCH SUMMARY
FOR WSU ARC/WSDA APPENDIX-A FUNDS
29
livestock waste in the PNW. AD adoption on these smaller dairies would also contribute to odor
reduction, pathogen destruction, chemical oxygen demand (COD) reduction, nutrient removal,
and GHG reduction (Frear 2009).
The number of small-scale, or boutique, livestock operations is increasing in and around city
settings, which may be a particularly appropriate setting for AD to mitigate the odor and
air/water quality issues. Figure 4.2 shows a concentration of small to medium dairy operations on
the west side of the Cascade Mountains in WA, including areas in proximity to Seattle, Olympia,
and Tacoma.
Figure 4.2: Small to medium sized dairy operations in WA
It is likely that these operations will not find AD viable if they are counting on revenue from
electrical generation or transportation fuels to cover costs. However, many of these boutique
dairies could incorporate AD into their marketing strategy to further solidify their image as green
or eco-friendly operation. Most boutique dairies are competitive because they offer specialized
products to their consumers including one that are natural, organic, grass fed, pasture raised,
certified humane, and/or eco-friendly (USDA 2011). Generating renewable energy, and reducing
their carbon footprint, would align well with these values. In addition, boutique farms may also
want to control odor and destroy pathogens, benefits that AD provides. This, if low cost AD
options can be developed, they may be adopted by small scale dairy operations.
One way to improve the economics of AD for boutique dairies is to change the end use of the
biogas. Converting biogas to electricity requires an internal combustion engine and is costly,
accounting for 50% of the capital costs and 80% of the operating costs of AD operations. Thus, it
represents one of the main cost barriers to small scale AD. However, if boutique dairies

June 30, 2013 ANAEROBIC DIGESTION RELATED R&D RESEARCH SUMMARY
FOR WSU ARC/WSDA APPENDIX-A FUNDS
30
produced heat from burning biogas directly in a boiler, they would reduce both capital and
operating costs considerably. Furthermore, boutique dairies have a need to heat their facilities, a
need that is currently met with natural gas or propane. Producing heat may therefore represent an
attractive option, given the combined benefits in terms of sustainability, marketability, and
reductions in existing heating costs.
4.2 Demonstration of a small-scale digester at a dairy in an urban setting
Even these benefits, design improvements to small scale digesters are still needed to further
improve project economics for small scale dairies, as a specific case study shows. Cherry Valley
Dairy (CVD), near Seattle, is a small dairy transitioning from a traditional commodity-based
model to a sustainable, urban dairy producing specialty products. Like many small dairies, CVD
expanded production in the 1990’s and early 2000’s in an effort to maintain financial viability,
which created water quality concerns due to manure management. CVD’s new owner is pursuing
a new business model for community-based marketing of value-added dairy products, which has
resulted in the following changes:
Significant reduction in the total number of milking animals
Construction of an on-farm micro-processing facility for artisan cheese and butter
Plans for on-site sales to the neighboring community
Sales to a local farmers’ market and a local cooperative grocery chain.
Figure 4.3: Small-scale vertical mixed plug flow digester with a hot water heater for heat
generation located CVD near Seattle, WA
An important part of the brand identity and value for these sustainable, artisan dairy products
will be the improved environmental footprint of the dairy. With this in mind, CVD has made site
design and operational investments to reduce storm water runoff. They are also exploring options
for improved manure management and on-site renewable energy generation and methane capture
with an anaerobic digester. In response to their interest, WSU and Andgar Corp. have designed a
new AD reactor that could reduce the total “footprint” and cost of AD for small dairies. As
described above, the reactor provides thermal energy for heating/chilling in CVD’s new micro-
processing facility. The system is also designed to accept milk processing wastewater (enhancing
biogas productivity). Lastly, it is anticipated that the soil amendment products recovered from

June 30, 2013 ANAEROBIC DIGESTION RELATED R&D RESEARCH SUMMARY
FOR WSU ARC/WSDA APPENDIX-A FUNDS
31
the digester can be marketed to local gardeners on-site or through the farmers’ market and co-op
as high-quality “co-products.”
This model represents a potentially sustainable system that could reduce CVD’s fossil energy use
and CH4 emissions and improve water quality to complete the “sustainability story” necessary to
add value to CVD’s model for sustainably produced dairy products. The objective of this task
was to install a pilot AD unit at CVD, proceed with start-up and training of the CVD staff to
manage the digester, and operate it for one calendar year as a basis for future evaluation of the
unit. Photos of the unit are available in Figure 4.3.
The unit was installed and began operation in July of 2012. As of mid-July 2012, it was
operating at temperature (~ 38°C) and producing biogas. The digester received 200 gallons per
day of manure from the dairies collection pit, and periodic doses of wash water from the milk
processing operation. Biogas was captured and flared. The gas volume and makeup was
monitored to see if it is feasible to use the biogas as a renewable energy source at the dairy.
4.3 Conclusions
As of March 2013, the unit was generating approximately 100 cubic feet of biogas per day.
Unfortunately, the biogas quality was rather poor with less than 10% of the biogas consisting of
CH4. Possible reasons for poor quality gas production and CH4 content include inconsistent
feeding of manure/wash water, and problems maintaining temperature through the winter.
Efforts to secure additional funding for further evaluation of management, financial and
environmental implications are underway.

June 30, 2013 ANAEROBIC DIGESTION RELATED R&D RESEARCH SUMMARY
FOR WSU ARC/WSDA APPENDIX-A FUNDS
32
CHAPTER 5: PRETREATMENT OF FIBROUS
FEEDSTOCK FOR ENTRY INTO DIGESTER
Mahesh Bule, Allan Gao, Liang Yu and Shulin Chen
5.1 Introduction
In the PNW, AD is primarily used to treat municipal and animal wastewater, although it is also
potentially applicable to lawn clippings, field residues (e.g. wheat and barley straw or hay), or
dedicated crops (e.g. corn or wheat). Table 5.1 shows the CH4 potential of various plants and
plant materials that have been investigated. A relatively recent inventory indicated that there was
over 2 million dry tons of lignocellulosic residue available for conversion to energy through AD
or other processes in WA in 2005 (Frear et al. 2005).
Table 5.1: CH4 yield from the AD of different plant material (Braun et al. 2010)
CH4 Yield (m3 per t VS)
Maize (whole crop) 205–450 Barley 353–658
Wheat (grain) 384–426 Triticale 337–555
Oats (grain) 250–295 Sorghum 295–372
Rye (grain) 283–492 Alfalfa 340–500
Grass 298–467 Sudan grass 213–303
Clover grass 290–390 Reed canary grass 340–430
Red clover 300–350 Ryegrass 390–410
Hemp 355–409 Nettle 120–420
Flax 212 Miscanthus 179–218
Sunflower 154–400 Rhubarb 320–490
Oilseed rape 240–340 Turnip 314
Jerusalem artichoke 300–370 Kale 240–334
Peas 390 Chaff 270–316
Potatoes 276–400 Straw 242–324
Sugar beet 236–381 Leaves 417–453
Fodder beet 420–500
In Europe, 90% of farm-based digesters operate using energy crops due to higher biomass
potential compared to waste-based digesters (DeBruyn et al. 2006). In Germany, the number of
systems digesting energy crops rose from 100 in 1990 to nearly 4,000 in 2008 (Braun et al.
2010). Most of the large scale digesters utilizing dedicated crops (either with or without other
substrates) undergo no pretreatment prior to digestion. Instead, they use an extended HRT in
order to break down recalcitrant wastes and achieve CH4 potentials. In Austria, 41 full-scale
energy crop digestion plants had a median HRT of 133 days (Braun et al. 2010). High HRT
raises capital costs, but these projects have still be feasible in Europe due to subsidies and high
received electrical sale prices (DeBruyn et al. 2006). In the US context, where received electrical

June 30, 2013 ANAEROBIC DIGESTION RELATED R&D RESEARCH SUMMARY
FOR WSU ARC/WSDA APPENDIX-A FUNDS
33
prices are much lower, alternative methods such as pretreatment must be explored before
lignocellulosic residues will be utilized in AD.
Challenges for anaerobic digestion of lignocellulosic residues in existing digesters in the Pacific
Northwest
Even in the existing digesters that use diary waste, nearly half of the organic matter is comprised
of lignocellulosic material (e.g. diary fiber) representing a large potential source of carbohydrates
that can be converted into usable intermediates of mono-sugars (Jungersen et al. 1994; Yue et al.
2011). These recalcitrant lignocellulosic materials are difficult to digest, lowering the biogas
potential of such projects. This is one reason why co-digestion of more readily degradable
material is often included to enhance to biogas production (WSDA 2011).
5.2 Pretreatment of lignocellulosic material
Pretreatment of recalcitrant materials can improve the efficiency of the AD process. This
approach becomes particularly important when utilizing biomass that contains a high
concentration of lignocellulose. The lignin provides a protective barrier around the hemicellulose
and cellulose contained in the plant cell wall, preventing easy hydrolysis. Pretreatment
techniques can fractionate the physical and chemical structure, resulting in more efficient
hydrolysis and increasing downstream CH4 production (Liao et al. 2008). Figure 5.1 illustrates
the structure of lignocellulosic material and shows how lignin provides a protective barrier that
prevents plant cell destruction by bacteria; also included is a schematic of how pretreatment can
aid in unlocking the hemicellulose and cellulose fractions (Kumar et al. 2009).
Figure 5.1: Schematic of the role of pretreatment in the conversion of biomass to fuel (Kumar et
al. 2009)
Numerous pretreatment techniques have been extensively studied for their application to
cellulosic ethanol production, including ammonia fiber expansion (AFEX), steam explosion,
hydrothermal, and dilute acid treatment; these pretreatments are able to separate lignin from the
lignocellulosic matrix (Gao 2012). Table 5.2 shows the commonly used process parameters used
for different pretreatment techniques. As the high temperatures and pressures associated with
each of these techniques indicate, these pretreatment techniques require high energy inputs, and
also require high capital costs (Hill et al. 2006; Himmel et al. 2007). If acids or bases are

June 30, 2013 ANAEROBIC DIGESTION RELATED R&D RESEARCH SUMMARY
FOR WSU ARC/WSDA APPENDIX-A FUNDS
34
required during the pretreatment process, which is the case for many of the techniques mentioned
in Table 5.2, then highly corrosion resistant reactors made out of nickel alloys are needed, further
increasing the capital costs of pretreatment.
Table 5.2: The commonly used parameters for different pretreatment techniques reported in the
literature (Gao 2012)
Chemical
Usage/ton
biomass
Temp
(°C)
Pressure
(bar)
Residence
Time
(min)
Glucan
Yield (%)
Xylan Yield
(%)
Organosolv 4:1 C2H5OH 90–220 14–20 25–100 85–100 n/a
Ionic Liquid 10:1 Ionic liquid 100–150
n/a 30–120 55–97 n/a
Dilute Acid 0.03:1 H2SO4 160–220 5–15 2–30 85–95 70–95
Steam
Explosion
0.005:1
H2SO4
160–290 20–24 5–15 85–100 85–95
Liquid Hot
Water
6:1 H2O 160–230 24–27 15–20 55–90 80–95
AFEX 1:1 NH3 60–140 20–41 5–15 55–100 55–95
Alkaline 1.2 MPa O2 170–220 5–12 15 70–80 50–55
Lime 0.75:1 Ca(OH)2 25–150 2–20 1 week >90 80
A less severe pretreatment process which avoids harsh chemicals would positively impact the
capital cost of the pretreatment step (Gao 2012). Low pressure/temperature pretreatments that do
not require corrosion resistant vessels have been studied for their effective degradation of the
lignin fraction in lignocellulosic material (García-Cubero et al. 2009; Kim et al. 2009). Two
techniques, ozone and soaking aqueous ammonia (SAA), have been shown to be effective
pretreatments for degrading or removing lignin (Gao 2012; Gao et al. 2012). SAA is able to
retain the hemicellulose fraction while removing the lignin fraction (Kim et al. 2006). This
attribute is important to AD because studies have shown that anaerobic bacteria are quite capable
of utilizing hemicellulose in addition to cellulose (Liew 2011). Also, little to no modification
occurs to lignin but SAA is able to separate lignin from the matrix and allow greater access to the
cellulose and hemicellulose fraction, ultimately allowing for more efficient enzymatic hydrolysis
(Gao 2012). The use of ammonia on lignocellulosic material has also been shown to cause a
structural shift from cellulose I molecules to cellulose III molecules, which allows greater
accessibility for anaerobic cellulose degradation due to greater internal surface area (Gao 2012).
Ozone pretreatment has been shown to be effective due to ozone’s strong oxidizing action, which
allows it to attack compounds incorporating conjugated double bonds and functional groups with
high electron bonds. It is very effective at targeting lignin although some hemicellulose is
degraded as well (García-Cubero et al. 2009). Other advantages include the fact that ozone does
not produce inhibitory degradation products that could interfere with hydrolysis, and the fact that
reactions occur at ambient temperature and pressure (García-Cubero et al. 2009).
However, disadvantages do exist with both of these pretreatment techniques. SAA pretreatment
requires a long time to achieve acceptable lignin degradation/separation, up to 24 hrs. Ozone

June 30, 2013 ANAEROBIC DIGESTION RELATED R&D RESEARCH SUMMARY
FOR WSU ARC/WSDA APPENDIX-A FUNDS
35
pretreatment can take up to 2 hrs to complete, which is an improvement over SAA. However, it
is a more costly pretreatment process than SAA because of the high energy requirements for
producing ozone (Gao 2012). In an attempt to overcome these key disadvantages, the two
treatments were combined as well as tested separately (Gao 2012; Gao et al. 2012).
5.3 Pretreatment and anaerobic digestion
Cellulose has a highly uniform composition consisting of up to 10,000 D-glucose molecules,
which are connected by β-1,4 bonds and tilted 180 degrees towards their neighbors, producing a
uniform crystalline structure of microfibrils (Schwarz 2001). This crystalline structure combined
with bonding to other polymers, such as hemicellulose and lignin, creates an unusually resilient
substrate for hydrolytic enzymes (Schwarz 2001). Anaerobic organisms are able to handle
cellulose differently than aerobic microorganisms. Aerobic microorganisms like fungi produce
single enzyme components which are connected to binding modules (Schwarz 2001). On the
other hand, anaerobic cellulose degrading bacteria have a unique enzyme complex called a
cellulosome that is responsible for their cellulolytic behavior. The cellulosome differs from free
cellulase units because the cellulosome is composed of a primary scaffolding subunit that allows
for the combination of up to 11 enzymes, creating a very efficient process for degrading cellulose
and hemicellulose (Bayer et al. 2007). On the cell surface, these multi protein and multi
functional enzymes appear as polycellulosomal aggregates, which promotes the adherence of the
bacterium to cellulose (Leschine 1995). Figure 5.2 provides a hypothetical schematic of what a
cellulosome looks like as it attaches to cellulose.
Figure 5.2: The structure of a cellulosome (Schwarz 2001)
This close proximity between the cell and the substrate minimizes the diffusion losses of the
hydrolytic products, which is thought to be a major advantage for attached cells. Due to the multi
enzyme approach of cellulosomes, there may exist four distinct advantages for the successful
degradation of cellulose, including the following (Schwarz 2001):
1. Synergism is optimized by the correct ratio between the components, which is
determined by the composition of the complex
2. Non-productive adsorption is avoided by the optimal spacing of components working
together in synergistic fashion
3. Competitiveness in binding to a limited number of binding sites is avoided by binding the
whole complex to a single site through a strong binding domain with low specificity

June 30, 2013 ANAEROBIC DIGESTION RELATED R&D RESEARCH SUMMARY
FOR WSU ARC/WSDA APPENDIX-A FUNDS
36
4. A halt in hydrolysis on depletion of one structural type of cellulose at the site of
adsorption is avoided by the presence of other enzymes with different specificity
Thus, cellulosomes have many advantages over single enzymes for degrading cellulose in plant
material. On the other hand, some disadvantages are present as well. One disadvantage when
compared to fungi enzymes is that cellulosome is not a free enzyme, and is unable to diffuse
through media whereas fungal enzymes are aqueous free enzymes, which greatly increases their
kinetic rate. In addition, the hydrolysis step can be an extremely long process for the cellulosome
due to the complex matrix of the lignocellulosic material. The crystalline structure of cellulose
and the envelopment of cellulose and hemicellulose by lignin slow down the degradation of
lignocellulose to produce sugars. This results in a longer HRT, going from days to many months,
for hydrolysis to proceed and subsequent methanogenic activity to occur (Keating et al. 2013).
To optimize the cellulosome ability to degrade lignocellulosic biomass, extensive research into
the hydrolytic mechanism with respect to the substrate-binding capacity and specificity, interplay
of catalytic components and their distribution and composition, end product inhibition, and
stability against proteases or denaturation is necessary (Schwarz 2001). Due to these unresolved
mechanisms, commercialization of highly efficient cellulosomes cannot be relied upon as an
immediate solution to the AD of lignocellulosic biomass. However, if the cellulose can be
removed from the crystalline structure, thus releasing single cellulose units, the cellulosome will
have greater access to degrade biomass to soluble organic matter for acidogenic bacteria to
convert to hydrogen and acetate, and ultimately for methanogens to convert to CH4. Therefore,
pretreatment techniques are necessary to bridge this gap between slow hydrolysis and
cellulosome optimization to enhance hydrolysis and biogas production.
Extensive studies have been performed to see the effect different pretreatments have on
agricultural wastes and wastewater for increased biogas production including biological and
chemical additives (Lettinga et al. 1980), thermochemical pretreatment of water hyacinth (Patel
et al. 1993), ultrasonic pretreatment of waste activated sludge (Wang et al. 1999), acid hydrolysis
of dairy manure fiber (Liao et al. 2006), catalytic liquefaction of dairy manure (Jungersen et al.
1994), and dilute acid and dilute sodium hydroxide pretreatment of dairy manure fiber (Yue et al.
2011). When considering the effect pretreatment techniques can have on biogas production, the
results vary considerably. One technique, wet explosion of dairy manure fiber, increased the
biogas production by 75% (Biswas et al. 2012) while other techniques using different feedstocks
have resulted in increases ranging from 28.6–225.6% (He et al. 2009; Chandra et al. 2012).
Nevertheless, results have shown that pretreating agriculture waste, prior to digestion, is
beneficial for biogas production (He et al. 2009; Chandra et al. 2012); although, many of these
techniques require high pressure and temperature, resulting in high energy inputs and increased
costs. Due to these high energy requirements, the pretreatment techniques have seen little to no
commercial success resulting in large digester designs to handle the long HRT required for
successful digestion of lignocellulosic residues.
Due to high lignin separation/removal and low temperature/pressure requirement, ozone and
SAA was investigated as a pretreatment technique for grass clippings. In addition, a combination
of the two pretreatments known as ozone and soaking aqueous ammonia (OSAA) was tested.
Initial tests were performed on grass clippings with future experiments on the fiber contained in
dairy manure planned.

June 30, 2013 ANAEROBIC DIGESTION RELATED R&D RESEARCH SUMMARY
FOR WSU ARC/WSDA APPENDIX-A FUNDS
37
The following objectives were performed:
1. Characterizing lawn grass before and after pretreatments had been utilized via
compositional analysis
2. Developing pretreatment technologies for improved enzymatic hydrolysis
3. Utilizing untreated and pretreated lawn grass for methane production
5.4 Pretreatment and composition analysis of lawn grass
Lawn grass was obtained locally and hammer milled. During ozone pretreatment, the grass
samples were sieved through a 32–42 mesh Tyler Standard Screen Scale. Ozone was produced
by a L11-L24 Ozone Generator manufactured by Pacific Ozone, California USA. 3 g of lawn
grass particles were adjusted with moisture (90% w/w) and placed into an enclosed stainless steel
reactor. The ozonation reaction was performed under 5.3% ozone concentration (5.3% w/w) at a
flow rate of 2 L/min for 10 mins. During the SAA pretreatment process, the lawn grass particles
were pretreated by SAA using 28–30% (w/w) ammonium hydroxide solution (JTB-9721-03
Ammonium Hydroxide 28–30%) with a solid to liquid ratio of 2:10 at 50°C for 24 h with no
agitation in 1,000 ml screw cap Pyrex solution bottle. The sequential ozone and SAA process
used the same procedures of each individual pretreatment described above but at different time
intervals. Grass samples underwent ozonation for 10 min followed by SAA for 6 hrs.
Table 5.3: Compositional analysis of untreated and pretreated grass
Components Untreated
(% w/w)
Ozone
(% w/w)
SAA
(% w/w)
OSAA
(% w/w)
Sugars
Arabinose 2.90 ± 0.08 1.90 ± 0.01 3.70 ± 0.01 4.35 ± 0.36
Galactose 1.23 ± 0.02 0.89 ± 0.01 1.28 ± 0.01 0.83 ± 0.02
Glucose 16.91 ± 1.07 16.14 ± 0.11 30.85 ± 0.02 30.96 ± 0.13
Xylose 9.52 ± 0.50 9.65 ± 0.06 10.73 ± 0.04 10.59 ± 0.04
Total 30.55 ± 0.46 28.58 ± 0.20 46.55 ± 0.05 46.73 ± 0.54
Lignin
Acidinsoluble 16.66 ± 0.57 14.21 ± 0.13 13.41 ± 0.86 11.13 ± 1.01
Acid soluble 3.73 ± 0.09 4.81 ± 0.72 1.81 ± 0.34 2.51 ± 0.47
Extractives
Ethanol 5.83 ± 0.21 ND ND ND
Water 4.18 ± 0.39 ND ND ND
Total proteins 1.52 ± 0.002 ND ND ND
ND: Not determined
Afterwards, compositional analyses were performed on untreated and pretreated lawn grass for
determination of structural carbohydrates in biomass. Results from the compositional analysis
(Table 5.3) showed decreases in sugar concentration after ozone pretreatment while degrading
minimal amounts of cellulose. The sugar content of the SAA and OSAA pretreatment increased,

June 30, 2013 ANAEROBIC DIGESTION RELATED R&D RESEARCH SUMMARY
FOR WSU ARC/WSDA APPENDIX-A FUNDS
38
which could be due to removal of ash, extractives and conversion of insoluble lignin to soluble
lignin. Any increase in sugar content will lead to a better hydrolysis process and could improve
bio-methane production. Based on these compositional analyses, the sequential OSAA
pretreatment was the best technique for degrading/removing lignin and should allow anaerobic
bacteria greater access to cellulose and hemicellulose during the hydrolysis step in AD.
5.5 Developing pretreatment technologies for improved enzymatic hydrolysis
To confirm these initial findings, enzymatic hydrolysis was used to investigate sugar recovery
from untreated and pretreated grass samples. The enzymatic hydrolysis of lawn grass pretreated
was performed at 1% (w/v) solid loading in 0.05 M sodium citrate buffer (pH 4.8) containing
100 μl 2% sodium azide with 30 FPU/g of cellulase (Novozymes NS 50013) and 30 CBU/g of β-
glycosidase (Novozymes NS 50010). Table 5.4 shows the sugary recovery of untreated grass,
along with the three pretreatments. Results indicated that cellulolytic enzymes were unable to
hydrolyze sugars from untreated grass samples, which would result in low biogas production
during methanogenesis. Ozone pretreatment improved sugar recovery to 48.50%, while SAA
resulted in 86.71% sugar recovery. However, the combination of the two pretreatments (10 min
of ozone pretreatment and 6 hours of SAA pretreatment) resulted in high sugar recovery
(89.63%) while minimizing the cost and time required.
Table 5.4: Sugar recovery of lawn grass after different pretreatments
Sample Sugar recovery (%)
Untreated 0.0± 0.00
Ozone Pretreatment 48.50 ± 2.17
SAA Pretreatment 86.71 ± 0.20
OSAA 89.63 ± 2.09
5.6 Utilizing untreated and pretreated grass clippings for methane production
To fully understand how biogas production will be affected by pretreatment, untreated and
pretreated grass was anaerobically digested to determine the biomethane production and change
in VFA. Figure 5.3 depicts the biomethane production of the different treatments over 30 days.

June 30, 2013 ANAEROBIC DIGESTION RELATED R&D RESEARCH SUMMARY
FOR WSU ARC/WSDA APPENDIX-A FUNDS
39
Figure 5.3: Biomethane productions of different grass treatments
The results indicated no evidence of inhibition of the methanogens responsible for producing
CH4, although biomethane production was significantly higher when utilizing SAA and OSAA
pretreatment compared to the ozone pretreatment or untreated samples. Ozone pretreatment
negatively impacted biomethane production compared to untreated grass. This could be due to
the low sugar yield that occurred from the short ozonation process. In comparison to untreated
grass samples, ozone pretreatment actually caused a loss of sugar. One study on canned maize
production sludge showed the biomethane production using ozone pretreatment also resulted in a
lower biogas production when ozone pretreatment was performed for 30 mins (Beszedes et al.
2009). However, when the process was increased to 60 min, the biomethane production
increased around 28% (Beszedes et al. 2009). Based on these other findings, it is possible that
increasing the ozonation process beyond 10 minutes would also increase biomethane production,
though this would also increase the energy required for ozonation. It is also possible that the
ozone pretreatment inhibited methanogenesis.
When the SAA pretreatment was utilized biomethane production increased nearly 30%
compared to the untreated grass samples. OSAA also resulted in satisfactory biomethane
increases (around 18% increase), though there are indications that the OSAA pretreatment
inhibited methanogenesis somewhat.
5.7 Conclusions
This study provided concrete evidence that CH4 production was enhanced when applying
pretreatment techniques to lignocellulosic biomass. Overall, the authors suggest SAA may be the
best pretreatment because this process could integrate with the NR process being developed at
WSU. Specifically, the ammonia would be available without cost, and can be recycled and used
in the NR process for the production of bio-fertilizers after it is used for pretreatment. Another
positive attribute is that the SSA proccess does not require any special handling, making it easier
to integrate than the OSAA pretreatment process. However, a further technoeconomical analysis
will be required to develop this integrated process.

June 30, 2013 ANAEROBIC DIGESTION RELATED R&D RESEARCH SUMMARY
FOR WSU ARC/WSDA APPENDIX-A FUNDS
40
The experiments performed here provide a framework for future work to scale up pre-treatments.
In addition to scale-up efforts, a logical next step in this research would be to test these
pretreatments on dairy manure. If these pretreatments could boost biomethane production from
the currently underutilized lignocellulosic material within dairy manure, it could boost
economics at across the existing AD facilities on dairies in the PNW.

June 30, 2013 ANAEROBIC DIGESTION RELATED R&D RESEARCH SUMMARY
FOR WSU ARC/WSDA APPENDIX-A FUNDS
41
CHAPTER 6: ANAEROBIC DIGESTION OF
ALGAL BIOMASS RESIDUES WITH NUTRIENT
RECYCLE
Baisuo Zhao, Jingwei Ma, Quanbao Zhao, Craig Frear and Shulin Chen
6.1 Introduction
Microalgae are considered as one of the most promising feedstocks for biofuel production due to
their high growth rates (Scott et al. 2010) and high concentration of lipids compared to other
feedstocks (e.g. corn, maize, hemp, soybean, jatropha, camelina, palm oil) (Mata et al. 2010).
The lipids contained within the cells of microalgae can be processed into a multitude of energy
products including transesterfied biodiesel (Chisti 2007), fermented bioethanol (Bush et al.
2006), photo-biological hydrogen (Ghirardi 2000), hydrocarbon biofuels for drop-in
replacements of gasoline, diesel, and jet fuel (Jones et al. 2012), and anaerobically generated
CH4 (Sialve et al. 2009; Uellendahl et al. 2010) which can be used to generate CHP or RNG.
Although the bulk of research focused on microalgae as a renewable energy source is oriented
towards biodiesel production, anaerobically digesting microalgae for CH4 generation has also
garnered considerable interest.
The relatively simpler and lower-cost AD pathway may be particularly appropriate for
processing the lower-lipid algae that are cultivated in blooms in open ponds or waterways (often
for wastewater treatment and environmental protection purposes) (Sialve et al. 2009). In
addition, a large quantity of algae residue will be generated at algal bio-refineries composed of ≥
50% lipid content by dry weight (Scott et al. 2010), which will require disposal. Both of these
materials can be viewed as an attractive feedstock for AD (Sialve et al. 2009; Davis et al. 2011;
Delrue et al. 2012).
With this in mind, researchers at WSU, working with the National Renewable Energy
Laboratory (NREL), investigated how anaerobic microorganisms can digest microalgae either as
a whole cell or as an extracted residue for the production of biogas. Figure 6.1 illustrates the
integration of algae cultivation and AD utilizing the whole cell or algal residue. Once AD has
been completed, the nutrient rich effluent can be recycled back to the raceway ponds since AD
converts N and P from their organic forms to more readily useable inorganic forms.

June 30, 2013 ANAEROBIC DIGESTION RELATED R&D RESEARCH SUMMARY
FOR WSU ARC/WSDA APPENDIX-A FUNDS
42
Figure 6.1: Algae cultivation with AD and nutrient recycle—either whole cell or residue
6.2 Whole cell microalgae and lipid-extracted microalgae residue
WSU was one partner of a multi-institutional consortium headed by the department of energy
(DOE). WSU’s two key objectives in this consortium included (1) extensive biological methane
potential (BMP) studies on delivered algal biomass, whole cell and extracted residue, and with
various degrees of biomass pretreatment and (2) translation of the BMP data and capabilities into
continuous digestion operation for determination of system capabilities upon scale up to a 5-L
reactor size.
Five model strains, similar to those generated in pilot and commercial algal fuel production
facilities, were selected for their diversity, tolerable growth conditions, lipid and protein
contents, and other distinct physiological features. Each strain was studied in both whole cell and
extracted residue form, generating ten specific algal biomass pretreatments. The five strains that
were chosen for this project included Chlorella vulgaris UTEX 395 (C), Phaeodactylum
tricornutum CCMP 632 (P) (provided by the NREL), Nannochloropsis sp. (N), Nannochloropsis
salina (NS), and Nanofrustulum sp. (NF) (provided by Seambiotic, Solix Biosystems, and
Cellana, respectively), Eustigmatophyceae (N and NS), Bacillariophyceae (P and NF), and
Chlorophyceae (C). Outdoor production systems were used to grow N1 (raceway), NS1 (photo-
bioreactor), and NF1 (raceway), with limited information on growth conditions available due to
proprietary relations. All microalgae were harvested and centrifuged at room temperature.
Subsequently, the biomass were dried and frozen at −20°C prior to lipid extraction or for AD
treatment. Five different solvent systems including (chloroform/methanol (2:1 v/v) (control),
hexane/isopropanol (3:2 v/v), dichloroethane/methanol (1:1 v/v), dichloroethane/ethanol (1:1
v/v), and acetone/dichloromethane (1:1 v/v)), were evaluated for possible BMP inhibition using
whole cell N1 biomass.
6.3 Bench-scale and scale-up microalgae digestion
The specific methane productivity (SMP; L CH4 g VS fed-1
) and other AD performance
parameters for the five industrial strains evaluated were within a relatively tight range. Table 6.1
summarizes the data from BMP evaluation of the ten different microalgae/treatments. This
contrasts with a review of the literature, which indicated a range of methane production of 0.09–
0.54 L CH4 g-1
(Nallathambi Gunaseelan 1997; Sialve et al. 2009; Uellendahl et al. 2010; Park et
al. 2012).

June 30, 2013 ANAEROBIC DIGESTION RELATED R&D RESEARCH SUMMARY
FOR WSU ARC/WSDA APPENDIX-A FUNDS
43
It is believed that control of a viable inoculum to substrate (I/S) ratio (1.0 VS/VS) during BMP
and continuous digestion was instrumental in overcoming long chain fatty acid (LCFA)
inhibition and providing for a tighter and more effective range of SMP (0.304–0.557 L CH4 g
VS-1
) and VS reduction (59.33–78.50%). SMP appeared to be less related to algal species and
more related to LCFA content within the biomass, with a linear relationship between SMP and
ash-free lipid content being developed for easier, less time-consuming determination of
approximate SMP for particular biomass strains grown. Figure 6.2 shows this linear relationship
between SMP and ash-free lipid content. While not a perfect relationship (R2 = 0.814), it is clear
that whole cell or residual biomass lipid content is one of the most important parameters
dictating SMP. Presumably, as algal refineries come closer to reality, lipid-extraction processes
will become more effective, leading estimated SMP to be a bit lower within the developed range.
More importantly, as BMP studies on microalgae biomass can be costly and time-consuming;
narrowing of the SMP range with a suitable linear equation that describes the relationship to
remaining lipid content can enhance efficiency.
Table 6.1: BMP and performance indicators for studied biomass
Algae biomass C1 C2 N1 N2 NF1 NF2 NS1 NS2 P1 P2
Biogas (L Biogas) 5.28 5.31 5.36 5.90 6.93 4.37 8.36 5.11 5.20 4.89
CH4 Prod. (L CH4) 3.37 3.14 3.57 3.99 5.07 3.04 5.57 3.83 3.37 3.39
CH4 Fraction (%) 63.82 59.13 66.60 67.62 73.16 69.56 66.63 74.95 64.81 69.32
95% CH4 Prod. (D) 1 9.75 12.04 5.58 13.94 11.36 9.89 12.71 7.84 13.49 9.70
Max CH4 (LCH4/L D) 2
0.046 0.037 0.087 0.037 0.072 0.056 0.074 0.054 0.040 0.050
1o Hydrolysis (KHz)
3 0.22 0.19 0.41 0.17 0.22 0.31 0.16 0.24 0.16 0.23
Effluent pH 7.17 7.50 7.16 7.05 7.16 7.10 6.94 6.94 7.28 7.45
TAN (mg N/L) 401 865 458 1316 322 509 228 326 613 690
Total VFA (mg/L) 250 177 ND ND ND 118 151 155 190 55
VS Reduction (%) 66.06 64.21 65.90 64.41 76.41 59.33 78.50 73.83 70.60 60.20
SMP (L CH4/g VS
fed)
0.337 0.314 0.357 0.399 0.507 0.304 0.557 0.383 0.337 0.339
TMPE (L CH4/g VS
d)
0.510 0.489 0.542 0.619 0.663 0.512 0.710 0.519 0.477 0.563
TMPT (L CH4/g VS) 4
0.604 0.552 0.682 0.531 0.882 0.457 0.749 0.598 0.629 0.580
Degradation (%) 55.76 60.19 52.36 75.09 57.47 66.49 74.33 64.06 53.54 58.48

June 30, 2013 ANAEROBIC DIGESTION RELATED R&D RESEARCH SUMMARY
FOR WSU ARC/WSDA APPENDIX-A FUNDS
44
Figure 6.2: Relationship between ash-free lipid content and SMP for microalgae biomass
Several subsequent experiments illustrated the vulnerability of microalgae AD to long chain fatty
acid (LCFA) inhibition if appropriate process controls are not in place. Figure 6.3 illustrates the
effect the I/S ratio had on biogas production for NS1 and NS2. The threshold I/S ratio of 1.0 is
consistent with literature. Hashimoto et al. (1989) determined that a minimum ratio of 0.5 was
required for straw digestion at concentrations of 10–40 g VS L-1
. Furthermore, Hashimoto
showed that maximum CH4 production rates were achieved when I/S ratios reached 2.0. Owen at
al. (1979) and Chynoweth et al. (1993) showed similar results and suggested I/S ratios of 1.0 and
2.0, respectively. As noted, for NS1 a minimum I/S ratio of 1.0 was required to achieve stable
digestion, while for NS2, the required I/S ratio was only 0.5. Notably, NS2 has considerably less
lipids and therefore less LCFA due to the extraction process. It was thus not exposing the AD
microbes to as high a concentration of surface attaching chemicals. Conversely, the higher
concentrations of LCFA in NS1 presumably induced a greater degree of surface adhesion and
therefore microbial inhibition, requiring a greater inoculum concentration to overcome this
phenomenon.
Figure 6.3: Biogas production curves for digestion of NS1 (A) and NS2 (B) at various I/S ratios
0
100
200
300
400
500
600
700
800
900
1000
0 5 10 15 20 25 30
Bio
gas
Pro
du
ctio
n (
ml)
Time (Day)
NS2 I/S 0.1
NS2 I/S 0.5
NS2 I/S 1.0
NS2 I/S 1.5
NS2 I/S 2.0
B
0
100
200
300
400
500
600
700
800
900
1000
0 5 10 15 20 25 30
Bio
ga
s p
rod
uct
ion
(m
l)
Time (Day)
NS1 I/S 0.1
NS1 I/S 0.5
NS1 I/S 1.0
NS1 I/S 1.5
NS1 I/S 2.0
A

June 30, 2013 ANAEROBIC DIGESTION RELATED R&D RESEARCH SUMMARY
FOR WSU ARC/WSDA APPENDIX-A FUNDS
45
Figure 6.4 illustrates how the Ca affected the biogas production during digestion of NS1 and
NS2. Dosing the system with Ca raised biogas production. We hypothesize that the introduction
of suitable concentrations of Ca allowed for a Ca-LCFA substrate that relieved the bacterial
biomass of the aforementioned cell-surface inhibition. The effect of Ca dosage concentration
appears to solidify this explanation as the lower 0.5X dosage still showed some degree of
inhibition before 200 hrs, while 1.0X and 2.0X dosage showed no signs. Thus, Ca may be a
useful treatment that can reduce inhibition if needed.
Time (hour)
0 100 200 300 400
Me
tha
ne
pro
ductio
n (
mL
)
0
200
400
600
800
Ca 0
Ca 0.5X
Ca 1.0X
Ca 2.0X
Time (hour)
0 100 200 300 400
Me
tha
ne
pro
ductio
n (
mL
)
0
100
200
300
400
Ca 0X
Ca 0.5X
Ca 1.0X
Ca 2.0X
Figure 6.4: Effects of dosing Ca
on CH4 production from NS1 (left) and NS2 biomass (right)
In the case of continuous digestion, a high I/S ratio was accomplished through use of sequencing
batch reactor (SBR) processing, allowing for a much higher biomass concentration. Previous
concerns related to C/N ratio, ammonia toxicity, reduced CH4 percentages, and poor access to
organic material via cellular membranes/walls were not noted when proper digestion controls
were in place.
All biomass digested was well within industry standard of 20 days, with most achieving 95%
CH4 accumulation prior to day 15. Figure 6.5 shows how the biogas production stabilized well
before 20 days when digesting whole cell biomass. CH4 content ranged from 60–75% while
effluent TAN and VFA levels were quite low, indicating effective, complete digestion with little
concern of product inhibition, despite all samples having C/N ratios well below that ideally
preferred. Throughout all experiments, a certain degree of milling of dried biomass was utilized,
thus bringing into question the role the drying and milling processes had in easing AD
conditions. This is important as no drying or milling would likely take place in a more realistic
commercial environment. Further study on the role of this pretreatment to cellular structures via
image processing is warranted.

June 30, 2013 ANAEROBIC DIGESTION RELATED R&D RESEARCH SUMMARY
FOR WSU ARC/WSDA APPENDIX-A FUNDS
46
Figure 6.5: Biogas production curves from BMP tests on whole cell biomass
Another observation noted in regard to commercial harvest is the use of extraction solvent
mixture, with studies determining that chloroform/methanol mixtures were extremely inhibitory
to methanogenic bacteria. Due to this inhibition, it is recommended to experiment with use of
different solvent mixtures if AD is to be a critical component of the biorefinery approach. Figure
6.6 illustrates the significant decrease in CH4 production, which resulted from the
chloroform/methanol solvent.
Figure 6.6: CH4 production during digestion of N1 treated with different solvents A:
Chloroform/methanol (2:1); B: Hexane/isopropanol (3:2); C: Dichloroethane/methanol (1:1); D:
Dichloroethane/ethanol (1:1); E: Acetone/Dichloroethane (1:1)
0
100
200
300
400
500
600
0 5 10 15 20 25
Bio
gas p
rod
ucti
on
(m
l)
Time (Day)
C2
N2
NF2
NS2
P2

June 30, 2013 ANAEROBIC DIGESTION RELATED R&D RESEARCH SUMMARY
FOR WSU ARC/WSDA APPENDIX-A FUNDS
47
Scale up to continuous digesters showed general maintenance of previously identified BMP
capabilities. The NS1 digester showed higher SMP ranging from 0.59–0.65 L CH4 g VS-1
, while
the NS2 digester showed a lower SMP ranging from 0.29–0.42 L CH4 g VS-1
. VS reduction
percentages at lower OLR were also on par with earlier BMP trials, while percentages decreased
at higher OLR tested due to accumulation of undigested algae residue. Results showed that the
OLR in the NS2 digester could reach up to 5 g VS L-1
d-1
, while the NS1 digester failed at an
OLR of 3.0 g VS L-1
d-1
. Figure 6.7 illustrates how the OLR affected the biogas production for
NS1 and NS2.
Figure 6.7: CH4 production from NS1 (top) and NS2 (bottom) digester at different OLR

June 30, 2013 ANAEROBIC DIGESTION RELATED R&D RESEARCH SUMMARY
FOR WSU ARC/WSDA APPENDIX-A FUNDS
48
Reasons for the decreased viability of NS1 at higher OLR as compared to NS2 is attributed to
LCFA inhibition with LCFA accumulating within the digester and attaching to the retained
biomass, reducing bacterial performance until ultimately the digester failed. As the ultimate
preferred use for AD within the algal biorefinery concept is to treat lipid-extracted microalgae,
the excellent results with NS2 is encouraging, but the noted impact of LCFA on ultimate OLR of
NS1 should be useful to those potentially digesting whole cell microalgae.
At these two maximum OLR, both NS1 and NS2 could achieve a volumetric methane potential
(VMP) of 1.40 m3 CH4 m
-3 d
-1. For comparison purposes, most commercial sludge/manure
digesters are deemed effective if they achieve VMP near 1.0 m3 CH4 m
-3 d
-1; thus our results
suggest commercial viability. Effluent nutrient concentrations were notably high at higher OLR,
allowing for potentially important economic benefits upon recycle of these nutrients to the
growth ponds. Effluents and their characteristics were made available to NREL for such
recycle/growth studies.
6.4 Conclusions
Microalgae are an attractive renewable energy solution due to their intrinsic ability to accumulate
lipids extracellularly, live in harsh environments, and grow at high rates compared to other
feedstocks. Most renewable energy research on microalgae has focused on converting extracted
lipids into biodiesel. However, the remaining biomass from this process could be utilized by AD
to produce electricity or RNG. Therefore, researchers at WSU working with NREL tested the
biomethane production of 5 different strains of algae, as either whole cell or lipid extracted. 5
different solvent systems were utilized for extracting the lipid from the cell. Based on the studies
performed at WSU, the following conclusions were made:
Chloroform/methanol created sustained inhibitory conditions for AD.
A linear relationship between SMP and ash-free lipid content was determined, showing
the strong relationship that LCFA has on CH4 production.
As the I/S ratio increased, so did the biogas production; though the presence of LCFA did
have inhibitory effects on the biogas production. This provides further evidence that
LCFA should be monitored for successful digestion.
Dosing the system with Ca raised the level of biogas production.

June 30, 2013 ANAEROBIC DIGESTION RELATED R&D RESEARCH SUMMARY
FOR WSU ARC/WSDA APPENDIX-A FUNDS
49
CHAPTER 7: ANAEROBIC DIGESTION
EXTENSION - TECH TRANSFER PROJECT
Craig Frear, Georgine Yorgey, Sylvia Kantor and Chad Kruger
The purpose of the AD Extension – Tech Transfer Project is to provide high-demand educational
products and services that reduce technical, financial, and policy barriers to the development of
the AD industry. The tasks were developed and prioritized based on informal needs assessment
from industry, government and non-governmental partners. The focus is on assisting industry
growth and the development of durable extension materials focused on industry and industry-
serving clientele, rather than (in addition to) scientific publication. The industry
commercialization component is summarized in section 7.1 while the durable extension materials
are summarized in section 7.2.
7.1 Assisting AD industry growth
Several key applied research and extension activities were conducted during this past quarter:
Dr. Frear continues to lead project development, Pro Forma analysis and pre-engineering efforts
for several projects in WA that integrate AD of organic waste and nutrient recovery (NR) with a
specific aim of producing RNG fuel. Specific projects include
The PacifiClean project, which is aimed at integrating an AD and NR unit within a
planned compost yard. A revised set of Pro Forma and engineering plans were presented
last quarter to prospective investors and business developers.
Outlook POD, a large dairy CAFO project located in the Yakima Basin. This project is
aimed at responding to area needs in nutrient management and new business models for
AD development. Dr. Frear continues to work with project teams to develop the business
plans of the project. As of June 2013 the project was entering the financing stage, with
plans for construction in spring of 2014.
Much of the outreach work specific to the Yakima Basin project has also been in coordination
with the EPA Region 10, with Dr. Frear providing instrumental support in educating/informing
both EPA and concerned dairymen in on-going issues related to nitrate levels in the Basin (EPA
2013).
In addition to the proposed projects mentioned above, on-going demonstration of NR research
through leveraged funding continues at Lynden and Enumclaw, WA, where two NR
demonstration units are being operated alongside anaerobic digesters. Dr. Frear works with
industry partners and farmers on a weekly basis regarding attempts to refine and improve the
technology. He is also assisting industrial partners in project development across the country.
Beyond work on specific products, Dr. Frear has continued to explore more sustainable ways to
produce the desired co-products, and is working to improve the marketing and usability of
developed products. Key tasks that have been implemented include:

June 30, 2013 ANAEROBIC DIGESTION RELATED R&D RESEARCH SUMMARY
FOR WSU ARC/WSDA APPENDIX-A FUNDS
50
Working with industry and fertilizer distributors to grow mature markets for the
developed products from NR (ammonium sulfate biofertilizer and P-rich biosolid)
Working with WSU Prosser scientists in improving knowledge of the effect these bio-
fertilizers have, at greenhouse scale, on yield and ecosystem services emissions such as
GHG and nitrates
Coordinating with Washington State Department of Agriculture (WSDA) officials on
licensing of fertilizer products and development of allowed storage and containment
facilities for the bio-fertilizers.
Lastly, Dr. Frear has made numerous key presentations and met with valuable stakeholders
throughout this biennium—all related to development of AD and NR. These presentations
include the following:
AiCHE National Conference in Pittsburgh, PA
USDA NIFA Meeting in Washington, DC
Washington State Bioenergy Symposiums in Seattle, WA
The PNW Fertilizer Association Annual Conference in Pasco, WA
EPA Agstar National Conventions in Boise, ID, Syracuse, NY, and Indianapolis IN
Biocycle National Conferences in Portland, OR and San Diego, CA
California Dairy Summit in Modesto, CA
Center for Dairy Innovation Markets Webinar
ABO Algal National Conference in Denver, CO
Oregon AD Summit in Portland, OR
EPA AD Markets Summit in Washington, DC
Qualco Farm Field Day in Monroe, WA
WA Dairy Federation Meetings in Everett, WA
US/China AD Symposium in Beijing, China
7.2. Webinar and other outreach programs tasked by Appendix A:
Nutrient recovery webinar
October 2011—WSU scientists have conducted extensive research on AD as a technology for
recovery of CH4 (energy), stable carbon, and nutrients from organic wastes such as manure, food
processing wastes and the organic fraction of municipal solid wastes (OFMSW). Our research
has evaluated the technical and economic performance of commercially available systems,
developed improved AD reactors, and commercialized WSU patented NR technology (AIR-
TRAP system). This potentially game-changing technology could make integrated AD and N
and P recovery commercially viable. This webinar, presented by the center for sustainable
agriculture and natural resources (CSANR) director Chad Kruger and CSANR scientist Craig
Frear, provided an update on the latest results from the WSU Climate Friendly Farming Project’s
AD research and can be viewed on the web (http://breeze.wsu.edu/p52833652/).
June 30, 2013 ANAEROBIC DIGESTION RELATED R&D RESEARCH SUMMARY
FOR WSU ARC/WSDA APPENDIX-A FUNDS
51
Anaerobic digestion project/nutrient recovery system field day
A field day/tour of the WSU commercial AIR-TRAP system is scheduled for July 10, 2013. The
field day was delayed a few months to allow additional time for final testing of the AIR-TRAP
system to be completed. The planned field day includes visiting the Vander Haak Dairy where
the AIR-TRAP system was installed (along with numerous other R&D investments) as well as
visiting the brand new completed digester installation less than 1 mile away located at Edaleen
dairy. The target audience includes farmers, government agency/regulatory representatives,
community and political leaders, AD entrepreneurs/project developers/technology providers,
community members, environmentally-oriented undergraduate and graduate students, and
Carbon Masters.
Nutrient recovery technology fact sheet
While working on commercializing AD technology on dairies it has become increasingly clear
that a systems approach that includes NR is essential for comprehensive dairy manure
management. WSU has conducted assessment of multiple options for recovery of N and P from
digested dairy manure. An initial review of this evaluation was presented in chapters 7 and 8 of
the Climate Friendly Farming Project Final Report (Kruger et al. 2010). A fact sheet has been
drafted that describes the scientific rationale and need for combining NR technology with AD
and introduces the WSU AIR-TRAP system. This fact sheet is being finalized for submission to
the WSU Fast Track Publication system.
Anaerobic digestion project financial trade-off fact sheet
WSU completed a comprehensive economic analysis of AD systems (Bishop et al. 2009) that
included an interactive spreadsheet useful for adjusting scenarios and project costs. This was the
most comprehensive economic scenario analysis for dairy AD projects publicly available at the
time. However, the data for this study was collected between 2005 and 2006 and the assessment
is now dated, given the subsequent upgrades to AD systems and changes in project landscape.
Estimates of financial costs and revenues for current AD projects were updated with 2011–2012
figures through a companion project that assessed the feasibility of multi-faceted AD systems
installations in Eastern and Western WA (Coppedge et al. 2012). This study addressed specific
questions that have emerged in recent years, such as financial trade-offs of fabrication materials,
relative profitability based on project scale, options for biogas and co-product utilization, and
financial trade-offs of auxiliary technology such as NR. While comprehensive and detailed, this
feasibility study is a cumbersome report that needed to be distilled into a simplified fact sheet to
provide up-to-date financial evaluation for commercial AD projects and insight into the
conditions that affect project profitability. The primary audiences for this fact sheet are
community economic development entities (ports, economic development authorities, and
utilities), farmers, consultants and others that need an introduction to the financial concerns
associated with digester projects. A secondary audience includes technology providers and
project developers. This fact sheet will be completed and submitted to the WSU Fast Track
Publication system in June.

June 30, 2013 ANAEROBIC DIGESTION RELATED R&D RESEARCH SUMMARY
FOR WSU ARC/WSDA APPENDIX-A FUNDS
52
Anaerobic digestion project overview video
Formal and informal evaluations conducted at prior events (workshops, field days, etc.) indicate
that most dairy industry clientele in the region have a basic understanding of AD technology and
many have personally visited AD projects. However, many of the non-industry clientele that
have an influence in project development (i.e. local and state government, financial institutions,
utilities, etc.) have not had any kind of formal overview of AD projects and their lack of basic
understanding is a barrier to the development of specific projects. An overview video, with an
emphasis on providing visuals, was deemed the most effective and efficient media for providing
a succinct overview of AD systems, reducing the need and expense of hosting future AD 101
workshops. The overview video has been finalized and posted on a permanent YouTube
Channel: http://youtu.be/Ei49Z4oeUtY. We are working with CAHNRS Marketing and News on
a promotional plan to publicly “release” the video in June as part of the advertising campaign for
the field day (task #2).
Anaerobic digestion workshop at Bioenergy Research Symposium
The state’s Bioenergy Research Symposium has become the most effective venue for sharing the
rapid advances in AD research in the region. We hosted a workshop and/or poster session for the
2012 Symposium. The session is described below:
Innovations in bioprocessing
Increasing interest in waste-to-energy technologies, nutrient management, process efficiencies
and economies-of-scale is driving innovative research into bioprocessing pathways. This panel
will explore exciting discoveries looking to advance to commercial-scale applications.
http://www.pacificbiomass.org/BioenergyResearchSymposiums/BioenergyResearchSymposium
2012.aspx
Moderator: Craig Frear, WSU
NR from High-Solids AD (Craig Frear, WSU)
New High-Solids AD Systems (Shulin Chen, WSU)
Integrating Pyrolysis and AD (Manuel Garcia-Perez/Matthew Smith, WSU)
Breaking the Barrier of Biomass Conversion Using Wet Explosion Pretreatment (Philip
Teller, WSU)

June 30, 2013 ANAEROBIC DIGESTION RELATED R&D RESEARCH SUMMARY
FOR WSU ARC/WSDA APPENDIX-A FUNDS
53
CHAPTER 8: MISCELLANEOUS RESEARCH
8.1 Psychrophilic anaerobic digestion
Jingwei Ma, Jie Liu and Shulin Chen
8.1.1 Introduction
Throughout the Northern Hemisphere, numerous household and commercial AD facilities have
been constructed. However, a majority of these facilities have either ceased functioning or yield
low amounts of biogas due to poor construction, lack of awareness, improper feeding and
souring during winter. For example, a biogas facility located in the Himalayas had 70% lower
biogas output during the winter season than in the summer (Kanwar et al. 1994). This is
undesirable from an economic standpoint but, more importantly from an energy standpoint – as it
means AD is least able to meet demand during the winter when demand is at its highest. This is a
serious concern when biogas plants are used for cooking and heating, forcing the users to seek
other fuels to replace this loss of energy (Kashyap et al. 2003). Winter souring is the result of an
inability to maintain an effective heat and temperature balance within the digester. This can
occur for one or more of the following reasons:
1. Improper engineering to adequately overcome heat losses in cold environments
2. Over-dilution
3. Cold wastewater
4. Economic factors which prevent the inclusion of heating or heat recovery systems
5. Anaerobic micro organism populations that are negatively affected by a drop in
temperature
At lower temperatures, the mesophilic bacteria that dominate at higher temperatures (32–38°C)
are unable to sequester substrates from their environment because of lowered affinity (Nedwell
1999). This results in lower biogas production compared to digesters operating at the higher
temperatures mesophilic bacteria thrive in (Kashyap et al. 2003). One proposed method for
overcoming this lower degradation is slowing down the loading rate and increasing the HRT to
over 100–300 days (Safley et al. 1990). However, this would require larger digesters to handle
the higher volume of organic matter and is not viable for household digestion. An alternative
solution is to find other ways to improve the biogas production process without substantially
altering the digester itself.
One approach to overcoming this phenomenon is to utilize psychrophilic microbes during AD,
since they are more adept at surviving, and even thriving in, low temperature environments. The
Arrhenius equation has been used to show how the losses in biogas production occur at lower
temperatures through a correlation between the active temperature ranges of anaerobic
microorganisms and their subsequent biogas production (Schütz et al. 1990). However, there still
are benefits to such design as reduced but stable performance during winter is preferred over

June 30, 2013 ANAEROBIC DIGESTION RELATED R&D RESEARCH SUMMARY
FOR WSU ARC/WSDA APPENDIX-A FUNDS
54
complete stoppage or sustained, extensive inhibition. Methanogenesis has been reported in
diverse cold habitats including arctic and sub-arctic peat lands (Metje et al. 2007), freshwater
sediments (Nozhevnikova et al. 2001), and high-altitude rice paddy soils (Fey et al. 2000).
Several psychro-active acetogenic bacteria and psychro-active methanogenic archaea have been
isolated from cold environments and have shown growth potential at temperatures below 10°C
(Nozhevnikova et al. 2001); however, the microbial interactions and biochemical pathways
involved are still not well understood (Kashyap et al. 2003). Studies have been conducted on low
temperature digestion but were later found to be psychrotrophic bacteria, which are more capable
of handling temperature changes then psychrophiles (Kashyap et al. 2003). Due to these
misunderstandings, the most adept microorganisms have yet to be extensively studied for their
effectiveness at producing biogas for energy use at low temperature. Therefore, research on
psychrophilic bio-methanation was carried out, as part of an effort to develop a new generation
of anaerobic fermentation technologies that can overcome the biogas reductions currently seen at
digesters in regions with extreme temperature swings.
8.1.2 Biogas production from various low temperature sources
Samples from low temperature environments were screened for phychrophilic consortia at WSU.
Ten microbial consortium samples from different environments were chosen to enrich
psychrophilic microorganisms or psychro-active microorganisms. The ten microbial consortium
samples originated from the following locations: three separate lagoon locations located at WSU
Knott Dairy Center (L1, L2, and L3), a mix tank located at WSU Knott Dairy Center (Mix), a lab-
scale sequential batch reactor fed with flushed dairy manure located at WSU (SBR), waste
activated sludge from the Pullman Wastewater Treatment Plant (PWTP) located in Pullman, WA
(WAS), an aeration tank from the PWTP located in Pullman, WA (Aeration), a household
digester located in LD, Heilongjiang, PRC (LD), a household digester located in SH,
Heilongjiang, PRC (SH), and a household digester located in XW, Heilongjiang, PRC (XW). All
of these locations undergo significant temperature swings from summer to winter and because of
this should be appropriate locations for discovering psychrophilic bacteria.
8.1.2.1 Results and discussion
Table 8.1.1 depicts the different locations of the inoculums subdivided into three categories
including dairy lagoon, digester and WWTP. Dairy manure was used as substrate for biogas
production. Fresh dairy manure with TS of 180.7 g/L and VS of 151.3 g/L was collected from
the WSU’s Knott Dairy Center in Pullman, WA, USA and stored at 4°C prior to use.
Table 8.1.1: Biogas potential generated from different microbial consortium
Category Dairy lagoon Digester WWTP
Inocula source L1 L2 L3 Mix SBR LD SH XW WAS Aeration
Biogas (mL) 2523 2326 2355 2817 1911 2020 2277 1877 1562 1251

June 30, 2013 ANAEROBIC DIGESTION RELATED R&D RESEARCH SUMMARY
FOR WSU ARC/WSDA APPENDIX-A FUNDS
55
Experiments were conducted in 250 ml serum bottles that were kept inside a temperature
controlled room at 15°C. Biogas production was monitored daily and gas content was analyzed
by gas chromatography (GC). Each set was run in triplicate to ensure reproducibility of results.
The biogas production profile is shown in the Figure 8.1.1 and compared in Table 8.1.1.
Time (day)
0 20 40 60 80
Bio
gas
pro
duct
ion (
mL
)
0
500
1000
1500
2000
2500
3000
WAS
SBR
Lagoon1
Lagoon2
Lagoon3
Mixing tank
Aeration tank
LD
SH
XW
Figure 8.1.1: Biogas production from 10 low temperature consortiums (triplicate)
Anaerobic microorganisms from dairy lagoon and digesters showed a higher biogas production
rate than aerobic microorganisms from active sludge from the WWTP as they adapted to
anaerobic environment better than aerobes. Biogas production from digesters inoculated with
dairy lagoon (L1, L2, and L3) microorganisms presented a high biogas production rate due to
undigested manure in the seeds. Taking this into account, the microbial consortium sampled
from the long time running digesters, especially SH and LD, were considered as good candidates
for psychrophilic consortium.
8.1.2.2 Conclusions
Psychrophilic consortium from long-time running digesters showed good biogas production.
However, psychrophilic consortium from dairy lagoon showed the highest biogas production
since undigested dairy manure was associated with inoculum. If we take this unforeseen
occurrence into consideration, the psychrophilic consortium from SH digester which didn’t have
undigested dairy manure in the seed resulted in the highest biogas production. Therefore, the
psychrophilic consortium inhabiting the SH inoculum will be used for further analysis and the
performance will be compared with mesophilic AD. The studies performed above provided
initial data on discovering the best fit consortia for further analysis. The next step in this process
will be to generate low temperature anaerobic digestion (LTAD) that will utilize the psychro-
active consortium with the goal of developing high treatment efficiency, low construction and

June 30, 2013 ANAEROBIC DIGESTION RELATED R&D RESEARCH SUMMARY
FOR WSU ARC/WSDA APPENDIX-A FUNDS
56
operation cost digestion technology to produce multiple products using real-time object-oriented
control systems.
8.1.3 Enhancing biogas production of psychrophilic anaerobic digestion with the addition of
trace elements
Bacteria require macronutrients and trace elements such as N, P, sulfur (S), K, Ca, magnesium
(Mg), iron (Fe), nickel (Ni), cobalt (Co), zinc (Zn), manganese (Mn), and copper (Cu) to grow
optimally (Rajeshwari et al. 2000). Unfortunately, wastewater streams can lack the required
concentrations of some of these micronutrients and trace elements, requiring supplementation
prior to digestion (Amani et al. 2010). Since trace elements play such an important role in AD,
studies were performed at WSU on the effect trace elements have on the psychrophilic bacteria.
Two psychrophilic consortia (SH and LD) from long-time running digesters with higher CH4
production were selected as target consortium in this research for evaluation of trace elements
addition. The TS and VS of SH were 16.0 g/L and 12.6 g/L, respectively. TS and VS of LD were
22.7 g/L and 18.2 g/L, respectively. Dairy manure was used as substrate for biogas production.
Fresh dairy manure with TS of 180.7 g/L and VS of 151.3 g/L was collected from the WSU
Knott Dairy Center in Pullman, WA, USA and stored at 4°C prior to use.
During BMP assays, 5 g VS of dairy manure were inoculated with 60 mL of one psychrophilic
seeds and placed into 250 ml flasks that served as bioreactors for the BMP studies. The working
volume in each BMP reactor was 200 ml with the rest serving as headspace. Optimal trace
elements concentration for CH4 production was determined in a previous study to be 1 mg/L of
Fe, 0.25 mg/L of Ni, and 0.2 mg/L of Co. Digesters without trace elements addition served as the
control. All digesters were incubated in a low temperature chamber at 15°C. Biogas production
was monitored daily and gas content was analyzed by GC. Each set was run in triplicate to
ensure reproducibility of results.
8.1.3.1 Results and discussion
Figures 8.1.2 shows the accumulated biogas production of digesters inoculated with SH and LD,
respectively. With the trace elements addition, the biogas and CH4 production from SH increased
by 28% and 17%, respectively. However, no notable enhancement or inhibition was observed in
biogas production of LD digester, which indicated that the demand of trace element for
psychrophilic consortium is species specific, and different bacteria or archaea have disparate
needs for trace elements consumption. When compared with a typical mesophilic digestion
process (0.23 L CH4 gVS-1
), the ultimate CH4 yield at psychrophilic condition (0.14 L CH4 gVS-
1) was quite low, even after trace element addition. However, without input energy for heating,
the psychrophilic digester may still be able to compete with the mesophilic digester on a net
energy output. Though, a techno-economic analysis is required to further evaluate this
possibility.

June 30, 2013 ANAEROBIC DIGESTION RELATED R&D RESEARCH SUMMARY
FOR WSU ARC/WSDA APPENDIX-A FUNDS
57
Time (day)
0 20 40 60 80
Bio
gas
pro
duction (
mL
)
0
200
400
600
800
1000
1200
1400
SH treatment
SH control
Time (day)
0 10 20 30 40 50 60 70
Bio
gas
pro
duction (
mL
)
0
200
400
600
800
1000
1200
1400
LD treatment
LD control
Figure 8.1.2: Biogas production of SH inoculated digester (left) and LD inoculated digester
(right)
8.1.3.2 Conclusions
Our studies showed that low temperature digestion is possible and that anaerobic bacteria in
certain locations have a better ability to adapt to low temperature conditions. Our results suggest
that when inoculating an anaerobic digester it is advantageous to choose the substrate from an
area that has undergone anaerobic digestion in a low temperature setting for an extended period
of time. To fully justify the claim that this consortium was that of psychrophilic bacteria, a clone
library should be constructed and used to identify the type of methanogens present during this
low temperature digestion.
Psychrophilic microbes require a higher concentration of trace elements than mesophilic
microbes. However, the demand for trace elements is species specific with different bacteria or
archaea requiring different trace elements for enhanced digestion. Therefore, this strategy may
need to be optimized for each digester due to the diverse microbial community structure in each
digester.
Since many dairy farms are operated in the Northern region of US, China, and Europe,
psychrophilic technologies treating dairy waste in regions of low temperature will be beneficial
for both waste management and bioenergy production. Mesophilic digestion is the preferred
choice for performance and efficiency but it is highly energy intensive in winter. In cases where
these heating requirements cannot be maintained, pcychrophilic consortia may be helpful.

June 30, 2013 ANAEROBIC DIGESTION RELATED R&D RESEARCH SUMMARY
FOR WSU ARC/WSDA APPENDIX-A FUNDS
58
8.2 Carboxylate Platforms
Baisuo Zhao, Craig Frear and Shulin Chen
8.2.1 Introduction
As discussed more fully in Chapter 6, research on the use of microalgae for biodiesel and for AD
have both recently received increased attention. Within AD of microalgae, the low C/N ratio
from algal biomass is another serious problem since algae biomass typically has high protein
content (39−71%), which could produce high TAN and result in the inhibition of methanogenesis
(Sialve et al. 2009). One solution that has been implemented by other researchers is co-digestion
of microalgal biomass with another substrate that is high in carbon and low in N. This can
diminish NH3+ toxicity and increase biogas production. For example, biomethane yield and
productivity doubled when equal masses of wastewater sludge and Spirulina biomass were co-
digested (Samson et al. 1982). Similarly, Yen and Brune (2007) added waste paper (50% w/w) to
aquaculture algal sludge to adjust the C/N ratio to around 20−25:1 which, in turn, doubled the
CH4 production rate from 0.6 L/L liquid day to 1.2 L/L liquid day at 35°C with a HRT of 10
days.
Recently, another advanced biorefining technology, the MixAlco process within the ‘carboxylate
platform’, was developed by Holtzapple and colleagues (Holtzapple et al. 1999; Holtzapple et al.
2009; Agler et al. 2011). This technology can convert complex waste into mixed carboxylate
salts, an effective feedstock for downstream production of biofuels and valuable targeted
chemicals, using an undefined anaerobic acid-forming bacterial consortium. In theory, the high
concentrations of TAN from algal protein during the fermentation are easily acidified, resulting
in the accumulation of high concentrations of carboxylic acids. Simultaneously, the high
concentration of ammonium derived from algal TAN is able to neutralize the produced
carboxylic acids, which can directly lead to a low supplement salt bicarbonate buffer (Fu 2010).
The cow rumen contains more than 1,000 bacterial OTUs associated with the biodegradation of
lignocellulose (Hess et al. 2011). These bacteria provide rapid fermentation rates from the
complex feedstock with high productivity of short-chain volatile carboxylic acids which includes
acetic, propionic, and butyric acids (Weimer et al. 2009).
The goal of this work was to establish a mixed culture of cow rumen bacteria for the
transformation of microalgal biomass to carboxylates using ASBR technology as a consolidated
bioprocessing (CBP) system. Figure 8.2.1 illustrates this consolidated process to produce
carboxylate with subsequent NR and downstream processing to biofuels.

June 30, 2013 ANAEROBIC DIGESTION RELATED R&D RESEARCH SUMMARY
FOR WSU ARC/WSDA APPENDIX-A FUNDS
59
Figure 8.2.1: Overview of the CBP from algal biomass to carboxylate salts
During the experiments, the bacterial population dynamics and community were investigated by
T-RFLP technology. Understanding the microbial population and its community structure
involved in the carboxylate platform will help us to (1) refine the design and operation of the
bioreactor system, (2) facilitate the development of inoculum for large-scale implementation of
this process, and (3) contribute to the developing body of knowledge regarding conversion and
biofuel production from algal biomass.
8.2.2 Materials and methods
8.2.2.1 Feedstock and inoculum source
Scenedesmus dimorphus, a freshwater unicellular alga of class Chlorophyceae, was used in this
study as the biomass feedstock for a series of fermentation experiments. The media for S.
dimorphus cell culture was composed of 5 ml feed concentrate per gallon filtered tap water. The
feed concentrate was prepared as follows (w/v): 2.60% N, 1.20% phosphate, 2.40% soluble
potash, 1.88% calcium, 0.78% magnesium, and 0.04% iron. The culture media was derived from
the following: fish meal, composted seabird guano, kelp, rock phosphate, potassium carbonate,
magnesium carbonate, calcium carbonate, calcium nitrate, magnesium nitrate, and iron EDTA. S.
dimorphus were photoautotrophically cultured for 15 days at pH 6.0−8.4 at a temperature of
22−25°C in a closed pond. The algal biomass of S. dimorphus was harvested, dewatered, and
dried using the HDD technology described by Algaeventure Systems (http://www.algaevs.com/).
Thereafter, the microalgal biomass was desiccated at 105°C to a constant weight before
fermentation. Finally, the dried biomass was milled and passed through 1 mm screen in a
Cyclone Analytic Grinder (USA). The seed inoculum of the mixed fiber and liquid from cow
rumen used in the ASBR reactor was obtained from the farm of animal science at WSU in
En
zym
e p
rod
uctio
n
Hyd
roly
sis
Cow rumen
microbes
Complex
enzymes
KetonesDewater
Hydrogenation
Ketonization
Gas NH3
Effluent containing
residual nutrient
N, P, K, etc.
Re
co
ve
ry
Mixed
carboxylate
salts
Gas CO2
Phosphorus
in struvite
DownstreamProcess
CBP
Fermentation
broth
e.g. acetate,
propionate,
butyrate, etc.
Mixed
Carboxylic
Acids
Acid springing
Aqueous NH3
Excess NH3
Dehydration+
Oligomerization
Mixed primary alcohols
(e.g. ethanol)
Mixed secondary alcohols
(e.g. isopropanol)
Hydrocarbons fuels
(e.g. gasoline)
Alcohols
EstersEsterification
Hydrogenation
Ino
ca
ula
tion
Re
co
ve
ry
Nu
tra
liza
tio
n (
pH
7.0
)
Nutrient Recovery
Phototrophic
algal biomass
A little
bit of H2
H2
H2
Thermal conversion

June 30, 2013 ANAEROBIC DIGESTION RELATED R&D RESEARCH SUMMARY
FOR WSU ARC/WSDA APPENDIX-A FUNDS
60
November 2010. The samples were immediately transferred in sterile N2-full serum bottles,
tightly sealed with butyl rubber stoppers, kept at room temperature during transportation, and
then stored at 4ºC for later use. Aliquots of samples were added to inoculate the bioreactor
vessels.
8.2.2.2 Bioreactor construction and performance monitoring
4 g dried algal biomass of S. dimorphus and 10% seed inoculum were inoculated in four serum
bottles for the ASBR. The anaerobic cultures of the ASBR reactor were neutralized with aqueous
ammonia (10% w/v) to a pH of between 6.95–7.05 before fermentation, flushed with O2-free N2
gas for 15 min to induce an anaerobic condition, and incubated at 39±1ºC and 200 rpm. After 95
h of reactor operation, 95, 50, 33.3, and 25 ml of the cultured medium for 4.2, 8, 12, and 16 days
of HRT were replaced by equal volume of fresh medium containing 3.8, 2, 1.33, and 1 g algal
biomass, respectively. The reactors were operated again for 95 h. From the second cycle, every
operation was comprised of a decanting period (10 min), feeding period (20 min), neutralizing
acids period (20 min), flushing period (10 min), and reacting period (varied by HRT). The initial
volatile solids loading rate (VSLR) was decreased stepwise by increasing HRT from 4.2, 8, 12,
and 16 days. The experimental design conditions for the different HRT in the ASBR system are
shown in Table 8.2.1. Constant substrate consumption and carboxylic acids production (±5%
variation) were considered as indicators for the steady state conditions.

June 30, 2013 ANAEROBIC DIGESTION RELATED R&D RESEARCH SUMMARY
FOR WSU ARC/WSDA APPENDIX-A FUNDS
61
Table 8.2.1: Operational parameters and characteristics of un-extracted algal biomass samples
ASBR fermentation A B C D HRT (days) 4.2 8 12 16
VSLR (g VS fed/L liquid day) 7.51 3.96 2.65 1.98
Total carboxylic acid concentration (g/L liquid) 3.62±0.63 7.50±0.81 12.35±0.53 14.06±0.59
Product distribution
Acetic acid (wt %) 54.85±7.96 49.16±9.88 44.90±3.33 36.28±3.50
Propionic acid (wt %) 15.48±2.76 15.23±1.83 14.56±1.52 12.21±1.69
Butyric acid (wt %) 19.23±1.41 22.04±1.94 21.48±0.75 21.48±2.17
Valeric acid (wt %) 10.43±1.35 13.57±0.82 13.88±1.49 17.12±3.29
Caproic acid (wt %) 0.00±0.00 0.00±0.00 4.18±2.91 6.72±1.39
Heptanoic acid (wt %) 0.00±0.00 0.00±0.00 0.00±0.00 6.58±0.68
Conversion (g VS digested/g VS fed) 0.208 0.381 0.526 0.598
Yield (g total acids/g VS fed) 0.115 0.237 0.388 0.443
Selectivity (g total acids/g VS digested) 0.552 0.621 0.738 0.742
Total carboxylic acid productivity (g total acids/L liquid day) 0.862 0.938 1.029 0.879
Acetic acid yield (g acetic acid/g VS fed) 0.063 0.116 0.174 0.161
Methane productivity (g CH4/L liquid day) 0.0002 0.0009 0.0006 0.0010
TAN (mg/L) 522.2 551.7 584.7 626.7
The lab-scale ASBR bioreactor (New Brunswick Scientific Inc., Model Bioflo 110 Fermentor,
NJ) was operated with 5 L working volume supplied with 3% seeds of 12 HRT (Figure 8.2.2) at
39±1ºC and 200 rpm. The reactor was perfectly sealed and the head unit included functional
ports such as feed inlet and outlet, temperature probe and pH probe. Prior to start-up of the
reactor, it was sparged with O2-free N2 gas for 25 min. During the fermentation, 30% aqueous
ammonia was pumped automatically into the fermenter to maintain a pH within 7.0±0.1.
Figure 8.2.2: Schematic of the fermentation process with attached monitoring system

June 30, 2013 ANAEROBIC DIGESTION RELATED R&D RESEARCH SUMMARY
FOR WSU ARC/WSDA APPENDIX-A FUNDS
62
Methanogens were inhibited by a concentration of 25 mg iodoform/L which came from a
concentrated solution (25 g iodoform/L ethanol) during the fermentation (Fu 2010). The
concentrated solution was stored in a sterile sealed N2-full serum bottle encased in aluminum foil
at 4ºC due to the sensitivity of iodoform to light and air. The iodoform was taken through the
butyl rubber stopper with the 1 ml syringe, and added into the reactor every two days to prevent
CH4 production.
8.2.2.3 Analytical methods
The elemental analysis for carbon, hydrogen, oxygen, nitrogen, and sulfur of S. dimorphus was
performed according to standard methods (Pella 1990) at the Stable Isotope Core Laboratory,
WSU. The total cell lipid was determined after fatty acid methyl ester synthesis using capillary
GC on a SP-2560, 100 m x 0.25 mm x 0.20 μm capillary column (Supelco), as described by
O'Fallon et al. (2007). The TAN was determined by N-Macro Kjeldahl method and total
phosphate level was assessed using TS and VS in the initial substrates and fermentation residues
were measured using the national renewable energy laboratory (NREL) standard laboratory
analytical procedures (http://www.nrel.gov/biomass). The TS was dried to constant weight
(±0.1%) at 105ºC and the ash was determined after the dry oxidation (±0.3 mg) at 550ºC.
Prior to measurement of the total carboxylic acids, the samples from the fermentation solutions
were first centrifuged at 13,000 rpm for 3 min. Subsequently, the supernatant liquids were mixed
with an equal amount of internal standard solution (4-methyl-n-valeric acid, 1.162 g/L), acidified
by formic acid (1% m/v) with the ratio of 1:4 (v/v), and then filtrated through Millipore 13 mm
non-sterile membrane (0.20 µm; Fisher, PA, USA). The concentrations of carboxylic acids were
analyzed using a Shimadzu GC outfitted with an AOC-5000 auto-sampler and FID detector
operated at 300ºC (GC-2014; Sunnyvale, CA, USA) using a HP-INNOWax column of 30 cm
length, 0.25 mm ID and 0.25 μm film. Start temperature was 70ºC, ramped at 15ºC per min to a
hold temperature of 230ºC for three mins. Split/split-less injector temperature was 250ºC at a
split ratio of 40/1 using helium carrier gas. Detector temperature was 300ºC.
To express all carboxylic acids on a common basis, the carboxylic acid concentrations were
converted to acetic acid equivalents (α) (Fu et al. 2010) by the following equations:
α (mol/L) = acetic (mol/L) 8.2.1 + 1.75 × propionic (mol/L) 8.2.2
+ 2.5 × butyric (mol/L) 8.2.3 + 3.25 × valeric (mol/L) 8.2.4 + 4.0 × caproic (mol/L) 8.2.5
+ 4.75 × heptanoic (mol/L) 8.2.6
On mass basis, the acetic acid equivalent can be expressed as:
Ae (g/L) = 60.5 (g/mol) × α (mol/L) 8.2.7
VSLR =VS fed (g)
liquid in reactor (L) time (day)
8.2.8
% Conversion =VS digested (g)
VS Fed (g) 100
8.2.9

June 30, 2013 ANAEROBIC DIGESTION RELATED R&D RESEARCH SUMMARY
FOR WSU ARC/WSDA APPENDIX-A FUNDS
63
% Yield =Total carboxylic acids produced (g)
VS fed (g) 100
1.5.10
% Selectivity =Total carboxylic acids produced (g)
VS digested (g) 100
1.5.11
Total acid productivity =Total carboxylic acids produced (g)
liquid in reactor (L) time (day)
1.5.12
8.2.2.4 Molecular analysis of bacterial communities
Community genomic DNA was extracted from each 2 ml solid-liquid mixture sampled from the
series of tests in the ASBR reactor using the Power Soil DNA Isolation Kit (MoBio Laboratories,
CA). Genomic DNA purity was assessed and quantified by A280/A260 ration (Johnson et al. 1994)
using the NanoDrop Spectrophotometer ND-1000 (NanoDrop Technologies). The genomic DNA
was used for T-RFLP analysis and clone library construction for phylogenetic analysis.
For T-RFLP analysis, bacterial 16S rRNA genes were amplified with a forward primer 8F and a
universal reverse primer 1492r (Zhao et al. 2010). The 5' end of the 8F primer was labeled with
the fluorescent tag 6-FAM (6-carboxyfluorescein). Polymerase chain reaction (PCR) was
performed as follows in a 50μl reaction volume using GoTaq® Green Master Mix (Promega,
USA): initial denaturation step at 95°C for 5 min, followed by 20 cycles of denaturation at 95°C
for 60 sec, annealing at 55°C for 60 sec and primer extension at 72°C for 90 sec, with a final 5
min extension step at 72°C. Three replicate PCRs were run per sample, pooled after
amplification, and purified using the QIAGEN PCR purification kit (Valencia, CA, USA).
Subsequently, the PCR products were individually digested with Hae III (GG′AC, Takara Bio,
USA) and Rsa I (GT′AC, Takara Bio, USA) for 8 h at 37°C in order to detect different types as
much as possible. It was found that Hae III was suitable in this study. Furthermore, separation of
T-RFs was run on an ABI 3730xl DNA sequencer in GeneScan mode (GENEWIZ, Inc. USA)
together with an internal size standard (GeneScan 500 LIZ; Applied Biosystems). T-RFs were
analyzed using GeneMarker V 2.2 (SoftGenetics LLC., USA) including fragments with the
lengths ranging from 50 to 500 bp, an initial peak detection threshold of 50 relative fluorescent
units, and a peak area with both > 500 and its relative abundance > 0.5%. Peaks of < 0.5 bases
apart from each other were merged. The T-RFs profiles were normalized by calculating the
relative abundance (percentage) of each fragment (each T-RF peak area divided by the total peak
area of each sample). The T-RFs peaks were assigned through Phylogenetic Assignment Tool
(PAT, https://secure.limnology.wisc.edu/trflp/) (Kent et al. 2003), using a modified database
from Ribosomal Database Project (Cole et al. 2005) and our database from 16S rRNA gene clone
library (still under construction) was generated by ISPaR tool of MiCA
(http://mica.ibest.uidaho.edu ) (Shyu et al. 2007).
8.2.2.5 Nucleotide sequence accession numbers
Bacterial sequences generated in this study have been deposited in the GenBank database under
accession numbers X to Y. All submissions conform to the “minimum information standards”
recommended by the genomic Standards Consortium
(http://gensc.org/gc_wiki/index.php/Main_Page ) (Yilmaz et al. 2011).

June 30, 2013 ANAEROBIC DIGESTION RELATED R&D RESEARCH SUMMARY
FOR WSU ARC/WSDA APPENDIX-A FUNDS
64
8.2.3 Results and discussion
8.2.3.1 Characteristics of S. dimorphus biomass
The biomass of S. dimorphus was harvested at approximately 0.5 g dry weight/L liquid with
0.791 g VS/g TS and 0.291 g Ash/g TS, implying this strain can offer abundant metal elements
for microbial nutrition during anaerobic processes. The significant organic nutrients were C
(39.62%), H (5.66%), O (28.66%), N (6.65%), and S (1.25%), respectively. The crude protein is
generally regarded to be 6.25 times total N, which indicates that the protein content of S.
dimorphus was approximately 41.6%. This is consistent with the protein range of values (29–
71%) given by Sialve et al. (2009). The total lipids were only 7.22% because it was grown
phototrophically without any nutrient stress to induce lipid accumulation. Three prominent fatty
acids were present including palmitic (C16:0, 13.75 %), linoleic (C18:2n6, 8.60 %), and linolenic
(C18:3n3, 7.63 %), respectively. The total lipid content in S. dimorphus were less than 40%.
Generally, a C/N ratio of 20–30:1 is considered optimal for the production of CH4+, though there
is still some disagreement (Parkin 1986; Yen et al. 2007). The ratio of C/N in S. dimorphus was
too low to generate CH4, (5.96/1, but could be used to generate carboxylates.
8.2.2.2 Carboxylic acids production in anaerobic sequence batch reactor with different
hydraulic retention times
Continuous carboxylic acids production was operated simultaneously in ASBR with 100 ml
working volume at different HRT including 4.2 (A), 8 (B), 12 (C), and 16 (D) days. When HRT
increased, the VSLR decreased to 7.51, 3.96, 2.65, 1.98 g VS fed/L liquid day, respectively. Four
reactors were running for 80 days with S. dimorphus as a feedstock and a steady-state production
of the total carboxylic acids was achieved during the phase of 60–80 days (data not shown).
Table 8.2.1 summarizes the operating parameters and constant experimental results of four HRT
fermentations. Data shows that the production was impacted by HRT, with resulting variation in
the total carboxylic acid concentration, productivity, yield, conversion, selectivity, and even
metabolite patterns. With 4-day and 8-day HRT, low digestibility occurred although the VSLR
was high. The main reason for this is that the algal cell wall is composed of a diverse array of
fibrillar, matrix and crystalline polymers, which are not easily biodegradable by bacteria in a
relatively short operational period. With 12-day and 16-day HRT, the digestibility was
significantly enhanced, indicating that specific microbial consortiums selected under pressure of
HRT have been established for the biodegradation. The maximum total carboxylic acid yield
(0.879 g/L day), selectivity (0.742 g total acids/g VS digested) and conversion (0.598 g VS
digested/g VS fed) occurred at 16-day HRT fermentation (VSLR = 1.98 g VS fed/L liquid day)
with a total carboxylic acids concentration of 14.06±0.59 g/L liquid, while the highest
productivity (1.029 g total acids/L liquid day) resulted from the 12-day HRT fermentation (see
Figure 8.2.3) (VSLR = 2.65 g VS fed/L liquid day) with a concentration of 12.35±0.53 g/L
liquid. Since the productivity of total carboxylic acids is preferred by industry, this suggests that
the optimum HRT was 12 days. The profiles and proportions of individual acid from S.
dimorphus biomass in the effluents were significantly different from those of sugarcane bagasse
and sewage sludge (Fu 2010; Rughoonundun et al. 2010; Fu et al. 2011). As indicated in Table
1.5.1, the patterns and concentrations of carboxylic acids shifted from lower molecular weight
acids (i.e. acetic acid and propionic acid) to higher molecular weight acids (i.e. valeric acid,

June 30, 2013 ANAEROBIC DIGESTION RELATED R&D RESEARCH SUMMARY
FOR WSU ARC/WSDA APPENDIX-A FUNDS
65
caproic acid and heptanoic acid) with an increase in HRT. For instance, the major carboxylic
acids from S. dimorphus consisted of acetic acid (36.28–54.85 wt % of the total carboxylic
acids), propionic acid (12.21–15.48 wt %), butyric acid (19.23–22.04 wt %) and valeric acid
(10.43–17.12 wt %).
In order to effectively test and enhance total carboxylic acid productivity for a modest scale-up at
an HRT of 12 days, a 5 L working volume lab-scale ASBR bioreactor was operated to mimic
common industrial operation conditions. After 32 days’ incubation, the performance metrics
were quite stable and significantly greater at the 5 L working volume than those at the 100 ml
working volume. The maximum total carboxylic acid concentration of 14.68±0.31 g/L liquid was
reached after 20 days (see Figure 1.5.3) and the yield of 0.462 g total acids/g VS fed was
achieved, higher than yields from the previous study. Total carboxylic acid productivity was
1.223 g total acids/L liquid day with a biomass conversion of 63.15% g VS digested/g VS fed
and selectivity of 0.731 g total acids/g VS digested.
0
2
4
6
8
10
12
14
16
0 4 8 12 16 20 24 28 32
To
tal
carb
ox
yli
c a
cid
co
nce
ntr
ati
on
(g
/L)
Time (day)
Figure 8.2.3: The total acid concentration for the lab-scale ASBR bioreactor at a 12-day HRT
During anaerobic fermentation, protein is degraded and the accumulated ammonium (the main
form of N) can be released into liquid phase (Zamalloa et al. 2011). The TAN of liquid effluent
was on the average 1.165 g/L which accounted for approximately 84.4% of the mixed solid and
liquid effluent. This data indicated a lower concentration has been found from the cyanobacteria
Spirulina maxima (up to 7.0 g/L) (Samson et al. 1986) and higher concentration than that from
marine microalgae Phaeodactylum tricornutum (0.546 g/L) (Zamalloa et al. 2011). The strong
concentration of NH3+ from S. dimorphus also suggested the protein rich microalgae are unable
to produce a high volume of biomethane as NH3 has some toxic effects on methanogenesis. As
Table 1.5.1 shows, the NH3+ can be recovered from the digestion effluent using sulfuric acid as
an adsorbent through aeration at elevated temperatures of 50°C (data not shown). The soluble
phosphates (PO4-P) in the effluent from S. dimorphus was on the average of 0.267 g/L whereas

June 30, 2013 ANAEROBIC DIGESTION RELATED R&D RESEARCH SUMMARY
FOR WSU ARC/WSDA APPENDIX-A FUNDS
66
total phosphate was on the average of 1.898 g/L, indicating that there are still almost 86%
phosphates in the solid effluent. These data indicate that recycling N and P from algal waste via
the ‘carboxylate platform’ is a promising way to address the nutrient needs of microalgae
cultivation.
8.2.2.3 Terminal restriction fragment length polymorphism analysis of bacterial community at
different hydraulic retention time
T-RFLP analysis was used to investigate the diversity and relative abundance of bacterial
community at the different HRT. The T-RFLP profiles of bacterial fragments digested with Hae
III shown in Figure 1.5.4 indicated that the percentages of each T-RF varied significantly in the
four reactors, suggesting a dynamic shift had occurred in the bacterial community.
Figure 8.2.4: T-RFLP pattern of PCR-amplified nearly full-length bacterial 16S rRNA genes of
different HRTs digested with the restriction enzyme Hae III
HRT 4
HRT 8
HRT 12
HRT 16
June 30, 2013 ANAEROBIC DIGESTION RELATED R&D RESEARCH SUMMARY
FOR WSU ARC/WSDA APPENDIX-A FUNDS
67
One major T-RF, 274, could be seen at HRT 4 days and disappeared at HRT 8, 12, and 16 days,
which indicated that a bacterial shift had occurred at higher HRT. There were several major T-
RF of 112, 175, 339, and 340 bp when 8, 12, and 16 HRT were utilized, corresponding to the
dominant bacterial (OTU) (Figure 1.5.4). However, these T-RFs were not dominant at the HRT
of 4 days. Results such as this indicate that monitoring the T-RFLP may indicate changes in
bacterial communities when changing different parameters. Improved understanding of these
shifts in response to operational parameters could allow researchers in the future to promote
desired bacterial shifts to generate more biogas or other co-products.
8.2.4 Conclusions
S. dimorphus was investigated in this study for its ability to undergo AD. Due to the fact that the
C/N ratio was so low (5.96/1), it was deemed unsuitable for the production of biomethane.
Therefore, it was used to produce carboxylate salts, which can be further processed downstream
to carboxylic acid and ultimately biofuels (e.g. ethanol, isopropanol, or gasoline). The
experiments conducted in this project showed that the production of carboxylates was impacted
by the HRT, with the highest production occurring at an HRT of 12 days. Thereafter, S.
dimorphus was anaerobically digested in a 5 L working volume ASBR reactor to showcase the
production of carboxylate acids under operational conditions that more closely mimicked those
found in industry. The maximum total carboxylic acid concentration of 14.68±0.31 g/L liquid
was achieved after 20 days and thereafter steady state production was achieved. The pathway to
carboxylate salts provides another option for the AD of algal biomass residue, one that may be
more appropriate than the production of biomethane. Analysis with T-RFLP indicated that the
community shifts over time during the digestion process, and a clone library of the species at the
12 day HRT is currently being constructed to provide more insight into the dominant bacterial
community.

68
8.3 Methane Super-saturation
Quanbao Zhao, Changle Pang and Craig Frear
8.3.1 Introduction
In addition to generating CH4 and CO2 (Massé et al. 2000; Fine et al. 2012), AD discharges a
large volume of liquid effluent which contains dissolved gases, including CH4, CO2, and H2S
(Sharpe et al. 2002; Hudson et al. 2006; Ullman et al. 2007). If the effluent goes untreated, these
dissolved gases will be emitted into air, polluting the environment and contributing to climate
change. In addition, the dissolved methane (D-CH4) that is discharged with effluent represents a
loss of energy that could have been used to generate electricity. Some authors have reported that
D-CH4 in the effluent can range from 36–41% (Souza et al. 2011), to 50% (Agrawal et al. 1997),
to more than 60% (Singh et al. 1998) of the theoretical CH4 potential in the reactors. Souza et al.
(2011) and Hartley and Lant (2006) indicated that D-CH4 was super-saturated in the effluent of
many anaerobic treatment systems. D-CH4 occurs under conditions of low temperature and low
strength, as the solubility of CH4 in the liquid phase increases with decreasing temperature. Since
most digesters operate at mesophilic temperature (35°C), a portion of the CH4 generated by
methanogenic microorganisms remains within the effluent.
In the past, the D-CH4 in effluent has gone unrecovered (Hatamoto et al. 2010; Hatamoto et al.
2011) and likely escapes during lagoon storage and/or field application. This creates a negative
economic impact. It also lessens the GHG mitigation capacity of AD, as CH4 is a powerful GHG
(VanderZaag et al. 2011; Abbasi et al. 2012). Due to the economic and environmental
implications of D-CH4, researchers at WSU developed a technique to extract the D-CH4 within
dairy effluent.
8.3.2 Materials and methods
A continuous stirred-tank reactor (CSTR) reactor with a working volume of 1 L was used to
perform the experiments. Attached to the CSTR were a temperature detector, heater and agitator.
A vacuum pump (N816.3KT.45P, KNF, USA) and gas collector was connected the reactor and
used to determine the concentration of CH4, CO2, and H2S. A schematic of the system is shown
in Figure 8.3.1.

June 30, 2013 ANAEROBIC DIGESTION RELATED R&D RESEARCH SUMMARY
FOR WSU ARC/WSDA APPENDIX-A FUNDS
69
Figure 8.3.1: CSTR reactor with attached vacuum pump and gas collection system
The reactor was fed with 1 L volume diary AD effluent from a dairy farm in WA. The initial pH
of the effluent was 7.9±0.08. About 1 ml defoaming solution was added into the effluent to
control foam production during the experiment. The CSTR reactor was operated at different
temperatures and mixing speeds to investigate the effects these two parameters had on removing
D-CH4, dissolved CO2 (D-CO2), and dissolved H2S (D-H2S). The operational conditions are
summarized in Table 8.3.1.
Table 8.3.1: Operational conditions of the experiments
Parameter Unit Values
Temperature °C 25, 35, 55
Mixing speed rpm 0, 300
Three known working volume (250 ml) sealed vials were used to sample 200 ml effluent with
110 ml volume headspace and thereafter 1 ml of 20 mM mercury (II) chloride was added to each
vial to inhibit biological reactions. The vials were shaken vigorously on a shaker at ambient
temperature for 1 h to allow the dissolved gas in the effluent to diffuse into the headspace. After
equilibration of the gas and liquid phases, the compositions of the headspace gas were
determined by a GC (Varian CP-3800, Agilent, USA). The concentrations of the dissolved gases
in the sample effluent were calculated by the following equation (Alberto et al. 2000; Hartley et
al. 2006):
8.3.1
where CL is the concentration of dissolved gas in solution (μg ml-1
), CG1 is the concentration of
gas in headspace before shaking (μg ml-1
), CG2 is the concentration of gas in headspace after
shaking (μg ml-1
), VG is the volume of headspace (ml), VL is the volume of liquid in the vial
(ml), and α is Bunsen solubility coefficient for each specific gas depending on temperature. The

June 30, 2013 ANAEROBIC DIGESTION RELATED R&D RESEARCH SUMMARY
FOR WSU ARC/WSDA APPENDIX-A FUNDS
70
α of water has the following parameters: air partition coefficient at 25°C = 0.030, Bunsen’s
constant = 0.0301, at 1 atm, 25°C.
8.3.3 Results and discussion
The D-CH4 recovery performance was highly dependent on the temperature and mixing speed.
Figure 8.3.2 depicts the cumulative recovery results of the D-CH4 in the effluent at different
temperatures and mixing speeds. From the results of the vacuum recovery, it is clear that for 1 L
of effluent, the cumulative D-CH4 recovery sharply increased in the first 5 min and continued
increasing, though recovery rate gradually slowed after about 15 mins under most conditions.
This can be attributed to the fact that the initial concentration of the D-CH4 was relatively high in
the effluent and low in the headspace of the reactor; thus, the gas-liquid equilibrium was
relatively easy to overcome under vacuum conditions. As D-CH4 was removed over time it
became more difficult for the vacuum to remove higher concentrations of D-CH4. In other
experiments equilibrium took longer to achieve. For example, at 25°C and 0 rpm the equilibrium
wasn’t achieved until around 60 mins. In addition, the total recovery was much lower. Clearly,
the combination of low temperature and low rpm results in a much lower release of dissolved
gases.
Recovered CH4
Time (min)
0 1 5 10 15 20 30 45 60 75 90 105 120
CH
4 r
eco
vere
d (
mL
/L m
anure
)
0
2
4
6
8
10
12
14
at 55C & 0 rpm
at 55C & 300 rpm
at 35C & 0 rpm
at 35C & 300 rpm
at 25C & 0 rpm
at 23C & 300 rpm
Figure 8.3.2: D-CH4 recovery at various temperatures and mixing speeds
The results in Figure 8.3.2 indicated that higher temperatures significantly improved D-CH4
recovery due to a lower solubility of gases. However, one must note that high temperatures will
lead to higher costs for engineering applications. Mixing of the CSTR also had a positive effect
on the removal of D-CH4. The combination of high temperature (55°C) and high mixing speed
(300 rpm) allowed for the greatest overall removal of D-CH4, but it is worth mentioning that a

June 30, 2013 ANAEROBIC DIGESTION RELATED R&D RESEARCH SUMMARY
FOR WSU ARC/WSDA APPENDIX-A FUNDS
71
significant amount of D-CH4 was also removed at the lower temperature (23°C) and a high
mixing speed (300 rpm), which could help with the economics of this recovery process.
Figure 8.3.3 illustrates the concentrations of D-CO2 and D-H2S during the same experiments.
Although the solubilities of the two gases may be different, the removal of both these acidic
gases should occur once the temperature is increased in the effluent. In addition, agitating the
effluent should also increase the release of these dissolved gases. As can be seen in the graph on
the left, the recovery of D-CO2 was mainly a function of temperature, with the highest removals
occurring at a temperature of 55°C. Interestingly, mixing did little to effect the removal of D-
CO2 since at both a low mixing speed (0 rpm) and high mixing speed (300 rpm) the removals
were similar (at a temperature of 55°C). When considering the removal of D-H2S, the recovery
system had little to no effect. There was higher removal at a temperature of 35°C with no
mixing but this concentration is still extremely low when compared with the removal of D-CH4
and D-CO2. This could be due to the fact that the production of H2S during the anaerobic process
is much lower than CH4 and CO2, resulting in a lower D-H2S. It could also be a reflection of the
fact that H2S has a higher solubility than CO2 and is less likely to be released from the liquid
phase.
CO2 recovered
Time (min)
0 1 5 10 15 20 30 45 60 75 90 105 120
CO
2 r
eco
ve
red
(m
L/L
manure
)
0
100
200
300
400
500
600
700
at 55C & 0 rpm
at 55C & 300 rpm
at 35C & 0 rpm
at 35C & 300 rpm
at 25C & 0 rpm
at 23C & 300 rpm
Recovered H2S
Time (min)
0 1 5 10 15 20 30 45 60 75 90 105 120
H2S
re
co
ve
red
(m
L/L
ma
nure
)
0.0
0.1
0.2
0.3
0.4
at 55C & 0rpm
at 55C & 300rpm
at 35C & 0rpm
at 35C & 300rpm
at 25C & 0rpm
at 23C & 300rpm
Figure 8.3.3: Recovery of D-CO2 (left) and D-H2S (right) at various temperatures and mixing
speeds
The pH was monitored throughout the experiment to determine how the pH of the effluent was
affected by the release of the dissolved gases. As the amount of D-CO2 in the effluent decreased,
the pH of the effluent increased because CO2 is slightly acidic (Figure 8.3.4).

June 30, 2013 ANAEROBIC DIGESTION RELATED R&D RESEARCH SUMMARY
FOR WSU ARC/WSDA APPENDIX-A FUNDS
72
pH
Time (min)
0 1 5 10 15 20 30 45 60 75 90 105 120
pH
7.0
7.5
8.0
8.5
9.0
9.5
at 55C & 0 rpm
at 55C & 300 rpm
at 35C & 0 rpm
at 35C & 300 rpm
at 25C & 0 rpm
at 23C & 300 rpm
Figure 8.3.4: pH of the effluent at various temperatures and mixing speeds
As can be seen in the figure, the pH of a 1 L of AD effluent solution can be increased from 7.8 to
around 9.2 after 2 hrs of degassing via a vacuum pump. This can be helpful for downstream
processing such as ammonia stripping (Zhao et al. 2012). In traditional ammonia stripping of
digested effluent, increasing pH of the effluent is achieved by adding alkali (Lei et al. 2007),
which often hurts the economics of the process. This process could raise the pH to the
appropriate levels for downstream ammonia stripping with a lower cost.
8.3.4 Conclusions
The results of this experiment indicated a strong relationship between temperature and the
recovery of dissolved gases (primarily CH4 and CO2, but also to a lesser extent H2S), that can be
attributed to the solubility of the gases. As the temperature increased, the concentrations of
recoverable D-CH4 and D-CO2 increased significantly. Figure 8.3.2 indicates clearly that the
effects of temperature dominate those from mixing, though a future statistical analysis should be
performed to gain a better understanding of the effects of these two operational parameters. Our
results also showed that removing D-CO2 and D-H2S from the effluent raised the pH, which is
necessary for subsequent ammonia stripping if nutrient recovery is incorporated. In the case of
combined AD-NR, degassing the effluent via a vacuum could provide another way to increase
the pH of the effluent, lessening the requirements for alkali inputs to remove ammonia from the
effluent. An economic analysis would be beneficial to compare the energy costs required to run
this degassing system with the cost of alkali input for traditional ammonia stripping techniques.
Such analysis should also seek to determine whether the quantity of CH4 that was recovered

June 30, 2013 ANAEROBIC DIGESTION RELATED R&D RESEARCH SUMMARY
FOR WSU ARC/WSDA APPENDIX-A FUNDS
73
offsets the additional costs for the energy consumption and heat required for the system to work
optimally.

74
References Abatzoglou, N. and S. Boivin (2009). "A review of biogas purification processes." Biofuels, Bioproducts
and Biorefining 3(1): 42-71. Abbasi, T., S. M. Tauseef, et al. (2012). "Anaerobic digestion for global warming control and energy
generation—An overview." Renewable and Sustainable Energy Reviews 16(5): 3228-3242. Agler, M. T., B. A. Wrenn, et al. (2011). "Waste to bioproduct conversion with undefined mixed cultures:
the carboxylate platform." Trends in Biotechnology 29(2): 70-78. Agrawal, L. K., H. Harada, et al. (1997). "Treatment of dilute wastewater in a UASB reactor at a moderate
temperature: Performance aspects." Journal of Fermentation and Bioengineering 83(2): 179-184.
AgSTAR (2010). Anaerobic Digestion Capital Costs for Dairy Farms. Mankato, EPA. Agyei, N., C. Strydom, et al. (2000). "An investigation of phosphate ion adsorption from aqueous solution
by fly ash and slag." Cement and concrete research 30(5): 823-826. Agyei, N. M., C. Strydom, et al. (2002). "The removal of phosphate ions from aqueous solution by fly ash,
slag, ordinary Portland cement and related blends." Cement and concrete research 32(12): 1889-1897.
Alberto, M. C. R., J. R. M. Arah, et al. (2000). "A sampling technique for the determination of dissolved methane in soil solution." Chemosphere - Global Change Science 2(1): 57-63.
Alva, A., S. Paramasivam, et al. (2006). "Nitrogen and irrigation management practices to improve nitrogen uptake efficiency and minimize leaching losses." Journal of Crop Improvement 15(2): 369-420.
Amani, T., M. Nosrati, et al. (2010). "Anaerobic digestion from the viewpoint of microbiological, chemical, and operational aspects - a review." Environmental Reviews 18: 255-278.
Archibeque, S. L., D. N. Miller, et al. (2007). "The influence of oscillating dietary protein concentrations on finishing cattle. I. Feedlot performance and odorous compound production." Journal of animal science 85(6): 1487-1495.
ASAE (2005). Manure Production and Characteristics. Michigan, USA, American Society of Agricultural Engineers. ASAE Standard, D384.2.
Bayer, E. A., R. Lamed, et al. (2007). "The potential of cellulases and cellulosomes for cellulosic waste management." Current opinion in biotechnology 18(3): 237-245.
Bektas, N., H. Akbulut, et al. (2004). "Removal of phosphate from aqueous solutions by electro-coagulation." Journal of Hazardous Materials 106(2-3): 101-105.
Bendall, E., R. C. Aiken, et al. (1983). "Selective absorption of H2S from larger quantities of CO2 by absorption and reaction in fine sprays." AIChE Journal 29(1): 66-72.
Beszedes, S., S. Kertesz, et al. (2009). "Biogas Production of Ozone and/or Microwave-Pretreated Canned Maize Production Sludge." OZONE SCIENCE AND ENGINEERING 31(3): 257-261.
Bishop, C. P. and C. R. Shumway (2009). "The Economics of Dairy Anaerobic Digestion with Coproduct Marketing." Applied Economic Perspectives and Policy 31(3): 394-410.
Biswas, R., B. K. Ahring, et al. (2012). "Improving biogas yields using an innovative concept for conversion of the fiber fraction of manure." Water Science & Technology.
Braun, R., P. Weilnad, et al. (2010). Biogas from Energy Crop Digestion. I. Bioenergy. Bush, R. A. and K. M. Hall (2006). Process for the production of ethanol from algae. Google patents. Carpenter, S. R., N. F. Caraco, et al. (1998). "Nonpoint pollution of surface waters with phosphorus and
nitrogen." Ecological applications 8(3): 559-568. CAST (2002). "Animal Diet Modification to Decrease the Potential for Nitrogen and Phosphorus
Pollution." Council for Agricultural Science and Technology(21).

June 30, 2013 ANAEROBIC DIGESTION RELATED R&D RESEARCH SUMMARY
FOR WSU ARC/WSDA APPENDIX-A FUNDS
75
Chandra, R., H. Takeuchi, et al. (2012). "Hydrothermal pretreatment of rice straw biomass: A potential and promising method for enhanced methane production." APEN Applied Energy 94: 129-140.
Chisti, Y. (2007). "Biodiesel from microalgae." Biotechnology Advances 25(3): 294-306. Chynoweth, D. P., C. E. Turick, et al. (1993). "Biochemical methane potential of biomass and waste
feedstocks." Biomass and Bioenergy 5(1): 95-111. Cole, J., B. Chai, et al. (2005). "The Ribosomal Database Project (RDP-II): sequences and tools for high-
throughput rRNA analysis." Nucleic acids research 33(suppl 1): D294-D296. Coppedge, B., G. Coppedge, et al. (2012). Renewable Natural Gas and Nutrient Recovery Feasibility For
Deruyter: An Anaerobic Digester Case Study For Alternative Offtake Markters and Remediation of Nutrient Loading Concerns Within The Region.
Davis, J. G. and P. H. Dernoeden (2002). "Dollar spot severity, tissue nitrogen, and soil microbial activity in bentgrass as influenced by nitrogen source." Crop science 42(2): 480-488.
Davis, R., A. Aden, et al. (2011). "Techno-economic analysis of autotrophic microalgae for fuel production." Applied Energy 88(10): 3524-3531.
de Hullu, J., J. I. W. Massen, et al. (2008). Comparing different biogas upgrading techniques, Eindhoven University of Technology.
DeBruyn, J., H. House, et al. (2006). Ontario Large Herd Operators European Anaerobic Digestion Tour Report. Ontario, LHO.
Deckwer, W.-D. and R. W. Field (1992). Bubble column reactors. Chichester; New York, Wiley. Delrue, F., P. A. Setier, et al. (2012). "An economic, sustainability, and energetic model of biodiesel
production from microalgae." Bioresource Technology 111: 191-200. Dobermann, A. (2007). "Nutrient use efficiency–measurement and management." Fertilizer Best
Management Practices: 1. Eghball, B., B. J. Wienhold, et al. (2002). "Mineralization of manure nutrients." Journal of Soil and Water
Conservation 57(6): 470-473. EPA (2010). Market Opportunities for Biogas Recovery Systems- A Guide to Identifying Candidates for
On-Farm and Centralized Systems. Washington DC. EPA (2013). Relation Between Nitrate in Water Wells and Potential Sources in the Lower Yakima Valley,
Washington. Yakima, WA, EPA. Erisman, J. and M. Schaap (2004). "The need for ammonia abatement with respect to secondary PM
reductions in Europe." Environmental Pollution 129(1): 159-163. Ferguson, R. B., J. S. Schepers, et al. (1991). "Corn Uptake and Soil Accumulation of Nitrogen:
Management and Hybrid Effects." Soil Sci. Soc. Am. J. 55(3): 875-880. Fey, A. and R. Conrad (2000). "Effect of temperature on carbon and electron flow and on the archaeal
community in methanogenic rice field soil." Applied and environmental microbiology 66(11): 4790-4797.
Fine, P. and E. Hadas (2012). "Options to reduce greenhouse gas emissions during wastewater treatment for agricultural use." Science of The Total Environment 416(0): 289-299.
Frear, C. (2009). Anaerobic Digestion Strategies for Dairy Manures. Biological Systems Engineering. Pullman, Washington State University. Doctor of Philosophy 143.
Frear, C., S. Chen, et al. (2011). "Biogas potential and microbial population distributions in flushed dairy manure and implications on anaerobic digestion technology." J. Chem. Technol. Biotechnol. Journal of Chemical Technology and Biotechnology 86(1): 145-152.
Frear, C., T. Ewing, et al. (2011). "Evaluation of Co-Digestion at a Commercial Dairy Anaerobic Digester." Clean Soil Air Water Clean - Soil, Air, Water 39(7): 697-704.
Frear, C., B. Zhao, et al. (2005). Biomass Inventory and Bioenegy Assesment Olympia, Washington State University.

June 30, 2013 ANAEROBIC DIGESTION RELATED R&D RESEARCH SUMMARY
FOR WSU ARC/WSDA APPENDIX-A FUNDS
76
Fu, Z. and M. T. Holtzapple (2010). "Consolidated bioprocessing of sugarcane bagasse and chicken manure to ammonium carboxylates by a mixed culture of marine microorganisms." Bioresource Technology 101(8): 2825-2836.
Fu, Z. and M. T. Holtzapple (2011). "Anaerobic thermophilic fermentation for carboxylic acid production from in-storage air-lime-treated sugarcane bagasse." Applied Microbiology and Biotechnology: 1669-1679.
Fu, Z. H., Mark T. (2010). "Anaerobic mixed-culture fermentation of aqueous ammonia-treated sugarcane bagasse in consolidated bioprocessing." Biotechnol Bioeng: 216-227.
Fu, Z. H., Mark T. (2010). "Consolidated bioprocessing of sugarcane bagasse and chicken manure to ammonium carboxylates by a mixed culture of marine microorganisms." Bioresource Technology 101(8): 2825-2836.
Galinato, S. P., C.E. Kruger, et al. (2013). Economic feasibility of post-digester nutrient recovery using struvite crystallization and WSU AIRTRAP approach.
Gao, A. H. (2012). Pretreatment of wheat straw with ozone and soaking aqueous ammonia. Biological Systems Engineering. Pullman, Washington State University. M.S. .
Gao, A. H., M. V. Bule, et al. (2012). "Structural and Thermal Characterization of Wheat Straw Pretreated with Aqueous Ammonia Soaking." Journal of Agricultural and Food Chemistry 60(35): 8632-8639.
García-Cubero, M. A., G. González-Benito, et al. (2009). "Effect of ozonolysis pretreatment on enzymatic digestibility of wheat and rye straw." Bioresource Technology 100(4): 1608-1613.
Garner, F. H., R. Long, et al. (1958). "The selective absorption of hydrogen sulphide in carbonate solutions." Journal of Applied Chemistry 8(5): 325-336.
Ghirardi, M. (2000). "Microalgae: a green source of renewable H2." Trends in Biotechnology 18(12): 506-511.
Guan, T. Y. and R. A. Holley (2003). "Pathogen survival in swine manure environments and transmission of human enteric illness—a review." Journal of Environmental Quality 32(2): 383-392.
Hartley, K. and P. Lant (2006). "Eliminating non-renewable CO2 emissions from sewage treatment: An anaerobic migrating bed reactor pilot plant study." Biotechnology and Bioengineering 95(3): 384-398.
Hashimoto, A. G. (1989). "Effect of inoculum/substrate ratio on methane yield and production rate from straw." Biological Wastes 28(4): 247-255.
Hatamoto, M., T. Miyauchi, et al. (2011). "Dissolved methane oxidation and competition for oxygen in down-flow hanging sponge reactor for post-treatment of anaerobic wastewater treatment." Bioresource Technology 102(22): 10299-10304.
Hatamoto, M., H. Yamamoto, et al. (2010). "Biological oxidation of dissolved methane in effluents from anaerobic reactors using a down-flow hanging sponge reactor." Water Research 44(5): 1409-1418.
He, Y., Y. Pang, et al. (2009). "Investigation on the Changes of Main Compositions and Extractives of Rice Straw Pretreated with Sodium Hydroxide for Biogas Production." Energy & Fuels 23(4): 2220-2224.
Heathwaite, L., A. Sharpley, et al. (2000). "A Conceptual Approach for Integrating Phosphorus and Nitrogen Management at Watershed Scales." J. Environ. Qual. 29(1): 158-166.
Heathwaite, L., A. Sharpley, et al. (2000). "A conceptual approach for integrating phosphorus and nitrogen management at watershed scales." Journal of Environmental Quality 29(1): 158-166.
Henry, W. R. and J. A. Seagraves (1960). "Economic aspects of broiler production density." Journal of Farm Economics 42(1): 1-17.

June 30, 2013 ANAEROBIC DIGESTION RELATED R&D RESEARCH SUMMARY
FOR WSU ARC/WSDA APPENDIX-A FUNDS
77
Hess, M., A. Sczyrba, et al. (2011). "Metagenomic Discovery of Biomass-Degrading Genes and Genomes from Cow Rumen." Science 331(6016): 463.
Hill, J., E. Nelson, et al. (2006). "Environmental, economic, and energetic costs and benefits of biodiesel and ethanol biofuels." Proceedings of the National Academy of Sciences of the United States of America 103(30): 11206-11210.
Himmel, M. E., S. Y. Ding, et al. (2007). "Biomass Recalcitrance: Engineering Plants and Enzymes for Biofuels Production." Science 315(9 February 2007): 804-807.
Holtzapple, M. T., R. R. Davison, et al. (1999). "Biomass conversion to mixed alcohol fuels using the MixAlco process." Applied Biochemistry and Biotechnology 79(1): 609-631.
Holtzapple, M. T. and C. B. Granda (2009). "Carboxylate platform: the MixAlco process part 1: comparison of three biomass conversion platforms." Appl Biochem Biotechnol 156(1-3): 95-106.
Hudson, N., D. Duperouzel, et al. (2006). "Assessment of permeable covers for odour reduction in piggery effluent ponds. 1. Laboratory-scale trials." Bioresource Technology 97(16): 2002-2014.
Jeppesen, E., M. Søndergaard, et al. (1998). The structuring role of submerged macrophytes in lakes, Springer.
Johnson, L. A. and D. E. Soltis (1994). "matK DNA sequences and phylogenetic reconstruction in Saxifragaceae s. str." Systematic Botany: 143-156.
Jones, C. S. and S. P. Mayfield (2012). "Algae biofuels: versatility for the future of bioenergy." Current opinion in biotechnology 23(3): 346-351.
Joshua H. Viers, Daniel Liptzin, et al. (2012). Technical Report 2: Nitrogen Sources and Loading to Groundwater Davis, UC Davis.
Jungersen, G. and B. K. Ahring (1994). "Anaerobic Digestion of Liquified Cow Manure Pretreated by Catalytic Liquefaction." Water Science & Technology 30(12).
Kantarci, N., F. Borak, et al. (2005). "Bubble column reactors." Process Biochemistry 40(7): 2263-2283. Kanwar, S. and R. Guleri (1994). "Performance evaluation of a family-size, rubber-balloon biogas plant
under hilly conditions." Bioresource Technology Bioresource Technology 50(2): 119-121. Kapdi, S. S., V. K. Vijay, et al. (2005). "Biogas scrubbing, compression and storage: perspective and
prospectus in Indian context." Renewable Energy 30(8): 1195-1202. Kashyap, D. R., K. S. Dadhich, et al. (2003). "Biomethanation under psychrophilic conditions: a review."
Bioresource Technology 87(2): 147-153. Keating, C., D. Cysneiros, et al. (2013). "The hydrolysis and biogas production of complex cellulosic
substrates using three anaerobic biomass sources." Water science and technology : a journal of the International Association on Water Pollution Research 67(2): 293-298.
Kennedy, N. (2012). Biogas Purification: A Novel Technique Using Pretreated Digester Effluent. Biological Systems Engineering. Pullman, Washington State University. Master of Science.
Kent, A. D., D. J. Smith, et al. (2003). "Web-Based Phylogenetic Assignment Tool for Analysis of Terminal Restriction Fragment Length Polymorphism Profiles of Microbial Communities." Applied and Environmental Microbiology 69(11): 6768-6776.
Kiely, G. (1997). Environmental Engineering. London, McGrawHill. Kim, T. H., R. Gupta, et al. (2009). Pretreatment of Biomass by Aqueous Ammonia for Bioethanol
Production #. T Biofuels. 581: 79-91. Kim, T. H. and Y. Y. Lee (2006). "Fractionation of corn stover by hot-water and aqueous ammonia
treatment." Bioresource Technology 97(2): 224-232. Kruger, C., G. Yorgey, et al. (2010). Climate Friendly Farming: Improving the Carbon Footprint of
Agriculture in the Pacific Northwest., Washington State University.

June 30, 2013 ANAEROBIC DIGESTION RELATED R&D RESEARCH SUMMARY
FOR WSU ARC/WSDA APPENDIX-A FUNDS
78
Kumar, P., D. M. Barrett, et al. (2009). "Methods for Pretreatment of Lignocellulosic Biomass for Efficient Hydrolysis and Biofuel Production." Industrial & Engineering Chemistry Research 48(8): 3713-3729.
Lehmann, J. (2007). "Bio-energy in the black." Frontiers in Ecology and the Environment 5(7): 381-387. Lehmann, J., J. Gaunt, et al. (2006). "Bio-char sequestration in terrestrial ecosystems–a review."
Mitigation and adaptation strategies for global change 11(2): 395-419. Lehmann, J., M. C. Rillig, et al. (2011). "Biochar effects on soil biota–a review." Soil Biology and
Biochemistry 43(9): 1812-1836. Lei, X., N. Sugiura, et al. (2007). "Pretreatment of anaerobic digestion effluent with ammonia stripping
and biogas purification." Journal of Hazardous Materials 145(3): 391-397. Leschine, S. B. (1995). "Cellulose degradation in anaerobic environments." Annual review of
microbiology 49: 399-426. Lettinga, G., A. F. M. van Velsen, et al. (1980). "Use of the upflow sludge blanket (USB) reactor concept
for biological wastewater treatment, especially for anaerobic treatment." Biotechnology and Bioengineering 22(4): 699-734.
Liao, W., Y. Liu, et al. (2006). "Acid hydrolysis of fibers from dairy manure." BITE Bioresource Technology 97(14): 1687-1695.
Liao, W., Y. Liu, et al. (2008). "Kinetic modeling of enzymatic hydrolysis of cellulose in differently pretreated fibers from dairy manure." Biotechnology and Bioengineering 101(3): 441-451.
Liebrand, C., K. C. Ling, et al. (2009). "Cooperative approaches for implementation of dairy manure digesters." from http://hdl.handle.net/10113/35107.
Liew, L. N. (2011). Solid- State Anaerobic Digestion of Lignocellulosic Biomass for Biogas Production, Ohio State University. Master of Science
Lu, S., S. Bai, et al. (2009). "Removal mechanism of phosphate from aqueous solution by fly ash." Journal of hazardous materials 161(1): 95-101.
Ma, J., L. Yu, et al. (2013). "Kinetics of psychrophilic anaerobic sequencing batch reactor treating flushed dairy manure." Bioresource Technology 131(0): 6-12.
Mary H. Ward, Theo M. deKok, et al. (2005). "Workgroup Report: Drinking-Water Nitrate and Health—Recent Findings and Research Needs." Environ Health Perspect. 11(113).
Massé, D. I. and R. L. Droste (2000). "Comprehensive model of anaerobic digestion of swine manure slurry in a sequencing batch reactor." Water Research 34(12): 3087-3106.
Mata, T. M., A. A. Martins, et al. (2010). "Microalgae for biodiesel production and other applications: A review." Renewable and Sustainable Energy Reviews 14(1): 217-232.
McCubbin, D. R., B. J. Apelberg, et al. (2002). "Livestock ammonia management and particulate-related health benefits." Environ Sci Technol 36(6): 1141-1146.
Mehta, A. (2002). The Economics and Feasibility of Electricity Generation using Manure Digesters on Small and Mid-size Dairy Farms, University of Wisconsin
Metje, M. and P. Frenzel (2007). "Methanogenesis and methanogenic pathways in a peat from subarctic permafrost." Environmental microbiology 9(4): 954-964.
Murphy, J. D., E. McKeogh, et al. (2004). "Technical/economic/environmental analysis of biogas utilisation." Applied Energy 77(4): 407-427.
Nallathambi Gunaseelan, V. (1997). "Anaerobic digestion of biomass for methane production: A review." Biomass and Bioenergy 13(1–2): 83-114.
Namasivayam, C. and D. Sangeetha (2004). "Equilibrium and kinetic studies of adsorption of phosphate onto ZnCl< sub> 2</sub> activated coir pith carbon." Journal of Colloid and Interface Science 280(2): 359-365.

June 30, 2013 ANAEROBIC DIGESTION RELATED R&D RESEARCH SUMMARY
FOR WSU ARC/WSDA APPENDIX-A FUNDS
79
Nedwell, D. (1999). "Effect of low temperature on microbial growth: lowered affinity for substrates limits growth at low temperature." FEMS Microbiology Ecology 30(2): 101-111.
Nozhevnikova, A. N., M. V. Simankova, et al. (2001). "Temperature characteristics of methanogenic archaea and acetogenic bacteria isolated from cold environments." Water science and technology : a journal of the International Association on Water Pollution Research 44(8): 41-48.
NRC (1993). Managing Wastewater in Coastal Urban Areas, The National Academies Press. O'Fallon, J., J. Busboom, et al. (2007). "A direct method for fatty acid methyl ester (FAME) synthesis:
Application to wet meat tissues, oils and feedstuffs." Journal of animal science: jas. 2006-2491v2001.
Oguz, E. (2005). "Sorption of phosphate from solid/liquid interface by fly ash." Colloids and Surfaces A: Physicochemical and Engineering Aspects 262(1): 113-117.
Owen, W. F., D. C. Stuckey, et al. (1979). "Bioassay for monitoring biochemical methane potential and anaerobic toxicity." Water Research 13(6): 485-492.
Park, S. and Y. Li (2012). "Evaluation of methane production and macronutrient degradation in the anaerobic co-digestion of algae biomass residue and lipid waste." BITE Bioresource Technology 111: 42-48.
Parkin, g. f., owen, w.f. (1986). "Fundamentals of anaerobic digestion of wastewater sludge." Journal of Environmental Engineering 112: 867-920.
Patel, V., M. Desai, et al. (1993). "Thermochemical pretreatment of water hyacinth for improved biomethanation." Applied Biochemistry and Biotechnology 42(1): 67-74.
Pella, E. (1990). "Elemental organic analysis. Part 2. State of the art." Am. Lab 22(12): 28-32. Power, S., C. Barker, et al. (2001). "Habitat management: a tool to modify ecosystem impacts of nitrogen
deposition?" The Scientific World Journal 1: 714-721. R. Mitchell, R. Babcock, et al. (2005). Water Quality: Abbotsford-Sumas Final Report, Western
Washington University. Rajeshwari, K. V., M. Balakrishnan, et al. (2000). "State-of-the-art of anaerobic digestion technology for
industrial wastewater treatment." Renewable and Sustainable Energy Reviews 4(2): 135-156. Ribaudo, M., J. Kaplan, et al. (2003). "Manure management for water quality costs to animal feeding
operations of applying manure nutrients to land." USDA-ERS Agricultural Economic Report(824). Rughoonundun, H., C. Granda, et al. (2010). "Effect of thermochemical pretreatment on sewage sludge
and its impact on carboxylic acids production." Waste Management 30(8-9): 1614-1621. Safley, L. M. and P. W. Westerman (1990). "Psychrophilic anaerobic digestion of animal manure:
Proposed design methodology." Biological Wastes 34(2): 133-148. Samson, R. and A. Leduy (1982). "Biogas production from anaerobic digestion of Spirulina maxima algal
biomass." Biotechnology Bioengineering 24(8): 1919-1924. Samson, R. and A. LeDuyt (1986). "Detailed study of anaerobic digestion of Spirulina maxima algal
biomass." Biotechnol Bioeng 28(7): 1014-1023. Schlegel, A., K. Dhuyvetter, et al. (1996). "Economic and environmental impacts of long-term nitrogen
and phosphorus fertilization." Journal of production agriculture 9(1): 114-118. Schütz, H., W. Seiler, et al. (1990). "Influence of Soil Temperature on Methane Emission from Rice Paddy
Fields." Biogeochemistry 11(2): 77-95. Schwarz, W. H. (2001). "The cellulosome and cellulose degradation by anaerobic bacteria." APPLIED
MICROBIOLOGY AND BIOTECHNOLOGY 56(5-6): 5-6. Scott, S. A., M. P. Davey, et al. (2010). "Biodiesel from algae: challenges and prospects." Current opinion
in biotechnology 21(3): 277-286. Sharpe, R. R., L. A. Harper, et al. (2002). "Methane emissions from swine lagoons in Southeastern US."
Agriculture, Ecosystems & Environment 90(1): 17-24.

June 30, 2013 ANAEROBIC DIGESTION RELATED R&D RESEARCH SUMMARY
FOR WSU ARC/WSDA APPENDIX-A FUNDS
80
Shyu, C., T. Soule, et al. (2007). "MiCA: a web-based tool for the analysis of microbial communities based on terminal-restriction fragment length polymorphisms of 16S and 18S rRNA genes." Microbial Ecology 53(4): 562-570.
Sialve, B., N. Bernet, et al. (2009). "Anaerobic digestion of microalgae as a necessary step to make microalgal biodiesel sustainable." Biotechnology Advances 27(4).
Sialve, B., N. Bernet, et al. (2009). "Anaerobic digestion of microalgae as a necessary step to make microalgal biodiesel sustainable." Biotechnology Advances 27(4): 409-416.
Singh, K. S. and T. Viraraghavan (1998). "Start-up and operation of UASB reactors at 20°C for municipal wastewater treatment." Journal of Fermentation and Bioengineering 85(6): 609-614.
Souza, C. L., C. A. Chernicharo, et al. (2011). "Quantification of dissolved methane in UASB reactors treating domestic wastewater under different operating conditions." Water science and technology : a journal of the International Association on Water Pollution Research 64(11): 2259-2264.
Speece, R. E. (1996). Anaerobic biotechnology for industrial wastewaters. Nashville, Tenn., Archae Press. Srinivasan, V. and R. C. Aiken (1988). "Selective absorption of H2S from CO2 -- factors controlling
selectivity toward H2S." Fuel Processing Technology 19(2): 141-152. Sutton, M., D. Flower, et al. (1993). "The exchange of atmospheric ammonia with vegetated surfaces. I:
Unfertilized vegetation." Quarterly Journal of the Royal Meteorological Society 119(513): 1023-1045.
Uellendahl, H. and B. K. Ahring (2010). "Anaerobic digestion as final step of a cellulosic ethanol biorefinery: Biogas production from fermentation effluent in a UASB reactor-pilot-scale results." Biotechnology and Bioengineering 107(1): 59-64.
Ullman, J. L. and S. Mukhtar (2007). "Impact of dairy housing practices on lagoon effluent characteristics: Implications for nitrogen dynamics and salt accumulation." Bioresource Technology 98(4): 745-752.
US-EPA (2004). National emission inventory - ammonia emissions from animal husbandry. U.S. Environmental Protection Agency, Washington, DC.
US-EPA (2006). Market Opportunities for Biogas Recovery Systems—A Guide to Identifying Candidates for On-Farm and Centralized Systems. Washington DC, United States Environmental Protection Agency.
US-EPA (2012). Relation Between Nitrate in Water Wells and Potential Sources in the Lower Yakima Valley, Washington, U.S. EPA Region 10.
USDA-ERS (2009). Manure Use for Fertilizer and for Energy. USDA-ERS (2011). Nitrogen in Agricultural Systems: Implications for Conservation Policy. USDA (2011). An In-depth Studyof Small-scale U.S.Livestock Operations. Fort Collins, USDA–APHIS–VS–
CEAH–NAHMS. VanderZaag, A. C., C. Wagner-Riddle, et al. (2011). "Methane emissions from stored liquid dairy manure
in a cold climate." Animal Feed Science and Technology 166–167(0): 581-589. Vanotti, M. B. and L. G. Bundy (1994). "Corn Nitrogen Recommendations Based on Yield Response
Data." jpa 7(2): 249-256. Wallin, M. and S. Olausson (1993). "Simultaneous Absorption of H2S and CO2 into a Solution of Sodibum
Carbonate." Chemical Engineering Communications 123(1): 43 - 59. Wang, Q., M. Kuninobu, et al. (1999). "Upgrading of anaerobic digestion of waste activated sludge by
ultrasonic pretreatment." Bioresource Technology 68(3): 309-313. Wang, Z.-W., J. Ma, et al. (2011). "Bipolar effects of settling time on active biomass retention in
anaerobic sequencing batch reactors digesting flushed dairy manure." Bioresource Technology 102(2): 697-702.

June 30, 2013 ANAEROBIC DIGESTION RELATED R&D RESEARCH SUMMARY
FOR WSU ARC/WSDA APPENDIX-A FUNDS
81
Ward, M. L., G. Bitton, et al. (2005). "Heavy metal binding capacity (HMBC) of municipal solid waste landfill leachates." Chemosphere 60(2): 206-215.
Weiland, P. (2006). "Biomass Digestion in Agriculture: A Successful Pathway for the Energy Production and Waste Treatment in Germany." Engineering in Life Sciences 6(3): 302-309.
Weimer, P. J., J. B. Russell, et al. (2009). "Lessons from the cow: What the ruminant animal can teach us about consolidated bioprocessing of cellulosic biomass." Bioresource Technology 100(21): 5323-5331.
Wilkie, A. C., H. F. Castro, et al. (2004). "Fixed-film Anaerobic Digestion of Flushed Dairy Manure after Primary Treatment: Wastewater Production and Characterisation." Biosystems Engineering 89(4): 457-471.
WSDA (2011). Washington Dairies and Digesters. Olympia, WA. Xue, Y., H. Hou, et al. (2009). "Characteristics and mechanisms of phosphate adsorption onto basic
oxygen furnace slag." Journal of Hazardous Materials 162(2): 973-980. Yen, H. and D. Brune (2007). "Anaerobic co-digestion of algal sludge and waste paper to produce
methane." Bioresource Technology 98(1): 130-134. Yih, S.-M. and C.-C. Sun (1987). "Simultaneous Absorption of Hydrogen Sulfide and Carbon Dioxide into
di-isopropanolamine Solution." The Canadian Journal of Chemical Engineering 65(4): 581-585. Yilmaz, P., R. Kottmann, et al. (2011). "Minimum information about a marker gene sequence (MIMARKS)
and minimum information about any (x) sequence (MIxS) specifications." Nature biotechnology 29(5): 415-420.
Yue, Z., C. Teater, et al. (2011). "Development of a new bioethanol feedstock - Anaerobically digested fiber from confined dairy operations using different digestion configurations." JBB Biomass and Bioenergy 35(5): 1946-1953.
Zamalloa, C., J. De Vrieze, et al. (2011). "Anaerobic digestibility of marine microalgae Phaeodactylum tricornutum in a lab-scale anaerobic membrane bioreactor." Appl Microbiol Biotechnol.
Zhao, B., H. Wang, et al. (2010). "Thalassospira xianhensis sp. nov., a polycyclic aromatic hydrocarbon-degrading marine bacterium." International Journal of Systematic and Evolutionary Microbiology 60(5): 1125.
Zhao, Q., S. W. Dvorak, et al. (2012). Nutrient Recovery Systems and Methods. USA. US 2012/0118035 A1.