anaerobic digestion process modeling - nc state …jwlevis/presentations/ad.pdf · anaerobic...
TRANSCRIPT

Anaerobic Digestion Process Modeling
WOLFS
1
Keith Hodge, PE
Graduate Research Assistant
Department of Civil, Construction, and Environmental Engineering
Jim Levis, PhD
Research Assistant Professor
Department of Civil, Construction, and Environmental Engineering
Morton Barlaz, PhD, PE
Professor and Head
Department of Civil, Construction, and Environmental Engineering
E. Velvet Gaston
Undergraduate Assistant
Department of Civil, Construction, and Environmental Engineering
http://go.ncsu.edu/SWM-LCA

Outline
• Introduction
• Reactor Configurations & System Mass Flows
• Biogas Beneficial Use
• Digestate Management
• Illustrative Results
2

INTRODUCTION
3
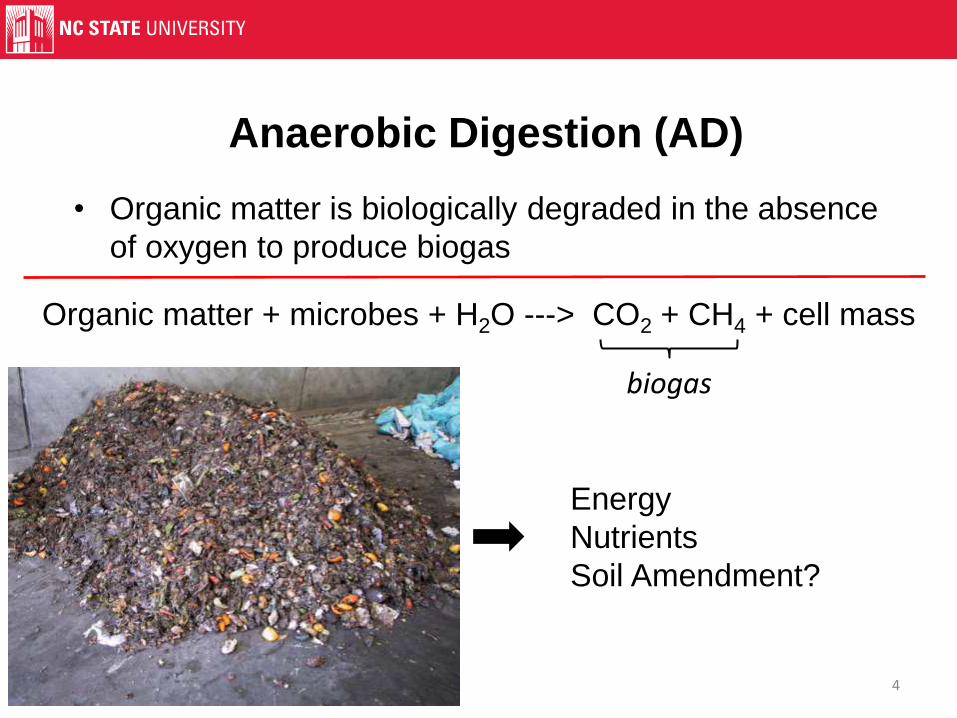
• Organic matter is biologically degraded in the absence
of oxygen to produce biogas
Anaerobic Digestion (AD)
4
biogas
Organic matter + microbes + H2O ---> CO2 + CH4 + cell mass
Energy
Nutrients
Soil Amendment?

Objectives of Anaerobic Digestion
• Energy recovery
• Landfill diversion
– “Avoided” methane emissions
• Secondary benefit – Beneficial use of digested solids
– Depending on feedstock
5
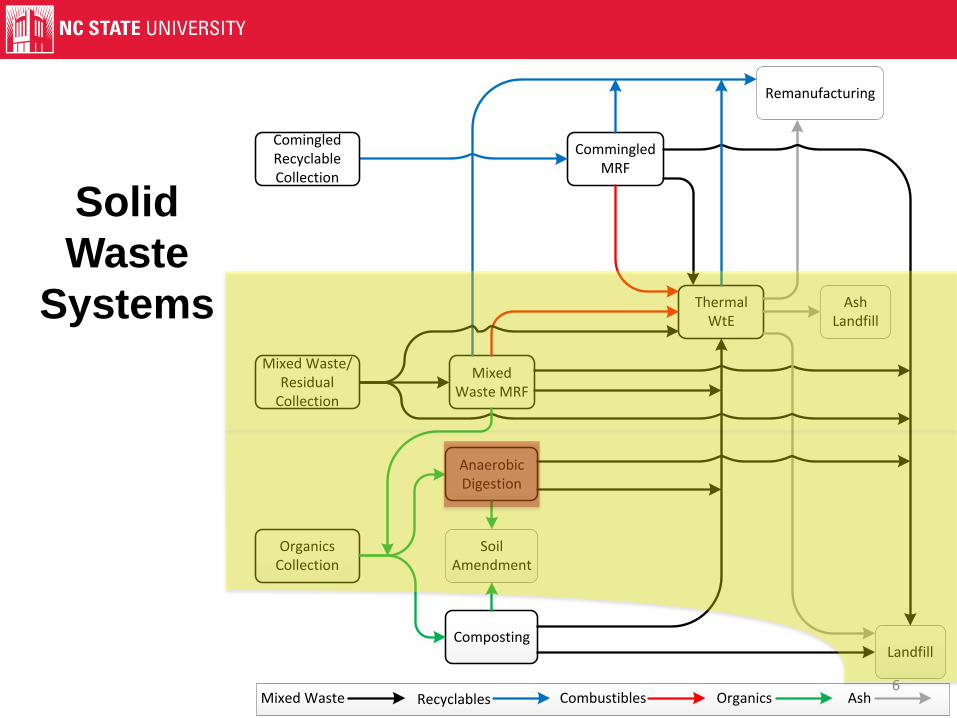
Commingled MRF
Composting
Thermal WtE
Soil Amendment
Mixed Waste MRF
Remanufacturing
Ash Landfill
Landfill
Mixed Waste Recyclables Combustibles Organics Ash
Anaerobic Digestion
Mixed Waste/Residual
Collection
Comingled Recyclable Collection
Organics Collection
Solid
Waste
Systems
6

The Anaerobic Digestion Process Model
7
Anaerobic Digestion
Process Model
Residual
Contaminants
(Mgout/ Mgin)
Direct Emissions (kg/Mgin)
Equipment Fuel Use (L/Mgin)
Electricity Use (kWh/Mgin)
Capital Cost ($/Mg-yr-1)
Operating Cost ($/Mgin)
Incoming Waste
Materials (Mgin)
User Inputs
Recovered
Energy
(kWhout/ Mgin)
Transportation Use (kg-km/Mgin)
Recovered
Solids/Nutrients
(Mgout/ Mgin)
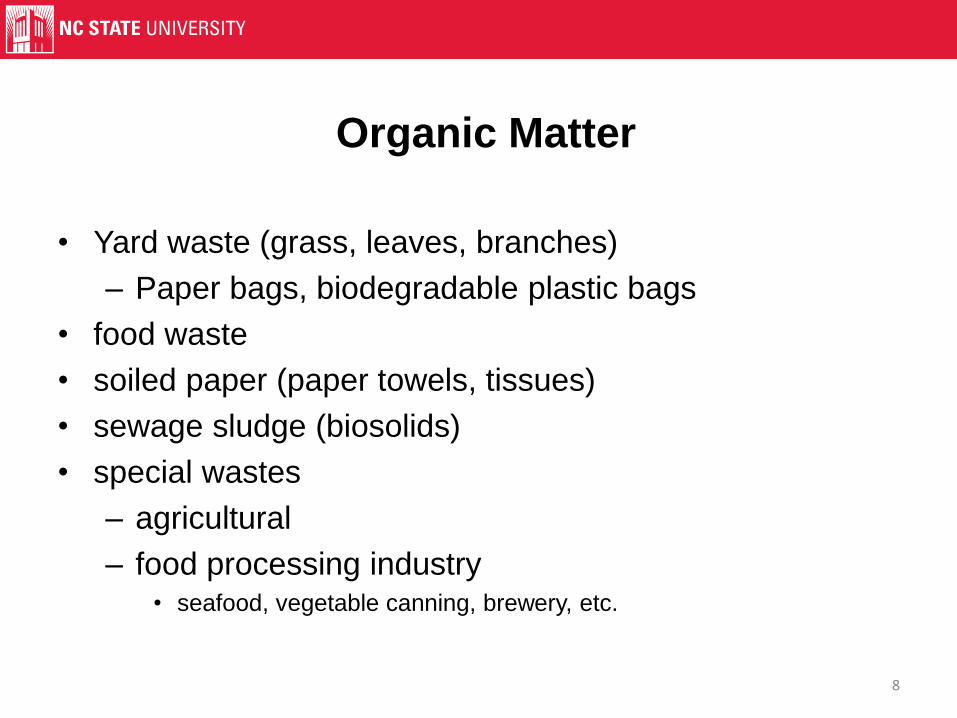
Organic Matter
• Yard waste (grass, leaves, branches)
– Paper bags, biodegradable plastic bags
• food waste
• soiled paper (paper towels, tissues)
• sewage sludge (biosolids)
• special wastes
– agricultural
– food processing industry • seafood, vegetable canning, brewery, etc.
8

Organic Matter in SWOLF
9
Waste Component
Ultimate Methane
Yield (m3/dry Mg)
Yard Trimmings, Leaves 65.3
Yard Trimmings, Grass 194.8
Yard Trimmings, Branches 62.6
Food Waste – Vegetable 399.5
Food Waste – Non-Vegetable 399.5
Wood 13.7
Wood Other 13.7
Textiles 46.4
Waste Component
Ultimate Methane
Yield (m3/dry Mg)
Newsprint 74.3
Corr. Cardboard 195.1
Office Paper 263.6
Magazines 84.4
3rd Class Mail 263.6
Folding Containers 195.1
Paper Bags 195.1
Mixed Paper 164
Paper – Non-recyclable 155
• Also use % of ultimate yield produced (material-specific)
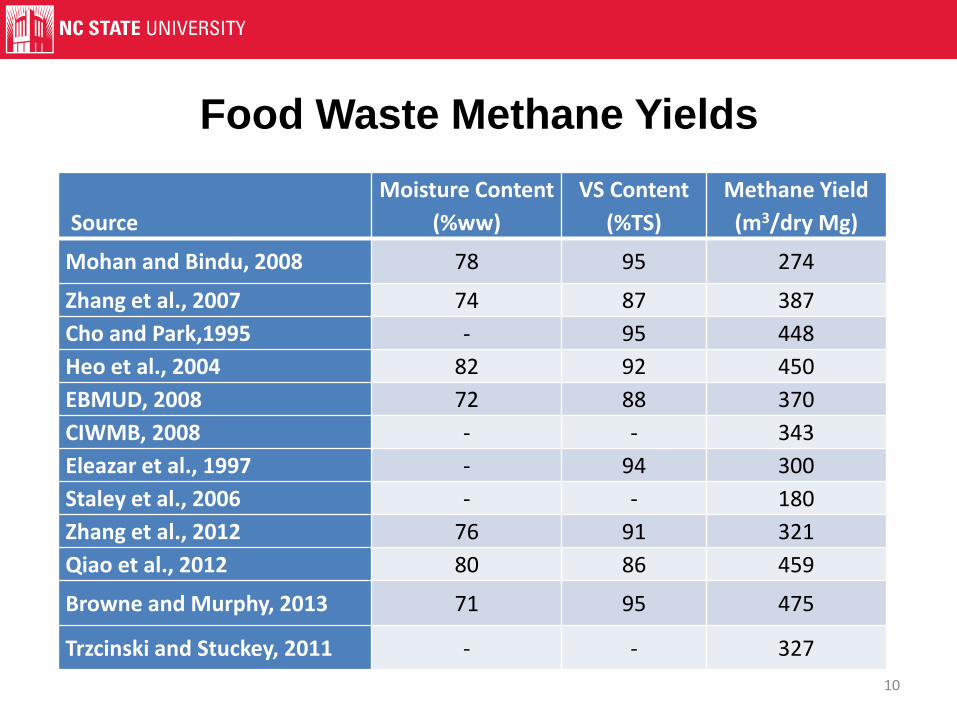
Food Waste Methane Yields
Source
Moisture Content
(%ww)
VS Content
(%TS)
Methane Yield
(m3/dry Mg)
Mohan and Bindu, 2008 78 95 274
Zhang et al., 2007 74 87 387
Cho and Park,1995 - 95 448
Heo et al., 2004 82 92 450
EBMUD, 2008 72 88 370
CIWMB, 2008 - - 343
Eleazar et al., 1997 - 94 300
Staley et al., 2006 - - 180
Zhang et al., 2012 76 91 321
Qiao et al., 2012 80 86 459
Browne and Murphy, 2013 71 95 475
Trzcinski and Stuckey, 2011 - - 327
10

REACTOR CONFIGURATIONS
& SYSTEM MASS FLOWS
11

AD Reactor Configurations
• Wet vs. Dry – Based on solids content in reactor. – Typically <20% = wet; >20% = dry
• Single-stage vs. Two-stage – Two-stage systems separate hydrolysis and
methanogenesis into distinct reactors.
• Mesophilic vs. Thermophilic – Reactor operating temperature impacts gas
production rate and process stability – Typically ~95-100°F = mesophilic;
~130-135°F = thermophilic
• Continuous vs. Batch Feed – Flow of feedstock into AD reactor
12
AD Reactor Configurations in SWOLF
• Process model is black-box with respect to reactor
configuration. – i.e. microbial kinetics are not explicitly modeled.
• All configurations can be represented if relevant performance data is available.
• Default inputs based on: – Wet – Single-stage – Mesophilic – Continuous
13

AD System Mass Flows in SWOLF
• Solid, liquid, and gas flows are present in all AD
systems.
• Mass flows are tracked through the system: – Water – Solids – Volatile Solids – Carbon – Biogas
14

Key Mass Flow/Process Default Inputs
15
Input Units Value Source
Reactor target moisture content
- 0.92 Levis and Barlaz 2010
Maximum percent of reactor water from recirculation
% 80 -
Incoming VS, water, carbon, nitrogen mass
Varies (waste component-specific)
Incoming methane potential Varies (waste component-specific)
16
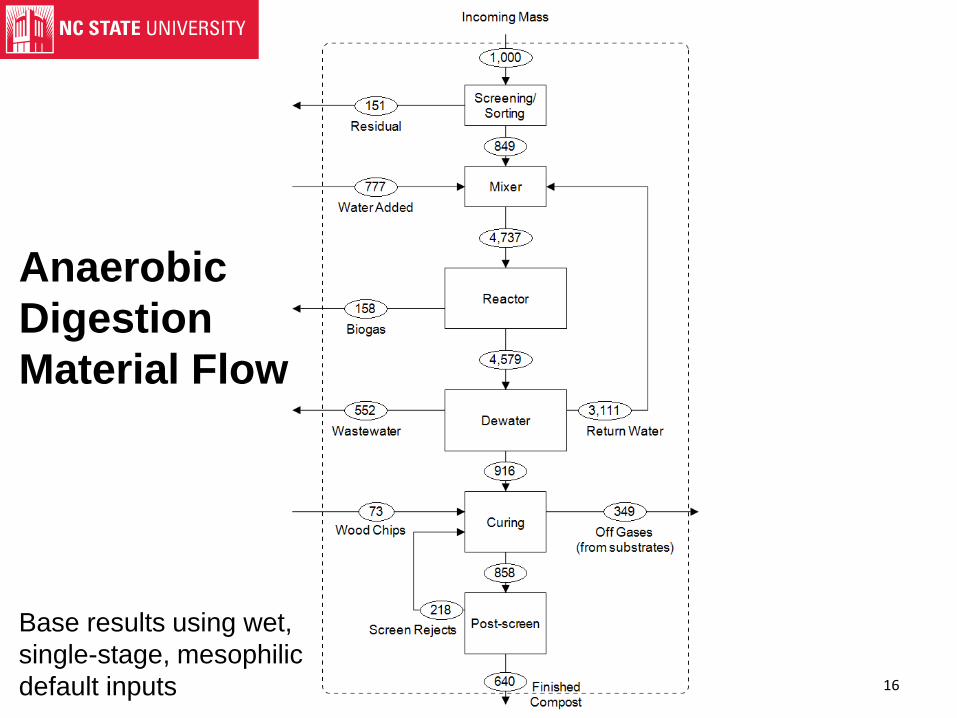
Anaerobic
Digestion
Material Flow
Base results using wet,
single-stage, mesophilic
default inputs
BIOGAS BENEFICIAL USE
17

Biogas Beneficial Use
• Primary objective of AD is energy recovery
• Typical biogas methane content ~60%
• Combustion for electricity production
– internal combustion engine, turbine
– offset conventional electricity production
• Upgrade biogas for other uses:
– Natural gas quality for pipeline injection.
– Upgrade and compress for vehicle fuel (CNG).
18

Biogas Beneficial Use in SWOLF
• Biogas production estimated using material-specific:
– Methane potential
– Percent of methane potential reached in modeled AD
system
• Combustion for electricity production
– Generation estimated using heating value of methane
and heat rate of engine/turbine system.
– System downtime, biogas leakage considered.
– Offset electricity generation for chosen grid.
• Other biogas end uses not yet modeled in SWOLF. 19

Key Biogas/Energy Default Inputs
20
Input Units Value Source
Biogas Engine Heat Rate MJ/kWh 8.5 Sanscartier et. al. 2012
AD Facility Electricity Use kWh/Mg 58 Sanscartier et. al. 2012
Methane Leakage % 3 Sanscartier et. al. 2012
System Downtime % 3 -
DIGESTATE MANAGEMENT
21

Digestate Beneficial Use
• Nutrient value
– Can be land applied in place of N, P, K mineral
fertilizers
• Soil conditioner/amendment
– Can improve soil quality (difficult to quantify) or
– Meet specialty soil needs (potting soil, etc.)
• Carbon storage
– Biogenic carbon can be bound in soil for years-
climate change benefit.
• Refer to Composting presentation for additional details
(digested solids are handled similar to compost).
22

Typical Digestate Management Options
Direct land application, no separation
23
Solids to: • Direct land application • Aerobic curing • Drying
Liquids to: • Wastewater treatment
OR
Separation

Digestate Management Options in SWOLF
Direct land application, no separation
24
Solids to: • Direct land application • Aerobic curing • Drying (under development)
Liquids to: • Wastewater treatment
OR
Separation
Carbon Storage
AND
Fertilizer Production
OR
Peat Production
Emissions
counted for all
processing steps
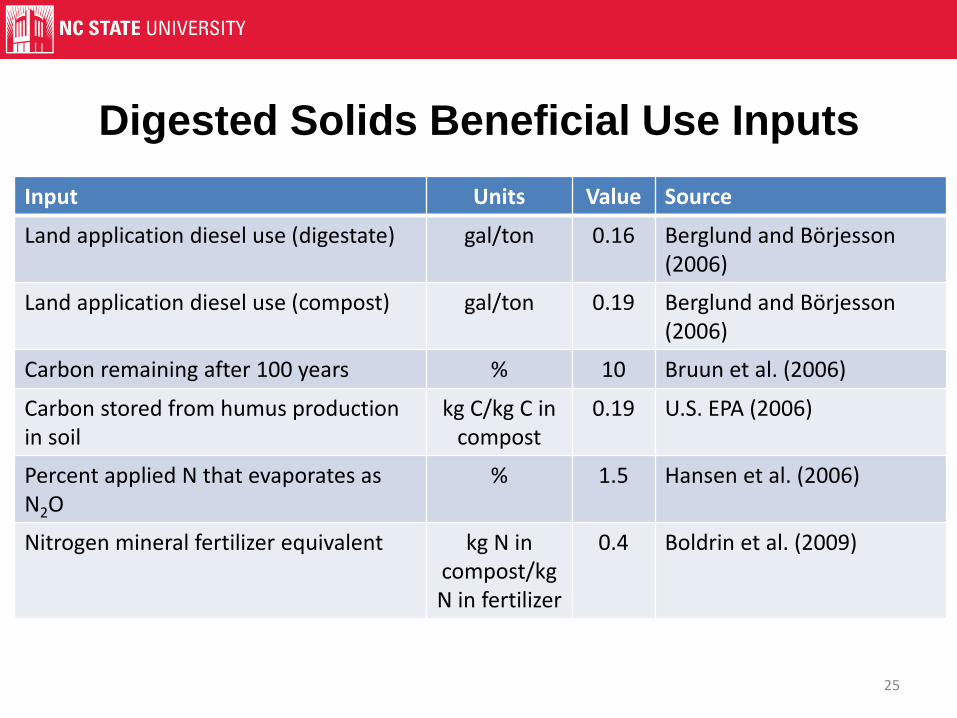
Digested Solids Beneficial Use Inputs
25
Input Units Value Source
Land application diesel use (digestate) gal/ton 0.16 Berglund and Börjesson (2006)
Land application diesel use (compost) gal/ton 0.19 Berglund and Börjesson (2006)
Carbon remaining after 100 years % 10 Bruun et al. (2006)
Carbon stored from humus production in soil
kg C/kg C in compost
0.19 U.S. EPA (2006)
Percent applied N that evaporates as N2O
% 1.5 Hansen et al. (2006)
Nitrogen mineral fertilizer equivalent kg N in compost/kg N in fertilizer
0.4 Boldrin et al. (2009)

Digested Solids Beneficial Use
Offset Emission Factors
26
Emission N (kg/kg N) P (kg/kg P) K (kg/kg P)
Peat (kg/Mg)
Carbon Dioxide – Fossil 5.18 0.411 0.342 18
Methane 0.04 0.002 0.02 0.27
Nitrous Oxide 2.19E-02 5.44E-05 8.16E-04 7.29E-04
GWP (kg CO2e) 12.7 0.48 1.09 25
*Emission Factors adopted from Ecoinvent v3

ILLUSTRATIVE RESULTS
27

Illustrative Results –
Comparison of Digestate Management
28
-400
-300
-200
-100
0
100
200
Separation and AerobicCuring
Direct Land Application
Glo
bal
War
min
g P
ote
nti
al
(kg
CO
2-e
q/M
g)
Electricity Offset
Digestate Off-Gases
Plant Operations
Soil Carbon Storage
Fertilizer Offset
Net

Illustrative Results –
Influence of Electricity Offsets
29
-600
-500
-400
-300
-200
-100
0
100
200
National Average High-CarbonElectrcity Offset
Low-CarbonElectricity Offset
Glo
bal
War
min
g P
ote
nti
al
(kg
CO
2-e
q/M
g)
Electricity Offset
Digestate Off-Gases
Plant Operations
Soil Carbon Storage
Fertilizer Offset
Net
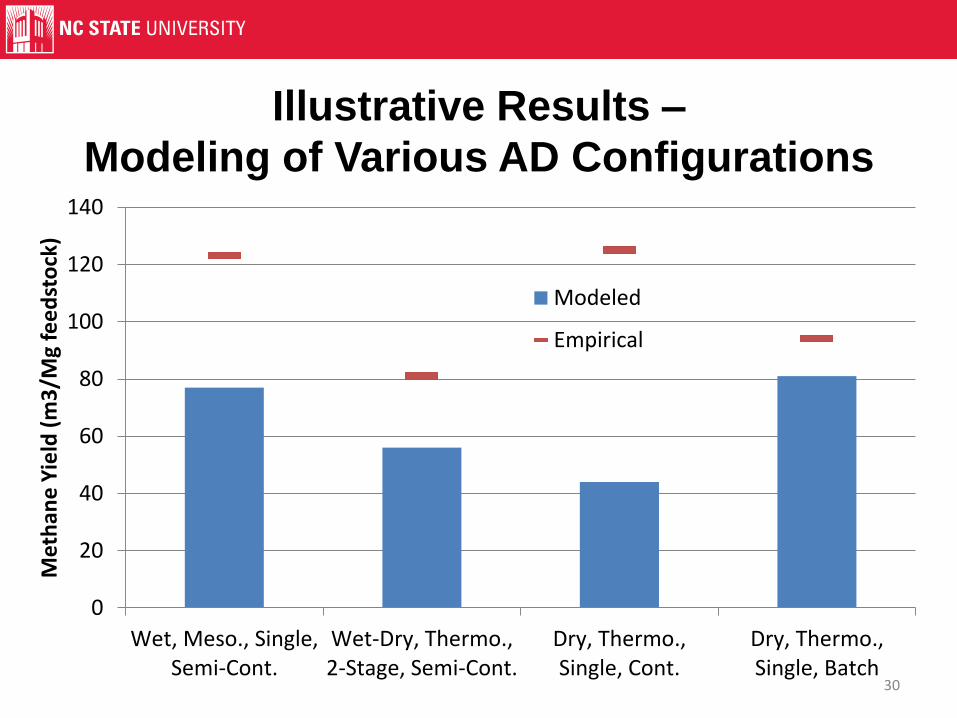
Illustrative Results –
Modeling of Various AD Configurations
30
0
20
40
60
80
100
120
140
Wet, Meso., Single,Semi-Cont.
Wet-Dry, Thermo.,2-Stage, Semi-Cont.
Dry, Thermo.,Single, Cont.
Dry, Thermo.,Single, Batch
Met
han
e Y
ield
(m
3/M
g fe
ed
sto
ck)
Modeled
Empirical

References
• Berglund, M. & Börjesson, P. (2006) Assessment of energy performance in the life-cycle of biogas production.
Biomass and Bioenergy, 30,254– 266.
• Boldrin, A.; Andersen, J.K.; Moller, J.; Christensen, T.H.; Favoino, E. (2009) Composting and compost utilization:
accounting of greenhouse gases and global warming contributions Waste Manage. Res., 27 (8), 800-812.
• Bruun, S., Hansen, T.L., Christensen, T.H., Magid, J. & Jensen, L.S. (2006) Application of processed organic
municipal solid waste on agricultural land: a scenario analysis. Environmental Modeling and Assessment, 11, 251-
265.
• Hansen, T.L., Bhander, G.S., Christensen, T.H., Bruun, S. & Jensen, L.S. (2006) Life cycle modelling of
environmental impacts of application of processed organic municipal solid waste on agricultural land
(EASEWASTE). Waste Management & Research, 24, 153-166.
• Levis, J.W. et al., 2010. Assessment of the state of food waste treatment in the United States and Canada. Waste
Management, 30(8-9), pp.1486–94.
• Levis, J.W. & Barlaz, M. a, 2011. What is the most environmentally beneficial way to treat commercial food waste?
Environmental Science & Technology, 45(17), pp.7438–44.
• Levis, J. W., Barlaz, M. A., (2013). Anaerobic Digestion Process Model Documentation. Raleigh,
NC. http://www4.ncsu.edu/~jwlevis/AD.pdf.
• Sanscartier, D., Maclean, H.L. & Saville, B., 2012. Electricity production from anaerobic digestion of household
organic waste in Ontario: techno-economic and GHG emission analyses. Environmental Science & Technology,
46(2), pp.1233–42.
• U.S. EPA (2006) Solid Waste Management and Greenhouse Gases: A Life-Cycle Assessment of Emissions and
Sinks http://www.epa.gov/climatechange/wycd/waste/downloads/fullreport.pdf Date accessed: 06-02-2010.
31
http://go.ncsu.edu/SWM-LCA

References (cont’d)
• Anaerobic Digestion of Food Waste, (2008) East Bay Municipal Utility District, Oakland, CA,
http://www.epa.gov/region9/organics/ad/EBMUDFinalReport.pdf
• Browne J.D., Murphy J.D., 2013. Assessment of the resource associated with biomethane from food waste,
Applied Energy 104 (2013) 170–177.
• Cho, J. K., Park, S. C., & Chang, H. N. (1995). Biochemical methane potential and solid state anaerobic digestion
of Korean food wastes. Bioresource Technology, 52(3), 245–253. doi:10.1016/0960-8524(95)00031-9
• CIWMB (California Integrated Waste Management Board) (2008). Current Anaerobic Digestion Technologies Used
for Treatment of Municipal Organic Solid Waste. Sacramento, CA. http://www.calrecycle.ca.gov/Publications/
Documents/1275/2008011.pdf.
• Eleazer, W. E.; Odle, W. S.; Wang, Y.; Barlaz, M. A. Biodegradability of Municipal Solid Waste Components in
Laboratory‐Scale Landfills. (1997), 31, 911–917.
• Heo, N.H., Park, S.C., Kang, H., (2004). Effects of mixture ratio and hydraulic retention time on single‐stage
anaerobic co‐digestion of food waste and activated sludge. J. Environ. Sci. Health A39 (7), 1739-1756.
• Mohan S, Bindu BK. (2008). Effect of phase separation on anaerobic digestion of kitchen waste. NRC Research
Press, jees.nrc.ca; Feb. 19, 2008.
• Qiao W., Yan X., Ye J., Sun Y., Wang W., Zhang Z., (2011). Evaluation of biogas production from different biomass
wastes with/without hydrothermal pretreatment, Renewable Energy 36 (2011) 3313‐3318.
• Staley, B. F.; Xu, F.; Cowie, S. J.; Barlaz, M. A; Hater, G. R. (2006) Release of trace organic compounds during the
decomposition of municipal solid waste components. Environ Sci Technol, 40, 5984–91.
• Trzcinski A.P. and Stuckey D.C., (2012). Determination of the Hydrolysis Constant in the Biochemical Methane
Potential Test of Municipal Solid Waste, ENVIRONMENTAL ENGINEERING SCIENCE, Volume 29, Number 9.
• Zhang Y., Banks C.J., Heaven S., (2012). Anaerobic digestion of two biodegradable municipal waste streams,
Journal of Environmental Management 104 (2012) 166-174.
• Zhang, R.; El‐Mashad, H. M.; Hartman, K.; Wang, F.; Liu, G.; Choate, C.; Gamble, P. (2007) Characterization of
food waste as feedstock for anaerobic digestion. Bioresource technology, 98, 929-35.
32
http://go.ncsu.edu/SWM-LCA