anaerobic digestion of food waste stabilized by lime mud from papermaking process
TRANSCRIPT
Bioresource Technology 170 (2014) 270–277
Contents lists available at ScienceDirect
Bioresource Technology
journal homepage: www.elsevier .com/locate /bior tech
Anaerobic digestion of food waste stabilized by lime mudfrom papermaking process
http://dx.doi.org/10.1016/j.biortech.2014.08.0030960-8524/� 2014 Elsevier Ltd. All rights reserved.
⇑ Corresponding author. Tel.: +86 531 89631168; fax: +86 531 89631163.E-mail address: [email protected] (J. Zhang).
Jishi Zhang a,⇑, Qinqing Wang b, Pengwei Zheng a, Yusong Wang c
a School of Environmental Science and Engineering, Qilu University of Technology, Jinan 250353, Chinab School of Food and Bioengineering, Qilu University of Technology, Jinan 250353, Chinac Rizhao Center for Solid Waste Disposal, Rizhao 276800, China
h i g h l i g h t s
� CH4 production from food waste by a single-stage with LMP addition was proposed.� Maximum CH4 yield of 272.8 mL/g VS was obtained at 10 g LMP/L and 19.8 g VS/L.� No VFAs, NH4
+-N inhibition when LMP added and optimal VS removal (47%) were found.� Alkalinity and elements of LMP favored anaerobic stability and CH4 yield.
a r t i c l e i n f o
Article history:Received 2 May 2014Received in revised form 30 July 2014Accepted 2 August 2014Available online 9 August 2014
Keywords:Food wasteAnaerobic digestionLime mud from papermaking processProcess stability
a b s t r a c t
The effects of lime mud from papermaking process (LMP) addition as buffer agent and inorganic nutri-ent on the anaerobic digestion stability of food waste (FW) were investigated under mesophilic condi-tions with the aim of avoiding volatile fatty acids accumulation, and inorganic elements deficiency.When LMP concentration ranged from 6.0 to 10 g/L, the FW anaerobic digestion could maintain effi-cient and stable state. These advantages are attributed to the existence of Ca, Na, Mg, K, Fe, and alkalinesubstances that favor the methanogenic process. The highest CH4 yield of 272.8 mL/g-VS was obtainedat LMP and VS concentrations of 10.0 and 19.8 g/L, respectively, with the corresponding lag-phase timeof 3.84 d and final pH of 8.4. The methanogens from residue digestates mainly consisted ofMethanobrevibacter, coccus-type and sarcina-type methanogens with LMP addition compared toMethanobacteria in control. However, higher concentration of LMP inhibited methanogenic activitiesand methane production.
� 2014 Elsevier Ltd. All rights reserved.
1. Introduction
In China, the disposal of organic wastes is becoming a severeproblem: the daily Chinese urban waste production exceeded 65million ton in 2013, containing about 30% of food waste (FW). Inaddition, the increasing consumption of paper adds an additionalgrowing inorganic waste problem of the lime mud from papermak-ing process (LMP). LMP generated from the causticizing process insulfate pulp production has a considerable fraction of CaCO3 andslight amounts of elements, such as Mg, Na, Fe and mineral fillers,which makes it extremely difficult to deal with or reuse. Anaerobicdigestion has been proven to be an efficient and green technologyfor the treatment of FW and animal manure due to the advantages
of reducing waste and producing renewable energy in the form ofbiogas (El-Mashad et al., 2010).
Due to the characteristics of FW with high contents of volatilesolids and moisture (Kim et al., 2011), it could be quite beneficialfor energy recovery and reduction if treated by anaerobic digestion.However, anaerobic digestion of FW alone may suffer from lowmethane yield, instability and even process failure due to volatilefatty acids (VFAs) concentrations and inorganic elements devia-tions from optimality. There are few reports about successfullyoperating single-stage anaerobic digestion of FW alone at higherorganic loading rate (OLR) due to the high biodegradability of FWand its sequent intermediates that could decrease pH within ashort period. Anaerobic digestion of FW alone was not stable atthe OLR of 4.0 g-VS/(L d), as indicated by high VFAs concentrationsand low pH in the digestion system and low biogas production rate(El-Mashad et al., 2008). Meanwhile, co-digestion could bebeneficial due to dilution of toxic chemicals, enhanced balance of
J. Zhang et al. / Bioresource Technology 170 (2014) 270–277 271
nutrients, and synergistic effect of microorganisms (Li et al., 2010b;Mshandete et al., 2004; Parawira et al., 2004). Additionally, thedigestion allowed higher organic loadings and gave a more stableprocess (Zhang et al., 2012). If sufficient buffering is provided,FW can be better utilized for energy production. Since proteins richin substrates could provide good buffering capacity, highly nitrog-enous wastes can be co-digested with FW to increase the stabilityof the anaerobic process. Zhang et al. (2013a) found that, at anoptimum FW to cattle manure ratio of 2:1 (w/w), the total meth-ane production in batch tests was enhanced by 41.1%, and the cor-responding methane yield was 388 mL/g-VS. Furthermore, theyindicated that the addition of cattle manure enhanced the buffercapacity of anaerobic system. Similar results were obtained thatmethane yield from FW and sewage sludge (SS) mixed in the ratioof 1:1 (w/w) at mesophilic (35 �C, 215 mL/g-VS) and thermophilic(55 �C, 280 mL/g-VS) temperature increased higher than thosefrom SS alone at 35 �C (116 mL/g-VS) and 55 �C (163 mL/g-VS),respectively (Kim et al., 2003). Although co-digestion process ofFW and nitrogen-rich organic wastes (e.g., animal slurry and SS)shows better stability and high methane yield compared to anaer-obic digestion of FW alone, this digestion technology significantlyrestricts the FW disposal capacity.
Buffering is required to maintain pH within a desired range of6.8–7.8 in the FW anaerobic digestion due to VFAs accumulation.pH plays a critical role in governing metabolic pathways of micro-organisms, and methanogens are more liable to be affected bylower pH and grow slower than fermentative microorganisms.FW can be co-digested with highly nitrogenous wastes to enhancethe stability of fermentation process, but it maybe also lead toN-accumulation, and associated inhibition when operating withan excess N-concentration of feedstock (Wang et al., 2013).Besides, the maximum hydrogen yield of 137.6 mL/g-VS wasobtained when LMP was added to FW that reinforces the hypothe-sis of synergistic effects and provides a suitable buffering agent fora carbohydrate-rich to generate hydrogen (Zhang et al., 2013b).Trace elements are also necessary nutrients for cell growth inmicrobiology in order to improve the stability of anaerobic diges-tion, but the issue of lack of trace elements was often ignored inthe practical application. Generally, FW contains low contents oftrace elements, maybe leading to the failure of its anaerobic diges-tion (Zhang et al., 2011). Supplementation of essential trace ele-ments (e.g., Ca, Mg, Fe, Cu, Zn, Mn, Mo, Co, Mo, Ni, and Se) hasbeen shown to be important to maintain the stability of anaerobicprocess, and consequently increase methane production (Yadvikeet al., 2004; Zhang et al., 2011).
In previous studies of anaerobic digestion, the formation andfunction of a buffer system were merely attributed the buffer toa common phenomenon without in-depth discussion (Zhanget al., 2013b; Nielsen and Angelidaki, 2008). The free NH4
+-N con-verted from N-resource, and the CaCO3 of LMP establishes a goodbuffer system combining with the VFAs produced by the hydro-lytic acidification bacteria, thus enhance the tolerance of VFAsin the batch anaerobic fermentation system (Zhang et al.,2013b). Although it has been reported that the addition of LMPinto FW can synergistically enhance bio-hydrogen performance(Zhang et al., 2013b), no study has been conducted to addressthe stability, the buffer capacity and the nutrient characteristicsin FW anaerobic digestion with LMP addition for methaneproduction.
The objectives of the present research were therefore to evalu-ate the performance of anaerobic digestion from FW in terms ofstability by adding LMP. It includes threefold: (i) examine the buf-fering effect of LMP; (ii) identify the addition dosages of LMP forenhancing microbial consortia proximity; and (iii) assess the inor-ganic nutrients of LMP. The criteria for judging the success ofanaerobic digestion of FW added with LMP were process stability,
soluble chemical oxygen demand (SCOD), VFAs, acidity or alkalin-ity, and methane production.
2. Methods
2.1. Preparation of substrates and inoculum
Food waste (FW) was taken from a cafeteria at the Qilu Univer-sity of Technology campus in China, which was made up of vegeta-bles, rice, steamed bread, fruits and a small amount of meats. FWwas shredded and masticated into smaller than 1.5 mm in diame-ter. Then it was further homogenized by using a blender in order toobtain uniform slurry, packed into 4-L plastic storage containers,and frozen at �16 �C. The frozen feedstock was prepared to thawprior to using as experimental substrate, and stored at 4 �C for nomore than one week. The characteristics of FW are given in Table 1,with the comparison of previous literature data. There are somedifferences in total solid (TS), volatile solid (VS), C/N, and contentsof trace elements (e.g. Na, K and Ca) due to differences betweeneating habits and FW collection. However, the previous studiesfocus on the co-digestion of FW with cattle manure to improvethe stability of anaerobic process (El-Mashad et al., 2010; Zhanget al., 2011, 2013a).
Sewage sludge (SS) was taken from a municipal wastewatertreatment plant in Ji’nan, China, which handles an average 50 kilo-tons of wastewater and generates approximately 250 tons of SSdaily. SS was stored at 4 �C prior to the usage. Then it was culti-vated in the culture medium containing glucose (4500 mg/L), yeastextract (100 mg/L), NH4Cl (380 mg/L), KH2PO4 (43 mg/L), Na2HPO4�12H2O (112 mg/L), MgCl2 (0.1 mg/L), CaCl2 (0.1 mg/L) and CuCl2
(0.1 mg/L), under anaerobic and mesophilic (37 ± 1 �C) conditionsfor 40 d, before inoculation. Chemical characteristics of the inocu-lum are as follows: pH: 7.3 ± 0.2, total alkalinity (TA, mg CaCO3/L):3115 ± 20, total solid (TS, wt.%): 4.0 ± 0.1, volatile solid (VS, wt.% ofTS): 56.3 ± 0.2, soluble chemical oxygen demand (SCOD, mg/L):2150 ± 20, and ammonia nitrogen (NH4
+-N, mg/L): 239 ± 5.0.
2.2. Collection and characteristics of inorganic additives
Lime mud from papermaking process (LMP) was collected froma pulp and paper factory in Rizhao, China, containing primarilyCaCO3, CaO and several other minerals. It was oven-dried at105 �C for 3 h and was used as inorganic additives in anaerobicdigestion of FW. The compositions of LMP are largely related toraw materials and treatment process (Martins et al., 2007). LMPelemental composition (wt.%) was as follows: Ca (35.4 ± 0.05), Si(2.97 ± 0.02), Mg (1.82 ± 0.02), Na (5.42 ± 0.02), K (0.13 ± 0.01), Fe(1.12 ± 0.01), Mn (0.56 ± 0.01), S (1.72 ± 0.01) and P (0.37 ± 0.01).Its specific surface area (4.95 ± 0.02, m2 g�1) and surface micro-structure have also been determined as previously described(Zhang et al., 2013b).
2.3. Anaerobic digestion experiments
A series of batch experiments were carried out in 800 mL glassdigesters with an effective volume of 500 mL at a mesophilic tem-perature of 37 ± 1 �C for 40 d. These digesters were equipped withtwo ports for sampling slurry and gas, respectively. Fifty grams ofFW (wet weight) added into each glass digester at different addi-tion amounts of LMP (1, 3, 5 and 7 g), then they were fully mixedand diluted by the appropriate amount of deionized water to avoiddamaging microbial growth due to the high alkalinity of LMP. Sub-sequently, 100 mL of inoculum was added into each glass digester,and filled up to the working volume of 500 mL with deionizedwater. Therefore, the LMP concentration in the corresponding
t (d)
P (m
L)
StationaryAcceleration phase
Pm
λ
Lag phase Decline phase
Rm
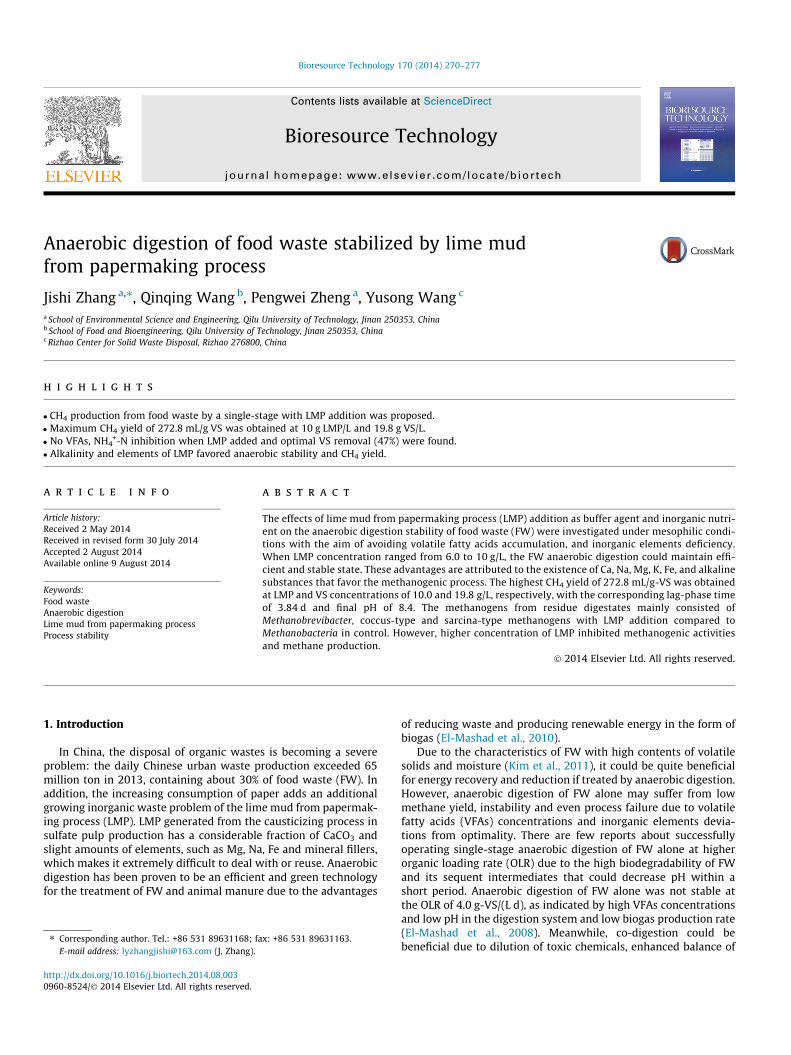
Fig. 1. Kinetic model of methane generated in batch fermentation.
Table 1Characteristics of food waste (mean value ± standard deviation).
Parameters Food waste
Zhang et al. (2013a) Zhang et al. (2011) El-Mashad et al. (2010) This study
pH 5.2 ± 0.3 6.5 ± 0.2 – 6.3 ± 0.3TS (wt.%) 18.5 ± 0.1 18.1 ± 0.6 28 ± 1.3 20.2 ± 0.2VS (wt.%) 17.0 ± 0.1 17.1 ± 0.6 24.1 ± 1.1 19.8 ± 0.2VS/TS ratio 0.92 0.94 ± 0.01 0.86 0.98 ± 0.01Carbon, C (%, d. b.)a 46.5 ± 1.5 46.67 – 48.7 ± 1.3Nitrogen, N (%, d. b.)a 2.2 ± 0.3 3.54 2.95 2.3 ± 0.2C/N ratio 21.1 13.2 ± 0.2 – 21.9SCOD (mg/L) –b 106,600 ± 530 – 5360 ± 20Na+ (%)a 3.45 ± 0.2 – 0.60 2.15 ± 0.2K+ (%)a 2.3 ± 0.04 – 0.80 1.11 ± 0.02Mg2+ (%)a 0.16 ± 0.01 – 0.16 0.12 ± 0.01Ca2+ (%)a 0.03 ± 0.01 – 2.83 0.05 ± 0.01
a (%, d. b.), Based on dry base.b –, Not available.
272 J. Zhang et al. / Bioresource Technology 170 (2014) 270–277
digester was 0, 2, 6, 10, and 14 g/L, respectively, after they weremixed homogeneously. Furthermore, all inoculum to substrateratios (ISRs) on VS basis in digesters were 22.75%. The headspaceof digester was flushed with nitrogen gas (300 mL/min) for about5 min in order to create anaerobic conditions prior to starting thedigestion experiments. Then, the digesters were quickly sealedwith rubber septum and placed in temperature controlled incuba-tors at 37 ± 1 �C. Along with the test reactors, two blank reactorswere also operated to measure the biogas produced from the inoc-ulum for later use in the correction of biogas produced from thetesting substrate. Each of the blank digesters contained only inoc-ulum and water. Experiments of each digester were performed induplicate and all results were the average of replicate analysis.
2.4. Methane measurement
Methane (CH4) production was collected by the water displace-ment method. All digesters were shaken manually for 30 s once aday prior to measurement of biogas production. CH4 volume wasdetermined daily after the biogas passed through a gas bottle con-taining 5% NaOH solution (Zhang et al., 2007). The measured meth-ane volume was transformed into the volume at standardtemperature (0 �C) and pressure (100 kPa). Biogas samples wereperiodically taken from the gas collection line prior to the bottleand examined for the CH4 and CO2 contents by using a gas chroma-tography (GC-2014C, Shimadzu, Japan) equipped with a thermalconductivity detector. A 2 m � 3 mm stainless-steel column packedwith carbon molecular sieve was used. The temperatures of injec-tion port, column and thermal conductivity detector were 150,160 and 170 �C, respectively. Argon was used as carrier gas with apressure of 300 kPa and a flow rate of 30 mL/min. Cumulative meth-ane yield (CMY) of anaerobic digestion was calculated using Eq. (1).
VCMY;i ¼ VCMY;i�1 þ VCH4 ;i ð1Þ
where VCMY;i (mL) and VCMY;i�1 (mL) are the cumulative CH4 volumesin the current (i) and previous (i�1) time (d), respectively, and VCH4,i
(mL) is the CH4 volume at current time (d).Methane producing microorganisms’ generation can be divided
into four phases as follows: Lag phase, acceleration phase, station-ary phase and decline phase, shown in Fig. 1. In this study, themodified Gompertz three- parameter model was fitted to thecumulative CH4 curves to determine the maximum CH4 productionrate (Rm) and the lag phase (k), as shown in Eq. (2) (Lay et al., 1998).
PðtÞ ¼ Pm exp � exp2:71828Rm
Pmðk� tÞ þ 1
� �� �ð2Þ
where P(t) is the cumulative CH4 production (mL) at incubationtime t (d), Pm is the CH4 production potential (mL) at the end of
the incubation, Rm is the maximum CH4 production rate (MMPR)(mL/d), k is the lag phase (d). The values of Pm, Rm and k for eachbatch test were determined using Software Origin 8.0. Likewise,the parameters were diagnosed by correlation coefficient (R2), stan-dard errors (SE).
2.5. Analytical methods
During the tests, 2 mL of liquid sample was collected at a propertiming with a syringe. The sample was immediately filteredthrough 0.45 lm cellulose nitrate membrane filters (Whatman,USA) and then stored at 4 �C for further analysis. The total solids(TS), volatile solid (VS) of prepared food waste and inoculum weredetermined according to the Standard Methods (APHA, 2005). VFAwas detected by a colorimetric method at 500 nm (Jarrel andKalmokoff, 1988). Total nitrogen (TN) was determined by KjeltecNitrogen Analyzer, and ammonia (NH4
+-N) by the Nessler’s reagentcolorimetric method (Appels et al., 2008). Soluble chemical oxygen(SCOD) was measured by the classical potassium dichromatemethod (COD analyzer, DJL100, Qindao, China) (APHA, 2005).Soluble total organic carbon (STOC) was determined by a TOC ana-lyzer (TOC-V, Shimadzu, Japan). Alkalinity and acidity (as CaCO3)were measured through titrimetry (APHA, 2005). The pH of liquidsample was determined by using a calibrated pH probe (ColeParmer, Model 05669-20). The metal concentrations of liquid sam-ples such as K, Na, Fe, Mg and Ca, were determined by atomicabsorption spectrophotometer (AA6300Model, Shimadzu, Japan).Moreover, the superficial structure and morphology of bacteriawere also observed by scanning electron microscope (SEM)

500
J. Zhang et al. / Bioresource Technology 170 (2014) 270–277 273
(Quanta-200, FEI Co., Holland) after digested residue was freeze–dried for 22 h.
0 5 10 15 20 25 30 35 400
100
200
300
400
control 2 g LMP/L 6 g LMP/L 10 g LMP/L 14 g LMP/L
Met
hane
pro
duct
ion
rate
(mL/
d)
Digestion time (d)
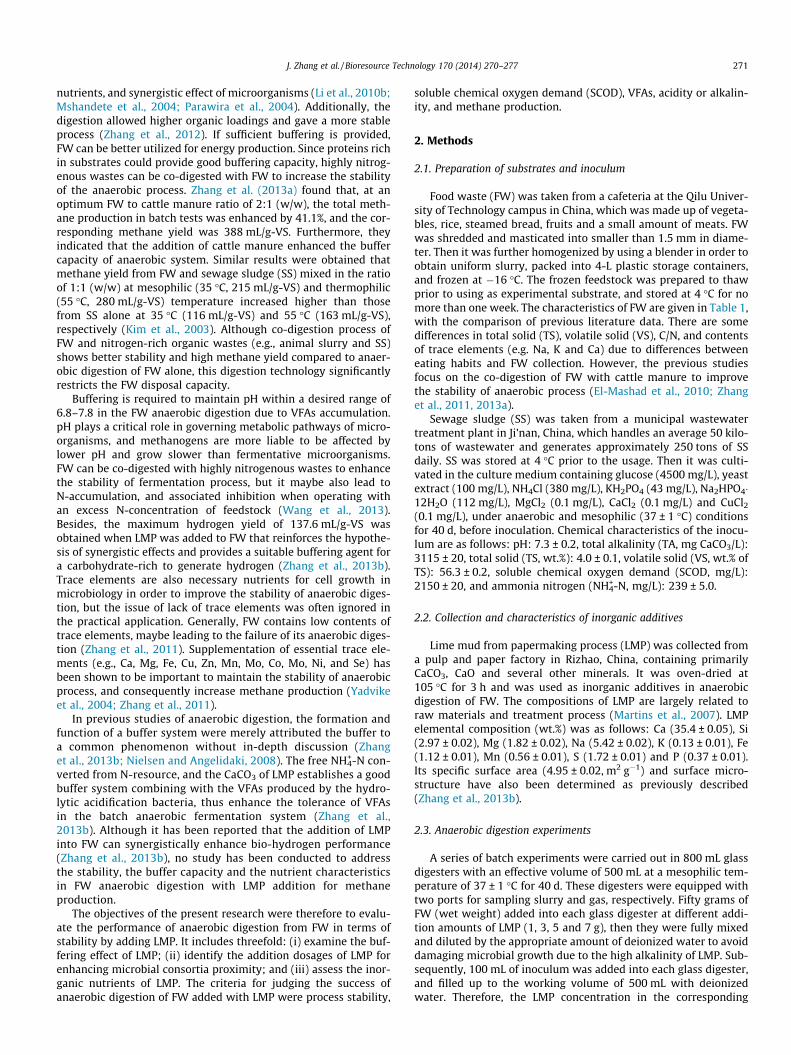
Fig. 3. Effects of initial LMP concentrations on methane production rates.
3. Results and discussion
3.1. Effect of LMP addition on methane production
Generally, methane production is linearly correlated with theamount of volatile solids (VS) degraded when methanogenic pro-cess reaches to stable state in operation. Besides, the process sta-bility mainly reflected in the relative stability of pH and thebiogas production in turn. During the digestion of FW and SS withthe addition of LMP, the effects of initial concentrations of LMP oncumulative methane yield (CMY) and methane production rate(MPR) are shown in Figs. 2 and 3, respectively.
H2 was not measured during the entire fermentation period dueto the fact that it can be utilized and converted to methanogenesisin the condition of CO2 by the autotrophic growth of various meth-anogen species. After 39 days of digestion, CMY was measured tobe 21, 1653, 2522, 2700, and 2145 mL at the control and LMP con-centrations (2.0, 6.0, 10.0, and 14.0 g/L), respectively (Fig. 2). Withthe addition of LMP, CMY from the AD of FW showed significantincreases than that from the control, indicating that LMP additioncould improve the growth factors for methanogens and theyadapted in a relatively wide range of LMP concentrations of6.0–14.0 g/L (Fig. 2 and Table 2). Fig. 2 shows the increase ofCMY with the increase of initial LMP concentration up to 10 g/L.Simultaneously, LMP addition did enhance digestion capacity andthe time to stop producing biogas was observed in advance. Thismay be attributed to the presence of alkaline substrates (e.g.,CaCO3), providing a buffer effect for acidic substrates generatedthrough hydrolysis, and other elements such as S, K, Mg and Feneeded for microorganism growth from LMP (Zhang et al.,2013b). Compared with the CMY at initial LMP concentrations of6 and 10 g/L, however, it reduced and lowered at the LMP concen-trations of 14 g/L, whereas methane-producing at the concentra-tion was completed for about 14 d prior to that from LMPconcentrations of 6 and 10 g/L. Both of them were about 16 dthough they had a slight increase later. Approximately 85–90% ofthe methane yield was obtained in the first 11 days of methano-genic process. It was demonstrated that methane-producing bacte-ria were probably inhibited, and/or the available organiccomponents were reduced by an excessive concentration of LMP(more than 10 g/L). On the other hand, obviously, the control group
0 5 10 15 20 25 30 35 400
500
1000
1500
2000
2500
3000
Cum
ulat
ive
met
hane
yie
ld (m
L)
Digestion time(d)
control 2 g LMP/L 6 g LMP/L 10 g LMP/L 14 g LMP/L
Fig. 2. Effects of initial LMP concentrations on cumulative methane yields.
producing the least methane yield was seriously inhibited by lowpH (4.0) due to the cumulation of acidic substrates (CxHyCOOH)hydrolyzed from degradable substances (Figs. 2 and 3).
Effect of LMP addition on average methane production rates foranaerobic digestion from FW are shown in Fig. 3. With the increaseof LMP concentration, higher methane production rateswere observed correspondingly than that without LMP addition.The highest methane production rates of 122, 313 and 399 mL/dat the corresponding LMP concentrations (2.0, 6.0 and 10.0 g/L),could be synergistically achieved, respectively, while it achievedto appropriate 350 mL/d for the methanogenic process of14.0 g LMP/L. Several peaks of methane production rates wereobtained during fermentation period except for the control group(without LMP addition) due to different biodegradability of organicmatter fractions in the feedstock (Forster-Carneiro et al., 2008). Car-bohydrates such as steamed bread and boiled rice are generallydecomposed prior to other composition in initial digestion time;while other peaks appeared subsequently, as other matters (e.g.,meat and fat) were degradated. They were relatively lower in thesecond peak period (11–13 d) than that in the first one where themethane production rate (399 mL/d) with LMP concentration of10 g/L was measured to be higher than other concentrations (Fig. 3).
In addition, the modified Gompertz model has been successfullyapplied in modeling the methanogenic process. Based on the datashown in Fig. 3, cumulative CH4 production curves were fitted bythe modified Gompertz equation of FW anaerobic digestion at var-ious LMP concentrations. The values of Pm, Rm and k were deter-mined in Table 2. It showed that the determination coefficients(R2) of all the regressions were all around 0.99, suggesting thatthe methane producing process could be well described by themodified Gompertz model.
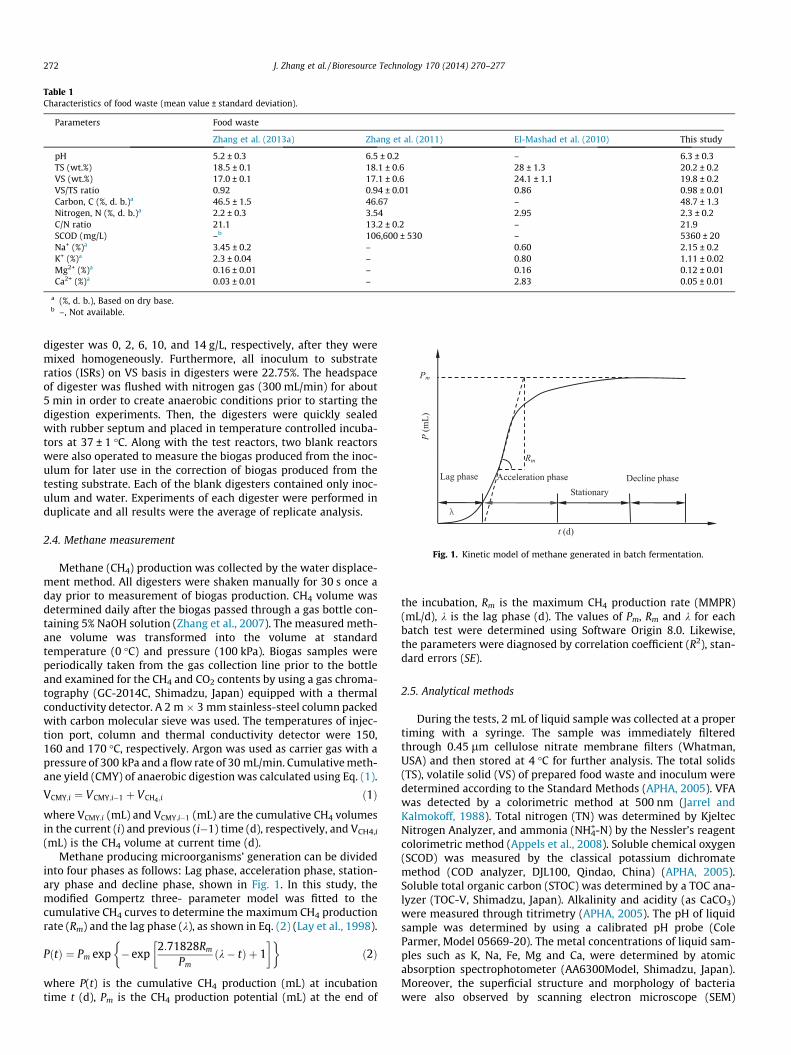
The highest CH4 production potential (Pm) (2671.18 mL), themaximum CH4 production rate (MMPR) (313.28) (mL/d) and thehighest CH4 yield (272.8 mL/g-VS), were all obtained at the LMPconcentration of 10.0 g/L, respectively (Table 2). Moreover, signifi-cant negative correlations were observed between the lag phases(k) and LMP concentrations. Increasing in LMP concentration from2.0 to 14.0 g/L associated with the decrease of k from 4.41 to 2.68 d.This indicated that the microorganisms were better adapted to uti-lize the substrate at LMP concentrations ranged from 2.0 to 14.0 g/L (Table 2). In addition, the highest CH4 yield is 272.8 mL/g-VS thatis lower than the yield of 282 and 353 mL/g-VS obtained from mix-ture of FW and manure (1:2, w/w), and FW alone during the diges-tion (30 d) at 35 �C (El-Mashad et al., 2010). While Zhang et al.(2013a) observed that, at the optimum food waste to cattle manureratio of 2:1 (w/w), the total CH4 production was enhanced by41.1%, and the corresponding CH4 yield was 388 mL/g-VS. This
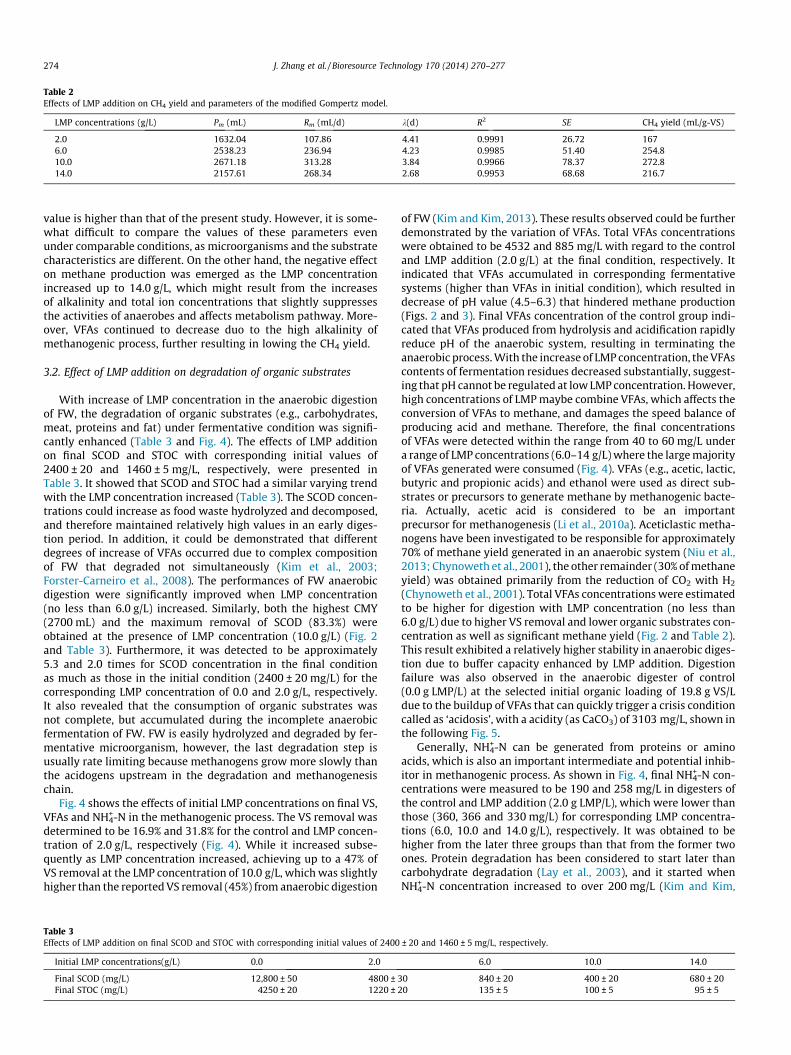
Table 2Effects of LMP addition on CH4 yield and parameters of the modified Gompertz model.
LMP concentrations (g/L) Pm (mL) Rm (mL/d) k(d) R2 SE CH4 yield (mL/g-VS)
2.0 1632.04 107.86 4.41 0.9991 26.72 1676.0 2538.23 236.94 4.23 0.9985 51.40 254.810.0 2671.18 313.28 3.84 0.9966 78.37 272.814.0 2157.61 268.34 2.68 0.9953 68.68 216.7
274 J. Zhang et al. / Bioresource Technology 170 (2014) 270–277
value is higher than that of the present study. However, it is some-what difficult to compare the values of these parameters evenunder comparable conditions, as microorganisms and the substratecharacteristics are different. On the other hand, the negative effecton methane production was emerged as the LMP concentrationincreased up to 14.0 g/L, which might result from the increasesof alkalinity and total ion concentrations that slightly suppressesthe activities of anaerobes and affects metabolism pathway. More-over, VFAs continued to decrease duo to the high alkalinity ofmethanogenic process, further resulting in lowing the CH4 yield.
3.2. Effect of LMP addition on degradation of organic substrates
With increase of LMP concentration in the anaerobic digestionof FW, the degradation of organic substrates (e.g., carbohydrates,meat, proteins and fat) under fermentative condition was signifi-cantly enhanced (Table 3 and Fig. 4). The effects of LMP additionon final SCOD and STOC with corresponding initial values of2400 ± 20 and 1460 ± 5 mg/L, respectively, were presented inTable 3. It showed that SCOD and STOC had a similar varying trendwith the LMP concentration increased (Table 3). The SCOD concen-trations could increase as food waste hydrolyzed and decomposed,and therefore maintained relatively high values in an early diges-tion period. In addition, it could be demonstrated that differentdegrees of increase of VFAs occurred due to complex compositionof FW that degraded not simultaneously (Kim et al., 2003;Forster-Carneiro et al., 2008). The performances of FW anaerobicdigestion were significantly improved when LMP concentration(no less than 6.0 g/L) increased. Similarly, both the highest CMY(2700 mL) and the maximum removal of SCOD (83.3%) wereobtained at the presence of LMP concentration (10.0 g/L) (Fig. 2and Table 3). Furthermore, it was detected to be approximately5.3 and 2.0 times for SCOD concentration in the final conditionas much as those in the initial condition (2400 ± 20 mg/L) for thecorresponding LMP concentration of 0.0 and 2.0 g/L, respectively.It also revealed that the consumption of organic substrates wasnot complete, but accumulated during the incomplete anaerobicfermentation of FW. FW is easily hydrolyzed and degraded by fer-mentative microorganism, however, the last degradation step isusually rate limiting because methanogens grow more slowly thanthe acidogens upstream in the degradation and methanogenesischain.
Fig. 4 shows the effects of initial LMP concentrations on final VS,VFAs and NH4
+-N in the methanogenic process. The VS removal wasdetermined to be 16.9% and 31.8% for the control and LMP concen-tration of 2.0 g/L, respectively (Fig. 4). While it increased subse-quently as LMP concentration increased, achieving up to a 47% ofVS removal at the LMP concentration of 10.0 g/L, which was slightlyhigher than the reported VS removal (45%) from anaerobic digestion
Table 3Effects of LMP addition on final SCOD and STOC with corresponding initial values of 2400
Initial LMP concentrations(g/L) 0.0 2.0
Final SCOD (mg/L) 12,800 ± 50 4800 ± 3Final STOC (mg/L) 4250 ± 20 1220 ± 2
of FW (Kim and Kim, 2013). These results observed could be furtherdemonstrated by the variation of VFAs. Total VFAs concentrationswere obtained to be 4532 and 885 mg/L with regard to the controland LMP addition (2.0 g/L) at the final condition, respectively. Itindicated that VFAs accumulated in corresponding fermentativesystems (higher than VFAs in initial condition), which resulted indecrease of pH value (4.5–6.3) that hindered methane production(Figs. 2 and 3). Final VFAs concentration of the control group indi-cated that VFAs produced from hydrolysis and acidification rapidlyreduce pH of the anaerobic system, resulting in terminating theanaerobic process. With the increase of LMP concentration, the VFAscontents of fermentation residues decreased substantially, suggest-ing that pH cannot be regulated at low LMP concentration. However,high concentrations of LMP maybe combine VFAs, which affects theconversion of VFAs to methane, and damages the speed balance ofproducing acid and methane. Therefore, the final concentrationsof VFAs were detected within the range from 40 to 60 mg/L undera range of LMP concentrations (6.0–14 g/L) where the large majorityof VFAs generated were consumed (Fig. 4). VFAs (e.g., acetic, lactic,butyric and propionic acids) and ethanol were used as direct sub-strates or precursors to generate methane by methanogenic bacte-ria. Actually, acetic acid is considered to be an importantprecursor for methanogenesis (Li et al., 2010a). Aceticlastic metha-nogens have been investigated to be responsible for approximately70% of methane yield generated in an anaerobic system (Niu et al.,2013; Chynoweth et al., 2001), the other remainder (30% of methaneyield) was obtained primarily from the reduction of CO2 with H2
(Chynoweth et al., 2001). Total VFAs concentrations were estimatedto be higher for digestion with LMP concentration (no less than6.0 g/L) due to higher VS removal and lower organic substrates con-centration as well as significant methane yield (Fig. 2 and Table 2).This result exhibited a relatively higher stability in anaerobic diges-tion due to buffer capacity enhanced by LMP addition. Digestionfailure was also observed in the anaerobic digester of control(0.0 g LMP/L) at the selected initial organic loading of 19.8 g VS/Ldue to the buildup of VFAs that can quickly trigger a crisis conditioncalled as ‘acidosis’, with a acidity (as CaCO3) of 3103 mg/L, shown inthe following Fig. 5.
Generally, NH4+-N can be generated from proteins or amino
acids, which is also an important intermediate and potential inhib-itor in methanogenic process. As shown in Fig. 4, final NH4
+-N con-centrations were measured to be 190 and 258 mg/L in digesters ofthe control and LMP addition (2.0 g LMP/L), which were lower thanthose (360, 366 and 330 mg/L) for corresponding LMP concentra-tions (6.0, 10.0 and 14.0 g/L), respectively. It was obtained to behigher from the later three groups than that from the former twoones. Protein degradation has been considered to start later thancarbohydrate degradation (Lay et al., 2003), and it started whenNH4
+-N concentration increased to over 200 mg/L (Kim and Kim,
± 20 and 1460 ± 5 mg/L, respectively.
6.0 10.0 14.0
0 840 ± 20 400 ± 20 680 ± 200 135 ± 5 100 ± 5 95 ± 5

0 1 2 3 4 5 6 7 8 9 10 11 12 13 142000
3000
4000
5000
6000
7000
8000
Final alkalinity Final acidity Final pH
LMP concentrations (g/L)
0
500
1000
1500
2000
2500
3000
3500
4000
2
3
4
5
6
7
8
9
10
Fina
l aci
dity
(mg/
L)
Fina
l pH
Fina
l alk
alin
ity (m
g/L)
Fig. 5. Effects of initial LMP concentrations on final alkalinity and acidity.
0 1 2 3 4 5 6 7 8 9 10 11 12 13 1410
15
20
25
30
35
40
45
50
VS removal Final VFA Final NH3-N
LMP concentrations (g/L)
0
1000
2000
3000
4000
5000
150
200
250
300
350
400
Fina
l VFA
(mg/
L)
Fina
l NH
4+ -N (m
g/L)
VS re
mov
al (%
)
Fig. 4. Effects of initial LMP concentrations on final VS, VFAs and NH4+-N.
J. Zhang et al. / Bioresource Technology 170 (2014) 270–277 275
2013). Moreover, NH4+-N is also an essential nutrient for anaerobic
microorganisms and favors anaerobic digestion under 200 mg/L(Liu and Sung, 2002). However, when it reached to 700 mg/L,methanogenic activity could be inhibited (Lay et al., 1998). In thisstudy, NH4
+-N concentrations in the final condition were all below700 mg/L (Fig. 4), demonstrating that no NH4
+-N inhibitionoccurred in fermentative process. This result can be likelyexplained by the presence of high concentration of VFAs that canneutralize parts of NH4
+-N.
3.3. Effect of LMP addition on final acidity and alkalinity
During anaerobic digestion, acidity and alkalinity are crucialfactors that affect methanogenic activity and metabolism pathway.A failure of the imbalances of pH, VFAs and alkalinity might resultin limitation of microbial growth, and consequent inhibition orinterruption of CH4 production. Adding LMP into anaerobic diges-tion of food waste can release VFAs slowly, thereby slowing thedecrease of pH, which provides a relatively favorable environmentfor the survival of methanogenic bacteria (Fig. 5). Some metabolic
intermediates, in particular VFAs, could interact with LMP to formbicarbonates that improve buffering effect for this system, asshown in Eqs. (3–5) where CxHyCOOH presents the VFAs.
CxHyCOOH � CxHyCOO� þHþ ð3Þ
CaCO3 þHþ � Ca2þ þHCO�3 ð4Þ
NH3 �H2O � NHþ4 þ OH� ð5Þ
Combine Eqs. (3) and (5), Eq. (6) was obtained as follow (Zhanget al., 2013a):
CxHyCOOHþ NH3 �H2O � CxHyCOO� þ NHþ4 þH2O ð6Þ
Moreover, more VFAs will be neutralized at higher concentra-tion of ammonia. Therefore, higher alkalinity may be the reasonfor buffer capacity enhancement in the FW digestion.
Variations of final alkalinity and acidity have an inverse trend(Fig. 5). The final alkalinity of anaerobic digesters increased withLMP concentration increasing, whereas it was lower (6278 mg/L)for LMP concentration of 10.0 g/L than those (7101 and 7197 mg/L)
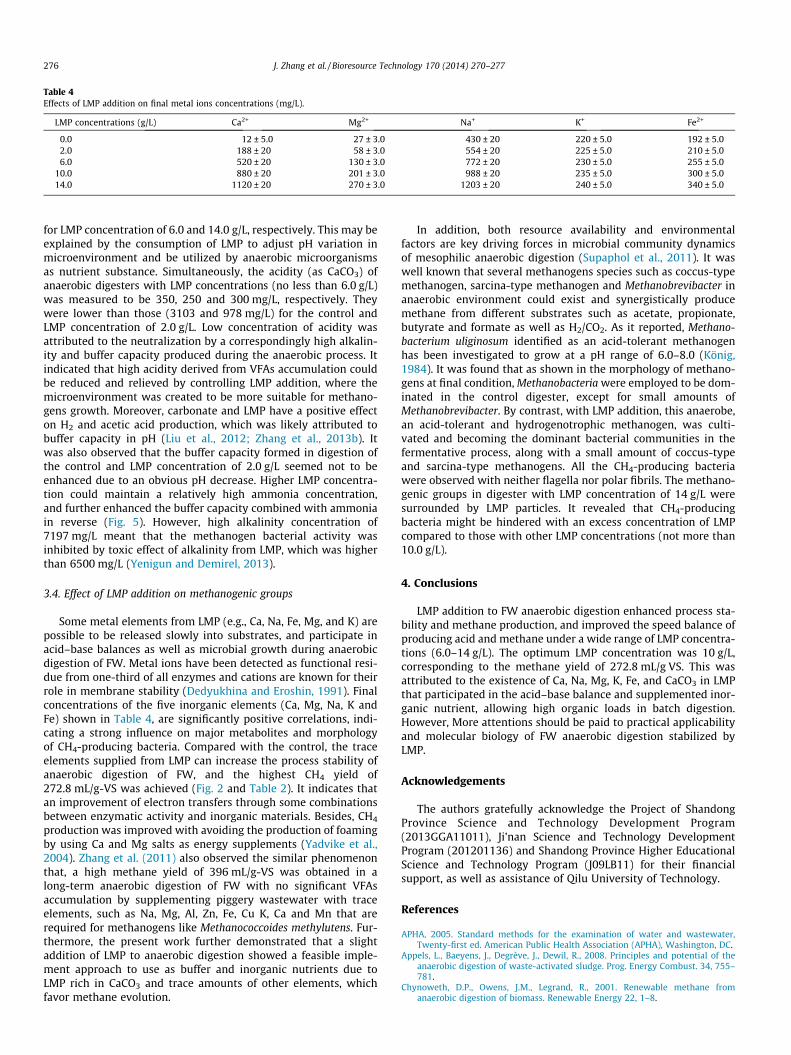
Table 4Effects of LMP addition on final metal ions concentrations (mg/L).
LMP concentrations (g/L) Ca2+ Mg2+ Na+ K+ Fe2+
0.0 12 ± 5.0 27 ± 3.0 430 ± 20 220 ± 5.0 192 ± 5.02.0 188 ± 20 58 ± 3.0 554 ± 20 225 ± 5.0 210 ± 5.06.0 520 ± 20 130 ± 3.0 772 ± 20 230 ± 5.0 255 ± 5.0
10.0 880 ± 20 201 ± 3.0 988 ± 20 235 ± 5.0 300 ± 5.014.0 1120 ± 20 270 ± 3.0 1203 ± 20 240 ± 5.0 340 ± 5.0
276 J. Zhang et al. / Bioresource Technology 170 (2014) 270–277
for LMP concentration of 6.0 and 14.0 g/L, respectively. This may beexplained by the consumption of LMP to adjust pH variation inmicroenvironment and be utilized by anaerobic microorganismsas nutrient substance. Simultaneously, the acidity (as CaCO3) ofanaerobic digesters with LMP concentrations (no less than 6.0 g/L)was measured to be 350, 250 and 300 mg/L, respectively. Theywere lower than those (3103 and 978 mg/L) for the control andLMP concentration of 2.0 g/L. Low concentration of acidity wasattributed to the neutralization by a correspondingly high alkalin-ity and buffer capacity produced during the anaerobic process. Itindicated that high acidity derived from VFAs accumulation couldbe reduced and relieved by controlling LMP addition, where themicroenvironment was created to be more suitable for methano-gens growth. Moreover, carbonate and LMP have a positive effecton H2 and acetic acid production, which was likely attributed tobuffer capacity in pH (Liu et al., 2012; Zhang et al., 2013b). Itwas also observed that the buffer capacity formed in digestion ofthe control and LMP concentration of 2.0 g/L seemed not to beenhanced due to an obvious pH decrease. Higher LMP concentra-tion could maintain a relatively high ammonia concentration,and further enhanced the buffer capacity combined with ammoniain reverse (Fig. 5). However, high alkalinity concentration of7197 mg/L meant that the methanogen bacterial activity wasinhibited by toxic effect of alkalinity from LMP, which was higherthan 6500 mg/L (Yenigun and Demirel, 2013).
3.4. Effect of LMP addition on methanogenic groups
Some metal elements from LMP (e.g., Ca, Na, Fe, Mg, and K) arepossible to be released slowly into substrates, and participate inacid–base balances as well as microbial growth during anaerobicdigestion of FW. Metal ions have been detected as functional resi-due from one-third of all enzymes and cations are known for theirrole in membrane stability (Dedyukhina and Eroshin, 1991). Finalconcentrations of the five inorganic elements (Ca, Mg, Na, K andFe) shown in Table 4, are significantly positive correlations, indi-cating a strong influence on major metabolites and morphologyof CH4-producing bacteria. Compared with the control, the traceelements supplied from LMP can increase the process stability ofanaerobic digestion of FW, and the highest CH4 yield of272.8 mL/g-VS was achieved (Fig. 2 and Table 2). It indicates thatan improvement of electron transfers through some combinationsbetween enzymatic activity and inorganic materials. Besides, CH4
production was improved with avoiding the production of foamingby using Ca and Mg salts as energy supplements (Yadvike et al.,2004). Zhang et al. (2011) also observed the similar phenomenonthat, a high methane yield of 396 mL/g-VS was obtained in along-term anaerobic digestion of FW with no significant VFAsaccumulation by supplementing piggery wastewater with traceelements, such as Na, Mg, Al, Zn, Fe, Cu K, Ca and Mn that arerequired for methanogens like Methanococcoides methylutens. Fur-thermore, the present work further demonstrated that a slightaddition of LMP to anaerobic digestion showed a feasible imple-ment approach to use as buffer and inorganic nutrients due toLMP rich in CaCO3 and trace amounts of other elements, whichfavor methane evolution.
In addition, both resource availability and environmentalfactors are key driving forces in microbial community dynamicsof mesophilic anaerobic digestion (Supaphol et al., 2011). It waswell known that several methanogens species such as coccus-typemethanogen, sarcina-type methanogen and Methanobrevibacter inanaerobic environment could exist and synergistically producemethane from different substrates such as acetate, propionate,butyrate and formate as well as H2/CO2. As it reported, Methano-bacterium uliginosum identified as an acid-tolerant methanogenhas been investigated to grow at a pH range of 6.0–8.0 (König,1984). It was found that as shown in the morphology of methano-gens at final condition, Methanobacteria were employed to be dom-inated in the control digester, except for small amounts ofMethanobrevibacter. By contrast, with LMP addition, this anaerobe,an acid-tolerant and hydrogenotrophic methanogen, was culti-vated and becoming the dominant bacterial communities in thefermentative process, along with a small amount of coccus-typeand sarcina-type methanogens. All the CH4-producing bacteriawere observed with neither flagella nor polar fibrils. The methano-genic groups in digester with LMP concentration of 14 g/L weresurrounded by LMP particles. It revealed that CH4-producingbacteria might be hindered with an excess concentration of LMPcompared to those with other LMP concentrations (not more than10.0 g/L).
4. Conclusions
LMP addition to FW anaerobic digestion enhanced process sta-bility and methane production, and improved the speed balance ofproducing acid and methane under a wide range of LMP concentra-tions (6.0–14 g/L). The optimum LMP concentration was 10 g/L,corresponding to the methane yield of 272.8 mL/g VS. This wasattributed to the existence of Ca, Na, Mg, K, Fe, and CaCO3 in LMPthat participated in the acid–base balance and supplemented inor-ganic nutrient, allowing high organic loads in batch digestion.However, More attentions should be paid to practical applicabilityand molecular biology of FW anaerobic digestion stabilized byLMP.
Acknowledgements
The authors gratefully acknowledge the Project of ShandongProvince Science and Technology Development Program(2013GGA11011), Ji’nan Science and Technology DevelopmentProgram (201201136) and Shandong Province Higher EducationalScience and Technology Program (J09LB11) for their financialsupport, as well as assistance of Qilu University of Technology.
References
APHA, 2005. Standard methods for the examination of water and wastewater,Twenty-first ed. American Public Health Association (APHA), Washington, DC.
Appels, L., Baeyens, J., Degrève, J., Dewil, R., 2008. Principles and potential of theanaerobic digestion of waste-activated sludge. Prog. Energy Combust. 34, 755–781.
Chynoweth, D.P., Owens, J.M., Legrand, R., 2001. Renewable methane fromanaerobic digestion of biomass. Renewable Energy 22, 1–8.
J. Zhang et al. / Bioresource Technology 170 (2014) 270–277 277
Dedyukhina, E.G., Eroshin, V.K., 1991. Essential metal ions in the control ofmicrobial metabolism. Process Biochem. 26, 31–37.
El-Mashad, H.M., McGarvey, J.A., Zhang, R., 2008. Performance and microbialanalysis of anaerobic digesters treating food waste and dairy manure. Biol. Eng.1, 235–244.
El-Mashad, H.M., Zhang, R., 2010. Biogas production from co-digestion of dairymanure and food waste. Bioresour. Technol. 101, 4021–4028.
Forster-Carneiro, T., Pérez, M., Romero, L.I., 2008. Influence of total solid andinoculum contents on performance of anaerobic reactors treating food waste.Bioresour. Technol. 99, 6994–7002.
Jarrel, K.F., Kalmokoff, M.L., 1988. Nutritional requirements of the methanogenicarchaebacteria. Can. J. Microbiol. 34, 557–576.
Kim, D.H., Kim, M.S., 2013. Development of a novel three-stage fermentation systemconverting food waste to hydrogen and methane. Bioresour. Technol. 127, 267–274.
Kim, H.W., Han, S.K., Shin, H.S., 2003. The optimisation of food waste addition as acosubstrate in anaerobic digestion of sewage sludge. Waste Manage. Res. 21,515–526.
Kim, D.H., Kim, S.H., Kim, H.W., Kim, M.S., Shin, H.S., 2011. Sewage sludge additionto food waste synergistically enhances hydrogen fermentation performance.Bioresour. Technol. 102, 8501–8506.
König, H., 1984. Isolation and characterization of Methanobacterium uliginosum sp.nov. from marshy soil. Can. J. Microbiol. 30, 1477–1481.
Lay, J.J., Li, Y.Y., Noike, T., 1998. The influence of pH and ammonia concentration onthe methane production in high-solids digestion processes. Water Environ. Res.70, 1075–1082.
Lay, J.J., Fan, K.S., Chang, J., Ku, C.H., 2003. Influence of chemical nature of organicwastes on their conversion to hydrogen by heat–shock digested sludge. Int. J.Hydrogen Energy 28, 1361–1367.
Li, L., Li, D., Sun, Y., Ma, L., Yuan, Z., Kong, X., 2010a. Effect of temperature and solidconcentration on anaerobic digestion of rice straw in South China. Int. J.Hydrogen Energy 35, 7261–7266.
Li, R., Chen, S., Li, X., 2010b. Biogas production from anaerobic co-digestion of foodwaste with dairy manure in a two-phase digestion system. Appl. Biochem.Biotech. 160, 643–654.
Liu, T., Sung, S., 2002. Ammonia inhibition on thermophilic aceticlasticmethanogens. Water Sci. Technol. 45, 113–120.
Liu, Q., Zhang, X.L., Jun, Z., Zhao, A.H., Chen, S.P., Liu, F., Tai, J., Liu, J.Y., Qian, G.R.,2012. Effect of carbonate on anaerobic acidogenesis and fermentative hydrogen
production from glucose using leachate as supplementary culture underalkaline conditions. Bioresour. Technol. 113, 37–43.
Martins, F.M., Martins, J.M., Ferracin, L.C., Cunha, C.J., 2007. Mineral phases of greenliquor dregs, slaker grits, lime mud and wood ash of a Kraft pulp and paper mill.J. Hazard. Mater. 147, 610–617.
Mshandete, A., Kivaisi, A., Rubindamayugi, M., Mattiasson, B., 2004. Anaerobic batchco-digestion of sisal pulp and fish wastes. Bioresour. Technol. 95, 19–24.
Nielsen, H.B., Angelidaki, I., 2008. Strategies for optimizing recovery of the biogasprocess following ammonia inhibition. Bioresour. Technol. 99, 7995–8001.
Niu, Q., Qiao, W., Qiang, H., Li, Y., 2013. Microbial community shifts and biogasconversion computation during steady, inhibited and recovered stages ofthermophilic methane fermentation on chicken manure with a wide variationof ammonia. Bioresour. Technol. 146, 223–233.
Parawira, W., Murto, M., Zvauya, R., Mattiasson, B., 2004. Anaerobic batch digestionof solid potato waste alone and in combination with sugar beet leaves. RenewEnergy 29, 1811–1823.
Supaphol, S., Jenkins, S., Intomo, P., Waite, I., O’Donnell, A.G., 2011. Microbialcommunity dynamics in mesophilic anaerobic co-digestion of mixed waste.Bioresour. Technol. 102, 4021–4027.
Wang, Q., Peng, L., Su, H., 2013. The effect of a buffer function on the semi-continuous anaerobic digestion. Bioresour. Technol. 139, 43–49.
Yadvika, Santosh, Sreekrishnan, T.R., Kohli, S., Rana, V., 2004. Enhancement ofbiogas production from solid substrates using different techniques – a review.Bioresour. Technol. 95, 1–10.
Yenigun, O., Demirel, B., 2013. Ammonia inhibition in anaerobic digestion: a review.Process Biochem. 48, 901–911.
Zhang, R., El-Mashad, H.M., Hartman, K., Wang, F., Liu, G., Choate, C., Gamble, P.,2007. Characterization of food waste as feedstock for anaerobic digestion.Bioresour. Technol. 98, 929–935.
Zhang, L., Lee, Y.W., Jahng, D., 2011. Anaerobic co-digestion of food waste andpiggery wastewater: focusing on the role of trace elements. Bioresour. Technol.102, 5048–5059.
Zhang, Y., Banks, C.J., Heaven, S., 2012. Co-digestion of source segregated domesticfood waste to improve process stability. Bioresour. Technol. 114, 168–178.
Zhang, C., Xiao, G., Peng, L., Su, H., Tan, T., 2013a. The anaerobic co-digestion of foodwaste and cattle manure. Bioresour. Technol. 129, 170–176.
Zhang, J., Wang, Q., Jiang, J., 2013b. Lime mud from paper-making process additionto food waste synergistically enhances hydrogen fermentation performance.Int. J. Hydrogen Energy 38, 2738–2745.