anaerobic digestion and power generation: … jdreyfus.pdf · anaerobic digestion and power...
TRANSCRIPT

ANAEROBIC DIGESTION AND POWER GENERATION: THE SUCCESS OF THE CO-
DIGESTION PLANT AT GLENELG WWTP
Jennifer Dreyfus
1, Stacey Smith
2, Dan Squire
1, Ian Mackenzie
1, Tim Mengler
1, Shannon Uern
2, Paddy
Atkinson 1
1. Allwater, Adelaide, SA, Australia
2. SA Water, Adelaide, SA, Australia
ABSTRACT A co-digestion facility at a municipal Wastewater Treatment Plant in Adelaide was constructed and commissioned in July 2013 following the completion of a research program conducted by SA Water. SA Water and Allwater have worked closely together to ensure the efficient and effective implementation of this relatively new technology. Regular tanker loads of industrial waste are received at the plant to boost biogas production and hence power generation for use onsite. The implementation of co-digestion has been a success with an increase in the amount of power generated from an average 55% up to an average of 75%, without negatively impacting on the process. INTRODUCTION Glenelg Wastewater Treatment Plant (WWTP), located in Adelaide (South Australia), is one of six WWTPs operated and maintained by Allwater (a Joint Venture between Suez Environnement, Degremont and Transfield Services) on behalf of SA Water. The WWTP treats 50 ML/day of primarily domestic wastewater and has five anaerobic digesters, two of which have floating covers, allowing for biogas storage. The anaerobic digestion process at Glenelg WWTP produces biogas converted onsite by three combustion engines for electricity generation. Historically the digesters were only fed with primary sludge and thickened secondary sludge drawn from the wastewater treatment process, and produced enough biogas to provide approximately 55% of the power used onsite. The success of a number of research projects on co-digestion of industrial high strength organics to boost biogas production in anaerobic digesters driven by SA Water, led to the construction in 2012-13 of a fully automated co-digestion plant at the Glenelg WWTP. This plant is the first of its kind in Australia and this paper describes the co-digestion process and the results that have been achieved at Glenelg WWTP.
PROCESS Anaerobic Digestion The anaerobic digestion process is used to stabilise sludges generated from primary and secondary treatment and involves the decomposition of organic waste into methane and carbon dioxide (see Figure 1). The sludge retention time (SRT) in the digesters is critical to ensure a good degradation of the sludge. At Glenelg WWTP the average SRT is 18 days. This decomposition occurs in a number of stages involving facultative and anaerobic bacteria. The most sensitive bacteria are the obligate anaerobes, methanogens in Stage 4 of the process (see Figure 1). The bacteria are very sensitive to pH and temperature change so in order to achieve the optimum biogas production it is important to maintain a pH between 6.8 and 7.2 in the digesters and a temperature of 35 degrees C. The longest stage of the process is Stage 1 during which the complex organic materials are converted into soluble organic material by bacterial extra-cellular enzymes. The soluble organic material can then enter the bacterial cells and be utilised as a food source. The time required for that stage is limiting for the anaerobic digestion process and biogas production. Having five anaerobic digesters of 3.2ML volume each, Glenelg WWTP has excess capacity to take more load to the digesters, and with floating covers on two of the anaerobic digesters, more biogas storage is also available. Co-Digestion Adding high strength trade waste to the anaerobic digester has two main advantages: (i) it can boost biogas production to produce more energy and (ii) it also avoids overloading the sewer and secondary treatment systems with trade waste. Many industries in South Australia produce liquid waste streams of high organic content but in volumes that are in most cases too small to allow an economical implementation of in-house treatment. The wastes would therefore be disposed of to sewer, land based applications or land fill. However, each of these disposal methods has associated environmental impacts. For

example, delivering the waste to compost or landfill takes up valuable land space and the process releases greenhouse gases to the atmosphere. In addition, discharging high content organic waste to the sewer network can damage infrastructure due to the highly organic and corrosive nature of the waste. The high level of organics is also difficult to treat at WWTPs, as it may overload the process due to high Biochemical Oxygen Demand (BOD) resulting in more energy required to treat the waste. With projections of increasing energy demands, and associated costs at WWTPs, SA Water identified a need to reduce the utilisation of external energy resources and maximise onsite energy generation. Therefore in 2009, SA Water commenced their own research program on the co-digestion of readily available industrial high strength organic waste (or trade waste) with the sludge from Glenelg WWTP to maximise the efficiency of biogas production from the anaerobic digesters. A number of bench scale and full scale trials were conducted over a four year period focusing on the addition of different trade waste substrates (such as whey, beer, coke, wine…) to the thickened sludge, at different rates, and the impact they were having on biogas production and quality (Krampe, 2010a; Krampe, 2010b; Kalatzis, 2012). SA Water approached companies known to produce high organic loadings located in the sewer catchments within the vicinity of Glenelg WWTP to offer an alternative and cost effective disposal option. Due to the small volumes from different suppliers and the opportunity to collate a database on the suitability of different substrates, a wide range of substrate types were initially analysed. Each substrate being considered for use is subjected to an extensive series of testing before being accepted for use at the co-digestion facility. The testing is used to identify any unwanted contaminants and organic composition that would impact on the digesters. Each substrate is analysed to obtain base results for quality data such as biochemical oxygen demand, chemical oxygen demand, grease, total dissolved solids, total nitrogen and total phosphorous (see Table 1). The substrates are then anaerobically digested in an Eudiometer (a small laboratory scale pilot plant, which mimics performance of an anaerobic digester – see Figure 2). The Eudiometer enables a determination to be made of the percentage of waste that can be used in the digester by assessing the success of the substrate to produce biogas with minimal impact to the digester sludge after a retention time of 20 days, as would occur under normal digester cycles at Glenelg WWTP. As those trials were successful, a full scale plant was built and started to be operational in July 2013. The co-digestion plant consists of a trade waste unloading station, retrofitted with a filter to prevent any solids entering, and two 30kL storage tanks
with recirculation pumps to mix the substrate in the tank. The stored substrate can then be added to the thickened sludge tank at a controlled rate through a variable speed transfer pump from where it is pumped directly to the digesters. The addition of substrate to the thickened waste activated sludge (TWAS) has to be carefully controlled in order to maintain stable operation of the digesters and not upset the methanogenic bacteria which are very sensitive to pH and loading changes. Overloading of digesters with very high strength waste can cause excess production of gas which could result in methane being expelled to the atmosphere. The SCADA system has been developed to allow different addition rates depending on the substrate received, as well as transferring substrates at night or early in the morning to ensure the biogas production is boosted when the onsite power demand is highest (see Figure 3). The pH is also monitored when the substrate is transferred to the thickened sludge in order to avoid any contamination or shock load. Often different substrates are mixed in the receival tank, which allows the pH to be balanced before transfer to the thickened sludge. The co-digestion plant has been online for more than a year. Significant improvements to the power generation have occurred during this period, however the SA Water Trade Waste Team continue to seek new customers in order to increase the output of the plant to full capacity and thus maximise gas production. RESULTS AND DISCUSSION Biogas and Energy Production The volumes of trade waste being delivered monthly to the plant are now consistently above 1000 kL, and represents on average 6% of the flow going into the digesters. Figure 4 shows that the volume of biogas produced increases with the volume of trade waste delivered.
The benefits of the co-digestion are also observed in Figure 5 where the amount of energy generated with biogas has remained above 65% since the co-digestion plant was commissioned, reaching up to 84% in October 2014. This percentage may keep increasing as the co-digestion plant is not being used at its full capacity.
Figure 5 also shows that the amount of natural gas used by the engines has decreased, representing great savings for the site. The engines are fuelled by either biogas or natural gas. Biogas is used primarily, but should biogas production not meet the

demand for the engines, their operation is supplemented by natural gas. Ongoing improvements to the controls of the automated co-digestion plant will favour biogas use over natural gas. The co-digestion plant has been a very successful addition to the Glenelg WWTP with 13.7ML of trade waste received, and an extra 1,355 MWh of power has been generated onsite since its commissioning. Digester Performance At the Glenelg WWTP the primary sludge is directly fed to the digesters, the Waste Activated Sludge (WAS) is thickened through Disolved Air Floatation, and the trade waste is then trickle fed to the thickened sludge prior to being added to the digesters. The average temperature in the digesters
is 35ᴼC and the average retention time is 18 days.
The addition of high strength organic waste to the digester sludge could have a negative impact on the performance of the digesters and the quantity of biosolids produced. However, since the commissioning of the co-digestion plant, up to 6% by volume of substrate has been added to the digesters and the stability of the digesters has not been impacted: the alkalinity as calcium carbonate remains stable around 2500mg/L, and the pH is consistenly at 6.9 -7.
In addition, it has also been observed that the percentage of volatile solids destruction has not been compromised with the co-digestion (see Figure 6). Until December 2013, only four digesters were online, which could explain the lower Volatile Solids reduction of the digesters prior to this date. However, once all of the digesters came online and stabilised, Figure 4 shows that the performance has been close to the estimated performance using the empirical equation from Liptack (1974):
Vd=13.7ln(SRTdes)+18.9
Where Vd =volatile solids destruction, %
SRT= time of digestion, d
The volatile solids destruction has not been impacted, with the amount of volatile matter going in the digesters increasing slightly with the addition of high strength substrate, and this is observable on the volatile solids to total solids ratio coming out of the digesters (see Figure 7). Over the last 10 years the VS/TS ratio has been varying between 0.6 and 0.7; since high volumes of trade waste have been received the ratio has been constantly at 0.7.
There has also been minimal change to the quality of the sludge produced since implementation of the
co-digestion facility. Furthermore the sludge is not dewatered onsite, it is pumped straight from the digesters to the Bolivar WWTP sludge lagoons which is located 28 km north of Glenelg WWTP. To pump the sludge to the Bolivar lagoons for evaporation is of tremendous benefit as the trade waste substrates are often very high in nitrogen and phosphorus. If co-digestion was to be implemented at any plant dewatering their sludge onsite and returning the dewatering effluent back to the head of the plant, the additional nitrogen load would need to be considered. Solutions exist to reduce the dewatering effluent nitrogen concentration before being returned, such as the Anammox process that is being trialled at the outlet of the centrifuge of the Bolivar WWTP (Mouilleron et al, 2014).
The co-digestion facility has had only beneficial impacts on energy cost and production so far without impacting negatively on the process.
CONCLUSION
The installation, operation and optimisation of a co-digestion plant at Glenelg WWTP has led to a reduction in imported power and natural gas use at Glenelg WWTP. This has reduced the plant’s carbon footprint by producing up to 84% of the power required onsite, without compromising the performance of the digesters.
Further improvements in controls and electrical infrastructure will continue to increase savings through maximising the biogas use and exporting excess power to the grid.
The success of the co-digestion facility at Glenelg WWTP has also led to the development of the design of a trade waste receival station for the Bolivar WWTP, the largest WWTP in South Australia
ACKNOWLEDGEMENTS
The Glenelg WWTP operations and maintenance team is acknowledged for the great work they do daily to maintain the co-digestion facility. The Trade Waste team from SA Water is acknowledged for always looking for new customers and undertaking laboratory tests to ensure the substrates will produce a optimum amount of biogas, and be compatible with the digesters at Glenelg.

REFERENCES Krampe, J. Richards, D. Willis, M. Tresp, S. Le Boulch, C. (2010a), Co-Fermentation of Wastewater Sludge with Trade Wastes, SA Water Krampe J., Willis M., Richard D. (December 2010b) Co-digestion of high strength organic trade waste with wastewater sludge, WATER
Kalatzis, N., (2012), Co digestion of waste water sludge with trade wastes, SA Water, Adelaide, SA, Australia
Mouilleron, I., Hyde, K., van den Akker, B., Rinck-Pfeiffer, S., Keegan, A., Krampe, J., Lacoste, L., Graveleau, L., (2014), Managing Ammonia Load Variations on the Deammonification Process – Lessons Learnt from the Demonstration Scale, OzWater Conference, Brisbane.

Carbohydrates Fats Proteins
Stage 1: Hydrolysis
Sugars Fatty Acids Amino Acids
Carbonic acids and alcohol
Hydrogen Carbon Dioxide
Ammonia
Stage 2: Fermentation
Acetic Acid Carbon Dioxide
Hydrogen
Stage 3: Acetogenesis
Carbon Dioxide Methane
Stage 4: Methanogenesis
Figure 1: Anaerobic Digestion Process
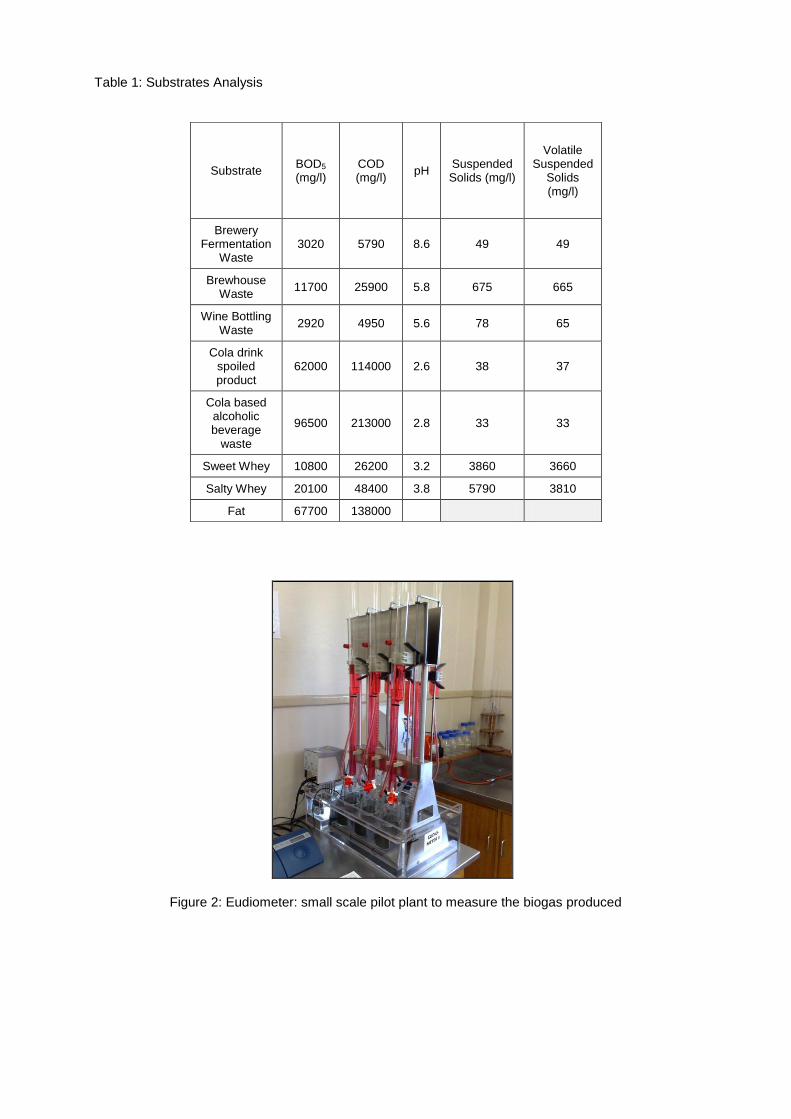
Table 1: Substrates Analysis
Figure 2: Eudiometer: small scale pilot plant to measure the biogas produced
Substrate BOD5 (mg/l)
COD (mg/l)
pH Suspended Solids (mg/l)
Volatile Suspended
Solids (mg/l)
Brewery Fermentation
Waste 3020 5790 8.6 49 49
Brewhouse Waste
11700 25900 5.8 675 665
Wine Bottling Waste
2920 4950 5.6 78 65
Cola drink spoiled product
62000 114000 2.6 38 37
Cola based alcoholic beverage
waste
96500 213000 2.8 33 33
Sweet Whey 10800 26200 3.2 3860 3660
Salty Whey 20100 48400 3.8 5790 3810
Fat 67700 138000

Figure 3: SCADA control timer to be able to add substrate when the site is not attended
150
170
190
210
230
250
270
290
0
200
400
600
800
1000
1200
1400
1600
Trad
e W
aste
Vo
lum
e r
ece
ive
d (k
L/m
on
th)
Trade waste volume
Volume Gas
Produced
Vo
lum
e o
f Bio
gas Pro
du
ced
(*1
0^
3m
3/m
on
th)
Figure 4: Volume of Biogas Produced and Trade waste volume received since the Co digestion plant commissioning

285
313
355
325
294
218
158
129
129
117
118
165
241
264
277
159
113
115
139
123
116
146
212
297
346
347
229
264
273 221 315
261
219 196
215
148
141
163
185
236
231
189 234
182
148
126
114
64
30
50
48
84
46
3
497
468
43
9
456
473
49
1 455
48
5
53
0
546
54
1
54
7
542
54
8
472
501 52
6
55
3 56
6
59
3
590
569
58
0
550
535
0
10
20
30
40
50
60
70
80
90
0
200
400
600
800
1000
1200
% o
nsi
te g
en
era
tio
n/m
on
th
MW
h/M
on
th
Total Imported Power(MWh/month) Natural Gas Power Produced(MWh/month)
Biogas Power Production(MWh/month) % Onsite Generation
Figure 5: Onsite power generation and Power usage at Glenelg WWTP
0
10
20
30
40
50
60
70
80
90
% V
S re
du
ctio
n
VS reduction in digesters
Theoritical VS reduction
Figure 6: Volatile solids reduction in the digesters compared to the theoretical VS reduction at equivalent retention time

0
0.1
0.2
0.3
0.4
0.5
0.6
0.7
0.8
0.9
% V
S/TS
VS/TS digested sludge
Figure 7: VS/TS ratio of the digested sludge