anaerobic co-digestion of high strength food waste with … · 2020-01-20 · anaerobic digestion...
TRANSCRIPT
Anaerobic Co-Digestion of High Strength Food Waste with Municipal Sewage Sludge: An
Assessment of Digester Performance and Gas Production
Ankit Bidhan Pathak
Thesis submitted to the faculty of the Virginia Polytechnic Institute and State University in
partial fulfillment of the requirements for the degree of
Master of Science
In
Civil and Environmental Engineering
Gregory D. Boardman
John T. Novak
Husen Zhang
April 29, 2014
Blacksburg, VA
Keywords: Anaerobic digestion, High-Strength Waste (HSW), Food Waste, organic loading,
failure, gas production
Copyright© 2014, Ankit Pathak
Anaerobic Co-Digestion of High Strength Food Waste with Municipal Sewage Sludge: An
Assessment of Digester Performance and Gas Production
Ankit Bidhan Pathak
Abstract
Anaerobic digestion is perhaps the simplest and most widely accepted method for solids and
residuals management in the field of wastewater treatment. An emerging trend with regard to
anaerobic digestion is the addition of additional organic or industrial wastes rich in degradable
material (COD) that can lead to increased methane production and reduce the energy demand of
the facility.
The objective of this research was to evaluate the effect of adding significant quantities (>20% of
feed volume) of High – Strength Food Wastes (HSW) to digesters treating conventional municipal
sludge by monitoring key parameters such as pH, influent and effluent solids, ammonia, Volatile
Fatty Acids (VFAs) and alkalinity. Daily gas production was also closely monitored. Four
digesters were set up and exposed to different food waste loading rates. A comparison was drawn
between the performance of these reactors, one of which was fed only with sewage sludge and
served as the control. If the bacteria in the system are able to metabolize this additional COD, it
should show up as an increase in gas production with little or no increase in effluent COD.
Ammonia is another crucial parameter that needs to be closely watched as it can have an inhibitory
effect on methane production. As part of this study, the impact of addition of free ammonium
(simulating high ammonium concentration in the feed sludge or food waste) on digester
performance was assessed. The digesters were closely monitored for signs of poor performance or
failure.
iii
Acknowledgements
This project was performed using sludge supplied by Opeqon Water Reclamation Facility
(OWRF), a domestic wastewater treatment plant in Winchester, Virginia. The plant is interested
in setting up anaerobic digesters and is exploring the possibility of co-digestion of conventional
sludge with high-strength food wastes from industries in the vicinity. Black & Veatch are the
consultants working with OWRF for this project. This research project was funded by Black &
Veatch, OWRF and the city of Winchester. I thank them for approaching Virginia Tech with this
project, which was funded via funding number 457915.
I must sincerely thank Robert Wimmer and Mike Hanna from Black & Veatch for their inputs on
this project. I am equally grateful to Don Riggleman and Richard Wadkins at OWRF for their
promptness and cooperation with regard to shipping of sludge and food wastes to Virginia Tech
for our use.
I owe a debt of gratitude to my advisors Dr. Gregory D. Boardman and Dr. John T. Novak for their
continued guidance. I consider myself fortunate to have worked with both of them as they are both
renowned experts in the field of wastewater treatment, which has always held my interest. I am
thankful to have been mentored by them. I would also like to thank Dr. Husen Zhang for serving
on my committee. I have had the good fortune to interact with him and often look to him for
guidance and advice.
I want to take this opportunity to express my gratitude to Julie Petruska and Jody Smiley for
training me to carry out the analyses that I needed for this project.
I feel I need to thank Kuang Zhu, who familiarized me with the running of anaerobic digesters and
helped me set them up. I would also like to thank Ramola Vaidya, who joined me on this project
during the last few months and displayed exemplary diligence in the lab. I express my gratitude to
Siddhartha Roy who kept the digesters running when I needed to get out of town.
Last but not least, I would like to thank all my friends and my family for standing by me through
the good times and the bad.
iv
Table of Contents
Page
Abstract
Acknowledgements ...................................................................................................................... iii
Table of Contents ......................................................................................................................... iv
List of Tables ................................................................................................................................ vi
List of Figures .............................................................................................................................. vii
Attribution .................................................................................................................................. viii
CHAPTER 1: Introduction ...........................................................................................................1
Project Objectives .......................................................................................................................1
CHAPTER 2: Literature Review .................................................................................................3
Types of Biosolids .......................................................................................................................3
Introduction to Anaerobic Digestion ...........................................................................................3
Parameters vital to digester performance ....................................................................................4
Anaerobic co-digestion ...............................................................................................................7
References .................................................................................................................................12
CHAPTER 3: Manuscript 1
An Assessment of co-digestion of High – Strength Food Processing Wastes (HSWs) with
municipal sewage sludge .............................................................................................................16
Abstract ......................................................................................................................................17
Introduction ................................................................................................................................18
Materials and Methods ...............................................................................................................22
Results and Discussion ...............................................................................................................28
Conclusion ..................................................................................................................................38
References ..................................................................................................................................39
v
CHAPTER 4: Manuscript 2
Loading limits and digester stability for co-digestion of High Strength Wastes (HSWs) with
municipal sewage sludge..............................................................................................................41
Abstract ......................................................................................................................................42
Introduction ................................................................................................................................43
Materials and Methods ...............................................................................................................46
Results and Discussion ...............................................................................................................53
Conclusion ..................................................................................................................................67
References ..................................................................................................................................68
CHAPTER 5: Conclusion ...........................................................................................................70
Appendix A: Scatter plots of raw data .......................................................................................72
Appendix B: Statistical analysis of gas production using JMP 10.0 .......................................80
Appendix C: Statistical analysis of VS destruction using JMP 10.0 .......................................81
Appendix D: COD balance at highest HSW loading (Day 240 – 300) ....................................82
vi
List of Tables
Page
2.1 Summary drawn from literature survey ..................................................................................11
3.1 Table showing the nature of the Kraft juice processing waste and cheese whey waste .........23
3.2 Steady-state, design composition of inflow into digesters provided by OWRF .....................24
3.3 Analysis of pH values recorded for all four digesters over the period of operation ...............29
3.4 Average influent and effluent VS and average VS destruction after day 70 ...........................30
3.5 NH3-N levels in all four digesters during different phases of digester operation ...................33
3.6 Statistical analysis of gas production using JMP 10.0 .............................................................36
3.7 Comparison of average COD loading and average gas production ........................................36
3.8 Average digester gas composition ..........................................................................................37
4.1 Nature of the Kraft juice processing waste and feta cheese whey waste ................................47
4.2 Nature of the new Kraft juice processing waste and feta cheese whey waste ........................47
4.3 Steady – state, design composition of inflow into digesters provided by OWRF ..................48
4.4 Average influent and effluent NH3-N concentration ..............................................................59
4.5 Average gas production obtained from each digester .............................................................60
4.6 Average digester gas composition obtained from each digester .............................................61
vii
List of Figures
Page
3.1 Feeding Regime used over the period of digester operation ...................................................24
3.2 Plots of Digester pH vs Time ..................................................................................................28
3.3 Plots of tCOD (mg/L) vs time (days) .......................................................................................31
3.4 Average COD destruction during various phases of digester operation .................................32
3.5 Average Total VFA (mg/L) values .........................................................................................34
3.6 Data for Daily gas production (L/day of gas produced in 24 hours vs Time) .........................35
4.1 Timeline depicting variations made in digester feed over the course of operation ................49
4.2 Digester pH vs time ................................................................................................................54
4.3 Influent and effluent VS variation with time ..........................................................................55
4.4 Comparison of organic loading (in terms of VS) over the course of digester operation ........56
4.5 Comparison of organic loading (in terms of COD) over the course of digester operation .....57
4.6 Bar chart showing average COD reduction after day 181, under maximum HSW loading ...58
4.7 NH3-N values in response to step changes in influent NH3-N for digesters 2 and 3..............59
4.8 VFA concentration vs time plots ............................................................................................62
4.9. Alkalinity vs time ...................................................................................................................63
4.10 Analysis of VFA and alkalinity measurements over the period of failure of digester 4 .......65
4.11 Plots of parameters showing failure of digester 4 ..................................................................66
A.1 Plot showing digester pH variation with time ........................................................................72
A.2: TS and VS variation over the time of digester operation ......................................................73
A.3: Total COD vs Time over the period of digester operation ...................................................75
A.4: TAN vs time for digester operation ......................................................................................76
A.5: Gas Production (L/day) vs Time ............................................................................................77
A.6: Total VFAs (as mg/L HAc) vs Time ....................................................................................78
A.7: Alkalinity (as mg/L as CaCO3) vs Time ..............................................................................79
B.1: Statistical analysis of gas production using JMP 10.0 ...........................................................80
C.1: Statistical analysis of % VS destruction using JMP 10.0.......................................................81
D.1: COD Balances for digesters 1 and 2 ......................................................................................82
D.2: COD balances for digesters 3 and 4 .......................................................................................83
viii
Attribution
Dr. Gregory D. Boardman, Ph.D., P.E., DEE, F.ASCE, Professor, Department of Civil and
Environmental Engineering, Virginia Polytechnic Institute and State University, Blacksburg, VA
– 24061
Dr. John T. Novak, Ph.D., P.E., Professor Emeritus, Department of Civil and Environmental
Engineering, Virginia Polytechnic Institute and State University, Blacksburg, VA – 24061
Robert Wimmer, P.E., Wastewater Process Specialist, Water Division, Black & Veatch
Corporation, Finksburg, MD – 21048
Mike Hanna, P.E., Project Manager, Black and Veatch Corporation, Finksburg, MD - 21048
Drs. Boardman and Novak, Robert Wimmer and Mike Hanna are duly credited as co-authors in
chapters 3 and 4 of this document. Dr. Boardman served as principal investigator for this project.
All the authors contributed equally to the ideas and the direction of this research.
Dr. Boardman and Dr. Novak were responsible for deciding most of the tests that were to be carried
out. They also decided the methods that would be used to monitor the parameters of interest. The
served as PI and co – PI on the project, respectively.
Robert Wimmer and Mike Hanna are consultants working with Black and Veatch Corporation.
They identified the goals of the study and provided inputs from time to time. Regular reports of
the progress being made during the study were reviewed by them as well.
1
Chapter 1
Introduction
Anaerobic digestion of domestic sewage sludge has the dual advantage of producing an effluent
that is fit for land application, while simultaneously generating biogas (primarily methane) that
can be used to generate energy and significantly reduce a wastewater treatment facility’s
expenditure on power. The aim of this study was to evaluate the impact of addition of High –
Strength food processing wastes (HSWs) from juice and cheese processing industries to digesters
being fed with domestic sewage sludge.
The sludge that was fed into the digesters was obtained from Opeqon Waste Reclamation facility
(OWRF) in Winchester, VA. Every week, 5 gallons of primary sludge and 3 gallons of waste
activated sludge (WAS) were shipped for use in this study. The food wastes fed into the digesters
were: (1) Juice processing waste from Kraft Foods Group supplied by OWRF and (2) Feta Cheese
Whey supplied by Gloversville-Johnstown Wastewater Treatment Facility, Johnstown, NY. Both
these food processing wastes were shipped to Virginia Tech.
Project Objectives
The project objective was to evaluate the impact of addition of HSWs from juice and cheese
processing industries to digesters being fed with domestic sewage sludge. Four digesters were set
up and fed with sludge on a daily basis for a total duration of about 11 months. Each of these
digesters received a different feed regime. Digester 1 served as the control and was fed with
municipal sludge only (in the ratio 60:40 of primary to WAS). Digesters 2, 3 and 4 received
varying amounts of food processing wastes and their performance was closely and regularly
assessed.
Gas production was the major parameter being monitored. It was hoped that the higher COD being
fed as part of the food waste would be metabolized by the anaerobic and methanogenic bacteria
present in the digesters, leading to increased gas production. Several parameters that indicate
2
healthy digester functioning were also monitored. Reactor pH is crucial for healthy functioning of
anaerobic systems and was regularly measured. The total solids (TS) and volatile solids (VS)
content of the sludge fed into the digesters and the effluent withdrawn were recorded. The total
chemical oxygen demand (tCOD) and soluble chemical oxygen demand (sCOD) for the influent
sludge and the digester effluent were regularly measured.
The gas produced by the digesters was analyzed for methane content. The percentage of the
produced gas that is methane is a good indicator of the health of anaerobic digesters. Influent and
effluent ammonia levels were monitored as were volatile fatty acids (VFAs) and alkalinity.
3
Chapter 2
Literature Review
Types of Biosolids
Appropriate methods must be adopted for biosolids handling and disposal based on the nature of
the biosolids in question. The regulations for biosolids disposal are dictated by the US EPA (1993).
Based on the regulations, biosolids are broadly classified into two categories:
Class A Biosolids are those in which the pathogens are reduced to levels below current detectable
levels (EPA, 1997). These can be directly dewatered and used for land application. These types of
biosolids are often thickened, dewatered and land applied (Metcalf and Eddy, 1991).
Class B Biosolids are those in which pathogen levels are “unlikely to pose a threat to public health
and the environment under specific – use conditions” (EPA, 1997). These solids cannot be sold or
directly land – applied (Metcalf and Eddy, 1991).
Introduction to Anaerobic Digestion
Anaerobic digestion of biosolids generated in a wastewater treatment plant has been carried out
for decades (Metcalf and Eddy, 1991; Grady et al., 2011). The simplest systems employ a single,
mixed reactor without any recycle stream. A hydraulic retention time (HRT) range of 10 – 30 days
(10 days being the minimum required HRT at 35 degree Celsius) is usually employed (Droste,
1997). However, HRTs of 15 – 20 days are typically used for most large – scale operations (Grady
et al., 2011). The solids retention time (SRT) is equivalent to the HRT for conventional, suspended
– growth anaerobic digesters (Droste, 1997; Grady et al., 2011, Metcalf and Eddy, 1991).
4
Based on the amount of books and literature available, it is clear that anaerobic digestion of
municipal sewage sludge is a well – studied and understood process. The sizing and design of
anaerobic digesters has been studied in detail. Anaerobic digestion is the most widely employed
method for sludge stabilization, as it puts biosolids to good use and helps to reduce the energy
expenditure of the facility significantly by generating methane gas (Metcalf and Eddy, 1991). Such
digesters need to be mixed thoroughly and good mixing is crucial to their performance and
effectiveness (Droste, 1997). Such completely mixed, suspended – growth anaerobic digesters may
be agitated by either recirculating the digester gas generated by methanogens or by providing
mechanical agitation / mixing (Metcalf and Eddy, 1991).
Parameters Vital to Digester Performance
Digester performance is a function of several variables, each of which can significantly impact the
working of the digester. These parameters have been described in great detail in several standard
textbooks and literature. They have also been elaborately described in the federal and state
regulations.
Solids Retention Time (SRT)
SRT is the effective amount of time that the influent spends in the anaerobic process. It is defined
as the ratio of reactor volume to the flow rate of material in and out of the reactor. SRT is a crucial
parameter that affects all the stages of anaerobic digestion; i.e., hydrolysis, fermentation and
methanogenesis (Metcalf and Eddy, 1991).
SRTs of as low as 10 days have been reported to work well with digesters. However, the
regulations mandate an SRT of at least 15 days for Class B pathogen reduction (EPA, 2003).
Usually, SRTs of 15 – 25 days are employed (Grady et al., 2011). It is however, universally
accepted that a certain minimum SRT is necessary for digester operation. Droste (1997) references
a study carried out by Lawrence and McCarty (1969) which concluded that a minimum SRT of 3
– 5 days under mesophilic conditions is a must for methanogens to thrive.
5
It also added that a safety factor of 3 – 20 times this value is needed for successful operation of
anaerobic digestion systems.
The US EPA Process Design Manual for Sludge Treatment and Disposal (1979) states that while
most systems work well within the typical SRT range of 15 – 25 days, longer SRTs may be
required for wastes that contain very complex compounds and hence require greater time for
stabilization.
Temperature
Based on the kind of temperature employed, anaerobic processes are classified as mesophilic and
thermophilic digestion. Mesophilic digestion employs temperatures of 30 – 40 °C, while
thermophilic digestion employs temperatures in the range of 50 – 60 °C (Droste, 1997).
Conventionally, systems are designed to operate in either the mesophilic or the thermophilic
temperature range. However, newer technologies employ multistage processes that employ
mesophilic and thermophilic digestion at different stages (Metcalf and Eddy, 1991).
A stable operating temperature is essential for digester operation as anaerobic processes tend to be
more susceptible to sensitivity in the face of temperature variations (Grady et al., 2011). WEF
(1998) recommends a variation of less than 0.5 °C/d since changes greater than 1 °C/d can have
an impact on digester performance. Droste (1997) also suggests that lack of variation in the
operating temperature is conducive to stable digester operation.
Mixing
The importance of mixing for good performance in anaerobic systems has been emphasized in
literature as well as standard textbooks. Mixing is essential to maintain homogeneity in the
digestion process and is accomplished by internal mechanical mixers, external mechanical mixers
(involving recirculation of tank contents), gas recirculation or recirculation of the material
contained in the digester via pumps (Grady et al., 2011).
Poor or inadequate mixing has been known to negatively impact digester performance and mixing
systems need to be tested for their effectiveness. The digesters themselves may be designed to
improve mixing characteristics in them, as in the case of egg – shaped digesters (Droste, 1997).
6
pH, VFAs and Alkalinity
Perhaps the foremost indicator of the health of an anaerobic system is its pH. Large fluctuations in
the reactor pH are indicative of problems with normal digester functioning. The optimal range of
pH for anaerobic digestion has been reported to be between 6.0 and 8.0, with pH values between
6.5 and 7.5 being ideal for stable digester operation (Zehnder et al., 1982).
Alkalinity is the capacity of the reactor to neutralize acid and thereby resist a lowering in pH.
According to values published by the EPA in 1979, alkalinity values for digester influent are
usually in the range of 500 – 1500 mg/L while those of the effluent are considered to be “good”
when they are in the range of 2500 – 3500 mg/L.
VFAs can build up in the reactor and cause problems. Low VFA levels are a sign that organic
material in the digester is being efficiently transformed into methane (Metcalf & Eddy, 1991).
They are usually expressed as mg/L of acetic acid and include organic acids containing 2 – 7
carbons. A VFA value of <1000 mg/L is favorable for stable digester operation (Grady et al.,
2011).
7
Anaerobic Co-Digestion
The concept of anaerobic co-digestion is one that is fast gaining ground and is beginning to make
an appearance in peer reviewed literature. Anaerobic co-digestion refers to addition of waste other
than municipal sewage sludge to conventional anaerobic digesters.
Wastes Added to Co-Digestion Processes
A wide variety of anaerobic operations have been operated with the concept of co-digestion being
employed. From available literature, it can be seen that a diverse array of wastes are amenable to
biodegradation / treatment via the medium of digestion in digesters treating municipal sewage
sludge.
Addition of the organic fractions of municipal solid wastes (commonly referred to as OFMSWs, a
category of wastes that includes organic wastes being dumped into landfills and leachate drawn
off from landfills) has been carried out with success (Agdag et al., 2005). Similar studies have
been carried out in countries like Scotland, which is implementing policies that will reduce the
amount of material allowed to be disposed of by landfilling to almost half of the current limit.
Disposal of OFMSWs by means of anaerobic co-digestion has therefore been explored as a
possible treatment option (Pahl et al., 2007).
Perhaps the most widely used type of wastes for the purpose of anaerobic co-digestion are food or
food processing wastes. Since these wastes are almost always highly biodegradable, they serve as
good candidates for degradation via anaerobic digestion. A great deal of work has been done in
studying the effects of such wastes on the performance of anaerobic systems and as a result, these
systems have been run with a good deal of success.
Within the category of food wastes, fruit and vegetable wastes and agricultural or plant based
wastes have been easily incorporated into anaerobic systems due to their high percentage of readily
biodegradable COD. A range of anaerobic processes have also been explored for this purpose
(single as well as multi – stage). Multi – stage processes have attempted to use potato waste
prepared in the laboratory by grinding and pulverizing commercially available potatoes in order to
simulate pulverized potato waste, the kind that would be available on a large scale for an industrial
application (Zhu et al., 2008). Co-digestion of food residues from cafeterias (including fruits,
vegetables and grains that were homogenized and pulverized) has also been carried out in the
8
laboratory, leading to the yield of methane as well as biohydrogen that can then be used for energy
generation (Zhu et al., 2008).
Some unusual wastes have also been encountered in co-digestion operations. Anaerobic systems
have been used to co-digest municipal wastewater sludge with onion juice that was acquired from
an onion processing facility and was made by treating residual onion solids with lime and
compressing them in a screw press (Romano and Zhang, 2008). In another study, samples of coffee
waste supplied by Nestle were used as feed for co-digestion with sewage sludge in Portugal (Alves
et al., 2006). In countries like Greece, studies have been conducted involving co – digestion of
wastewater from olive mills (facilities that employ continuous process for the extraction of olive
oil) that is fairly rich in total and soluble COD with waste activated sludge (WAS) from local
wastewater treatment plants (Athanasoulia et al., 2012).
In Ohio, a mixture of yard waste that was made primarily of branches and leaves that were dried
and ground was mixed with food waste obtained from Walmart grocery stores and co-digested for
biogas production (Li and Brown, 2013). A mix of agro – industrial waste and sewage sludge was
co-digested in a study carried out in Spain. The food wastes used in this study included fruit and
vegetable wastes as well as meat and bones (Esteban-Gutierrez et al., 2013).
Using the process of co-digestion for food waste disposal has not been limited to plant or agro –
based wastes. Wastes from the meat industry have been successfully used in conjunction with
sewage sludge for the purpose of digestion as well. Studies carried out in Spain have analyzed the
effects of adding waste collected from slaughterhouses into anaerobic operations operating using
wastewater sludge. This waste included a mixture of cow and pig manure, ruminal waste and
residual meat slurries (Buendia et al., 2009). A similar study combined slaughterhouse wastes with
OFMSWs in co-digestion operations. This study used waste from poultry processing (rich in lipids
and ammonia) with sewage sludge (Moran et al., 2008).
Manure has long been used as a feed source for anaerobic digestion. There are several projects in
developing countries (such as India) that use cattle manure to produce biogas in rural areas that
have a large livestock population.
9
Dairy cow manure, OFMSWs and cotton gin waste (primarily containing ground up cotton seeds
that are high in fat content) were separately co-digested with municipal sewage sludge in
anaerobic systems in Mexico (Samani et al., 2008). Cow manure has been combined with
concentrated food processing waste (a mixture of cheese whey, animal blood, used cooking oil
and fried potato waste) in co-digestion experiments in Japan (Yamashiro et al., 2013). Another
study based in Italy used a two – stage process to carry out co-digestion of cheese whey waste
with cattle manure (Grilli et al., 2013).
Yet another major candidate for co-digestion operations is grease – based or grease trap waste.
Grease contains very high amounts of COD and is thus ideal for co-digestion applications,
although it can produce scum and operational issues at very high loading rates. Mesophilic co-
digestion of grease trap waste from animal cutting plants (i.e. slaughterhouses) in Finland has been
carried out in digesters treating conventional municipal sludge (Luostarinen et al., 2009). Research
from North Carolina State University (NCSU) has also explored the idea of adding grease trap
waste from food service establishments into digesters being run on thickened waste activated
sludge (TWAS). This waste consisted of fat, oil and grease (FOGs) and food residuals (Reyes et
al., 2013). Furthermore, attempts have been made to increase methane production in anaerobic
processes by the addition of grease trap waste from restaurants and food processing centers in
Tennessee (He et al., 2011).
A new, radical idea has been the co-digestion of waste glycerol from the production of biodiesel
along with municipal sewage sludge. Since this glycerol is usually not pure enough to be applied
to industrial applications, it can serve as an attractive, readily - biodegradable substrate for
anaerobic co-digestion and help solve a major problem of waste disposal being faced by the
sustainable biofuel industry (Athanasoulia et al., 2014). The effect of crude glycerol from biodiesel
production on the quality and quantity of methane produced in anaerobic operations involving
sewage sludge has also been studied (Fountoulakis et al., 2010).
10
Observed Impacts of Co-Digestion on Digester Performance
Co – digestion usually has the effect of increasing gas production in anaerobic systems without
affecting other parameters too much. The results obtained in studies dealing with anaerobic co-
digestion seem to suggest that wastes from the food industry or plant – based food processing are
readily degraded in these systems, whereas some others can be more difficult to break down.
Addition of OFMSWs has had a positive impact on VFA and COD reduction without having any
major impact on pH (Agdag et al., 2005). The same study also hypothesized that the
microorganisms present in municipal solid wastes work in synergy with those found in
conventional sewage sludge treatment systems to boost performance.
In the co-digestion system treating olive mill waste with WAS, a ratio of 70% WAS to 30% olive
waste in a continuous stirred tank configuration worked well (Athanasoulia et al., 2012). Here too,
a significant increase in methane production was reported, with all the other parameters exhibiting
little variation. However, increasing the dosage of the olive mill waste to levels beyond 30% by
volume began to hinder smooth functioning of the system leading to “overloading”. A study on
high – solids anaerobic digestion of food and agro – based waste found that high levels of ammonia
and VFAs might prove to be inhibitory and parameters like SRT and mixing play a pivotal role in
the success of such systems (Aymerich et al., 2013).
The nature of materials like slaughterhouse waste (i.e., high protein and lipid content) might imply
a difficulty in co-digestion. However, co-digestion using slaughterhouse waste as fodder has been
carried out at mesophilic conditions in a semi-continuous process (Moran et al., 2008). The process
failed at a lower SRT of around 25 days, but was successful when SRT was set to 50 days and
gradually reduced to 25 days. Organic loading was set to a low value as well, and gradually
increased to a maximum. Studies like this show that not all wastes are readily amenable to
degradation via the medium of anaerobic digestion and a variation in the nature of the feed for
processes as sensitive as the ones involving wastes from the meat industry could result in a drastic
drop in the performance of the system.
11
Studies dealing with grease trap waste showed interesting results as well. An interesting study
focused on the limit to which grease trap waste could be loaded into anaerobic digesters to be co-
digested with Thickened Waste Activated Sludge (TWAS). The increase in methane production
observed for this system was 317%, the highest value reported at the time (Reyes et al., 2013).
However, digester failure was observed when loading rates of grease trap wastes exceeded 20%
(v/v) of the total influent.
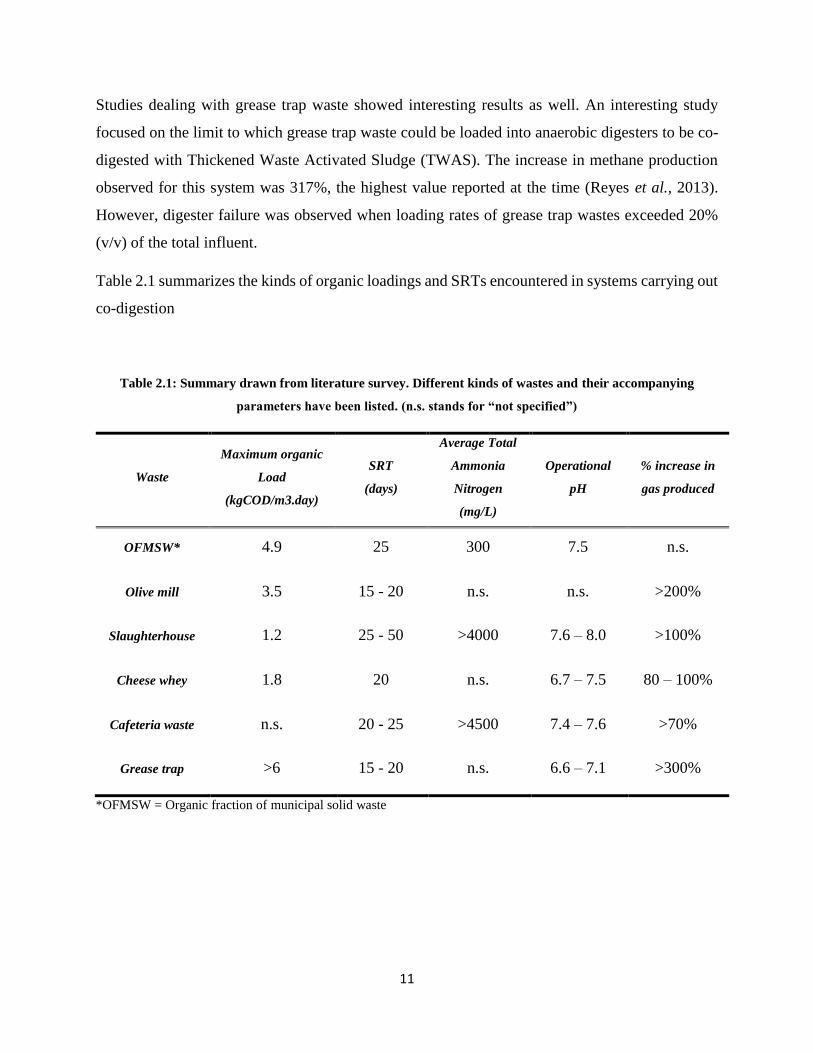
Table 2.1 summarizes the kinds of organic loadings and SRTs encountered in systems carrying out
co-digestion
Table 2.1: Summary drawn from literature survey. Different kinds of wastes and their accompanying
parameters have been listed. (n.s. stands for “not specified”)
Waste
Maximum organic
Load
(kgCOD/m3.day)
SRT
(days)
Average Total
Ammonia
Nitrogen
(mg/L)
Operational
pH
% increase in
gas produced
OFMSW* 4.9 25 300 7.5 n.s.
Olive mill 3.5 15 - 20 n.s. n.s. >200%
Slaughterhouse 1.2 25 - 50 >4000 7.6 – 8.0 >100%
Cheese whey 1.8 20 n.s. 6.7 – 7.5 80 – 100%
Cafeteria waste n.s. 20 - 25 >4500 7.4 – 7.6 >70%
Grease trap >6 15 - 20 n.s. 6.6 – 7.1 >300%
*OFMSW = Organic fraction of municipal solid waste
12
References
Ağdağ, O. N. and D. T. Sponza (2005). "Co-digestion of industrial sludge with municipal solid
wastes in anaerobic simulated landfilling reactors." Process Biochemistry 40(5): 1871-1879.
Appels, L., et al. (2008). "Principles and potential of the anaerobic digestion of waste-activated
sludge." Progress in Energy and Combustion Science 34(6): 755-781.
Athanasoulia, E., et al. (2012). "Anaerobic waste activated sludge co-digestion with olive mill
wastewater." Water Sci Technol 65(12): 2251-2257.
Athanasoulia, E., et al. (2014). "Co-digestion of sewage sludge and crude glycerol from
biodiesel production." Renewable Energy 62: 73-78.
Aymerich, E., et al. (2013). "Analysis of the stability of high-solids anaerobic digestion of agro-
industrial waste and sewage sludge." Bioresour Technol 144: 107-114.
Bertin, L., et al. (2013). "Innovative two-stage anaerobic process for effective codigestion of
cheese whey and cattle manure." Bioresour Technol 128: 779-783.
Bolzonella, D., et al. (2005). "Mesophilic anaerobic digestion of waste activated sludge:
influence of the solid retention time in the wastewater treatment process." Process Biochemistry
40(3-4): 1453-1460.
Brown, D. and Y. Li (2013). "Solid state anaerobic co-digestion of yard waste and food waste for
biogas production." Bioresour Technol 127: 275-280.
Buendia, I. M., et al. (2009). "Feasibility of anaerobic co-digestion as a treatment option of meat
industry wastes." Bioresour Technol 100(6): 1903-1909.
Callaghan, F. J., et al. (1999). "Co-digestion of waste organic solids: batch studies." Bioresource
Technology 67(2): 117-122.
Calli, B., et al. (2005). "Effects of high free ammonia concentrations on the performances of
anaerobic bioreactors." Process Biochemistry 40(3-4): 1285-1292.
13
Cuetos, M. J., et al. (2008). "Anaerobic digestion of solid slaughterhouse waste (SHW) at
laboratory scale: Influence of co-digestion with the organic fraction of municipal solid waste
(OFMSW)." Biochemical Engineering Journal 40(1): 99-106.
Droste, R.L., (1997), Theory and practice of water and wastewater treatment. John Wiley and
Sons Inc. 622-663
Fountoulakis, M. S., et al. (2010). "Co-digestion of sewage sludge with glycerol to boost biogas
production." Waste Management 30(10): 1849-1853.
Grady, L.C.P., et al. (2011). Biological Wastewater Treatment. CRC press, Taylor and Francis
Group 561 - 612
Hansen, K. H., et al. (1998). "Anaerobic digestion of swine manure: Inhibition by Ammonia."
Water Research 32(1): 5-12.
Lou, X. F., et al. (2012). "Field performance of small scale anaerobic digesters treating food
waste." Energy for Sustainable Development 16(4): 509-514.
Luostarinen, S., et al. (2009). "Increased biogas production at wastewater treatment plants
through co-digestion of sewage sludge with grease trap sludge from a meat processing plant."
Bioresource Technology 100(1): 79-85.
Lv, W., et al. (2013). "Evaluation of system performances and microbial communities of two
temperature-phased anaerobic digestion systems treating dairy manure." Bioresour Technol 143:
431-438.
Macias-Corral, M., et al. (2008). "Anaerobic digestion of municipal solid waste and agricultural
waste and the effect of co-digestion with dairy cow manure." Bioresour Technol 99(17): 8288-
8293.
Mata-Alvarez, J., et al. (2000). "Anaerobic digestion of organic solid wastes. An overview of
research achievements and perspectives." Bioresource Technology 74(1): 3-16.
Mata-Alvarez, J., et al. (2000). "Anaerobic digestion of organic solid wastes. An overview of
research achievements and perspectives." Bioresource Technology 74(1): 3-16.
14
Neves, L., et al. (2006). "Anaerobic co-digestion of coffee waste and sewage sludge." Waste
Management 26(2): 176-181.
Nishio, N. and Y. Nakashimada (2007). "Recent development of anaerobic digestion processes
for energy recovery from wastes." J Biosci Bioeng 103(2): 105-112.
Noutsopoulos, C., et al. (2013). "Anaerobic co-digestion of grease sludge and sewage sludge: the
effect of organic loading and grease sludge content." Bioresour Technol 131: 452-459.
Pahl, O., et al. (2008). "Anaerobic co-digestion of mechanically biologically treated municipal
waste with primary sewage sludge - a feasibility study." Bioresour Technol 99(9): 3354-3364.
Rajagopal, R., et al. (2013). "A critical review on inhibition of anaerobic digestion process by
excess ammonia." Bioresour Technol 143: 632-641.
Romano, R. T. and R. Zhang (2008). "Co-digestion of onion juice and wastewater sludge using
an anaerobic mixed biofilm reactor." Bioresour Technol 99(3): 631-637.
Salminen, E. and J. Rintala (2002). "Anaerobic digestion of organic solid poultry slaughterhouse
waste – a review." Bioresource Technology 83(1): 13-26.
Sheng, K., et al. (2013). "Effect of ammonia and nitrate on biogas production from food waste
via anaerobic digestion." Biosystems Engineering 116(2): 205-212.
Stroot, P. G., et al. (2001). "Anaerobic codigestion of municipal solid waste and biosolids under
various mixing conditions—I. digester performance." Water Res 35(7): 1804-1816.
Sung, S. and T. Liu (2003). "Ammonia inhibition on thermophilic anaerobic digestion."
Chemosphere 53(1): 43-52.
Tchobanoglous, G., et al. (1991), Metcalf and Eddy Wastewater Engineering, Treatment and
Reuse Fourth Edition, Tata McGraw-Hill edition, 983-1018
Wang, L., et al. (2013). "Determining the limits of anaerobic co-digestion of thickened waste
activated sludge with grease interceptor waste." Water Res 47(11): 3835-3844.
Ward, A. J., et al. (2008). "Optimisation of the anaerobic digestion of agricultural resources."
Bioresour Technol 99(17): 7928-7940.
15
Yamashiro, T., et al. (2013). "Anaerobic co-digestion of dairy cow manure and high
concentrated food processing waste." Journal of Material Cycles and Waste Management 15(4):
539-547.
Zhang, R., et al. (2007). "Characterization of food waste as feedstock for anaerobic digestion."
Bioresour Technol 98(4): 929-935.
Zhu, H., et al. (2008). "Biohydrogen production by anaerobic co-digestion of municipal food
waste and sewage sludges." International Journal of Hydrogen Energy 33(14): 3651-3659.
Zhu, H., et al. (2008). "Co-production of hydrogen and methane from potato waste using a two-
stage anaerobic digestion process." Bioresour Technol 99(11): 5078-5084.
Zhu, Z., et al. (2011). "Enhancing biomethanation of municipal waste sludge with grease trap
waste as a co-substrate." Renewable Energy 36(6): 1802-1807.

16
Chapter 3
Manuscript 1
Title:
An Assessment of co-digestion of High – Strength Food Processing Wastes (HSWs) with
municipal sewage sludge
A.B. Pathaka*, G.D. Boardmana, J.T. Novaka, R. Wimmerb, M. Hannab
a: Virginia Polytechnic Institute & State University, Blacksburg, VA, United States
b: Black & Veatch, Baltimore, MD, United States
*Corresponding author
17
ABSTRACT
The successful functioning of an anaerobic digester depends on the interplay of several factors,
each of which is crucial to the success of the system as a whole. Reactor pH, volatile solids (VS)
destruction, chemical oxygen demand (COD) destruction, gas production and volatile fatty acid
(VFA) levels are among the parameters indicative of the condition of an anaerobic system. In this
study, the effects of adding high – strength food wastes (HSWs) to laboratory – scale anaerobic
digesters were closely monitored.
Two wastes were considered for this purpose. The first was a fruit juice processing waste supplied
by Kraft Foods and the other was whey waste from feta cheese production supplied by a cheese
manufacturer from the state of New York. The study was initiated by setting up four lab – scale
digestion units (volume = 9.75 L) and stabilizing them with municipal sewage sludge, a mixture
of 60% primary sludge and 40% waste activated sludge (WAS). While one digester served as the
control, the other three began receiving gradually increasing amounts of HSW, starting with the
waste from Kraft and then both the wastes simultaneously. The wastes were initially loaded at a
lower rate and the loading rate was increased after making sure that the digesters could stably
operate under the current load.
A major thrust of the study was to analyze the effects of HSW addition on digester gas production.
The observations made as part of this study showed that anaerobic systems are capable of co-
digesting materials that are much higher in COD than municipal sewage sludge. They also indicate
increased digester gas production via addition of COD to the influent.
Keywords: High – strength Waste (HSW), anaerobic digestion, performance, failure, loading rate
18
INTRODUCTION
Anaerobic co-digestion of municipal sludge is an idea that has been explored for a long time, but
is now becoming widely regarded as a viable and beneficial option for waste water treatment plants
(WWTPs) employing anaerobic digesters. Several references to co-digestion can be found in
literature. Some of these date back to the 1960s, a period of time soon after anaerobic digestion
became accepted as a mainstream process in full scale wastewater treatment facilities. However,
most of the studies dealing with large-scale co-digestion operations have occurred in the last
decade.
According to recent literature dealing with anaerobic co-digestion of so-called “foreign” wastes
with municipal sewage sludge, there has been an effort to employ a huge array of wastes as “co-
substrates”. An encouraging sign is that a lot of these substances have shown promise at the lab
and pilot scale, with some being applied to full-scale treatment plants. Anaerobic systems have
been able to maintain stability under variable organic loading by wastes that have varied chemical
compositions, thereby living up to their billing as robust systems. The following section provides
a brief summary of the kinds of wastes that have been successfully used for co-digestion and the
impacts they have had on the performance of the system in which they were used.
Wastes from the food or food processing industry have been found to be great candidates for
anaerobic co-digestion due to their simple organic composition and readily biodegradable nature.
These wastes are also available in large quantities virtually everywhere, which makes them a
convenient and reliable co-digestion feed. The great volume of work carried out in the food waste
co-digestion area has led to great clarity and understanding of the pitfalls and potential problems
associated with using these systems, which in turn has enabled the application of these wastes at
large scales.
Food residues in the form of fruits, vegetables and grains from eating or dining establishments
such as cafeterias have been fed into anaerobic digesters acclimatized to treating sewage sludge
after grinding and homogenization. Methane and bio-hydrogen generation was accomplished by
this process (Zhu et al., 2008).
19
Several projects have attempted to digest a mix of agro-based and animal-based food wastes. A
recent study attempted to use sewage sludge in conjunction with a varied “cocktail” of food wastes,
including waste fruits and vegetables as well as meat and bones (Esteban-Gutierrez et al., 2013).
In Ohio, food waste obtained from Walmart was mixed with yard waste such as ground-up leaves
and branches and co-digested to generate usable digester gas (Li and Brown, 2013). Multi-stage
anaerobic processes have also successfully used potato waste (prepared in the laboratory by
grinding and pulverizing commercially available potatoes in order to simulate pulverized potato
waste, the kind that would be available on a large scale) for an industrial application as a feed
material for co-digestion (Zhu et al., 2008)
In a study that was published in 2009, pulverized and homogenized slaughterhouse waste was
added to anaerobic digesters along with sewage sludge (Buendia et al., 2009). The wastes added
included cow and pig feces, ruminal cattle waste and pig and cattle meat. Stable digester operation
was observed, although issues that might create problems in the process were identified. Lipid and
ammonia – rich poultry waste has also been employed as a co-digestion feed material (Moran et
al., 2008).
The organic fractions of municipal solid wastes have been successfully used in anaerobic systems
treating sewage sludge (Agdag et al., 2005). This waste includes landfill leachates and organic
wastes dumped into landfills that might be relatively easily degraded by biological agents. With
countries like Scotland imposing restrictions on the volume of material that may be disposed of by
landfilling, there has been a sudden interest in employing waste from landfills as feed material for
anaerobic systems. This has had the effect of providing a convenient disposal alternative for
landfill operators while also ensuring a stable supply of degradable waste, resulting in increased
gas production for treatment facilities (Pahl et al., 2007).
A fairly recent trend has been the application of high strength wastes (HSWs) that are extremely
high in COD as co-substrate in digesters treating municipal sewage sludge. Since these materials
are chemically very different from sewage sludge and carry high organic loads in the form of COD,
they are more challenging to incorporate into conventional anaerobic processes.
20
Wastes from the processing of foods that are high in sugars or lipids usually fall into the category
of HSWs. Co-digestion work carried out in Japan has combined cow manure with concentrated
food processing waste. This waste was composed of a mixture of cheese whey, animal blood, used
cooking oil and fried potato waste (Yamashiro et al., 2013). A two – stage process has also been
employed to treat a mixture of cattle manure and cheese whey (Grilli et al., 2013)
Eateries and restaurants (or any establishment discharging highly fatty or lipid – rich waste into
the sewer system) are required to have grease traps (also known as grease interceptors) to capture
grease that would otherwise end up at the local wastewater treatment plant and interfere with
treatment operations. The waste from these grease traps is extremely high in COD and has
therefore been looked at as a feed material for anaerobic digesters. An important trend has been
the attempt to increase methane production by addition of these wastes to anaerobic digestion
processes. In Tennessee, grease trap waste from restaurants has been used to boost methane
production (He et al., 2011). Grease trap waste has been used in conjunction with slaughterhouse
waste for the purpose of addition to digesters treating sewage sludge (Luostarinen et al., 2009).
Grease trap waste (fats, oils and grease or FOGs and food residuals) from restaurants and eateries
has been added to digesters running using thickened waste activated sludge (Reyes et al., 2013).
The study exploring the addition of the organic fractions of municipal solid wastes to anaerobic
digesters carried out by Agdag et al. in 2005 used three reactors with varied loading ratios of
leachates to sludge. It concluded that leachate addition did not appear to have any adverse impact
on the reactor VFA concentrations as well as COD reduction. The study also hypothesized that the
methanogens present in anaerobic digesters treating sludge have the ability to work in synergy
with those in organic municipal wastes and landfill leachate to provide good performance during
the process of digestion.
A co-digestion system treating olive mill waste (from an olive oil manufacturing plant) with WAS,
a ratio of 70% WAS to 30% olive waste in a continuous stirred tank configuration worked well
(Athanasoulia et al., 2012). A significant increase in methane production was the highlight of the
study, as this increase was brought about with little or no impact on parameters like pH, COD
reduction, or VFA levels. However, increasing the dosage of the olive mill waste to levels beyond
30% by volume began to hinder smooth functioning of the system leading to “overloading”.
Aymerich et al. (2013) studied co-digestion of food and agro – based wastes and reported that
21
while the system tends to function well at loading rates lower than 20% on a volumetric basis, an
increase in the loading of said wastes might begin to change the system behavior as well as
performance. They highlight the importance of VFA and ammonia levels in the digesters as
reliable indicators of digester health and performance.
Slaughterhouse wastes are often challenging contenders as feed materials for co-digestion. Semi-
continuous processes have employed slaughterhouse wastes as co-substrates under mesophilic
conditions (Moran et al., 2008). The anaerobic digesters treating these wastes showed extremely
poor performances at an SRT of 25 days, but were able to run at stable conditions when the SRT
was set at 50 days and then gradually reduced to 25 days. Organic loading was set to a low value
as well and gradually increased to a maximum. Studies like this show that not all wastes are readily
amenable to degradation via the medium of anaerobic digestion and a variation in the nature of the
feed for processes as sensitive as the ones involving wastes from the meat industry could result in
a drastic drop in the performance of the system.
Studies dealing with grease trap waste (an example of HSW) also showed interesting results. A
study was carried out, focusing on the limit to which grease trap waste could be loaded into
anaerobic digesters to be co-digested with thickened waste activated sludge (TWAS). The increase
in methane production observed for this system was 317%, the highest value reported at the time
(Reyes et al., 2013). However, digester failure was observed when loading rates of grease trap
wastes exceeded 20% (v/v) of the total influent.
Thus, it can be seen that while easily biodegradable organics serve as good feed materials for co-
digestion, high strength wastes have the potential to effect large increases in gas production at
lower loading rates. This would be of interest to wastewater treatment facilities looking to recover
larger amounts of energy from digester gas in an effort to reduce energy consumption without
having to expand the plant or having to provide for bigger digesters. The aim of this project was
to analyze the effects of adding two such high strength wastes to anaerobic digesters that are
acclimatized to municipal sewage sludge (a mixture of primary and secondary sludges) and to
analyze the effect of addition of these wastes on the performance of the digesters and gas
production.
22
MATERIALS AND METHODS
Anaerobic Digester Design and Operation
This study aimed at assessing the feasibility of co-digestion of sewage sludge with high – strength
food processing wastes from industries that processed fruit juice and cheese, generating wastes
rich in COD and acidic in nature. An important parameter to be considered while evaluating the
viability of co-digestion was the increase in gas production, if any.
Four anaerobic, batch reactors were set up. The volume of each reactor was 25 liters (L). These
reactors were made of high density polyethylene and were supplied by Hobby Beverage Company,
Temecula, California. The reactors were cylindrical in shape with conical or tapered bottoms,
which made for better and more thorough mixing. The anaerobic reactors therefore simulated egg
– shaped digesters. The reactors were fitted with a thermometer to measure the temperature of the
digestion process and were placed in a constant temperature room maintained at 37 °C, a
temperature optimal for mesophilic anaerobic digestion.
The digesters were seeded with 8 L of mesophilic anaerobic digester effluent from the
Christiansburg Wastewater Treatment Plant, Christiansburg, Virginia. Sludge from the
Christiansburg plant was used for the purpose of seeding since its close proximity to the university
meant that the digested seed could be swiftly transported to the reactors and sealed, minimizing
the time of exposure to oxygen. Once the digesters had been seeded and started, primary and waste
activated sludge (WAS) were shipped from Winchester, Virginia in ice - packed coolers and used
as reactor feed. These sludge coolers were shipped on a weekly basis (about 17 liters of primary
sludge and 12 liters of WAS per week).
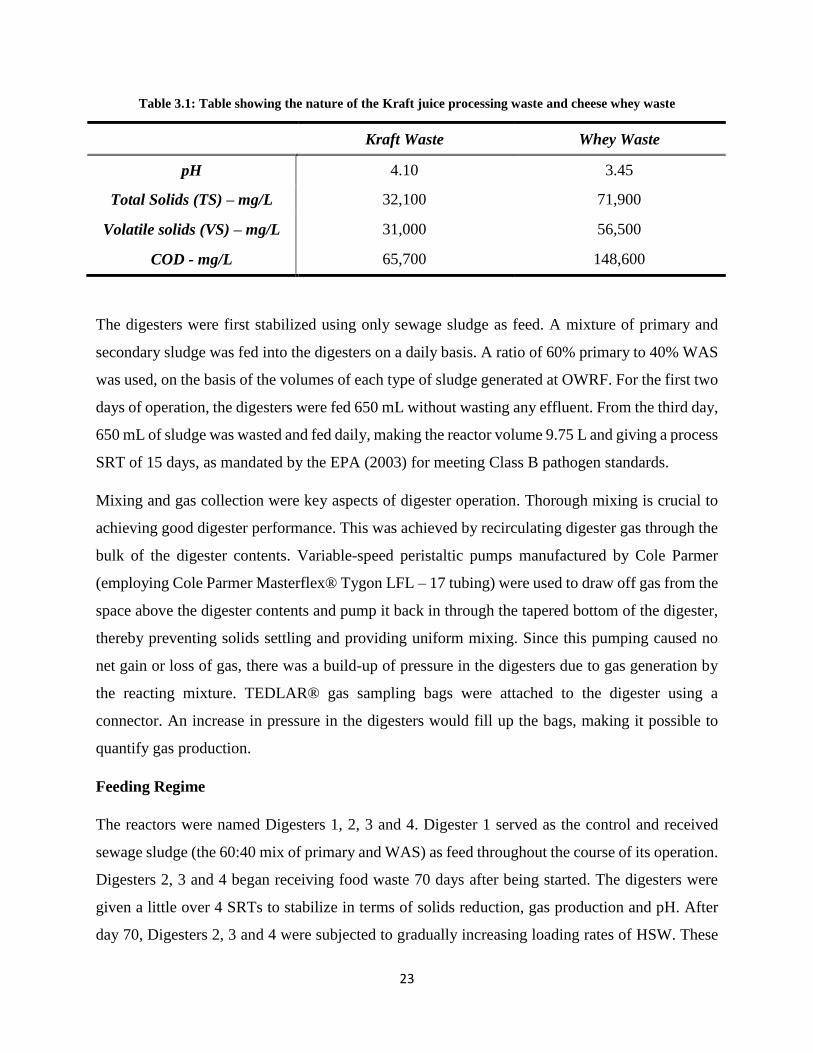
Two kinds of HSWs were to be used in the study. The first was juice processing waste supplied
by Kraft foods, while the other was whey waste from feta cheese manufacture, supplied by a
facility in the state of New York. Both these wastes had a relatively lower pH compared to sewage
sludge. They also had a high TDS content as well as a high COD value. The nature of these wastes
has been summarized in table 3.1:
23
Table 3.1: Table showing the nature of the Kraft juice processing waste and cheese whey waste
The digesters were first stabilized using only sewage sludge as feed. A mixture of primary and
secondary sludge was fed into the digesters on a daily basis. A ratio of 60% primary to 40% WAS
was used, on the basis of the volumes of each type of sludge generated at OWRF. For the first two
days of operation, the digesters were fed 650 mL without wasting any effluent. From the third day,
650 mL of sludge was wasted and fed daily, making the reactor volume 9.75 L and giving a process
SRT of 15 days, as mandated by the EPA (2003) for meeting Class B pathogen standards.
Mixing and gas collection were key aspects of digester operation. Thorough mixing is crucial to
achieving good digester performance. This was achieved by recirculating digester gas through the
bulk of the digester contents. Variable-speed peristaltic pumps manufactured by Cole Parmer
(employing Cole Parmer Masterflex® Tygon LFL – 17 tubing) were used to draw off gas from the
space above the digester contents and pump it back in through the tapered bottom of the digester,
thereby preventing solids settling and providing uniform mixing. Since this pumping caused no
net gain or loss of gas, there was a build-up of pressure in the digesters due to gas generation by
the reacting mixture. TEDLAR® gas sampling bags were attached to the digester using a
connector. An increase in pressure in the digesters would fill up the bags, making it possible to
quantify gas production.
Feeding Regime
The reactors were named Digesters 1, 2, 3 and 4. Digester 1 served as the control and received
sewage sludge (the 60:40 mix of primary and WAS) as feed throughout the course of its operation.
Digesters 2, 3 and 4 began receiving food waste 70 days after being started. The digesters were
given a little over 4 SRTs to stabilize in terms of solids reduction, gas production and pH. After
day 70, Digesters 2, 3 and 4 were subjected to gradually increasing loading rates of HSW. These
Kraft Waste Whey Waste
pH 4.10 3.45
Total Solids (TS) – mg/L 32,100 71,900
Volatile solids (VS) – mg/L 31,000 56,500
COD - mg/L 65,700 148,600
24
rates were increased to levels OWRF was intending to feed into their digesters, and then raised
higher to assess the impacts of the wastes at greater loading rates. Loading rates were gradually
increased to values as high as 4.8 kg/m3.day from values of 1.75 – 2 kg COD/m3.day, as was the
case with the feed consisting only of sewage sludge. Based on the HSW supply available to OWRF,
the following composition of influent was chosen:
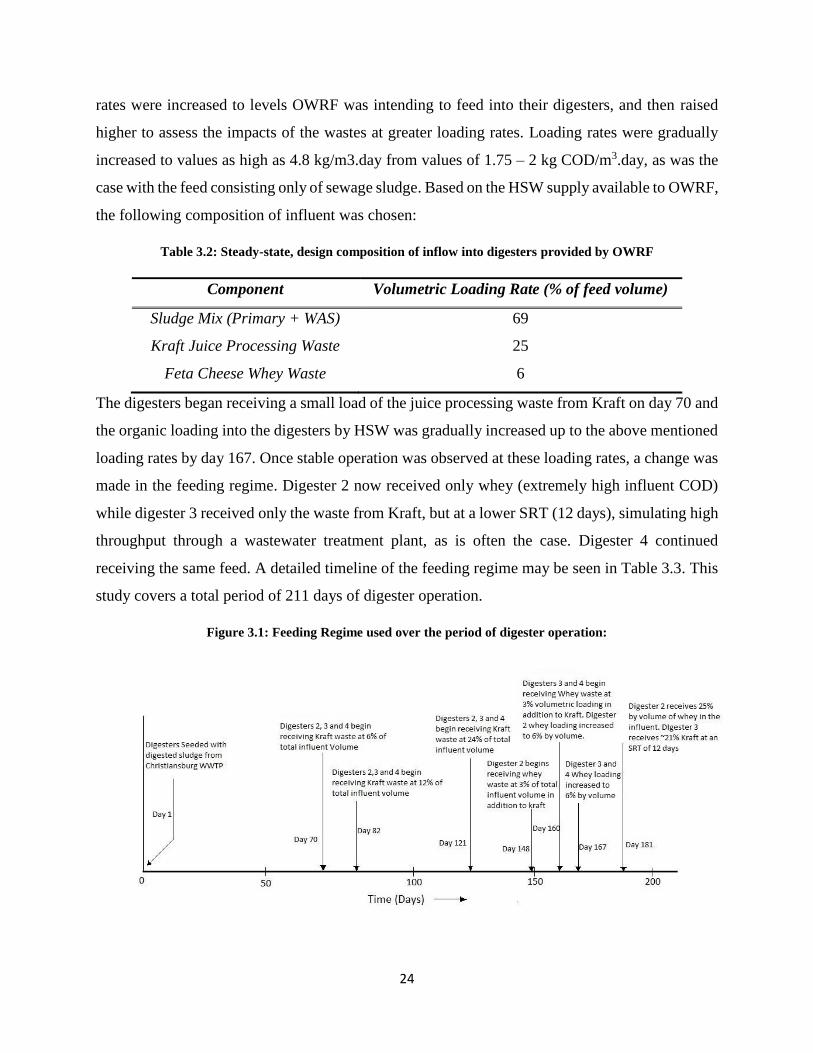
Table 3.2: Steady-state, design composition of inflow into digesters provided by OWRF
Component Volumetric Loading Rate (% of feed volume)
Sludge Mix (Primary + WAS) 69
Kraft Juice Processing Waste 25
Feta Cheese Whey Waste 6
The digesters began receiving a small load of the juice processing waste from Kraft on day 70 and
the organic loading into the digesters by HSW was gradually increased up to the above mentioned
loading rates by day 167. Once stable operation was observed at these loading rates, a change was
made in the feeding regime. Digester 2 now received only whey (extremely high influent COD)
while digester 3 received only the waste from Kraft, but at a lower SRT (12 days), simulating high
throughput through a wastewater treatment plant, as is often the case. Digester 4 continued
receiving the same feed. A detailed timeline of the feeding regime may be seen in Table 3.3. This
study covers a total period of 211 days of digester operation.
Figure 3.1: Feeding Regime used over the period of digester operation:
25
Digester Performance Assessment
Digester performance was measured using a combination of several parameters being monitored
closely and on a regular basis. These parameters were pH, Volatile solids (VS) in the influent and
effluent, total COD (tCOD) levels in the influent and effluent, influent and effluent ammonia levels
(NH3-N) and VFA levels.
pH Measurement
Digester pH was monitored using an Oakton ® basic, handheld pH meter manufactured by Cole
Parmer. Influent and effluent pH values were monitored, recorded and plotted on a regular basis.
Effluent pH values greater than 6.8 would signify healthy digester functioning, although values
closer to or greater than 7.0 would be optimum for methanogenic activity (Grady et al., 2011).
VS Measurement
VS destruction is an important parameter to gauge digester performance. VS destruction of greater
than 50% shows good digester health, while values above 40% are acceptable (Metcalf and Eddy,
1991). Aluminum weighing pans were used to calculate VS content of the influent and effluent. A
Cole – Parmer analytical balance was used to weigh the samples. The pans were pre – baked in a
550 °C oven to get rid of any residual volatile compounds or coatings that may be present. The
weight of the empty pans was noted. The sample whose VS was to be measured was then added
onto the pan. This weight was also recorded. The pan was placed in an oven at 105 °C for a
minimum of three hours to evaporate all the water from it. The weight of the pan was recorded
again, and the weight of the solids left on the pan signified the Total Solids (TS) of the sample.
The pans containing these solids were then placed in a muffle furnace at 550 °C for a minimum of
two hours to burn off organic (i.e. volatile) matter. The weight of the residue was recorded, and
the loss in weight in the muffle furnace indicated the VS content of the sample. These analyses
were regularly carried out for the influent fed as well as the effluent that was wasted.
Total COD Measurement
Total COD measurement is carried out using the closed titrimetric method (standard method
5220C). The detection limit of this test was 450 mg/L of COD, requiring samples of higher COD
to be diluted and analyzed. This dilution factor was later multiplied by the COD of the analyzed
26
sample to get the actual COD of the substance being tested. For this test, 5 mL of diluted sample
was mixed with 5 mL of digestion reagent (a 0.0167 M solution of potassium dichromate, K2Cr2O7
with concentrated H2SO4 and HgSO4) and 7 mL of sulfuric acid reagent (a solution of concentrated
H2SO4 and Ag2SO4). This mixture was digested in an oven at 150 °C for two hours and then cooled
down. Some of the dichromate was consumed in oxidizing the COD present in the sample. The
remaining dichromate was estimated by titration against 0.10 M Ferrous Ammonium Sulfate
(FAS) solution using Ferroin indicator. The dichromate consumed was used as a measure of the
COD of the sample.
Ammonia (NH3-N) Measurement
Distillation and titrimetry (standard method 4500) were used to calculate NH3-N levels in the
influent as well as the effluent. A known volume of the sample (2.5 mL for the purpose of our
analyses) was mixed with borate buffer solution (a solution of sodium hydroxide and sodium
tetraborate) and diluted to 100 mL with distilled water. The pH of the mixture was then adjusted
to 9.5 using 1 N NaOH. The sample was then subjected to distillation and the vapors generated
were captured in a boric acid indicator solution (an aqueous solution of boric acid containing
methyl red and methylene blue indicators). The color of the indicator solution would change from
purple to green. The solution was then titrated against 0.02 N sulfuric acid. The volume of sulfuric
acid consumed was used to determine NH3-N.
VFA Measurement
VFA measurements were carried out using gas chromatography coupled with a flame ionization
detector (GC-FID). A Shimadzu gas chromatograph (GC – 14A) was used for the purpose of these
analyses. The column employed was a Nukol™ fused silica column (15 m x 0.53 mm, 0.5 µm film
thickness). A Shimadzu computer integrator (CR501 Chromatopak) was used to quantify and
analyze data. Helium was used as the carrier gas. VFA concentrations were obtained as mg/L of
C2 – C7 organic acids, with acetic acid, propionic acid, butyric acid and heptanoic acid being
detected.
27
Gas Production Measurement and Statistical Analysis
Gas production was of prime interest and was monitored on a daily basis. The TEDLAR® gas
bags that were connected to the digesters for the purpose of gas collection and sampling were
supplied by Restek and were 25 L in capacity.
On a daily basis, these bags were disconnected and connected to a pump that emptied out the gas
from them at a fixed rate. The time taken to empty the bag was then used to calculate the volume
of gas contained in it. This was recorded as the daily (or 24 hour) gas production.
Statistical analysis of gas production was carried out using JMP 10.0, a software developed by
SAS. The mean gas production and standard deviation were calculated for each digester. Also, the
software was used to calculate 75% confidence limits for gas production for each digester.
Gas Composition Analysis
The gas produced by the digesters was analyzed for methane and carbon dioxide content. A
Shimadzu 14A Gas Chromatograph was used with a Thermo Conductivity Detector (TCD). A
Restek Column packed with Haysep Q media was used (4 m Length, 6.35 mm ID). Helium was
used as the carrier gas. An inlet temperature of 110 °C was employed.
28
RESULTS AND DISCUSSION
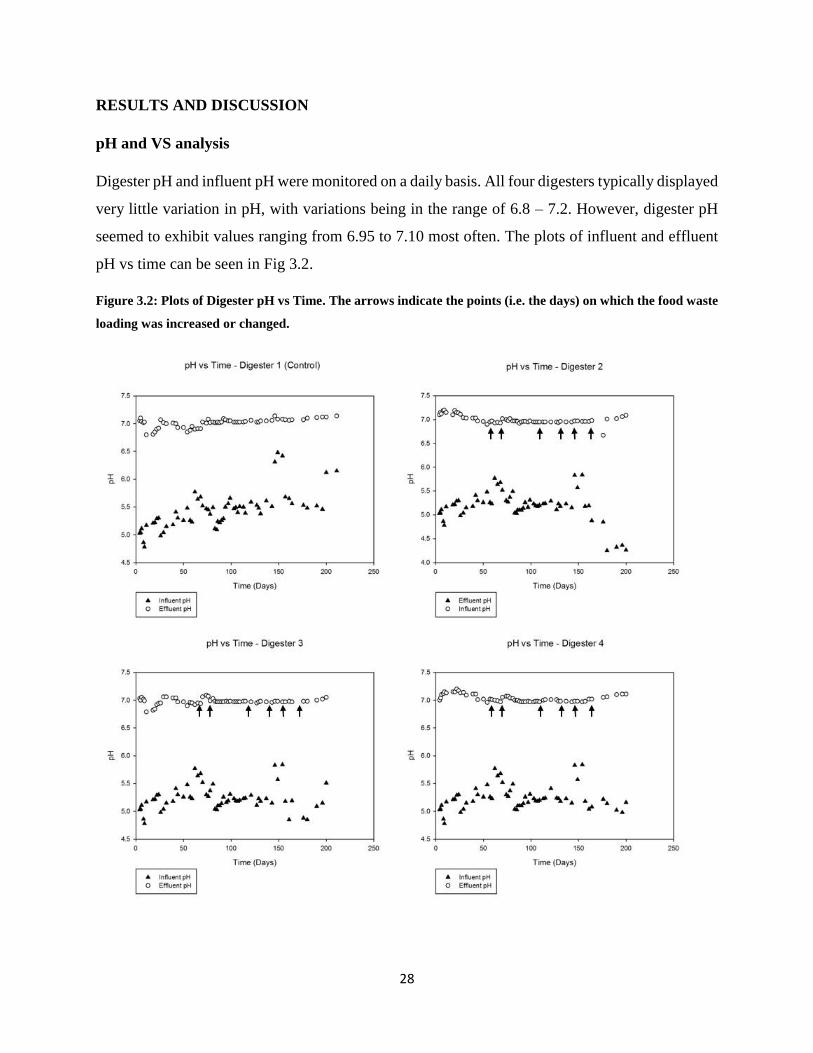
pH and VS analysis
Digester pH and influent pH were monitored on a daily basis. All four digesters typically displayed
very little variation in pH, with variations being in the range of 6.8 – 7.2. However, digester pH
seemed to exhibit values ranging from 6.95 to 7.10 most often. The plots of influent and effluent
pH vs time can be seen in Fig 3.2.
Figure 3.2: Plots of Digester pH vs Time. The arrows indicate the points (i.e. the days) on which the food waste
loading was increased or changed.
29
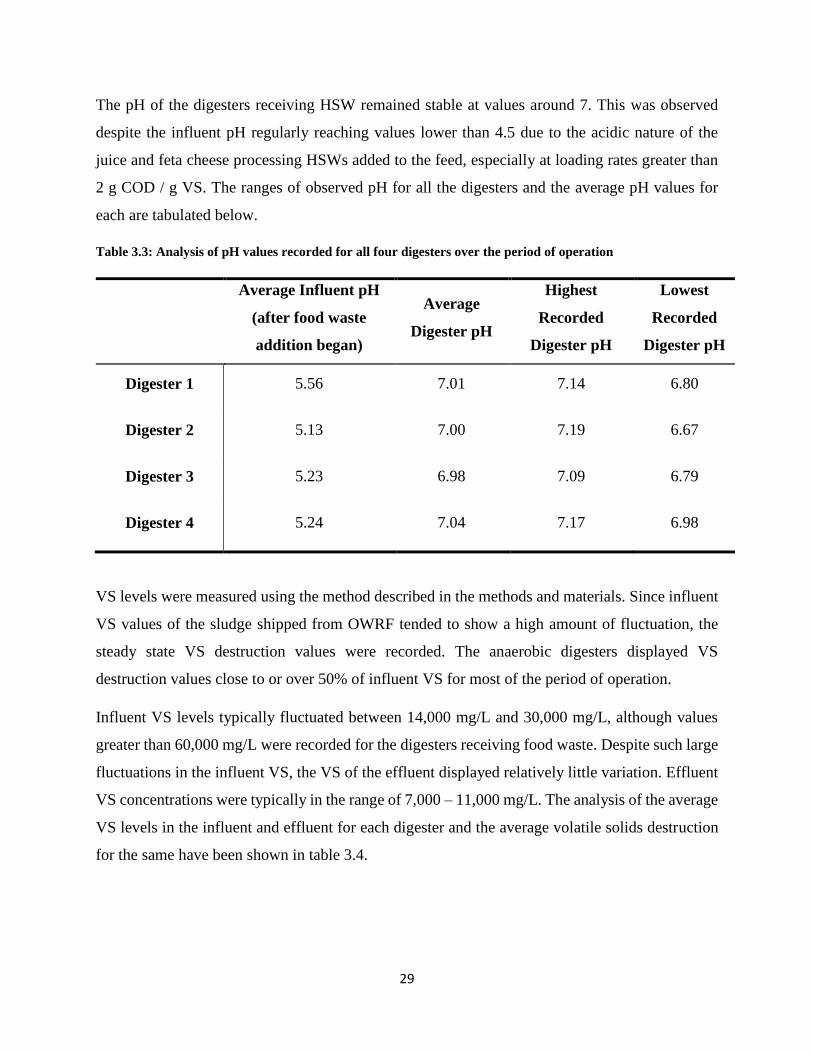
The pH of the digesters receiving HSW remained stable at values around 7. This was observed
despite the influent pH regularly reaching values lower than 4.5 due to the acidic nature of the
juice and feta cheese processing HSWs added to the feed, especially at loading rates greater than
2 g COD / g VS. The ranges of observed pH for all the digesters and the average pH values for
each are tabulated below.
Table 3.3: Analysis of pH values recorded for all four digesters over the period of operation
Average Influent pH
(after food waste
addition began)
Average
Digester pH
Highest
Recorded
Digester pH
Lowest
Recorded
Digester pH
Digester 1 5.56 7.01 7.14 6.80
Digester 2 5.13 7.00 7.19 6.67
Digester 3 5.23 6.98 7.09 6.79
Digester 4 5.24 7.04 7.17 6.98
VS levels were measured using the method described in the methods and materials. Since influent
VS values of the sludge shipped from OWRF tended to show a high amount of fluctuation, the
steady state VS destruction values were recorded. The anaerobic digesters displayed VS
destruction values close to or over 50% of influent VS for most of the period of operation.
Influent VS levels typically fluctuated between 14,000 mg/L and 30,000 mg/L, although values
greater than 60,000 mg/L were recorded for the digesters receiving food waste. Despite such large
fluctuations in the influent VS, the VS of the effluent displayed relatively little variation. Effluent
VS concentrations were typically in the range of 7,000 – 11,000 mg/L. The analysis of the average
VS levels in the influent and effluent for each digester and the average volatile solids destruction
for the same have been shown in table 3.4.
30
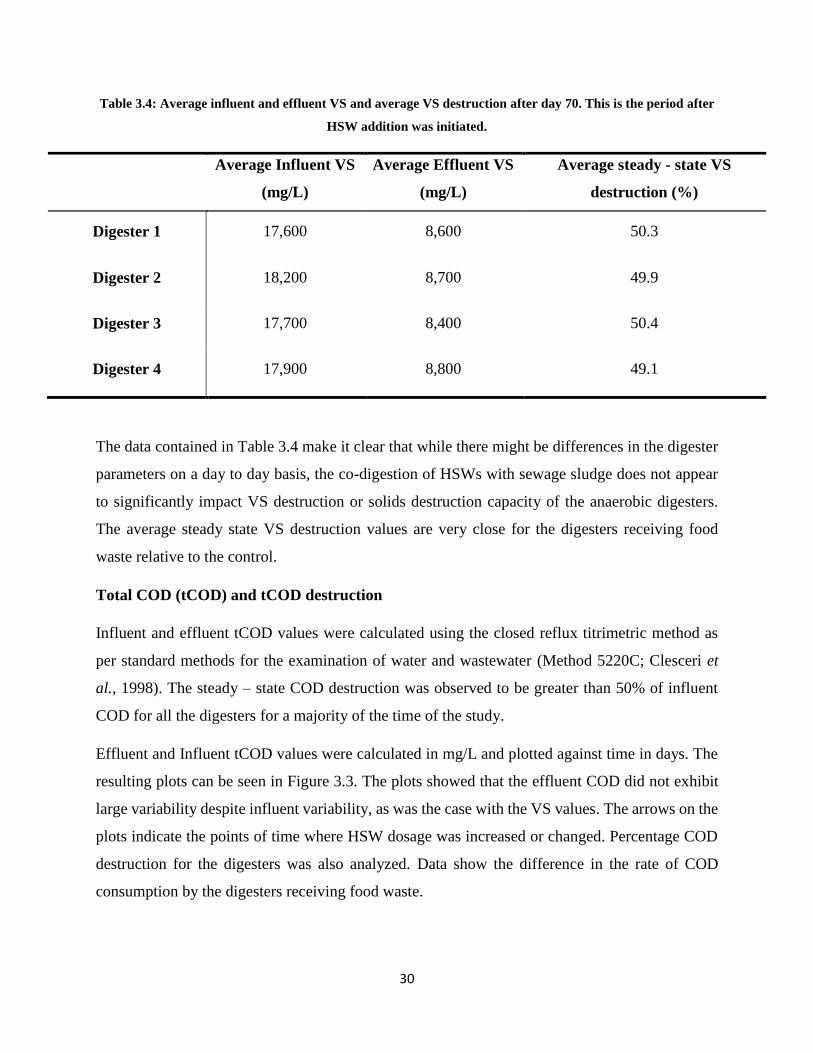
Table 3.4: Average influent and effluent VS and average VS destruction after day 70. This is the period after
HSW addition was initiated.
Average Influent VS
(mg/L)
Average Effluent VS
(mg/L)
Average steady - state VS
destruction (%)
Digester 1 17,600 8,600 50.3
Digester 2 18,200 8,700 49.9
Digester 3 17,700 8,400 50.4
Digester 4 17,900 8,800 49.1
The data contained in Table 3.4 make it clear that while there might be differences in the digester
parameters on a day to day basis, the co-digestion of HSWs with sewage sludge does not appear
to significantly impact VS destruction or solids destruction capacity of the anaerobic digesters.
The average steady state VS destruction values are very close for the digesters receiving food
waste relative to the control.
Total COD (tCOD) and tCOD destruction
Influent and effluent tCOD values were calculated using the closed reflux titrimetric method as
per standard methods for the examination of water and wastewater (Method 5220C; Clesceri et
al., 1998). The steady – state COD destruction was observed to be greater than 50% of influent
COD for all the digesters for a majority of the time of the study.
Effluent and Influent tCOD values were calculated in mg/L and plotted against time in days. The
resulting plots can be seen in Figure 3.3. The plots showed that the effluent COD did not exhibit
large variability despite influent variability, as was the case with the VS values. The arrows on the
plots indicate the points of time where HSW dosage was increased or changed. Percentage COD
destruction for the digesters was also analyzed. Data show the difference in the rate of COD
consumption by the digesters receiving food waste.
31
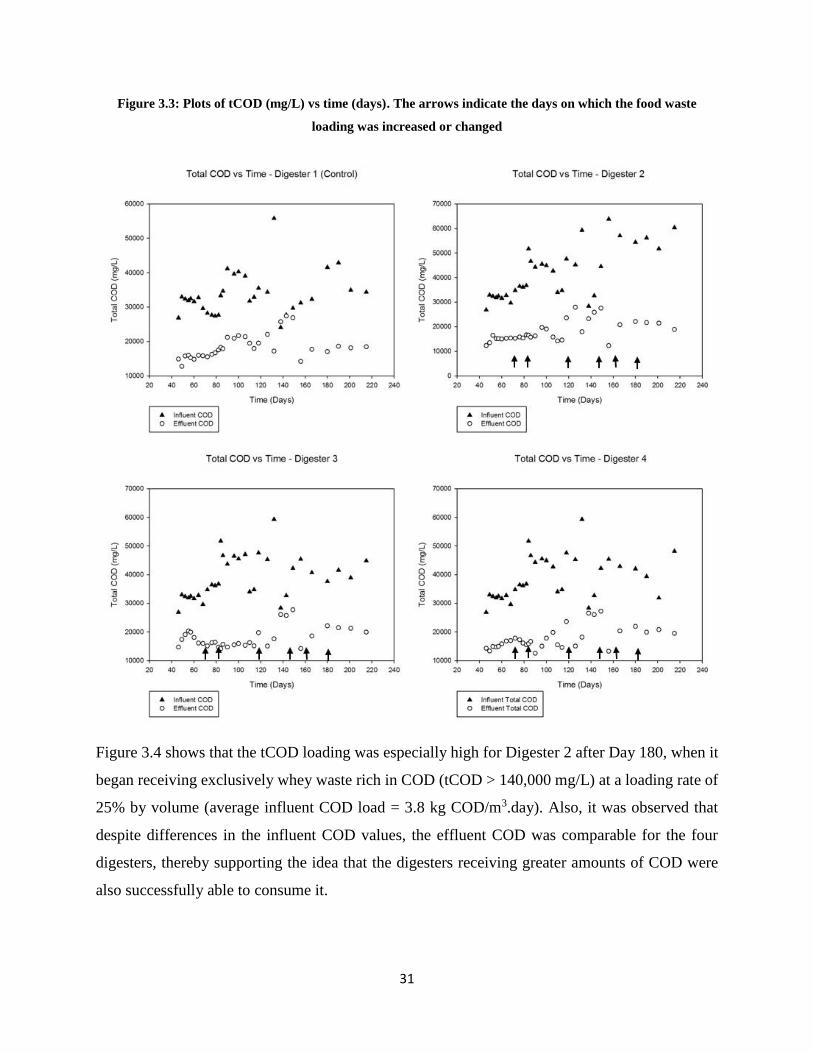
Figure 3.3: Plots of tCOD (mg/L) vs time (days). The arrows indicate the days on which the food waste
loading was increased or changed
Figure 3.4 shows that the tCOD loading was especially high for Digester 2 after Day 180, when it
began receiving exclusively whey waste rich in COD (tCOD > 140,000 mg/L) at a loading rate of
25% by volume (average influent COD load = 3.8 kg COD/m3.day). Also, it was observed that
despite differences in the influent COD values, the effluent COD was comparable for the four
digesters, thereby supporting the idea that the digesters receiving greater amounts of COD were
also successfully able to consume it.
32
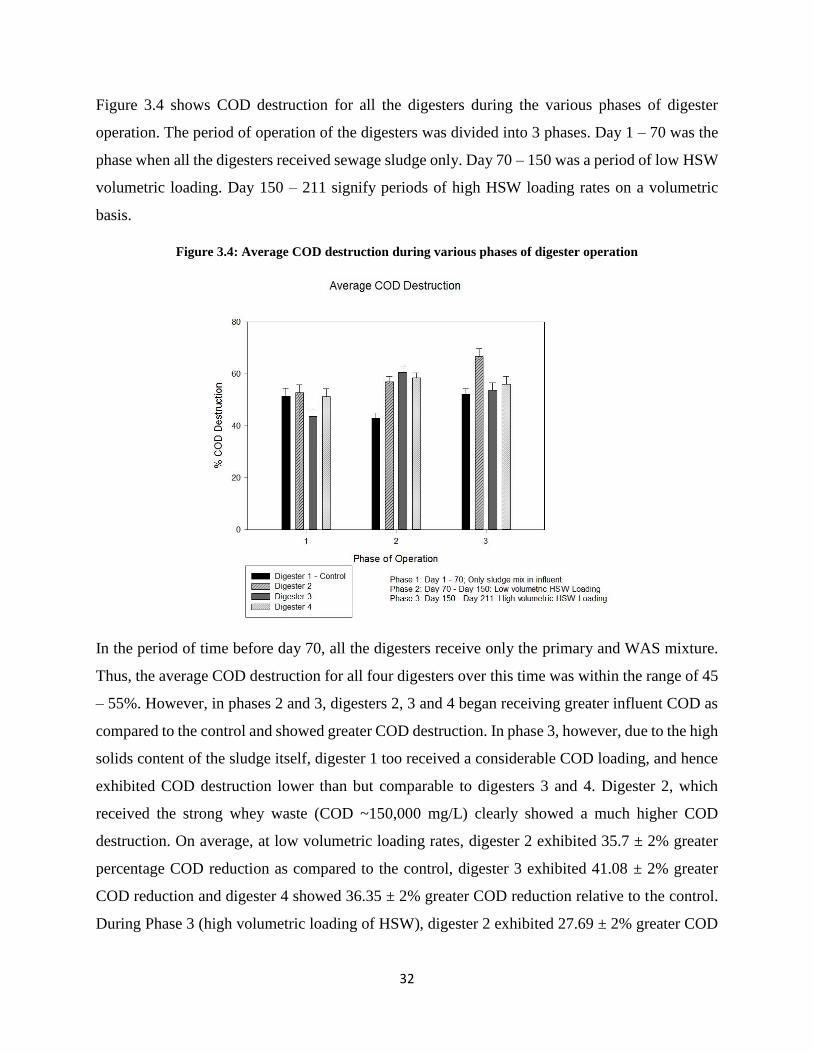
Figure 3.4 shows COD destruction for all the digesters during the various phases of digester
operation. The period of operation of the digesters was divided into 3 phases. Day 1 – 70 was the
phase when all the digesters received sewage sludge only. Day 70 – 150 was a period of low HSW
volumetric loading. Day 150 – 211 signify periods of high HSW loading rates on a volumetric
basis.
Figure 3.4: Average COD destruction during various phases of digester operation
In the period of time before day 70, all the digesters receive only the primary and WAS mixture.
Thus, the average COD destruction for all four digesters over this time was within the range of 45
– 55%. However, in phases 2 and 3, digesters 2, 3 and 4 began receiving greater influent COD as
compared to the control and showed greater COD destruction. In phase 3, however, due to the high
solids content of the sludge itself, digester 1 too received a considerable COD loading, and hence
exhibited COD destruction lower than but comparable to digesters 3 and 4. Digester 2, which
received the strong whey waste (COD ~150,000 mg/L) clearly showed a much higher COD
destruction. On average, at low volumetric loading rates, digester 2 exhibited 35.7 ± 2% greater
percentage COD reduction as compared to the control, digester 3 exhibited 41.08 ± 2% greater
COD reduction and digester 4 showed 36.35 ± 2% greater COD reduction relative to the control.
During Phase 3 (high volumetric loading of HSW), digester 2 exhibited 27.69 ± 2% greater COD
33
removal, digester 3 showed 2.62 ± 2% greater COD removal, while digester 4 showed 7.23 ± 2%
higher COD removal. The lower increases in % COD removal at high HSW loading may be
ascribed to the high solids (and as a consequence, higher COD) content in the sludge itself.
NH3-N and VFA Data
An NH3-N build up in anaerobic digesters can have an adverse impact on methanogen activity,
leading to a condition known as ammonia inhibition. Ammonia inhibition has been studied for co-
digestion processes involving food processing wastes. Ammonia was described as “highly
inhibitory” for gas production at total ammonia nitrogen (TAN) levels greater than 3780 mg/L,
while it was described as having “no detrimental effect” on gas production at levels lower than
1,540 mg/L (Pan et al., 2013) In this study, the average influent VS was 6.25%, significantly higher
than the values observed for the sludge obtained from Winchester. The mixture of food waste and
sewage sludge fed into the digesters had a pH greater than 7.4, as opposed to values in the range
of 4.5 – 5.5 that were observed in this study.
It was necessary to measure NH3-N levels in the digesters on a regular basis to check for ammonia
build up and any effect it might have on the performance of the digesters. The TAN levels in all
four digesters were below 500 mg/L and these data can be seen in Table 3.6.
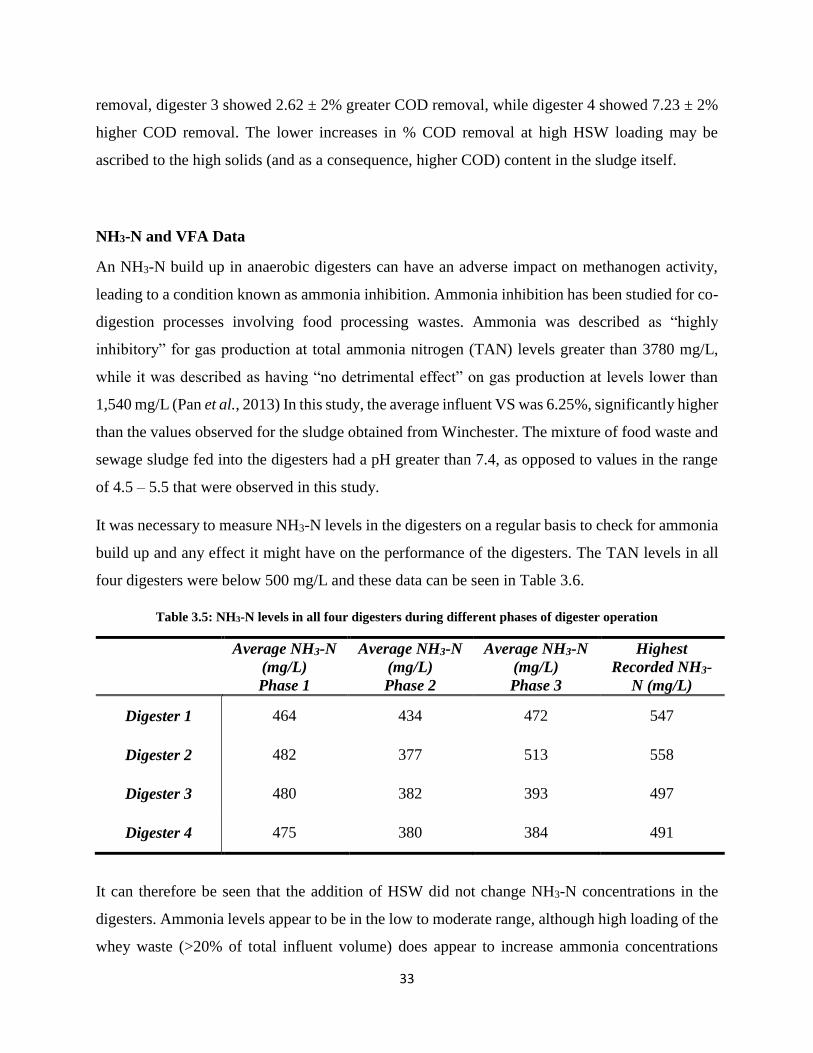
Table 3.5: NH3-N levels in all four digesters during different phases of digester operation
Average NH3-N
(mg/L)
Phase 1
Average NH3-N
(mg/L)
Phase 2
Average NH3-N
(mg/L)
Phase 3
Highest
Recorded NH3-
N (mg/L)
Digester 1 464 434 472 547
Digester 2 482 377 513 558
Digester 3 480 382 393 497
Digester 4 475 380 384 491
It can therefore be seen that the addition of HSW did not change NH3-N concentrations in the
digesters. Ammonia levels appear to be in the low to moderate range, although high loading of the
whey waste (>20% of total influent volume) does appear to increase ammonia concentrations
34
marginally in digester 2. However, no significant NH3-N increase was observed due to HSW
addition.
No NH3-N values greater than 558 mg/L were recorded for any of the digesters over the entire
period of operation. The influent NH3-N levels in the sludge mix from OWRF had a mean value
of 191 mg/L, while no ammonia was detected in the Kraft and the whey wastes.
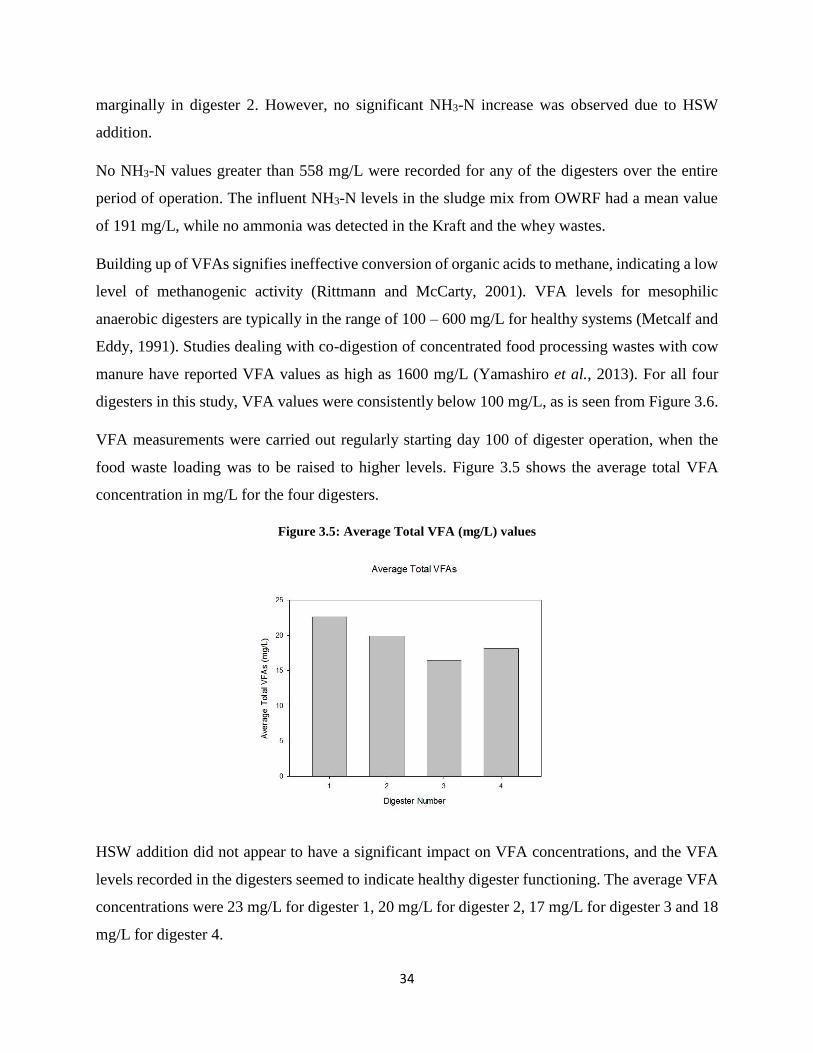
Building up of VFAs signifies ineffective conversion of organic acids to methane, indicating a low
level of methanogenic activity (Rittmann and McCarty, 2001). VFA levels for mesophilic
anaerobic digesters are typically in the range of 100 – 600 mg/L for healthy systems (Metcalf and
Eddy, 1991). Studies dealing with co-digestion of concentrated food processing wastes with cow
manure have reported VFA values as high as 1600 mg/L (Yamashiro et al., 2013). For all four
digesters in this study, VFA values were consistently below 100 mg/L, as is seen from Figure 3.6.
VFA measurements were carried out regularly starting day 100 of digester operation, when the
food waste loading was to be raised to higher levels. Figure 3.5 shows the average total VFA
concentration in mg/L for the four digesters.
Figure 3.5: Average Total VFA (mg/L) values
HSW addition did not appear to have a significant impact on VFA concentrations, and the VFA
levels recorded in the digesters seemed to indicate healthy digester functioning. The average VFA
concentrations were 23 mg/L for digester 1, 20 mg/L for digester 2, 17 mg/L for digester 3 and 18
mg/L for digester 4.
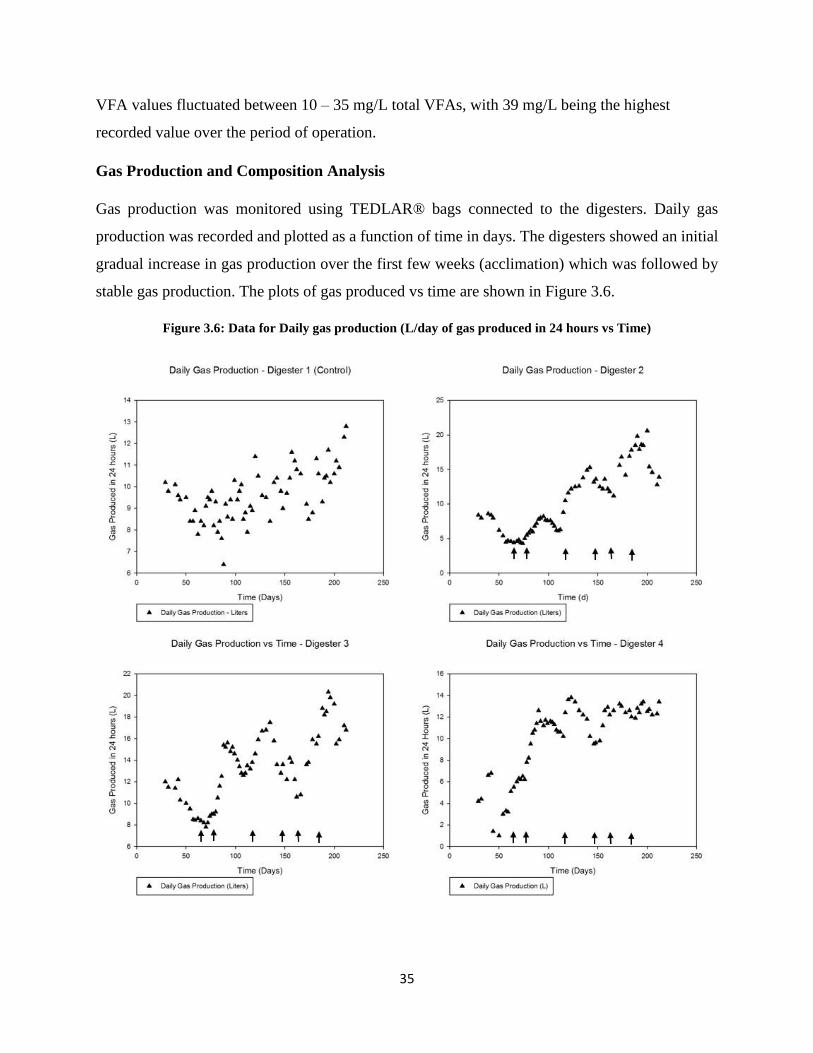
35
VFA values fluctuated between 10 – 35 mg/L total VFAs, with 39 mg/L being the highest
recorded value over the period of operation.
Gas Production and Composition Analysis
Gas production was monitored using TEDLAR® bags connected to the digesters. Daily gas
production was recorded and plotted as a function of time in days. The digesters showed an initial
gradual increase in gas production over the first few weeks (acclimation) which was followed by
stable gas production. The plots of gas produced vs time are shown in Figure 3.6.
Figure 3.6: Data for Daily gas production (L/day of gas produced in 24 hours vs Time)
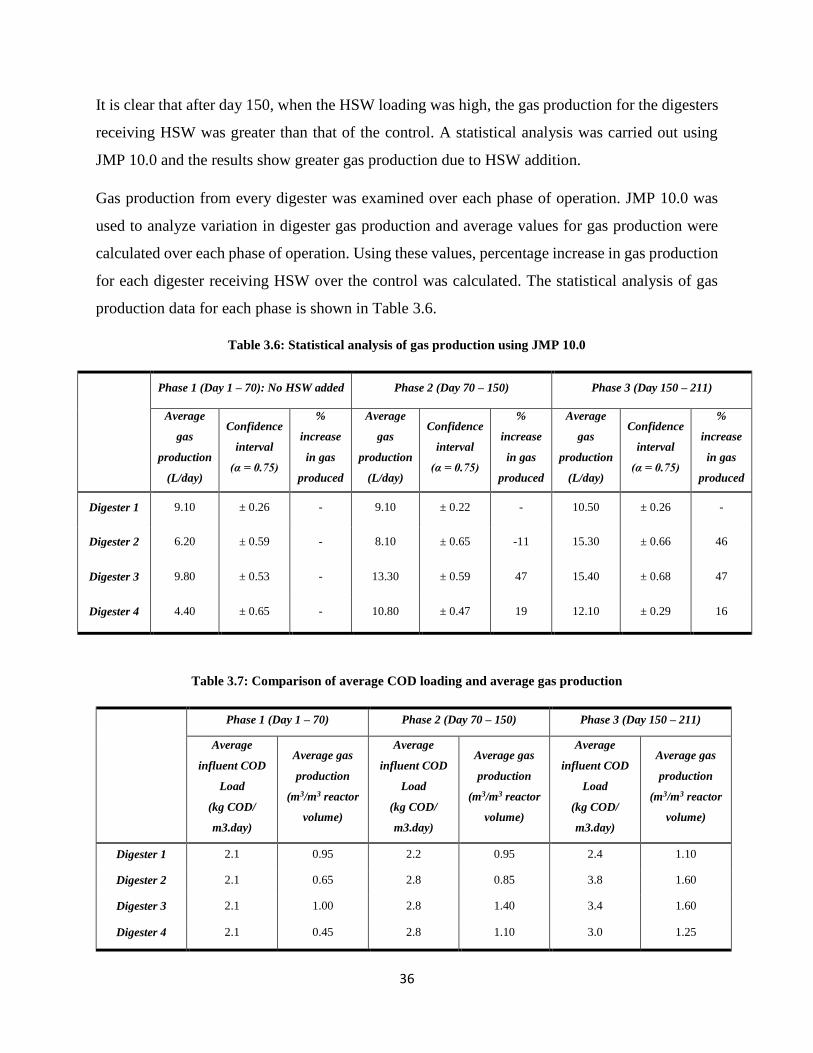
36
It is clear that after day 150, when the HSW loading was high, the gas production for the digesters
receiving HSW was greater than that of the control. A statistical analysis was carried out using
JMP 10.0 and the results show greater gas production due to HSW addition.
Gas production from every digester was examined over each phase of operation. JMP 10.0 was
used to analyze variation in digester gas production and average values for gas production were
calculated over each phase of operation. Using these values, percentage increase in gas production
for each digester receiving HSW over the control was calculated. The statistical analysis of gas
production data for each phase is shown in Table 3.6.
Table 3.6: Statistical analysis of gas production using JMP 10.0
Phase 1 (Day 1 – 70): No HSW added Phase 2 (Day 70 – 150) Phase 3 (Day 150 – 211)
Average
gas
production
(L/day)
Confidence
interval
(α = 0.75)
%
increase
in gas
produced
Average
gas
production
(L/day)
Confidence
interval
(α = 0.75)
%
increase
in gas
produced
Average
gas
production
(L/day)
Confidence
interval
(α = 0.75)
%
increase
in gas
produced
Digester 1 9.10 ± 0.26 - 9.10 ± 0.22 - 10.50 ± 0.26 -
Digester 2 6.20 ± 0.59 - 8.10 ± 0.65 -11 15.30 ± 0.66 46
Digester 3 9.80 ± 0.53 - 13.30 ± 0.59 47 15.40 ± 0.68 47
Digester 4 4.40 ± 0.65 - 10.80 ± 0.47 19 12.10 ± 0.29 16
Table 3.7: Comparison of average COD loading and average gas production
Phase 1 (Day 1 – 70) Phase 2 (Day 70 – 150) Phase 3 (Day 150 – 211)
Average
influent COD
Load
(kg COD/
m3.day)
Average gas
production
(m3/m3 reactor
volume)
Average
influent COD
Load
(kg COD/
m3.day)
Average gas
production
(m3/m3 reactor
volume)
Average
influent COD
Load
(kg COD/
m3.day)
Average gas
production
(m3/m3 reactor
volume)
Digester 1 2.1 0.95 2.2 0.95 2.4 1.10
Digester 2 2.1 0.65 2.8 0.85 3.8 1.60
Digester 3 2.1 1.00 2.8 1.40 3.4 1.60
Digester 4 2.1 0.45 2.8 1.10 3.0 1.25
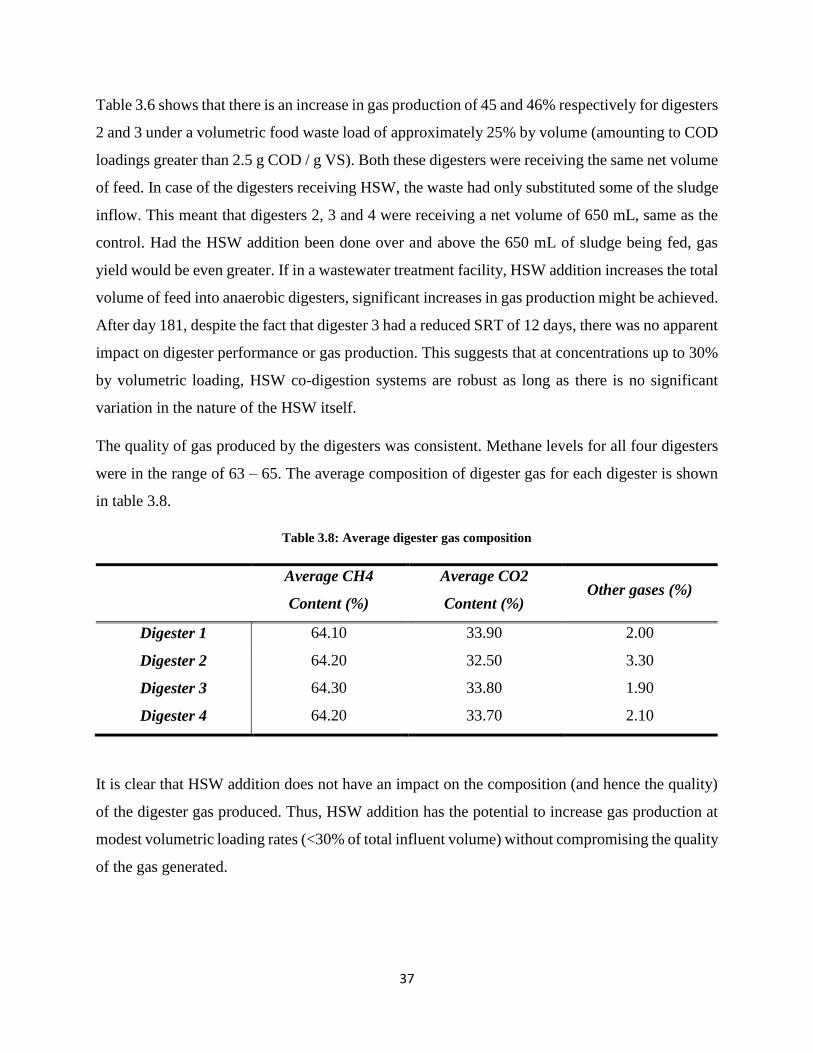
37
Table 3.6 shows that there is an increase in gas production of 45 and 46% respectively for digesters
2 and 3 under a volumetric food waste load of approximately 25% by volume (amounting to COD
loadings greater than 2.5 g COD / g VS). Both these digesters were receiving the same net volume
of feed. In case of the digesters receiving HSW, the waste had only substituted some of the sludge
inflow. This meant that digesters 2, 3 and 4 were receiving a net volume of 650 mL, same as the
control. Had the HSW addition been done over and above the 650 mL of sludge being fed, gas
yield would be even greater. If in a wastewater treatment facility, HSW addition increases the total
volume of feed into anaerobic digesters, significant increases in gas production might be achieved.
After day 181, despite the fact that digester 3 had a reduced SRT of 12 days, there was no apparent
impact on digester performance or gas production. This suggests that at concentrations up to 30%
by volumetric loading, HSW co-digestion systems are robust as long as there is no significant
variation in the nature of the HSW itself.
The quality of gas produced by the digesters was consistent. Methane levels for all four digesters
were in the range of 63 – 65. The average composition of digester gas for each digester is shown
in table 3.8.
Table 3.8: Average digester gas composition
Average CH4
Content (%)
Average CO2
Content (%) Other gases (%)
Digester 1 64.10 33.90 2.00
Digester 2 64.20 32.50 3.30
Digester 3 64.30 33.80 1.90
Digester 4 64.20 33.70 2.10
It is clear that HSW addition does not have an impact on the composition (and hence the quality)
of the digester gas produced. Thus, HSW addition has the potential to increase gas production at
modest volumetric loading rates (<30% of total influent volume) without compromising the quality
of the gas generated.
38
CONCLUSION
HSW addition represents a practical and viable means of increasing gas production at a wastewater
treatment facility. Studies involving HSW addition to sewage sludge for the purpose of co-
digestion do warn against the possibility of “overloading” digesters with HSWs, which could lead
to poor performance or reactor failure (Aymerich et al., 2013).
Based on this study, the following conclusions can be drawn:
HSW addition to anaerobic digesters treating municipal sewage sludge can be
accomplished via acclimatization of the digesters to gradually increasing HSW loading.
The nature of the HSW must be known before addition to the co-digestion process. This
study employed slightly acidic food processing wastes, one of which had a COD greater
than 150,000 mg/L. Total influent COD loadings of greater than 3.0 g COD / g VS/ day
were digested successfully in a system accustomed to treating sewage sludge at influent
tCOD loading rates in the range of 1 – 1.75 g COD / g VS/day.
The anaerobic digesters that were operated in this study handled 25 – 30% HSWs by
volume in the influent without any adverse impact on reactor performance.
It is possible to greatly increase gas production by HSW addition. If a mere 25% of the
influent to an anaerobic digester treating sewage sludge is substituted by HSW, up to 46%
increase in gas production is achievable. When HSW addition brought about an increase
in influent COD from 1 – 1.75 g COD / g VS to values greater than 2.5 g COD / g VS,
increases in gas production were observed. These increases were maintained over the
period of HSW addition, with gas production increasing as much as 46% over the control
(digester receiving no HSW).
39
REFERENCES
Ağdağ, O. N., & Sponza, D. T. (2005). Co-digestion of industrial sludge with municipal solid
wastes in anaerobic simulated landfilling reactors. Process Biochemistry, 40(5), 1871-1879.
Athanasoulia, E., Melidis, P., & Aivasidis, A. (2012). Anaerobic waste activated sludge co-
digestion with olive mill wastewater. Water Sci Technol, 65(12), 2251-2257.
Aymerich, E., Esteban-Gutierrez, M., & Sancho, L. (2013). Analysis of the stability of high-solids
anaerobic digestion of agro-industrial waste and sewage sludge. Bioresour Technol, 144, 107-114.
Bertin, L., Grilli, S., Spagni, A., & Fava, F. (2013). Innovative two-stage anaerobic process for
effective codigestion of cheese whey and cattle manure. Bioresour Technol, 128, 779-783.
Buendia, I. M., Fernandez, F. J., Villasenor, J., & Rodriguez, L. (2009). Feasibility of anaerobic
co-digestion as a treatment option of meat industry wastes. Bioresour Technol, 100(6), 1903-1909.
Cuetos, M. J., Gómez, X., Otero, M., & Morán, A. (2008). Anaerobic digestion of solid
slaughterhouse waste (SHW) at laboratory scale: Influence of co-digestion with the organic
fraction of municipal solid waste (OFMSW). Biochemical Engineering Journal, 40(1), 99-106.
Luostarinen, S., Luste, S., & Sillanpaa, M. (2009). Increased biogas production at wastewater
treatment plants through co-digestion of sewage sludge with grease trap sludge from a meat
processing plant. Bioresour Technol, 100(1), 79-85.
Lv, W., Zhang, W., & Yu, Z. (2013). Evaluation of system performances and microbial
communities of two temperature-phased anaerobic digestion systems treating dairy manure.
Bioresour Technol, 143, 431-438.
Macias-Corral, M., Samani, Z., Hanson, A., Smith, G., Funk, P., Yu, H., & Longworth, J. (2008).
Anaerobic digestion of municipal solid waste and agricultural waste and the effect of co-digestion
with dairy cow manure. Bioresour Technol, 99(17), 8288-8293.
Rice E.W., Baird R.B., Eaton A.D., Clesceri L.S. (2012). Standard methods for the examination
of water and wastewater, American Public Health Association, American Water Works
Association, Water Environment Federation.
40
Sheng, K., Chen, X., Pan, J., Kloss, R., Wei, Y., & Ying, Y. (2013). Effect of ammonia and nitrate
on biogas production from food waste via anaerobic digestion. Biosystems Engineering, 116(2),
205-212.
Wang, L., Aziz, T. N., & de los Reyes, F. L., 3rd. (2013). Determining the limits of anaerobic co-
digestion of thickened waste activated sludge with grease interceptor waste. Water Res, 47(11),
3835-3844.
Yamashiro, T., Lateef, S. A., Ying, C., Beneragama, N., Lukic, M., Masahiro, I., . . . Umetsu, K.
(2013). Anaerobic co-digestion of dairy cow manure and high concentrated food processing waste.
Journal of Material Cycles and Waste Management, 15(4), 539-547.
41
Chapter 4
Manuscript 2
Title:
Loading limits and digester stability for co-digestion of High Strength Wastes (HSWs) with
municipal sewage sludge
A.B. Pathaka*, G.D. Boardmana, J.T. Novaka, R. Wimmerb, M. Hannab
a: Virginia Polytechnic Institute & State University, Blacksburg, VA, United States
b: Black & Veatch, Baltimore, MD, United States
*Corresponding author
42
ABSTRACT
Addition of High Strength Wastes (HSWs) to anaerobic digesters is fraught with several
challenges. It is absolutely essential that the nature of the waste be compatible with the microbes
found in anaerobic systems. The waste pH, chemical oxygen demand (COD) and ammonia levels
(NH3-N) must also be within a range conducive for effective degradation via anaerobic digestion.
In addition, it is vital that there is a semblance of uniformity in the nature of HSW being fed into
the system, as handling a high degree of variability may cause a drastic fall in the performance of
a digester or even result in reactor failure.
The aim of this study was to look into the stability of anaerobic digesters being fed with HSWs
from fruit juice and cheese processing. These had a low pH and a high COD (pH < 3.5; COD >
150,000 mg/L). Therefore, while their addition into anaerobic digesters would bring about a highly
desirable increase in gas production, their chemical nature held the potential to disrupt digester
functioning at high loading rates. This study looked into reactor stability at high levels of COD
and ammonia loading by monitoring parameters such as digester pH, volatile solids (VS)
destruction, influent and effluent total and soluble COD (tCOD and sCOD), influent and effluent
NH3-N, gas production, volatile fatty acids (VFAs) and alkalinity.
The results showed that while anaerobic digesters can accept a significant HSW loading, the nature
and uniformity of the HSW that forms a part of the feed plays a pivotal role in determining the
stability of the system. While dips in performance or reactor failure can be sudden, it is possible
to predict such a dip by closely monitoring certain parameters associated with the digesters.
Keywords: Anaerobic Digestion, High Strength Wastes, Stability, High Loading, Failure
43
INTRODUCTION
The concept of anaerobic co-digestion is one that is fast gaining ground and is beginning to make
an appearance in peer reviewed literature. Anaerobic co-digestion refers to addition of waste other
than municipal sewage sludge to conventional anaerobic digesters. It is being regarded as a viable
option for waste water treatment plants (WWTPs) employing anaerobic digesters. Several
references to co-digestion can be found in literature. Some of these studies date back to the 1960s,
a period of time soon after anaerobic digestion became accepted as a mainstream process in full-
scale wastewater treatment facilities. However, most of the studies dealing with full-scale co-
digestion operations have occurred in the last decade.
Perhaps the most widely used type of wastes for the purpose of anaerobic co-digestion are food or
food processing wastes. Since these wastes are almost always highly biodegradable, they serve as
good candidates for degradation via anaerobic digestion. A great deal of work has been done in
studying the effects of such wastes on the performance of anaerobic systems and as a result, these
systems have been operated successfully.
Fruit and vegetable wastes and agricultural or plant based wastes (i.e. pulverized fruits and
vegetables or plant residues) have been easily incorporated into anaerobic systems due to their
high percentage of readily biodegradable COD. A range of anaerobic processes have also been
explored for this purpose (single as well as multi-stage). Multi-stage processes have attempted to
use potato waste prepared in the laboratory by grinding and pulverizing commercially available
potatoes in order to simulate pulverized potato waste, the kind that would be available on a large
scale for an industrial application (Zhu et al., 2008).
Using the process of co-digestion for food waste disposal has not been limited to plant or agro –
based wastes. Wastes from the meat industry have been successfully used in conjunction with
sewage sludge for the purpose of digestion as well. Studies carried out in Spain have analyzed the
effects of adding waste collected from slaughterhouses into anaerobic operations operating using
wastewater sludge. This waste included a mixture of cow and pig manure, ruminal waste and
residual meat slurries (Buendia et al., 2009). A similar study combined slaughterhouse wastes with
OFMSWs in co-digestion operations. This study used waste from poultry processing (rich in lipids
and ammonia) with sewage sludge (Moran et al., 2008).
44
A major candidate for co-digestion operations is grease – based or grease trap waste. Grease
contains very high amounts of COD and is thus considered to be an HSW. Grease from grease
interceptors can be added to anaerobic digesters, although it can produce scum and operational
issues at very high loading rates. Mesophilic co-digestion of grease trap waste from animal cutting
plants (i.e. slaughterhouses) in Finland has been carried out in digesters treating conventional
municipal sludge (Luostarinen et al., 2009). Research from North Carolina State University
(NCSU) has also explored the idea of adding grease trap waste from food service establishments
into digesters being run on thickened waste activated sludge (WAS). This waste consisted of fat,
oil and grease (FOGs) and food residuals (Reyes et al., 2013). Furthermore, attempts have been
made to increase methane production in anaerobic processes by the addition of grease trap waste
from restaurants and food processing centers in Tennessee (He et al., 2011).
Several studies have attempted to quantify the effect of HSW addition to anaerobic systems. Co –
digestion usually has the effect of increasing gas production in anaerobic systems without affecting
other parameters too much. The results obtained in studies dealing with anaerobic co-digestion
seem to suggest that wastes from the food industry or plant – based food processing are readily
degraded in these systems, whereas some others can be more difficult to break down.
The nature of materials like slaughterhouse waste (i.e. high protein and lipid content) might imply
a difficulty in co-digestion. However, co-digestion using slaughterhouse waste as fodder has been
carried out at mesophilic conditions in a semi-continuous process (Moran et al., 2008). The process
failed at a lower SRT of around 25 days but was successful when SRT was set to 50 days and
gradually reduced to 25 days. Organic loading was set to a low value as well and gradually
increased to a maximum. The loading was initiated at VS values of 0.9 kg/m3.day and gradually
increased to values close to 2 kg/m3.day. Studies like this show that not all wastes are readily
amenable to degradation via the medium of anaerobic digestion and a variation in the nature of the
feed for processes as sensitive as the ones involving wastes from the meat industry could result in
a drastic drop in the performance of the system.
Studies dealing with grease trap waste showed interesting results as well. An interesting study
focused on the limit to which grease trap waste could be loaded into anaerobic digesters to be co-
digested with thickened waste activated sludge. The increase in methane production observed for
45
this system was 317%, the highest value reported at the time (Reyes et al., 2013). However,
digester failure was observed when loading rates of grease trap wastes exceeded 20% (v/v) of the
total influent (tCOD > 65 g/L).
While studies have dealt with an array of wastes, some address the inhibition of anaerobic digestion
by high levels of ammonia. It is therefore a concern that high ammonia and/or nitrogen levels in
the HSW being fed might harm the performance of the system or cause failure. Several studies
have reported different threshold values for ammonia tolerance. In a study treating ground – up
food wastes using anaerobic digesters, ammonia values lower than 2,000 mg/L seemed to have no
effect on digester performance, whereas values greater than 3,000 mg/L severely impacted gas
production (Pan et al., 2013). However, not all systems can handle such high ammonia loading
values. In systems treating livestock or slaughterhouse waste, ammonia inhibition was observed at
concentrations as low as 316 mg/L, with severe inhibition at concentrations greater than 800 mg/L,
causing VFA build – up in the digester.
The aim of this study was to test anaerobic digesters that had been acclimatized to food waste for
tolerance to high ammonia concentrations and to document and analyze digester failure due to
ammonia loading or other factors.
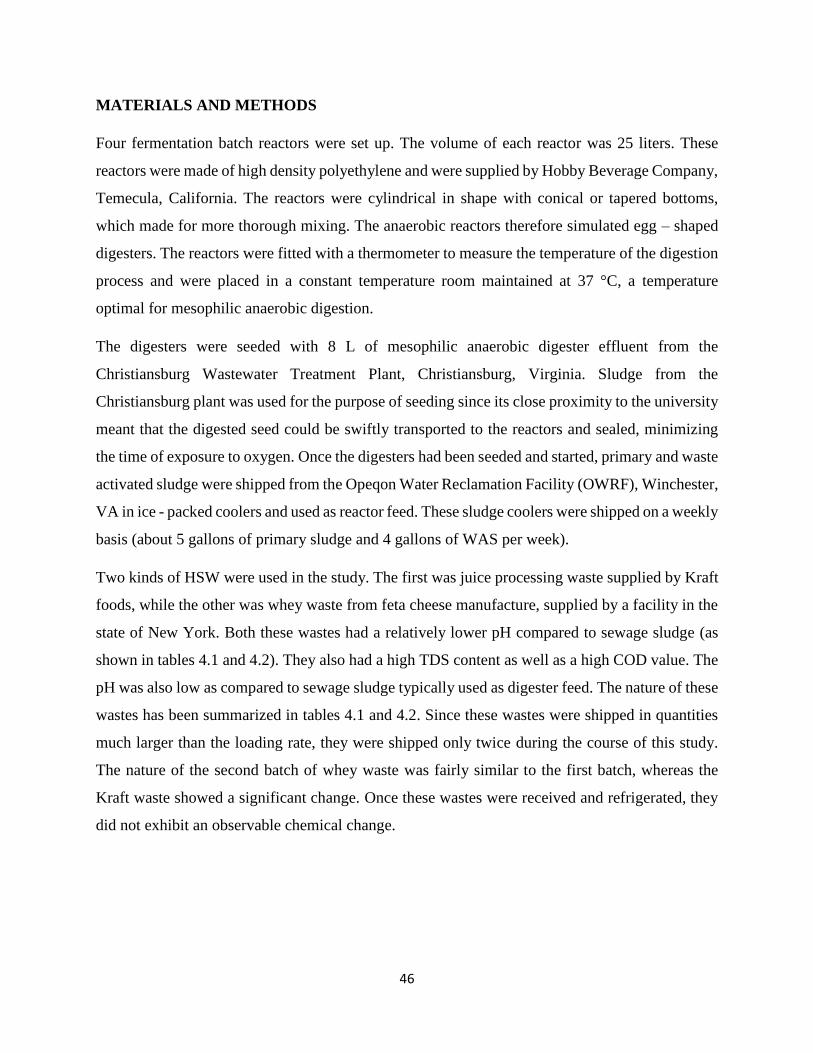
46
MATERIALS AND METHODS
Four fermentation batch reactors were set up. The volume of each reactor was 25 liters. These
reactors were made of high density polyethylene and were supplied by Hobby Beverage Company,
Temecula, California. The reactors were cylindrical in shape with conical or tapered bottoms,
which made for more thorough mixing. The anaerobic reactors therefore simulated egg – shaped
digesters. The reactors were fitted with a thermometer to measure the temperature of the digestion
process and were placed in a constant temperature room maintained at 37 °C, a temperature
optimal for mesophilic anaerobic digestion.
The digesters were seeded with 8 L of mesophilic anaerobic digester effluent from the
Christiansburg Wastewater Treatment Plant, Christiansburg, Virginia. Sludge from the
Christiansburg plant was used for the purpose of seeding since its close proximity to the university
meant that the digested seed could be swiftly transported to the reactors and sealed, minimizing
the time of exposure to oxygen. Once the digesters had been seeded and started, primary and waste
activated sludge were shipped from the Opeqon Water Reclamation Facility (OWRF), Winchester,
VA in ice - packed coolers and used as reactor feed. These sludge coolers were shipped on a weekly
basis (about 5 gallons of primary sludge and 4 gallons of WAS per week).
Two kinds of HSW were used in the study. The first was juice processing waste supplied by Kraft
foods, while the other was whey waste from feta cheese manufacture, supplied by a facility in the
state of New York. Both these wastes had a relatively lower pH compared to sewage sludge (as
shown in tables 4.1 and 4.2). They also had a high TDS content as well as a high COD value. The
pH was also low as compared to sewage sludge typically used as digester feed. The nature of these
wastes has been summarized in tables 4.1 and 4.2. Since these wastes were shipped in quantities
much larger than the loading rate, they were shipped only twice during the course of this study.
The nature of the second batch of whey waste was fairly similar to the first batch, whereas the
Kraft waste showed a significant change. Once these wastes were received and refrigerated, they
did not exhibit an observable chemical change.
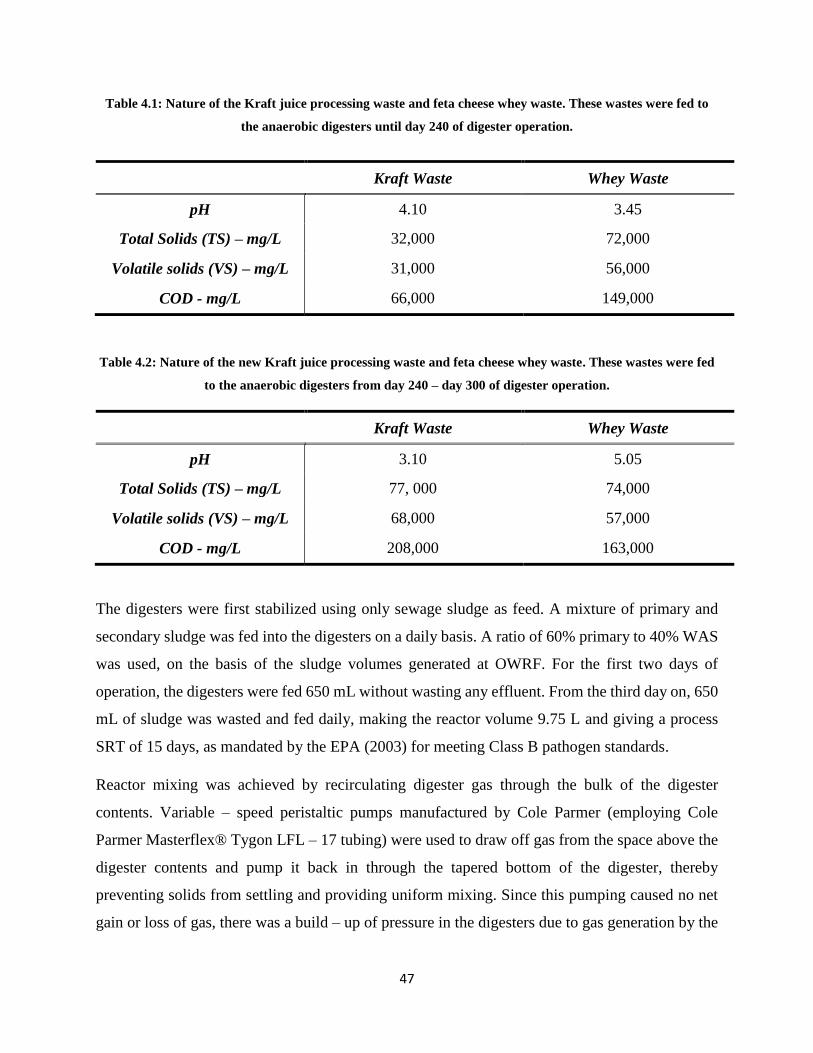
47
Table 4.1: Nature of the Kraft juice processing waste and feta cheese whey waste. These wastes were fed to
the anaerobic digesters until day 240 of digester operation.
Table 4.2: Nature of the new Kraft juice processing waste and feta cheese whey waste. These wastes were fed
to the anaerobic digesters from day 240 – day 300 of digester operation.
The digesters were first stabilized using only sewage sludge as feed. A mixture of primary and
secondary sludge was fed into the digesters on a daily basis. A ratio of 60% primary to 40% WAS
was used, on the basis of the sludge volumes generated at OWRF. For the first two days of
operation, the digesters were fed 650 mL without wasting any effluent. From the third day on, 650
mL of sludge was wasted and fed daily, making the reactor volume 9.75 L and giving a process
SRT of 15 days, as mandated by the EPA (2003) for meeting Class B pathogen standards.
Reactor mixing was achieved by recirculating digester gas through the bulk of the digester
contents. Variable – speed peristaltic pumps manufactured by Cole Parmer (employing Cole
Parmer Masterflex® Tygon LFL – 17 tubing) were used to draw off gas from the space above the
digester contents and pump it back in through the tapered bottom of the digester, thereby
preventing solids from settling and providing uniform mixing. Since this pumping caused no net
gain or loss of gas, there was a build – up of pressure in the digesters due to gas generation by the
Kraft Waste Whey Waste
pH 4.10 3.45
Total Solids (TS) – mg/L 32,000 72,000
Volatile solids (VS) – mg/L 31,000 56,000
COD - mg/L 66,000 149,000
Kraft Waste Whey Waste
pH 3.10 5.05
Total Solids (TS) – mg/L 77, 000 74,000
Volatile solids (VS) – mg/L 68,000 57,000
COD - mg/L 208,000 163,000
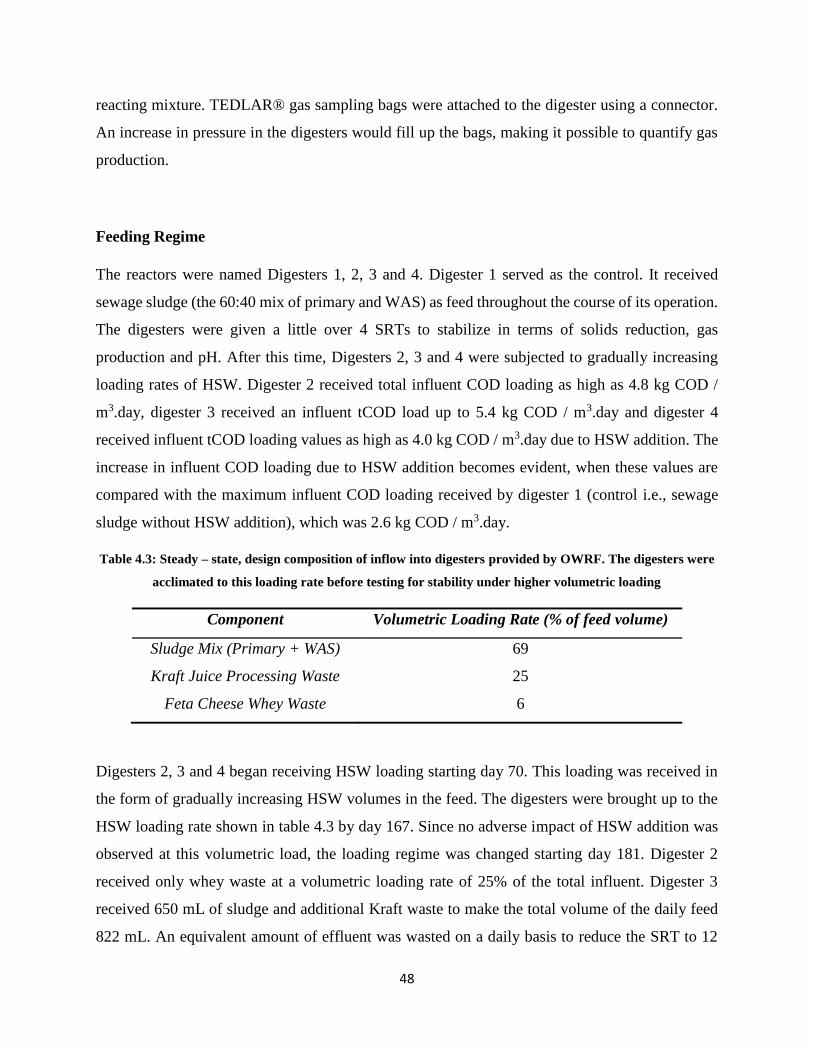
48
reacting mixture. TEDLAR® gas sampling bags were attached to the digester using a connector.
An increase in pressure in the digesters would fill up the bags, making it possible to quantify gas
production.
Feeding Regime
The reactors were named Digesters 1, 2, 3 and 4. Digester 1 served as the control. It received
sewage sludge (the 60:40 mix of primary and WAS) as feed throughout the course of its operation.
The digesters were given a little over 4 SRTs to stabilize in terms of solids reduction, gas
production and pH. After this time, Digesters 2, 3 and 4 were subjected to gradually increasing
loading rates of HSW. Digester 2 received total influent COD loading as high as 4.8 kg COD /
m3.day, digester 3 received an influent tCOD load up to 5.4 kg COD / m3.day and digester 4
received influent tCOD loading values as high as 4.0 kg COD / m3.day due to HSW addition. The
increase in influent COD loading due to HSW addition becomes evident, when these values are
compared with the maximum influent COD loading received by digester 1 (control i.e., sewage
sludge without HSW addition), which was 2.6 kg COD / m3.day.
Table 4.3: Steady – state, design composition of inflow into digesters provided by OWRF. The digesters were
acclimated to this loading rate before testing for stability under higher volumetric loading
Component Volumetric Loading Rate (% of feed volume)
Sludge Mix (Primary + WAS) 69
Kraft Juice Processing Waste 25
Feta Cheese Whey Waste 6
Digesters 2, 3 and 4 began receiving HSW loading starting day 70. This loading was received in
the form of gradually increasing HSW volumes in the feed. The digesters were brought up to the
HSW loading rate shown in table 4.3 by day 167. Since no adverse impact of HSW addition was
observed at this volumetric load, the loading regime was changed starting day 181. Digester 2
received only whey waste at a volumetric loading rate of 25% of the total influent. Digester 3
received 650 mL of sludge and additional Kraft waste to make the total volume of the daily feed
822 mL. An equivalent amount of effluent was wasted on a daily basis to reduce the SRT to 12
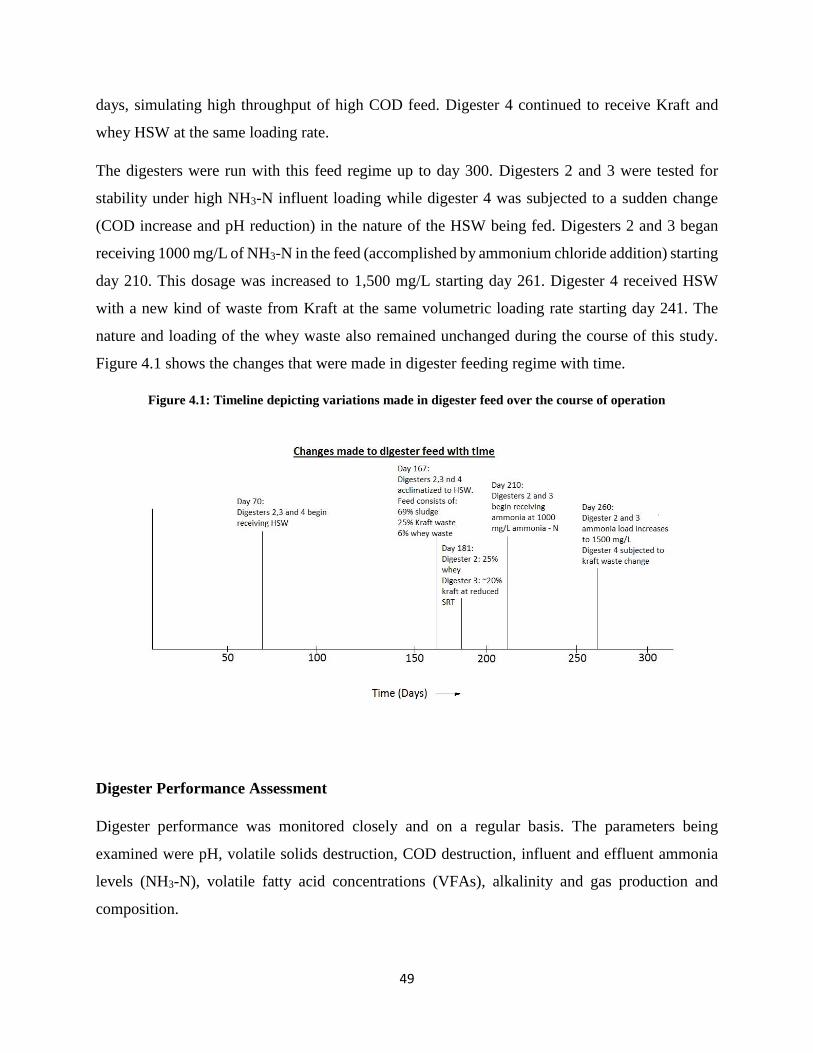
49
days, simulating high throughput of high COD feed. Digester 4 continued to receive Kraft and
whey HSW at the same loading rate.
The digesters were run with this feed regime up to day 300. Digesters 2 and 3 were tested for
stability under high NH3-N influent loading while digester 4 was subjected to a sudden change
(COD increase and pH reduction) in the nature of the HSW being fed. Digesters 2 and 3 began
receiving 1000 mg/L of NH3-N in the feed (accomplished by ammonium chloride addition) starting
day 210. This dosage was increased to 1,500 mg/L starting day 261. Digester 4 received HSW
with a new kind of waste from Kraft at the same volumetric loading rate starting day 241. The
nature and loading of the whey waste also remained unchanged during the course of this study.
Figure 4.1 shows the changes that were made in digester feeding regime with time.
Figure 4.1: Timeline depicting variations made in digester feed over the course of operation
Digester Performance Assessment
Digester performance was monitored closely and on a regular basis. The parameters being
examined were pH, volatile solids destruction, COD destruction, influent and effluent ammonia
levels (NH3-N), volatile fatty acid concentrations (VFAs), alkalinity and gas production and
composition.
50
pH Measurement
Digester pH was monitored using an Oakton ® basic handheld pH meter manufactured by Cole
Parmer. Influent and Effluent pH values were monitored, recorded and plotted on a regular basis.
Effluent pH values greater than 6.8 would signify healthy digester functioning, although values
closer to or greater than 7.0 would be optimum for methanogenic activity (Grady et al., 2011).
VS Measurement
VS destruction is an important parameter to gauge digester performance. VS destruction of greater
than 50% shows good digester health, while values above 40% are acceptable (Metcalf and Eddy,
1991). Aluminum weighing pans were used to calculate VS content of the influent and effluent. A
cole – parmer analytical balance was used to weigh the samples. The pans were pre – baked in a
550 °C oven to get rid of any residual volatile compounds or coatings that may be present. The
weight of the empty pans was noted. The sample whose VS was to be measured was then added
onto the pan. This weight was also recorded. The pan was placed in an oven at 105 °C for a
minimum of three hours to evaporate all the water from it. The weight of the pan was recorded
again, and the weight of the solids left on the pan signified the total solids (TS) of the sample. The
pans containing these solids were then placed in a muffle furnace at 550 °C for a minimum of two
hours to burn off organic (i.e., volatile) matter. The weight of the residue was recorded, and the
loss in weight in the muffle furnace indicated the VS content of the sample. These analyses were
regularly carried out for the influent fed as well as the effluent that was wasted.
Total COD Measurement
Total COD measurement is carried out using the closed titrimetric method (standard method
5220C). The detection limit of this test was 450 mg/L of COD, requiring samples of higher COD
to be diluted and analyzed. This dilution factor was later multiplied by the COD of the analyzed
sample to get the actual COD of the substance being tested. For this test, 5 mL of diluted sample
was mixed with 5 mL of digestion reagent (a 0.0167 M solution of potassium dichromate, K2Cr2O7
with concentrated H2SO4 and HgSO4) and 7 mL of sulfuric acid reagent (a solution of concentrated
H2SO4 and Ag2SO4). This mixture was digested in an oven at 150 °C for two hours and then cooled
down. Some of the dichromate was consumed in oxidizing the COD present in the sample. The
remaining dichromate was estimated by titration against 0.10 M Ferrous Ammonium Sulfate
51
(FAS) solution using Ferroin indicator. The dichromate consumed was used as a measure of the
COD of the sample.
Ammonia (NH3-N) Measurement
Distillation and titrimetry were used to calculate NH3-N levels in the influent as well as the effluent
(standard method 4500). A known volume of the sample (2.5 mL for the purpose of our analyses)
was mixed with borate buffer solution (a solution of sodium hydroxide and sodium tetraborate)
and diluted to 100 mL with distilled water. The pH of the mixture was then adjusted to 9.5 using
1 N NaOH. The sample was then subjected to distillation and the vapors generated were captured
in a boric acid indicator solution (an aqueous solution of boric acid containing methyl red and
methylene blue indicators). The color of the indicator solution would change from purple to green.
The solution was then titrated against 0.02 N sulfuric acid. The volume of sulfuric acid consumed
was used to determine NH3-N.
VFA Measurement
VFA measurements were carried out using gas chromatography coupled with a flame ionization
detector (GC-FID). A Shimadzu gas chromatograph (GC – 14A) was used for the purpose of these
analyses. The column employed was a Nukol™ fused silica column (15 m x 0.53 mm, 0.5 µm film
thickness). A Shimadzu computer integrator (CR501 Chromatopak) was used to quantify and
analyze data. Helium was used as the carrier gas. VFA concentrations were obtained as mg/L of
C2 – C7 organic acids, with acetic acid, propionic acid, butyric acid and heptanoic acid being
detected.
Gas Production and composition Analysis
Gas production was of prime interest and was monitored on a daily basis. The Tedlar® gas bags
(25 L) that were connected to the digesters for the purpose of gas collection and sampling were
supplied by Restek.
On a daily basis, these bags were disconnected and connected to a pump that emptied out the gas
from them at a fixed rate. The pump was calibrated by measuring the time it took to empty out
exactly 10 liters of gas that were filled into an empty Tedlar® bag. Using the calculated pump flow
52
rate, the time taken to empty the bag was then used to calculate the volume of gas contained in it.
This was recorded as the daily (or 24 hour) gas production.
Statistical analysis of gas production was carried out using JMP 10.0, a software developed by
SAS. The mean gas production and standard deviation were calculated for each digester. Also, the
software was used to calculate 75% confidence limits for gas production for each digester.
The gas produced by the digesters was analyzed for methane and carbon dioxide content. A
Shimadzu 14A Gas Chromatograph was used with a Thermo Conductivity Detector (TCD). A
Restek Column packed with Haysep Q media was used (4 m Length, 6.35 mm ID). Helium was
used as the carrier gas. An inlet temperature of 110 °C was employed.
Alkalinity Measurement
A known volume of the sample (5 mL) was titrated against 0.02 N sulfuric acid. The end point pH
was 4.5. The sample was titrated against the sulfuric acid by drop wise addition of the acid titrant
from a burette. An Oakton ® basic handheld pH meter manufactured by Cole Parmer was used to
monitor the pH during titrant addition. Titration was ended when a pH of 4.5 was recorded by the
pH meter. The volume of titrant consumed was then used to estimate sample alkalinity (standard
method 2320B).
53
RESULTS AND DISCUSSION
Digesters 2, 3 and 4 received HSW over the period from day 70 – day 181. During this period,
they were acclimated to the HSW volumes described by table 4.3. Starting day 181, the feeding
regime underwent a change, resulting in an increase in the HSW loading to all three digesters. The
digester function under these conditions has been discussed in detail in this section.
Digesters 3 and 4 began receiving the new batch of HSWs starting day 241. Digester 3, which
received a lower volumetric loading of this waste, did not show signs of poor performance or
failure. Digester 4 exhibited failure within less than one SRT of the new waste addition. This
failure was characterized by a sharp fall in pH and almost zero values for VS destruction, COD
destruction and gas production. An increase in VFA concentrations and fall in alkalinity were also
noticed. The digester was “revived” by inoculation using effluent from the other three digesters,
and was back to regular performance levels within a week.
pH Measurement
Digester pH for all four digesters displayed minimal variation, except for a brief period of time
(day 265 – 275) in the case of digester 4, when failure occurred. During the initial period of HSW
addition, pH values as low as 6.8 were observed in digesters 2, 3 and 4. However, these values
rose over time and were consistently above 7.0 (in the range of 7.0 – 7.15 over 95% of the time)
once the digesters had acclimatized to the HSW addition.
Focusing on the failure of digester 4, a sharp fall in pH was noticed, until the digester pH was
almost equal to the pH of the feed itself (about 5.6). Figure 4.2 shows plots of digester pH vs time
for all the digesters. For digester 4, the fall in pH starting at around day 260 shows the beginning
of digester failure, while the rise in pH around day 280, shows improving digester health. Digester
pH was stable at values near 7.10 and fell to values as low as 5.7, indicating that little or no
digestion was taking place.
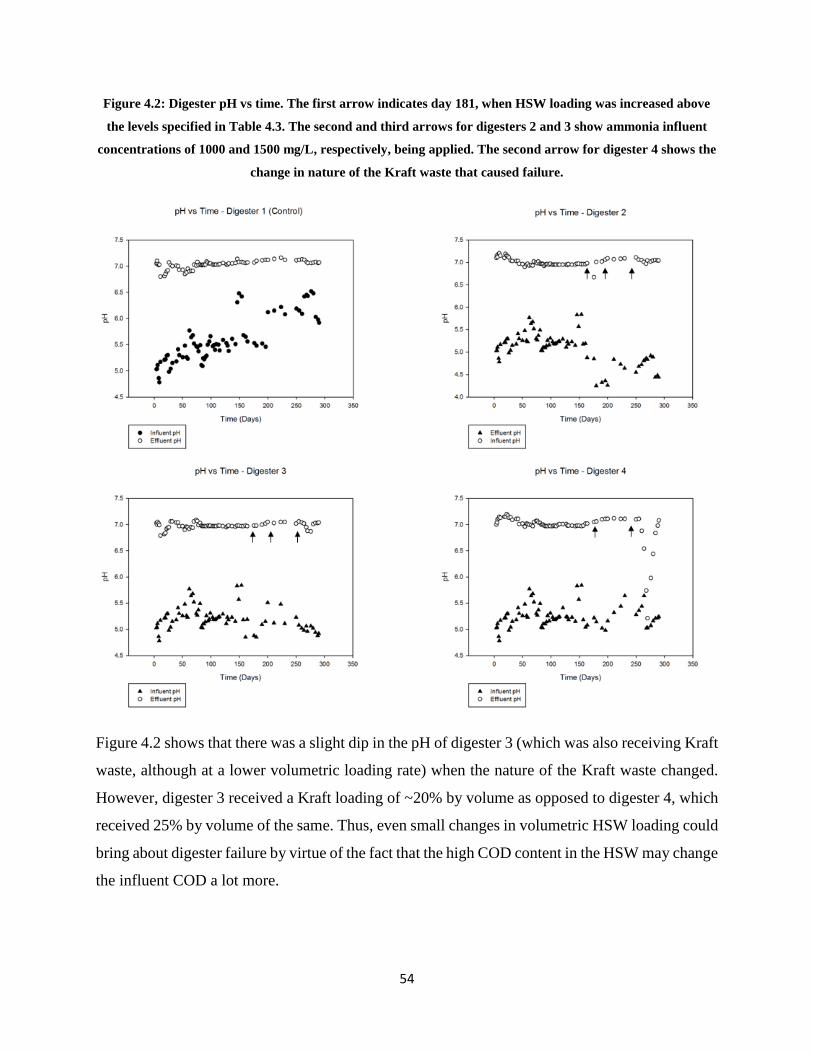
54
Figure 4.2: Digester pH vs time. The first arrow indicates day 181, when HSW loading was increased above
the levels specified in Table 4.3. The second and third arrows for digesters 2 and 3 show ammonia influent
concentrations of 1000 and 1500 mg/L, respectively, being applied. The second arrow for digester 4 shows the
change in nature of the Kraft waste that caused failure.
Figure 4.2 shows that there was a slight dip in the pH of digester 3 (which was also receiving Kraft
waste, although at a lower volumetric loading rate) when the nature of the Kraft waste changed.
However, digester 3 received a Kraft loading of ~20% by volume as opposed to digester 4, which
received 25% by volume of the same. Thus, even small changes in volumetric HSW loading could
bring about digester failure by virtue of the fact that the high COD content in the HSW may change
the influent COD a lot more.
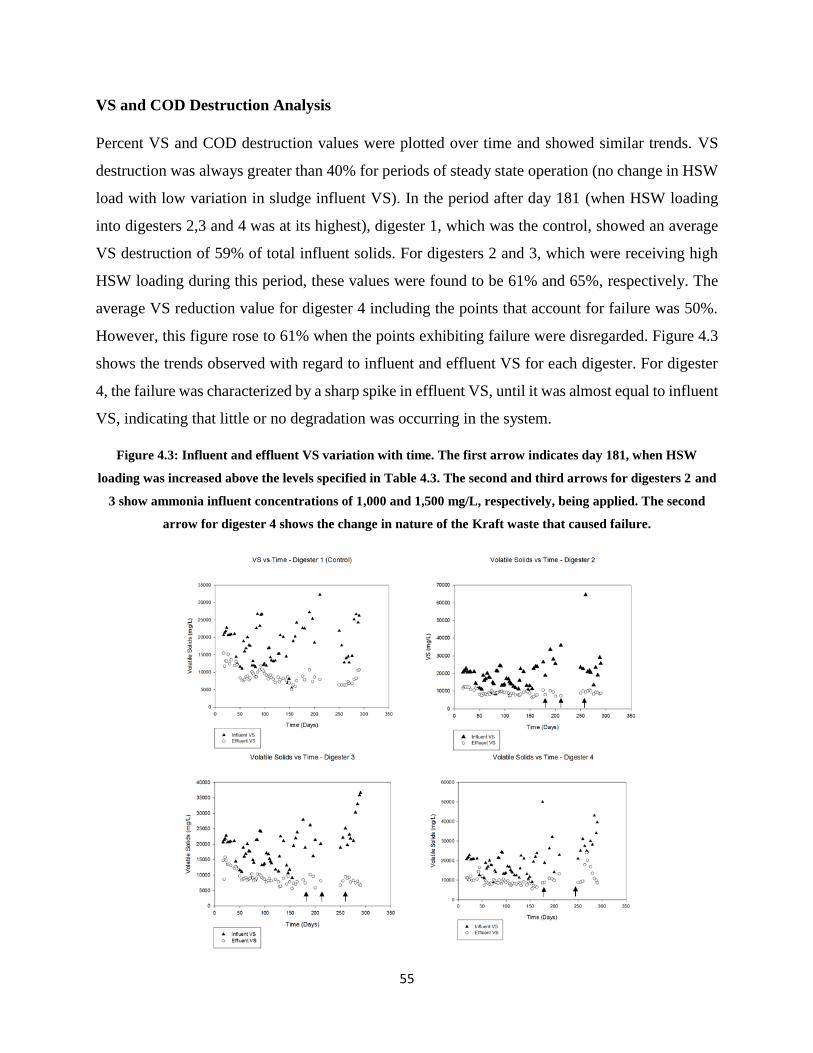
55
VS and COD Destruction Analysis
Percent VS and COD destruction values were plotted over time and showed similar trends. VS
destruction was always greater than 40% for periods of steady state operation (no change in HSW
load with low variation in sludge influent VS). In the period after day 181 (when HSW loading
into digesters 2,3 and 4 was at its highest), digester 1, which was the control, showed an average
VS destruction of 59% of total influent solids. For digesters 2 and 3, which were receiving high
HSW loading during this period, these values were found to be 61% and 65%, respectively. The
average VS reduction value for digester 4 including the points that account for failure was 50%.
However, this figure rose to 61% when the points exhibiting failure were disregarded. Figure 4.3
shows the trends observed with regard to influent and effluent VS for each digester. For digester
4, the failure was characterized by a sharp spike in effluent VS, until it was almost equal to influent
VS, indicating that little or no degradation was occurring in the system.
Figure 4.3: Influent and effluent VS variation with time. The first arrow indicates day 181, when HSW
loading was increased above the levels specified in Table 4.3. The second and third arrows for digesters 2 and
3 show ammonia influent concentrations of 1,000 and 1,500 mg/L, respectively, being applied. The second
arrow for digester 4 shows the change in nature of the Kraft waste that caused failure.
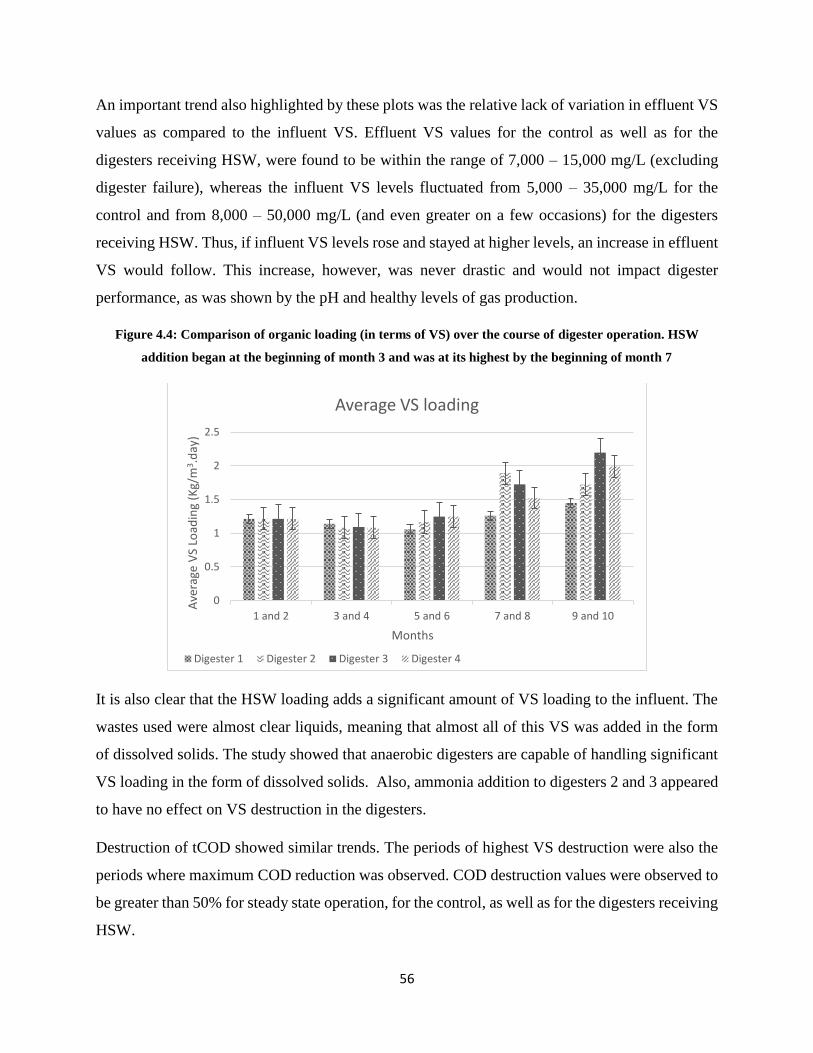
56
An important trend also highlighted by these plots was the relative lack of variation in effluent VS
values as compared to the influent VS. Effluent VS values for the control as well as for the
digesters receiving HSW, were found to be within the range of 7,000 – 15,000 mg/L (excluding
digester failure), whereas the influent VS levels fluctuated from 5,000 – 35,000 mg/L for the
control and from 8,000 – 50,000 mg/L (and even greater on a few occasions) for the digesters
receiving HSW. Thus, if influent VS levels rose and stayed at higher levels, an increase in effluent
VS would follow. This increase, however, was never drastic and would not impact digester
performance, as was shown by the pH and healthy levels of gas production.
Figure 4.4: Comparison of organic loading (in terms of VS) over the course of digester operation. HSW
addition began at the beginning of month 3 and was at its highest by the beginning of month 7
It is also clear that the HSW loading adds a significant amount of VS loading to the influent. The
wastes used were almost clear liquids, meaning that almost all of this VS was added in the form
of dissolved solids. The study showed that anaerobic digesters are capable of handling significant
VS loading in the form of dissolved solids. Also, ammonia addition to digesters 2 and 3 appeared
to have no effect on VS destruction in the digesters.
Destruction of tCOD showed similar trends. The periods of highest VS destruction were also the
periods where maximum COD reduction was observed. COD destruction values were observed to
be greater than 50% for steady state operation, for the control, as well as for the digesters receiving
HSW.
0
0.5
1
1.5
2
2.5
1 and 2 3 and 4 5 and 6 7 and 8 9 and 10
Ave
rage
VS
Load
ing
(Kg/
m3 .
day
)
Months
Average VS loading
Digester 1 Digester 2 Digester 3 Digester 4
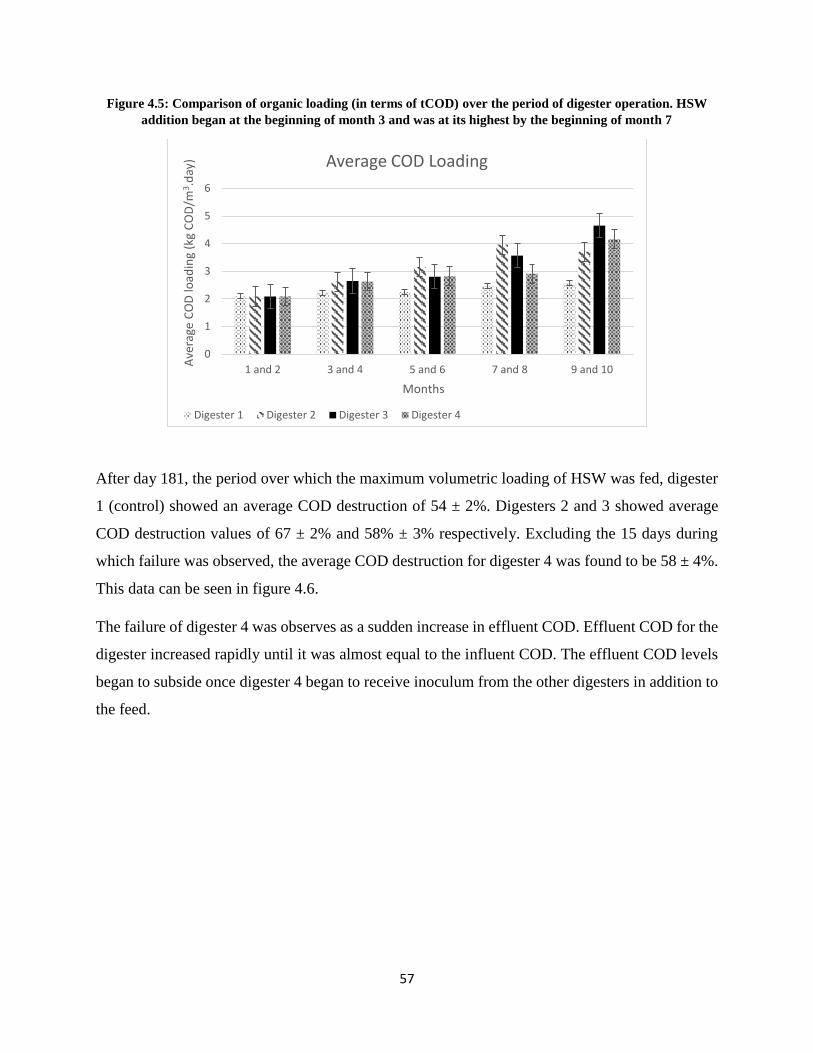
57
Figure 4.5: Comparison of organic loading (in terms of tCOD) over the period of digester operation. HSW
addition began at the beginning of month 3 and was at its highest by the beginning of month 7
After day 181, the period over which the maximum volumetric loading of HSW was fed, digester
1 (control) showed an average COD destruction of 54 ± 2%. Digesters 2 and 3 showed average
COD destruction values of 67 ± 2% and 58% ± 3% respectively. Excluding the 15 days during
which failure was observed, the average COD destruction for digester 4 was found to be 58 ± 4%.
This data can be seen in figure 4.6.
The failure of digester 4 was observes as a sudden increase in effluent COD. Effluent COD for the
digester increased rapidly until it was almost equal to the influent COD. The effluent COD levels
began to subside once digester 4 began to receive inoculum from the other digesters in addition to
the feed.
0
1
2
3
4
5
6
1 and 2 3 and 4 5 and 6 7 and 8 9 and 10
Ave
rage
CO
D lo
adin
g (k
g C
OD
/m3 .
day
)
Months
Average COD Loading
Digester 1 Digester 2 Digester 3 Digester 4
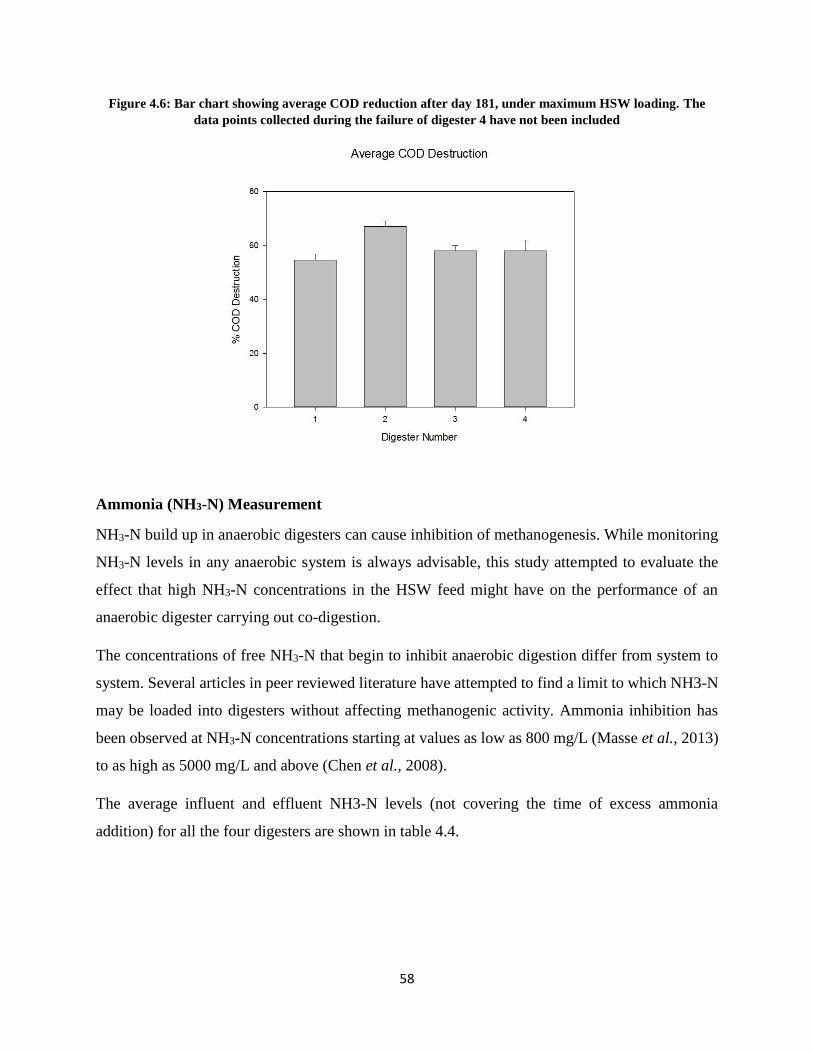
58
Figure 4.6: Bar chart showing average COD reduction after day 181, under maximum HSW loading. The
data points collected during the failure of digester 4 have not been included
Ammonia (NH3-N) Measurement
NH3-N build up in anaerobic digesters can cause inhibition of methanogenesis. While monitoring
NH3-N levels in any anaerobic system is always advisable, this study attempted to evaluate the
effect that high NH3-N concentrations in the HSW feed might have on the performance of an
anaerobic digester carrying out co-digestion.
The concentrations of free NH3-N that begin to inhibit anaerobic digestion differ from system to
system. Several articles in peer reviewed literature have attempted to find a limit to which NH3-N
may be loaded into digesters without affecting methanogenic activity. Ammonia inhibition has
been observed at NH3-N concentrations starting at values as low as 800 mg/L (Masse et al., 2013)
to as high as 5000 mg/L and above (Chen et al., 2008).
The average influent and effluent NH3-N levels (not covering the time of excess ammonia
addition) for all the four digesters are shown in table 4.4.
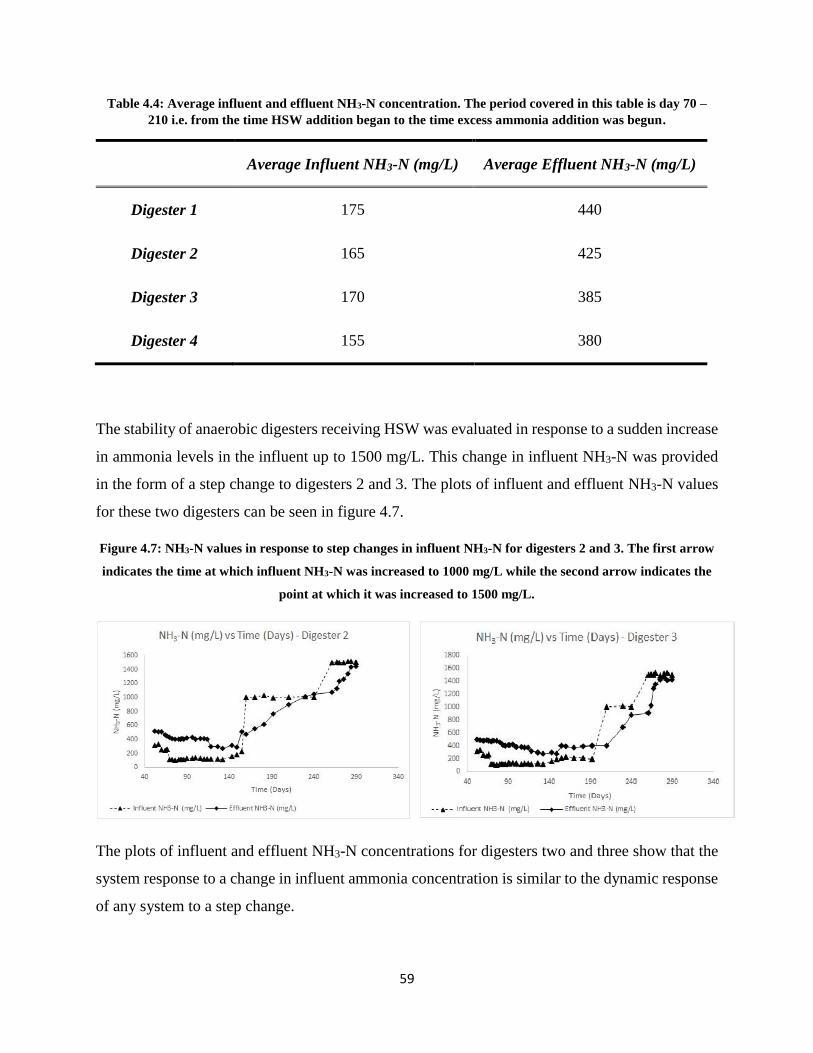
59
Table 4.4: Average influent and effluent NH3-N concentration. The period covered in this table is day 70 –
210 i.e. from the time HSW addition began to the time excess ammonia addition was begun.
Average Influent NH3-N (mg/L) Average Effluent NH3-N (mg/L)
Digester 1 175 440
Digester 2 165 425
Digester 3 170 385
Digester 4 155 380
The stability of anaerobic digesters receiving HSW was evaluated in response to a sudden increase
in ammonia levels in the influent up to 1500 mg/L. This change in influent NH3-N was provided
in the form of a step change to digesters 2 and 3. The plots of influent and effluent NH3-N values
for these two digesters can be seen in figure 4.7.
Figure 4.7: NH3-N values in response to step changes in influent NH3-N for digesters 2 and 3. The first arrow
indicates the time at which influent NH3-N was increased to 1000 mg/L while the second arrow indicates the
point at which it was increased to 1500 mg/L.
The plots of influent and effluent NH3-N concentrations for digesters two and three show that the
system response to a change in influent ammonia concentration is similar to the dynamic response
of any system to a step change.
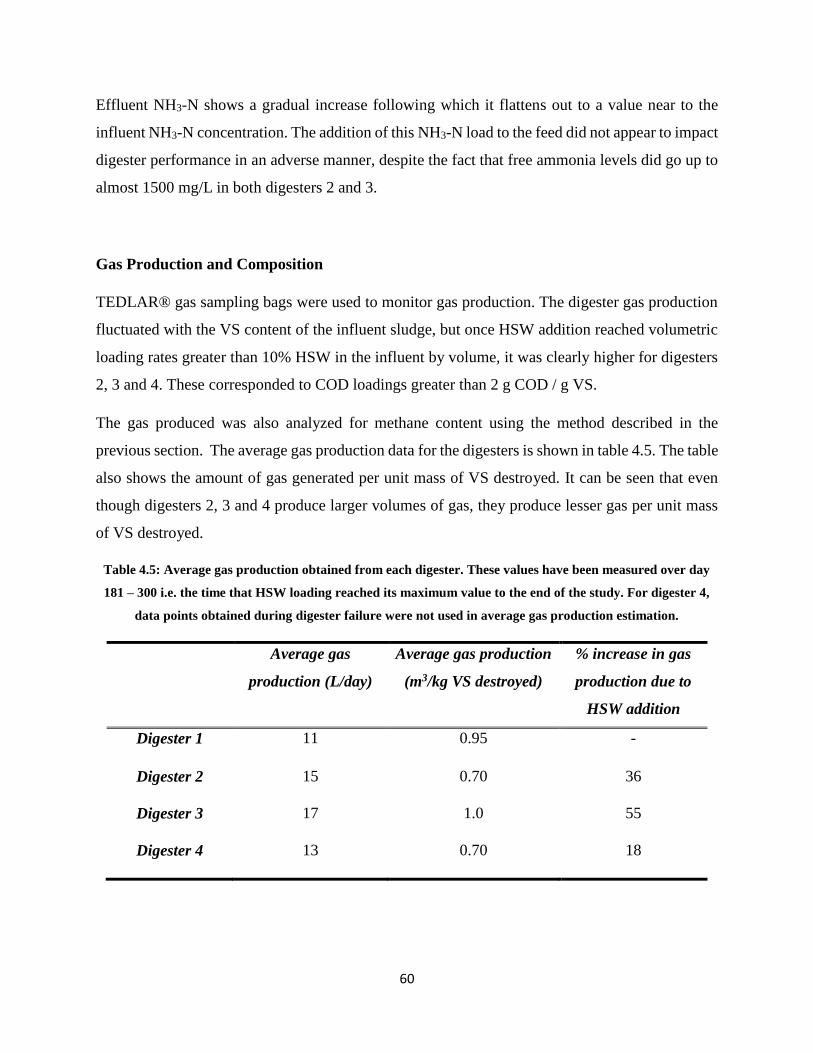
60
Effluent NH3-N shows a gradual increase following which it flattens out to a value near to the
influent NH3-N concentration. The addition of this NH3-N load to the feed did not appear to impact
digester performance in an adverse manner, despite the fact that free ammonia levels did go up to
almost 1500 mg/L in both digesters 2 and 3.
Gas Production and Composition
TEDLAR® gas sampling bags were used to monitor gas production. The digester gas production
fluctuated with the VS content of the influent sludge, but once HSW addition reached volumetric
loading rates greater than 10% HSW in the influent by volume, it was clearly higher for digesters
2, 3 and 4. These corresponded to COD loadings greater than 2 g COD / g VS.
The gas produced was also analyzed for methane content using the method described in the
previous section. The average gas production data for the digesters is shown in table 4.5. The table
also shows the amount of gas generated per unit mass of VS destroyed. It can be seen that even
though digesters 2, 3 and 4 produce larger volumes of gas, they produce lesser gas per unit mass
of VS destroyed.
Table 4.5: Average gas production obtained from each digester. These values have been measured over day
181 – 300 i.e. the time that HSW loading reached its maximum value to the end of the study. For digester 4,
data points obtained during digester failure were not used in average gas production estimation.
Average gas
production (L/day)
Average gas production
(m3/kg VS destroyed)
% increase in gas
production due to
HSW addition
Digester 1 11 0.95 -
Digester 2 15 0.70 36
Digester 3 17 1.0 55
Digester 4 13 0.70 18
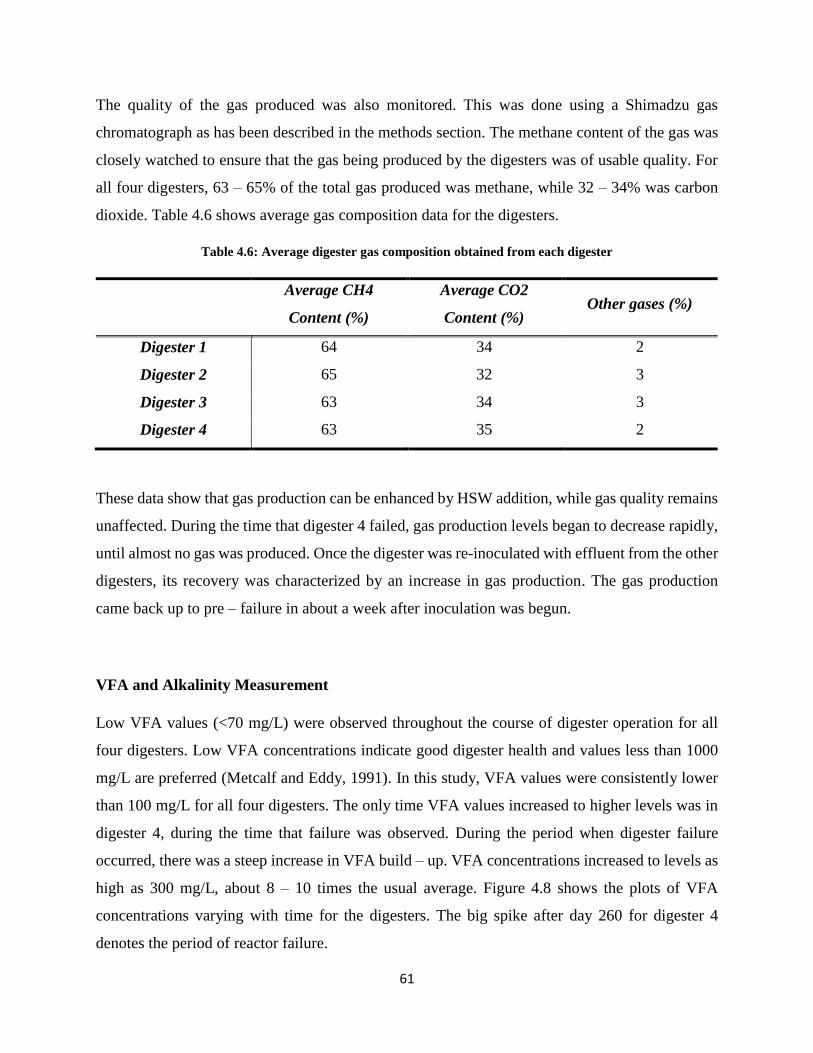
61
The quality of the gas produced was also monitored. This was done using a Shimadzu gas
chromatograph as has been described in the methods section. The methane content of the gas was
closely watched to ensure that the gas being produced by the digesters was of usable quality. For
all four digesters, 63 – 65% of the total gas produced was methane, while 32 – 34% was carbon
dioxide. Table 4.6 shows average gas composition data for the digesters.
Table 4.6: Average digester gas composition obtained from each digester
Average CH4
Content (%)
Average CO2
Content (%) Other gases (%)
Digester 1 64 34 2
Digester 2 65 32 3
Digester 3 63 34 3
Digester 4 63 35 2
These data show that gas production can be enhanced by HSW addition, while gas quality remains
unaffected. During the time that digester 4 failed, gas production levels began to decrease rapidly,
until almost no gas was produced. Once the digester was re-inoculated with effluent from the other
digesters, its recovery was characterized by an increase in gas production. The gas production
came back up to pre – failure in about a week after inoculation was begun.
VFA and Alkalinity Measurement
Low VFA values (<70 mg/L) were observed throughout the course of digester operation for all
four digesters. Low VFA concentrations indicate good digester health and values less than 1000
mg/L are preferred (Metcalf and Eddy, 1991). In this study, VFA values were consistently lower
than 100 mg/L for all four digesters. The only time VFA values increased to higher levels was in
digester 4, during the time that failure was observed. During the period when digester failure
occurred, there was a steep increase in VFA build – up. VFA concentrations increased to levels as
high as 300 mg/L, about 8 – 10 times the usual average. Figure 4.8 shows the plots of VFA
concentrations varying with time for the digesters. The big spike after day 260 for digester 4
denotes the period of reactor failure.
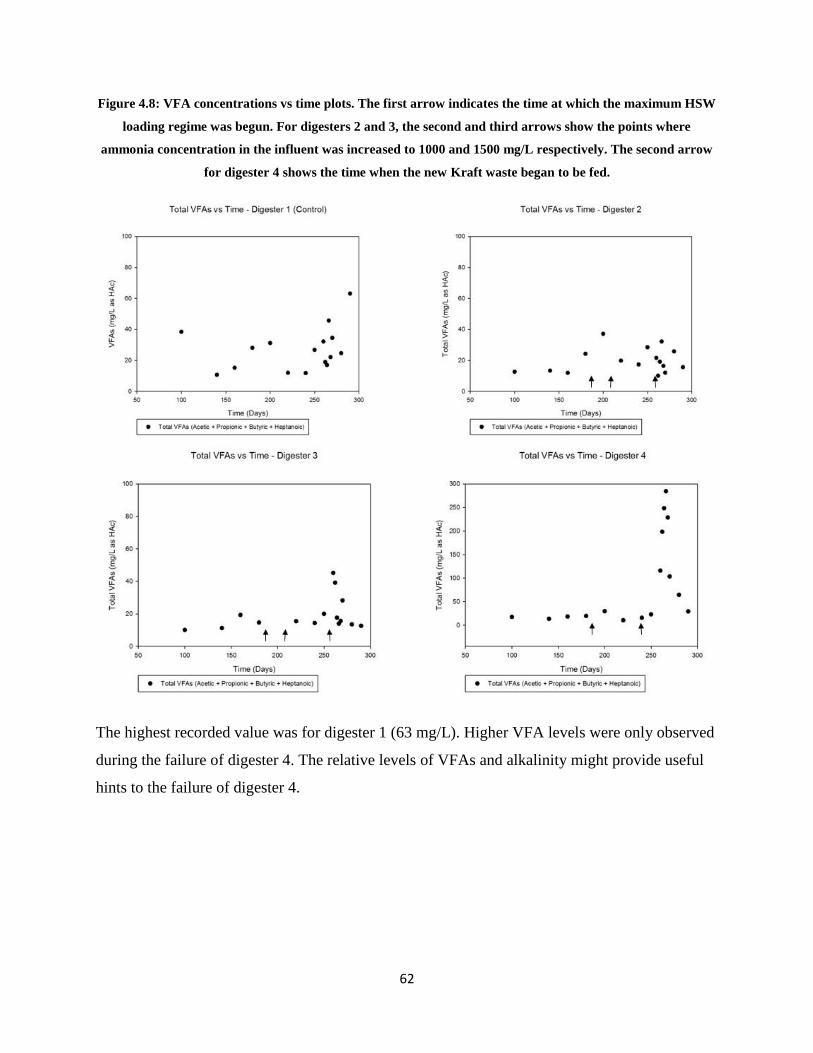
62
Figure 4.8: VFA concentrations vs time plots. The first arrow indicates the time at which the maximum HSW
loading regime was begun. For digesters 2 and 3, the second and third arrows show the points where
ammonia concentration in the influent was increased to 1000 and 1500 mg/L respectively. The second arrow
for digester 4 shows the time when the new Kraft waste began to be fed.
The highest recorded value was for digester 1 (63 mg/L). Higher VFA levels were only observed
during the failure of digester 4. The relative levels of VFAs and alkalinity might provide useful
hints to the failure of digester 4.
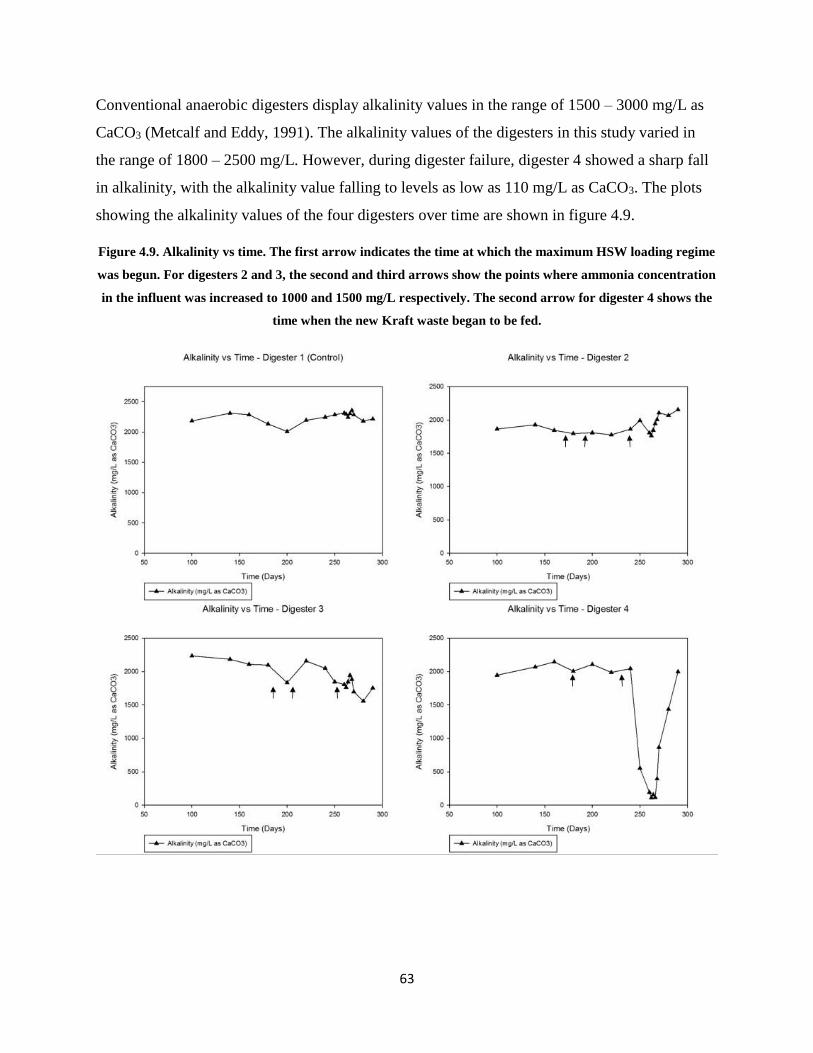
63
Conventional anaerobic digesters display alkalinity values in the range of 1500 – 3000 mg/L as
CaCO3 (Metcalf and Eddy, 1991). The alkalinity values of the digesters in this study varied in
the range of 1800 – 2500 mg/L. However, during digester failure, digester 4 showed a sharp fall
in alkalinity, with the alkalinity value falling to levels as low as 110 mg/L as CaCO3. The plots
showing the alkalinity values of the four digesters over time are shown in figure 4.9.
Figure 4.9. Alkalinity vs time. The first arrow indicates the time at which the maximum HSW loading regime
was begun. For digesters 2 and 3, the second and third arrows show the points where ammonia concentration
in the influent was increased to 1000 and 1500 mg/L respectively. The second arrow for digester 4 shows the
time when the new Kraft waste began to be fed.
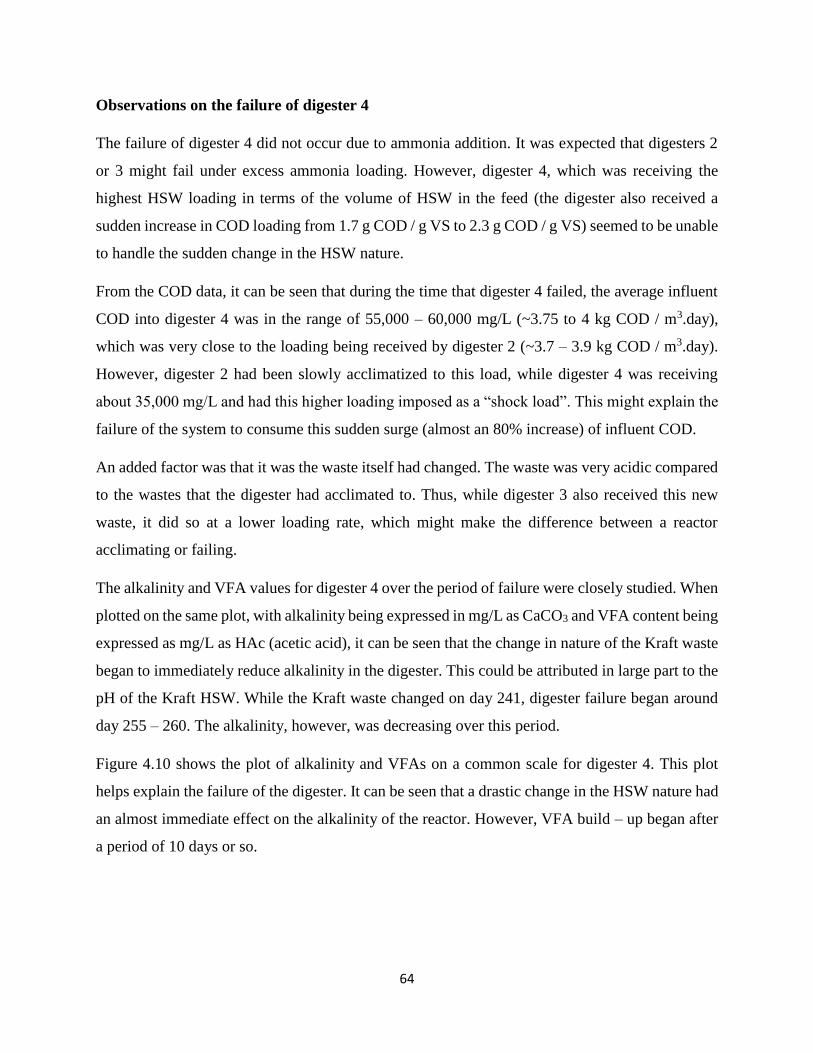
64
Observations on the failure of digester 4
The failure of digester 4 did not occur due to ammonia addition. It was expected that digesters 2
or 3 might fail under excess ammonia loading. However, digester 4, which was receiving the
highest HSW loading in terms of the volume of HSW in the feed (the digester also received a
sudden increase in COD loading from 1.7 g COD / g VS to 2.3 g COD / g VS) seemed to be unable
to handle the sudden change in the HSW nature.
From the COD data, it can be seen that during the time that digester 4 failed, the average influent
COD into digester 4 was in the range of 55,000 – 60,000 mg/L (~3.75 to 4 kg COD / m3.day),
which was very close to the loading being received by digester 2 (~3.7 – 3.9 kg COD / m3.day).
However, digester 2 had been slowly acclimatized to this load, while digester 4 was receiving
about 35,000 mg/L and had this higher loading imposed as a “shock load”. This might explain the
failure of the system to consume this sudden surge (almost an 80% increase) of influent COD.
An added factor was that it was the waste itself had changed. The waste was very acidic compared
to the wastes that the digester had acclimated to. Thus, while digester 3 also received this new
waste, it did so at a lower loading rate, which might make the difference between a reactor
acclimating or failing.
The alkalinity and VFA values for digester 4 over the period of failure were closely studied. When
plotted on the same plot, with alkalinity being expressed in mg/L as CaCO3 and VFA content being
expressed as mg/L as HAc (acetic acid), it can be seen that the change in nature of the Kraft waste
began to immediately reduce alkalinity in the digester. This could be attributed in large part to the
pH of the Kraft HSW. While the Kraft waste changed on day 241, digester failure began around
day 255 – 260. The alkalinity, however, was decreasing over this period.
Figure 4.10 shows the plot of alkalinity and VFAs on a common scale for digester 4. This plot
helps explain the failure of the digester. It can be seen that a drastic change in the HSW nature had
an almost immediate effect on the alkalinity of the reactor. However, VFA build – up began after
a period of 10 days or so.
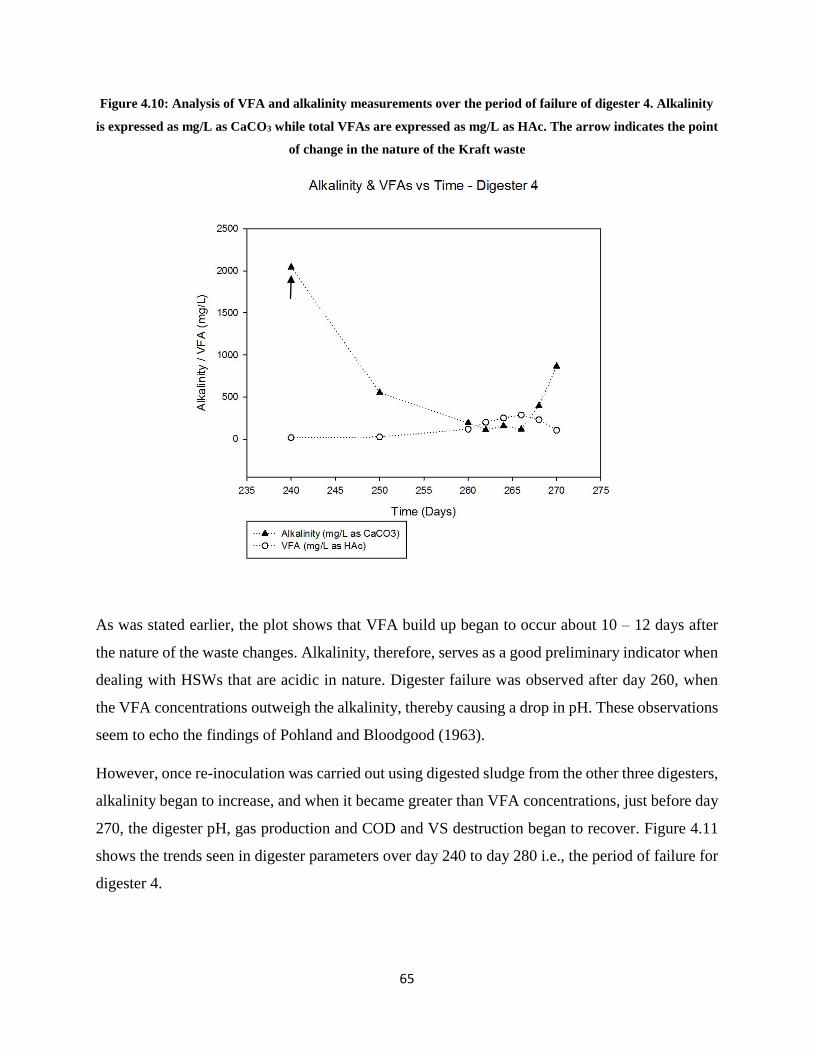
65
Figure 4.10: Analysis of VFA and alkalinity measurements over the period of failure of digester 4. Alkalinity
is expressed as mg/L as CaCO3 while total VFAs are expressed as mg/L as HAc. The arrow indicates the point
of change in the nature of the Kraft waste
As was stated earlier, the plot shows that VFA build up began to occur about 10 – 12 days after
the nature of the waste changes. Alkalinity, therefore, serves as a good preliminary indicator when
dealing with HSWs that are acidic in nature. Digester failure was observed after day 260, when
the VFA concentrations outweigh the alkalinity, thereby causing a drop in pH. These observations
seem to echo the findings of Pohland and Bloodgood (1963).
However, once re-inoculation was carried out using digested sludge from the other three digesters,
alkalinity began to increase, and when it became greater than VFA concentrations, just before day
270, the digester pH, gas production and COD and VS destruction began to recover. Figure 4.11
shows the trends seen in digester parameters over day 240 to day 280 i.e., the period of failure for
digester 4.
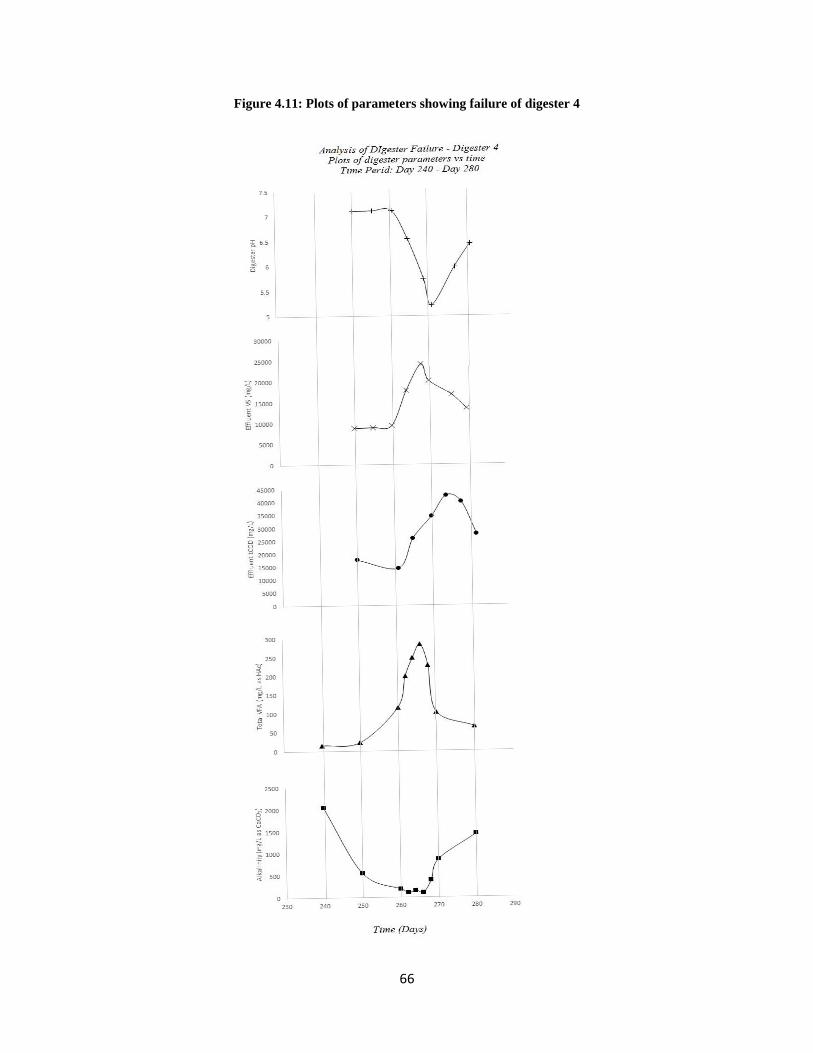
66
Figure 4.11: Plots of parameters showing failure of digester 4
67
CONCLUSION
Anaerobic digesters were successfully operated at high HSW and ammonia loads, and digester
failure was characterized due to an HSW “overload”.
The major conclusions drawn from this study are as follows:
Stable digester operation was achieved with HSW loading rates as high as 25 – 30% of
the total inflow at an SRT of 15 days. These volumetric compositions corresponded to
COD loadings as high as 3 g COD / g VS (4.5 kg COD/ m3.day).
In case of digester 3, a reduction in SRT did not have an impact on digester performance.
High ammonia loading, up to a concentration of 1500 mg/L did not appear to have any
adverse impact on digester performance, suggesting a stability of the system and a high
tolerance capacity for TAN. Thus, a system operating in the pH range of 7.0 – 7.20 at a
temperature of 37 °C.
HSW loading greater than 30% by volume is not recommended as it might cause digester
“overloading” and lead to failure.
Even when COD levels in the HSW are within a range that anaerobic digesters can
process, it is important that the nature of the HSW being added does not suffer a drastic
change. Anaerobic digesters are vulnerable to sudden changes in the nature of the feed, as
was demonstrated by the failure of digester 4 within 10 days of a change in the nature of
the HSW being added.
For wastes that are acidic in nature, alkalinity is an important parameter to monitor.
Acidic wastes can effect an immediate reduction in the alkalinity of an anaerobic
digester. When alkalinity values (expressed as mg/L as CaCO3) were smaller than the
total VFA concentration (mg/L as HAc), digester failure was observed.
68
REFERENCES
Ağdağ, O. N., & Sponza, D. T. (2005). Co-digestion of industrial sludge with municipal solid
wastes in anaerobic simulated landfilling reactors. Process Biochemistry, 40(5), 1871-1879.
Athanasoulia, E., Melidis, P., & Aivasidis, A. (2012). Anaerobic waste activated sludge co-
digestion with olive mill wastewater. Water Sci Technol, 65(12), 2251-2257.
Aymerich, E., Esteban-Gutierrez, M., & Sancho, L. (2013). Analysis of the stability of high-solids
anaerobic digestion of agro-industrial waste and sewage sludge. Bioresour Technol, 144, 107-114.
Buendia, I. M., Fernandez, F. J., Villasenor, J., & Rodriguez, L. (2009). Feasibility of anaerobic
co-digestion as a treatment option of meat industry wastes. Bioresour Technol, 100(6), 1903-1909.
Calli, B., Mertoglu, B., Inanc, B., & Yenigun, O. (2005). Effects of high free ammonia
concentrations on the performances of anaerobic bioreactors. Process Biochemistry, 40(3-4),
1285-1292.
Chen, Y., Cheng, J. J., & Creamer, K. S. (2008). Inhibition of anaerobic digestion process: a
review. Bioresour Technol, 99(10), 4044-4064.
Cuetos, M. J., Gómez, X., Otero, M., & Morán, A. (2008). Anaerobic digestion of solid
slaughterhouse waste (SHW) at laboratory scale: Influence of co-digestion with the organic
fraction of municipal solid waste (OFMSW). Biochemical Engineering Journal, 40(1), 99-106.
Noutsopoulos, C., Mamais, D., Antoniou, K., Avramides, C., Oikonomopoulos, P., &
Fountoulakis, I. (2013). Anaerobic co-digestion of grease sludge and sewage sludge: the effect of
organic loading and grease sludge content. Bioresour Technol, 131, 452-459.
Rice E.W., Baird R.B., Eaton A.D., Clesceri L.S. (2012). Standard methods for the examination
of water and wastewater, American Public Health Association, American Water Works
Association, Water Environment Federation.
Sheng, K., Chen, X., Pan, J., Kloss, R., Wei, Y., & Ying, Y. (2013). Effect of ammonia and nitrate
on biogas production from food waste via anaerobic digestion. Biosystems Engineering, 116(2),
205-212.
69
Wang, L., Aziz, T. N., & de los Reyes, F. L., 3rd. (2013). Determining the limits of anaerobic co-
digestion of thickened waste activated sludge with grease interceptor waste. Water Res, 47(11),
3835-3844.
Yamashiro, T., Lateef, S. A., Ying, C., Beneragama, N., Lukic, M., Masahiro, I., . . . Umetsu, K.
(2013). Anaerobic co-digestion of dairy cow manure and high concentrated food processing waste.
Journal of Material Cycles and Waste Management, 15(4), 539-547.
Yenigün, O., & Demirel, B. (2013). Ammonia inhibition in anaerobic digestion: A review. Process
Biochemistry, 48(5-6), 901-911.
Zhu, Z., Hsueh, M. K., & He, Q. (2011). Enhancing biomethanation of municipal waste sludge
with grease trap waste as a co-substrate. Renewable Energy, 36(6), 1802-1807.
70
Chapter 5
Conclusion
Based on the data obtained during this study, anaerobic co-digestion using HSWs from juice and
cheese processing industries is a viable and beneficial option for wastewater treatment facilities to
boost gas production and reduce their energy demand. In case of this study, HSW addition
increased VS and COD content in the influent to levels 2 – 3 times higher than the sewage sludge
being fed into the digesters. This did not appear to have a negative impact of digester performance,
as was seen by higher VS and COD destruction values in the digesters receiving HSW, and also
by the increased gas production.
The following concluding remarks may be made:
HSW addition to anaerobic digesters treating municipal sewage sludge can be
accomplished via acclimatization of the digesters to gradually increasing HSW loading.
It is possible to greatly increase gas production by HSW addition. HSW additions that
cause an increase in influent COD loading by up to a factor of three (reaching values of 4.5
Kg COD/m3.day from values in the range of 1.75 kg COD/m3.day) can bring about an
increase in gas production of over 50% per unit reactor volume on a daily volume basis.
When influent VS loading is lower than 1 kg/m3.day, HSW tolerance by means of HSW
addition might also be lower, resulting in poorer performance or digester failure at total
influent COD loading rates greater than 2.5 – 3 g COD / g VS / day.
If the waste being added to the system is acidic in nature, the buffering capacity of the
system dictates the system stability. Poorly buffered systems show poor alkalinity values.
A fall in alkalinity values due to HSW addition could be a preliminary indicator of digester
failure.
For treatment facilities considering HSW addition to anaerobic digesters, thorough HSW
testing is needed. HSW addition must be controlled when digesters receive low VS loading

71
(<1 kg.m3.day) and the nature of the HSW being added (specifically pH and tCOD) must
be regularly monitored.
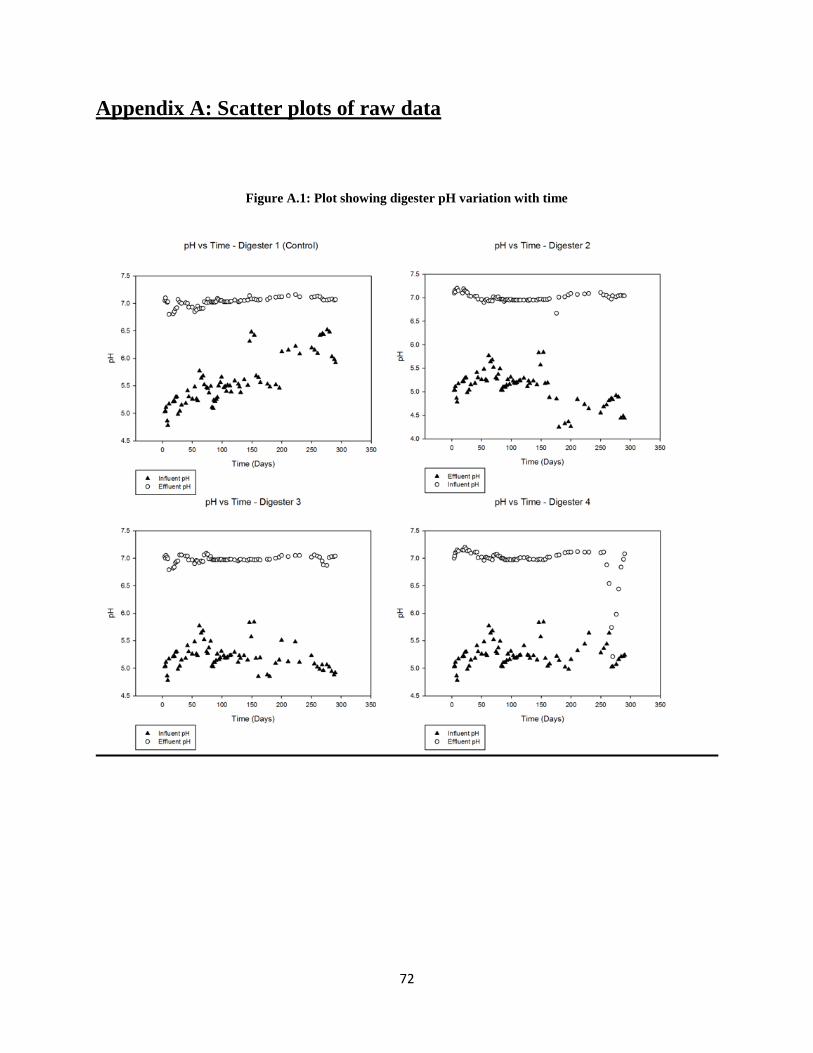
72
Appendix A: Scatter plots of raw data
Figure A.1: Plot showing digester pH variation with time
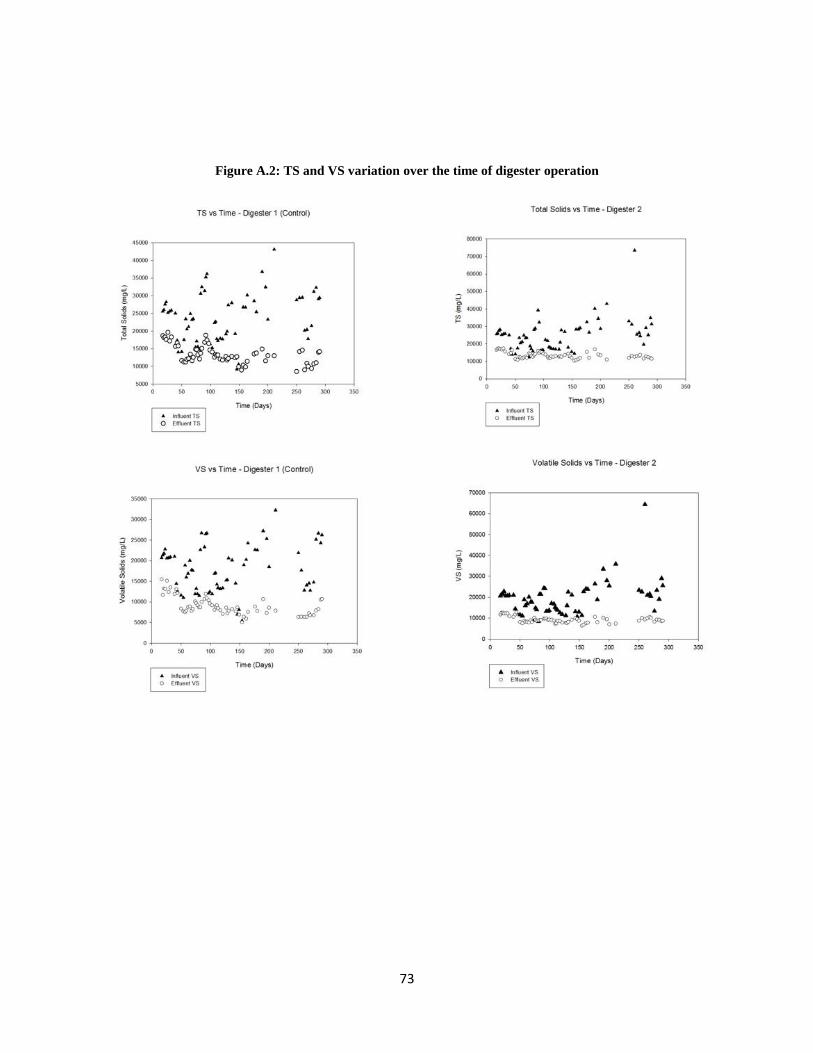
73
Figure A.2: TS and VS variation over the time of digester operation
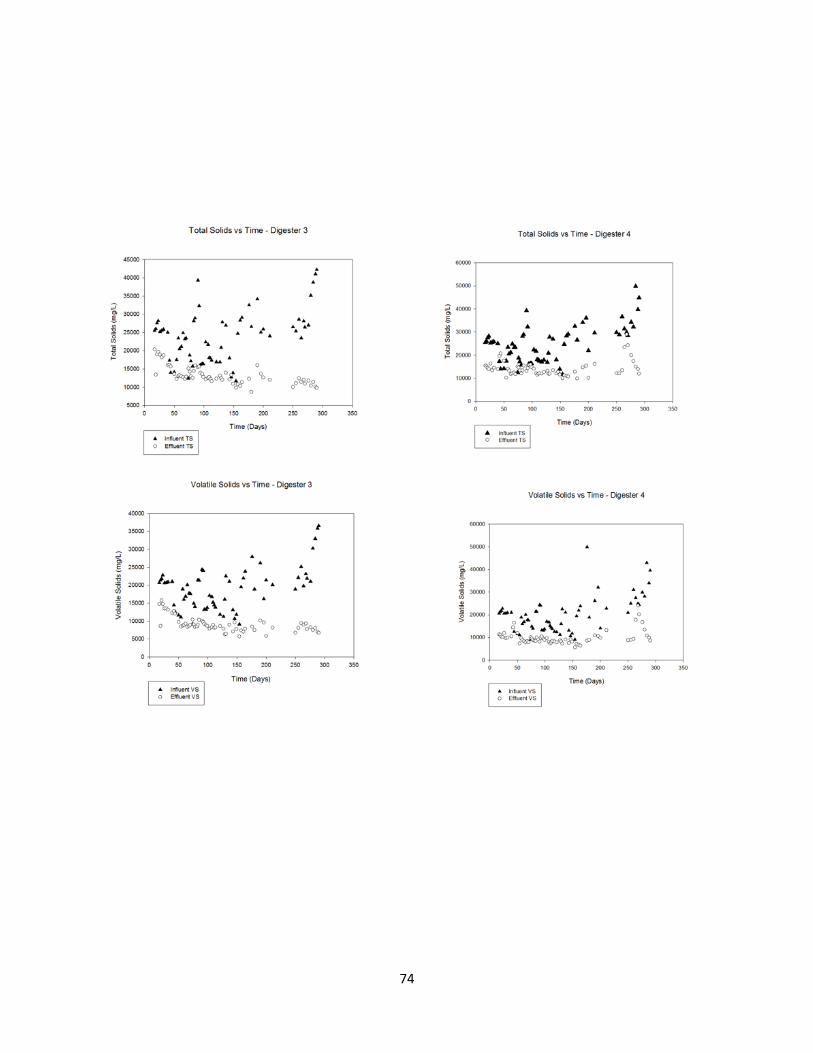
74
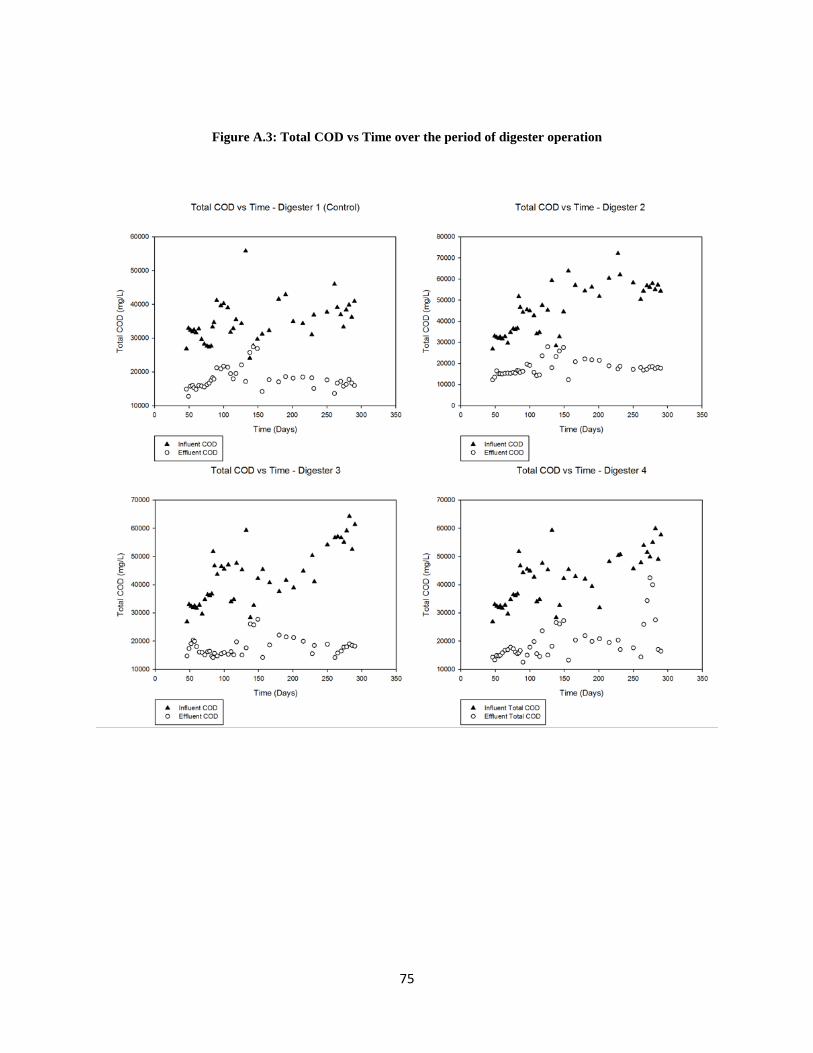
75
Figure A.3: Total COD vs Time over the period of digester operation
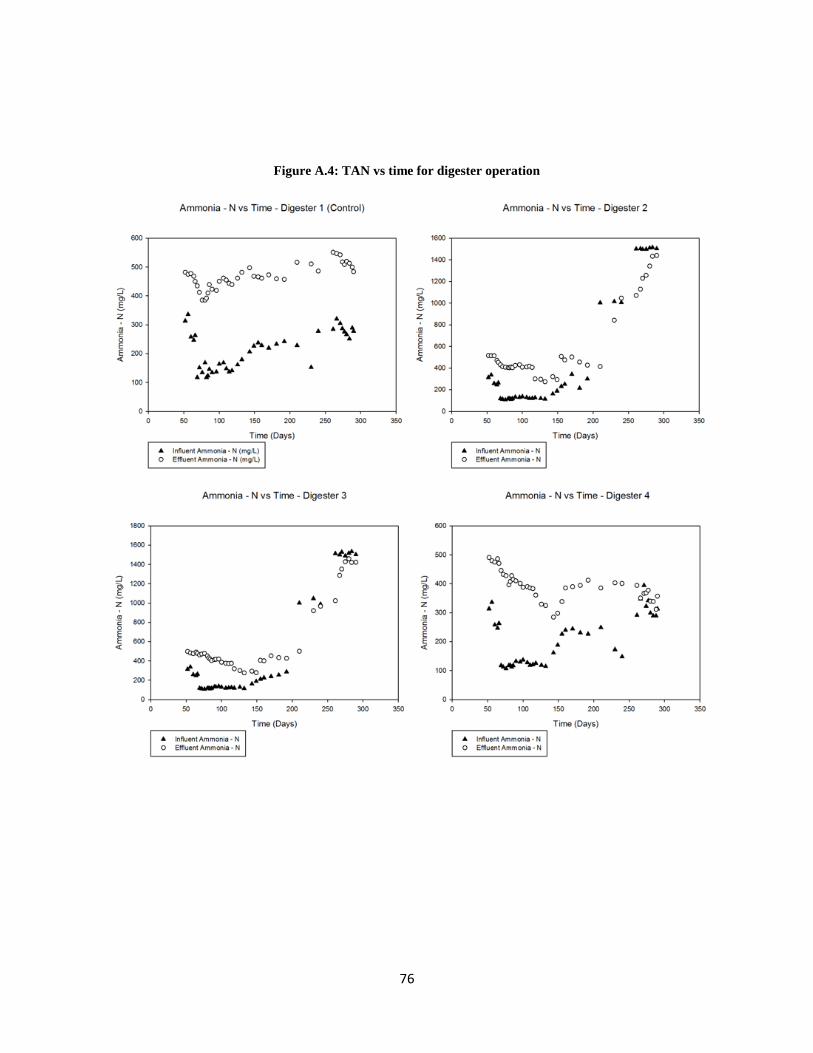
76
Figure A.4: TAN vs time for digester operation
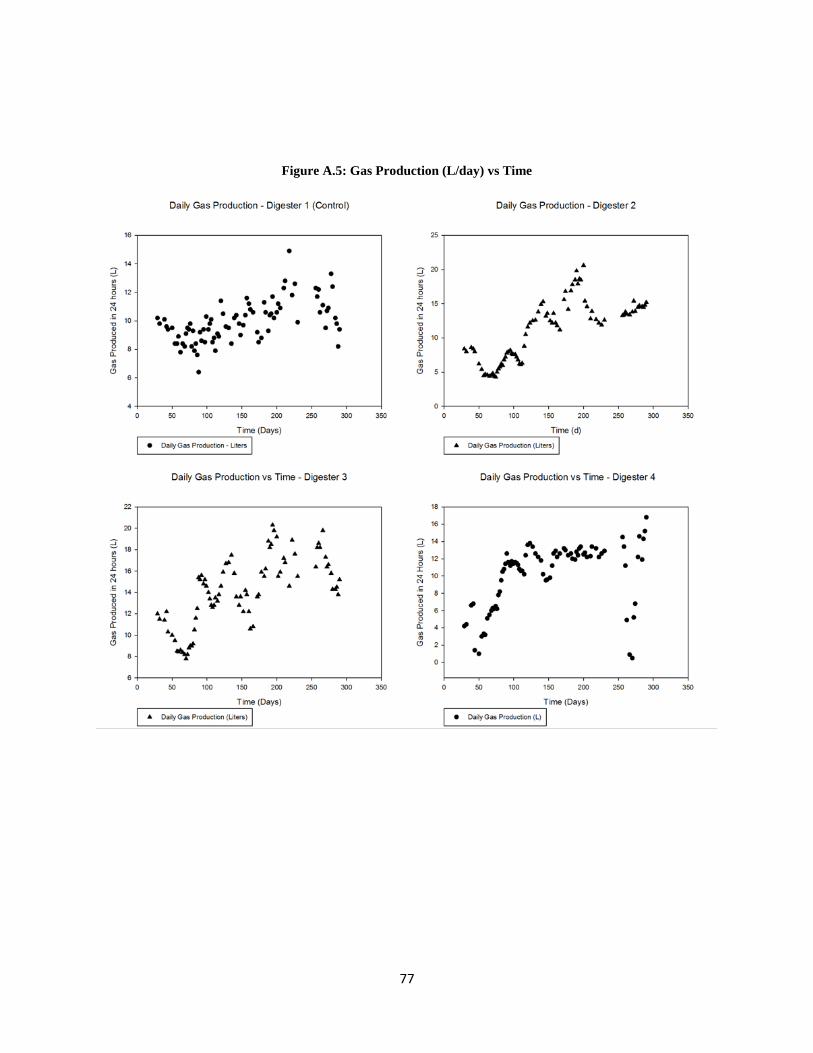
77
Figure A.5: Gas Production (L/day) vs Time
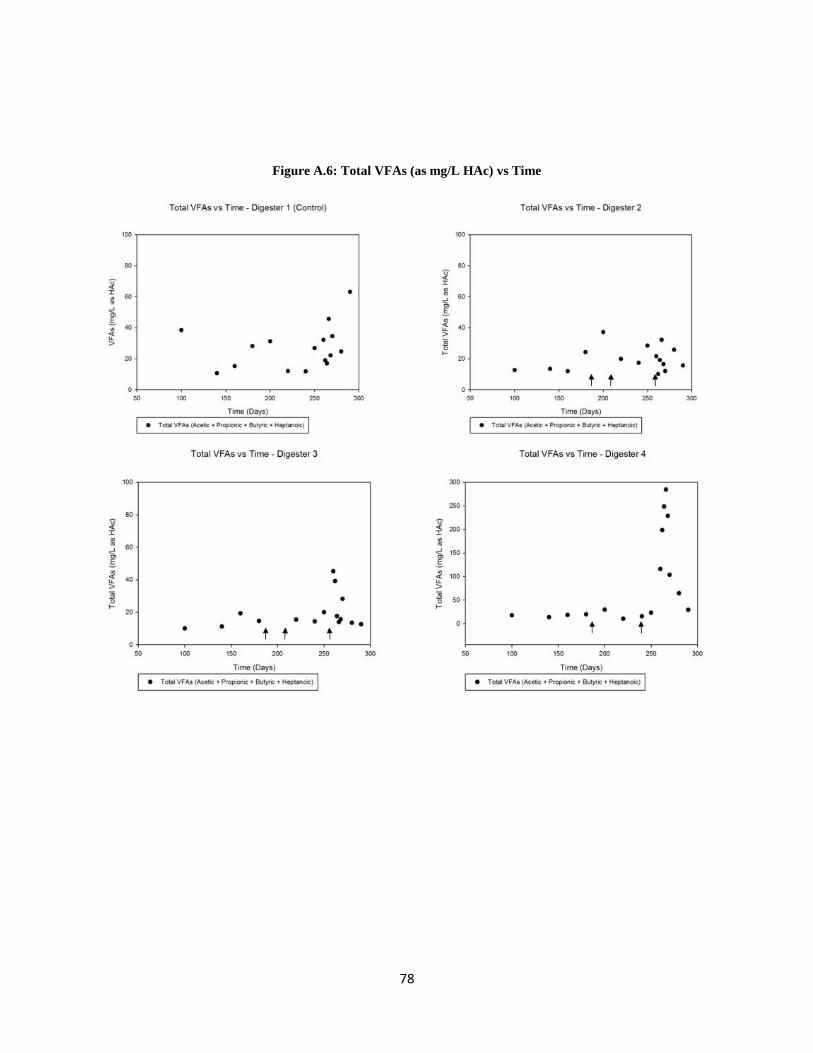
78
Figure A.6: Total VFAs (as mg/L HAc) vs Time
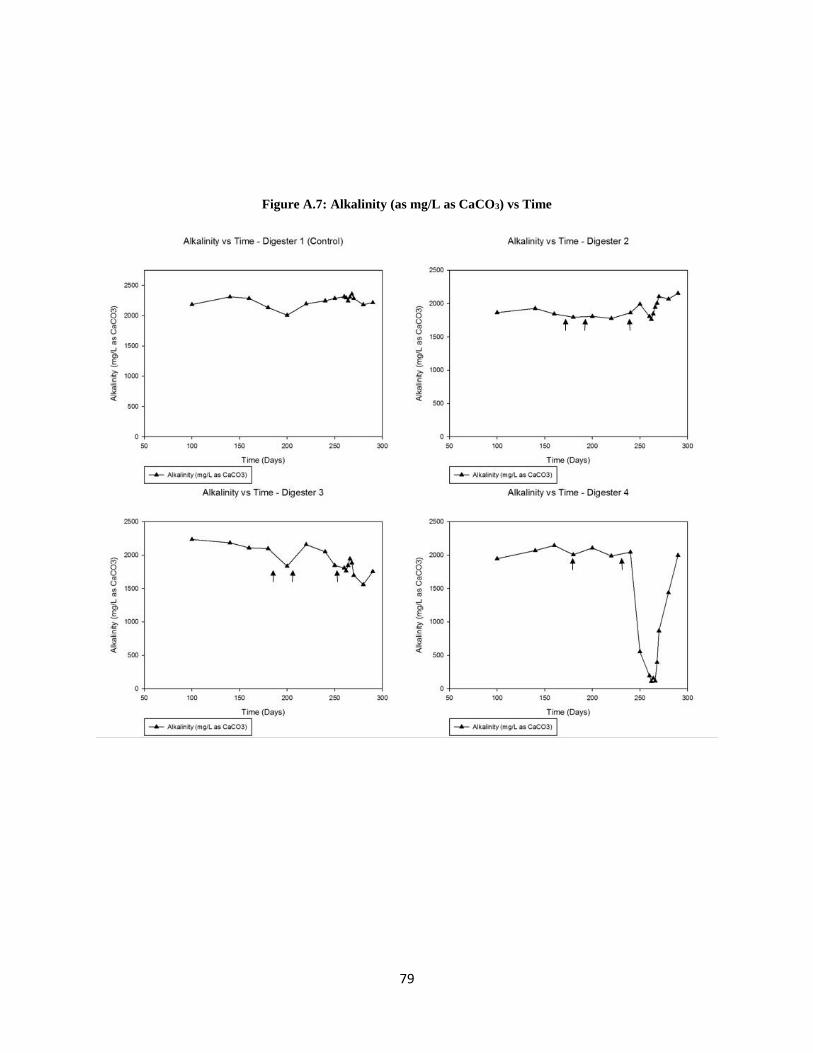
79
Figure A.7: Alkalinity (as mg/L as CaCO3) vs Time
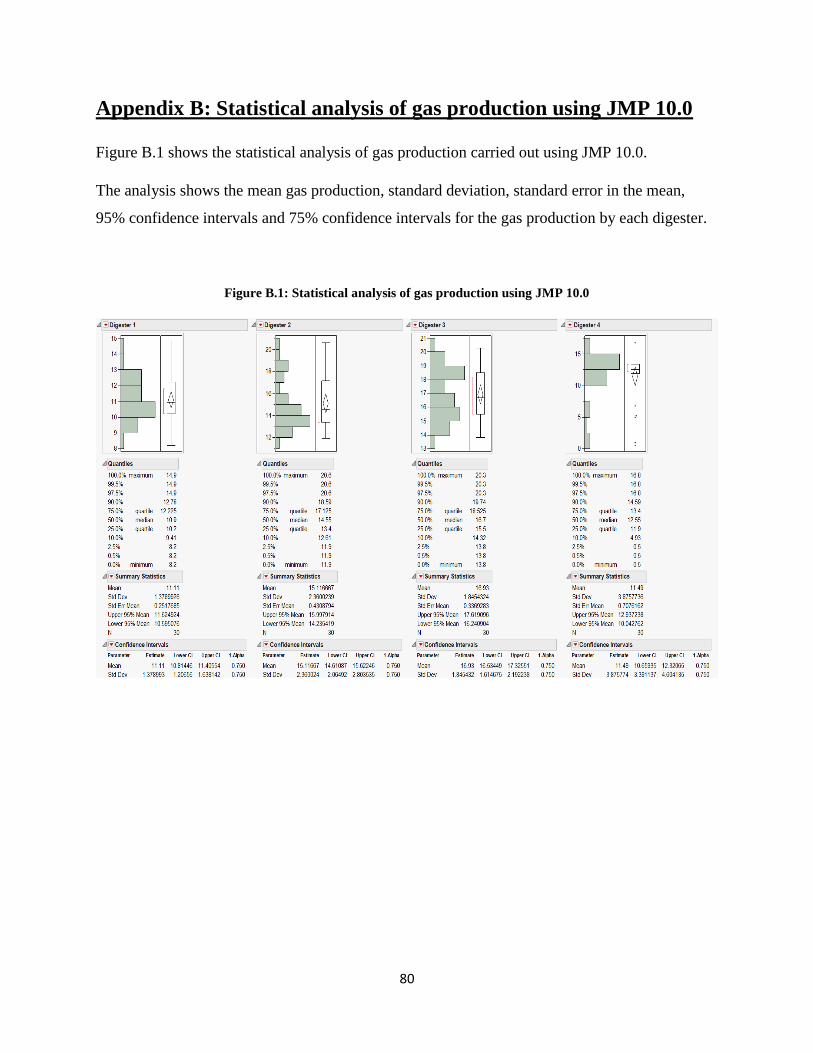
80
Appendix B: Statistical analysis of gas production using JMP 10.0
Figure B.1 shows the statistical analysis of gas production carried out using JMP 10.0.
The analysis shows the mean gas production, standard deviation, standard error in the mean,
95% confidence intervals and 75% confidence intervals for the gas production by each digester.
Figure B.1: Statistical analysis of gas production using JMP 10.0
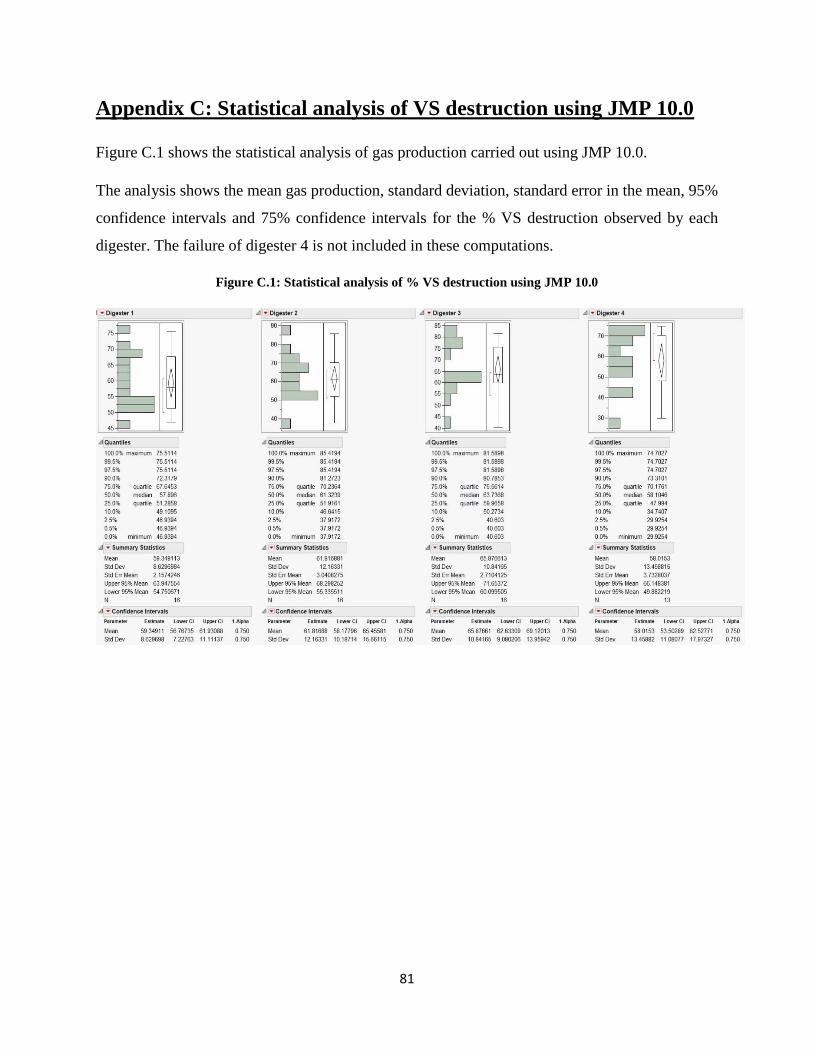
81
Appendix C: Statistical analysis of VS destruction using JMP 10.0
Figure C.1 shows the statistical analysis of gas production carried out using JMP 10.0.
The analysis shows the mean gas production, standard deviation, standard error in the mean, 95%
confidence intervals and 75% confidence intervals for the % VS destruction observed by each
digester. The failure of digester 4 is not included in these computations.
Figure C.1: Statistical analysis of % VS destruction using JMP 10.0
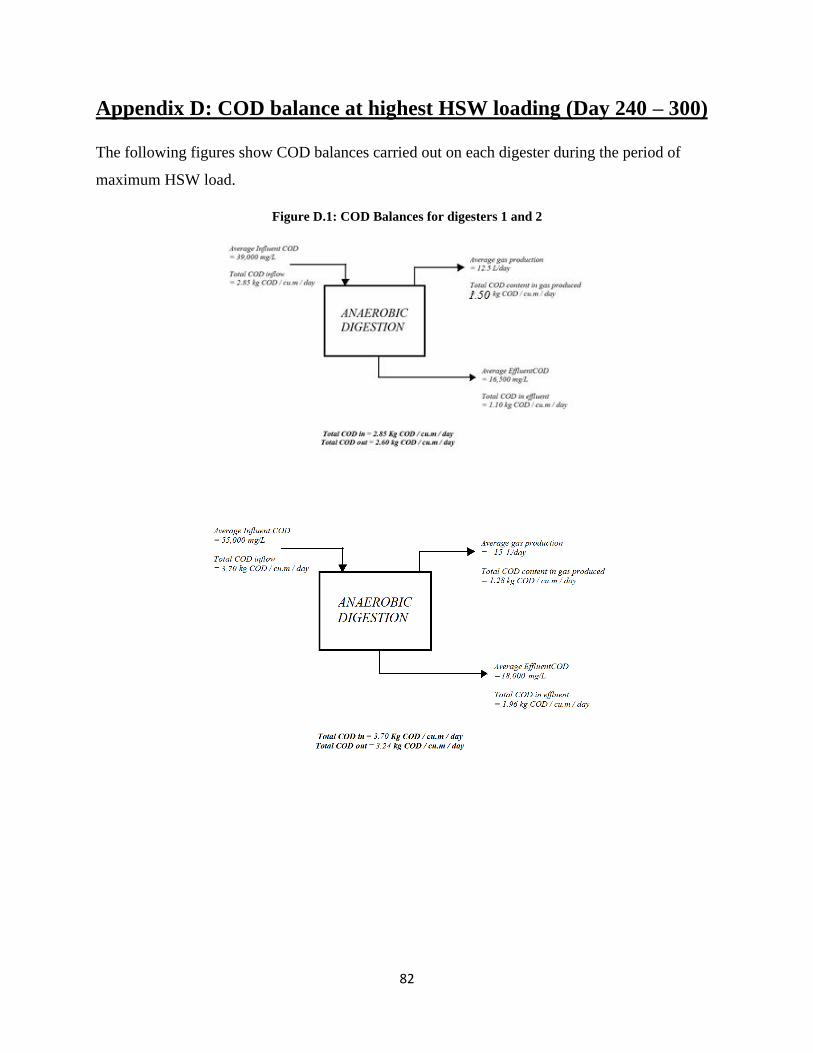
82
Appendix D: COD balance at highest HSW loading (Day 240 – 300)
The following figures show COD balances carried out on each digester during the period of
maximum HSW load.
Figure D.1: COD Balances for digesters 1 and 2
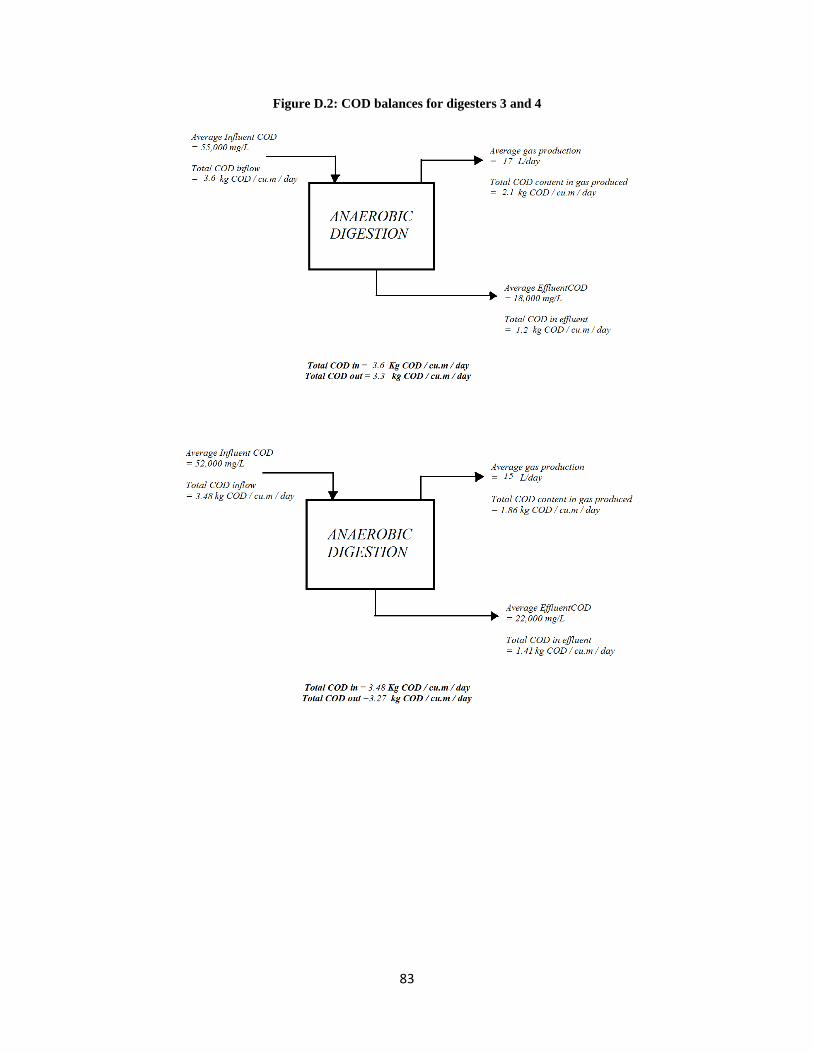
83
Figure D.2: COD balances for digesters 3 and 4