an up close and personal look - mapyourshow.com · an up close and personal look ... cemex usa ....
TRANSCRIPT


An Up Close and Personal Look at Aggregate Variability in a Silo
Jim Cox Cemex USA

It’s 6 a.m., you have a line of customer trucks waiting to be loaded, do you know
where your gradation is? • An up close look at the variability which occurs when moving
material through bins or silos • A case study of measurements made and improvements
implemented to improve sampling, testing and handling of material

City Point Terminal Cocoa, Fl
• Located midway up the east coast of Florida.
• Source-Limestone • LA = 32, SG = 2.45

FEC Quarry Rail Loading

City Point

City Point

• 3 customers experiencing failures on gradation
• Multiple locations with each customer • Compared customer data to our terminal
data
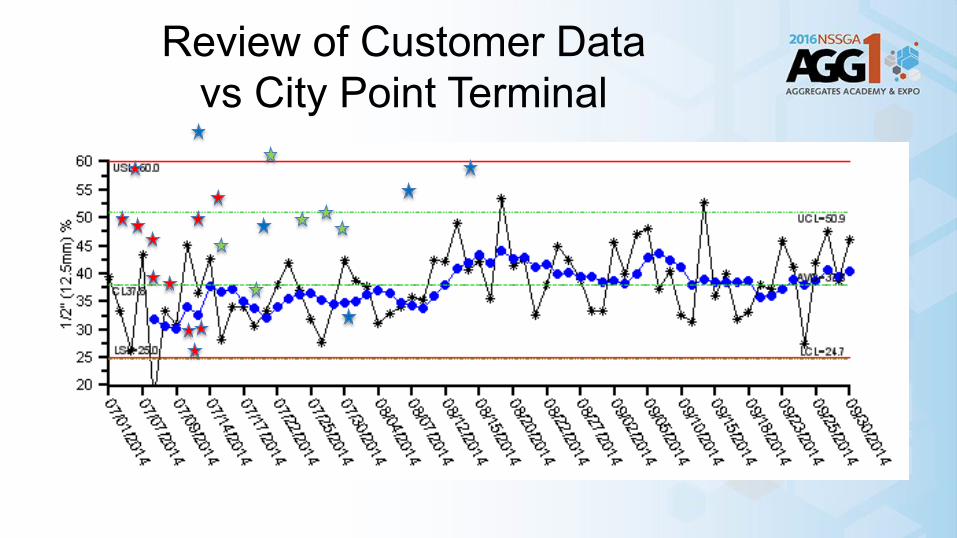
Review of Customer Data vs City Point Terminal

We Have a Problem
FEC Quarry Average = 33.3 Standard Deviation = 4.0

Experiment
• 10 railcars from FEC quarry to City Point
• Sampled each for gradation
• Average -1/2” = 33.7 • SD = 3.33
31.9 30.7 30.4 33.6 41.7 32.5 34.9 31.5 34.3 35.8
1 2 3 4 5 6 7 8 9 10

Experiment
31.9 30.7 30.4 33.6 41.7 32.5 34.9 31.5 34.3 35.8 1 2 3 4 5 6 7 8 9 10
Unloaded railcars into the empty silo in the order they were loaded at FEC quarry

City Point 1 2 3 4 5 6 7 8 9 10
31.9 30.7 30.4 33.6 41.7 32.5 34.9 31.5 34.3 35.8
Average = 33.7 SD = 3.33
Silo measurement stats:
Avg 37.91
SD 11.49
Observatons:
If I take the most coarse and most fine samples and mix with any sample from 2-9
2 3 4 5 6 7 8 9
43.20 39.10 38.77 35.60 35.53 36.90 37.63 36.03
The 1st value utlizing 1, 10 & 2 is a bit fine.
Conversly the last value utilizing 1, 10, & 9 is a bit course.
Silo Cross section
NTS
10 18.10
9 32.50
8 37.30
7 35.10
6 31.00
5 31.20
4 40.70
3 41.70
2 54.00
1 57.50
Discharge

City Point Silo Cross section
NTS
10 18.10
9 32.50
8 37.30
7 35.10
6 31.00
5 31.20
4 40.70
3 41.70
2 54.00
1 57.50
Discharge
FEC Data: Average = 33.7 SD = 3.33
Silo measurement stats:
Avg 37.91
SD 11.49
Increment # Increment # Increment # Avg
9 7 4 54.00 40.70 35.10 43.27
7 4 4 40.70 35.10 35.10 36.97
9 6 2 54.00 31.20 32.50 39.23
8 5 3 41.70 31.00 37.30 36.67
7 5 4 40.70 31.00 35.10 35.60
7 5 3 40.70 31.00 37.30 36.33
8 7 3 41.70 40.70 37.30 39.90
7 6 3 40.70 31.20 37.30 36.40
7 5 4 40.70 31.00 35.10 35.60
8 5 4 41.70 31.00 35.10 35.93
9 4 3 54.00 35.10 37.30 42.13
9 6 2 54.00 31.20 32.50 39.23
9 4 4 54.00 35.10 35.10 41.40
7 5 3 40.70 31.00 37.30 36.33
8 4 2 41.70 35.10 32.50 36.43
8 4 2 41.70 35.10 32.50 36.43
8 4 4 41.70 35.10 35.10 37.30
8 4 2 41.70 35.10 32.50 36.43
9 5 2 54.00 31.00 32.50 39.17
8 5 2 41.70 31.00 32.50 35.07
9 5 4 54.00 31.00 35.10 40.03
9 7 2 54.00 40.70 32.50 42.40
7 7 2 40.70 40.70 32.50 37.97
7 4 2 40.70 35.10 32.50 36.10
8 6 2 41.70 31.20 32.50 35.13
7 7 3 40.70 40.70 37.30 39.57
8 4 4 41.70 35.10 35.10 37.30
7 4 4 40.70 35.10 35.10 36.97
9 6 2 54.00 31.20 32.50 39.23
9 4 2 54.00 35.10 32.50 40.53
0
20
40
60
80
1 2 3 4 5 6 7 8 9 101112131415161718192021222324252627282930
39.00 Grand Avg of 30
2.62 SD of 30

City Point Silo Cross section
NTS
10 18.10
9 32.50
8 37.30
7 35.10
6 31.00
5 31.20
4 40.70
3 41.70
2 54.00
1 57.50
Discharge
FEC Data: Average = 33.7 SD = 3.33
Silo measurement stats:
Avg 37.91
SD 11.49
Increment # Increment # Increment # Avg
10 5 4 57.50 31.00 35.10 41.20
9 4 2 54.00 35.10 32.50 40.53
7 7 2 40.70 40.70 32.50 37.97
8 4 2 41.70 35.10 32.50 36.43
8 5 3 41.70 31.00 37.30 36.67
9 6 1 54.00 31.20 18.10 34.43
8 7 4 41.70 40.70 35.10 39.17
8 4 1 41.70 35.10 18.10 31.63
7 4 3 40.70 35.10 37.30 37.70
8 7 1 41.70 40.70 18.10 33.50
8 7 2 41.70 40.70 32.50 38.30
9 5 2 54.00 31.00 32.50 39.17
10 4 4 57.50 35.10 35.10 42.57
10 5 2 57.50 31.00 32.50 40.33
9 7 2 54.00 40.70 32.50 42.40
7 5 1 40.70 31.00 18.10 29.93
8 5 3 41.70 31.00 37.30 36.67
10 6 4 57.50 31.20 35.10 41.27
9 5 2 54.00 31.00 32.50 39.17
10 6 1 57.50 31.20 18.10 35.60
10 6 1 57.50 31.20 18.10 35.60
9 6 3 54.00 31.20 37.30 40.83
10 4 3 57.50 35.10 37.30 43.30
7 5 3 40.70 31.00 37.30 36.33
7 4 1 40.70 35.10 18.10 31.30
7 4 1 40.70 35.10 18.10 31.30
10 4 1 57.50 35.10 18.10 36.90
8 5 1 41.70 31.00 18.10 30.27
10 5 2 57.50 31.00 32.50 40.33
8 6 2 41.70 31.20 32.50 35.13
37.76 grand average of 30
3.64 SD of 30

FEC Data: Average = 33.7 SD = 3.33 Silo measurement stats:
Avg 37.91
SD 11.49
Increment # Increment # Increment # Avg
10 5 4 57.50 31.00 35.10 41.20
9 4 2 54.00 35.10 32.50 40.53
7 7 2 40.70 40.70 32.50 37.97
8 4 2 41.70 35.10 32.50 36.43
8 5 3 41.70 31.00 37.30 36.67
9 6 1 54.00 31.20 18.10 34.43
8 7 4 41.70 40.70 35.10 39.17
8 4 1 41.70 35.10 18.10 31.63
7 4 3 40.70 35.10 37.30 37.70
8 7 1 41.70 40.70 18.10 33.50
8 7 2 41.70 40.70 32.50 38.30
9 5 2 54.00 31.00 32.50 39.17
10 4 4 57.50 35.10 35.10 42.57
10 5 2 57.50 31.00 32.50 40.33
9 7 2 54.00 40.70 32.50 42.40
7 5 1 40.70 31.00 18.10 29.93
8 5 3 41.70 31.00 37.30 36.67
10 6 4 57.50 31.20 35.10 41.27
9 5 2 54.00 31.00 32.50 39.17
10 6 1 57.50 31.20 18.10 35.60
10 6 1 57.50 31.20 18.10 35.60
9 6 3 54.00 31.20 37.30 40.83
10 4 3 57.50 35.10 37.30 43.30
7 5 3 40.70 31.00 37.30 36.33
7 4 1 40.70 35.10 18.10 31.30
7 4 1 40.70 35.10 18.10 31.30
10 4 1 57.50 35.10 18.10 36.90
8 5 1 41.70 31.00 18.10 30.27
10 5 2 57.50 31.00 32.50 40.33
8 6 2 41.70 31.20 32.50 35.13
37.76 grand average of 30
3.64 SD of 30
Increment # Increment # Increment # Avg
9 7 4 54.00 40.70 35.10 43.27
7 4 4 40.70 35.10 35.10 36.97
9 6 2 54.00 31.20 32.50 39.23
8 5 3 41.70 31.00 37.30 36.67
7 5 4 40.70 31.00 35.10 35.60
7 5 3 40.70 31.00 37.30 36.33
8 7 3 41.70 40.70 37.30 39.90
7 6 3 40.70 31.20 37.30 36.40
7 5 4 40.70 31.00 35.10 35.60
8 5 4 41.70 31.00 35.10 35.93
9 4 3 54.00 35.10 37.30 42.13
9 6 2 54.00 31.20 32.50 39.23
9 4 4 54.00 35.10 35.10 41.40
7 5 3 40.70 31.00 37.30 36.33
8 4 2 41.70 35.10 32.50 36.43
8 4 2 41.70 35.10 32.50 36.43
8 4 4 41.70 35.10 35.10 37.30
8 4 2 41.70 35.10 32.50 36.43
9 5 2 54.00 31.00 32.50 39.17
8 5 2 41.70 31.00 32.50 35.07
9 5 4 54.00 31.00 35.10 40.03
9 7 2 54.00 40.70 32.50 42.40
7 7 2 40.70 40.70 32.50 37.97
7 4 2 40.70 35.10 32.50 36.10
8 6 2 41.70 31.20 32.50 35.13
7 7 3 40.70 40.70 37.30 39.57
8 4 4 41.70 35.10 35.10 37.30
7 4 4 40.70 35.10 35.10 36.97
9 6 2 54.00 31.20 32.50 39.23
9 4 2 54.00 35.10 32.50 40.53 39.00 Grand Avg of 30
2.62 SD of 30
City Point
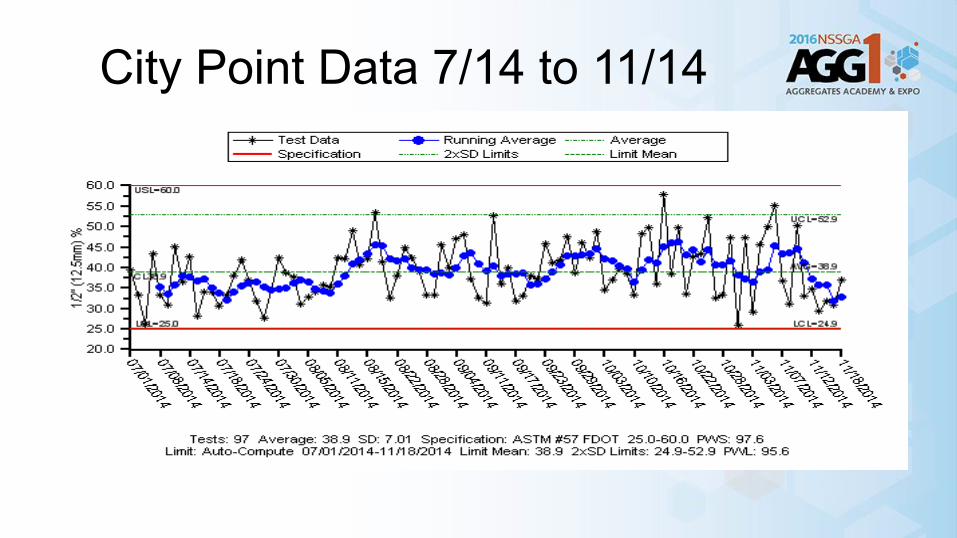
City Point Data 7/14 to 11/14

City Point Data 11/14 to 1/15

City Point Data 11/14 to 1/15 modified

Lessons Learned • COMPOSITE SAMPLE OVER TIME • REFRAIN FROM SAMPLING THE 1ST FEW TONS AND
THE LAST FEW TONS FROM A SILO • REFRAIN FROM EMPTYING SILOS/BINS BELOW
MAGIC NUMBER OF MAYBE 20 – 30% • DO NOT USE SILOS AND BINS AS BYPASS CHUTES • COMMUNICATION • TEAMWORK

Action Plan
• Modify Sampling Plans at terminal and customers yards
• Stop using bins/silos as bypass chutes • Install bin level indicators in silos • Incorporate bin levels into plant
automation • Give bin level data to loadout and QC

Sampling Plans at Customers Yards
• Follow recommendations of ASTM D 75 • Develop plan with customer and third party • Utilize best practices developed with FDOT • Use power equipment
• Composite samples of increments of 3 sub samples
• Encourage loader operators to not drive on material

Thing to Discourage

Stockpile Sampling
Best Practices
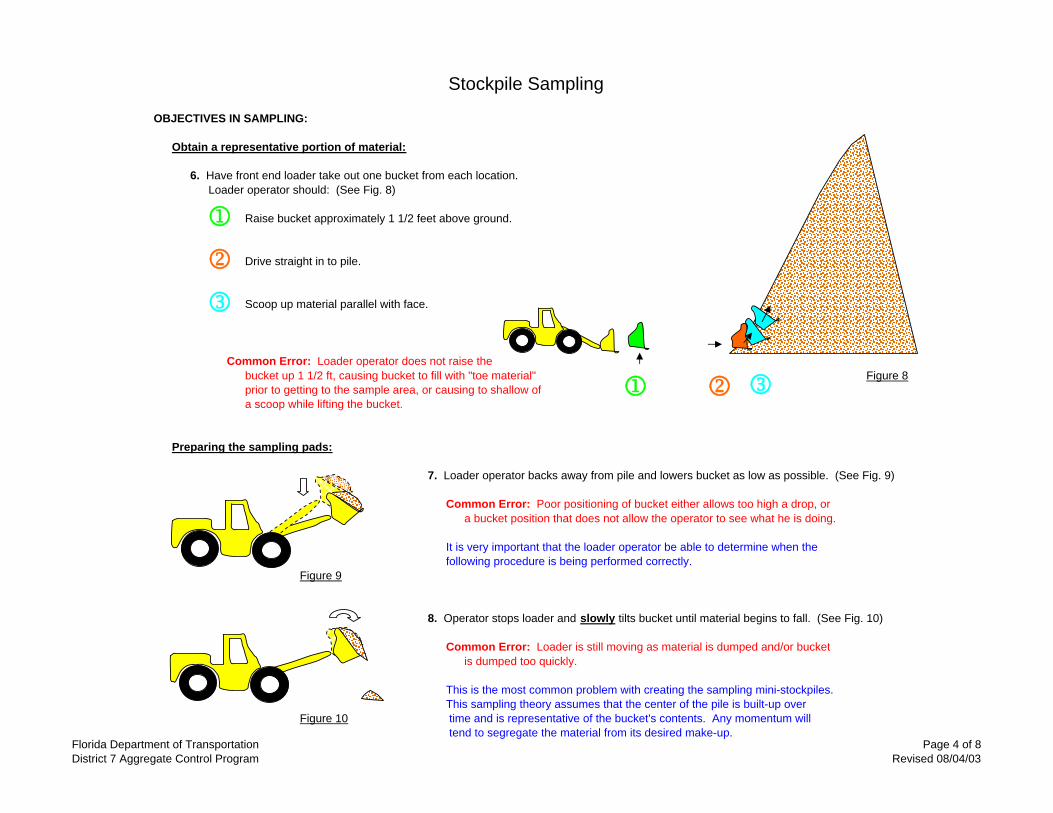
OBJECTIVES IN SAMPLING:
Obtain a representative portion of material:
6. Have front end loader take out one bucket from each location.Loader operator should: (See Fig. 8)
Raise bucket approximately 1 1/2 feet above ground.
Drive straight in to pile.
Scoop up material parallel with face.
Common Error: Loader operator does not raise thebucket up 1 1/2 ft, causing bucket to fill with "toe material" Figure 8prior to getting to the sample area, or causing to shallow of a scoop while lifting the bucket.
Preparing the sampling pads:
7. Loader operator backs away from pile and lowers bucket as low as possible. (See Fig. 9)
Common Error: Poor positioning of bucket either allows too high a drop, ora bucket position that does not allow the operator to see what he is doing.
It is very important that the loader operator be able to determine when thefollowing procedure is being performed correctly.
Figure 9
8. Operator stops loader and slowly tilts bucket until material begins to fall. (See Fig. 10)
Common Error: Loader is still moving as material is dumped and/or bucketis dumped too quickly.
This is the most common problem with creating the sampling mini-stockpiles.This sampling theory assumes that the center of the pile is built-up over
Figure 10 time and is representative of the bucket's contents. Any momentum will tend to segregate the material from its desired make-up.
j k l
j
k
l

Stockpile Sampling
Best Practices
FREQUENTLY ASKED QUESTIONS:
1. Why should the front-end loader take the sample 1 1/2 feet high, rather than at ground level?
This method of sampling is used in sampling undisturbed "production faces".It is recognized that the outside, and especially the ouside bottom of an undisturbed pile is highly segregated.Taking the sample 1 1/2 feet high avoids this area and is believed to be more representative of the overall pile.
2. If I am pulling shipping samples from an active shipping face, should I sample at 1 1/2 feet high?
Shipping samples are most representative of material shipped by having the front-end loader pull the sample the same way it is loading out trucks.If the front-end loader enters the pile at the bottom, the samples should be pulled at the bottom.
3. Why does this method prescribe back-blading the pile?
Back-blading the pile exposes the material that was built-up, layer upon layer, at the center of the pile as it slowly increased in height.The material at the very top is the last material out of the bucket, which is also probably some of the first material in to the bucket.This material is not believed to be as representative as the material built up over time.
4. How can I tell if I am back-blading the pile at the correct height?
A pile that is back-bladed correctly should generally have small peaks (less than 2" above back-bladed surface) at the very ends of the pile. (See Fig. 21)These peaks are where the loader bucket cut across the top of the pile. These peaks also help to define the centerline of the original pile.
5. What if there are no peaks on my back-bladed pile?
Optimal height may not have peaks.A back-bladed pile should allow a full shovel width of material to be taken at three locations along the original center-line of the pile. 2 ftThis generally requires that the exposed surface be a minimum of 2 feet wide at the outside sampling points.
Figure 216. Why do I need to sample material a minimum of 1 foot from the ends of the mini-stockpile?
Material at the outside edges of the mini-stockpile are subject to segregation and should be avoided.
Peaks
LC

Sampling Plans at Terminals
• Composite samples of increments of 3 sub samples over time
• Utilize best practices developed with FDOT • Use power equipment

Radar Sensors

Bin Levels

Still Doing good!

An Up Close and Personal Look at Aggregate Variability in a Silo
Jim Cox Cemex USA
Questions?
Stockpile Sampling
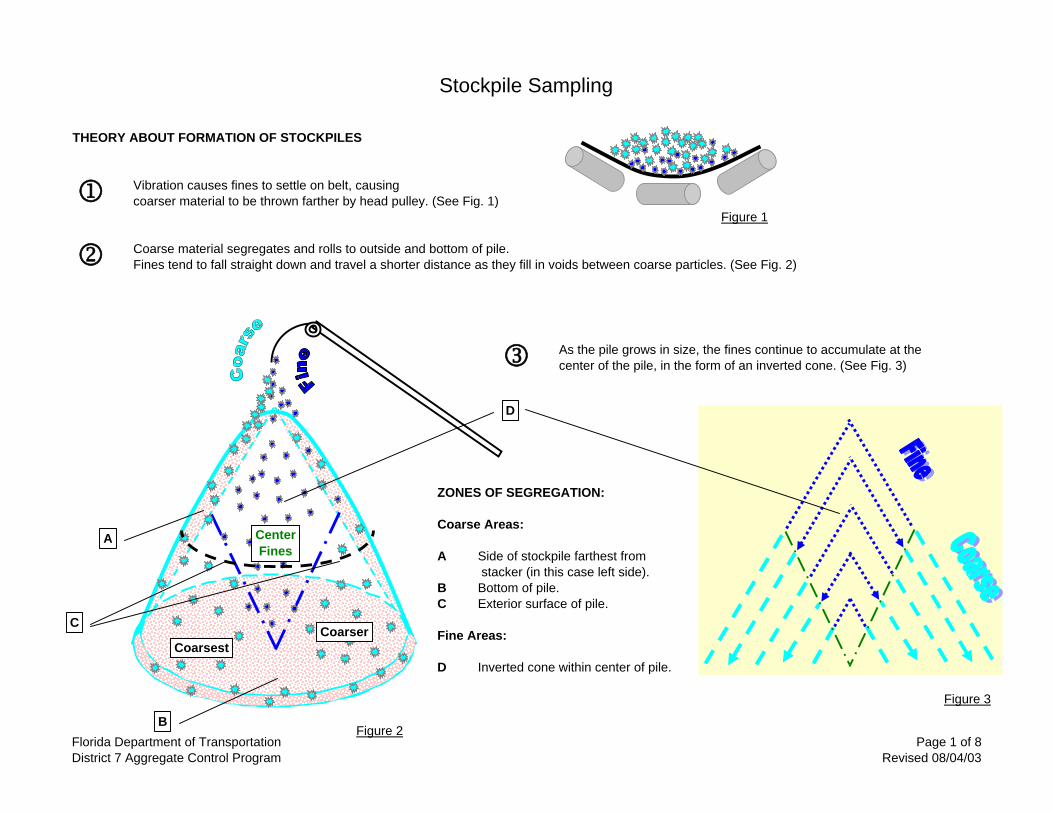
THEORY ABOUT FORMATION OF STOCKPILES
Vibration causes fines to settle on belt, causingcoarser material to be thrown farther by head pulley. (See Fig. 1)
Figure 1
Coarse material segregates and rolls to outside and bottom of pile.Fines tend to fall straight down and travel a shorter distance as they fill in voids between coarse particles. (See Fig. 2)
As the pile grows in size, the fines continue to accumulate at the center of the pile, in the form of an inverted cone. (See Fig. 3)
ZONES OF SEGREGATION:
Coarse Areas:
A Side of stockpile farthest from stacker (in this case left side).
B Bottom of pile.C Exterior surface of pile.
Fine Areas:
D Inverted cone within center of pile.
Figure 3
Figure 2
1
2
3
CenterFines
Coarser
A
B
C
D
Coarsest
Florida Department of TransportationDistrict 7 Aggregate Control Program
Page 1 of 8Revised 08/04/03

Stockpile SamplingGOALS OF SAMPLING:
A. Choose sampling locations that are representative of area being sampled, such that composite sample is representative of overall pile.
B. Avoid sampling areas that are highly segregated
C. Meet requirements of AASHTO T2.
OBJECTIVES IN SAMPLING:
Choose representative locations:
1. Select sampling location perpendicular to the direction of the stacker. (See Fig. 4)
Common Error: Opening the face while the stackeris still depositing material.
Face must be in-active during sampling,in order to obtain a representative sample.
Figure 4
2. Remove material from bottom of the pile, across the entire cross-sectionof the stockpile. (See Figs. 4 & 5)
Common Error: Only removing material from the three areas to be sampled.
This allows material to flow from surrounding area into the area to be sampled.If the size of the pile prohibits opening the entire face, the inspector should haveenough area removed (minimum 2 bucket widths) so that surrounding area doesnot flow into area to be sampled.
Common Error: Placing discarded material in way of area to be sampled.
Material may be set off to side or loaded into trucks as face is opened.
Figure 5
CenterFines
CoarsestCoarser
Location of Stacker
Florida Department of TransportationDistrict 7 Aggregate Control Program
Page 2 of 8Revised 08/04/03

Stockpile Sampling
OBJECTIVES IN SAMPLING:
Choose representative locations: (continued)
3. Repeat Step 2 - Remove a second bucket of material from the bottom of the pile, across the entire cross-section. (See Fig. 6)
Common Error: Only removing one bucket of material from the facebefore taking the sample.
A minimum of two buckets must be removed to assure a representativesampling location.
Figure 6
4. Continue to remove material from across the entire face, as necessary, to cause material from the top of the pile to cascade down to the bottom. (See Fig. 7)
Common Error: Only removing the minimum number of (two) buckets, even thoughthe material has not cascaded.
The initial removal of material is to remove the exterior surface of the pile. However,it is still necessary for the material to cascade, so that the sample will include material from top, middle and bottom.
5. Select location of sampling points - middle, left and right. (See Fig. 7)
Use the following guidlines when picking sampling locations:
A. Sample middle location first - it will define limits of remaining areas.B. Avoid area within one bucket width of outside edge of pile - this area
is highly segregated.C. Sampling points on left and right sides should be as close to the
center of the outer one-third sections as possible, without getting into segregated material.
Common Error: Sampling off to one side of center, or sampling from same section more than once.
Figure 7Both of these situations can generally be avoided by sampling thecenter of the stockpile first.
1 32
Cascade
Florida Department of TransportationDistrict 7 Aggregate Control Program
Page 3 of 8Revised 08/04/03
Stockpile Sampling
OBJECTIVES IN SAMPLING:
Obtain a representative portion of material:
6. Have front end loader take out one bucket from each location.Loader operator should: (See Fig. 8)
Raise bucket approximately 1 1/2 feet above ground.
Drive straight in to pile.
Scoop up material parallel with face.
Common Error: Loader operator does not raise thebucket up 1 1/2 ft, causing bucket to fill with "toe material" Figure 8prior to getting to the sample area, or causing to shallow of a scoop while lifting the bucket.
Preparing the sampling pads:
7. Loader operator backs away from pile and lowers bucket as low as possible. (See Fig. 9)
Common Error: Poor positioning of bucket either allows too high a drop, ora bucket position that does not allow the operator to see what he is doing.
It is very important that the loader operator be able to determine when thefollowing procedure is being performed correctly.
Figure 9
8. Operator stops loader and slowly tilts bucket until material begins to fall. (See Fig. 10)
Common Error: Loader is still moving as material is dumped and/or bucketis dumped too quickly.
This is the most common problem with creating the sampling mini-stockpiles.This sampling theory assumes that the center of the pile is built-up over
Figure 10 time and is representative of the bucket's contents. Any momentum will tend to segregate the material from its desired make-up.
1 2 3
1
2
3
Florida Department of TransportationDistrict 7 Aggregate Control Program
Page 4 of 8Revised 08/04/03

Stockpile Sampling
OBJECTIVES IN SAMPLING:
Preparing the sampling pads: (continued)
9. From here, the loader operator must dump the material so that it slowly breaks,equally, to both sides of the mini-stockpile. This allows the center of the pileto build up over time. (See Fig. 11)
Common Error: Material is dumped so that it falls primarily to one side.
The inspector can assist the operator by standing to the side of the pile andgiving him feedback when the material is falling correctly.
Figure 11
10. As the material is dumped, the loader operator must pull forward to keep the material falling over the center of the pile. (See Fig. 12)
The inspector can assist the operator by standing to the side of the pile andgiving him feedback when the material is falling correctly.
Figure 12
11. Operator pulls forward and turns bottom of bucket as close to "straight down" as possible. Operator then "back-blades" pile, at about knee height, to expose "center of mass" to be sampled. (See Fig. 13)
Figure 13a Common Error: Cutting pile too low, or not positioning bottom of blade invertical position.
Cutting the pile too low causes the representative material that was built upover time to be moved away and exposes the non-representative materialwhich was dumped in the first few moments. (see step 8, Fig. 10)
Back-blading with the bottom of the bucket at a flat angle will force material (that is supposed to be removed) down into the sampling surface.
Figure 13 (See Fig. 13a)Florida Department of TransportationDistrict 7 Aggregate Control Program
Page 5 of 8Revised 08/04/03

Stockpile Sampling
OBJECTIVES IN SAMPLING:
Shape of mini-stockpiles before and after back-blading:
11a. Operator lays out three piles, side by side. (See Fig. 14a)
This diagram shows the shape of the piles, prior toback-blading. (See Fig. 14b)
Figure 14a Figure 14b
11b. Operator "back-blades" each pile at approximatelyknee height. (See Fig. 14a & 15a)
This diagram shows the shape of the piles, afterback-blading. Note the center-line of the original pile.(See Figs. 14b & 15b)
Figure 15a Figure 15b
Sampling a mini-stockpile:12. Inspector samples each mini-stockpile as follows: (See Fig. 16)
1. Insert square tip shovel vertically to its full depth at each location.2. Pry up shovel, being careful to retain as much material as possible.3. Combine the material into one composite sample.
Common Errors: Use of round-tip shovel; not inserting shovel vertically to its full depth; loss of material from shovel; notsampling along center-line of original piles.
Figure 16
Exterior sample points should be a minimum of 1 foot from edge of pile.
Sample at three locations along center-line of original piles.
X
X
X
Florida Department of TransportationDistrict 7 Aggregate Control Program
Page 6 of 8Revised 08/04/03

Stockpile Sampling
OBJECTIVES IN SAMPLING:
Assuring that the sample is representative.
13. Inspector reviews appearance of material sampled.
Does each shovel full of material appear representative of its location within the mini-stockpile? (See Figs 17 & 18)
Does each mini (sampling) stockpile appear representative of its location in the face of the aggregate stockpile? (See Figs 18 & 19)
Does the face appear representative of the overall stockpile? (See Figs 19 & 20)
Figure 20Figure 18
Figure 17 Figure 19
Common Error: Inspector does not make visual determination as to whether he has been successful in obtaining a "representative" sample.The decision regarding whether a sample is representative must be made at the time of sampling.
X
X
X
Cascade
CenterFines
Coarsest Coarser
Florida Department of TransportationDistrict 7 Aggregate Control Program
Page 7 of 8Revised 08/04/03

Stockpile Sampling
FREQUENTLY ASKED QUESTIONS:
1. Why should the front-end loader take the sample 1 1/2 feet high, rather than at ground level?
This method of sampling is used in sampling undisturbed "production faces".It is recognized that the outside, and especially the ouside bottom of an undisturbed pile is highly segregated.Taking the sample 1 1/2 feet high avoids this area and is believed to be more representative of the overall pile.
2. If I am pulling shipping samples from an active shipping face, should I sample at 1 1/2 feet high?
Shipping samples are most representative of material shipped by having the front-end loader pull the sample the same way it is loading out trucks.If the front-end loader enters the pile at the bottom, the samples should be pulled at the bottom.
3. Why does this method prescribe back-blading the pile?
Back-blading the pile exposes the material that was built-up, layer upon layer, at the center of the pile as it slowly increased in height.The material at the very top is the last material out of the bucket, which is also probably some of the first material in to the bucket.This material is not believed to be as representative as the material built up over time.
4. How can I tell if I am back-blading the pile at the correct height?
A pile that is back-bladed correctly should generally have small peaks (less than 2" above back-bladed surface) at the very ends of the pile. (See Fig. 21)These peaks are where the loader bucket cut across the top of the pile. These peaks also help to define the centerline of the original pile.
5. What if there are no peaks on my back-bladed pile?
Optimal height may not have peaks.A back-bladed pile should allow a full shovel width of material to be taken at three locations along the original center-line of the pile. 2 ftThis generally requires that the exposed surface be a minimum of 2 feet wide at the outside sampling points.
Figure 216. Why do I need to sample material a minimum of 1 foot from the ends of the mini-stockpile?
Material at the outside edges of the mini-stockpile are subject to segregation and should be avoided.
Peaks
LC
Florida Department of TransportationDistrict 7 Aggregate Control Program
Page 8 of 8Revised 08/04/03