an overview of the fixed income securities market ... · an overview of the fixed income securities...
TRANSCRIPT

CHAPTER 1An Overview of the Fixed
Income Securities Market
RECENT RISE IN POPULARITY OF BONDS
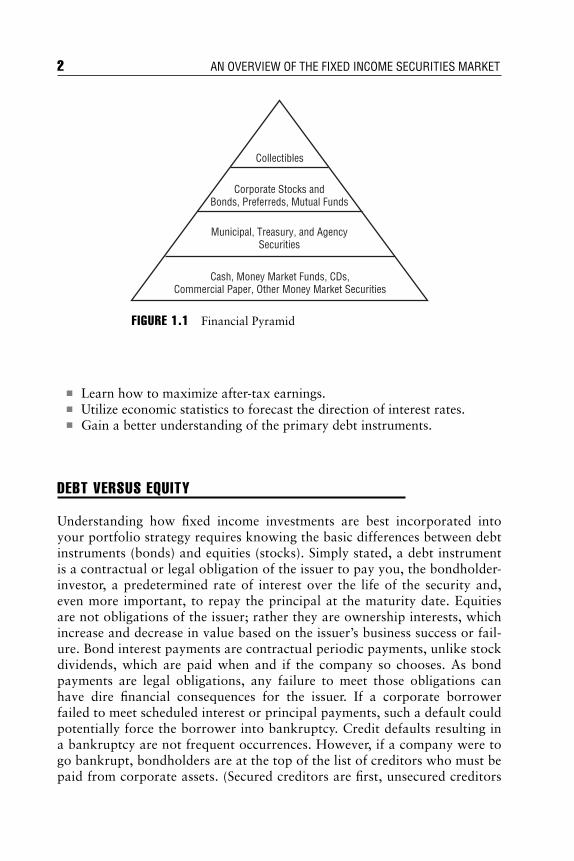
When the stock market was soaring through the 1980s and 1990s, bonds werefrequently ignored as an investment alternative. However, in recent years, in-vestors, rocked by falling equity prices, a shaky economy, and a series of corpo-rate scandals, flocked to fixed income securities in droves. Some were attractedto the relative safety of income and principal; others were looking for a higheror more stable potential return in a period of declining equity prices; still otherswere merely looking for a safe haven until the storm in equities blew over. Whilethe market turmoil in equities has at least temporarily subsided for now, manyinvestors have learned a valuable lesson: Fixed income securities should be anintegral part of virtually everyone’s portfolio. For most investors, bonds shouldrepresent an essential segment of one’s financial pyramid. (See Figure 1.1.)
Despite the increased popularity of bonds, there are still many advantagesof debt instruments that are overlooked by investors. Some brokers and finan-cial planners argue that bonds and other debt instruments don’t have the po-tential for capital gain usually associated with equities. As a result, manyinvestors are uneasy about the bond market. In fact, bonds and other debt in-struments offer investors an effective and secure way to build a nest egg for re-tirement. Furthermore, bonds can help people gain financial independencewithout causing them to accept more risk than is necessary or that they cancomfortably tolerate.
The purpose of this book is to give you an understanding of the risks andrewards of including fixed income securities in your investment portfolio. Thisbook will help you:
� Take an active role in managing risk in your fixed income portfolio.� Apply various valuation methods to a variety of fixed income instru-
ments.� Learn essential bond market concepts and terminology.
1
ccc_strumeyer_ch1_1-25.qxd 1/6/05 1:38 PM Page 1
COPYRIG
HTED M
ATERIAL
� Learn how to maximize after-tax earnings.� Utilize economic statistics to forecast the direction of interest rates.� Gain a better understanding of the primary debt instruments.
DEBT VERSUS EQUITY
Understanding how fixed income investments are best incorporated intoyour portfolio strategy requires knowing the basic differences between debtinstruments (bonds) and equities (stocks). Simply stated, a debt instrumentis a contractual or legal obligation of the issuer to pay you, the bondholder-investor, a predetermined rate of interest over the life of the security and,even more important, to repay the principal at the maturity date. Equitiesare not obligations of the issuer; rather they are ownership interests, whichincrease and decrease in value based on the issuer’s business success or fail-ure. Bond interest payments are contractual periodic payments, unlike stockdividends, which are paid when and if the company so chooses. As bondpayments are legal obligations, any failure to meet those obligations canhave dire financial consequences for the issuer. If a corporate borrowerfailed to meet scheduled interest or principal payments, such a default couldpotentially force the borrower into bankruptcy. Credit defaults resulting ina bankruptcy are not frequent occurrences. However, if a company were togo bankrupt, bondholders are at the top of the list of creditors who must bepaid from corporate assets. (Secured creditors are first, unsecured creditors
2 AN OVERVIEW OF THE FIXED INCOME SECURITIES MARKET
FIGURE 1.1 Financial Pyramid
Corporate Stocks andBonds, Preferreds, Mutual Funds
Collectibles
Cash, Money Market Funds, CDs,Commercial Paper, Other Money Market Securities
Municipal, Treasury, and AgencySecurities
ccc_strumeyer_ch1_1-25.qxd 1/6/05 1:38 PM Page 2

next, then preferred shareholders, and then equity holders, if there is any-thing left). (See Figure 1.2.) Dividend payments made to common stock-holders may be made only after the issuer has satisfied its obligations to paybondholders and preferred stockholders.
Key Characteristics of Bonds versus Stock� Certain debt instruments, especially some corporate bonds and munici-
pal revenue bonds, are often structured around covenants (maintenanceof liquidity, debt, or revenue ratios). These covenants are rules by whicha borrower must operate, thereby providing the primary level of protec-tion to the bondholder, as compliance with a bond’s covenants assuresthat there will be sufficient revenue to pay bondholders their interest andprincipal when due.
� Equity securities represent an ownership interest in a company. Paymentsof dividends are at the discretion and direction of the board of directorsand the company’s management rather than an obligatory payment re-quired under a bond resolution or indenture.
� Bond prices are determined by the market, taking into account the is-suer’s credit ratings, the coupon payment rate, term to maturity, and mar-ket yields on other fixed income securities.
� Equity share prices reflect the perceived or expected value of the com-pany’s current and future earnings potential.
Debt versus Equity 3
FIGURE 1.2 Creditor Priorities in Case of BankruptcySource: Hamilton Floating Rate Fund, LLC.
Highest Priority
Senior Unsecured Debt
Subordinated Debt
Preferred Stock
Common Stock
Lowest Priority
Senior Secured Debt
ccc_strumeyer_ch1_1-25.qxd 1/6/05 1:38 PM Page 3

The scheduled automatic conversion of your bond investment into cash,no later than the maturity date, is an important distinction between debt andequities. As an investor, you can tailor bond maturities in your debt portfolioto meet your future cash needs as well as to achieve a balance between therisks and rewards offered by shorter-term cyclical trend and longer-termtrend changes in market interest rates. As equities are perpetual securities,converting stocks to cash requires selling the shares at whatever the marketwill pay. Also, the risk of loss through corporate bankruptcy is substantiallyhigher with equities than with debt instruments because, as stated earlier, theclaim of debt holders on a company’s assets is superior to that of equityholders in a bankruptcy. That may be one reason why, through much of ourfinancial history, the market has generally demanded a higher dividend yieldon equities than the yield on corporate bonds, though that is far from thecase today. The fundamental truth is that, if chosen wisely, corporate bondsare inherently a safer investment than equities. And there is no counterpartin the equity markets to the inherent investment safety available with gov-ernment debt, especially with U.S. Treasuries. Debt instruments, offer in-vestors greater certainty of cash flow and security of principal than you havewith most equity investments.
CHARACTERISTICS OF FIXED INCOME SECURITIES
The world of fixed income securities is diverse in many respects. In order to maximize the investment value of fixed income securities in your port-folio, it is necessary to understand the characteristics of these types of investments.
When you’re considering investing in fixed income securities, you shouldfirst evaluate your income tax bracket, credit risk tolerance, market risk toler-ance, and liquidity needs so that you can establish the right portfolio game plan.
Tax Bracket
Your tax status is one of the most important factors to consider in structuringa fixed income portfolio. Knowing your federal, state, and local tax bracketsand whether you are subject to the Alternative Minimum Tax is necessary toassure that your investment choices will provide the maximum after-tax re-turn. As many bonds enjoy some form of tax exemption or preferred treat-ment, which we examine in greater detail in later chapters, your tax status aswell as the tax treatment of the account that you are investing for is central tomaximizing the yield of your bond portfolio.
4 AN OVERVIEW OF THE FIXED INCOME SECURITIES MARKET
ccc_strumeyer_ch1_1-25.qxd 1/6/05 1:38 PM Page 4

Municipal bonds are debt instruments whose interest payments are ex-empt from income taxes. The exemption from federal income taxes is based onthe Doctrine of Reciprocal Immunity, initially established by the SupremeCourt in 1895, which determined that the federal government and state andlocal governments shall not impose personal income taxes on the interest pay-ments on debt instruments of each other. Therefore interest income received onmunicipal investments is not subject to federal taxation. Also, interest paid onU.S. Treasury debt instruments is exempt from state and local income taxes. Inthe vast majority of cases, states do not tax the interest income generated bybonds issued within that state or by any of its political subdivisions. In addi-tion, the interest income received on debt issued by Puerto Rico, as well asGuam and other territories of the United States, is also generally exempt fromstate and local, as well as federal income taxes (each state has its own statuteswith respect to local tax treatment of tax-exempt interest income).
Interest income may also be deferred from taxation, depending on thetype of account in which the income is generated. To make this point moreclearly, if you hold taxable fixed income securities, such as Treasuries, agen-cies, or corporates, in an individual retirement account (IRA), 401(k), orKeogh plan or similar tax-deferred account, income generated is taxed whenthe funds are withdrawn, rather than when earned. This will allow you to de-fer taxation to a period in the future (i.e., when you may be retiring and arepresumably in a lower tax bracket).
Market Risk
Market risk is influenced by credit, maturity, and economic factors. The longerthe term of the security, the greater the market risk, since there is more uncer-tainty as you invest farther out on the yield curve. Investors who want to makea market play, betting on falling long-term rates for example, could buy 20-year low coupon bonds, in the hope of capturing significant price appreciationas interest rates declined. Conversely, if you anticipate a rising interest rate pe-riod, you might buy shorter-term bonds, or bonds with a variable rate struc-ture, such as auction rate securities or variable rate demand bonds (Chapter 8),to ride the rate rise. Investors wishing to minimize market risk could laddertheir bond maturities, thereby creating a shorter overall average maturity yetcapturing some additional yield from longer-term securities. Laddering a port-folio means buying bonds that mature over a range of time—short-term,medium-term, and long-term. For example, an investor could consider pur-chasing an equal amount of bonds due in 3, 5, 7, and 10 years, resulting in anaverage maturity of 6.25 years. This portfolio would have less market risk anda lower average yield than a portfolio made up exclusively of 10-year bonds.
Short-term debt obligations include those securities that mature or mustbe repaid in full relatively soon. Short-term securities have maturities that can
Characteristics of Fixed Income Securities 5
ccc_strumeyer_ch1_1-25.qxd 1/6/05 1:38 PM Page 5

be as short as one day, or maturities of weeks or months, but usually less thantwo years. Securities maturing within one year are often referred to as moneymarket securities. These securities include commercial paper, Treasury bills(T-bills), repurchase agreements, certificates of deposit, Eurodollar deposits,variable rate demand bonds, and auction rate securities.
Fixed income securities may contain a call option, or an option for the is-suer to redeem the obligation prior to maturity. Some bonds which containembedded call options include a call premium, similar to a prepaymentpenalty, so the investor receives some compensation for being taken out of theinvestment earlier than the original term, presumably when interest rates arelower than at the time of purchase. On those bonds that are callable, the pe-riod prior to the call date is known as the no-call period. Redemption premi-ums may be stated as percentage over par, such as 102 percent (par plus 2percent), or may be stated in the form of a formula usually referred to as a“make-whole” premium. The latter is more typical in the corporate bondmarket, whereas the simple premium concept is typical in the municipal bondand Treasury markets. Callable bonds tend to be slightly higher yielding thannoncallable bonds due to the risk the investor takes in being called out of theinvestment prior to maturity. The benefit of the call feature to the issuer is theability to redeem the issue if rates fall, enabling the issuer to refinance the debtat a lower rate.
Certain securities, especially variable rate securities, carry a put option,which entitles the bondholder to tender the securities at par, or a predeterminedprice, under certain circumstances. This is the structure that gives variable ratedemand bonds their appeal in that the holder has the option to tender, or put,the bonds back to the issuer or trustee at any time with a certain number ofdays’ notice, typically one to seven days. Some corporate-backed bonds carry alonger-term put option as well. The put option can work like this: Suppose youpurchased a seven-year bond with a five-year put at 5 percent, and it is now fiveyears later. Rates for similar investments are now at 6 percent, so you would beinclined to tender your bond and purchase the new bond at 6 percent. In an-other case, say the issuer of the bond was rated AA at the time of purchase andhas now been downgraded to A. If you have a put option that is current, or ac-tive, you might put the bond and reinvest in another AA security. In both ofthese cases, you would receive 100 percent of the par amount with a par put in-stead of having to sell the bond, probably at a price less than par. This featuredoes provide added potential value, so put option bonds will generally bepriced at a lower yield than a bond without a put option.
Liquidity
An investor’s liquidity needs is another important consideration in assemblinga portfolio of fixed income securities. What are your cash needs now and in
6 AN OVERVIEW OF THE FIXED INCOME SECURITIES MARKET
ccc_strumeyer_ch1_1-25.qxd 1/6/05 1:38 PM Page 6

the future? Will you have any particular obligations to fund over the next sev-eral years? What are your current and future income needs? When do you ex-pect to retire? Investing in fixed income securities means tying up cash for adetermined amount of time. By identifying specific cash needs in the future,you will be able to better time your bond maturities to meet those needs.
Credit Quality
Credit characteristics of fixed income securities are not homogeneous instructure or market performance. Any given investment grade corporatebond will have certain credit attributes that may cause it to have greater orlesser security than a similarly rated corporate bond, and may trade quitedifferently in the market due to factors unrelated to interest rates as a whole.For example, a secured single-A utility bond will tend to trade parallel toTreasuries, but an unsecured single-A telecommunications company bondmay deviate from the fixed income market as a whole due to market con-cerns about the telecom industry. While credit ratings are an important diag-nostic tool to help investors assess the risk and value of a bond, additionaldue diligence is required.
The credit market as a whole is divided into six segments determined bythe type of debt issuer. These segments include (1) the U.S. Treasury market,(2) the U.S. government agency (GSE) market, (3) the state and local govern-ment debt market (municipal bonds and notes), (4) the U.S. corporate debtmarket, (5) the mortgage-backed and asset-backed markets, and (6) the for-eign debt market. Each of these issuers of debt sells a wide range of debtobligations with varying maturities, from overnight to long-term, which insome cases may be as long as 100 years.
With the exception of U.S. Treasury obligations, issuers may issue debtthat varies in credit quality. The difference in credit quality will depend onsuch factors as whether the debt has a first or subordinate claim on specificassets; what those assets are, if any; and how soon the debt must be repaid.Corporations, for example, can issue unsecured debt backed by the parentcompany or by an operating subsidiary. These are termed debentures, securedonly by the general credit of the issuer. The corporation can also issue debtbacked by a lien on, or a pledge of, specific assets. Assets that can be used asbacking or collateral for the debt include real estate, equipment, credit carddebt, car loans, and the like.
State and local governments issue two types of debt: general obligation(GO) bonds of the governmental entity and supported by its taxing authority,and revenue bonds backed and supported by a stream of revenues or feespledged to the bondholders, usually from the specific project that is being fi-nanced such as a bridge or a toll road. GOs, with their broader sources of finan-cial backing, are generally viewed as having stronger credit than revenue bonds,
Characteristics of Fixed Income Securities 7
ccc_strumeyer_ch1_1-25.qxd 1/6/05 1:38 PM Page 7

which have a more limited financial backing. In certain cases, a municipal issuermay sell bonds backed not only by the issuer’s full faith and credit and taxing au-thority like a GO bond, but also by a pledge of certain revenues derived from theproject financed. These bonds are referred to as being double-barreled. There isalso a subset of revenue bonds that includes private activity bonds, which arebonds issued by a municipality for the benefit of a private entity, such as a col-lege or cultural institution. The source of repayment is from a pledged stream ofrevenue, but the revenue stems from the end user—the college, for example—rather than the municipality or agency issuing the bonds. As will be discussed inthe “Municipal Bonds” chapter later on (Chapter 10), private activity bondshave other tax considerations that the investor should take note of.
There is a third category of municipal debt called prerefunded (prere) orescrowed to maturity (ETM) bonds. These are municipal bonds that havebeen technically defeased (legally repaid, although still outstanding) by pro-viding an escrow account of U.S. government-backed obligations that guaran-tee the investor timely payment of interest and principal in lieu of paymentsfrom the original issuer. Investors purchasing these securities get the best ofboth worlds: tax-free income and gilt-edged security.
As previously noted, a key distinction of debt instruments is the contrac-tual obligation of the debtor or issuer of the debt to pay you, the creditor orowner of the debt instrument, a set rate of interest at prescribed times, as wellas to repay the principal or face value of the debt at its specific maturity date.Whether the issuer actually meets those obligations depends on the issuer’sability and willingness to do so. The market makes a risk judgment on thatability and willingness to pay debt interest and principal based on past experi-ence and the underlying financial strength of the debtor to meet its creditobligations. The Orange County debacle in the early 1990s is a case study inhow a wealthy California county had the ability to pay, but initially not thewillingness to pay. To make bondholders whole, the county ultimately had toraise taxes and cut expenses. (See Chapter 10.)
Investors generally rely on one or more of the three most widely recog-nized independent credit rating companies, Moody’s Investors Service, Stan-dard & Poor’s (S&P), and Fitch Ratings Ltd. to assess the degree of risk ofdefault assigned a given issuer. Each rank or gradation of risk is assigned a let-ter grade, with those considered to be of highest quality and lowest credit riskgiven a triple-A rating. The lowest rating grade, short of default, that may beassigned is C, suggesting a high risk of default. Debt issues assigned a Baa rat-ing by Moody’s, a BBB rating by S&P or Fitch, or higher are considered to beinvestment grade and generally (but not always) considered relatively safe.The term high grade generally refers to issues rated from double-A to triple-A.Bonds rated below investment grade are deemed “speculative grade” issuers.Debt issues rated below triple-B are considered high-risk and are commonlyreferred to as “high yield” bonds or “junk bonds.” Table 1.1 shows corporate
8 AN OVERVIEW OF THE FIXED INCOME SECURITIES MARKET
ccc_strumeyer_ch1_1-25.qxd 1/6/05 1:38 PM Page 8

long-term rating categories by the three largest nationally recognized ratingagencies, Moody’s, S&P, and Fitch.
Each agency modifies its ratings from Aa or AA to Caa or CCC with amodifier denoting strong, medium, or weak quality within each rating rank.For example, Moody’s-rated A1 credits are stronger than A2, which isstronger than A3 credits. Similarly, S&P and Fitch designate their modifiers as“+” or “–”, as in A+ being superior to A, which is superior to A–.
Each agency also has a unique rating designation for short-term instru-ments such as commercial paper or municipal notes. Table 1.2 lists corporateshort-term ratings used by the big three.
S&P and Fitch also use a “+” modifier for their prime short-term rating,for example A-1+. For municipal credits, Moody’s short-term ratings use aMunicipal Investment Grade (MIG) rating system, similar to the corporateratings. S&P also uses the label “SP” for its municipal short-term ratings.
While buying only investment grade debt is a sound way to mitigatecredit risk, it is not a panacea. Some investment grade debt issuers have de-faulted and some have gone bankrupt (remember Enron?). That dire outcome
Characteristics of Fixed Income Securities 9
TABLE 1.1 Corporate Long-Term Rating Categories
Moody’s S&P Fitch
Aaa AAA AAAAa AA AA Investment GradeA A ABaa BBB BBB
Ba BB BBB B BCaa CCC CCC Speculative GradeCa CC CCC C C
D D DDD, DD, D Default
TABLE 1.2 Corporate Short-Term Rating Categories
Moody’s S&P Fitch
P1 A-1 F1 } PrimeP2 A-2 F2P3 A-3 F3NP B, C, D B, C, D } Speculative Grade
ccc_strumeyer_ch1_1-25.qxd 1/6/05 1:38 PM Page 9

is relatively rare in the high grade market. Thus, the risk of default can be re-duced, but unfortunately not completely eliminated, by investing in top-ratedagency, corporate and state and local government debt issues. By purchasing anumber of different high-grade bonds from different issuers, you will furtherreduce the risk an adverse impact on your overall portfolio if any one of thesedebt issuers should default.
Not all securities with the same credit rating are equal. Within a givenrating level, there are varying characteristics that make some bonds morecreditworthy than others. For example, AAA-rated U.S. Treasury securitiesare considered to be without risk of default. It is therefore a superior credit toan unguaranteed AAA-rated government agency, or similarly rated corporateor state and local government debt issue because the U.S. Treasury has thepower to print money for the repayment of its obligations. Similarly, state andlocal government debt may be considered a marginally stronger credit thanidentically rated corporate debt as the municipality has the authority to levytaxes necessary to honor its debt obligation. Even within a classification ofbonds, the same holds true; a municipal general obligation bond, backed by afull faith and credit pledge, may be considered more creditworthy than simi-larly rated revenue bonds, backed by revenues from a specific project. In thecorporate bond market, first mortgage utility bonds rated BBB may be viewedas more secure than a BBB rated debenture with no assets pledged against it.The lesson here is not to depend totally on the published rating. Investorsmust utilize ratings in conjunction with diversification strategies and good oldcommon sense.
COMPONENTS OF FIXED INCOME SECURITIES
Fixed income securities have three essential attributes: (1) coupon rate (onwhich the interest payments are calculated), (2) maturity (term of the in-vestment), and (3) price or yield (market value). Distinctions among debtinstruments also include credit rating, interest payment frequency andcallability. There are even debt instruments that compensate the holder forchanges in the rate of inflation and debt instruments whose coupon ratechanges at set intervals, as in the case of variable rate securities and stepped-coupon securities.
A debt instrument, regardless of its maturity and issuer, is a contract be-tween the issuer and holder. The contract obligates the issuer to pay you, theholder, a stated interest payment on the dates specified. Usually the stated annualinterest payment, or coupon, is paid in two installments (i.e., every six months).The annual payment date typically falls on the same day of the year designatedfor the ultimate redemption or maturity of the debt instrument. For example, if
10 AN OVERVIEW OF THE FIXED INCOME SECURITIES MARKET
ccc_strumeyer_ch1_1-25.qxd 1/6/05 1:38 PM Page 10

the specific day the issuer has promised to pay off the debt, its maturitydate, is April 1, 2035, the semiannual interest payments will typically bemade on April 1 and six months later, October 1, each and every year untilthe maturity date of the bond. If the annual coupon rate is specified as 6percent, then 3 percent will be paid each April 1 and 3 percent each Octo-ber 1. While semiannual payments are the most common, other paymentintervals are utilized as well. Some fixed income instruments pay monthly(i.e., Ginnie Maes) while others may pay annually. Some securities, likesavings bonds, T-bills, and zero coupon Treasuries, are issued without acoupon, paying interest at maturity.
The coupon rate is the contractual interest rate paid for the life of the in-strument. It does not change, except in variable rate securities and, in rareinstances, when a change was specified in the original offering agreement(commonly referred to as a step-up security). Thus, a 6.25 percent couponrate pays 6.25 percent per annum until the obligation matures.
The market interest rate or market yield (yield to maturity) is a differentconcept. Market rates can change minute by minute and are influenced by allthe forces that affect the marketplace, including fundamental or economics-related events, supply and demand and technical factors.
THE BASICS OF PRICE
While the coupon on a fixed rate bond or note is constant (set for the life ofthe bond), the market yield varies for that security, depending on numerousmarket forces. Thus, for most of the life of the debt instrument, the marketyield will be higher or lower than the coupon yield. That difference betweencoupon and market yield, if any, determines a bond’s price. When the couponand market yield are identical, for example both 5.5 percent, the price of thebond will be par, or $1,000 per $1,000 bond. But if the coupon yield is 5.5percent while the market yield has declined to 5.25 percent, the stream of in-terest payments represented by the 5.5 percent coupon yield cannot be re-placed by buying a new comparable or virtually identical debt security. Thatmakes the existing 5.5 percent coupon-bearing bond more valuable as it willpay $55 per year for each $1,000 bond, whereas a new bond priced at parwould pay only $52.50 per year. To compensate for its added value, the priceof the existing bond will have to rise sufficiently, depending on its maturity, torecalculate the yield from 5.5 percent to the 5.25 percent market yield, thusraising the price of the bond.
The calculations that determine the yield to maturity, which involve thecoupon rate, the price of the debt instrument, and its maturity date will be ex-plained later (Chapter 3). For now, it is important to recognize that whenmarket yields fall, debt prices rise. When the market yield falls below the
The Basics of Price 11
ccc_strumeyer_ch1_1-25.qxd 1/6/05 1:38 PM Page 11

coupon yield, the bonds price rises above par, or above $1,000 per bond. Thisbond is trading at a “premium.” The same principle operates in reverse.When market yields rise, bond prices fall. When the market yield rises abovethe coupon yield, the debt instrument’s price falls below par. This bond istrading at a discount. How much the price falls below or rises above par is de-termined by a present value calculation using coupon, market yield, and thematurity date, or call date.
By now, you should understand that if market yields are rising and areprojected to continue rising, then the price of any given fixed income debt in-strument is falling and will likely continue falling. Your investment strategiesbased on your view that interest rates are likely to continue rising, causing theprices of debt instruments to trend lower, vary. If you are a buy-and-hold in-vestor, intermediate market movements need not disturb you. But, if you are amarket timer, whether to a greater or lesser extent, a market movement canand should be a call to action.
Your decisions will depend on what you expect to happen. Are bond yieldslikely to rise only slightly because of sizable new supply coming to market, onlyto retrace their rise after the sales? Is the rise in interest rates a cyclical rise that islikely to be extended and sustained for many months or years? Or is the rise po-tentially a very long-term phenomenon that leads to higher and higher yields ateach successive cyclical interest rate peak? The very same questions can be posedwith regard to signs of declining bond yields and consequent rising prices ondebt instruments. What is the direction of the economy and Federal Reserve pol-icy? What is the current and likely future rate of inflation? These and other con-siderations all go into deciding whether interest rates are high or low, or rising orfalling, and how high or low they are likely to go. For a buy-and-hold investorthat determination is not essential, but for a market timer it can be critical.
FACTORS AFFECTING BOND PRICES
There are numerous factors, both fundamental and technical, that impact bondprices. Fundamental factors include overall economic activity and the ensuinginflationary pressures, unemployment, and budget and trade deficits. Creditconcerns with specific issuers may negatively affect the price of an issuer’s secu-rities as well. Technical factors influencing supply and demand of the bondmarket in general as well as particular bonds can lead to significant price move-ments. These technical variables may be a bit more difficult for investors tograsp, but a brief look into the U.S. Treasury’s quarterly refunding auctionsmay help explain the effects of technical influences of supply and demand.
The Treasury’s quarterly refunding often serves to drive market yields uptemporarily due to the sheer size of the Treasury’s bond sale. Indeed, after theauctioned bonds and notes are successfully distributed to market investment
12 AN OVERVIEW OF THE FIXED INCOME SECURITIES MARKET
ccc_strumeyer_ch1_1-25.qxd 1/6/05 1:38 PM Page 12

portfolios (rather than just in short-term trading accounts), market yields oftenrevert to the levels prevailing before the auction. The regularity of this phe-nomenon is so pronounced that it is sometimes called a Duke of York, after anEnglish nursery rhyme. For those unfamiliar with it: “The Duke of York hadten thousand men; he marched them to the top of a hill, then marched themdown again.” Like the Duke of York and his men, Treasury market yields havea tendency to rise immediately prior to the auction, and once the yield rise hasaccomplished its purpose—to entice buyers—it tends to reverse. In order todistinguish this type of yield behavior from cyclical yield patterns it is useful tokeep the timing of the Treasury’s debt refunding in mind. The U.S. Treasury isnow refinancing its debt monthly, but there is usually a more important impacton market yields in the Treasury’s quarterly auctions, which take place in thefirst full week of the middle month of each quarter, more specifically early Feb-ruary, May, August, and November. These market yield gyrations do not affectmerely Treasuries. They often affect yields on corporate bonds as well. And ifthere are outsized corporate bond offerings, they too can temporarily affectTreasury yields. It is a two-way street. That is another way of saying all thecredit markets are interrelated. A major change in the supply or demand forcredit in one market has a ripple effect upon all the other credit markets to agreater or lesser extent.
There is a special reason why the Treasury auctions have an outsized effecton Treasury yields and why sizable auctions in other markets do so as well. Toput it succinctly, it reflects the short sale of similar maturity Treasuries by theunderwriting firms in order to create a more favorable market for the new debtoffering. The underwriting firms offering a new corporate issue also sell com-parable maturity Treasury issues short for exactly the same purpose. For thosewho do not recall what a short sale is, it is the sale of borrowed financial in-struments, in this instance Treasury bonds. The sale of borrowed bonds hasmuch the same market price depressing and yield raising impact as the sale ofbonds that are not borrowed. There is, of course, an important difference. Thesale has to be reversed. When it is, the market impact is reversed as well. Nowyou know the secret of the Duke of York yield phenomenon around auctions.Sometimes dealers try to outwit the market into believing that no rise in yieldis necessary to attract buyers to the auctions. They may even bid up the priceand lower the yield in advance of major auctions. If they are successful in thistactic, the auction can be even more profitable for them. But, what if the auc-tions are not successful? If the auction generates less market enthusiasm thanexpected at the yields offered, meaning that the underwriters are stuck withtoo much of the new issue, yields will subsequently soar and market prices willplunge after the auction (rather than before) in an underwriter scramble to un-load excessive positions and place the issue with their customers. This exampleis an object lesson of technical factors influencing not only Treasury securitiesbut corporate yields and prices as well.
Factors Affecting Bond Prices 13
ccc_strumeyer_ch1_1-25.qxd 1/6/05 1:38 PM Page 13

ARE TODAY’S BOND YIELDS HIGH OR LOW?—A HISTORY LESSON
By Philip Braverman
Press reports in recent years have often referred to interest rates as being ex-traordinarily low. Financial news story headlines have cited particular interestrates or yields as the lowest in four decades. The clear implication is that suchlow levels of interest rates are unsustainable, and that yields are likely soon toskyrocket. To gain perspective on what is or is not a low level of interest rates,and whether recent yield levels are sustainable, requires a look at interestrates over an extended period of time.
A review of U.S. Treasury bond yields over the past few decades wouldcertainly seem to support the view that recent lows in yields are extraordi-nary. (See Figure 1.3.) The monthly average Treasury bond yield hit an all-time high of 14.68 percent in October 1981, in the midst of the August1981–November 1982 recession, and has been declining in an irregular pat-tern ever since. The lowest monthly average Treasury bond yield in the 1980swas 7.27 percent, reached in July 1986 (down over 7 percentage points from
14 AN OVERVIEW OF THE FIXED INCOME SECURITIES MARKET
FIGURE 1.3 Long-Term Treasury Rate 1800–2000Yearly AverageSources: Federal Reserve Board, Homer & Sylla. Through August 2001. Data fromFederal Reserve Bank of Dallas, “Selected Interest Rates.”Courtesy Hoisington Investment Management Company, Austin, Texas.
Yearly Average14%
12%
10%
8%
6%
4%
2%
0%
14%
12%
10%
8%
6%
4%
2%
0%
Treasury rates are still high based on long-term historicalconsiderations.
avg. = 4.5%
1870 to present average = 4.2%
1800 1820 1840 1860 1880 1900 1920 1940 1960 1980 20001810 1830 1850 1870 1890 1910 1930 1950 1970 1990
ccc_strumeyer_ch1_1-25.qxd 1/6/05 1:38 PM Page 14
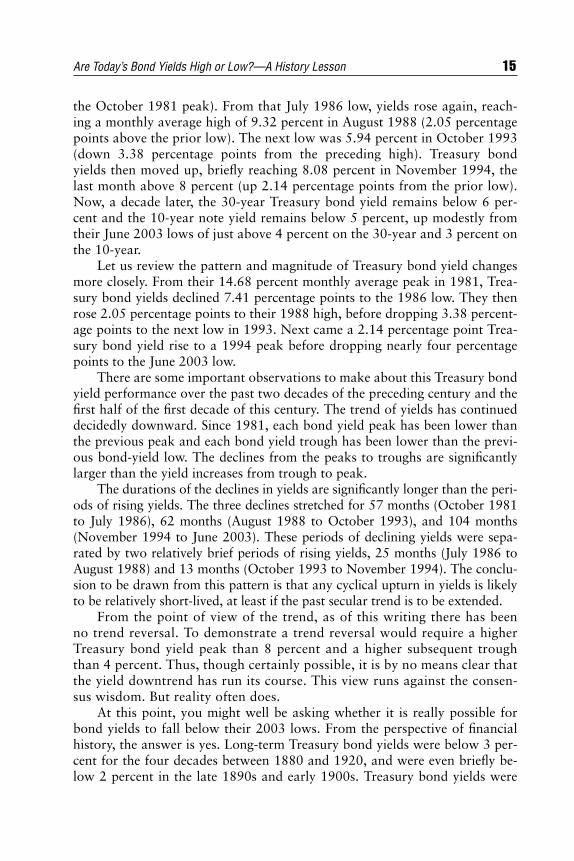
the October 1981 peak). From that July 1986 low, yields rose again, reach-ing a monthly average high of 9.32 percent in August 1988 (2.05 percentagepoints above the prior low). The next low was 5.94 percent in October 1993(down 3.38 percentage points from the preceding high). Treasury bondyields then moved up, briefly reaching 8.08 percent in November 1994, thelast month above 8 percent (up 2.14 percentage points from the prior low).Now, a decade later, the 30-year Treasury bond yield remains below 6 per-cent and the 10-year note yield remains below 5 percent, up modestly fromtheir June 2003 lows of just above 4 percent on the 30-year and 3 percent onthe 10-year.
Let us review the pattern and magnitude of Treasury bond yield changesmore closely. From their 14.68 percent monthly average peak in 1981, Trea-sury bond yields declined 7.41 percentage points to the 1986 low. They thenrose 2.05 percentage points to their 1988 high, before dropping 3.38 percent-age points to the next low in 1993. Next came a 2.14 percentage point Trea-sury bond yield rise to a 1994 peak before dropping nearly four percentagepoints to the June 2003 low.
There are some important observations to make about this Treasury bondyield performance over the past two decades of the preceding century and thefirst half of the first decade of this century. The trend of yields has continueddecidedly downward. Since 1981, each bond yield peak has been lower thanthe previous peak and each bond yield trough has been lower than the previ-ous bond-yield low. The declines from the peaks to troughs are significantlylarger than the yield increases from trough to peak.
The durations of the declines in yields are significantly longer than the peri-ods of rising yields. The three declines stretched for 57 months (October 1981to July 1986), 62 months (August 1988 to October 1993), and 104 months(November 1994 to June 2003). These periods of declining yields were sepa-rated by two relatively brief periods of rising yields, 25 months (July 1986 toAugust 1988) and 13 months (October 1993 to November 1994). The conclu-sion to be drawn from this pattern is that any cyclical upturn in yields is likelyto be relatively short-lived, at least if the past secular trend is to be extended.
From the point of view of the trend, as of this writing there has beenno trend reversal. To demonstrate a trend reversal would require a higherTreasury bond yield peak than 8 percent and a higher subsequent troughthan 4 percent. Thus, though certainly possible, it is by no means clear thatthe yield downtrend has run its course. This view runs against the consen-sus wisdom. But reality often does.
At this point, you might well be asking whether it is really possible forbond yields to fall below their 2003 lows. From the perspective of financialhistory, the answer is yes. Long-term Treasury bond yields were below 3 per-cent for the four decades between 1880 and 1920, and were even briefly be-low 2 percent in the late 1890s and early 1900s. Treasury bond yields were
Are Today’s Bond Yields High or Low?—A History Lesson 15
ccc_strumeyer_ch1_1-25.qxd 1/6/05 1:38 PM Page 15

again below 3 percent for most of the three decades from the 1930s Great De-pression through the 1950s. (See Figure 1.4.)
Let’s examine another question you may be asking. Are 4 percent to 5 per-cent Treasury bond yields high or low? Most observers would give the wronganswer. Based only on the limited experience of the past few decades, 4 percentto 5 percent Treasury bond yields may seem low. But the correct answer, usingthe long sweep of historical data, is that such yield levels are only average.Since 1870, Treasury bond yields have averaged 4.6 percent. That includes theformative years of U.S. history, the War of 1812, and the U.S. Civil War, whenTreasury bond yields exceeded 6 percent in the midst of heightened concernover inflation. Indeed, such high Treasury bond yields were understandable atthe time in view of the world financial community’s serious concern over thesafety of such investments, especially considering doubts over the very survivalof the United States as an independent unified nation.
If the period prior to 1870 is excluded to avoid unnecessarily distortingthe data by the inclusion of war-induced interest rate spikes, the average U.S.Treasury bond yield falls to 4.2 percent for the period from 1870 through2000. It could be argued that there are still two major distorting periods re-
16 AN OVERVIEW OF THE FIXED INCOME SECURITIES MARKET
FIGURE 1.4 Long-Term Treasury Rate 1871–2004Yearly AverageSources: Federal Reserve Board, Homer & Sylla. Through September 2004.Courtesy Hoisington Investment Management Company, Austin, Texas.
Yearly Average14%
12%
10%
8%
6%
4%
2%
0%
14%
12%
10%
8%
6%
4%
2%
0%1871 1891 1911 1931 1951 1971 1991
1881 1901 1921 1941 1961 1981 2001
*Two 20-year periods when bondsoutperformed stocks.
avg. = 4.2%
3.42%2.72%
3.33%
2.44%
ccc_strumeyer_ch1_1-25.qxd 1/6/05 1:38 PM Page 16

maining, the low interest rates in the Great Depression, which pushed Trea-sury bond yields below 3 percent, and the inflationary aftermath of WorldWar II, reinforced by the Cold War (the very expensive arms race between theSoviet bloc and the West), which again pushed Treasury yields above 6 per-cent. If these two periods were removed, average Treasury bond yields wouldfall well below 4 percent.
This 4.2 percent average Treasury bond yield since 1870 and the well un-der 4.0 percent average yield excluding the aberrations of both the Depres-sion and the Cold War can be used as a guide to investing. When Treasurybond yields, not just Treasury 10-year note yields, are around 4.0 percent, thelevels may at worst be viewed as neither high nor low, just average. Thus,higher Treasury bond yields, such as those prevailing currently, should beviewed as attractive.
But that may not be optimistic enough. Treasury long-term bond yieldsmight well be returning to the averages experienced before the Cold Warwhen below 4.0 percent bond yields were typical and even below 3.0 percentbond yields were at times commonplace. That possibility would of coursemake Treasury bond yields above 4.0 percent far more enticing for the long-term investor.
There is another way of assessing Treasury bond yields to see if they arehigh or low. That is by looking at the real Treasury bond yield after deductinginflation. Since 1871, the real Treasury bond yield has averaged 2.1 percentafter deducting the measure of inflation called the GDP deflator, which by co-incidence also averaged 2.1 percent since 1871. This real bond yield was wellabove this 2.1 percent average level in the 1980s, when inflation fears wererunning rampant. The real Treasury bond yield has since gradually declinedtoward its long-term average, but it’s not there yet. With various key mea-sures of inflation, especially core inflation, trending below its 2.1 percent his-toric average and the real Treasury bond yield above its long-term average,both real and nominal Treasury bond yields can be viewed as still high.
These bond investment decision-making approaches are different fromcyclical analysis, which will be discussed in Chapters 5 and 6. None of theseapproaches will prevent bond yields from rising when you expect them to de-cline. But they will significantly increase the probability of profitable invest-ment in bonds. They have for me.
SORTING OUT FACT FROM FICTION
What about the often-repeated contention that an investor will almost alwaysdo better in stocks than in bonds? As just noted, the market rate of interesttypically available on bonds and other medium- to long-term debt instru-ments is currently significantly higher than the rate of dividend return on eq-
Sorting Out Fact from Fiction 17
ccc_strumeyer_ch1_1-25.qxd 1/6/05 1:38 PM Page 17

uities. That has been the case for a number of decades. But, stock proponentscounter with the argument that it is the total return on a portfolio, includingprice changes, that counts. And the total return on portfolios of equities hashistorically outperformed that on bonds (see Figure 1.5).
There are, however, a number of holes in that argument. It is widely rec-ognized that the risk of loss through default or volatile market price behavioris higher in equities. Shouldn’t the returns for equity portfolios and debt port-folios be risk adjusted? In addition, the portfolio earnings comparisons areusually biased in favor of equities. Since many stocks pay little or no divi-dends, a more appropriate comparison is probably between the price perfor-mance of zero coupon bonds and equities. Stocks have not alwaysoutperformed portfolios of zero coupon or even coupon-paying bonds.
For example, a portfolio of U.S. Treasury zero coupon bonds maturingNovember 15, 2020, earned an average 9.72 percent per year over the past 10years and 10.31 percent per year since the end of 1989. The Merrill Lynch10+-year-maturity Treasury securities index since year-end 1989 earned a9.17 percent average annual return. Different maturity zero coupon U.S.Treasuries earned similar returns. The U.S. Treasury zero coupon bond
18 AN OVERVIEW OF THE FIXED INCOME SECURITIES MARKET
FIGURE 1.5 Cumulative WealthSource: “Cumulative Experience for Five U.S. Asset Classes,” by Campbell R. Harveyof the Fuqua School of Business, Duke University.
Time
10,953.9
2,284.8
86.860.6
17.7
10.3
Dec1925
De c2003
Dec1930
Dec1935
Dec1940
Dec1945
Dec1950
Dec1955
Dec1960
Dec1965
Dec1970
Dec1975
Dec1980
Dec1985
Dec1990
Dec1995
Dec2000
S&P 500 TR U.S. Small Stk TR U.S. LT Corp TR U.S. LT Gvt TR U.S. 30 Day TBill TR U.S. Inflation
0.1
20,000.0
0.1
0.20.3
0.50.71.0
2.03.0
5.07.0
10.0
20.030.0
50.070.0
100.0
200.0
300.0
500.0700.0
1,000.0
2,000.0
3,000.0
5,000.07,000.0
10,000.0
Index Values (USD) Index Line GraphFrequency: Monthly
ccc_strumeyer_ch1_1-25.qxd 1/6/05 1:38 PM Page 18

STRIPS maturing November 15, 2015, earned an average 9.46 percent overthe past 10 years and 9.95 percent since 1986.1
Similar returns would have been achieved in zero coupon bond mutualfunds that invest primarily, though not exclusively, in U.S. government andagency debt securities. For example, on February 1, 2004, the American Cen-tury Target funds reported total gains averaging 8.81 percent in the past 10years and 10.34 percent since 1986 on its 2015 maturity fund. The averagegains on its 2015 Target fund were 8.81 percent in the past 10 years and10.64 percent since 1989. These returns were actually lower, though still im-pressive, after fees and expenses.2
It is important to note that the actual return on a portfolio of U.S. Trea-sury zero coupon securities or a bond fund investing in zeros would have beenmade considerably higher than those just cited by choosing the most advanta-geous sector of the zero maturity yield curve. How an investor can accom-plish that will be explained in subsequent chapters. And you can improveyour relative investment gains regardless of whether interest rates decline, re-main the same, or even rise, provided you follow the advice that will bespelled out in Chapter 19 for “riding the yield curve.”
As just noted, even when a portfolio of equities earns more than a portfo-lio of bonds over some given holding period, the higher return was partly, ifnot entirely, because of the assumption of greater risk. One way of viewingthat risk is whether the prices reached on such investments are, by some ob-jective standard of measurement, within or outside a historically normalrange. If the prices are high relative to the long sweep of history of such in-vestments, they may be considered to have been in unsustainable speculativeterritory (consider the stock market during the 1990s and the dot-com bub-ble). That is the case with equity prices, but not so with fixed income securi-ties markets as a rule. The rise in equity prices in the 1990s essentially was adrive ever deeper into speculative territory. That can be discerned using suchstandard measures of equity value as the price-earnings (P/E) ratio. It was cer-tainly not because the dividend rate on equities, expressed as a percentage ofreturn on every $100 invested, exceeded the percentage market rate of inter-est on the same $100 invested in a portfolio of bonds.
Much of the gain in the price of equities over recent decades did not come asa proportionate response to the rise in corporate earnings. Instead, it came frombidding up the market price it took to purchase each dollar of earnings and eachdollar of dividends. To put it another way, the speculative binge in equities in the1980s and 1990s was made possible by (1) market acceptance of what proved tobe an unsustainable long upswing in P/E ratios to levels well above their long-term trend average, (2) a pronounced decline in the rate of dividend return, and(3) various forms of creative accounting and corporate malfeasance that artifi-cially inflated earnings or hid losses. Even Federal Reserve Chairman AlanGreenspan, in a speech to the American Enterprise Institute in December 1996,
Sorting Out Fact from Fiction 19
ccc_strumeyer_ch1_1-25.qxd 1/6/05 1:38 PM Page 19

said that the equity market had “unduly escalated asset values” and coined thephrase “irrational exuberance” to describe the market’s expectations of equityprices. Since Greenspan’s warning, the stock market has become further ex-tended, with the S&P 500 Index increasing by an additional 57%! Thus, there isa good reason to doubt that there will be a near-term extension of such riskytrends as those of the 1990s. Indeed, it may be prudent to anticipate an oppositetrend. (See Figure 1.6.)
Historical experience suggests that it is far more likely that there will be areversal in both the trend rise in the price-earnings ratio and the trend decline inthe rate of dividends back to more normal relationships. The same reversalprocess is likely in other traditional measures of equity value. Those measuresalso suggest that equity prices not only are unlikely to repeat their heady rate ofrise in the 1990s, they may not even exceed high-quality bond interest ratesover the next decade. Such a trend reversal, called a reversion to the mean, willtend to return these ratios back to their long-term trend average. But that rever-sion to the mean is typically achieved by a pronounced overshooting of thelong-term averages. For example, every time the average P/E ratio has previ-ously exceeded 20, it has subsequently receded to below 10, not just to thelong-term average of 15. As is evident in Figure 1.7, the dividend yield on the
20 AN OVERVIEW OF THE FIXED INCOME SECURITIES MARKET
FIGURE 1.6 Price-Earnings Ratio 1881–1999Sources: Bureau of Labor Statistics; Rober Shiller, Yale University. Through June 2001est. Earnings through Q1. Numerator: Real S&P Composite Stock Price Index. De-nominator: 10-year moving average of real S&P Composite earnings.Courtesy Hoisington Investment Management Company, Austin, Texas.
Monthly
50
45
40
35
30
25
20
15
10
5
0
In the 5, 10, 15, and 20-year periods following June 1901, the real returns on stocks, includingdividends, were 3.4%, 4.4%, 3.1%, and –0.2% respectively.
Following September 1929, the real returns on stocks were –13.1% (5 years), –1.4% (10 years),–0.5% (15 Years), 0.4% (20 years).
Following January 1966, the real returns on stocks were –2.6% (5 years), –1.8% (10 years), –0.5%(15 years), and 1.9% (20 years).
1871 1883 1895 1907 1919 1931 1943 1955 1967 1979 1991
50
45
40
35
30
25
20
15
10
5
0
June 1901
25
Sept. 1929
32
Jan. 1966
24
Average1870–1989
Dec. 199944
ccc_strumeyer_ch1_1-25.qxd 1/6/05 1:38 PM Page 20

Standard & Poor’s 500 index may not just rise from its recent under 2 percentlevel to its 4 percent long-term average. Rather, the dividend yield may rise toeven higher levels, such as 5 percent or 6 percent, as it has in the past when div-idends previously ended a long-term downswing. These historical perspectivessuggest that until the long-term imbalances in the P/E ratio and dividend returnare corrected, and confidence in corporate governance and corporate account-ing standards is established, there is a greater vulnerability in equities than iswidely recognized.
There is a further possible time bomb awaiting the equity market whenthe baby boomer generation begins retiring. The problem stems from the con-sequent heavy liquidation of the retirees’ equity portfolios, a process that islikely to extend for a couple of decades, beginning in about 2011. To betterunderstand this problem it is necessary to remind the reader of a very seriouspotential defect in the heavy reliance of retirement portfolios on equities.That defect stems from the need to liquidate equity holdings in order to meetretirement spending needs. Except for that portion of required retirement dis-tributions that come from dividends, the remainder is dependent on prevail-ing equity market prices at the time the funds are needed. If there is aconcentration of selling of equities to meet retirement needs, it is likely toswamp any offsetting domestic buying. It is primarily a problem of demo-graphics. In the critical decades, there will be far more retirees added eachyear domestically than new additions to the labor force. Moreover, the sellingby the average retiree will far exceed net equity purchases by the average newlabor force entrant. The result could be a prolonged equity bear market thatcrimps the spending power of retirees.
Sorting Out Fact from Fiction 21
FIGURE 1.7 S&P 500 Dividend Yield versus Treasury Bond YieldSource: The S&P 500 Dividend Yield, http.//cpcug.org/user/invest/b&syield.gif, fromHarry Rood, “The Big Picture: Index to Commentary on Long-Term Market Trends,”http://cpcug.org/user/invest/bigpic2.html. Copyright © 1995–1997 HR Consultants.
Stock & Bond Yield
16
14
12
10
8
6
4
2
01920 1930 1940 1950 1960 1970 1980 1990 2000
Yiel
d (%
/yea
r)
S&P 500
T-Bond
ccc_strumeyer_ch1_1-25.qxd 1/6/05 1:38 PM Page 21

There is of course a counterargument (there always is) that may mitigateor possibly negate such concerns. The counterargument is that new entrantsto the middle class in the developing world will produce sufficient foreignbuying of U.S. equities to lessen or offset the impact of domestic retiree sell-ing. Whether that is true remains to be seen.
The bottom line is that there is a basis for concern over excessive relianceon the equity market for retirement savings in the critical decades of babyboomer retirement. The solution to that uncertainty can be increased relianceon debt instruments for more assured interest and principal payouts in retire-ment. Nothing is without some element of risk. But with a portfolio of high-grade bonds and U.S. Treasuries, your cash flow income in retirement isdependent on the coupon interest yield rate return, not on the pricing whimof the marketplace.
While equity price increases over time are certainly not precluded, theymay be restrained. That is not to say that equities do not have a place inyour portfolio. They do. But debt instruments, in a properly structuredportfolio, deserve greater attention than they are usually afforded. Giventhe perspective of history, the return on long-term high-grade debt instru-ments may turn out to be not only the safest return, but also the most pru-dent choice for a high return for conservative investors with a long-terminvestment horizon employing a buy-and-hold strategy, which will be dis-cussed throughout this book.
One of the key points for investors to recognize is that the coupon in-terest payment on a bond is generally a more dependable source of incomethan the dividend payment on a stock. The return of your investment prin-cipal at a bond’s maturity is far more assured than is the return of yourprincipal invested in stocks by selling at any given point of time. It may bean old saying, but it is still worth repeating: “The return of your principalis far more important than the return on your principal.” On well-selectedbonds and shorter-term debt instruments, you can have both a favorablereturn on your principal as well as the eventual return of your principal.(See Figure 1.8.)
INVESTMENT STRATEGIES—BUY-AND-HOLD VERSUS MARKET TIMING
Regardless of whether one invests in equities, debt instruments, or both, thereis an ongoing debate as to what investment strategy is more effective. Withdebt securities there are essentially two opposing strategies. One approach isto remain fully invested through all the phases of the business or interest rate
22 AN OVERVIEW OF THE FIXED INCOME SECURITIES MARKET
ccc_strumeyer_ch1_1-25.qxd 1/6/05 1:38 PM Page 22

cycle, called a buy-and-hold strategy. The alternative is to time investmentsboth to take advantage of periods of rising market prices and to avoid or min-imize the risk of loss in the periods of declining market prices. This latter ap-proach is called, appropriately enough, “market timing.”
What are the arguments in support of the buy-and-hold strategy? Thosewho favor staying invested throughout any up and down changes in invest-ment prices have a number of concerns. Despite the seemingly repetitive na-ture of cycles in stock or bond prices, they argue that the essential problemwith market timing is the difficulty of correctly forecasting changes in mar-ket direction. As a consequence, they believe market timing will worsen over-all portfolio performance. They contend more income is actually lost bystaying out of the market when a price downturn is anticipated, because toooften there is a price rise rather than the expected downturn. There is also anopportunity cost in keeping one’s funds uninvested, anticipating a bond mar-ket decline (increase in yields). For example, an investor with cash idling in a
Investment Strategies—Buy-and-Hold versus Market Timing 23
FIGURE 1.8 Risk versus Return
U.S. Inflation
U.S.(30 Day) TBill TR
U.S. LT Gvt TR
U.S. LT Corp Bond TR
S&P500 Total Return
U.S. Small Stock TR
0.00% 2.00% 4.00% 6.00% 8.77%
Return (All) Risk (STD)
ccc_strumeyer_ch1_1-25.qxd 1/6/05 1:38 PM Page 23

money market mutual fund or a bank yielding less than 1 percent is givingup potentially more than 4 percent tax-free by not buying a long-term mu-nicipal security. By holding cash for a two-year period anticipating an up-ward interest rate move, the investor has now forgone some 8 percent ininterest income. Interest rates need to rise significantly to make up this op-portunity cost.
While forecasting is more an art than a science, it can potentially be donesuccessfully and thereby significantly improve your investment results. Thesame investor sitting on cash for a short-term period during a significant bondmarket decline (a large increase in market yield) will be rewarded hand-somely, far offsetting any opportunity cost. Your strategy should match yourrisk tolerance, financial sophistication, and available time and interest in fol-lowing the financial markets.
Whether you choose market timing, buy-and-hold investing, or a com-bination, you can more readily employ either approach with bonds thanwith stocks. The reason: Bonds automatically turn into cash at maturityand pay a steady, reliable stream of interest payments. For a buy-and-holdportfolio strategy, bonds can more readily provide the cash for retirementor other purposes than can equities, which require periodic selling, at pos-sibly inopportune times, to meet spending needs. It may also be that thecyclical swings in equity prices are less predictable than in bond prices. Ifthat is correct, either strategy is more likely to be successful with debt instruments.
Laddering a Portfolio
Briefly introduced earlier, portfolio laddering is an investment strategy thatperfectly applies to fixed income securities investing. Laddering is a techniquethat involves purchasing bonds with discrete maturities across a range of thematurity spectrum in order to (1) mitigate market risk and/or (2) fund futurefinancial obligations. In the first case, investors create their laddered bondportfolios to capture yield across the yield curve and to set up a reinvestmentregimen in order to dollar cost average. As each maturity arrives, the investorpurchases a new maturity to replace the original. This strategy provides liq-uidity if the investor should need cash. Since the investor is making each rein-vestment or rollover purchase at the current market rate, this should, over thelife of the portfolio, yield the bond market’s average rate of return for thatmaturity range.
If an investor is investing for a specific financial obligation, such as college, laddering is the best solution. If you know that you will be re-quired to fund payments of $25,000 per year for four years beginning 10years from now, you can begin funding that obligation today by purchasing
24 AN OVERVIEW OF THE FIXED INCOME SECURITIES MARKET
ccc_strumeyer_ch1_1-25.qxd 1/6/05 1:38 PM Page 24

bonds (zero coupon or current coupon) with maturities coinciding with the payment dates. Zero coupon securities are excellent instruments tofund this type of portfolio as you purchase the desired maturity amount ata discount, such discount being the interest earnings that will be paid atmaturity.
These techniques are examined in detail in Chapter 18.
Investment Strategies—Buy-and-Hold versus Market Timing 25
ccc_strumeyer_ch1_1-25.qxd 1/6/05 1:38 PM Page 25