an overview of the design and implementation of fda’s ... type (e.g., acute liver injury for...
TRANSCRIPT

© 2013, The Brookings Institution
Brookings Roundtable on Active Medical Product Surveillance
An Overview of the Design and
Implementation of FDA’s Prospective Routine Observational Monitoring Program
Tools for Safety Surveillance
Jennifer Nelson, Group Health Research Institute and University of Washington
Elizabeth Chrischilles, University of Iowa Department of Epidemiology
Monday, September 16, 2013

© 2013, The Brookings Institution
Mini-Sentinel’s Distributed Database 1- User creates and submits query (a computer program) 2- Data partners retrieve query 3- Data partners review and run query against their local data 4- Data partners review results 5- Data partners return results via secure network 6- Results are aggregated
Source: Mini-Sentinel
3

© 2013, The Brookings Institution
Mini-Sentinel Analyses
• Rapid assessments • Near real-time • Executed by each data partner behind their firewall • For additional information, please see the Mini-Sentinel Presentation on
Modular Programs
Modular Programs
• Formal and detailed evaluations • Customized study designs and protocols • More resource- and time- intensive than modular programs • For examples of past Mini-Sentinel Protocol-Based Assessments, please see
here or here
Protocol-Based Assessments
• Relatively standardized • Semi-automated • Routine prospective surveillance program • Can examine a number of products simultaneously
Prospective Routine Observational Monitoring Program Tools (PROMPT)
4

© 2013, The Brookings Institution
Housekeeping
• To minimize feedback, please confirm that the microphone on your telephone is muted.
• To mute your phone, press the mute button or ‘*6’. (To un-mute, press ‘*7’)
• There will be opportunities for questions and discussion at the end of today’s presentations. Please use the Q & A tab on the top of your screen to submit your questions into the queue at any point and we will call upon you to state your question.
• Call the Level 3 Conferencing at 1-888-447-1119 with technical problems.
5

© 2013, The Brookings Institution
Brookings Roundtable on Active Medical Product Surveillance
An Overview of the Design and
Implementation of FDA’s Prospective Routine Observational Monitoring Program
Tools for Safety Surveillance
Jennifer Nelson, Group Health Research Institute and University of Washington
Elizabeth Chrischilles, University of Iowa Department of Epidemiology
Monday, September 16, 2013

PROMPT: Prospective Routine
Observational Monitoring Program Tools
Elizabeth Chrischilles, U of Iowa
Jennifer Nelson, Group Health and U of WA
Mini-Sentinel Protocol Core and Methods Core
September 16, 2013

FDA’s Vision for a Semi-Automated Surveillance System as Another
Surveillance Tool

What constitutes a comprehensive safety surveillance system? • Semi-automated routine
surveillance, applying general tools with minor adaptations to address the specific product
But also… • Ability to bring specialized
expertise to bear on specific issue(s) that may arise in product lifecycle

Complements other approaches
Other Mini Sentinel activities • describe populations and treatment (e.g., uptake)
• one-time, retrospective customized protocol-based assessments for older products
• monitor impact of FDA actions (e.g., a label change)
FDA activities beyond Mini Sentinel • surveillance based on spontaneous reports
• untargeted surveillance (data mining) of healthcare data
• customized protocol-based studies using healthcare data

Overview of Anticipated Procedures for Active Surveillance of New Medical Products Using the PROMPT System

Goal
Relatively standardized
Prospective
A number of products simultaneously
Signal potential excess risk for subsequent follow-up
Tools: • Cohort and outcome library
• Core confounder definition
• Module selection tool
• Analysis modules
• User guides

Define exposures, outcomes, etc
Estimate the risk
Aggregate results over time
Apply alerting rules
Report to FDA FDA reports to public when appropriate
Newly marketed product
Choose analysis approach
PROMPT surveillance at a glance

Define exposures, outcomes, etc •FDA: Selects product for surveillance •6 mo prior to desired start •Planning team:
•Which outcomes? •Post-exposure time window? •Who is eligible? •Comparators? •Which confounders? •Which design? •Plan for promptly evaluating signals?
Newly marketed product
PROMPT surveillance: who, what, when

PROMPT Outcome selection occurs in association with several other medical products of
that type (e.g., acute liver injury for drugs; febrile seizures for vaccines) or another product in the class and is thus of general interest or
reason to suspect that that product in particular might increase the risk of that HOI, for example because of a signal identified in pre-approval animal studies or clinical trials
Signal refinement is a process for evaluating the magnitude and clinical significance of a suspected association
15
Signal Evaluation Signal Refinement Signal Generation Signal Generation Signal Refinement

Standard outcome algorithms GI bleeding
Pancreatitis
Premature delivery
Pulmonary Fibrosis
Hypertensive crisis
Agranulocytosis
Aplastic Anemia
Bronchospasm
CVA
Venous Thromboembolism
Hemorrhagic CVA
Ischemic CVA
Neutropenia
Bell’s Palsy
Spontaneous abortion/Stillbirth
Acute Respiratory Failure
Sepsis
Deafness
Thrombotic thrombocytopenic purpura
Systemic lupus erythematosis
Inflammatory Bowel Disease
Juvenile RA
Tuberculosis
Erythema multiforme major
Idiopathic thrombocytopenic purpura
Thrombocytopenia
Henoch Schonlein purpura
Peripheral neuropathy
Guillan-Barre syndrome
Tendon rupture
Seizure, febrile
Suicide
Valvulopathy
Hip fracture
Pulmonary hypertension
Rhabdomyolysis
Sudden cardiac death
Diabetes

Standard Outcome Definitions:
Outcome Algorithm Rationale Reference
Acute Ischemic Stroke
Recommended Primary: 434, 436 in first position of a hospital claim
Some algorithms also included 433.x1 and excluded 434.x0 (see Recommended Secondary), however 433.x1 may also have low PPV and the PPV for 434 (without exclusion) in first position is good (>85%). PPV diminishes slightly when any position, or when community vs tertiary care.
22262598 12105309
Recommended Secondary: 433.x1, 434 (excluding 434.x0), 436 in first position of a hospital claim
Algorithm that included 433.x1, 434 (excluding 434.x0), and 436 performed well. 433 (other than 433.x0) had very low PPV. One study found 433.x1 PPV=71%
22262598 12364739
Also Observed (but not recommended): 433, 434, 436 in first position.
433 had very low PPV . 433.x0 PPV was 2%, 433.x1 PPV was only 20%
9707200

PROMPT Cohort selection
Exclude prior history of event?
Separate cohorts for each product indication?
Separate cohorts for individuals with major risk factors?
High priority subgroups
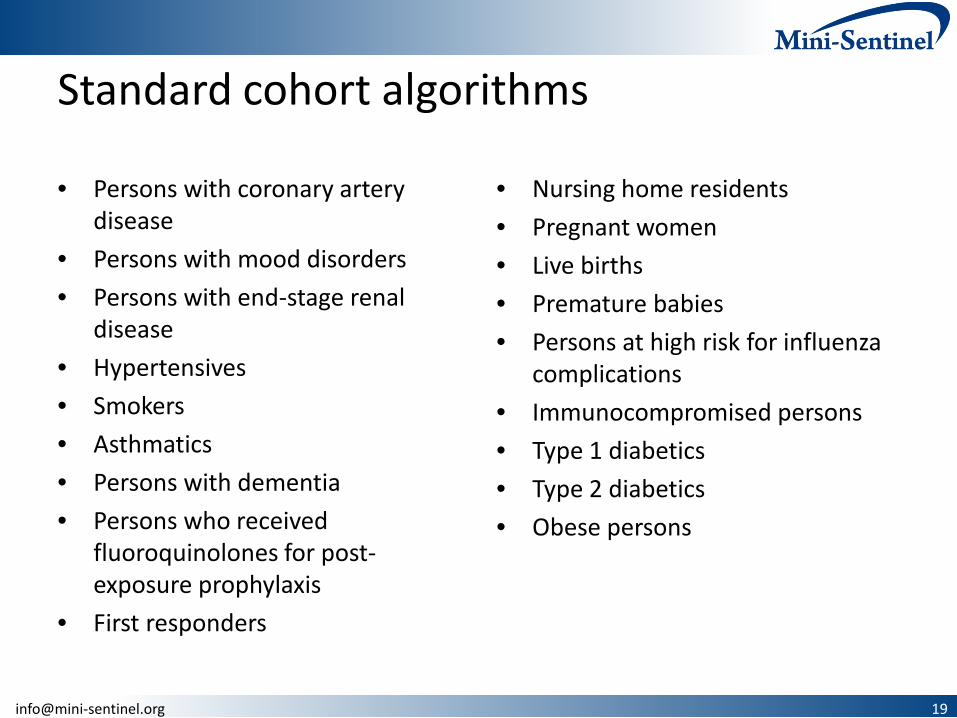
Standard cohort algorithms
• Persons with coronary artery disease
• Persons with mood disorders
• Persons with end-stage renal disease
• Hypertensives
• Smokers
• Asthmatics
• Persons with dementia
• Persons who received fluoroquinolones for post-exposure prophylaxis
• First responders
• Nursing home residents
• Pregnant women
• Live births
• Premature babies
• Persons at high risk for influenza complications
• Immunocompromised persons
• Type 1 diabetics
• Type 2 diabetics
• Obese persons

PROMPT Core confounder definitions Demographics Age Sex Calendar time* Data Partner* Healthcare utilization in baseline period # of visits to emergency departments # of ambulatory visits # of hospitalizations # of distinct drugs ordered/dispensed # of prescriptions ordered/dispensed Lifestyle Factors Smoking**, per algorithm developed by the “15 Cohorts” workgroup Body mass index**i, if available in the common data model; otherwise, per algorithm developed by the “15 Cohorts” workgroup Combined Charlson-Elixhauser comorbidity index
* Requires special consideration given sequential analyses ** Discreetly-captured data field not currently in the Mini Sentinel Common Data Model, therefore alternate diagnosis-based algorithm suggested

Define exposures, outcomes, etc
Newly marketed product
Choose analysis approach Cohort or self-controlled?
Relative risk? Risk difference?
PROMPT surveillance: how


PROMPT Module Selection Tool
MS Taxonomy project aimed at “pre-thinking” major design and analysis considerations • Outlined methodological decisions in routine monitoring
• Identified methodological options at each decision node
• Determined the scenarios characteristics that might influence the decisions
• Mapped scenario characteristics to recommended options
Developed interactive tool to expedite decision-making process for routine monitoring


Overview: Modular approach to drug safety monitoring in a distributed database system
Build pre-programmed modules that can be quickly activated to monitor the use and safety effects of new and existing drugs
Construct an analytic dataset based on pre-specified inputs: − Population eligibility − Outcome, exposure/comparator, and confounder definitions
Describe the population of exposed and comparators Estimate adjusted safety effects across data partners Modules can be run once as single analyses or conducted
repeatedly over time as data are refreshed and uptake occurs using sequential testing methods and pre-specified inputs: − Overall Type 1 (false positive) error to control across multiple tests − Frequency of testing and shape of signaling threshold over time − Maximum sample size after which surveillance will stop if no signal

Some Details: Modular approach to drug safety monitoring in a distributed database system
Validated programming code Can be run asynchronously across data partners as data get
refreshed while preserving data privacy Methods involve standard epidemiologic designs and statistical
methods − Confounding adjustment via a self-controlled design, PS matching,
regression, or inverse weighting approaches Can estimate difference and ratio measures (rate or risk) Addresses heterogeneity across data partners Can flexibly employ a variety of sequential designs and analyses
− Frequency of sequential analyses − Signaling rules for alerting a difference in risk between groups over time

Current Status: Modular approach to drug safety monitoring in a distributed database system
Version 1 of code has been developed and tested in the MSDD Code development was conducted using several example pairs
where association was deemed to be ‘known’: − True positive drug-event pair: ACEis and angioedema − True negative drug-event pair: clindamycin and AMI − True positive vaccine-event pair: MMRV and fever/seizure
Version 1 of module user’s manuals have been written − Includes needed module inputs and resulting standardized output − Describes the epidemiological design and statistical methods employed
Version 1 of surveillance reports have been created Next steps: further testing and enhancement of code, manual
and reports
Define exposures, outcomes, etc
Estimate the risk
Newly marketed product
Choose analysis approach
PROMPT surveillance: estimate risk
Module 1 Module 2 Module 3 Module 4
Self-controlled design
Exposure matching by propensity score (cohort design)
Regression (cohort design)
IPTW regression (cohort design)

Self-controlled design module (PROMPT 1)
Variant of the self-controlled case series Utilizes cases (those who experience an adverse event) only Compares risk in exposed and comparator time windows within
the same person Time-fixed confounders are implicitly controlled Future version will allow adjustment for time-varying
confounders (Sequential) test is based on a LRT statistic comparing observed
versus expected event counts Sequential boundaries extend maxSPRT method
− Flat boundary; can delay 1st analysis, then continuous subsequent tests

Lisinopril-angioedema Report date: 1/31/2014
Self-controlled group sequential analysis Last exposure: 7/31/2013
Test no. 5 Cumulative exposed: 71,892
Sequential analysis history and results
Tracking New events Cumulative Risk estimates Hypothesis-testing statistics and results
Test
#
Most
recent
batch(es)
included
No. of
new
events
in risk
interval
(“cases”)
No. of
new
events
in
control
interval
(“con-
trols”)
No. of
exposed
patients
No. of
events
in risk
interval
(“cases”)
No. of
events
in
control
interval
(“con-
trols”)
Expec-
ted no.
of cases
Relative
risk
Risk
differ-
ence
Log
likeli-
hood
ratio
test
statistic
Target
alpha to
spend
Actual
alpha
spent
No. of
cases
needed
to reject
H0 (CV)
H0
rejected
?
1
2
3
4
5
Date of last analysis: 5/21/2013

PS matching module (PROMPT 2)
First (of three) cohort approaches (e.g., new user design) Utilize individual-level data that remain at each data partner to
− Estimate a PS (based on pre-specified confounders or using hd-PS) − Match exposed to unexposed patients using the PS (fixed matching ratio) − Evaluate diagnostics
Minimal data combined for central analysis at MSOC Can compute HR, RR, RD comparing exposed and comparators,
stratified by data partner Future version will allow disease risk score matching (Sequential) test is based on a LRT statistic comparing observed
versus expected event counts Sequential boundaries extend maxSPRT method
− Flat boundary; can delay 1st analysis, then continuous subsequent tests

PS Matching Dataset Creation Capabilities Substantial flexibility in defining exposures and
outcomes, exposure windows, washout period, minimum exposures, blackout periods, etc. • Use enrollment data to reconcile overlaps and gaps; define
continuous enrollment periods
• Create continuous exposure periods, incorporating stockpiling
• Identify incident exposure episodes and outcomes
• Can restrict cohort based on eligibility criteria
• Identifies and defines a wide range of core confounders (demographics, healthcare utilization, and comorbid conditions)

Inputs for Prospective Routine Observational Monitoring Program Tool: cohort matching program ELIGIBILITY INFORMATION
• Enrollment gap: specifies the number of days bridged between two consecutive enrollment
periods to create a single continuous enrollment period.
• Inclusion/exclusion conditions: defined by creating a SAS dataset with codes defining the inclusion or exclusion of conditions(s) of interest.
EXPOSURE INFORMATION • Medical product of interest: defined by creating a SAS dataset with codes (i.e., NDCs or
CPTs) to identify the product of interest. • Comparator of interest: defined by creating a SAS dataset with codes (i.e., NDCs or CPTs) to
identify the comparator product of interest.

Coordinating center
• Identify Cohort, • Outcomes • Covariates • Calculate
confounder scores (PS, hd-PS, DRS)
Specify input parameters
• Run diagnostics • Create de-identified
result files
Evaluate diagnostics and aggregate data
across partners
Apply alerting algorithms and
interpret results
Iterate at next data refresh
Multiple data partners
Transmit code
Transmit data
Start PROMPT 2
PS Matching Module in detail


Regression module (PROMPT 3)
A second cohort data approach (e.g., new user design) Individual-level data remain at each data partner De-identified data are then combined for central analysis at MSOC Can fit any generalized linear model of interest
Logistic regression to estimate an OR Poisson regression to estimate a RR (and incorporate person-time data) Linear regression to estimate a RD
(Sequential) test is based on a score statistic Signaling boundaries leverage and extend RCT group sequential
methods (unifying family by Kittleson et al.) − Allows flexible boundary shape specification (O’Brien-Fleming, Pocock, etc.) − Can customize testing plan (any continuous or group sequential plan) − Uses exact method boundary formulation (vs large sample assumptions)

Example Individual-level Dataset that remains at each Data Partner
StudyID Age Sex Smoker Weight Height Flu Vaccine …
1 28 F Current 135 5’6” Yes
2 45 M Quit 190 6’0” No
…
100,000 51 M Never 180 5’10” Yes

Example of combined aggregated data sent to MSOC: event counts by strata
Site Age Cat Sex Flu Vaccine Events N
A 25-30 F Yes 10 1000
A 25-30 F No 15 600
A 25-30 M Yes 4 2000
A 25-30 M No 10 1000
…
A 60-65 M No 55 5000
B 25-30 F Yes 25 10000
B 25-30 F No 88 8000
…

IPTW regression module (PROMPT 4)
A third cohort approach (e.g., new user design) Utilizes individual-level data that remain at each data partner to
− Estimate a PS based on pre-specified confounders − Estimate a RD using linear regression, inverse weighted by the PS
Summary statistics are combined across data partners for analysis Acknowledges site heterogeneity by computing a stratified RD
estimate that incorporates variability in propensity score models (Sequential) test is based on a Wald test statistic Sequential boundaries leverage and extend RCT methods
− Allows flexible boundary shape specification (O’Brien-Fleming, Pocock, etc.) − Can customize testing plan (any continuous or group sequential plan) − Uses exact method boundary formulation (vs. large sample assumptions)

IPTW regression module Involves a stratified IPTW risk difference
Construct site-specific propensity scores (logistic regression)
Calculate site-specific IPTW risk difference & variance
(Lunceford & Davidian 2004); send with Ns to a central location
S∆ )(V S∆
Site 1
)(V, 11 ∆∆Site 2
)(V, 22 ∆∆Site 9
)(V, 99 ∆∆Site 10
)(V, 1010 ∆∆…
CENTRAL
∑
∑
=
=
∆=∆ 10
1
10
1
SS
SSS
N
N

IPTW regression module Uses a non-parametric permutation approach for rare events
Fix outcomes and confounders and permute exposure w/in site
Sites also send permuted datasets
( ) ( ){ })(V,,,)(V, )()()1()1( PPSSSS
∆∆∆∆
Site 1
( )( ) ( ){ })(V,,,)(V,
,)(V,,)()()1()1(
111
1111
PP
N∆∆∆∆
∆∆
…
CENTRAL Overall adjusted risk difference
Distribution of permuted risk difference under H0
Site 8
( )( ) ( ){ })(V,,,)(V,
,)(V,,)()()1()1(
8
888
888
PP
N∆∆∆∆
∆∆
Repeat for each analysis time t=1, 2…T)
Use unifying family (Kittleson) to derive stopping boundaries


What happens when we find something?
Examples of post-monitoring follow-up activities: • Data checks, analytic code checks
• Subgroup analyses
• Adjust for additional confounders
• Test against other comparators
• Vary population, O, or E definitions
• Medical chart validation of cases
• Quantitative bias analysis
• Detailed epidemiologic investigation to assess causality
Prompt, pre-planned product-specific assessment of positive signal (or in the absence of signal)


Define exposures, outcomes, etc
Estimate the risk
Aggregate results over time
Apply alerting rules
Report to FDA FDA reports to public when appropriate
Newly marketed product
Choose analysis approach
PROMPT surveillance: reporting

Information from Mini Sentinel’s PROMPT is used to complement other FDA data to
help inform regulatory action


© 2013, The Brookings Institution
Brookings Roundtable on Active Medical Product Surveillance
An Overview of the Design and
Implementation of FDA’s Prospective Routine Observational Monitoring Program
Tools for Safety Surveillance
Jennifer Nelson, Group Health Research Institute and University of Washington
Elizabeth Chrischilles, University of Iowa Department of Epidemiology
Monday, September 16, 2013