an overview of singapore's social policies (published 14 august 2015)
TRANSCRIPT
SINGAPORE’S SOCIAL POLICIES: PAST, PRESENT, FUTURE
OPPORTUNITIES THROUGH LIFEFOR EVERY SINGAPOREAN,A BETTER SINGAPOREWITH EVERY GENERATION
By Deputy Prime Minister and Finance Minister Tharman ShanmugaratnamAt the SG50 Distinguished Lecture of the Economic Society of Singapore on Friday, 14 August 2015
1
OPPORTUNITIES THROUGH LIFEFOR EVERY SINGAPOREAN,A BETTER SINGAPOREWITH EVERY GENERATION
By Deputy Prime Minister and Finance Minister Tharman ShanmugaratnamAt the SG50 Distinguished Lecture of the Economic Society of Singapore on Friday, 14 August 2015
SINGAPORE’S SOCIAL POLICIES: PAST, PRESENT, FUTURE

2
�e story of Singapore’s �rst 50 years that is best known internationally is of economic progress leading to a remarkable rise in GDP per capita. But that is not the heart of the Singapore story. �e unique Singapore story has been that of broad-based social upliftment: jobs for all, rising incomes for all, homes for all, quality schools and public healthcare for all, and neighbourhoods and parks shared by all.
It’s impossible for our economy to have succeeded without e�ective social strategies – most importantly, enabling people to develop their potential through education, and housing policies that provided a sense of equity. Or if everyone was just doing something for themselves, and we did not have a sense that we were moving up together.
But it’s also impossible for us to have experienced the substantial and broad-based improvement in social well-being and life satisfaction without a vibrant economy – and the large increase in real incomes, across the whole span of the workforce.
Economic and social strategies have gone hand in hand, and that’s what transformed standards of living and created the Singapore story.
In the �rst three decades, we focused on the basics. It was about economic survival. It was about providing everyone with opportunities for a good school education, for a job, and to own a home. It was coupled with a strong emphasis on self-reliance.
�e �rst Budget speech in December 1965, by then Finance Minister Mr Lim Kim San, was all about survival. It had a detailed assessment of the competition we faced and the constraints we had to reckon with. And one sentence to do with social subsidies: the Mount Emily Girls’ Home was to get 40 more places to allow a total of 85 girls.
Jobs were created, incomes did rise, and homes went up in value steadily as the economy improved.
When we got to the 1990s, social policy was coming more to the fore. �e Government began to take a proactive approach towards helping the lower income group. Edusave for the young, MediFund for those who could not a�ord medical expenses, and housing grants for the HDB resale market.
For both low-income and middle-income Singaporeans, real incomes have increased five to six times since 1965 (in other words, after deducting for inflation).
There was very little explicit support for the poor in those early decades, and a limited array of social policies. But a whole generation was lifted out of poverty, because our economic strategies worked.

3
A NEW BALANCE
We needed to mitigate inequality. We had seen a trend of rising inequality, that began from the mid-1990s. �is followed a similar trend in most advanced countries. We also wanted to do more to ensure that social mobility remained alive, and to help young people to have a real chance of discovering their own strengths and do well in di�erent �elds. And we wanted to provide more assurance for older Singaporeans.
Starting from a decade ago, we began this series of shifts, but they were still part of that compact between economic and social strategies. We still had to ensure a competitive economy where incomes could rise, but we paid special attention to ensuring that the low-income and middle-income group kept up as our economy progressed.
All societies would like to sustain income growth, mitigate inequality, and keep their societies �uid and mobile. How have we done? Let me summarise the picture1.
Growing Incomes for AllWe’ve managed to sustain income growth across the board. It’s been unusual among the countries in the same league as us. In the advanced countries, income stagnation has been the norm for the middle-income group. Among the Asian NIEs, Hong Kong and Taiwan have seen virtually no real income growth for the middle and lower income groups in the last decade.
Fortunately, in Singapore, we’ve managed signi�cant income growth in the last 10 years. �is chart [Chart 1] shows the signi�cant income growth for the median household (i.e. households in the middle of the income ladder). It came about both because individuals’ wages went up and because more people took advantage of the increased job opportunities.
1For more details on Singapore and international comparisons, refer to ‘Ministry of Finance Occasional Paper: Income Growth, Inequality and Mobility Trends in Singapore’. It is available at http://www.mof.gov.sg/Resources/Feature-Articles/Income-Growth-Distribution-and-Mobility-Trends-in-Singapore
Cumulative growth of real median household income
Latest 10 years, after taxes and transfers
Chart 1
US
Taiwan
United Kingdom
Hong Kong
Finland
South Korea
Singapore
%
-5
-3
-3
5
17
18
39
Sources: National Statistical Of�ces and IMF
But it was in the last 10 years, starting from around 2006 that we made a more decisive shift, a deliberate rebalancing to ensure that we remained an inclusive society.
4
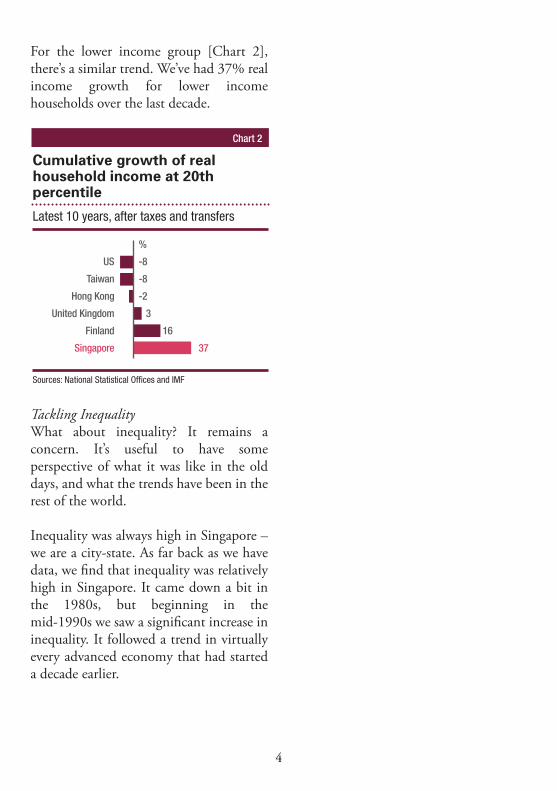
Cumulative growth of real household income at 20th percentile
Latest 10 years, after taxes and transfers
Chart 2
US
Taiwan
Hong Kong
United Kingdom
Finland
Singapore
%
-8
-8
-2
3
16
37
Sources: National Statistical Of�ces and IMF
For the lower income group [Chart 2], there’s a similar trend. We’ve had 37% real income growth for lower income households over the last decade.
Tackling InequalityWhat about inequality? It remains a concern. It’s useful to have some perspective of what it was like in the old days, and what the trends have been in the rest of the world.
Inequality was always high in Singapore – we are a city-state. As far back as we have data, we �nd that inequality was relatively high in Singapore. It came down a bit in the 1980s, but beginning in the mid-1990s we saw a signi�cant increase in inequality. It followed a trend in virtually every advanced economy that had started a decade earlier.

5
In Singapore, starting from the mid-1990s we saw an increase in inequality, for a whole decade. �e chart shows the trends in Gini coe�cients, using the OECD methodology for each country to ensure they can be compared. [Chart 3]
�e question then is what happens to inequality after taxes and transfers, because all governments engage in some redistribution, and we do too.
Long term trends in Gini coefficent for selected economies
Before taxes and transfers
Chart 3
0.54
0.52
0.50
0.48
0.46
0.44
0.42
0.40
0.38
0.36
0.341985 1987 1989 1991 1993 1995 1997 1999 2001 2003 2005 2007 2009 2011 2013
United KingdomUnited States
Finland
Singapore
Sources: OECD, Department of Statistics; using OECD methodology
Our level of inequality based on incomes (before taxes and government transfers) is not particularly high by international standards.
6
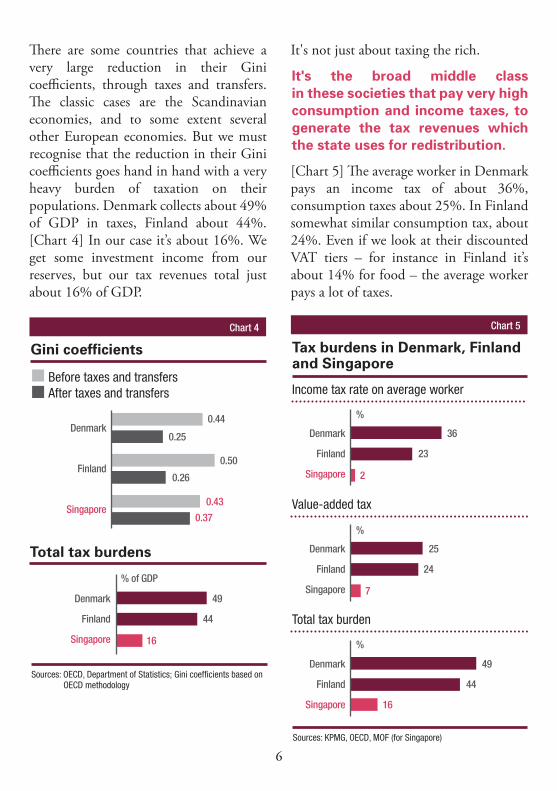
�ere are some countries that achieve a very large reduction in their Gini coe�cients, through taxes and transfers. �e classic cases are the Scandinavian economies, and to some extent several other European economies. But we must recognise that the reduction in their Gini coe�cients goes hand in hand with a very heavy burden of taxation on their populations. Denmark collects about 49% of GDP in taxes, Finland about 44%. [Chart 4] In our case it’s about 16%. We get some investment income from our reserves, but our tax revenues total just about 16% of GDP.
It's not just about taxing the rich.
[Chart 5] �e average worker in Denmark pays an income tax of about 36%, consumption taxes about 25%. In Finland somewhat similar consumption tax, about 24%. Even if we look at their discounted VAT tiers – for instance in Finland it’s about 14% for food – the average worker pays a lot of taxes.
Gini coefficients
Before taxes and transfersAfter taxes and transfers
Chart 4
Denmark
Finland
Singapore
0.44
0.25
0.50
0.26
0.43
0.37
Total tax burdens
Denmark
Finland
Singapore
49
44
16
Sources: OECD, Department of Statistics; Gini coef�cients based on OECD methodology
% of GDP
It's the broad middle class in these societies that pay very high consumption and income taxes, to generate the tax revenues which the state uses for redistribution.
Tax burdens in Denmark, Finlandand Singapore
Chart 5
Denmark
Finland
Singapore
36
23
2
Sources: KPMG, OECD, MOF (for Singapore)
Income tax rate on average worker
Value-added tax
Denmark
Finland
Singapore
25
24
7
Total tax burden
Denmark
Finland
Singapore
49
44
16
%
%
%
7
So that’s the basic trade-o�.
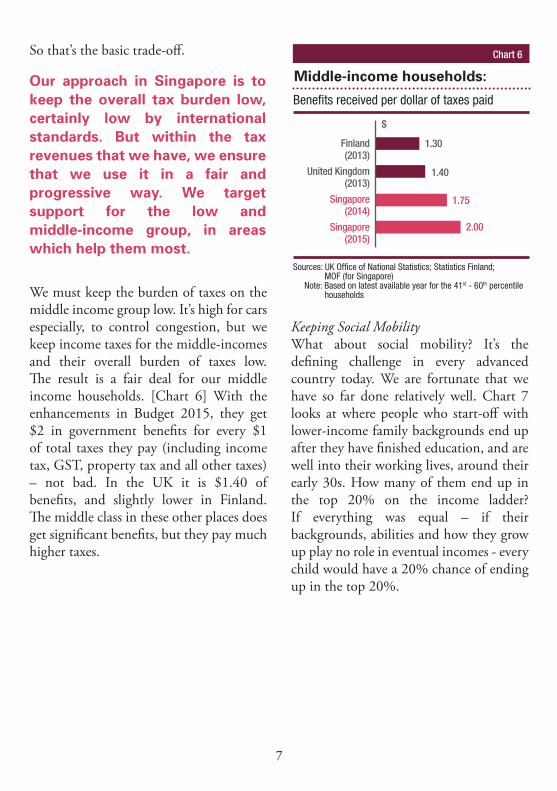
We must keep the burden of taxes on the middle income group low. It’s high for cars especially, to control congestion, but we keep income taxes for the middle-incomes and their overall burden of taxes low. �e result is a fair deal for our middle income households. [Chart 6] With the enhancements in Budget 2015, they get $2 in government bene�ts for every $1 of total taxes they pay (including income tax, GST, property tax and all other taxes) – not bad. In the UK it is $1.40 of bene�ts, and slightly lower in Finland. �e middle class in these other places does get signi�cant bene�ts, but they pay much higher taxes.
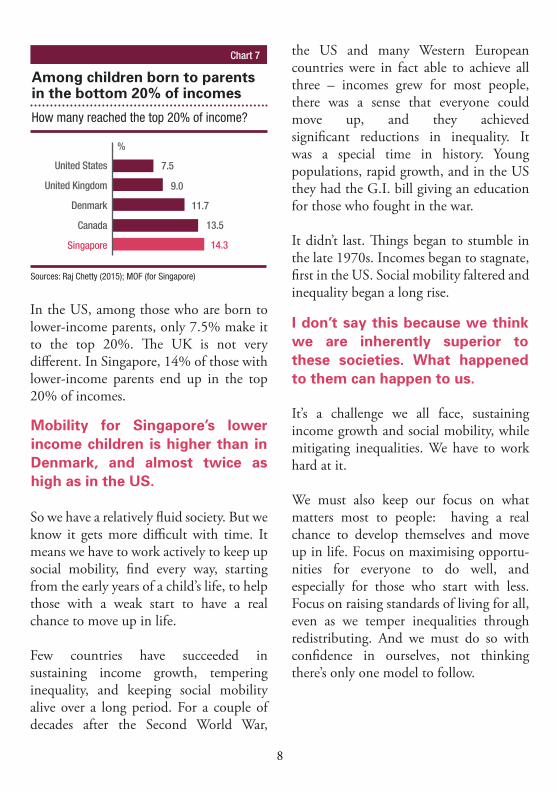
Keeping Social MobilityWhat about social mobility? It’s the de�ning challenge in every advanced country today. We are fortunate that we have so far done relatively well. Chart 7 looks at where people who start-o� with lower-income family backgrounds end up after they have �nished education, and are well into their working lives, around their early 30s. How many of them end up in the top 20% on the income ladder? If everything was equal – if their backgrounds, abilities and how they grow up play no role in eventual incomes - every child would have a 20% chance of ending up in the top 20%.
Our approach in Singapore is to keep the overall tax burden low, certainly low by international standards. But within the tax revenues that we have, we ensure that we use it in a fair and progressive way. We target support for the low and middle-income group, in areas which help them most.
Middle-income households:
Chart 6
Finland(2013)
United Kingdom(2013)
Singapore(2014)
Singapore (2015)
1.30
1.40
1.75
2.00
Sources: UK Of�ce of National Statistics; Statistics Finland; MOF (for Singapore) Note: Based on latest available year for the 41st - 60th percentile households
Bene�ts received per dollar of taxes paid
$
8
In the US, among those who are born to lower-income parents, only 7.5% make it to the top 20%. �e UK is not very di�erent. In Singapore, 14% of those with lower-income parents end up in the top 20% of incomes.
So we have a relatively �uid society. But we know it gets more di�cult with time. It means we have to work actively to keep up social mobility, �nd every way, starting from the early years of a child’s life, to help those with a weak start to have a real chance to move up in life.
Few countries have succeeded in sustaining income growth, tempering inequality, and keeping social mobility alive over a long period. For a couple of decades after the Second World War,
the US and many Western European countries were in fact able to achieve all three – incomes grew for most people, there was a sense that everyone could move up, and they achieved signi�cant reductions in inequality. It was a special time in history. Young populations, rapid growth, and in the US they had the G.I. bill giving an education for those who fought in the war.
It didn’t last. �ings began to stumble in the late 1970s. Incomes began to stagnate, �rst in the US. Social mobility faltered and inequality began a long rise.
It’s a challenge we all face, sustaining income growth and social mobility, while mitigating inequalities. We have to work hard at it.
We must also keep our focus on what matters most to people: having a real chance to develop themselves and move up in life. Focus on maximising opportu-nities for everyone to do well, and especially for those who start with less. Focus on raising standards of living for all, even as we temper inequalities through redistributing. And we must do so with con�dence in ourselves, not thinking there’s only one model to follow.
Mobility for Singapore’s lower income children is higher than in Denmark, and almost twice as high as in the US.
Among children born to parents in the bottom 20% of incomes
Chart 7
United States
United Kingdom
Denmark
Canada
Singapore
7.5
9.0
11.7
13.5
Sources: Raj Chetty (2015); MOF (for Singapore)
How many reached the top 20% of income?
14.3
%
I don’t say this because we think we are inherently superior to these societies. What happened to them can happen to us.
9
A MORE INCLUSIVE AND MORE INNOVATIVE SINGAPORETwo things matter greatly in our next phase of development. We have to make Singapore an innovative society. And we must continue to build an inclusive society. �ey go hand in hand.
We must be an innovative society to keep earning our place in the world, and to raise standards of living for all Singaporeans. We have to move from value-adding in global markets, to value-creation – through our own �rms, with more brands of their own, as well as through multi-nationals based here, creating value in Singapore. In every �eld: developing new, a�ordable medical treatments, creating new products or apps, or �nding new ways to reach customers.
It is more a matter of taking things out of education than putting things in. �at’s a more di�cult task.
We have to take calculated but bold steps, to evolve our system in future to provide more space for young people to explore as
they grow up, and to develop the originality of mind that comes from exploring things on their own. And we must ensure too that they have enough time to interact with their fellow students, on the playing �eld, in dance, in adventure – every form of interaction.
�e interactions when people are young matter not just for an inclusive society. �ey also matter for an innovative society. �e world of innovation is not just about the brightest sparks, but about teams. In many international rankings of innova-tion, Switzerland tops the US. It doesn’t have Silicon Valley, but it’s a society where everyone is continuously improving, every worker is treated with respect, and the whole team becomes that much more innovative and competitive.
�at’s why SkillsFuture is a major social and economic investment in our future. We will invest in every Singaporean, so that we all keep improving through life, keep learning something about ourselves we didn’t know, a strength, an interest. Keep expanding our potential together. We are going to provide the resources, all around the island, to make this happen.
We must stay with strategies that are working well, learn from mistakes, keep improving and keep making a better Singapore.
An innovative society starts from young, of course. But we must resist the thought that we have to add something more in education to develop the innovative spirit.
It’s also not just about the first 18 or 22 years of life, but learning through life.
This diversity in higher education makes for both an innovative and inclusive Singapore.
10
Making ours an inclusive society is a major goal.
�e changes amount to a signi�cant shift when you add them up.
Ensuring Birth is Not DestinyFor our young, we start o� with the advantage of a public school system where high average performance is not just due to a segment of top performers. Our Normal Tech students perform far better than their counterparts internationally.
But we have to do more to keep social mobility going. �e challenge as we've seen in all the advanced societies is in sustaining mobility, beyond the �rst waves that were achieved through meritocracy. Meritocracy is fair, but it will not on its own ensure we keep up social mobility. We therefore have to do more to help those who start with less. So that birth is never destiny.
Since 2006, we’ve been enhancing support for those with a weaker start. More specialists, smaller classes, more activities outside class to build con�dence and perseverance.
We are also intervening earlier. We’ve made preschools more a�ordable, and are introducing many more, near the home. We are also improving the quality of the preschool experience, which is especially helpful for those who come from lower-income homes.
And as we go forward, we have to pay more attention to the initial years of life, before pre-school. �e studies on children’s development show that these �rst few years are critical. But no country has found a good way to intervene in these initial years without intruding into parenting decisions.
We are doing more in higher education too. We’ve expanded subsidised places and introduced a diversity of pathways. �ey cater to di�erent interests, and open up strong, skills-based routes to advancement, including applied university programmes.
Step by step, for young Singaporeans, for working adults, for our Pioneers and the seniors of the future, we’ve been introducing changes over the last decade.
We now spend 50% more on children who have a weak start in learning than the average student.
We must try different ways in those early years − to help both parent and child − through both government and local community initiatives.
11
Tempering Inequalities During the Working YearsWhat about workforce inequalities? Fortunately, income growth for the lowest two quintiles (bottom 40% on the income ladder) has been the most rapid in the last �ve years.
But we have also put Workfare to work. We piloted it in 2006, made it a permanent scheme in 2007, and have enhanced it twice since.
Our cleaners had been stuck with very low pay levels for some years. Besides helping them with Workfare, we are helping them see higher pay through the Progressive Wage Model (PWM). Already, the median pay of a resident cleaner has risen from $820 to $1,000. Security guards will be on their own PWM in the near future.
We must also make sure Singaporean PMEs get a fair deal. �e tripartite Fair Consideration Framework is being enhanced to ensure that Singaporeans have a full and fair chance in the job market. �ey have to be at the core in every sector, and have opportunities for development so that they are part of the best global teams.
Why Our Neighbourhoods MatterHome-ownership for all is a key priority. We have moderated the property market
cycle. But we have also delinked our HDB BTO prices from the market cycle, to ensure homes remain a�ordable.
We can’t go back to the old days. In the early 1980s, which is when the parents of today’s young couples bought their �rst �at, a 4-room �at was $55,000.
Incomes have in fact kept pace with the costs of new �ats since 1980 – taking the average prices in the latest BTO launches in May 2015, inclusive of grants.
Since 2012, more than 1,800 low-income households, with incomes of $1,000 or less, have taken advantage of our $60,000 grants to own a 2-room BTO �at. We have sized the grants to ensure that they can pay down the loan from their CPF savings.
It is better than using their cash incomes to pay for rentals, and at the same time gives them an asset that can appreciate. Homeownership goes hand in hand with Workfare, a more progressive CPF and our other schemes to uplift their lifetime incomes, which we must keep working at. However, it doesn’t just help low-income
Low-income Singaporean workers now get up to 30% more in their wages through Government top-ups.
But, remember, the median household income was just $990 in 1980 (compared to $7,320 last year).
Our housing grants make a difference. What we will ensure is that young couples, both lower and middle-income, can purchase their homes.

12
families �nancially. It gives them real pride to own their own home.
�e playgrounds and parks, the rivers and lakes, the hawker centres, the sports facilities and senior activity centres, the whole neighbourhood. Even in the �rst Budget speech in 1965, when it was all about economic survival, Mr Lim Kim San found space in the Budget for 10 more playgrounds. �at thinking started early.
Shared neighbourhoods are not in the Gini coe�cient, but they are part of social equity. And very importantly, we’ve avoided the segregated cities seen in so many parts of the world. It’s not just about Baltimore and Paris where we’ve seen riots. It’s about the quiet discrimination that exists when you live in segregated neighbourhoods almost anywhere, and the di�erent aspirations that are bred over time.
We have disadvantaged families, but we must never have disadvantaged neighbourhoods, where social problems get more knotty, and solutions more di�cult.
Assuring Our SeniorsWe are doing much more to provide assurance to older Singaporeans.
We have enhanced the CPF system, and made it more progressive. It’s not just the Extra Interest scheme which guarantees 3.5% interest rate on the Ordinary Account (OA) for most individuals, or 5% on the Special Account. It is also the regular infusions of Workfare, the NS HOME Award and the housing grant that is put in the OA. If you take it all together, a young low income worker today would e�ectively get a 6.5% per annum return on his CPF OA over the full course of his working life. By the time he is 65, he would have received about 40% of his total CPF savings from the Government.
Besides the special package of bene�ts to honour the Pioneers, we have increased healthcare subsidies and introduced Medishield Life to help lower and middle-income Singaporeans. Higher subsidies across the system – from GPs to the hospitals and specialist clinics to the step-down care institutions.
And we’ve introduced Silver Support, an important new pillar in our social security system.
But social equity is not just about individual home ownership. It’s about shared ownership of our HDB neighbourhoods, which are probably the most unique feature of Singapore’s landscape.
We are in essence tempering inequalities throughout our lives – during the working years through Workfare, and in future in our senior years through Silver Support.

13
When you add it all up, the changes that we’ve put into place in the last 10 years amount to a signi�cant increase in support for the low income group. In 2005, it was already quite signi�cant – government transfers to the low-income group, after subtracting all the taxes they pay, e�ectively doubled their income in 2005. By 2010, it had increased by another third. And government support has moved up further in the last �ve years. [Chart 8]
I recognise of course that there is some political cunning in saying that this all came about because of GE 2011. I’m sorry, it didn’t.
We made clear our intentions and motivations, well before 2011, made clear that it was a multi-year strategy, and step by step, starting with the kids, through working life, and into the senior years, we have been moving towards a more inclusive society.
But this is a far more important agenda than a reaction to 2011.
KEEPING A CULTURE OF RESPONSIBILITYWe’ve got to do more to give everyone a fair deal in life, but do it in a way that gives everyone the pride of contributing in their own way.
No government can have a hands-o� strategy, where people are left to fend for themselves. Neither should we have hand-outs all along the way, because that just takes the dignity out of people.
Empower people, and enable them to earn their own success.
We’ve also got to make sure too that this doesn’t end up the way it has in many other advanced societies, where it becomes a contract between me and the government – ‘I pay these taxes, I want this much back in bene�ts’. Civil society and civic participation is far weaker today in almost every advanced country compared to a few decades ago. Membership in civic organisations has declined.
Lower-income households:
Chart 8
2005
2010
2015
103
136
Source: MOF
Government transfers (after paying taxes) as a percentage of household income
163
%
The world did not start in 2011.
We intend to continue on this journey, learning from experience and improving where we can.
Let’s instead keep providing hand-ups, especially for those who start with less, helping them develop their strengths and have a real chance of doing well.
14
We’ve got to keep a culture of responsibility across our society: individuals and families, government playing its part, but also a civic culture where we all feel involved and take the initiative, as individuals, voluntary bodies and as businesses.
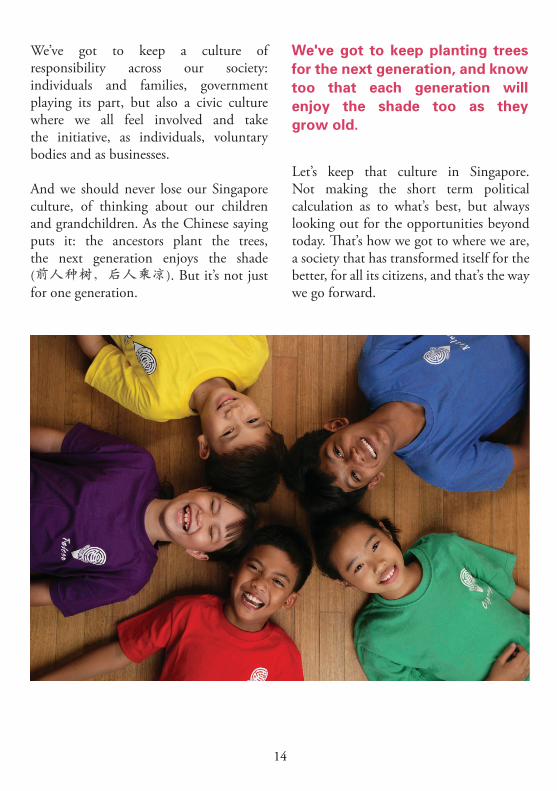
And we should never lose our Singapore culture, of thinking about our children and grandchildren. As the Chinese saying puts it: the ancestors plant the trees, the next generation enjoys the shade (前人种树,后人乘凉). But it’s not just for one generation.
Let’s keep that culture in Singapore. Not making the short term political calculation as to what’s best, but always looking out for the opportunities beyond today. �at’s how we got to where we are, a society that has transformed itself for the better, for all its citizens, and that’s the way we go forward.
We've got to keep planting trees for the next generation, and know too that each generation will enjoy the shade too as they grow old.
Produced by:
Photo credits:Ministry of Education (MOE)
National Population and Talent Division (NPTD)SPRING Singapore
Ministry of Communicationsand Information