an oscillatory contractile pole-force component dominates the traction forces exerted by
TRANSCRIPT

An Oscillatory Contractile Pole-Force Component Dominates
the Traction Forces Exerted by Migrating Amoeboid Cells
BALDOMERO ALONSO-LATORRE,1 JUAN C. DEL ALAMO,1 RUEDI MEILI,2 RICHARD A. FIRTEL,2
and JUAN C. LASHERAS1
1Department of Mechanical and Aerospace Engineering, University of California, San Diego, 9500 Gilman Dr., La Jolla,CA 92093, USA; and 2Section of Cell and Developmental Biology, Division of Biological Sciences, University of California,
San Diego, 9500 Gilman Dr., La Jolla, CA 92093, USA
(Received 29 March 2011; accepted 11 June 2011; published online 29 June 2011)
Associate Editor Edward Guo oversaw the review of this article.
Abstract—We used principal component analysis to dissectthe mechanics of chemotaxis of amoeboid cells into a reducedset of dominant components of cellular traction forces andshape changes. The dominant traction force component inwild-type cells accounted for ~40% of the mechanical workperformed by these cells, and consisted of the cell attachingat front and back contracting the substrate towards itscentroid (pole-force). The time evolution of this pole-forcecomponent was responsible for the periodic variations of celllength and strain energy that the cells underwent duringmigration. We identified four additional canonical compo-nents, reproducible from cell to cell, overall accounting foran additional ~20% of mechanical work, and associated withevents such as lateral protrusion of pseudopodia. Weanalyzed mutant strains with contractility defects to quantifythe role that non-muscle Myosin II (MyoII) plays inamoeboid motility. In MyoII essential light chain null cellsthe polar-force component remained dominant. On the otherhand, MyoII heavy chain null cells exhibited a differentdominant traction force component, with a marked increasein lateral contractile forces, suggesting that cortical contrac-tility and/or enhanced lateral adhesions are important formotility in this cell line. By compressing the mechanics ofchemotaxing cells into a reduced set of temporally-resolveddegrees of freedom, the present study may contribute torefined models of cell migration that incorporate cell-substrate interactions.
Keywords—Cell migration, Traction forces, Dictyostelium,
Principal component analysis, Chemotaxis, Myosin.
INTRODUCTION
Amoeboid cell migration is central to many physi-ological processes, including wound healing, immuneresponse, or embryonic development.20,22,29,30 Itsderegulation is a very important factor for seriouspathological processes, as varied as tumor invasion,vascular diseases, or mental retardation.9,24,37 Cellmigration requires the coordinated regulation of manymolecules, but occurs through a small repertoire ofshape changes consisting mainly of a sequence ofanterior protrusions and posterior retractions.2 Thereis ample evidence indicating that these morphologicalshape changes are mechanically coupled to the bio-chemical modulation of the adhesions via the tractionstresses exerted by the cell on the extracellular matrix(ECM).6,13,26,34,39 However, there is a need to betterunderstand the coupling of the global cell shapechanges, the distribution of traction stresses and theassociated biochemical processes.
Cell locomotion has been extensively studied usingcell shape as readout. Wessels and Soll36,40 developed aframework for the 2D and 3D analysis of shape changesduring cell locomotion, which enabled them to track themotion of amoeboid cells20 through the observation ofthe time evolution of descriptors such as the cell lengthor the velocity of the cell centroid. Machacek andDanuser25 identified different protrusion phenotypesusing level set methods. Killich et al.19 andKeren et al.18
used Principal Component Analysis (PCA) (also knownas Karhunen-Loeve decomposition or Proper Orthog-onal Decomposition) to quantify cell shape changes inmigrating Dictyostelium cells and epithelial fish kera-tocytes. These studies employed a version of PCA thatoptimized the variance of the measured contour of thecell, to obtain a reduced set of dominant components ofcell shape changes during migration. However, there is
Address correspondence to Juan C. Lasheras, Department of
Mechanical and Aerospace Engineering, University of California,
San Diego, 9500 Gilman Dr., La Jolla, CA 92093, USA. Electronic
mail: [email protected]
Cellular and Molecular Bioengineering, Vol. 4, No. 4, December 2011 (� 2011) pp. 603–615
DOI: 10.1007/s12195-011-0184-9
1865-5025/11/1200-0603/0 � 2011 Biomedical Engineering Society
603

still the need to understand the dominant traction forcepatterns, and the associated biochemical processes, thatthe cell employs to produce mechanical work (energy)during migration.
Measuring the mechanical energy spent by the cellduring migration requires having experimental access tothe traction forces imposed by the cells on their ECM.4
Harris et al.14 identified qualitatively the nature of thestresses exerted by cells on the ECM through theobservation of the wrinkling patterns cells induced overa thin layer of silicone rubber substratum.Dembo et al.11
and Peterson28 first described the use of elastic deform-able substrates to measure the traction stresses exertedby cells attached to the substrate surface. This techniquehas since been applied to study the traction stressesexerted by different types of cells, including locomotingkeratocytes,11 fibroblasts28 and Dictyostelium.10,23,26
The objective of this work is to refine the spatio-temporal description of motility by obtaining a statis-tically significant characterization of the relationshipbetween traction forces and cell shape in migratingamoeboid cells, using PCA as primary tool. For thispurpose, we carried out simultaneous measurements ofthe time evolution of cell shape and traction forcesexerted by isolated Dictyostelium cells undergoingchemotactic migration over a flat elastic substrate. Inorder to provide a physically relevant description, weapplied a modified version of PCA to the measure-ments of the traction forces that optimized the strainenergy accounted by each component. This analysisallowed us to determine the principal traction forcepatterns and shape changes implemented by migratingcells according to their importance for strain energyproduction. These patterns have a clear physicalinterpretation because the strain energy represents theamount of mechanical work performed by the cellagainst its surroundings while it is moving.
PCA effectively ‘‘compressed’’ the mechanics ofmigrating Dictyostelium cells by identifying a minimalset of traction force components that accounted thework performed by the cells. We found that the mostimportant of these components accounted for ~40% ofthe traction work, and consists of a simultaneouscontraction of the substrate from front and backtowards the center of the cell. Its temporal evolutionwas oscillatory and correlated well with that of thestrain energy and the cell length. In addition, we foundthat a set of five canonical principal components,exhibiting a high degree of repeatability from cell tocell, accounted for virtually all of the traction workexerted by WT cells. We also identified the most rele-vant principal components in two mutant strains withcontractility defects: MyoII Essential Light Chain Null(mlcE�) and MyoII Heavy Chain Null (mhcA�) cellsand compared it to the dominant components in WT.
The identification of a single most relevant compo-nent that accounts for a large portion of the strainenergy opens new venues to develop semiempiricalmodeling approaches3,27,32,33 to describe the motion ofthe cell.
MATERIALS AND METHODS
Dictyostelium Culture and Microscopy
Axenically grown Dictyostelium wild-type (WT)and mutant cells were prepared for chemotaxis andseeded onto a flat elastic gelatin gel as described pre-viously.10,26 Time-lapse sequences of chemotaxing cellswere acquired on an inverted microscope controlled byMetamorph software (Molecular Devices, Downing-town, PA).
Cell Shape Segmentation
Cell outlines where determined from differentialinterference contrast microscopy images using stan-dard segmentation techniques.10
Traction Cytometry Experiments
The traction stresses exerted by cells were deter-mined from measurements of the substrate deforma-tion after solving the equation of static equilibrium fora linearly-elastic substrate in Fourier space, asdescribed by del Alamo et al.10 (see Fig. 1a). Thesubstrate deformation was obtained from the lateraldisplacements u ¼ ðu; vÞ of 0.1-lm fluorescent latexbeads embedded in the gel. These displacements weremeasured by cross-correlating each instantaneousimage with a reference image of the relaxed substrate.41
The Young’s modulus of the gel was determined fromthe indentation of a tungsten carbide sphere.17 In thecalculations, the tensile stresses at the free surface ofthe substrate were assumed to be negligible(szzðz ¼ hÞ � 0), so that the stresses at the z ¼ h couldbe characterized by the 2D vector s ¼ ðszx; szyÞjz¼h:
Cholesky Decomposition of the Strain Energy US
Exerted on a Flat Substrate
The strain energy exerted by the cell on the surfaceof the substrate at a given instant of time was4
USðtÞ ¼1
2
Z
A
sðx; tÞ � uðx; tÞdx ¼ s; uf g; ð1Þ
where ð�Þ represents scalar product,RA dx represents a
surface integral in a box enclosing the cell, and fgrepresents an inner product. Note that US is equivalent
ALONSO-LATORRE et al.604

to the mechanical work the cell is exerts on the sub-strate.
We applied PCA to obtain a reduced set of tractionforce patterns which the cell used to exert mechanicalwork on the substrate. PCA works by optimizing themodal decomposition of a set of observations accord-ing to the norm associated to a predefined innerproduct. We then rewrote the strain energy as thenorm US ¼ fh; hg; where hðxÞ is the strain energysquare root or US-square root. This decomposition iscalled the Cholesky decomposition and is easier toperform in the Fourier domain,
US ¼L2B
2
X1a¼�1
X1b¼�1
bu�ab � Aab � buab; ð2Þ
where buab are the Fourier coefficients of the lateraldisplacement vector, Aa;b is the Fourier norm matrixand ðÞ� denotes Hermitian transposition. In Fourierspace, the problem of finding the functional Choleskydecomposition of the norm operator is reduced tofinding the algebraic Cholesky decomposition of thenorm matrix, Aab ¼ Q�abQab; where Qab is a lower-triangular matrix. Introducing this decomposition inEq. (2), one obtains that bhab ¼ Q�abbuab; and inversionof the Fourier transform yields
hðxÞ ¼ F�1 bhab
� �¼ F�1 Q�abbuab
� �: ð3Þ
Cell-based Coordinate System
Prior to applying PCA, we mapped the US-squareroot hðxÞ in a non-dimensional cell-based coordinatesystem that took into account the changes in cell shape
and orientation (see Fig. 1b and del Alamo andco-workers10,26). The origin of this coordinate systemwas the cell centroid, ðxcðtÞ; ycðtÞÞ; the coordinates wererescaled with the half-length of the cell, LðtÞ=2; and theaxes were parallel to the principal axes of the cell. Thecoordinates in this cell-based reference system were
x?¼½ðx�xcðtÞÞcos/ðtÞþðy�ycðtÞÞsin/ðtÞ�=½LðtÞ=2�;y?¼½ðy�ycðtÞÞcos/ðtÞ�ðx�xcðtÞÞsin/ðtÞ�=½LðtÞ=2�;
ð4Þ
where ðx; yÞ were the coordinates in the laboratoryreference frame, and /ðtÞ was the instantaneous anglebetween the longitudinal axis of the cell and the x-axisof the laboratory reference frame (see Fig. 1b). Inorder to ensure that the magnitude of both the tractionforces and the strain energy were conserved upontransformation of reference frame, the traction stressesand the US-square root were redefined respectively ass?ðx?Þ ¼ L2sðx?Þ=4 and h?ðx?Þ ¼ Lhðx?Þ=2: For sim-plicity, hereafter we will refer to x? as x and to h?ðx?Þas hðxÞ: The size of the computational box wheretraction forces were calculated was 6 non-dimensionalunits, and was discretized using 129� 129 nodes.
Scalar Field Mapping of Cell Shape Allows to Relateit to Traction Forces
The instantaneous cell shape is mapped using thenon-dimensional cell-based coordinate system definedin Eq. (4) as a 2D function dðxÞ such that dðxÞ ¼ 1 if xlaid within the contour of the cell, and dðxÞ ¼ 0otherwise (Fig. 2a). This function was discontinuous atthe contour of the cell, which could lead to undesiredspurious oscillations in its modal decomposition (the
(a) (b)
FIGURE 1. (a) Sketch representing a traction cytometry experiment. (b) Normalized cell-based reference system that adapts to theshape and orientation dynamics of the cell. The black contour is the cell outline. L(t) is the cell length. (x, y) are the axes of thelaboratory reference frame. (x?, y?) are the axes of the cell-based reference system, centered at the cell centroid (xc (t), yc (t)) andaligned with the principal axes of the cell, which are rotated an angle /(t) with respect to (x, y). The colormap indicates the strengthof the traction stresses exerted by the cell on the substrate (Pa), and the arrows indicate their direction. The thick black arrowindicates the direction of motion of the cell, moving with velocity V(t). Scale bar: 10 lm.
Pole Forces Thrust Motile Amoeboid Cells 605

Gibbs phenomenom, see Canuto et al.5), and deterio-rates the convergence of PCA. This was avoided byusing a continuous scalar field sðxÞ to represent cellshape
sðxÞ ¼ dðxÞcðxÞ=maxx½cðxÞ�; ð5Þ
where cðxÞ was the distance from each point inside thecell x to the cell contour (see Fig. 2b).
Because our aim was to determine how the cellshape associates with strain energy and traction forcesat each instant of time, we applied PCA on the com-posite three dimensional function
wðx; tÞ ¼ h; esð Þðx; tÞ; ð6Þ
which grouped both the US square root and the shapeof the cell. The value of parameter e was set very low(e ¼ 10�9 � 10�12) to ensure that the results from PCAonly depended on the strain energy and were indepen-dent on shape variance. We verified that the use of thesmall parameter �; as well as its selected magnitude, didnot affect the calculation of the components of hðxÞ:
Principal Component Analysis (PCA) on the StrainEnergy Square Root and Associated Cell Shape
Given a set of N experimental recordings of cellshape and traction forces (i.e. at times t ¼ tk for
k ¼ 1 . . .N), we applied PCA1,15 to the compositefunction wðx; tÞ (Eq. (6)), which allowed us to expressit as the weighted sum of principal components
wðx; tÞ ¼XNk¼1
akðtÞwkðxÞ; ð7Þ
where the basis functions wkðxÞ ¼ /ðxÞ; evðxÞð Þk; con-tain the spatial structure of cell shape and tracionforces of each principal component and are denotedprincipal functions, and ak is the weight coefficient ofeach component. To facilitate the interpretation of theprincipal functions, we transformed them into theirtraction force equivalents,
nðxÞ ¼ ½2=hLi�F�1ðAabQT��1ab
b/abÞðxÞ; ð8Þ
where hi denotes temporal average and hLi is theaverage cell length.
The principal functions are mutually orthonormalwith respect to the inner product (i.e. fwi;wjg ¼ 1 ifi = j and zero otherwise), so that the total strainenergy is given by
USðtÞ ¼XNk¼1jakðtÞj2 ¼
XNk¼1
UkSðtÞ: ð9Þ
This property allows us to evaluate the instantaneouscontribution of each term of the sum to the strain
(a) (b) (c) (d)
(e) (f)
FIGURE 2. Representations used to study the dynamics of traction stresses and cell shape. For a WT cell at a certain instant oftime: (a) 2D representation of the cell shape (d(x)). (b) 2D continuous representation of the cell shape (s(x)). The white line is thecell contour. At the free surface of the substrate: (c) Measured horizontal displacement field (u(x)), (d) Traction force field exertedby the cell (s(x)), (e) Strain energy square root (h(x)). In panels (c–e): the colormap and arrows indicate respectively the magnitudeand direction of the variable represented, and the black contour is the cell outline. (f) We applied PCA over a set of observationscombining h(x) and s(x) (s(x) multiplied by a very small factor �; so that its weight in the optimization process is negligible), and asa result we obtained a set of strain energy components (/(x)) and the cell shape associated to each component (v(x)). The scalebars in panels (a) and (f) indicate a half-length of the cell.
ALONSO-LATORRE et al.606
energy, UkSðtÞ ¼ jakðtÞj
2: The time-averaged contribu-tion of each component is usually referred to as theprincipal value associated to the component, kk: Theprincipal components are arranged in decreasing orderof kk; (i.e. kkþ1<kk). The relative contribution of eachprincipal component to the strain energy is obtainedfrom the ratio mk ¼ kk=hUSi: The defining propertyof PCA is that, when applied to the US square-root(Eq. (3)), it distributes the maximum amount of strainenergy in the fewest possible number of principalcomponents.15
As a closing remark, we note that in many appli-cations it is customary to subtract the average of theobservations prior to performing PCA. This procedureis well suited for systems whose dynamics can be wellrepresented as a fluctuating process superimposed on asteady state. However, this is not the case of chemo-taxing amoeboid cells as previous studies have showncell shape and traction forces show a marked periodicbehavior in this type of cell migration.10,26 Thus, weapplied PCA without subtracting the average of theobservations, a procedure already reported in the lit-erature,12 and which in our case led to the maximiza-tion of the strain energy accounted for by each mode.We hypothesize that the dominant mode obtained bythis procedure will capture the temporal periodicity ofcell shape and traction forces. This hypothesis is testedin ‘‘One Principal Component Captures the TemporalPeriodicity of Cell Length and Strain Energy DuringAmoeboid Cell Migration’’ section.
Individual and Ensemble PCA
We applied PCA to the time history of hðx; tÞ for 1)each single cell (individual PCA), and 2) for a pooledset of observations coming from all the cells recordedin our experiments (ensemble PCA). The high com-putational cost of performing ensemble PCA to all thecells (10468 observations from N = 24 cells) led us toconsider 10 different sets, each of them containing 600observations evenly distributed among each cell.Comparing the principal components obtained fromindividual and ensemble PCA allowed us to determinethe cell-to-cell reproducibility of the principal compo-nents of shape and strain energy.
RESULTS
Traction Force Components in Wild-type Cellsand Reproducibility
We applied PCA (see ‘‘Materials and Methods’’) todetermine the strain energy components exerted byWT Dictyostelium cells migrating chemotactically. The
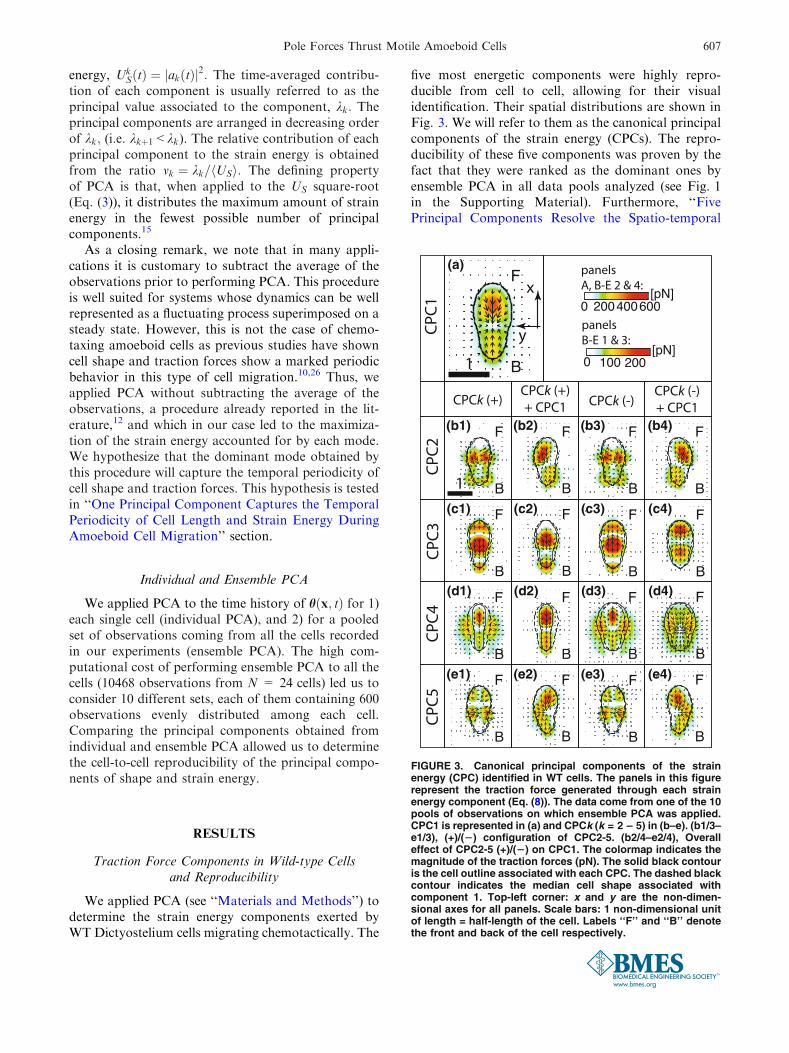
five most energetic components were highly repro-ducible from cell to cell, allowing for their visualidentification. Their spatial distributions are shown inFig. 3. We will refer to them as the canonical principalcomponents of the strain energy (CPCs). The repro-ducibility of these five components was proven by thefact that they were ranked as the dominant ones byensemble PCA in all data pools analyzed (see Fig. 1in the Supporting Material). Furthermore, ‘‘FivePrincipal Components Resolve the Spatio-temporal
(a)
(b1) (b2) (b3) (b4)
(c1) (c2) (c3) (c4)
(d1) (d2) (d3) (d4)
(e1) (e2) (e3) (e4)
FIGURE 3. Canonical principal components of the strainenergy (CPC) identified in WT cells. The panels in this figurerepresent the traction force generated through each strainenergy component (Eq. (8)). The data come from one of the 10pools of observations on which ensemble PCA was applied.CPC1 is represented in (a) and CPCk (k = 2 – 5) in (b–e). (b1/3–e1/3), (+)/(2) configuration of CPC2-5. (b2/4–e2/4), Overalleffect of CPC2-5 (+)/(2) on CPC1. The colormap indicates themagnitude of the traction forces (pN). The solid black contouris the cell outline associated with each CPC. The dashed blackcontour indicates the median cell shape associated withcomponent 1. Top-left corner: x and y are the non-dimen-sional axes for all panels. Scale bars: 1 non-dimensional unitof length = half-length of the cell. Labels ‘‘F’’ and ‘‘B’’ denotethe front and back of the cell respectively.
Pole Forces Thrust Motile Amoeboid Cells 607
Evolution of Traction Forces During PseudopodProtrusion and Retraction’’ section shows that fiveprincipal components provided just enough time res-olution to capture the evolution of the traction forcesexerted by the cells during migration.
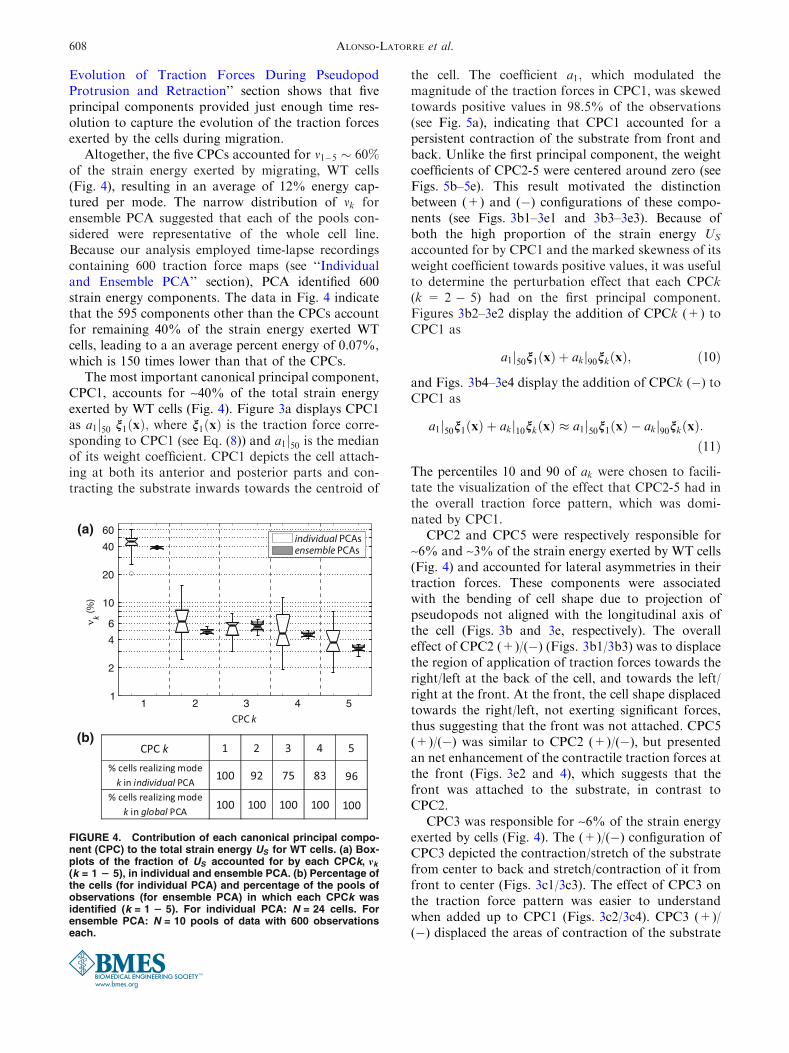
Altogether, the five CPCs accounted for m1�5 � 60%of the strain energy exerted by migrating, WT cells(Fig. 4), resulting in an average of 12% energy cap-tured per mode. The narrow distribution of mk forensemble PCA suggested that each of the pools con-sidered were representative of the whole cell line.Because our analysis employed time-lapse recordingscontaining 600 traction force maps (see ‘‘Individualand Ensemble PCA’’ section), PCA identified 600strain energy components. The data in Fig. 4 indicatethat the 595 components other than the CPCs accountfor remaining 40% of the strain energy exerted WTcells, leading to a an average percent energy of 0.07%,which is 150 times lower than that of the CPCs.
The most important canonical principal component,CPC1, accounts for ~40% of the total strain energyexerted by WT cells (Fig. 4). Figure 3a displays CPC1as a1j50 n1ðxÞ; where n1ðxÞ is the traction force corre-sponding to CPC1 (see Eq. (8)) and a1j50 is the medianof its weight coefficient. CPC1 depicts the cell attach-ing at both its anterior and posterior parts and con-tracting the substrate inwards towards the centroid of
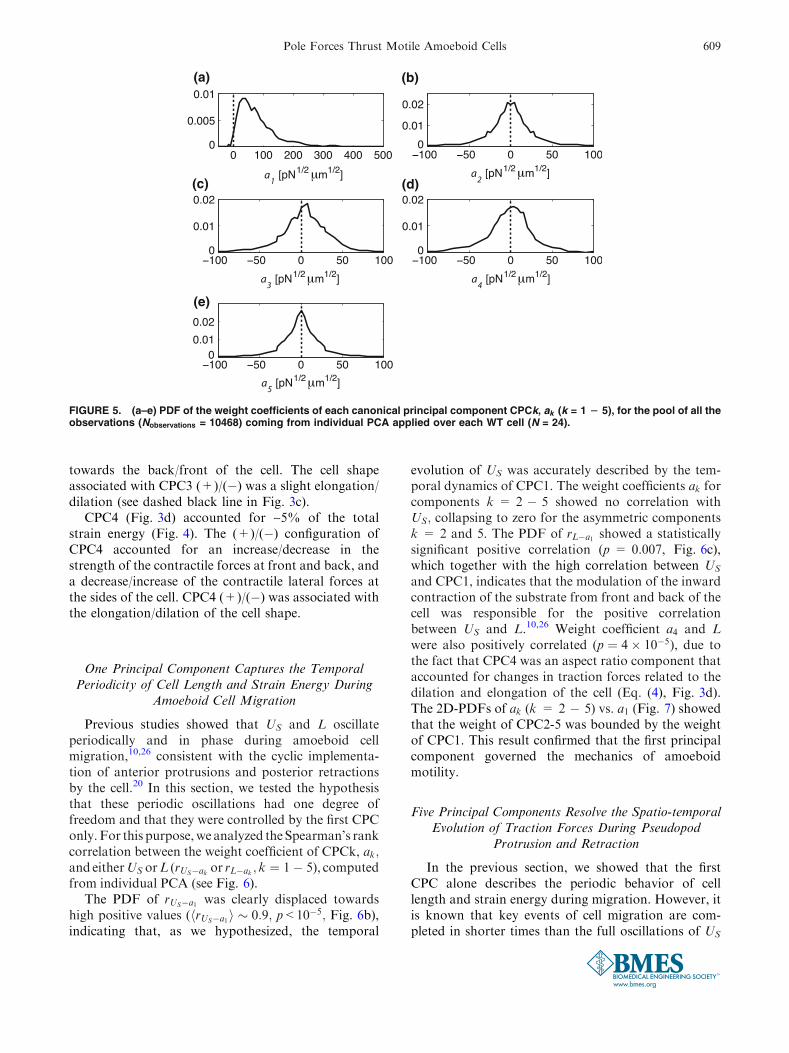
the cell. The coefficient a1; which modulated themagnitude of the traction forces in CPC1, was skewedtowards positive values in 98.5% of the observations(see Fig. 5a), indicating that CPC1 accounted for apersistent contraction of the substrate from front andback. Unlike the first principal component, the weightcoefficients of CPC2-5 were centered around zero (seeFigs. 5b–5e). This result motivated the distinctionbetween (+) and (�) configurations of these compo-nents (see Figs. 3b1–3e1 and 3b3–3e3). Because ofboth the high proportion of the strain energy US
accounted for by CPC1 and the marked skewness of itsweight coefficient towards positive values, it was usefulto determine the perturbation effect that each CPCk(k = 2 � 5) had on the first principal component.Figures 3b2–3e2 display the addition of CPCk (+) toCPC1 as
a1j50n1ðxÞ þ akj90nkðxÞ; ð10Þ
and Figs. 3b4–3e4 display the addition of CPCk (�) toCPC1 as
a1j50n1ðxÞ þ akj10nkðxÞ � a1j50n1ðxÞ � akj90nkðxÞ:ð11Þ
The percentiles 10 and 90 of ak were chosen to facili-tate the visualization of the effect that CPC2-5 had inthe overall traction force pattern, which was domi-nated by CPC1.
CPC2 and CPC5 were respectively responsible for~6% and ~3% of the strain energy exerted by WT cells(Fig. 4) and accounted for lateral asymmetries in theirtraction forces. These components were associatedwith the bending of cell shape due to projection ofpseudopods not aligned with the longitudinal axis ofthe cell (Figs. 3b and 3e, respectively). The overalleffect of CPC2 (+)/(�) (Figs. 3b1/3b3) was to displacethe region of application of traction forces towards theright/left at the back of the cell, and towards the left/right at the front. At the front, the cell shape displacedtowards the right/left, not exerting significant forces,thus suggesting that the front was not attached. CPC5(+)/(�) was similar to CPC2 (+)/(�), but presentedan net enhancement of the contractile traction forces atthe front (Figs. 3e2 and 4), which suggests that thefront was attached to the substrate, in contrast toCPC2.
CPC3 was responsible for ~6% of the strain energyexerted by cells (Fig. 4). The (+)/(�) configuration ofCPC3 depicted the contraction/stretch of the substratefrom center to back and stretch/contraction of it fromfront to center (Figs. 3c1/3c3). The effect of CPC3 onthe traction force pattern was easier to understandwhen added up to CPC1 (Figs. 3c2/3c4). CPC3 (+)/(�) displaced the areas of contraction of the substrate
(a)
(b)
FIGURE 4. Contribution of each canonical principal compo-nent (CPC) to the total strain energy US for WT cells. (a) Box-plots of the fraction of US accounted for by each CPCk, mk
(k = 1 2 5), in individual and ensemble PCA. (b) Percentage ofthe cells (for individual PCA) and percentage of the pools ofobservations (for ensemble PCA) in which each CPCk wasidentified (k = 1 2 5). For individual PCA: N = 24 cells. Forensemble PCA: N = 10 pools of data with 600 observationseach.
ALONSO-LATORRE et al.608
towards the back/front of the cell. The cell shapeassociated with CPC3 (+)/(�) was a slight elongation/dilation (see dashed black line in Fig. 3c).
CPC4 (Fig. 3d) accounted for ~5% of the totalstrain energy (Fig. 4). The (+)/(�) configuration ofCPC4 accounted for an increase/decrease in thestrength of the contractile forces at front and back, anda decrease/increase of the contractile lateral forces atthe sides of the cell. CPC4 (+)/(�) was associated withthe elongation/dilation of the cell shape.
One Principal Component Captures the TemporalPeriodicity of Cell Length and Strain Energy During
Amoeboid Cell Migration
Previous studies showed that US and L oscillateperiodically and in phase during amoeboid cellmigration,10,26 consistent with the cyclic implementa-tion of anterior protrusions and posterior retractionsby the cell.20 In this section, we tested the hypothesisthat these periodic oscillations had one degree offreedom and that they were controlled by the first CPConly. For this purpose,we analyzed theSpearman’s rankcorrelation between the weight coefficient of CPCk, ak;and eitherUS orL (rUS�ak or rL�ak ; k ¼ 1� 5), computedfrom individual PCA (see Fig. 6).
The PDF of rUS�a1 was clearly displaced towardshigh positive values (hrUS�a1i � 0:9; p<10�5; Fig. 6b),indicating that, as we hypothesized, the temporal
evolution of US was accurately described by the tem-poral dynamics of CPC1. The weight coefficients ak forcomponents k = 2 � 5 showed no correlation withUS; collapsing to zero for the asymmetric componentsk = 2 and 5. The PDF of rL�a1 showed a statisticallysignificant positive correlation (p = 0.007, Fig. 6c),which together with the high correlation between US
and CPC1, indicates that the modulation of the inwardcontraction of the substrate from front and back of thecell was responsible for the positive correlationbetween US and L.10,26 Weight coefficient a4 and Lwere also positively correlated (p ¼ 4� 10�5), due tothe fact that CPC4 was an aspect ratio component thataccounted for changes in traction forces related to thedilation and elongation of the cell (Eq. (4), Fig. 3d).The 2D-PDFs of ak (k = 2 � 5) vs. a1 (Fig. 7) showedthat the weight of CPC2-5 was bounded by the weightof CPC1. This result confirmed that the first principalcomponent governed the mechanics of amoeboidmotility.
Five Principal Components Resolve the Spatio-temporalEvolution of Traction Forces During Pseudopod
Protrusion and Retraction
In the previous section, we showed that the firstCPC alone describes the periodic behavior of celllength and strain energy during migration. However, itis known that key events of cell migration are com-pleted in shorter times than the full oscillations of US
(a) (b)
(c)
(e)
(d)
FIGURE 5. (a–e) PDF of the weight coefficients of each canonical principal component CPCk, ak (k = 1 2 5), for the pool of all theobservations (Nobservations = 10468) coming from individual PCA applied over each WT cell (N = 24).
Pole Forces Thrust Motile Amoeboid Cells 609

and L. Meili et al.26 reported that both pseudopodprotrusion and retraction take on average ~22 s inchemotaxing WT cells, whereas the period of theoscillations in cell length was found to be ~94 s. Thisraised two questions: 1) does the first CPC provideenough temporal resolution to represent the mechani-cal stresses that cells exert on their substrate duringmigration? and 2) if not, how many CPCs are neededto obtain the required time resolution?
We estimated the temporal resolution of eachprincipal component of the strain energy from thetemporal memory of the weight coefficients obtainedby individual PCA. That is, weight coefficients withlong memory have a poor temporal resolution andviceversa. The temporal memory was quantified usingthe autocorrelation of the weight coefficients of eachcomponent, RakðsÞ ¼ hakðtÞakðtþ sÞi: We obtained aparabolic fit to the first 10 s of positive lag of Rak ; and
calculated the time tR0 at which that parabola crossedthe horizontal axis Rak ¼ 0; providing with an esti-mated memory time for component k (Fig. 8a).
Figure 8b shows that the memory time decreasedwith the order of the principal component. In partic-ular, the first CPC had a memory time tR0ðk ¼ 1Þ ¼ 45s. The corresponding time resolution is too coarse toreproduce the dynamics of events such as protrusion orretraction, which have a duration of 22 s as reportedby Meili et al. In order to determine how many prin-cipal components are required to resolve these events,we calculated the index k22 above which tR0ðkÞbecomes <22 s. Analysis of k22 revealed that fiveprincipal components are required to achieve a mem-ory time of 22 s (Fig. 8c). Thus, we concluded that fiveprincipal components are needed to resolve the spatio-temporal evolution of traction forces during pseudo-pod protrusion and retraction.
Temporal Coordination Between Traction Forcesand Lateral Protrusions
The two asymmetric canonical principal compo-nents, CPC2 and CPC5, were found to be associatedwith lateral protrusion of pseudopods. CPC5 accountsfor the cell attaching the lateral protrusion to thesubstrate (Fig. 3b), whereas in CPC2 the lateral pro-trusion is not attached (Fig. 3b). The aim of this sec-tion was to analyze the possible temporal coordinationbetween these two components, and how they arecoordinated with the resulting bending of cell shape.The results from this analysis showed that the pro-trusion of lateral pseudopods takes about 12 s inaverage, starting with the lateral protrusion leading tothe bending of cell shape and finishing with theattachment of the pseudopod to the substrate.
Application of PCA only to cell shape, similar toKillich et al.19 and Keren et al.,18 provided with a set ofcell shape components. One of them accounts directlyfor cell bending and is temporally described by itsweight coefficient asbðtÞ: The PDFs of the Spearman’srank correlation coefficient between asb and either a2 ora5 (Fig. 9b) proved that the association between cellshape bending and both CPC2 and CPC5 was positiveand statistically significant. We studied the temporalcoordination of cell shape bending, CPC2, and CPC5through analysis of the cross-correlation of theirweight coefficients and their temporal delays (Figs. 9a,9c), showing that CPC5 is delayed ~12 s with respect toCPC2 (p = 0.004) (Figs. 9a, 9c, first boxplot) and thatthe physical bending of the cell precedes CPC5 by ~7 s(p = 0.0015) (Figs. 9a and 9c, second boxplot).Although Fig. 9c (third box-plot) suggests that CPC2precedes the bending of the cell by ~ 4 s, the statis-tical significance was marginal (p = 0.09), probably
(a)
(b) (c)
FIGURE 6. The weight coefficient of CPC1, a1, correlateswith both the strain energy exerted US and the cell length L.(a) For a WT cell, temporal evolution of a1 (top panel), US
(middle panel), L (bottom panel). (b) Box-plot of theSpearman’s rank correlation coefficient between the weightcoefficient of the 5 CPCs identified, ak (t) (k = 1 2 5), and US :(c) Box-plot of the Spearman’s rank correlation coefficientbetween ak (t) (k = 1 2 5) and L. Legend of the sign test of thenull hypothesis that the statistical distributions in panels(a–b) have zero median: *p < 0.01.
ALONSO-LATORRE et al.610

because this delay was close to the temporal resolutionof our experiments, 2 s.
Traction Force Components in Contractility Mutantsare Similar to those in Wild-type Cells
To investigate the role that MyoII contractilityplays in the strain energy components we applied PCA
to recordings of 1) MyoII essential light chain null cellswith altered MyoII motor function7 (mlcE�, N = 13),and 2) MyoII null cells lacking MyoII cross-linkingand motor function31 (mhcA�N ¼ 19).
Applying both ensemble and individual PCA (see‘‘Materials and Methods’’) to recordings of tractionforces and cell shape for both mhcA� and mlcE� cells,we identified five CPCs for each mutant cell line.
(a) (b)
(c) (d)
FIGURE 7. The weight of canonical strain energy components (CPC) 2–5 is bounded by the weight of CPC1. (a–e) 2D-PDFs of theweight coefficient of CPCk, ak ðtÞ (k = 2 2 5), vs. the weight coefficient of CPC1, a1; for the pool of all the observations(Nobservations = 10468) coming from individual PCA applied over each WT cell (N ¼ 24). Solid lines represent the contours containing40% (dark red), 60% (red), 80% (yellow), 90% (light blue) and 99% (blue) of the data. The dashed black lines indicate the approx-imate envelope of each 2D-PDF for ak � a1 (k = 2 2 5).
(a) (b) (c)
FIGURE 8. Temporal memory of the principal components in individual PCA. (a) � �; autocorrelation of the weight coefficient ofthe strain energy components in a WT cell, Rak
. Blue, k = 1; red, k = 2; green, k = 10; light blue, k = 25. 222 , parabola that fits Rak
for time lag 0-10 s. The intersection of the parabola with the axis Rak = 0 determines the temporal memory of component k (tR0(k )).(b) � �,tR0(k ) for the same cell. ��� (grey), the power law fit to tR0(k ) (pR0). The cross marks the component for which pR0
reaches 22 s (k22), which is the temporal resolution needed to describe pseudopod protrusion and retraction.27 (c) Box-plot of k22
for WT cells (N = 24).
Pole Forces Thrust Motile Amoeboid Cells 611

These principal components, specially in mlcE�; wereremarkably similar to those identified for WT cells(Fig. 14 for mlcE�; and 15 for mhcA� in the Sup-porting Material), and accounted for ~55% of US
exerted by mlcE� and mhcA� (Fig. 13A in the Sup-porting Material).
As in WT cells, CPC1 accounted for a substantialproportion of the strain energy (~40%) in both mlcE�
and mhcA� cells, indicating that temporal evolutionof the mechanical interaction between contractilitymutants and their substrate was also dynamicallysimple in these mutants. However, in mhcA� cells theprincipal components with k> 1 were less reproduc-ible from cell to cell (Fig. 13C in the SupportingMaterial) than in WT, indicating the difficulty to definea clear ‘‘mechanical phenotype’’ for this cell line.
The first principal component in mlcE� was verysimilar to that in WT cells (Figs. 3a1, 10a), with trac-tion forces focused at two areas at the posterior andanterior parts of the cell. However, this was not thecase in mhcA� cells, where CPC1 presented a largeamount of lateral forces (Fig. 10b). The prominentexertion of lateral forces by mhcA� is presentthroughout all the components (Fig. 15 in the Sup-porting Material).
DISCUSSION
Dr. Chien has been a major force in laying thefoundation of mechanobiology, an emerging branch ofcell biology that studies the interplay betweenmechanical forces and molecular biology. An essentialelement of mechanobiology is the variety of processesby which the cell responds to mechanical stresses,remodels its cytoskeleton and regulates its func-tion in physiology and disease. Among his many
contributions, Dr. Chien has studied how externalforces applied to the cell affect cell shape or cellmigration.8,16,21,35,38,42 The present paper has beengreatly inspired by Dr. Chien’s pioneering work in thisarea.
In motile cells, shape changes are strongly relatedwith the modulation of cell adhesions to the substratevia the forces they exert on it.6,13,26,34,39 In order tostudy this modulation, we measured the traction forcesand cell shape of Dictyostelium cells migratingchemotactically over a flat elastic substrate. We thenapplied a tailored formulation of Principal ComponentAnalysis (PCA) that optimized the mechanical workexerted by these cells. In addition, we used a 2Dmapping of cell shape to obtain the different shapechanges associated with each strain energy component.
Principal component analysis determined a set offive canonical principal components of the strainenergy (CPCs) that were reproducible from cell to cell,
(a) (b) (c)
FIGURE 9. Analysis of the temporal coordination between cell shape bending and the two asymmetric canonical principalcomponents of the strain energy, CPC2 and CPC5. (a) For a WT cell, cross-correlations between the bending of the cell (weightcoefficient as
b ), CPC2 (weight coefficient a2) and CPC5 (weight coefficient a5), used to quantify the delay between the signals(indicated with solid circles). (b) Box-plot of the Spearman’s rank correlation coefficient between: a2 and as
b ; and a5 and asb : (c) Box-
plot of the time delay, in s, between different weight coefficients, as extracted from their cross-correlations (see panel (a))(ax ! ay = time delay of ay with respect to ax ). Stars indicate significance of testing the null hypothesis that the statisticaldistributions in panels (b–c) come from a continuous distribution with zero median: *p < 0.05 and **p < 0.01.
(a) (b) (c)
FIGURE 10. Traction force maps corresponding to thedominant canonical strain energy component (CPC1) in (a)WT, (b) mlcE� and (c) mhcA�. The colormap and the arrowsindicate the magnitude (in pN) and direction of the tractionforces respectively. The solid black contour indicates themedian cell shape associated with this component. SeeEq. (8) for further explanation of the representation. x and yare the non-dimensional axes. Scale bar: 1 non-dimensionalunit of length = half-length of the cell. Labels ‘‘F’’ and ‘‘B’’denote the front and back of the cell respectively.
ALONSO-LATORRE et al.612
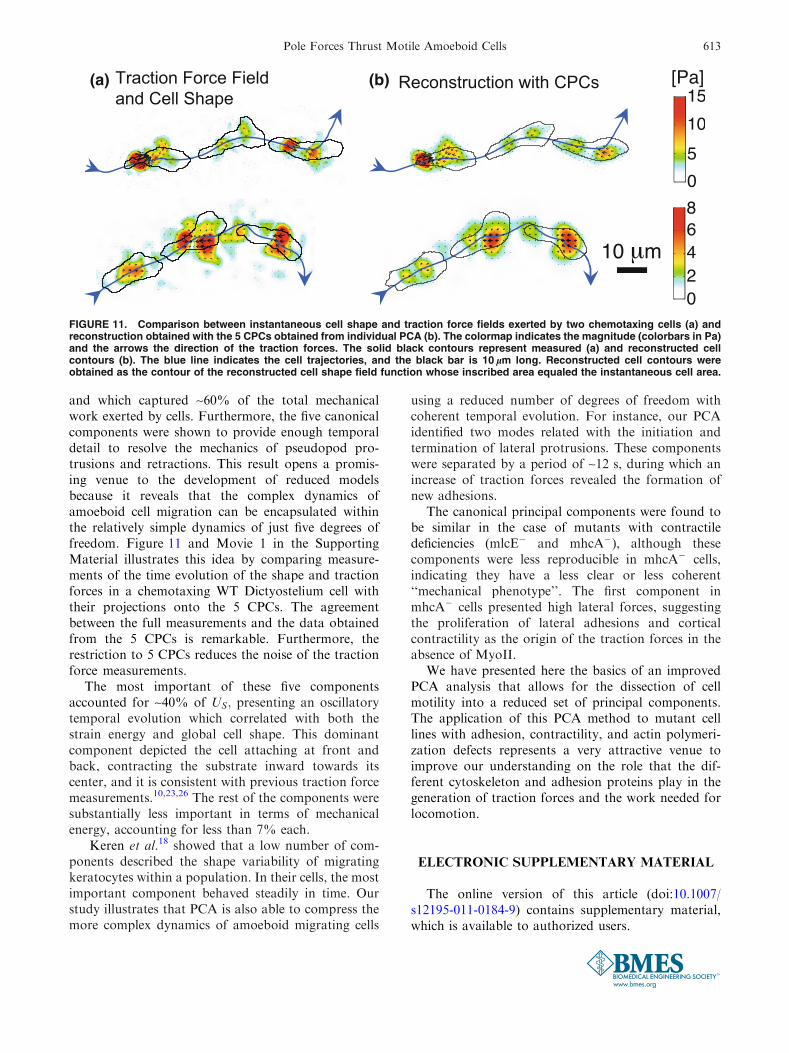
and which captured ~60% of the total mechanicalwork exerted by cells. Furthermore, the five canonicalcomponents were shown to provide enough temporaldetail to resolve the mechanics of pseudopod pro-trusions and retractions. This result opens a promis-ing venue to the development of reduced modelsbecause it reveals that the complex dynamics ofamoeboid cell migration can be encapsulated withinthe relatively simple dynamics of just five degrees offreedom. Figure 11 and Movie 1 in the SupportingMaterial illustrates this idea by comparing measure-ments of the time evolution of the shape and tractionforces in a chemotaxing WT Dictyostelium cell withtheir projections onto the 5 CPCs. The agreementbetween the full measurements and the data obtainedfrom the 5 CPCs is remarkable. Furthermore, therestriction to 5 CPCs reduces the noise of the tractionforce measurements.
The most important of these five componentsaccounted for ~40% of US; presenting an oscillatorytemporal evolution which correlated with both thestrain energy and global cell shape. This dominantcomponent depicted the cell attaching at front andback, contracting the substrate inward towards itscenter, and it is consistent with previous traction forcemeasurements.10,23,26 The rest of the components weresubstantially less important in terms of mechanicalenergy, accounting for less than 7% each.
Keren et al.18 showed that a low number of com-ponents described the shape variability of migratingkeratocytes within a population. In their cells, the mostimportant component behaved steadily in time. Ourstudy illustrates that PCA is also able to compress themore complex dynamics of amoeboid migrating cells
using a reduced number of degrees of freedom withcoherent temporal evolution. For instance, our PCAidentified two modes related with the initiation andtermination of lateral protrusions. These componentswere separated by a period of ~12 s, during which anincrease of traction forces revealed the formation ofnew adhesions.
The canonical principal components were found tobe similar in the case of mutants with contractiledeficiencies (mlcE� and mhcA�), although thesecomponents were less reproducible in mhcA� cells,indicating they have a less clear or less coherent‘‘mechanical phenotype’’. The first component inmhcA� cells presented high lateral forces, suggestingthe proliferation of lateral adhesions and corticalcontractility as the origin of the traction forces in theabsence of MyoII.
We have presented here the basics of an improvedPCA analysis that allows for the dissection of cellmotility into a reduced set of principal components.The application of this PCA method to mutant celllines with adhesion, contractility, and actin polymeri-zation defects represents a very attractive venue toimprove our understanding on the role that the dif-ferent cytoskeleton and adhesion proteins play in thegeneration of traction forces and the work needed forlocomotion.
ELECTRONIC SUPPLEMENTARY MATERIAL
The online version of this article (doi:10.1007/s12195-011-0184-9) contains supplementary material,which is available to authorized users.
(a) (b)
FIGURE 11. Comparison between instantaneous cell shape and traction force fields exerted by two chemotaxing cells (a) andreconstruction obtained with the 5 CPCs obtained from individual PCA (b). The colormap indicates the magnitude (colorbars in Pa)and the arrows the direction of the traction forces. The solid black contours represent measured (a) and reconstructed cellcontours (b). The blue line indicates the cell trajectories, and the black bar is 10 lm long. Reconstructed cell contours wereobtained as the contour of the reconstructed cell shape field function whose inscribed area equaled the instantaneous cell area.
Pole Forces Thrust Motile Amoeboid Cells 613

ACKNOWLEDGMENTS
This work was supported by grants USPHS1RO1GM084227 and 3RO1GM037830.
REFERENCES
1Berkooz, G., P. Holmes, and J. L. Lumley. The properorthogonal decomposition in the analysis of turbulentflows. Annu. Rev. Fluid Mech. 25:539–575, 1993.2Bray, D. Cell Movements: From Molecules to Motility,2nd edn. New York: Garland Pub., pp. 41–58, 2001.3Buenemann, M., H. Levine, W. J. Rappel, and L. M.Sander. The role of cell contraction and adhesion indictyostelium motility. Biophys. J. 99(1):50–58, 2010.4Butler, J. P., I. M. Tolic-Norrelykke, B. Fabry, and J. J.Fredberg. Traction fields, moments, and strain energy thatcells exert on their surroundings. Am. J. Physiol. CellPhysiol. 282(3):C595–C605, 2002.5Canuto, C., M. Y. Hussaini, A. Quarteroni, and T. A.Zang. Spectral Methods: Fundamentals in Single Do-mains. Scientific Computation, 1st edn. Berlin: Springer-Verlag, pp. 56–68, 2006.6Chen, C. S., J. L. Alonso, E. Ostuni, G. M. Whitesides, andD. E. Ingber. Cell shape provides global control of focaladhesion assembly. Biochem. Biophys. Res. Commun.307(2):355–361, 2003.7Chen, T. L., P. A. Kowalczyk, G. Ho, and R. L. Chisholm.Targeted disruption of the Dictyostelium myosin essentiallight chain gene produces cells defective in cytokinesis andmorphogenesis. J. Cell. Sci. 108(Pt 10):3207–3218, 1995.8Chien, S. Mechanotransduction and endothelial cellhomeostasis: the wisdom of the cell. Am. J. Physiol-HeartC. 292(3):H1209–H1224, 2007.9Condeelis, J., and J. E. Segall. Intravital imaging of cellmovement in tumours. Nat. Rev. Cancer 3(12):921–930,2003.
10del Alamo, J., C. R. Meili, B. Alonso-Latorre, J. Rodri-guez-Rodriguez, A. Aliseda, R. A. Firtel, and J. C. Lash-eras. Spatio-temporal analysis of eukaryotic cell motility byimproved force cytometry. Proc. Natl Acad. Sci. USA.104(33):13343–13348, 2007.
11Dembo, M., T. Oliver, A. Ishihara, and K. Jacobson.Imaging the traction stresses exerted by locomoting cellswith the elastic substratum method. Biophys. J. 70(4):2008–2022, 1996.
12Ferreras, I., A. Pasquali, R. R. de Carvalho, I. G. de laRosa, and O. Lahav. A principal component analysisapproach to the star formation history of elliptical galaxiesin compact groups. Mon. Not. R. Astron. Soc. 370(2):828–836, 2006.
13Gardel, M. L., B. Sabass, L. Ji, G. Danuser, U. S. Schwarz,and C. M. Waterman. Traction stress in focal adhesionscorrelates biphasically with actin retrograde flow speed. J.Cell Biol. 183(6):999–1005, 2008.
14Harris, A. K., P. Wild, and D. Stopak. Silicone rubbersubstrata: a new wrinkle in the study of cell locomotion.Science 208(4440):177, 1980.
15Holmes, P., J. L. Lumley, and G. Berkooz. Turbulence,Coherent Structures, Dynamical Systems and Symmetry,1st edn. Cambridge Monographs on Mechanics. Cam-bridge: Cambrige University Press, pp. 86–128, 1996.
16Hsu, P. P., S. Li, Y. S. Li, S. Usami, A. Ratcliffe, X. Wang,and S. Chien. Effects of flow patterns on endothelial cellmigration into a zone of mechanical denudation. Biochem.Biophys. Res. Commun. 285(3):751–759, 2001.
17Keer, L. M. Stress distribution at the edge of an equilib-rium crack. J. Mech. Phys. Solids 12(3):149–163, 1964.
18Keren, K., Z. Pincus, G. M. Allen, E. L. Barnhart, G.Marriott, A. Mogilner, and J. A. Theriot. Mechanism ofshape determination in motile cells. Nature 453(7194):475–U1, 2008.
19Killich, T., P. J. Plath, E. C. Hass, W. Xiang, H. Bultmann,L. Rensing, and M. G. Vicker. Cell-movement and shapeare nonrandom and determined by intracellular, oscillatoryrotating waves in dictyostelium amoebae. Biosystems33(2):75–87, 1994.
20Lauffenburger, D. A., and A. F. Horwitz. Cell migration: aphysically integrated molecular process. Cell 84(3):359–369,1996.
21Li, S., P. Butler, Y. Wang, Y. Hu, D. C. Han, S. Usami, J.L. Guan, and S. Chien. The role of the dynamics of focaladhesion kinase in the mechanotaxis of endothelial cells.Proc. Natl Acad. Sci. USA. 99(6):3546–3551, 2002.
22Li, S., J. L. Guan, and S. Chien. Biochemistry and bio-mechanics of cell motility. Annu. Rev. Biomed. Eng. 7:105–150, 2005.
23Lombardi, M. L., D. A. Knecht, M. Dembo, and J. Lee.Traction force microscopy in dictyostelium reveals distinctroles for myosin ii motor and actin-crosslinking activity inpolarized cell movement. J. Cell. Sci. 120(Pt 9):1624–1634,2007.
24Luo, L. Q. Rho gtpases in neuronal morphogenesis. Nat.Rev. Neurosci. 1(3):173–180, 2000.
25Machacek, M., and G. Danuser. Morphodynamic profilingof protrusion phenotypes.Biophys. J. 90(4):1439–1452, 2006.
26Meili, R., B. Alonso-Latorre, J. C. del Alamo, R. A. Firtel,and J. C. Lasheras. Myosin ii is essential for the spatio-temporal organization of traction forces during cell motil-ity. Mol. Biol. Cell 21(3):405–417, 2010.
27Mogilner, A., and B. Rubinstein. Actin disassembly ‘clock’and membrane tension determine cell shape and turning: amathematical model. J. Phys. Condens. Matter 22(19):194118, 2010.
28Peterson, M. A. Theory of deformable substrates dor cellmotility studies. Biophys. J. 71(2):657–669, 1996.
29Pollard, T. D., and G. G. Borisy. Cellular motility drivenby assembly and disassembly of actin filaments. Cell112(4):453–465, 2003.
30Ridley, A. J., M. A. Schwartz, K. Burridge, R. A. Firtel, M.H. Ginsberg, G. Borisy, J. T. Parsons, and A. R. Horwitz.Cell migration: integrating signals from front to back.Science 302(5651):1704–1709, 2003.
31Robinson, D. N., and J. A. Spudich. Dynacortin, a geneticlink between equatorial contractility and global shapecontrol discovered by library complementation of aDictyostelium discoideum cytokinesis mutant. J. Cell Biol.150(4):823–838, 2000.
32Rubinstein, B., K. Jacobson, and A. Mogilner. Multiscaletwo-dimensional modeling of a motile simple-shaped cell.Multiscale Model. Simul. 3(2):413–439, 2005.
33Satulovsky, J., R. Lui, and Y. L. Wang. Exploring thecontrol circuit of cell migration by mathematical modeling.Biophys. J. 94(9):3671–3683, 2008.
34Sheetz, M. P., D. P. Felsenfeld, and C. G. Galbraith. Cellmigration: regulation of force on extracellular-matrix-in-tegrin complexes. Trends Cell Biol. 8(2):51–54, 1998.
ALONSO-LATORRE et al.614

35Shiu, Y. T., S. Li, W. A. Marganski, S. Usami, M. A.Schwartz, Y. L. Wang, M. Dembo, and S. Chien. Rhomediates the shear-enhancement of endothelial cell migra-tion and traction force generation. Biophys. J. 86(4):2558–2565, 2004.
36Soll, D. R., D. Wessels, S. Kuhl, and D. F. Lusche. How acell crawls and the role of cortical myosin ii. Eukaryot. Cell8(9):1381–1396, 2009.
37Springer, T. A. Traffic signals for lymphocyte recirculationand leukocyte emigration: the multistep paradigm. Cell76(2):301–314, 1994.
38Tzima, E., M. A. del Pozo, S. J. Shattil, S. Chien, and M.A. Schwartz. Activation of integrins in endothelial cells byfluid shear stress mediates rho-dependent cytoskeletalalignment. EMBO J. 20(17):4639–4647, 2001.
39Wang, N., and D. E. Ingber. Control of cytoskeletalmechanics by extracellular-matrix, cell-shape, andmechanical tension. Biophys. J. 66(6):2181–2189, 1994.
40Wessels, D., H. Vawter-Hugart, J. Murray, and D. R. Soll.Three-dimensional dynamics of pseudopod formation andthe regulation of turning during the motility cycle ofdictyostelium. Cell Motil. Cytoskel. 27(1):1–12, 1994.
41Willert, C. E., and M. Gharib. Digital particle image ve-locimetry. Exp. Fluids 10(4):181–193, 1991.
42Zhao, Y., S. Chien, and S. Weinbaum. Dynamic contactforces on leukocyte microvilli and their penetration of theendothelial glycocalyx. Biophys. J. 80(3):1124–1140, 2001.
Pole Forces Thrust Motile Amoeboid Cells 615