an open source tool for the visualization, analysis … · an open source tool for the...
TRANSCRIPT
RUSS COLLEGE OF ENGINEERING AND TECHNOLOGY
An Open Source Tool for the Visualization,
Analysis and Reporting of Regional and
Statewide Transit Networks
J. David Porter, David S. Kim,
Alireza Mohseni, Pouya Barahimi
School of Mechanical, Industrial and
Manufacturing Engineering, Oregon State University
1
Saeed Ghanbartehrani
Department of Industrial and Systems Engineering, Ohio University

RUSS COLLEGE OF ENGINEERING AND TECHNOLOGY
Presentation Outline
• Introduction
• The Oregon Transit Network
• Research Objectives
• Data Sources
– General Transit Feed Specification (GTFS)
• TNA Software Tool Architecture
• TNA Software Tool Demonstration
• TNA Software Tool Evolution
• Conclusions
• Future Work
2

RUSS COLLEGE OF ENGINEERING AND TECHNOLOGY
Acknowledgements
• Oregon Department of Transportation
– Matthew Barnes
• Public Transit Division, Program Coordinator
– Lyn Cornell
• ODOT Research Project Coordinator
3

RUSS COLLEGE OF ENGINEERING AND TECHNOLOGY
Introduction
• Assessing the current "state of health" of individual transit networks is a
fundamental part of studies aimed at planning changes and/or upgrades to
the transportation network serving a region
• To be able to effect changes that benefit both the individual transit
networks as well as the larger transportation system, organizations need to
develop meaningful strategies guided by specific performance metrics
4

RUSS COLLEGE OF ENGINEERING AND TECHNOLOGY
Introduction (cont.)
• A fundamental requirement for the development of these performance
metrics is the availability of accurate data regarding transit networks
5

RUSS COLLEGE OF ENGINEERING AND TECHNOLOGY
Introduction (cont.)
• Prior to 2005, software engineers had to "data scrape" the web
site of a transit agency or were required to submit Freedom of
Information Act requests to obtain transit data (Roth, 2012)
– This situation complicated the assessment of single transit networks,
let alone performing a state-wide or region-wide study
• The advent of the General Transit Feed Specification (GTFS)
changed this constrained landscape and motivated transit
operators to release their schedules and route information to
third party developers
6

RUSS COLLEGE OF ENGINEERING AND TECHNOLOGY
The Oregon Transit Network
• The mission of the Rail & Public Transit Division (RPTD) of the
Oregon Department of Transportation (ODOT) is to support
mobility options for Oregonians through
– Advocacy
– Collaborative partnerships, and
– Grant programs
• To accomplish this mission, the RPTD provides grants, policy
leadership, and technical assistance to communities and local
transportation providers to provide transportation to people
7

RUSS COLLEGE OF ENGINEERING AND TECHNOLOGY
The Oregon Transit Network (cont.)
• Based on the RPTD's long experience in dealing with public
transit issues, the majority of investments made in transit
service by state, local, and federal government agencies are
– Based on local service providers’ individual priorities, and
– Made with limited ability to consider the impact that these investments
may have on the larger transit network
8
RUSS COLLEGE OF ENGINEERING AND TECHNOLOGY
Research Objectives
• Create an open source software tool to help the ODOT's RPTD
gain a better understanding and more efficient utilization of
existing state-wide transit networks
– Must help PTD planners to better understand and assess gaps in spatial
and temporal transit schedule connectivity
• The final product, referred to as the Transit Network Analysis
(TNA) software tool, incorporates publicly available data and
can be used to visualize, analyze, and report on the Oregon
transit network
9

RUSS COLLEGE OF ENGINEERING AND TECHNOLOGY
Data Sources
• The main data sources used by the TNA software tool are
– General Transit Feed Specification (GTFS) data
– Geographic area shape files: counties, census tracts, census places,
urbanized areas, congressional districts, and ODOT transit regions
– Census data (census block level)
– Employment data
– Park and Ride data
– Demographics
10

RUSS COLLEGE OF ENGINEERING AND TECHNOLOGY
Data SourcesGeneral Transit Feed Specification (GTFS)
• The GTFS is a common format for public transportation
schedules and associated geographic information
– https://developers.google.com/transit/
• The idea started in 2005 in Google and TriMet (Transit agency
of Portland, OR)
• A GTFS feed is a collection of at least six, and up to 13 CSV
(Comma separated Values) files (with extension .txt) contained
within a zip file.
11

RUSS COLLEGE OF ENGINEERING AND TECHNOLOGY
Data SourcesGTFS (cont.)
• Using the GTFS, a public or private
transit agency can describe
– Stops
– Routes
– Stop times
– Fare and fare rules
– Service calendar
– Service exceptions
– Transfers
…
12

RUSS COLLEGE OF ENGINEERING AND TECHNOLOGY
Data SourcesGTFS (cont.)
• Many transit agencies in the U.S. (and across the world) have
already created and adopted the GTFS data standard to make
information about their network available to users
– http://code.google.com/p/googletransitdatafeed/wiki/PublicFeeds
– http://www.gtfs-data-exchange.com/agencies
• In the state of Oregon, approximately 85% of fixed route
transit providers have GTFS data for their services
– http://www.oregon-gtfs.com/
13
RUSS COLLEGE OF ENGINEERING AND TECHNOLOGY
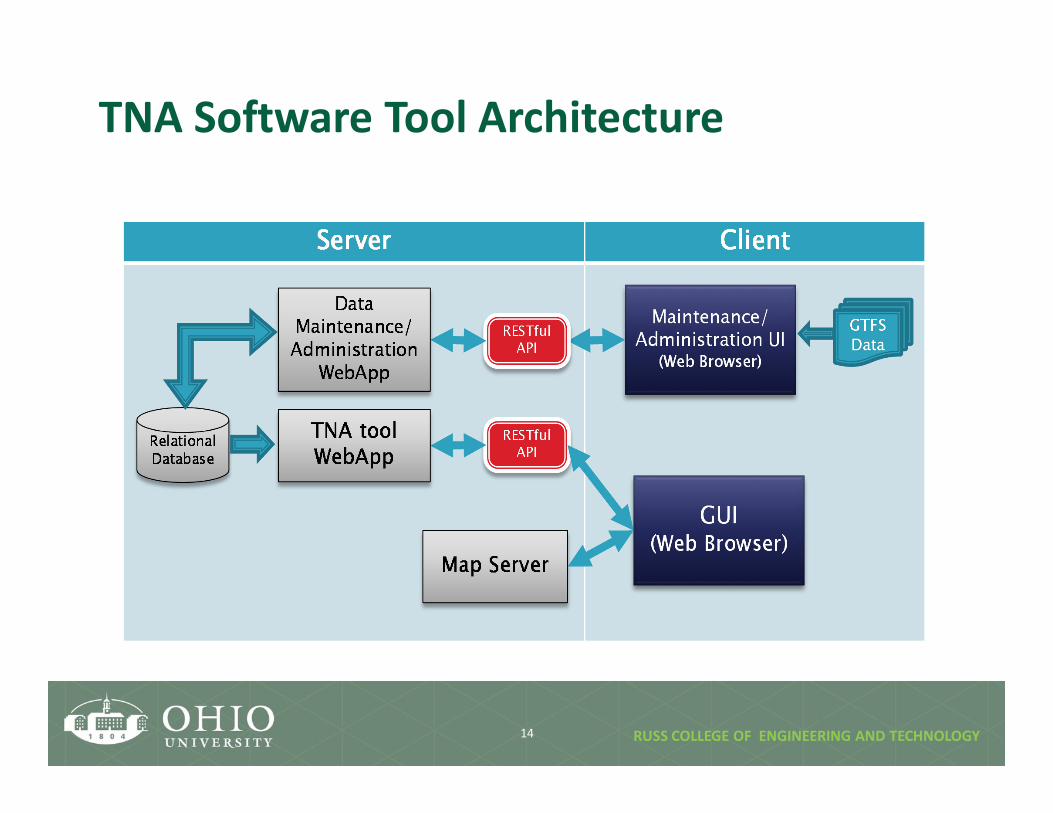
TNA Software Tool Architecture
14

RUSS COLLEGE OF ENGINEERING AND TECHNOLOGY
TNA Software Tool Architecture (cont.)
TNA software tool is developed using free open source tools and
libraries
• Java – Backend is programmed in Java
• PostgreSQL/ PostGIS
– The relational geospatial database
• JavaScript
– Client side functionality is implemented using JavaScript/ HTML/CSS
– Open source JavaScript libraries: jQuery, jQuery-UI, jsTree, DataTables,
markerCluster, Leaflet, …
15

RUSS COLLEGE OF ENGINEERING AND TECHNOLOGY
TNA Software Tool Demonstrationhttps://tnasoftwaretool.engr.oregonstate.edu/TNAtoolAPI-
Webapp/wiki/#!index.md
16

RUSS COLLEGE OF ENGINEERING AND TECHNOLOGY
TNA Software Tool Evolution
• Phase I: Jul 2012-Sep 2013
– Comprehensive research on available network analysis tools compatible with GTFS standard
– The first version of the TNA software tool was developed based on OpenTripPlanner
• Phase II: Nov 2013-Dec 2014
– TNA software tool backend was redesigned and coded from scratch
– The Geospatial database was designed and implemented in MySQL and then
PostgreSQL/PostGIS
– More complex reports/ on map reports
• Phase III: Jan 2015- Mar 2016
– Admin Interface
– GTFS Playground
– Employment, demographics, title IV, and park & ride
• Phase IV: Apr 2016 - Now
– More features
17
RUSS COLLEGE OF ENGINEERING AND TECHNOLOGY
Conclusions
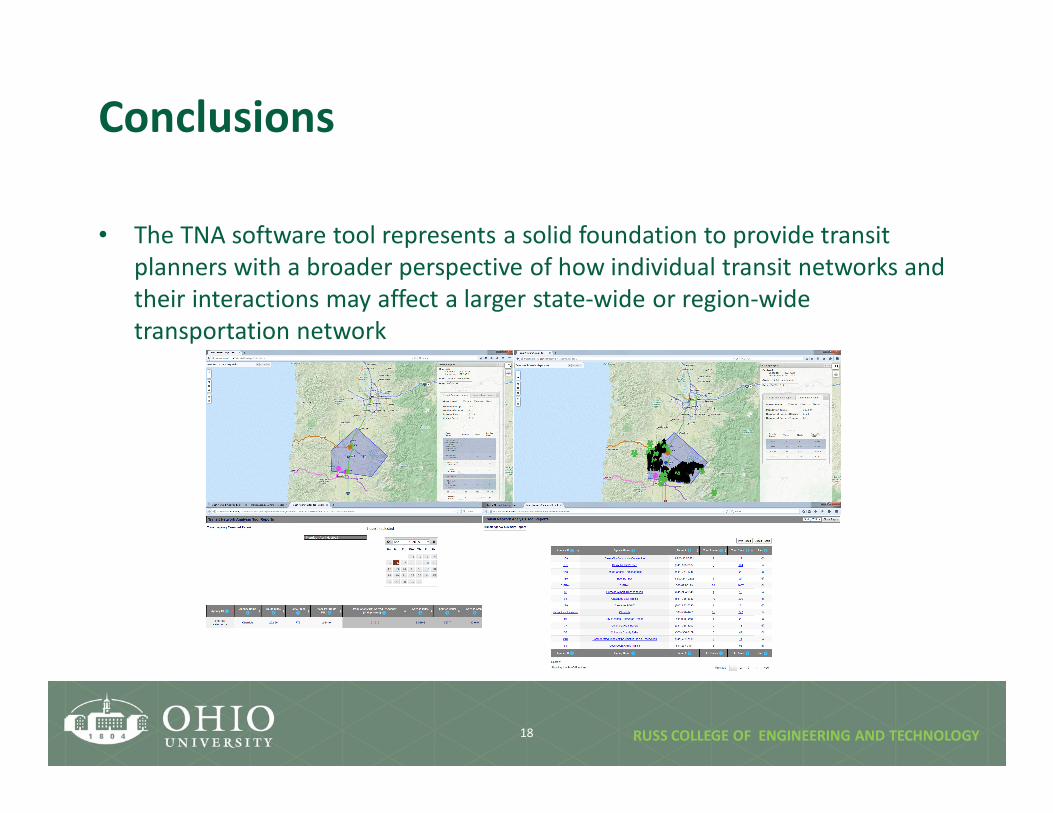
• The TNA software tool represents a solid foundation to provide transit
planners with a broader perspective of how individual transit networks and
their interactions may affect a larger state-wide or region-wide
transportation network
18

RUSS COLLEGE OF ENGINEERING AND TECHNOLOGY
Conclusions (cont.)
• A sophisticated geospatial analysis tool for design and analysis
of transit networks
– Observe and Analyze transit network evolution over time
– GTFS Playground: As-If and sensitivity analysis
– Complex reports based on geographic areas
– Connectivity analysis: transit hubs, connected agencies, and transit
networks
– Open source application, developed using open source tools and
libraries, uses open data
19

RUSS COLLEGE OF ENGINEERING AND TECHNOLOGY
Thanks for your attention
Questions
20