an online signal processing chain for respiratory...
TRANSCRIPT

POSTER 2016, PRAGUE MAY 24 1
An Online Signal Processing Chain for RespiratoryRate Estimation in Magnetic Induction Measurements
Pascal VETTER
Philips Chair for Medical Information Technology, RWTH Aachen University, Pauwelsstr. 20, 52074 Aachen, Germany
Abstract. In this paper, an online signal processing chainfor extracting respiratory rate from magnetic induction mea-surements (MIM) is presented. A flexible processing frame-work is presented and a breath-to-breath estimation as C.Bruser proposed in [1] as a beat-to-beat estimator is im-plemented within this framework. The measurement deviceMUSIMITOS2+ is used for test data recording. For thismeasurement a healthy subject was placed on a sun loungerover a 6(6)-gradiometer. The measurement is analyzed ex-emplarily. First, simple pre-processing steps are used to pre-pare the data for a principal component analysis (PCA). Theoutput of this PCA is then used as the input of the intervalestimator.
As a first result of this test, one can assume that the respira-tory signal could be extracted from the signal via PCA eventhough some channels contain bad signals. Even though theestimator would benefit from some further improvement inrobustness, the interval estimation was successful.
KeywordsMagnetic induction measurements, respiratory rate, in-
terval estimation, online signal processing
1. IntroductionIn medical care, many patients benefit from a non-
contact measurement of vital signs. Among others, those
on the intensive care unit (ICU) as well patients with fragile
skin e.g. neonates. These contactless monitoring techniques
include, for example capacitive electrocardiography (cECG)
and photoplethysmographic imaging (PPGI) [2]. Another
promising technology for contactfree measurement of heart
and lung activity is magnetic induction measurement (MIM),
which is the center of this paper is based.
In this paper an online processing framework is evalu-
ated by constructing a tool chain for breathing interval esti-
mation in MIM. The paper is structured as follows: In Sec-
tion 2 the ’Materials and Methods’ a short introduction to
MIM is given and the used hardware is introduced. After-
wards the basics of the processing chain are presented. In
Section 3 the results are presented with the help of a repre-
sentative extract of a signal and followed by a short discus-
sion in Section 4.
2. Materials and MethodsThe measurement principle of magnetic induction mea-
surement is based on the induction of an eddy current into
an object under test with non-zero conductance by an alter-
nating magnetic field, known as the primary field (Fig. 1).
These eddy currents will create an alternating magnetic field
TX-Coil
RX-Coil
RX-Coil
Primary Field
Gradiometer
Object Under Test
DDS
Eddy Current
Secondary Field
Fig. 1. The basic principle of magnetic induction measurement,
showing 1 Tx-coil and 2 Rx-coils
on their own, known as the secondary field. This secondary
field depends mainly on the conductivity distribution of the
object under test and can be measured by a set of receiv-
ing coils. In case of medical application, the measured sig-
nal will give an indication of the bio-impedance of the pa-
tient [3]. In analogy to EIT, vital signs can be derived from

2 P. VETTER, AN ONLINE SIGNAL PROCESSING CHAIN FOR RESPIRATORY RATE ESTIMATION
the measurement of the bio-impedance [4]. Therefore, it is
possible to measure vital signs contact-free with the MIM
technology. With a typical wavelength of 30 cm of the pri-
mary field and the coils placed a few cm away from the pa-
tient, the patient will be in the near field of the coils and
propagation delay can be neglected.
2.1. Hardware
For MIM the MUSIMITOS2+-device has been devel-
oped in previous work [5]. The transmitting coils (TX) are
driven by amplifiers that are controlled by a 10 MHz DDS-
source. The signal is received by a two coil antenna and
needs to be down-converted to base-band. That is accom-
plished by IQ-demodulation resulting in real and imaginary
part for every channel. The data is digitized in base-band via
National-Instrument-ADC-cards. Since the device is able
to feed six different sending coils at once, an axial 6(6)-
gradiometer, as described below, can be used. This sensor
array has six sending and six receiving coils, which can be
operated at the same time due to frequency duplexing. The
received signals can be distinguished by their slightly differ-
ent sending frequency, so that the measured secondary field
by one receiving coil can be divided into six signals which
correspond to the six different sending coils. In the follow-
ing, ’channel x-y’ names the channel where x is the sending
and y the receiving coil. The device records 6 · 6 = 36complex signals, i.e. 72 sample series which are send to the
signal processing application with 2604Hz sample rate re-
sulting in ≈ 187000 Samples per second. For evaluation the
MUSIMITOS2+ is also capable of recording reference data
of PPG-sensor and flow sensor.
Measurement coils : Since the primary field is orders
of magnitudes higher than the secondary field, a primary
field compensation needs to be performed. Therefore, an
axial gradiometer setup is chosen. Two receiving coils are
placed at the same distance parallel to the sending coil as
shown in Fig. 1. If the magnetic flux of the primary field
is the same in both coils, influence of the primary field can
be compensated by subtracting both voltages. In reality, the
coils will be adjusted for every measurement, so that the in-
fluence of the primary field is minimized. Nevertheless the
effect of the primary field will never be completely elimi-
nated. For long measurements the coils might even detune’,
so that no useful signal will be received or the signal is con-
taminated with a high drift. This means that all of the 72different channels might contain information on the respira-
tory activity of the subject, but some might not due to subject
placement, de-tuned primary field compensation or other in-
duced interference in the coils or signal line. To extract a
robust respiratory rate out of this measurement in an online
manner, a signal processing has been developed.
2.2. Online Signal Processing
For flexible online processing of sensor data we devel-
oped, a framework in C++. This framework is based on sig-
nal processing nodes that process incoming data in various
ways and can be connected to each other to build a process
chain as shown in Fig. 2. Every node saves the output data to
its own multi-channel circular output buffer for which each
following node is registered as a consumer. Since process
paths can be moved to different threads, the buffer takes care
of all consumer, so that thread safety is ensured and no pre-
mature overwriting can occur. All buffers can be visualized
during the processing for deeper analysis.
The first node of a chain should always be a data source
which in this case is chosen to be the MUSIMITOS2+. This
node handles communication to the device and receives the
measurement data via TCP-connection. Since data is fed
continuously to the process chain, each node needs to be ca-
pable of processing data in small chunks and push data to the
next node. For most nodes, the minimal chunk size is set to
one sample, so that a continuous flow of single data samples
through the process chain is kept. However, there are nodes
like the downsampling-node, which will wait for at least a
block of the size of the decimation factor. For testing pur-
pose, there is also a playback feature for recorded data as
well as a signal-generator-node is included. For further eval-
uation, a Matlab1-export-node is implemented. Due to an
easy extension of the signal-source-class, the proposed tool-
chain can be used for other measurement devices with only
small changes.
The evaluated process chain for the measurement is
shown in Fig. 2 and can be divided as follows:
• Pre-Processing (1. - 3.)
• Channel reduction via PCA (4.)
• Breath-to-breath estimation (5.)
Pre-Processing: First of all, the reference signal,
which is also recorded on the NI-ADC cards, is excluded
from the processing by channel selection and only used for
reference.
For the pre-processing steps, typical filter-nodes such
as IIR-filters and FIR-filters were implemented. The FIR-
filter uses a simple overlap-add method to process the data.
Note that even though for every input sample the correspond-
ing output sample is calculated with negligible delay, the fil-
ters induces a time shift of N2 due to the nature of causal FIR-
Filters. The pre-processing suits two purposes: reducing the
data rate and extract the useful signal by reducing out-of-
band noise. To reduces data rate, the first step is decimation
by factor of 32. This includes a anti-aliasing FIR-Filter with
348 coefficients, Fpass = 21 Hz and Fstop = 40 Hz. Since
348 is small compared to Fs = 2604 the introduced delay
1mathworks.com

POSTER 2016, PRAGUE MAY 24 3
Musimitos2 Channel
96 Channel 2604 SPS
FIR-Filter
LP 21..40Hz
72 Channel 2604 SPS
Downsampler
D= 32
72 Channel 2604 SPS
FIR-Filter
LP 2..5Hz
72 Channel 81.375 SPS
IIR-Filter
DC-Reject
72 Channel 81.375 SPS
PCA
72 Channel 81.375 SPS
72 Channel 81.375 SPS
Breathing
1 Channel 81.375 SPS
Filtered Signal
Remove reference signals
Decimation
Usefull Signal Extraction
Principal Component Analysis
DC-Removal
Use Main PCA
Extract Respiratory Rate
Selector
Channel
Selector
Estimation
Input-Signal
Input-Signal
1.
2.
3.
4.
5.
Downsampled Sig
Filtered Signal PCA-Comp
PCA-Comp
Downsampled Sig
Fig. 2. The implemented process chain for the online extraction
of breathing intervals.
is less than 100 ms. After this filtering, a downsampling to
fs = 80 achieved. For possible heart-beat detection, this
high sample rate is suitable and will be processed in further
work. For the detection of breath cycles, the data is low-pass
filtered again. We define the upper and lower frequency of
the breathing signal as Tmax = 10 s and Tmin = 0.5 s
and use an equiripple FIR-Filter with fpass = 2Hz and
fpass = 5 Hz with 68 coefficients.
For processing with PCA and interval estimation, a DC
offset is troublesome. To remove the mean without intro-
ducing a delay of several seconds, like a FIR-Filter with low
cutoff frequency would do, an IIR-Filter is used. The filter
has the form
H(z) =1− z−1
1− αz−1. (1)
A good choice of α has been determined as 0.99 in this setup.
Principal component analysis: Principal component
analysis (PCA) is used for data and noise reduction. The ba-
sic idea is to map the N dimensional input signal onto Nprincipal components via a projection matrix W . The first
component will have the highest variance and therefore con-
tain most information of the signal course. By neglecting the
I = N−M last components of the PCA, the data is reduced
to M dimension with minimal information loss in terms of
variance. This can be used for data reduction and denoising,
if the useful signal is of higher variance than the noise. For
fast online processing an iterative algorithm proposed by Y.
N. Rao is used [6][7] and implemented in the framework.
The PCA is run on all 72 channels and the first component is
used for further processing.
Interval Estimation: The interval estimation of this
setup is based on a beat-to-beat algorithm proposed by C.
Bruser in [1] as a robust BCG heart rate estimator. The algo-
rithm was implemented in the framework and used to detect
respiratory rate.
First an upper and lower bound for the interval de-
tection is chosen.As previous, we use Tmin = 0.5s and
Tmax = 10s. For every estimation step, a window of the
latest N = 2 · Tmax · fs samples is used. For every dis-
crete T = k · Fs between Tmin and Tmax, the likelihood for
being the true interval length is calculated. Therefore, three
estimators are fused to one probability distribution by multi-
plying their output.
The modified autocorrelation (CORR) is calculated for ev-
ery window by
CORR(n) =1
N
N∑i=0
w[i]w[i−N ] (2)
where N denotes the lag in samples and w the extracted win-
dow. Instead of a fixed window size, the modified version
will sum only over N samples.
Modified average magnitude difference function (AMDF) is
calculated as follows:
AMDF(n) =
(1
N
N∑i=0
|w[i]− w[i−N ]|)−1
(3)
Maximum amplitude pairs (MAP) is taken as
MAP(n) = maxi∈[0,..,N ]
(w[i] + w[i−N ]) (4)
For in detail explanation and analysis of this interval estima-
tor the interested reader is once more referred to the publica-
tion of C. Bruser[1].
3. ResultsIn this section, the result of each processing step as de-
scribed in chapter 2.2 is presented using a representative ex-
ample. The data was recorded from a healthy subject laying
over the 6(6)-gardiometer array. The subject had a distance
of about 2 cm to the upper receiving coil and a distance of
5-6 cm to the sending coil. A sequence of normal and faster
breathing was performed. To test the approach against partly
4 P. VETTER, AN ONLINE SIGNAL PROCESSING CHAIN FOR RESPIRATORY RATE ESTIMATION
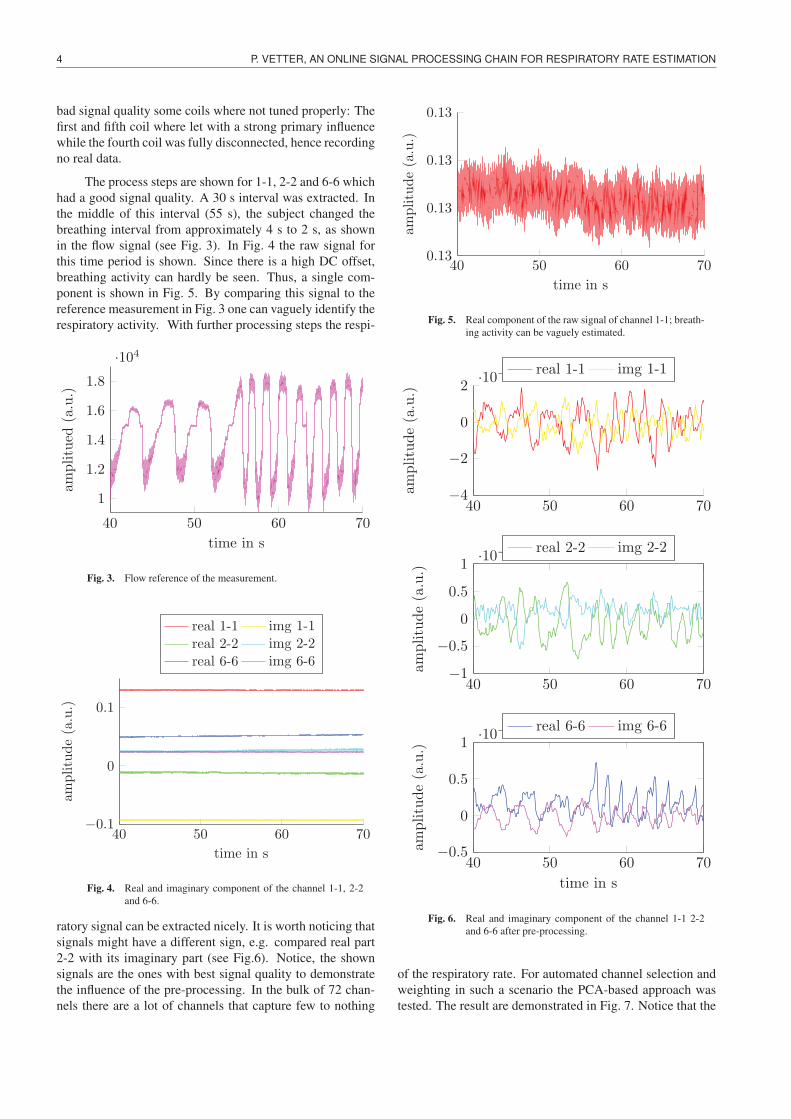
bad signal quality some coils where not tuned properly: The
first and fifth coil where let with a strong primary influence
while the fourth coil was fully disconnected, hence recording
no real data.
The process steps are shown for 1-1, 2-2 and 6-6 which
had a good signal quality. A 30 s interval was extracted. In
the middle of this interval (55 s), the subject changed the
breathing interval from approximately 4 s to 2 s, as shown
in the flow signal (see Fig. 3). In Fig. 4 the raw signal for
this time period is shown. Since there is a high DC offset,
breathing activity can hardly be seen. Thus, a single com-
ponent is shown in Fig. 5. By comparing this signal to the
reference measurement in Fig. 3 one can vaguely identify the
respiratory activity. With further processing steps the respi-
40 50 60 70
1
1.2
1.4
1.6
1.8
·104
time in s
amplitued
(a.u.)
Fig. 3. Flow reference of the measurement.
40 50 60 70−0.1
0
0.1
time in s
amplitude(a.u.)
real 1-1 img 1-1
real 2-2 img 2-2
real 6-6 img 6-6
Fig. 4. Real and imaginary component of the channel 1-1, 2-2
and 6-6.
ratory signal can be extracted nicely. It is worth noticing that
signals might have a different sign, e.g. compared real part
2-2 with its imaginary part (see Fig.6). Notice, the shown
signals are the ones with best signal quality to demonstrate
the influence of the pre-processing. In the bulk of 72 chan-
nels there are a lot of channels that capture few to nothing
40 50 60 700.13
0.13
0.13
0.13
time in s
amplitude(a.u.)
Fig. 5. Real component of the raw signal of channel 1-1; breath-
ing activity can be vaguely estimated.
40 50 60 70−4
−2
0
2·10−4
amplitude(a.u.)
real 1-1 img 1-1
40 50 60 70−1
−0.5
0
0.5
1·10−3
amplitude(a.u.)
real 2-2 img 2-2
40 50 60 70−0.5
0
0.5
1·10−3
time in s
amplitude(a.u.)
real 6-6 img 6-6
Fig. 6. Real and imaginary component of the channel 1-1 2-2
and 6-6 after pre-processing.
of the respiratory rate. For automated channel selection and
weighting in such a scenario the PCA-based approach was
tested. The result are demonstrated in Fig. 7. Notice that the

POSTER 2016, PRAGUE MAY 24 5
y-axis of Fig. 7 is upside down, since the sign of the output
of the PCA is not defined. The estimated interval can be seen
40 50 60 70
−1
0
1
·10−3
time in s
amplitude(a.u.)
Fig. 7. First component of the online PCA
in Fig. 8. The estimated breath cycle time can be derive from
the figure. The change in breathing rate at 55 s from 4 s to 2 s
is clearly detected. Nevertheless, noticeable artifacts occur
in between. However these false detection come along with
a lower estimated probability and might be discarded using
further data processing.
40 50 60 700
2
4
6
8
10
time in s
estimatedintervallength
ins estimated interval length
estimated intervalestimated probability
Fig. 8. Output of the interval estimator with given likelihood
(scaled)
4. DiscussionIn further works, the adaption of the PCA to subject
movement as well as changing condition should be analyzed
in detail. For the interval estimation, an integration over a
short time period, which was also proposed by C. Bruser in
[1] should be implemented to reach a higher robustness. At
last the estimated probability could be used to detect out-
liers in interval estimation. Also the breathing signal could
be extracted from the signals in a robust manner, further im-
provement needs to be implemented for a robust interval es-
timation. Nevertheless, the proposed online signal process-
ing chain shows promising results and the functionality of
the developed online signal processing framework has been
demonstrated.
AcknowledgementsResearch described in the paper was supervised by
Prof. Dr.-Ing. Dr. med. Steffen Leonhardt.
References[1] BRUSER, C., WINTER, S., LEONHARDT, S., Robust inter-beat inter-
val estimation in cardiac vibration signals, Physiological Measurement,2013, vol. 34, no. 2, pp. 123–138.
[2] BRUSER, C., HOOG ANTINK, C., WARTZEK, T., WALTER, M.,
LEONHARDT, S., Ambient and unobtrusive cardiorespiratory moni-
toring techniques, Biomedical Engineering, IEEE Reviews, 2015, pp.
30–43.
[3] GRIFFITHS, H., Magnetic induction tomography, Measurement Sci-ence and Technology, 2001, vol. 12, no. 8, pp. 1126–1131.
[4] CORDES, A., FOUSSIER, J., LEONHARDT, S., Breathing detec-
tion with a portable impedance measurement system: First measure-
ments, 2009 Annual International Conference of the IEEE Engineeringin Medicine and Biology Society, 2009 pp. 2767–2770.
[5] CORDES, A., LEONHARDT, S., Development of the new multichan-
nel simultaneous magnetic induction measurement system (musimitos
2+), 12th International Conference in Electrical Impedance Tomogra-phy (EIT 2011), 2011 .
[6] RAO, Y.N., PRINCIPE, J.C., A fast, on-line algorithm for pca and its
convergence characteristics, Neural Networks for Signal Processing X,Vols 1 and 2, Proceedings, 2000, pp. 299–307.
[7] HAN, D.H., RAO, Y.N., PRINCIPE, J.C., GUGEL, K., Real-time
pca(principal component analysis) implementation on dsp, 2004 IeeeInternational Joint Conference on Neural Networks, Vols 1-4, Proceed-ings, 2004, pp. 2159–2162.
About Authors. . .
Pascal Vetter was born in
Ludenscheid, Germany in 1987.
He finished his Abitur in 2007 and
received the B.Sc. and M.Sc. degree
from RWTH Aachen University in
2011 and 2014, respectively. He is
currently a research associate and
Ph.D. student at the Philips Chair
for Medical Information Technology,
Helmholtz-Institute for Biomedical
Engineering at RWTH Aachen
University. His research project is based on magnetic
induction measurements and covers hardware as well as
signal processing for said technology.