an online recommendation system for the taxi stand choice...
TRANSCRIPT

An Online Recommendation System for the Taxi Stand choice Problem (Poster)
Luis Moreira-Matias*†, Ricardo Fernandes•, João Gama*‡, Michel Ferreira•, João Mendes-Moreira*†, Luís Damas˥
* LIAAD – INESC TEC, Porto, Portugal E-mail: luis.m.matias, jgama, [email protected]
• Telecommunications Institute (IT), Department of Computer Sciences, Faculty of Sciences, University of Porto, Portugal E-mail: rjf, [email protected]
‡ Faculty of Economics, University of Porto, Portugal † Department of Informatics Engineering, Faculty of Engineering, University of Porto, Portugal
˥ GEOLINK, Porto, Portugal
Abstract— Nowadays, Informed Driving is crucial to the transportation industry. We present an online recommendation model to help the driver to decide about the best stand to head in each moment, minimizing the waiting time. Our approach uses time series forecasting techniques to predict the spatiotemporal distribution in real-time. Then, we combine this information with the live current network status to produce our output. Our online test-beds were carried out using data obtained from a fleet of 441 vehicles running in the city of Porto, Portugal. We demonstrate that our approach can be a major contribution to this industry: 395.361/506.873 of the services dispatched were correctly predicted. Our tests also highlighted that a fleet equipped with such framework surpassed a fleet that is not: they experienced an average waiting time to pick-up a passenger 5% lower than its competitor.
Keywords— taxi-passenger demand, auto-regressive integrated moving average (ARIMA), time-varying Poisson models, time series forecasting, data streams, ensemble learning, mobility intelligence.
I. INTRODUCTION The taxis became crucial for human mobility in
medium/large-sized urban areas. They provide a direct, comfortable and speedy way to move in and out of big town centers - as complement to other transportation means or as a main solution. A recent survey about the taxi service in New York [1] clearly quantifies this phenomenon: 25% of the participants use a taxi in a daily basis. In the past years, the medium/large-sized city councils tried to guarantee that the running vacant taxis will always meet the demand in their urban areas by emitting more taxi licenses than the necessary. As result, the cities’ cores are commonly crowded by a huge number of vacant taxis. These random cruise’ strategies for passenger finding have undesirable side effects like large wastes of fuel, an inefficient traffic handling, an increase of vehicles’ wear and of the air pollution. Another important dimension of this problem relies on scenarios where two
This work was supported by the projects DRIVE-IN: ”Distributed Routing and Infotainment through Vehicular Internet-working”, MISC: ”Massive Information Scavenging with Intelligent Transportation Systems” and VTL: ”Virtual Traffic Lights” under the Grants CMU-PT/NGN/0052/2008, MITPT/ITS-ITS/0059/2008, PTDC/EIA-CCO/118114/2010, respectively, and also by ERDF - European Regional Development Fund through the COMPETE Programme (operational programme for competitiveness), by the Portuguese Funds through the FCT(Portuguese Foundation for Science and Technology) within project FCOMP -01-0124-FEDER-022701.
or more companies struggle to serve an uneven passenger demand: the competition forces them to use inefficient strategies to pick up as many passengers as possible.
The taxi driver mobility intelligence is one of the keys to mitigate these problems. The knowledge about where the services (i.e. the transport of a passenger from a pick-up to a drop-off location) will actually emerge can truly be useful to the driver – especially where there are more than one competitor operating. Recently, the major taxi fleets are equipped with GPS sensors and wireless communication devices. Typically, these vehicles will transmit information to a data center about their location and the events undergoing like the passenger pick-up and drop-off. These historical traces can reveal the underlying running mobility patterns. Multiple works in the literature have already explored this kind of data successfully with distinct applications like smart driving [2], modeling the spatiotemporal structure of taxi services [3-5], building passenger-finding strategies [6, 7] or even predicting the taxi location in a passenger-perspective [8]. Despite their useful insights, the majority of the techniques reported are offline, discarding the main advantages of this signal (i.e. a streaming one).
In our work, we focus on the online choice problem about which is the best taxi stand to go to after a passenger drop-off (i.e. the stand where we will pick-up another passenger quicker). Our goal is to use the vehicular network communicational framework to improve their reliability by combining all drivers’ experience. In other words, the idea is to forecast how many services will arise in each taxi stand based on the network past behavior to feed a recommendation model to calculate the best stand to head to. An illustration about our problem is presented in Fig. 1 (the five blue dots represent possible stands to head to after a passenger drop-off; our recommendation system outputs one of them as the best choice at the moment).
An intelligent approach regarding this problem will improve the network reliability for both companies and clients: a clever distribution of vehicles throughout the stands will decrease the average waiting time to pick-up a passenger while the distance percussed will be more profitable. Passengers will also experience a lower waiting time to get a taxi (automatically dispatched or directly picked at a stand).
2012 IEEE Vehicular Networking Conference (VNC)
978-1-4673-4996-3/12/$31.00 ©2012 IEEE 173

Figure 1. Taxi Stand choice problem.
On the other hand, this can present a true advantage for a fleet when facing other competitors, which will work with less information than you do. This tool can improve the informed driving experience by transmitting to the driver which is the stand where 1) he will wait less time to get a passenger in; or where 2) he will get the service with the greatest revenue.
The smart stand-choice problem is based on four key decision variables: the expected price for a service over time, the distance/cost relation with each stand, how many taxis are already waiting at each stand and the passenger demand for each stand over time. The taxi vehicular network can be a ubiquitous sensor of taxi-passenger demand from where we can continuously mine the reported variables. However, the work described here will just address the decision process based on the last three variables.
In our previous work [9], we already proposed a model to predict the spatiotemporal distribution of the taxi passenger demand (i.e. the number of services that will emerge along the taxi stand network). Specifically, it predicts the passenger demand over space (taxi stand) for a short-time horizon of P-minutes. To do so, we adapted well-known time series forecasting techniques such as time varying Poisson model [10] and ARIMA (Autoregressive Integrated Moving Average) [11] to our problem. However, we just tested it using an iterative offline simulation based on a small data set. It was not more than a proof of concept that this model could be a contribution to take advantage of the vehicular network as a ubiquitous sensor of taxi passenger demand on future research works. This study departed from this initial work to extend it along three different dimensions:
The Recommendation System: we use these predictions as input to a Recommendation System that also accounts the number of taxis already in a stand and the distance to it. Such framework will improve the taxi driver mobility intelligence in real time, helping him to decide which is the most profitable stand in each moment. It will be based not only in his own past decisions and outcomes, but on a combination of everyone experience, taking full advantage of the ubiquitous characteristics of the vehicular communicational networks.
Test-bed: Our experiments took advantage of the vehicular network online information to feed the predictive framework. Moreover, the recommendation performance was evaluated in real-time, demonstrating its robustness and its ability to learn, decide and evolve without a high computational effort;
Dataset: 506.873 services were dispatched to our 441 vehicle fleet during our experiments. This large scale test was carried out along 9 months.
There are some works in the literature related with this problem, namely: 1) mining the best passenger-finding strategies [6, 12], 2) dividing the urban area into attractive clusters based on the historical passenger demand (i.e.: city zones with distinct demand patterns) [3-5] and even 3) predicting the passenger demand at certain urban hotspots [13-15]. The major contribution of this work facing this state-of-the-art is to build smart recommendations about the taxi stand to head to in an online streaming environment (i.e. real-time; while the taxis are operating) based not only on their historical trace but also on the current network status. In fact, the reported works present offline frameworks and/or test-beds or just account a low number of decision variables.
As a case-study, we have picked the city of Porto, Portugal. It contains a total of 63 taxi stands and two taxi companies running one fleet each. The fleet A has 441 running vehicles while the fleet B has only 250. In this network, each vehicle waits on average 44 minutes to pick-up a passenger. The existing regulations have two important assumptions:
Assumption 1. When a passenger arrives at a stand, he must pick the first taxi in the line. The parked taxis form a first-in-first-out (FIFO) queue.
Assumption 2. The drivers are not allowed to cruise randomly to find a passenger. They are forced to choose a taxi stand to head to after the passenger drop-off. They can just pick-up a passenger in a random street while they are heading to a taxi stand or over a pre-scheduled service.
The results were obtained using two distinct test-beds: firstly, (1) we let the stream run continuously between August 2011 and April 2012. The predictive model was trained during the first five months and it was stream-tested in the last four. Secondly, (2) we used a traffic simulator to test if our Recommendation System could beat the drivers’ expected behavior. We simulated a competitive scenario – with two fleets - using the services historical log and on the existing road network system. The obtained results validated that our method can effectively help the drivers to decide where they can achieve more profit.
The remainder of the paper is structured as follows. Section 2 formally presents our predictive model while Section 3 details our recommendation one. The fourth section describes our case study, how we acquired and preprocessed the data used as well as some statistics about it. The fifth section describes how we tested the methodology in a concrete scenario: firstly, we introduce the two experimental setups and the metrics used to evaluate both models. Then, the obtained
174

results are detailed, followed by some important remarks. Finally, conclusions are drawn as well as our future work.
II. THE PREDICTIVE MODEL In this section we present some relevant definitions and a
brief description of the predictive model on taxi passenger demand. The reader should consult the section II in [9] for further details. Let 𝑺 = 𝒔𝟏, 𝒔𝟐, … , 𝒔𝑵 be the set of 𝑵 taxi stands of interest and 𝑫 = 𝒅𝟏, 𝒅𝟐, … , 𝒅𝒋 be a set of 𝒋 possible passenger destinations. Our problem is to choose the best taxi stand at instant 𝒕 according with our forecast about passenger demand distribution over the time stands for the period [𝒕, 𝒕+P].
Consider 𝑿𝒌 = 𝑿𝒌,𝟎, 𝑿𝒌,𝟏, … , 𝑿𝒌,𝒕 to be a discrete time series (aggregation period of P-minutes) for the number of demanded services at a taxi stand 𝒌. Our goal is to build a model which determines the set of service counts 𝑿𝒌,𝒕 𝟏 for the instant 𝒕 + 𝟏 and for all taxi stands 𝒌 𝝐 𝟏. . 𝑵 . To do so, we propose three distinct short-term prediction models and a well-known data stream ensemble framework to use them all. We briefly describe those models along this section.
A. Time Varying Poisson Model Consider the probability to emerge n taxi assignments in a
determined time period – P(n) - following a Poisson distribution. We can define it using the following equation
P(n; λ) = !
, (1)
where 𝜆 represents the rate (averaged number of the demand on taxi services) in a fixed time interval. However, in this specific problem, the rate 𝜆 is not constant but time-variant. So, we adapt it as a function of time, i.e. 𝜆(𝑡), transforming the Poisson distribution into a nonhomogeneous one. Consider 𝜆(𝑡) to be defined as follows
λ(t) = λ δ ( )η ( ), ( ), (2)
where 𝑑(𝑡) represents the weekday 1=Sunday,2=Monday,…;; and ℎ(𝑡) the period in which time t falls (e.g. the time 00:31 is contained in the period 2 if we consider 30-minute periods).
B. Weighted Time Varying Poisson Model The model previously presented can be faced as a time-
dependent average which produces predictions based on the long-term historical data. However, it is not guaranteed that every taxi stand will have a highly regular passenger demand: actually, the demand in many stands can often be seasonal. The sunny beaches are a good example on the demand seasonality: the taxi demand around them will be higher on summer weekends rather than other seasons along the year.
To face this specific issue, we propose a weighted average model based on the one presented before: our goal is to increase the relevance of the demand pattern observed in the previous week by comparing it with the patterns observed several weeks ago (e.g. what happened on the previous Tuesday is more relevant than what happened two or three Tuesdays ago). The weight set 𝜔 is calculated using a well-
known time series approach to these kind of problems: the Exponential Smoothing [16]. This model will enhance the importance of the mid-term historical data rather than the long-term one already proposed in the above section.
C. Autoregressive Integrated Moving Average Model
The two previous models assume the existence of a regular (seasonal or not) periodicity in the taxi service passenger demand (i.e. the demand at one taxi stand on a regular Tuesday during a certain period will be highly similar to the demand verified during the same period on another Tuesdays). However, the demand can present distinct periodicities for different stands. The ubiquitous characteristics of this network force us to rapidly decide if and how the model is evolving and to adapt to these changes in real-time.
The AutoRegressive Integrated Moving Average Model (ARIMA) [11] is a well-known methodology to both model and forecast univariate time series data such as traffic flow data [17], electricity pricing [18] and other short-term prediction problems like our own. The ARIMA’s main advantages when compared to other algorithms are two: 1) it is versatile to represent very different types of time series: the autoregressive (AR) ones, the moving average ones (MA) and a combination of those two (ARMA); 2) on the other hand, it combines the most recent samples from the series to produce a forecast and to update itself to changes in the model. For further details, the reader should consult the section II in [9]
D. Sliding WindowEnsemble Framework We already proposed three distinct predictive models
which focused themselves to learn from the long, medium and short-term historical data. But a question remains open: how can we combine them all to improve our prediction? In the last decade, regression and classification tasks on streams attracted the community attention due to its drifting characteristics. The ensembles of such models were specifically addressed due to the challenge related with. One of the most popular models is the weighted ensemble [19]. The model we propose below is based on this one.
Consider 𝑀 = 𝑀 ,𝑀 ,… ,𝑀 to be a set of z models of interest to model a given time series and 𝐹 = 𝐹 , 𝐹 ,… , 𝐹 to be the set of forecasted values to the next period on the interval t by those models. The ensemble forecast Ε is obtained as
Ε = ∑ , β = ∑ ρ (3)
where ρ is the similarity measure obtained for the model M in the periods contained on the time window/period [t − H, t] (H is a user-defined parameter to define the window size) while compared with the real service time series. As the information is arriving for the next periods 𝑡, 𝑡 + 1, 𝑡 +2,… . the window will also slide to determine how the models are performing in the last H periods.
To calculate such similarity, we used AVE (Averaged Weighted Error) metric, which is formally presented in section IV of this paper.
175

III. THE RECOMMENDATION MODEL Let 𝐗𝐤,𝐭 𝟏 be the number of services to be demanded in the
taxi stand k during the 30-minutes period next to the time instant t. Then, a passenger is dropped-off somewhere by a vehicle of interest w minutes after the last forecast on the instant t. The problem is to choice one of the possible taxi stands to head to. This choice is related with four key variables: the expected price for a service over time, the distance to each stand, how many taxis are already waiting at each stand and the predicted passenger demand. However, here we solve this issue like a minimization problem: we want to rank the stands according the minimum waiting time (target variable) to pick-up a passenger, whenever it is directly picked-up or dispatched by the central.
Let 𝑪𝒌,𝒕 𝒘 be the number of taxis already parked in the stand k in the drop-off moment and 𝑳𝒌,𝒘 be the number of services departed from the same stand between this moment and the moment of the last forecast (i.e.: t). We can define the service deficit - 𝑺𝑫𝒌,𝒕 𝒘 - on the taxi stand k (i.e.: a prediction on the number of services that still will be demanded in the stand discounting the vehicles already waiting in the line) as
SD , = X , − C , − L , ∗ 𝛒𝐇 (4)
where ρ is the similarity (i.e.: 1 – error) obtained by our forecasting model in this specific stand during the sliding training window H. In fact, 𝛒𝐇 works as a certainty about our prediction (i.e.: if two stands have the same SD but our model is experiencing a bigger error in one of them, the other stand should be picked instead).
Let 𝒗𝐤 be the distance (in kilometers) between the drop-off location and the taxi stand k. We can define the normalized distance to the stand - 𝑼𝐤 - as follows
U = 1 − 𝐯𝐤 ξ (5) where 𝝃 is the distance to the farthest stand. We can calculate the Recommendation Score 1 of the taxi stand k as
𝑹𝑺𝟏 = U ∗ SD , (6)
Then, we calculate the Recommendation Score of every stands and we recommend to the driver the stand with the highest one.
IV. DATA ACQUISITON AND PREPROCESSING As a case-study, we picked the city of Porto, Portugal,
where has a population of 1.3 million inhabitants. This city is the center of a medium size urban area where the passenger demand is inferior to the number of running vacant taxis, provoking a huge competition between both companies and drivers – according to a recent aerial survey of the road traffic of the city [20], taxis represent 4% of the running vehicles during a non-rush hour period. This city has roughly 700 taxis operating on it, divided by two competitive fleets: the fleet A, with 441 vehicles and the fleet B, which has just 250. However, we just got access to the messages broadcasted by the first one.
The existing regulations force the drivers to not run randomly in search of passengers but to choose a specific taxi
stand out of the 63 existing ones in the city to wait for the next service immediately after the last passenger drop-off. A map of the stands spatial distribution is presented in the Fig. 2. There are three main ways to pick-up a passenger: (1) a passenger goes to a taxi stand and picks-up a taxi – the regulations also force the passengers to pick-up the first taxi in line (First In, First Out); (2) a passenger calls the taxi network central and demands a taxi for a specific location/time – the parked taxis have priority over the running vacant ones in the central taxi it a dispatch system; (3) a passenger picks vacant taxi while is going to a taxi stand, on any street. In this section, we describe the data acquisition process and the preprocessing applied to it.
A. Data Acquisition The data was continuously acquired using the telematics
installed in each one of the 441 running vehicles (GPS and wireless communication) of the fleet A. These vehicles usually run in one out of three 8h shifts: midnight to 8am, 8am-4pm and 4pm to midnight. Each data chunk arrives with the following six attributes: (1) TYPE –relative to the type of event reported and has four possible values: busy – the driver picked-up a passenger; assign – the dispatch central assigned a service previously demanded; free – the driver dropped-off a passenger and park – the driver parked at a taxi stand. The attribute (2) STOP is an integer with the ID of the related taxi stand. The attribute (3) TIMESTAMP is the date/time in seconds of the event and the attribute (4) TAXI is the driver code; the attributes (5) and (6) refers to the LATITUDE and the LONGITUDE corresponding to the acquired GPS position.
This data was acquired over a non-stop period of nine months. Our study just uses as input the services obtained directly at the stands or those automatically dispatched to the parked vehicles (more details in the section below). We did so because the passenger demand at each taxi stand is the main feature to aid the taxi drivers’ decision.
B. Preprocessing and Data Analysis
As preprocessing, a time series of taxi demand services aggregated for a period of P-minutes was developed. There are three types of accounted events: (1) the busy set directly at a taxi stand; (2) the assign set directly to a taxi parked at a taxi stand and (3) the busy set while a vacant taxi is cruising. Type 1 events are accounted directly as type 2 events. However, for each type 2 event, the system receives a busy event a few minutes later – as soon as the driver effectively picked-up the passenger – this is ignored by our system. Type 3 events are ignored unless they occur in a radius of W meters from a taxi stand (where W is a user defined parameter). If it does, it is considered as being a type 1 event related with the nearest taxi stand according the defined criteria. We did so because many regulations prohibit the picking-up of passengers in a pre-defined radius of a stop (in Porto, a radius of 50 meters is in place).
Three tables containing statistics about the studied period are now presented. Table I details the number of taxi services demanded per daily shift and day type. Table II presents an overview about the typical length of a service demanded.
176

Figure 2. Taxi Stand spatial distribution over the city of Porto, Portugal.
Table III has information about all services per taxi/driver and per cruise time.
The service column in Table III represents the number of services picked-up by the taxi drivers, while the second one is related to the cruise time of each service done. Additionally, we could state that the central service assignment is 24% of the total service (versus the 76% of the one demanded directly in the street) while 77% of the service is demanded directly to taxis parked in a taxi stand (and 23% is assigned while they are cruising). The average waiting time (to pick-up passengers) of a taxi parked at a taxi stand is 42 minutes while the average time for a service is only 11 minutes and 12 seconds.
The data in tables I and III highlight that, despite the regularity exhibited in the service (especially on the weekends), there are huge mobility intelligence discrepancies between the drivers (i.e. a large variance in services number and profit). Table II focuses on the length of the services: 75% of them last 15 minutes or less. These statistics sustain the importance of a smart decision on the stand-choice problem: an accurate sensor on the passenger demand can be a major advantage in urban areas where a highly competitive scenario – like our own - is in place.
V. EXPERIMENTAL RESULTS
In this section, we firstly describe the experimental setup developed to test our predictive model on the available data. Secondly, we introduce our simulation model and the experiments associated with. Thirdly, we present our Recommendation System and the metrics used to evaluate our methods. Finally, we present the results.
A. Experimental Setup for the Predictive Model Our model produces an online forecast for the taxi-
passenger demand at all taxi stands at each P-minutes period. Our test-bed was based on prequential evaluation [21]: data about the network events was continuously acquired.
Each data chunk was transmitted and received through a socket. The model was programmed using the R language [22]. The prediction effort was divided into three distinct processes running on a multicore CPU (the time series for each stand is independent from the remaining ones) which reduced the computational time of each forecast. The pre- defined functions used and the values set for the models parameters are detailed along this section.
TABLE I. TAXI SERVICES VOLUME (PER DAYTYPE/SHIFT)
Total Services Emerged
Averaged Service Demand per Shift 0am to 8am 8am to 4pm 4pm to 0am
Workdays 994797 915 2460 1701 Weekends 370145 1923 1374 1449
Total 1364942 2838 3834 3150
TABLE II. FREQUENCY DISTRIBUTION OF CRUISE TIME
Cruise Time (minutes) Services Cumulative %
5 124063 9,09 10 493068 45,21 15 408953 75,17 20 185228 88,74 25 70558 93,91 30 30828 96,17 35 15853 97,33 40 9533 98,03 45 6233 98,49 50 4303 98,80 55 3238 99,04
>55 13084 100,00
TABLE III. TAXI SERVICES VOLUME (PER TAXI/CRUISE TIME)
Services per Driver Cruise Time (minutes) Maximum 6751 71750 Minimum 100 643
Mean 2679 33132 Std. Dev. 1162 13902
Mean trav. time<15m 2010 Std. Dev. t.t.<15m 930
An aggregation period of 30 minutes was set (i.e. a new forecast is produced each 30 minutes; P=30) and a radius of 100 m (W = 100 > 50 defined by the existing regulations). It was set based on the average waiting time at a taxi stand, i.e. a forecast horizon lower than 42 minutes.
The ARIMA model (p,d,q values and seasonality) was firstly set (and updated each 24h) by learning/detecting the underlying model (i.e. autocorrelation and partial autocorrelation analysis) running on the historical time series curve for each considered taxi stand. To do so, we used an automatic time series function in the [forecast] R package [23] - auto-arima – with the default parameters. The weights/parameters for each model are specifically fit for each period/prediction using the function arima from the built-in R package [stats].
The time-varying Poisson averaged models (both weighted and non-weighted) were also updated every 24 hours. A sliding window of 4 hours (H=8) was considered in the ensemble.
B. Traffic Simulator: An Online Test-Bed The DIVERT [24] is a high-performance traffic simulator
framework which uses a realistic microscopic mobility model. The main advantage of this framework when facing others is the easiness to create new simulation modules efficiently. Hence, we have created a new model that simulates the real behavior of a taxi fleet. Upon a request, a central entity elects
177
one taxi to do the requested service. Once the service is finished, the same entity recommends a new taxi-stand for the taxi to go to and wait for a new service.
This framework was employed as an online test-bed for our Recommendation System. Firstly, the realistic map of the city of Porto - containing the real road network topology and the exact location of the 63 taxi stands in the city – was loaded (see Fig. 2 to more details). Secondly, we fed the framework with a service log (i.e. a time-dependent origin-destination matrix) correspondent to the studied period. However, we just accessed the log of one out of the two running fleets in Porto (the largest one, with 441 vehicles). To simulate a scenario similar to our own, we divided this fleet into two using a ratio close to real one (60% for the fleet A1 and 40% to the fleet B1). The services dispatched from the central were also divided in the same proportion while the services demanded in each taxi stand will be the same. The fleet B1 will use the most common and traditional way to choose the best taxi-stand: it will go to the nearest taxi stand of each drop-off location (i.e. after a drop-off, each driver has to head to a specific taxi stand of its own choice). However, the fleet A1 will use our Recommendation System to do an informed driving, which considers multiple variables – like the number of taxis in each stand or the demand prediction on them - to support this important decision. Finally, we ran the simulation and we extract the metrics for each fleet. The framework is used to calculate the optimal paths between the taxi stand and the passenger location and the dependent behavior of the fleets (the location of each vehicle will affect the way they get the services).
Our main goal is to simulate a real scenario behavior and its competitive characteristics while we are testing the Recommendation System. It is important to notice that both fleets would get similar results if they did not use any Recommendation System. We also highlight that the vehicles will remain parked in the stand waiting for a service whenever the time it takes to appear. In this case, we consider the maximum threshold of 120 minutes that is deeply detailed in the following section, along with the remaining evaluation metrics.
C. Evaluation Methods We used the data obtained from the last four months to
evaluate our both experimental setups (where 506873 services emerged). Firstly, we present two error measurements which were employed to evaluate our output: one from the literature and another from our own specifically adapted to our current problem. Secondly, we detail the two performance metrics used to evaluate our recommendation models.
Consider 𝑅 = 𝑅 , , 𝑅 , , … , 𝑅 , to be a discrete time series (aggregation period of P-minutes) with the number of services predicted for a taxi stand of interest 𝒌 in the period 𝟏, 𝒕 and 𝑋 = 𝑋 , , 𝑋 , , … , 𝑋 , the number of services actually emerged in the same conditions. The (1) Symmetric Mean Percentage Error (sMAPE) [25] is a well-known metric to evaluate the success of time series forecast models. However, this metric can be too intolerant with small magnitude errors (e.g. if two services are predicted on a given
period for a taxi stand of interest but no one actually emerges, the error within that period would be 1). Then, we propose to also use an adapted version of Normalized Mean Absolute Error [13].
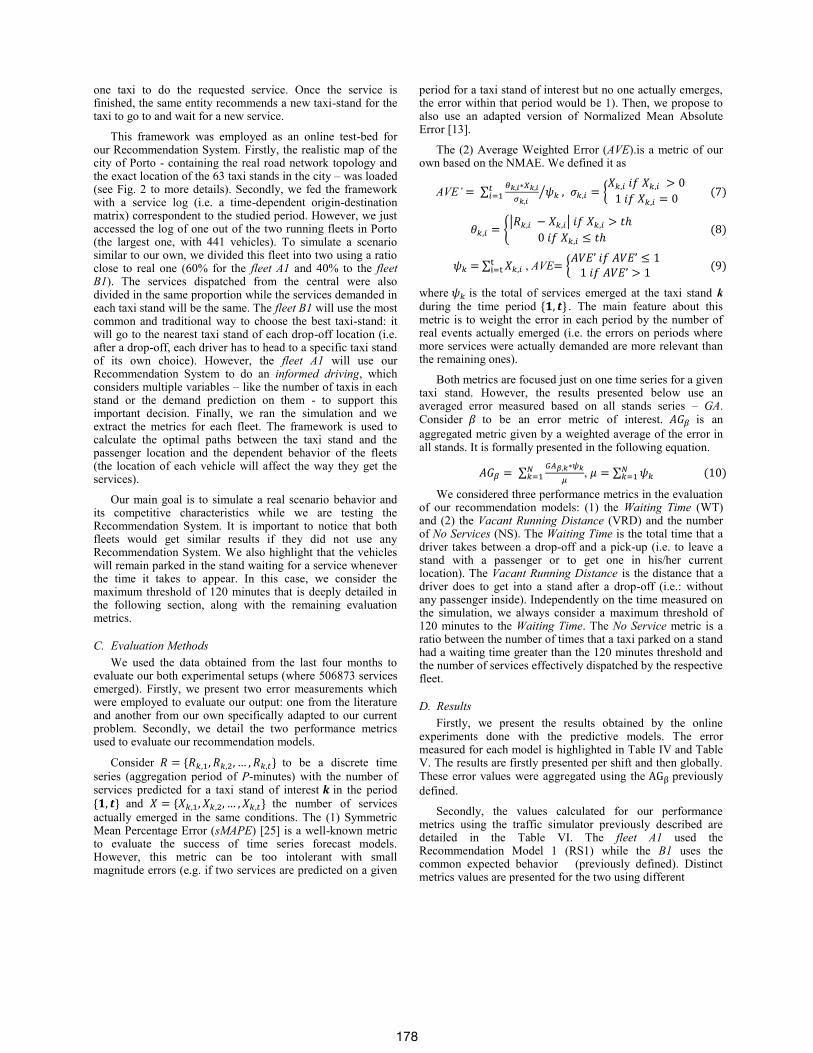
The (2) Average Weighted Error (AVE).is a metric of our own based on the NMAE. We defined it as
AVE’ = ∑ , ∗ ,
, 𝜓 , 𝜎 , =
𝑋 , 𝑖𝑓 𝑋 , > 01 𝑖𝑓 𝑋 , = 0 (7)
𝜃 , =𝑅 , − 𝑋 , 𝑖𝑓 𝑋 , > 𝑡ℎ
0 𝑖𝑓 𝑋 , ≤ 𝑡ℎ (8)
𝜓 = ∑ 𝑋 , , AVE= 𝐴𝑉𝐸’ 𝑖𝑓 𝐴𝑉𝐸’ ≤ 11 𝑖𝑓 𝐴𝑉𝐸’ > 1 (9)
where 𝜓 is the total of services emerged at the taxi stand k during the time period 𝟏, 𝒕 . The main feature about this metric is to weight the error in each period by the number of real events actually emerged (i.e. the errors on periods where more services were actually demanded are more relevant than the remaining ones).
Both metrics are focused just on one time series for a given taxi stand. However, the results presented below use an averaged error measured based on all stands series – GA. Consider 𝛽 to be an error metric of interest. 𝐴𝐺 is an aggregated metric given by a weighted average of the error in all stands. It is formally presented in the following equation.
𝐴𝐺 = ∑ , ∗ , 𝜇 = ∑ 𝜓 (10)
We considered three performance metrics in the evaluation of our recommendation models: (1) the Waiting Time (WT) and (2) the Vacant Running Distance (VRD) and the number of No Services (NS). The Waiting Time is the total time that a driver takes between a drop-off and a pick-up (i.e. to leave a stand with a passenger or to get one in his/her current location). The Vacant Running Distance is the distance that a driver does to get into a stand after a drop-off (i.e.: without any passenger inside). Independently on the time measured on the simulation, we always consider a maximum threshold of 120 minutes to the Waiting Time. The No Service metric is a ratio between the number of times that a taxi parked on a stand had a waiting time greater than the 120 minutes threshold and the number of services effectively dispatched by the respective fleet.
D. Results Firstly, we present the results obtained by the online
experiments done with the predictive models. The error measured for each model is highlighted in Table IV and Table V. The results are firstly presented per shift and then globally. These error values were aggregated using the AG previously defined.
Secondly, the values calculated for our performance metrics using the traffic simulator previously described are detailed in the Table VI. The fleet A1 used the Recommendation Model 1 (RS1) while the B1 uses the common expected behavior (previously defined). Distinct metrics values are presented for the two using different
178

TABLE IV. AVERAGED ERROR MEASURED USING AVE
MODEL
PERIODS 00->08 08->16 16->00 24h
Nr. Of Services Dem. 110972 227993 167908 506873 Poisson Mean 21,28% 24,88% 22,88% 23,43%
W. Poisson Mean 23,32% 28,37% 26,77% 26,74% ARIMA 20,85% 26,12% 22,92% 20,91%
Ensemble 18,98% 24,20% 22,05% 22,35%
TABLE V. AVERAGED ERROR MEASURED USING ASMAPE
MODEL
PERIODS 00->08 08->16 16->00 24h
Nr. Of Services Dem. 110972 227993 167908 506873 Poisson Mean 15,09% 19,20% 17,51% 16,84%
W. Poisson Mean 17,32% 20,66% 19,88% 18,47% ARIMA 16,81% 18,59% 17,85% 18,51%
Ensemble 14,37% 18,18% 17,19% 15,89%
TABLE VI. RECOMMENDATION MODEL PERFORMANCE ANALYSIS
Performance Metrics A1 (RS) B1 (common)
Average WT 38,98 40,84 Median WT 26,29 27,92 Std. Dev. WT 33,79 35,22 Average VRD 3,27 1,06 Median VRD 2,80 0,98
Std. Dev. VRD 2,53 0,54 No Service % 11,08% 19,26%
aggregations like the arithmetic mean (i.e. average), the median and the standard deviation. The No Services ratio is also displayed.
VI. CONCLUSIONS AND FUTURE WORK
In this paper, we present a novel application of time series forecasting techniques to improve the taxi driver mobility intelligence. We did it in three distinct steps: firstly (1) we mined both GPS and event signals emitted by a company operating in Porto, Portugal (where the passenger demand is lower than the vacant taxis). Secondly, we predicted - in a real-time experiment - the distribution of the taxi-passenger demand for the 63 taxi stands at 30-minute period intervals. Finally, we recreated the scenario running in Porto, where two fleets (the fleet A and B, which contain 441 and 250 vehicles, respectively) compete to get as many services as possible. We did it using a traffic simulation framework fed by the real services historical log of the largest operating fleet. One of the fleets used our Recommendation System for the Taxi Stand choice problem while the other one just picked the stand using a baseline model corresponding to the driver common behavior in similar situations.
Our predictive model demonstrated a more than satisfactory performance, anticipating in real time the spatial distribution of the passenger demand with an error of just
20%. We believe that this model is a true novelty and a major contribution to the area through its online adapting characteristics:
It takes advantage of the ubiquitous characteristics of a taxi communicational network, assembling the experience and the knowledge of all vehicles/drivers while they usually use just their own;
It simultaneously uses long-term, mid-term and short term historical data as a learning base;
It rapidly produces real-time short-term predictions of the demand, which can truly improve drivers’ mobility intelligence and consequently, their profit.
This approach meets no parallel in the literature also by its test-bed: the models were tested in a streaming environment, while the state-of-art presents mainly offline experimental setups. Our simulation results demonstrated that an informed driving about the spatiotemporal distribution of the service demand can truly improve the drivers’ mobility intelligence: the fleet A1 had an Average Waiting Time 5% lower than its competitor – even if it has a larger fleet. We also highlight the reduction of the No Service ratio in 50% while the Vacant Running Time faced an increase. It is important to state that this Recommendation System is focused on a Scenario like our own – two or more competitors operating in a medium/large city where the demand is lower than the number of running vehicles. Its main goal is to recommend a stand where a service will rapidly emerge – even if this stand is far away. The idea is to be in a position able to pick-up the emerging service demand before the remaining competition. This factor can provoke a slight increase on the Vacant Running Time but it will also reduce the usually large Waiting Times to pick-up passengers. Other scenarios may require a distinct calibration of the model to account different needs/goals.
Even if these results sound good, we cannot exactly calculate its significance (e.g.: Is it always better to drive more to get a service than wait longer for one?). However, we can sustain that our framework can successfully point out the stands where a service will rapidly emerge for the driver, demonstrating a promising performance on this critical decision variable. Additional simulations will be carried out to evaluate the significance of this test while other Recommendation Systems will also be tested to find the optimal compromise between the distance, the gain and the cost of each taxi stand choice.
ACKNOWLEDGMENTS The authors would like to thank to Geolink and to its team
for the data supplied to this work. We also would like to thank the contributions of the anonymous reviewers to improve this manuscript.
REFERENCES [1] N. Y. C. Taxi and L. Commission, "Taxi of Tomorrow Survey Results,"
ed: New York, 2011. [2] J. Yuan, Y. Zheng, C. Zhang, W. Xie, X. Xie, G. Sun, and Y. Huang,
"T-drive: driving directions based on taxi trajectories," presented at the
179

18th SIGSPATIAL International Conference on Advances in Geographic Information Systems, San Jose, California, 2010.
[3] D. Zhongwei and J. Minhe, "Spatiotemporal structure of taxi services in Shanghai: Using exploratory spatial data analysis," presented at the 19th International Conference on Geoinformatics, 2011.
[4] L. Liu, C. Andris, A. Biderman, and C. Ratti, "Uncovering Taxi Driver’s Mobility Intelligence through His Trace," IEEE Pervasive Computing, 2009.
[5] Y. Yang, Z. Yan, L. Qingquan, and M. Qingzhou, "Mining time-dependent attractive areas and movement patterns from taxi trajectory data," presented at the 17th International Conference on Geoinformatics, 2009.
[6] L. Bin, Z. Daqing, S. Lin, C. Chao, L. Shijian, Q. Guande, and Y. Qiang, "Hunting or waiting? Discovering passenger-finding strategies from a large-scale real-world taxi dataset," presented at the 2011 IEEE International Conference on Pervasive Computing and Communications Workshops, 2011.
[7] L. Junghoon, S. Inhye, and P. Gyung-Leen, "Analysis of the Passenger Pick-Up Pattern for Taxi Location Recommendation," presented at the NCM - 4th International Conference on Networked Computing and Advanced Information Management, 2008.
[8] S. Phithakkitnukoon, M. Veloso, C. Bento, A. Biderman, and C. Ratti, "Taxi-Aware Map: Identifying and Predicting Vacant Taxis in the City," presented at the Ambient Intelligence, 2010.
[9] L. Moreira-Matias, J. Gama, M. Ferreira, and L. Damas, "A Predictive Model for the Passenger Demand on a Taxi Network," presented at the ITSC'2012, Anchorage, Alaska, US, 2012.
[10] A. Ihler, Hutchins, J., Smyth, P., "Adaptive Event Detection with Time-Varying Poisson Processes," presented at the 12th ACM SIGKDD international conference on Knowledge discovery and data mining, Philadelphia, PA, USA, 2006.
[11] G. Box, G. Jenkins, and G. Reinsel, Time series analysis: Holden-day San Francisco, 1976.
[12] L. Junghoon, S. Inhye, and G. Park, "Analysis of the Passenger Pick-Up Pattern for Taxi Location Recommendation," presented at the Conference on Networked Computing and Advanced Information Management, 2008.
[13] X. Li, G. Pan, Z. Wu, G. Qi, S. Li, D. Zhang, W. Zhang, and Z. Wang, "Prediction of urban human mobility using large-scale taxi traces and its applications," Frontiers of Computer Science in China, vol. 6, pp. 111-121, 2012.
[14] A. Kaltenbrunner, R. Meza, J. Grivolla, J. Codina, and R. Banchs, "Urban cycles and mobility patterns: Exploring and predicting trends in a bicycle-based public transport system," Pervasive and Mobile Computing, vol. 6, pp. 455-466, 2010.
[15] H. Chang, Y. Tai, and J. Hsu, "Context-aware taxi demand hotspots prediction," International Journal of Business Intelligence and Data Mining, vol. 5, pp. 3-18, 2010.
[16] C. Holt, "Forecasting seasonals and trends by exponentially weighted moving averages," International Journal of Forecasting, vol. 20, pp. 5-10, 2004.
[17] W. Min and L. Wynter, "Real-time road traffic prediction with spatio-temporal correlations," Transportation Research Part C: Emerging Technologies, vol. 19, pp. 606-616, 2011.
[18] J. Contreras, R. Espinola, F. J. Nogales, and A. J. Conejo, "ARIMA models to predict next-day electricity prices," Power Systems, IEEE Transactions on, vol. 18, pp. 1014-1020, 2003.
[19] H. Wang, W. Fan, P. S. Yu, and J. Han, "Mining concept-drifting data streams using ensemble classifiers," presented at the Proceedings of the 9th ACM SIGKDD international conference on Knowledge discovery and data mining, Washington, D.C., 2003.
[20] M. Ferreira, H. Conceicao, R. Fernandes, and O. Tonguz, "Stereoscopic aerial photography: an alternative to model-based urban mobility approaches," presented at the Proceedings of the 6th ACM international workshop on VehiculAr InterNETworking, Beijing, China, 2009.
[21] A. P. Dawid, "Present position and potential developments: Some personal views: Statistical theory: The prequential approach," Journal of the Royal Statistical Society. Series A (General), pp. 278-292, 1984.
[22] R Development Core Team, R: A Language and Environment for Statistical Computing. Vienna, Austria, 2005.
[23] K. Yeasmin and J. H. Rob. Automatic Time Series Forecasting: The forecast Package for R. Available: http://www.jstatsoft.org/v27/i03/paper
[24] H. Conceição, L. Damas, M. Ferreira, and J. Barros, "Large-scale simulation of V2V environments," in Proceedings of the 2008 ACM symposium on Applied computing, Fortaleza, Ceara, Brazil, 2008, pp. 28-33.
[25] S. Makridakis and M. Hibon, "The M3-Competition: results, conclusions and implications," International Journal of Forecasting, vol. 16, pp. 451-476, 2000.
180