an of america n.a. (india rances) final.pdf · an of america n.a. (india rances) (incorporated in...
TRANSCRIPT
BANK OF AMERICA, N.A.(INDIA BRANCHES)(Incorporated in U.S.A. With Limited Liability)
july 15, 2017 vol LII no 28 EPW Economic & Political Weekly78
INDEPENDENT AUDITORS' REPORTTo The Chief Executive Officer of Bank of America, N.A (India Branches) Report on the Financial Statements1. We have audited the accompanying financial statements of Bank of America N.A. (India Branches) (the “Bank”), which comprise the Balance Sheet as at
March 31, 2017, and the Profit and Loss Account and Cash Flow Statement for the year then ended and a summary of significant accounting policies and other explanatory information, which we have signed under reference to this report.
Management’s Responsibility for the Financial Statements2. The Bank’s Management is responsible for the matters stated in Section 134(5) of the Companies Act, 2013 with respect to preparation of these financial
statements to give a true and fair view of the financial position, financial performance and cash flows of the Bank in accordance with the accounting principles generally accepted in India, including the Accounting Standards specified under Section 133 of the Companies Act, 2013 (“the Act”), read with Rule 7 of the Companies (Accounts) Rules, 2014 and provisions of Section 29 of the Banking Regulation Act, 1949 and circulars and guidelines issued by the Reserve Bank of India (RBI) from time to time as applicable to banks. This responsibility also includes maintenance of adequate accounting records in accordance with the provisions of the Act for safeguarding of the assets of the Bank and for preventing and detecting frauds and other irregularities; selection and application of appropriate accounting policies; making judgments and estimates that are reasonable and prudent; and design, implementation and maintenance of adequate internal financial controls, that were operating effectively for ensuring the accuracy and completeness of the accounting records, relevant to the preparation and presentation of the financial statements that give a true and fair view and are free from material misstatement, whether due to fraud or error.
Auditors’ Responsibility3. Our responsibility is to express an opinion on these financial statements based on our audit. 4. We have taken into account the provisions of the Act and the Rules made thereunder, including the accounting standards, provisions of section 29 of the Banking
Regulation Act, 1949, circulars and guidelines issued by RBI as applicable to banks and matters which are required to be included in the audit report. 5. We conducted our audit in accordance with the Standards on Auditing specified under section 143(10) of the Act and other applicable authoritative
pronouncements issued by the Institute of Chartered Accountants of India. Those Standards require that we comply with ethical requirements and plan and perform the audit to obtain reasonable assurance about whether the financial statements are free from material misstatement.
6. An audit involves performing procedures to obtain audit evidence, about the amounts and disclosures in the financial statements. The procedures selected depend on the auditors’ judgment, including the assessment of the risks of material misstatement of the financial statements, whether due to fraud or error. In making those risk assessments, the auditors consider internal control relevant to the Bank’s preparation and fair presentation of the financial statements in order to design audit procedures that are appropriate in the circumstances. An audit also includes evaluating the appropriateness of accounting policies used and the reasonableness of the accounting estimates made by the Bank’s Management, as well as evaluating the overall presentation of the financial statements.
7. We believe that the audit evidence we have obtained is sufficient and appropriate to provide a basis for our audit opinion on the financial statements. Opinion8. In our opinion, and to the best of our information and according to the explanations given to us, the accompanying financial statements together with the
notes thereon give the information required by provisions of section 29 of the Banking Regulation Act, 1949 as well as the Act and circulars and guidelines issued by the RBI, in the manner so required for banking companies and give a true and fair view in conformity with the accounting principles generally accepted in India of the state of affairs of the Bank as at March 31, 2017 and its profit and its cash flow for the year then ended.
Report on Other Legal and Regulatory Requirements9. In our opinion, the Balance Sheet, the Profit and Loss Account, and the Cash Flow Statement dealt with by this report have been drawn up in accordance
with the provisions of section 29 of the Banking Regulation Act, 1949 read with applicable provisions of section 133 of the Act read with Rule 7 of the Companies (Accounts) Rules, 2014.
10. As required by sub section (3) of section 30 of the Banking Regulation Act, 1949 we report that: a) We have obtained all the information and explanations which, to the best of our knowledge and belief, were necessary for the purpose of our audit
and have found them to be satisfactory. b) The transactions of the Bank, which have come to our notice during the course of our audit, have been within the powers of the Bank. c) During the course of our audit we have visited 3 branches to examine the books of accounts and other records maintained at the branch and performed
other relevant audit procedures. Since the key operations of the Bank are automated with the key applications integrated to the core banking system, the audit is carried out centrally at Mumbai Branch as all the necessary records and data required for the purposes of our audit are available therein.
11. Further, as required by section 143(3) of the Act, we report that: a) We have sought and obtained all the information and explanations which, to the best of our knowledge and belief, were necessary for the purposes of our audit; b) In our opinion, proper books of account as required by law have been kept by the Bank so far as it appears from our examination of those books; c) The Balance Sheet, the Profit and Loss Account and the Cash Flow Statement dealt with by this report are in agreement with the books of account; d) In our opinion, the aforesaid financial statements comply with the Accounting Standards specified under Section 133 of the Act, read with Rule 7 of
the Companies (Accounts) Rules, 2014 to the extent they are not inconsistent with the accounting policies prescribed by RBI; e) The requirements of section 164 (2) of the Companies Act, 2013 are not applicable to the Bank considering it is a branch of Bank of America N.A
which is incorporated with limited liability in the United States of America; f) With respect to the adequacy of the internal financial controls over financial reporting of the Bank and the operating effectiveness of such controls,
refer to our separate Report in “Annexure A”; g) With respect to the other matters to be included in the Auditors’ Report in accordance with Rule 11 of the Companies (Audit and Auditors) Rules,
2014, in our opinion and to the best of our knowledge and belief and according to the information and explanations given to us: i. The Bank has disclosed the impactof pending litigations as at March 31, 2017 on its financial position in its financial statements–Refer Schedule
12 andSchedule 18 - Note (V) (18); ii. The Bank has made provision as at March 31, 2017, as required under the applicable law or accounting standards, for material foreseeable
losses, on long-term contracts including derivative contracts – Refer Schedule 17 and Schedule 18 - Note (V) (5); iii. There were no amounts which were required to be transferred to the Investor Education and Protection Fund by the Bank during the year ended
March 31, 2017; iv. The disclosure requirement as envisaged in Notification G.S.R 308(E) dated 30th March 2017 is not applicable to the Bank - Refer Schedule
18 - Note (V) (44). For Price Waterhouse Chartered Accountants LLP Firm Registration Number: 012754N / N500016 Chartered Accountants
Sd/- Sharad Vasant Place : Mumbai Partner Date : June 22, 2017 Membership Number: 101119

BANK OF AMERICA, N.A.(INDIA BRANCHES)(Incorporated in U.S.A. With Limited Liability)
Economic & Political Weekly EPW july 15, 2017 vol LII no 28 79
Annexure A to Independent Auditors' ReportReferred to in paragraph 11 (f) of the Independent Auditors' Report of even date to the Chief Executive Officer of Bank of America N.A (India Branches) on the financial statements for the year ended March 31, 2017
Report on the Internal Financial Controls under Clause (i) of Sub-section 3 of Section 143 of the Act
1. We have audited the internal financial controls over financial reporting of Bank of America N.A. (India Branches) (“the Bank”) as at March 31, 2017 in conjunction with our audit of financial statements of the Bank for the year ended on that date.
Management’s Responsibility for Internal Financial Controls
2. The Bank’s management is responsible for establishing and maintaining internal financial controls based on the internal control over financial reporting criteria established by the Bank considering the essential components of internal control stated in the Guidance Note on Audit of Internal Financial Controls Over Financial Reporting issued by the Institute of Chartered Accountants of India (ICAI). These responsibilities include the design, implementation and maintenance of adequate internal financial controls that were operating effectively for ensuring the orderly and efficient conduct of its business, including adherence to Bank’s policies, the safeguarding of its assets, the prevention and detection of frauds and errors, the accuracy and completeness of the accounting records, and the timely preparation of reliable financial information, as required under the Act.
Auditors’ Responsibility
3. Our responsibility is to express an opinion on the Bank's internal financial controls over financial reporting based on our audit. We conducted our audit in accordance with the Guidance Note on Audit of Internal Financial Controls Over Financial Reporting (the “Guidance Note”) and the Standards on Auditing deemed to be prescribed under section 143(10) of the Act to the extent applicable to an audit of internal financial controls, both applicable to an audit of internal financial controls and both issued by the ICAI. Those Standards and the Guidance Note require that we comply with ethical requirements and plan and perform the audit to obtain reasonable assurance about whether adequate internal financial controls over financial reporting was established and maintained and if such controls operated effectively in all material respects.
4. Our audit involves performing procedures to obtain audit evidence about the adequacy of the internal financial controls system over financial reporting and their operating effectiveness. Our audit of internal financial controls over financial reporting included obtaining an understanding of internal financial controls over financial reporting, assessing the risk that a material weakness exists, and testing and evaluating the design and operating effectiveness of internal control based on the assessed risk. The procedures selected depend on the auditor’s judgement, including the assessment of the risks of material misstatement of the financial statements, whether due to fraud or error.
5. We believe that the audit evidence we have obtained is sufficient and appropriate to provide a basis for our audit opinion on the Bank’s internal financial controls system overfinancial reporting.
Meaning of Internal Financial Controls Over Financial Reporting
6. A Bank's internal financial control over financial reporting is a process designed to provide reasonable assurance regarding the reliability of financial reporting and the preparation of financial statements for external purposes in accordance with generally accepted accounting principles. A Bank's internal financial control over financial reporting includes those policies and procedures that (1) pertain to the maintenance of records that, in reasonable detail, accurately and fairly reflect the transactions and dispositions of the assets of the Bank; (2) provide reasonable assurance that transactions are recorded as necessary to permit preparation of financial statements in accordance with generally accepted accounting principles, and that receipts and expenditures of the Bank are being made only in accordance with authorisations of management and Chief Executive Officer of the Bank; and (3) provide reasonable assurance regarding prevention or timely detection of unauthorised acquisition, use, or disposition of the Bank's assets that could have a material effect on the financial statements.
Inherent Limitations of Internal Financial Controls Over Financial Reporting
7. Because of the inherent limitations of internal financial controls over financial reporting, including the possibility of collusion or improper management override of controls, material misstatements due to error or fraud may occur and not be detected. Also, projections of any evaluation of the internal financial controls over financial reporting to future periods are subject to the risk that the internal financial control over financial reporting may become inadequate because of changes in conditions, or that the degree of compliance with the policies or procedures may deteriorate.
Opinion
8. In our opinion, the Bank has, in all material respects, an adequate internal financial controls system over financial reporting and such internal financial controls over financial reporting were operating effectively as at March 31, 2017, based on the internal control over financial reporting criteria established by the Bank considering the essential components of internal control stated in the Guidance Note on Audit of Internal Financial Controls Over Financial Reporting issued by the Institute of Chartered Accountants of India.
For Price Waterhouse Chartered Accountants LLP Firm Registration Number: 012754N/N500016 Chartered Accountants
Sd/- Sharad Vasant Place : Mumbai Partner Date : June 22, 2017 Membership Number: 101119
BANK OF AMERICA, N.A.(INDIA BRANCHES)(Incorporated in U.S.A. With Limited Liability)
july 15, 2017 vol LII no 28 EPW Economic & Political Weekly80
Year Ended Year Ended March 31, March 31, 2017 2016 Schedule (Rs. '000) (Rs. '000)
I. INCOME
Interest earned 13 18,253,482 20,249,051
Other income 14 9,561,398 5,747,300
TOTAL 27,814,880 25,996,351
II. EXPENDITURE
Interest expended 15 7,111,884 7,997,392
Operating expenses 16 6,371,388 5,854,209
Provisions and contingencies 17 7,173,027 5,046,041
TOTAL 20,656,299 18,897,642
III. PROFIT
Net profit for the year 7,158,581 7,098,709
Profit brought forward 22,308,603 16,984,571
TOTAL 29,467,184 24,083,280
IV. APPROPRIATIONS
Transfer to Statutory Reserves 1,789,645 1,774,677
Amount retained in India for meeting Capital to Risk- weighted Asset ratio (CRAR) 10,000,000 –
Balance carried over to Balance Sheet 17,677,539 22,308,603
TOTAL 29,467,184 24,083,280
Significant accounting policies and notes to the FinancialStatements 18
Schedules referred to above form an integral part of the Profit and Loss Account
BALANCE SHEET AS AT MARCH 31, 2017
This is the Balance Sheet referred to in our report of even date This is the Profit and Loss Account referred to in our report of even date
For Price Waterhouse Chartered Accountants LLP For BANK OF AMERICA, N.A. (INDIA BRANCHES) Firm Registration No. 012754N/N500016 Sd/- Sd/- Sd/-Sharad Vasant Kaku Nakhate Kumar ShahPartner Chief Executive Officer Chief Financial OfficerMembership Number: 101119
Mumbai: June 22, 2017 Mumbai: June 22, 2017 Mumbai: June 22, 2017
PROFIT AND LOSS ACCOUNT FOR THE YEAR ENDED MARCH 31, 2017
As at As at March 31, March 31, 2017 2016 Schedule (Rs. '000) (Rs. '000)
CAPITAL AND LIABILITIES
Capital 1 9,853,492 9,853,492
Reserves and Surplus 2 62,541,202 55,382,621
Deposits 3 191,514,804 130,386,277
Borrowings 4 12,986,588 114,523,159
Other Liabilities and Provisions 5 71,555,165 43,391,029
TOTAL 348,451,251 353,536,578
ASSETS
Cash and balances with Reserve Bank of India 6 11,603,391 8,620,135
Balances with banks and money at call and short notice 7 64,733,051 15,169,467
Investments 8 76,171,038 159,522,829
Advances 9 136,507,736 123,463,754
Fixed Assets 10 1,073,825 725,474
Other Assets 11 58,362,210 46,034,919
TOTAL 348,451,251 353,536,578
Contingent Liabilities 12 3,567,403,882 3,761,585,367
Bills for Collection 217,745,724 181,621,098
Significant accounting policies and notes to the Financial Statements 18
Schedules referred to above form an integral part of the Balance Sheet
BANK OF AMERICA, N.A.(INDIA BRANCHES)(Incorporated in U.S.A. With Limited Liability)
Economic & Political Weekly EPW july 15, 2017 vol LII no 28 81
Year Ended Year EndedPARTICULARS March 31, 2017 March 31, 2016
(Rs. '000) (Rs. '000)
Cash flow from operating activities Net profit before taxation 13,228,842 12,003,310
Adjustments for: Depreciation 246,490 204,688 Loss on sale of fixed assets 53,441 1,239 Other (write backs) provisions (274,400) 275,000 Provisions for unhedged foreign currency exposure 274,765 (86,804) Provision for Non Performing Assets / (Writeback of provision) 1,100,000 (46,756) Provision for leave enchashment and sick leave 22,889 24,771 Provision for gratuity 34,356 685Provision for Country risk 2,401 –
Operating profit before working capital changes 14,688,784 12,376,133
Adjustments for: (Increase) / Decrease in investments 83,351,791 (20,656,147)(Increase) / Decrease in advances (14,143,982) (30,781,353)(Increase) / Decrease in other assets (13,417,552) (11,257,024)Increase / ( Decrease) in deposits 61,128,527 34,514,176 Increase / (Decrease) in other liabilities and provisions 28,104,126 9,045,183
Cash Generated from Operations 159,711,694 (6,759,033)Less: Taxes Paid (net of refunds received) (4,980,000) (5,186,518)
Net Cash (used in) Operating Activities (A) 154,731,694 (11,945,551)
Cash flow from investing activities Purchase of fixed assets (663,921) (464,464)Proceeds from sale of fixed assets 15,638 16,319
Net Cash (used in) Investing Activities (B) (648,283) (448,145)
Cash flow from Financing Activities Increase in borrowings (net) (101,536,571) 22,423,445
Net Cash generated from Financing Activities (C) (101,536,571) 22,423,445
Net increase in cash and cash equivalents (A+B+C) 52,546,840 10,029,749 Cash and Cash equivalents at the beginning of the year as per Schedule 6 and 7 23,789,602 13,759,853 Cash and Cash equivalents at the end of the year as per Schedule 6 and 7 76,336,442 23,789,602
Net increase in cash and cash equivalents 52,546,840 10,029,749
Notes to the Cash Flow Statement 1) The above cash flow statement has been prepared under "Indirect method" as set out in Accounting Standard-3 "Cash Flow Statements" specified
under Section 133 of the Companies Act, 2013 read with Rule 7 of the Companies (Accounts) Rules, 2014. 2) Previous year figures have been regrouped and reclassified wherever necessary to conform to current year’s presentation. This is the Cash Flow Statement referred to in our report of even date.
For Price Waterhouse Chartered Accountants LLP For BANK OF AMERICA, N.A. (INDIA BRANCHES) Firm Registration No. 012754N/N500016
Sd/- Sd/- Sd/-Sharad Vasant Kaku Nakhate Kumar ShahPartner Chief Executive Officer Chief Financial OfficerMembership Number: 101119
Mumbai: June 22, 2017 Mumbai: June 22, 2017 Mumbai: June 22, 2017
CASH FLOW STATEMENT FOR THE YEAR ENDED MARCH 31, 2017

BANK OF AMERICA, N.A.(INDIA BRANCHES)(Incorporated in U.S.A. With Limited Liability)
july 15, 2017 vol LII no 28 EPW Economic & Political Weekly82
SCHEDULES FORMING PART OF THE BALANCE SHEET
As at As at March 31, March 31, 2017 2016 (Rs. '000) (Rs. '000)
SCHEDULE 4 - Borrowings I. Borrowings in India i) Reserve Bank of India 450,000 98,400,000 ii) Other Banks – – iii) Other Institutions and Agencies 1,599,922 –
2,049,922 98,400,000
II. Borrowings outside India 10,936,666 16,123,159
TOTAL (I and II) 12,986,588 114,523,159
Secured borrowings in I and II above 2,049,922 98,400,000
SCHEDULE 5 - Other Liabilitiesand Provisions I. Bills payable 629,256 697,101 II. Inter-office adjustments - net 20,724 – III. Interest accrued 654,116 652,006 IV. Deferred Tax Liability [Refer Note 14 - Schedule 18(V)] – 166,379 V. Others [including provisions] [Refer Note 5(iv) - Schedule 18(V)] 70,251,069 41,875,543
TOTAL 71,555,165 43,391,029
SCHEDULE 6 - Cash and Balances with Reserve Bank of India I. Cash in hand (including foreign currency notes) 25,542 46,293 II. Balances with Reserve Bank of India (i) In Current account 11,577,849 8,573,842 (ii) In Other accounts – –
TOTAL (I and II) 11,603,391 8,620,135
SCHEDULE 7 - Balances with Banks and Money at Call and Short Notice I. In India i) Balances with banks a) In Current accounts 82,928 123,401 b) In Other deposit accounts – – ii) Money at call and short notice a) with banks 25,000,000 – b) with other institutions 34,524,732 14,131,135
TOTAL (i and ii) 59,607,660 14,254,536
II. Outside India i) In Current accounts 5,125,391 914,931 ii) In Other deposit accounts – – iii) Money at call and short notice – – 5,125,391 914,931
TOTAL (I and II) 64,733,051 15,169,467
As at As at March 31, March 31, 2017 2016 (Rs. '000) (Rs. '000)
SCHEDULE 1 - Capital I. Deposit kept with Reserve Bank of India under Section 11(2)(b)(ii) of the Banking Regulation Act, 1949. 15,100,000 13,358,600 II. Amount brought in as start-up capital 2,000 2,000 Tier I Capital augmented by Head Office 9,851,492 9,851,492 TOTAL 9,853,492 9,853,492 Note: Capital infused during the year:Rs. Nil (Previous Year Rs. Nil) SCHEDULE 2 - Reserves and Surplus I. Statutory Reserves Opening balance 14,710,561 12,935,884 Add: Transfer from Profit and Loss Account 1,789,645 1,774,677 16,500,206 14,710,561 II. Capital Reserves Opening balance 3,457,657 3,457,657 Add: Transfer from Profit and Loss Account – – 3,457,657 3,457,657 III. Amount Retained in India for meeting Capital to Risk-Weighted Asset Ratio (CRAR) Opening balance 14,875,501 14,875,501 Add: Transfer from Profit and Loss Account 10,000,000 – 24,875,501 14,875,501 IV. Investment Reserve Account Opening balance 30,299 30,299 Add: Transfer from Profit and Loss Account – – 30,299 30,299 V. Balance in Profit and Loss Account 17,677,539 22,308,603 TOTAL (I, II, III, IV and V) 62,541,202 55,382,621 SCHEDULE 3 - Deposits A. I. Demand Deposits i) From Banks 4,529,597 3,107,179 ii) From Others 73,563,119 58,442,960 II. Savings Bank Deposits 965,578 886,776 III. Term Deposits i) From Banks – – ii) From Others 112,456,510 67,949,362 TOTAL (I, II and III) 191,514,804 130,386,277 B. i) Deposits of Branches in India 191,514,804 130,386,277 ii) Deposits of Branches outside India – – TOTAL 191,514,804 130,386,277

BANK OF AMERICA, N.A.(INDIA BRANCHES)(Incorporated in U.S.A. With Limited Liability)
Economic & Political Weekly EPW july 15, 2017 vol LII no 28 83
As at As at March 31, March 31, 2017 2016 (Rs. '000) (Rs. '000)
SCHEDULE 10 - Fixed Assets I. Premises – – II. Other Fixed Assets (including Furniture and Fixtures)* At Cost on March 31 of preceding year 1,594,672 1,510,110 Additions during the year 953,510 150,687 2,548,182 1,660,797 Deductions during the year 569,251 66,124 1,978,931 1,594,673 Accumulated depreciation/ amortization 932,411 1,186,093 1,046,520 408,580 Capital Work in Progress 27,305 316,894 1,073,825 725,474 TOTAL (I and II) 1,073,825 725,474 *[Refer Note 17- Schedule 18(V)] SCHEDULE 11 - Other Assets I. Interest Accrued 2,934,687 3,899,569 II. Advance tax and tax deducted at source 1,057,120 3,103,422 [net of Provision for taxation of Rs. 53,179,205 thousand (Previous Year Rs. 46,105,451 thousand)]III. Inter-office adjustments - net – 265,950 IV. Deferred tax assets [Refer Note 14 - Schedule 18(V)] 837,114 – V. Others [Refer Note 5(iv) - Schedule 18(V)] 53,533,289 38,765,978
TOTAL 58,362,210 46,034,919SCHEDULE 12 - Contingent Liabilities I. Claims against the Bank not acknowledged as Debts 2,093,763 1,571,180 (including tax related matters) II. Liability for partly paid investments – – III. Liability on account of outstanding forward exchange contracts 2,045,833,294 2,132,412,503 IV. Liability on account of outstanding derivative contracts 1,477,588,410 1,583,455,634 V. Guarantees given on behalf of constituents (a) in India 19,162,963 18,673,745 (b) outside India 4,883,234 3,994,911 VI. Acceptances, endorsements and other obligations 4,010,234 5,806,379 VII. Other items for which the Bank is contingently liable – Committed Lines of credit 13,603,942 15,304,004 – Capital Commitments 82,373 250,643 – Depositor Education and Awareness Fund (DEAF) [Refer Note 38 - Schedule 18(V)] 145,669 116,368
TOTAL 3,567,403,882 3,761,585,367
SCHEDULES FORMING PART OF THE BALANCE SHEET
As at As at March 31, March 31, 2017 2016 (Rs. '000) (Rs. '000)
SCHEDULE 8 - Investments I. Investments in India (i) Government securities* 75,934,983 149,853,290 (ii) Other approved securities – – (iii) Shares – 600 (iv) Debentures and bonds – – (v) Subsidiaries and/or joint ventures – – (vi) Others (including Certificate of Deposits) 236,055 9,668,939 Gross Investments 76,171,038 159,522,829 Less: Provision for depreciation – –
76,171,038 159,522,829
II. Investments outside India – –
TOTAL (I and II) 76,171,038 159,522,829
* Includes securities of Face Value Rs. 17,400,000,000/- deposited with Clearing Corporation of India Limited (CCIL) as margin deposit (Previous Year: Rs. 3,500,000,000/-), Rs. 462,360,000/- pledged with Reserve Bank of India for funds borrowed under liquidity adjustment facility/marginal standing facility (Previous year: Rs. 102,336,000,000/-) and securities dealt in the repo market through CCIL Rs. 1,564,000,000/- (Previous year : Rs. NIL)
SCHEDULE 9 - Advances A. (i) Bills purchased and discounted 42,784,103 41,656,937 (ii) Cash credits, overdrafts and loans repayable on demand 88,183,575 77,209,039 (iii) Term loans 5,540,058 4,597,778
TOTAL 136,507,736 123,463,754
B. (i) Secured by tangible assets (including book debts) 3,905,436 1,628,086 (ii) Covered by Bank/ Government guarantees – – (iii) Unsecured 132,602,300 121,835,668
TOTAL 136,507,736 123,463,754
C. I. Advances in India (i) Priority sector 39,747,771 29,987,957 (ii) Public sector – – (iii) Banks 21,522,781 25,127,774 (iv) Others 75,237,184 68,348,023
136,507,736 123,463,754
II. Advances outside India – –
TOTAL (I and II) 136,507,736 123,463,754

BANK OF AMERICA, N.A.(INDIA BRANCHES)(Incorporated in U.S.A. With Limited Liability)
july 15, 2017 vol LII no 28 EPW Economic & Political Weekly84
Year Ended Year Ended March 31, March 31, 2017 2016 (Rs. '000) (Rs. '000)
SCHEDULE 16 - Operating Expenses
I. Payments to and provisions for employees 3,550,134 3,001,976
II. Rent, taxes and lighting 433,653 571,432
III. Printing and stationery 32,876 38,141
IV. Advertisement and publicity 319 6,572
V. Depreciation on Bank's property 246,490 204,688
VI. Directors' fees, allowances and expenses – –
VII. Auditors' fees and expenses 9,630 10,336
VIII. Law Charges 18,252 15,312
IX. Postages, Telegrams, Telephones, etc 172,373 191,433
X. Repairs and maintenance 231,967 190,573
XI. Insurance 164,405 117,381
XII. Other expenditure [Refer Note 33 and 41 - Schedule 18(V)] 1,511,289 1,506,365
TOTAL 6,371,388 5,854,209
SCHEDULE 17 - Provisions and Contingencies
I. Provision for unhedged foregin currency exposure / (Write-back of provision) 274,765 (86,804)
II. Provision for country risk 2,401 –
III. Provision for Non Performing Assets/(Write-back of provision) 1,100,000 (46,756)
IV. Provision for Taxation [Refer Note 15 - Schedule 18(V)] 7,073,754 4,226,699
V. Deferred tax [Refer Note 14 - Schedule 18(V)] (1,003,493) 678,097
VI. (Write-back of provision)
[Refer Note 15 - Schedule 18(V)] – (195)
VII. Other provisions [including write off of Rs 600 thousands (Previous year Nil)] (274,400) 275,000
TOTAL 7,173,027 5,046,041
Year Ended Year Ended March 31, March 31, 2017 2016 (Rs. '000) (Rs. '000)
SCHEDULE 13 - Interest Earned
I. Interest/discount on advances/bills 9,651,292 9,950,575
II. Income on investments 8,425,769 9,618,807
III. Interest on balances with Reserve Bank of India 36,395 29,226 and other inter-bank funds
IV. Others 140,026 650,443
TOTAL 18,253,482 20,249,051
SCHEDULE 14 - Other Income
I. Commission, exchange and brokerage 751,487 651,754
II. Profit on sale of investments (net) 2,941,444 577,940
III. Profit on revaluation of investments (net) – –
IV. (Loss) on sale of land, buildings and other assets (net) (53,441) (1,239)
V. Profit on exchange / derivative transactions (net) 4,893,711 3,553,042
VI. Miscellaneous Income [Refer Note 42 - Schedule 18(V)] 1,028,197 965,803
TOTAL 9,561,398 5,747,300
SCHEDULE 15 - Interest Expended
I. Interest on deposits 5,095,585 3,889,390
II. Interest on Reserve Bank of India/inter-bank borrowings 347,773 1,174,848
III. Others 1,668,526 2,933,154
TOTAL 7,111,884 7,997,392
SCHEDULES FORMING PART OF THE PROFIT AND LOSS ACCOUNT
BANK OF AMERICA, N.A.(INDIA BRANCHES)(Incorporated in U.S.A. With Limited Liability)
Economic & Political Weekly EPW july 15, 2017 vol LII no 28 85
SCHEDULE 18 – SIGNIFICANT ACCOUNTING POLICIES AND NOTES TO THE FINANCIAL STATEMENTS I) Background The financial statements for the year ended March 31, 2017 comprise the accounts of the India branches of Bank of America, N.A.
(the Bank), which is incorporated in the United States of America with limited liability.II) Basis of preparation The financial statements have been prepared and presented under the historical cost convention on the accrual basis of accounting,
unless otherwise stated and are in accordance with the generally accepted accounting principles in India, statutory provisions prescribed under the Banking Regulation Act, 1949, circulars and guidelines issued by the Reserve Bank of India (RBI) from time to time and Accounting Standards (AS) prescribed under Section 133 of the Companies Act, 2013 read with Rule 7 of the Companies (Accounts) Rules, 2014, Companies (Accounts) Amendment Rules, 2016, Companies (Accounting Standard) Rules, 2006, as amended and other relevant provisions of the Companies Act 2013 and Companies Act, 1956, to the extent applicable and conform to the statutory requirements prescribed by the RBI from time to time and current practices prevailing within the banking industry in India.
The financial statements are presented in Indian Rupees rounded off to the nearest thousand unless otherwise stated.III) Use of Estimates The preparation of financial statements, in conformity with the Generally Accepted Accounting Principles, requires management to
make estimates and assumptions that affect the reported amount of assets, liabilities, revenues and expenses and disclosure of contingent liabilities as at the date of the financial statements. Actual results could differ from those estimates and difference between the actual results and estimates are recognized in the period in which the results are known. Any revision in the accounting estimates is recognized prospectively in the current and future periods.
IV) Significant Accounting Policies 1) Revenue recognition i) Interest income is recognized in the Profit and Loss Account on an accrual basis, except in case of interest on non-performing
advances which is recognized as income upon receipt in accordance with the prudential norms issued by RBI. Interest income on discounted instruments is recognized over the tenor of the instrument on a constant effective yield basis. ii) Commission on guarantees and letters of credit is recognized upon receipt except commission exceeding the rupee
equivalent of USD 50,000, which is recognized on a straight line basis over the life of the contract. 2) Foreign Exchange Transactions Transactions in foreign currency are recorded and translated at exchange rates prevailing on the date of the transaction. Exchange
differences arising on foreign exchange transactions settled during the year are recognized in the Profit and Loss Account. Monetary assets and liabilities denominated in foreign currencies are translated at the balance sheet date at exchange rates
notified by the Foreign Exchange Dealers’ Association of India (FEDAI) and the resulting exchange differences are recognized in the Profit and Loss Account.
Foreign exchange spot and forward contracts outstanding as at the balance sheet date and held for trading, are revalued at rates of exchange notified by FEDAI and the resulting gains / losses are recognized in the Profit and Loss Account.
Foreign exchange forward contracts not intended for trading, which are entered into for establishing the amount of reporting currency required or available at the settlement date of a transaction, and are outstanding at the balance sheet date, are effectively valued at the closing spot rate. Premium / discount arising at the inception of such contracts are amortized in the Profit and Loss Account over the life of the contract.
Contingent liabilities on account of foreign exchange contracts, guarantees and acceptances, endorsements and other obligations denominated in foreign currencies are disclosed at the year-end closing rates of exchange notified by the FEDAI.
3) Derivatives The Bank enters into derivative contracts such as interest rate swaps, cross-currency swaps, currency options, as well as
exchange-traded interest rate futures, currency futures and currency options. All derivative contracts are classified as trading derivatives. Outstanding exchange-traded interest rate futures, currency futures
and currency options are marked-to-market using the closing price of relevant contracts as published by the exchanges / clearing corporation. Margin money deposited with the exchanges is presented under ‘Other Assets’. All other outstanding derivative contracts are valued at the estimated realizable market price (fair value). The resulting gains / losses are recognized in the Profit and Loss Account under ‘Other Income’. The corresponding unrealized gains are presented under ‘Other Assets’ and unrealized losses under ‘Other Liabilities’ on the Balance Sheet.
Fair value is determined by reference to a quoted market price or by using a valuation model. In case the market prices do not appropriately represent the fair value that would be realized for a position or portfolio, valuation adjustments such as market risk close-out costs and bid-offer adjustments are made to arrive at the appropriate fair value. These adjustments are calculated on a portfolio basis and reported as part of the carrying value of the positions being valued, thus reducing trading assets or increasing trading liabilities.
Valuation models, where used, calculate the expected cash flows under terms of the specific contracts, taking into account the relevant market factors viz. interest rates, foreign exchange rates, volatility, prices etc.
SCHEDULES FORMING PART OF THE FINANCIAL STATEMENTS FOR THE YEAR ENDED MARCH 31, 2017

BANK OF AMERICA, N.A.(INDIA BRANCHES)(Incorporated in U.S.A. With Limited Liability)
july 15, 2017 vol LII no 28 EPW Economic & Political Weekly86
The Bank also maintains general provision for standard assets on the current mark-to-market value of the contract, arising on account of derivative and foreign exchange transactions in accordance with the RBI Master circular (DBR.No.BP.BC.2/21.04.048/2015-16 dated July 1, 2015) on prudential norms on income recognition, asset classification and provisioning pertaining to advances.
Any overdue receivables representing positive mark-to-market value of derivative and foreign exchange contracts are treated as non-performing assets, if remaining unpaid for a period of 90 days or more pursuant to the above guidelines.
4) Investments Investments are accounted for in accordance with the RBI Master Circular (DBR No. BP.BC. 6/ 21.04.141 / 2015-16 dated July
1, 2015) on prudential norms for classification, valuation and operation of investment portfolio by banks. Classification Investments are accounted on settlement date basis and are classified as “Held to Maturity” (HTM), “Held for Trading” (HFT)
and “Available for Sale” (AFS) at the time of purchase in accordance with the RBI norms. Under each of these classifications, investments are further categorized as i) Government Securities ii) Other approved securities iii) Shares iv) Debentures and Bonds v) Subsidiaries and/or joint ventures and vi) Others.
Valuation Investments held under HTM classification are carried at acquisition cost. If the acquisition cost is more than the face value,
the premium is amortized over the remaining tenor of the investments. Investments classified under HFT and AFS portfolio are marked-to-market on a monthly basis. Investments classified under HFT and
AFS portfolio are valued as per rates declared by the Primary Dealers Association of India (PDAI) jointly with the Fixed Income Money Market and Derivatives Association of India (FIMMDA) and in accordance with the RBI guidelines. Consequently net depreciation, if any, under each of the classifications in respect of any category mentioned in ‘Schedule 8-Investments’ is provided for in the Profit and Loss Account. The net appreciation, if any, under any classification is ignored, except to the extent of any depreciation provided previously. The book value of the individual securities is not changed consequent to periodic valuation of investments.
Treasury Bills, Commercial Paper and Certificates of Deposit, being discounted instruments, are valued at carrying cost. Cost of investments is based on the weighted average cost method. InvestmentReserveAccount In accordance with the aforesaid Master Circular, in case the provision on account of depreciation in the HFT and AFS categories
is found to be in excess of the required amount, the excess is credited to the Profit and Loss Account and an equivalent amount net of taxes, if any adjusted for transfer to Statutory Reserve as applicable to such excess provision is appropriated to the Investment Reserve Account.
The provision required to be created on account of depreciation in investments in AFS & HFT categories is debited to the Profit and Loss Account and an equivalent amount net of tax benefit, if any and net of consequent reduction in transfer to Statutory Reserves is transferred from the Investment Reserve Account to the Profit and Loss Account, to the extent available.
Transfer between classifications Transfer of investment between classifications is accounted for in accordance with the extant RBI guidelines, as under: a) Transfer from AFS/HFT to HTM is made at the lower of book value or market value at the time of transfer. b) Transfer from HTM to AFS/HFT is made at acquisition price/book value if originally placed in HTM at a discount and
at amortized cost if originally placed in HTM at a premium. c) Transfer from AFS to HFT is made at book value and the related provision for depreciation held, if any, is transferred
to provision for depreciation against the HFT securities and vice-versa. Repo transactions Repo and Reverse Repo transactions are accounted for as secured borrowing and lending transactions in accordance with the
RBI guidelines. Borrowing costs on the repo transactions are accounted as interest expense and revenue on reverse repo transactions are accounted as interest income.
Repo and reverse repo transactions with the RBI under the Liquidity Adjustment Facility and Marginal Standing Facility are also accounted for as secured borrowing and lending transactions.
BrokerageandCommission Brokerage and Commission paid at the time of acquisition of a security is charged to Profit and Loss Account. Brokenperiod interest Broken period interest paid at the time of acquisition of the security is charged to the Profit and Loss Account. 5) Tangible fixed assets and capital work-in-progress: Tangible fixed assets are stated at the original cost of acquisition and related expenses less accumulated depreciation and
accumulated impairment losses, if any. Assets, which are not under active use and held for disposal, are stated at lower of net book value and net realizable value. Capital work-in-progress comprises cost of fixed assets that are not yet ready for their intended use as at the reporting date.
SCHEDULES FORMING PART OF THE FINANCIAL STATEMENTS FOR THE YEAR ENDED MARCH 31, 2017

BANK OF AMERICA, N.A.(INDIA BRANCHES)(Incorporated in U.S.A. With Limited Liability)
Economic & Political Weekly EPW july 15, 2017 vol LII no 28 87
Profit on disposal of properties is recognized in the Profit and Loss Account and an equivalent amount net of taxes, if any adjusted for applicable transfer to Statutory Reserve is appropriated to the Capital Reserve; losses on disposal are recognized in the Profit and Loss Account.
6) Intangible assets
The Company capitalizes intangible assets, where it is reasonably estimated that the intangible asset has an enduring useful life. Intangible assets are recorded at the consideration paid for acquisition of such assets and are carried at cost less accumulated amortization and accumulated impairment losses, if any.
7) Depreciation and amortization:
i) Except for items forming part of (iii) and (iv) below, depreciation on tangible assets is provided, pro-rata for the period of use, by straight line method (SLM), based on management’s estimate of useful lives of the fixed assets as stated in the table below:
Category Useful Life Server, networking and other computer equipment 2 to 5 years Furniture and fixtures 10 years Vehicles 5 years Other equipment (mechanical / electronic) 3 to 6.67 years
ii) The Company has arrived at the above estimates of useful lives based on an internal assessment and technical evaluation and believes that the useful lives stated above represent the best estimate of the period over which it expects to use the assets. With the exception of Furniture and Fittings, the useful lives estimated by the Company as stated in the table above are different from the useful lives prescribed under “Part C” of “Schedule II” of the Companies Act, 2013 Part C.
iii) Assets costing less than the rupee equivalent of USD 2,500 are fully depreciated in the year of purchase.
iv) Leasehold improvements are depreciated over the lease period including the renewal periods, if any. Assets associated with premises taken on lease are depreciated on straight line basis over the lease period or the useful lives stated above, whichever is shorter.
v) Intangible assets are amortized over their useful lives as estimated by the management commencing from the date the asset is available for use as stated in the table below:
Category Useful Life
Software* 2 to 5 years
* Software individually costing less than the rupee equivalent of USD 10,000 is fully amortized in the year of purchase.
8) Impairment of Assets
In accordance with AS-28 on ‘Impairment of Assets’, an asset is considered as impaired when at the balance sheet date, there are indications of impairment and the carrying amount of the asset, or where applicable, the cash generating unit to which the asset belongs, exceeds its recoverable amount (i.e. the higher of the asset’s net selling price and value-in-use). The Bank assesses at each balance sheet date whether there is any indication that an asset may be impaired based on internal/external factors. If any such indication exists, the Bank estimates the recoverable amount of the asset. If such recoverable amount of the asset is less than the carrying amount, the carrying amount is reduced to the recoverable amount and the reduction is recognized as an impairment loss in the Profit and Loss Account.
9) Advances
Advances are classified into performing and non performing advances in accordance with RBI Master Circular (DBR.No.BP.BC.2/21.04.048/2015-16 dated July 1, 2015) on prudential norms on income recognition, asset classification and provisioning pertaining to advances. Further, non-performing assets (NPA) are classified into sub-standard, doubtful and loss assets as per RBI guidelines.
Specific loan loss provisions in respect of non-performing advances are made based on management assessment of the degree of impairment, subject to the minimum provisioning norms laid down by RBI. Interest on non-performing advances is not recognized in the Profit and Loss Account until received.
Advances are stated net of bills re-discounted, specific loan loss provisions and interest-in-suspense for non-performing advances in accordance with the prudential norms.
The Bank also maintains general provisions on standard assets over and above the specific provisions to cover potential credit losses inherent in any loan portfolio.
Provision on standard assets, un-hedged foreign currency exposure of borrowers and country risk exposure is made in accordance with the norms prescribed by the RBI and disclosed under Schedule 5 – ‘Other Liabilities and Provisions’.
SCHEDULES FORMING PART OF THE FINANCIAL STATEMENTS FOR THE YEAR ENDED MARCH 31, 2017
BANK OF AMERICA, N.A.(INDIA BRANCHES)(Incorporated in U.S.A. With Limited Liability)
july 15, 2017 vol LII no 28 EPW Economic & Political Weekly88
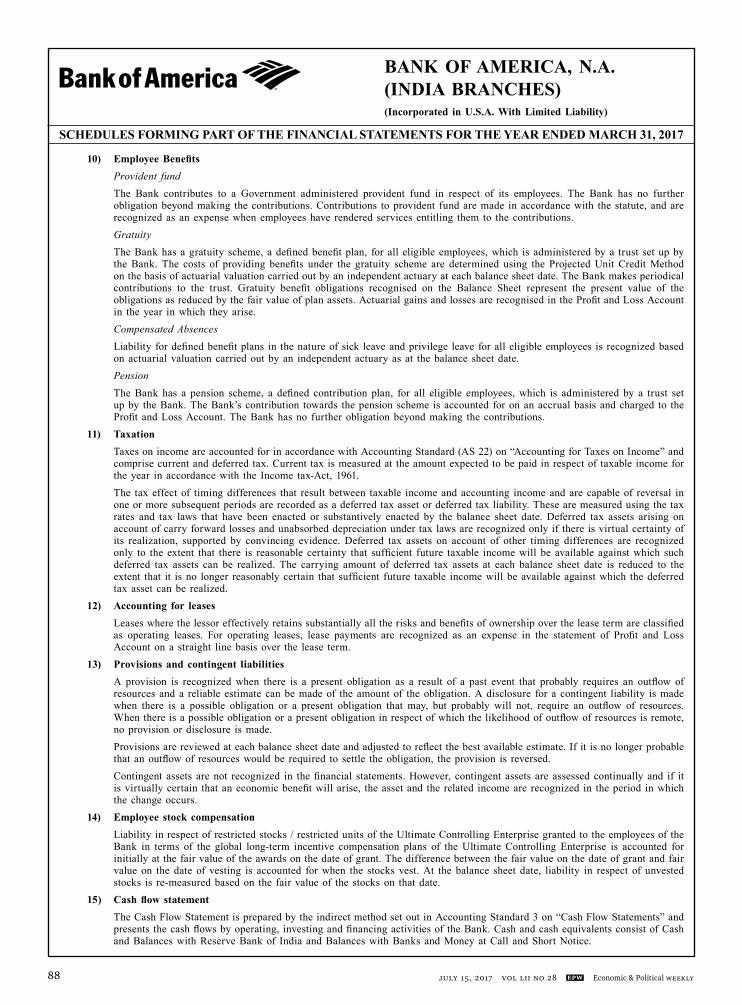
10) Employee Benefits Provident fund The Bank contributes to a Government administered provident fund in respect of its employees. The Bank has no further
obligation beyond making the contributions. Contributions to provident fund are made in accordance with the statute, and are recognized as an expense when employees have rendered services entitling them to the contributions.
Gratuity The Bank has a gratuity scheme, a defined benefit plan, for all eligible employees, which is administered by a trust set up by
the Bank. The costs of providing benefits under the gratuity scheme are determined using the Projected Unit Credit Method on the basis of actuarial valuation carried out by an independent actuary at each balance sheet date. The Bank makes periodical contributions to the trust. Gratuity benefit obligations recognised on the Balance Sheet represent the present value of the obligations as reduced by the fair value of plan assets. Actuarial gains and losses are recognised in the Profit and Loss Account in the year in which they arise.
CompensatedAbsences Liability for defined benefit plans in the nature of sick leave and privilege leave for all eligible employees is recognized based
on actuarial valuation carried out by an independent actuary as at the balance sheet date. Pension The Bank has a pension scheme, a defined contribution plan, for all eligible employees, which is administered by a trust set
up by the Bank. The Bank’s contribution towards the pension scheme is accounted for on an accrual basis and charged to the Profit and Loss Account. The Bank has no further obligation beyond making the contributions.
11) Taxation Taxes on income are accounted for in accordance with Accounting Standard (AS 22) on “Accounting for Taxes on Income” and
comprise current and deferred tax. Current tax is measured at the amount expected to be paid in respect of taxable income for the year in accordance with the Income tax-Act, 1961.
The tax effect of timing differences that result between taxable income and accounting income and are capable of reversal in one or more subsequent periods are recorded as a deferred tax asset or deferred tax liability. These are measured using the tax rates and tax laws that have been enacted or substantively enacted by the balance sheet date. Deferred tax assets arising on account of carry forward losses and unabsorbed depreciation under tax laws are recognized only if there is virtual certainty of its realization, supported by convincing evidence. Deferred tax assets on account of other timing differences are recognized only to the extent that there is reasonable certainty that sufficient future taxable income will be available against which such deferred tax assets can be realized. The carrying amount of deferred tax assets at each balance sheet date is reduced to the extent that it is no longer reasonably certain that sufficient future taxable income will be available against which the deferred tax asset can be realized.
12) Accounting for leases Leases where the lessor effectively retains substantially all the risks and benefits of ownership over the lease term are classified
as operating leases. For operating leases, lease payments are recognized as an expense in the statement of Profit and Loss Account on a straight line basis over the lease term.
13) Provisions and contingent liabilities A provision is recognized when there is a present obligation as a result of a past event that probably requires an outflow of
resources and a reliable estimate can be made of the amount of the obligation. A disclosure for a contingent liability is made when there is a possible obligation or a present obligation that may, but probably will not, require an outflow of resources. When there is a possible obligation or a present obligation in respect of which the likelihood of outflow of resources is remote, no provision or disclosure is made.
Provisions are reviewed at each balance sheet date and adjusted to reflect the best available estimate. If it is no longer probable that an outflow of resources would be required to settle the obligation, the provision is reversed.
Contingent assets are not recognized in the financial statements. However, contingent assets are assessed continually and if it is virtually certain that an economic benefit will arise, the asset and the related income are recognized in the period in which the change occurs.
14) Employee stock compensation Liability in respect of restricted stocks / restricted units of the Ultimate Controlling Enterprise granted to the employees of the
Bank in terms of the global long-term incentive compensation plans of the Ultimate Controlling Enterprise is accounted for initially at the fair value of the awards on the date of grant. The difference between the fair value on the date of grant and fair value on the date of vesting is accounted for when the stocks vest. At the balance sheet date, liability in respect of unvested stocks is re-measured based on the fair value of the stocks on that date.
15) Cash flow statement The Cash Flow Statement is prepared by the indirect method set out in Accounting Standard 3 on “Cash Flow Statements” and
presents the cash flows by operating, investing and financing activities of the Bank. Cash and cash equivalents consist of Cash and Balances with Reserve Bank of India and Balances with Banks and Money at Call and Short Notice.
SCHEDULES FORMING PART OF THE FINANCIAL STATEMENTS FOR THE YEAR ENDED MARCH 31, 2017
BANK OF AMERICA, N.A.(INDIA BRANCHES)(Incorporated in U.S.A. With Limited Liability)
Economic & Political Weekly EPW july 15, 2017 vol LII no 28 89
SCHEDULES FORMING PART OF THE FINANCIAL STATEMENTS FOR THE YEAR ENDED MARCH 31, 2017
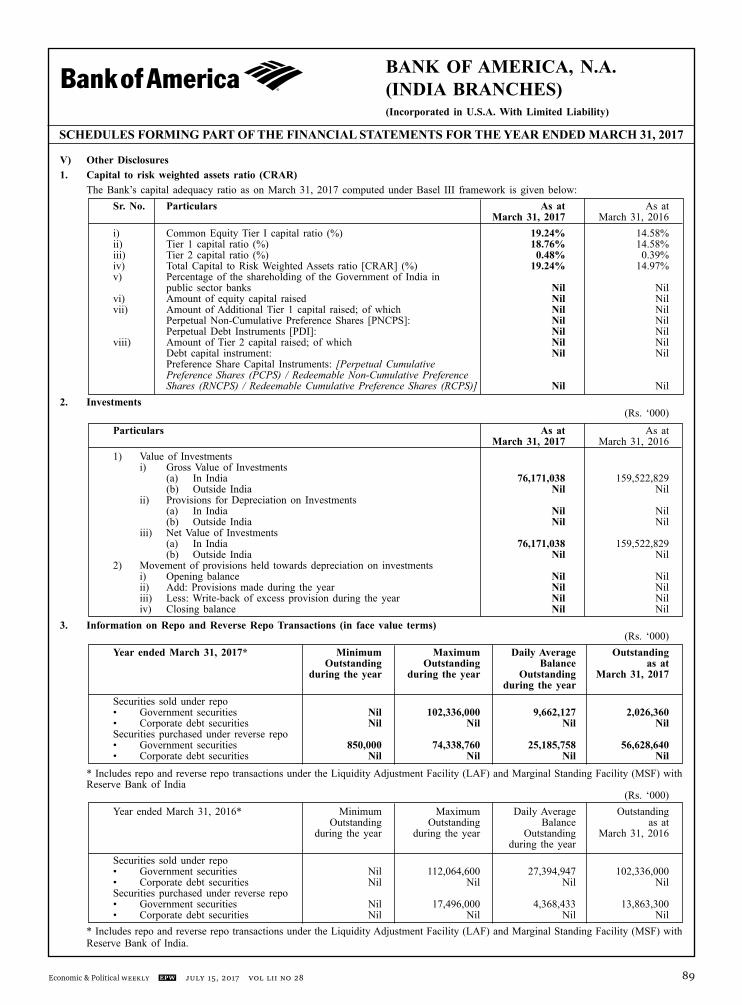
V) Other Disclosures 1. Capital to risk weighted assets ratio (CRAR) The Bank’s capital adequacy ratio as on March 31, 2017 computed under Basel III framework is given below: Sr. No. Particulars As at As at March 31, 2017 March 31, 2016 i) Common Equity Tier I capital ratio (%) 19.24% 14.58% ii) Tier 1 capital ratio (%) 18.76% 14.58% iii) Tier 2 capital ratio (%) 0.48% 0.39% iv) Total Capital to Risk Weighted Assets ratio [CRAR] (%) 19.24% 14.97% v) Percentage of the shareholding of the Government of India in public sector banks Nil Nil vi) Amount of equity capital raised Nil Nil vii) Amount of Additional Tier 1 capital raised; of which Nil Nil Perpetual Non-Cumulative Preference Shares [PNCPS]: Nil Nil Perpetual Debt Instruments [PDI]: Nil Nil viii) Amount of Tier 2 capital raised; of which Nil Nil Debt capital instrument: Nil Nil Preference Share Capital Instruments: [PerpetualCumulative PreferenceShares (PCPS) /RedeemableNon-CumulativePreference Shares (RNCPS) /RedeemableCumulativePreferenceShares (RCPS)] Nil Nil2. Investments (Rs. ‘000)
Particulars As at As at March 31, 2017 March 31, 2016 1) Value of Investments i) Gross Value of Investments (a) In India 76,171,038 159,522,829 (b) Outside India Nil Nil ii) Provisions for Depreciation on Investments (a) In India Nil Nil (b) Outside India Nil Nil iii) Net Value of Investments (a) In India 76,171,038 159,522,829 (b) Outside India Nil Nil 2) Movement of provisions held towards depreciation on investments i) Opening balance Nil Nil ii) Add: Provisions made during the year Nil Nil iii) Less: Write-back of excess provision during the year Nil Nil iv) Closing balance Nil Nil3. Information on Repo and Reverse Repo Transactions (in face value terms) (Rs. ‘000) Year ended March 31, 2017* Minimum Maximum Daily Average Outstanding Outstanding Outstanding Balance as at during the year during the year Outstanding March 31, 2017 during the year Securities sold under repo • Government securities Nil 102,336,000 9,662,127 2,026,360 • Corporate debt securities Nil Nil Nil Nil Securities purchased under reverse repo • Government securities 850,000 74,338,760 25,185,758 56,628,640 • Corporate debt securities Nil Nil Nil Nil * Includes repo and reverse repo transactions under the Liquidity Adjustment Facility (LAF) and Marginal Standing Facility (MSF) with
Reserve Bank of India (Rs. ‘000) Year ended March 31, 2016* Minimum Maximum Daily Average Outstanding Outstanding Outstanding Balance as at during the year during the year Outstanding March 31, 2016 during the year Securities sold under repo • Government securities Nil 112,064,600 27,394,947 102,336,000 • Corporate debt securities Nil Nil Nil Nil Securities purchased under reverse repo • Government securities Nil 17,496,000 4,368,433 13,863,300 • Corporate debt securities Nil Nil Nil Nil * Includes repo and reverse repo transactions under the Liquidity Adjustment Facility (LAF) and Marginal Standing Facility (MSF) with
Reserve Bank of India.
BANK OF AMERICA, N.A.(INDIA BRANCHES)(Incorporated in U.S.A. With Limited Liability)
july 15, 2017 vol LII no 28 EPW Economic & Political Weekly90
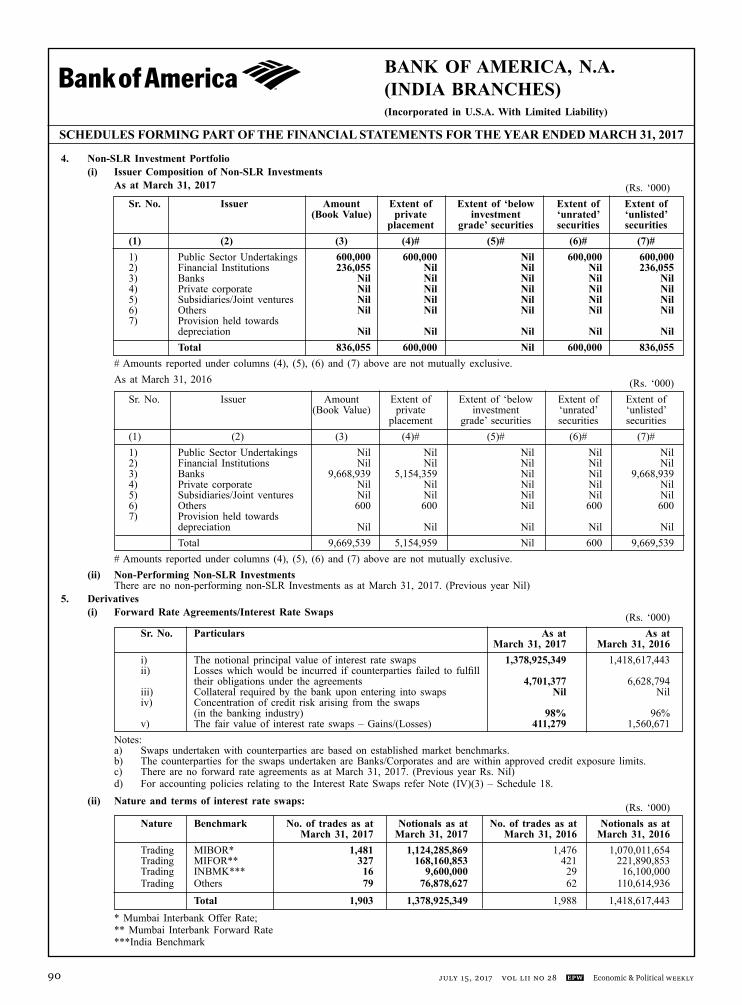
4. Non-SLR Investment Portfolio (i) Issuer Composition of Non-SLR Investments As at March 31, 2017 (Rs. ‘000) Sr. No. Issuer Amount Extent of Extent of ‘below Extent of Extent of (Book Value) private investment ‘unrated’ ‘unlisted’ placement grade’ securities securities securities (1) (2) (3) (4)# (5)# (6)# (7)# 1) Public Sector Undertakings 600,000 600,000 Nil 600,000 600,000 2) Financial Institutions 236,055 Nil Nil Nil 236,055 3) Banks Nil Nil Nil Nil Nil 4) Private corporate Nil Nil Nil Nil Nil 5) Subsidiaries/Joint ventures Nil Nil Nil Nil Nil 6) Others Nil Nil Nil Nil Nil 7) Provision held towards depreciation Nil Nil Nil Nil Nil Total 836,055 600,000 Nil 600,000 836,055 # Amounts reported under columns (4), (5), (6) and (7) above are not mutually exclusive. As at March 31, 2016 (Rs. ‘000) Sr. No. Issuer Amount Extent of Extent of ‘below Extent of Extent of (Book Value) private investment ‘unrated’ ‘unlisted’ placement grade’ securities securities securities (1) (2) (3) (4)# (5)# (6)# (7)# 1) Public Sector Undertakings Nil Nil Nil Nil Nil 2) Financial Institutions Nil Nil Nil Nil Nil 3) Banks 9,668,939 5,154,359 Nil Nil 9,668,939 4) Private corporate Nil Nil Nil Nil Nil 5) Subsidiaries/Joint ventures Nil Nil Nil Nil Nil 6) Others 600 600 Nil 600 600 7) Provision held towards depreciation Nil Nil Nil Nil Nil Total 9,669,539 5,154,959 Nil 600 9,669,539 # Amounts reported under columns (4), (5), (6) and (7) above are not mutually exclusive. (ii) Non-Performing Non-SLR Investments There are no non-performing non-SLR Investments as at March 31, 2017. (Previous year Nil)5. Derivatives (i) Forward Rate Agreements/Interest Rate Swaps (Rs. ‘000) Sr. No. Particulars As at As at March 31, 2017 March 31, 2016 i) The notional principal value of interest rate swaps 1,378,925,349 1,418,617,443 ii) Losses which would be incurred if counterparties failed to fulfill their obligations under the agreements 4,701,377 6,628,794 iii) Collateral required by the bank upon entering into swaps Nil Nil iv) Concentration of credit risk arising from the swaps (in the banking industry) 98% 96% v) The fair value of interest rate swaps – Gains/(Losses) 411,279 1,560,671 Notes: a) Swaps undertaken with counterparties are based on established market benchmarks. b) The counterparties for the swaps undertaken are Banks/Corporates and are within approved credit exposure limits. c) There are no forward rate agreements as at March 31, 2017. (Previous year Rs. Nil) d) For accounting policies relating to the Interest Rate Swaps refer Note (IV)(3) – Schedule 18. (ii) Nature and terms of interest rate swaps: (Rs. ‘000) Nature Benchmark No. of trades as at Notionals as at No. of trades as at Notionals as at March 31, 2017 March 31, 2017 March 31, 2016 March 31, 2016 Trading MIBOR* 1,481 1,124,285,869 1,476 1,070,011,654 Trading MIFOR** 327 168,160,853 421 221,890,853 Trading INBMK*** 16 9,600,000 29 16,100,000 Trading Others 79 76,878,627 62 110,614,936 Total 1,903 1,378,925,349 1,988 1,418,617,443 * Mumbai Interbank Offer Rate; ** Mumbai Interbank Forward Rate ***India Benchmark
SCHEDULES FORMING PART OF THE FINANCIAL STATEMENTS FOR THE YEAR ENDED MARCH 31, 2017

BANK OF AMERICA, N.A.(INDIA BRANCHES)(Incorporated in U.S.A. With Limited Liability)
Economic & Political Weekly EPW july 15, 2017 vol LII no 28 91
(iii) Exchange Traded Interest Rate Derivatives (Rs. ‘000) Sr. No. Particulars As at As at March 31, 2017 March 31, 2016 1) Notional principal amount of exchange traded interest rate derivatives undertaken during the year, – Interest rate futures 198,280,200 256,036,200 2) Notional principal amount of exchange traded interest rate derivatives outstanding as at March 31, – Interest rate futures 950,200 3,013,200 3) Notional principal amount of exchange traded interest rate derivatives outstanding and not "highly effective" NA NA 4) Mark-to-market value of exchange traded interest rate derivatives outstanding and not "highly effective" NA NA (iv) Disclosure on Risk Exposure in Derivatives a. Qualitative Disclosure • The Bank enters into derivative contracts for the purposes of trading and to meet customer requirements to manage their risks. • The Bank has a policy in place for measurement, reporting, monitoring and mitigating credit, market and operational risk. o Credit risk is managed based on the risk profile of the borrower or counterparty, repayment sources and other support
given the current events, conditions and expectations. Credit risk for a derivative contract is sum of the potential future changes in value and the replacement cost, which is the positive mark-to-market value of the contract.
o The Bank uses Value-at-Risk (VaR) modeling and stress testing to measure and manage market risk. Trading limits and VaR are used to manage day-to-day risks and are subject to testing where expected performance is compared to actual performance. All limit excesses are communicated to senior management for review.
o There exists an organizational set up for the management of risk. All lines of business are responsible for the risks within the business including operational risks. Such risks are managed through corporate-wide and/or line of business specific policies and procedures, controls, and monitoring tools.
• Treasury front-office, mid-office and back-office are managed by officials with necessary systems support and clearly defined responsibilities.
• There exist policies for recording derivative transactions, recognition of income, valuation of outstanding contracts, provision-ing and credit risk mitigation. The gains or losses are reported under the head ‘Profit on exchange/derivative transactions’ in the Profit and Loss account. On the Balance Sheet, unrealized gains are reported under “Other Assets” in Schedule 11 and unrealized losses are reported under “Other Liabilities” in Schedule 5. The outstanding amounts in respect of unrealized gains and losses summarized by major product types forming part of “Other Assets” and “Other Liabilities” respectively are as under:
(Rs. ‘000) Particulars As at March 31, 2017 As at March 31, 2016 Asset (+) Liability (-) Asset (+) Liability (-) Forward exchange contracts 42,543,525 (43,404,778) 20,961,033 (21,136,208) Interest rate swap 4,701,377 (4,290,098) 6,628,794 (5,068,123) Cross-currency interest rate swap 1,902,858 (1,548,002) 6,607,372 (6,922,691) Interest rate futures Nil (2,622) 6,697 Nil Currency futures Nil (1,350) Nil (29,399) Options 413,463 (1,229,344) 198,349 (341,851) Total 49,561,223 (50,476,194) 34,402,245 (33,498,272) b. Quantitative Disclosure (Rs. ‘000) Sr. No. Particulars Currency Interest Rate Derivatives* Derivatives** As at As at March 31, 2017 March 31, 2017 1) Derivatives (Notional Principal Amount) a) For hedging Nil Nil b) For trading 97,712,861 1,379,875,549 2) Marked to Market Positions a) Asset (+) 2,316,321 4,701,377 b) Liability (-) (2,778,696) (4,292,720) 3) Credit Exposure# 7,292,979 15,491,680 4) Likely impact of one percentage change in interest rate (100*PV01) *** a) on hedging derivatives Nil Nil b) on trading derivatives 371,593 312,973 5) Maximum and Minimum of 100*PV01 observed during the year *** a) on hedging b) on trading (Maximum) 386,939 745,205 c) on trading (Minimum) 251,315 2,172 The notional principal amount of outstanding foreign exchange contracts classified as trading and hedging as at March 31, 2017
amounted to Rs. 2,045,833,295 thousand and Rs. NIL respectively
SCHEDULES FORMING PART OF THE FINANCIAL STATEMENTS FOR THE YEAR ENDED MARCH 31, 2017

BANK OF AMERICA, N.A.(INDIA BRANCHES)(Incorporated in U.S.A. With Limited Liability)
july 15, 2017 vol LII no 28 EPW Economic & Political Weekly92
* Currency Derivatives include currency futures, cross-currency swaps and currency options. ** Interest Rate Derivatives include interest rate swaps and interest rate futures. *** Absolute values considered. # Credit exposure is computed based on the current exposure method representing the sum of potential future exposure and
positive mark-to-market value of contracts (Rs. ‘000)
Sr. No. Particulars Currency Interest Rate Derivatives* Derivatives** As at As at March 31, 2016 March 31, 2016
1) Derivatives (Notional Principal Amount) a) For hedging Nil Nil b) For trading 161,824,991 1,421,630,643 2) Marked to Market Positions a) Asset (+) 6,805,721 6,635,491 b) Liability (-) (7,293,941) (5,068,123) 3) Credit Exposure# 14,031,601 17,268,153 4) Likely impact of one percentage change in interest rate (100*PV01) *** a) on hedging derivatives Nil Nil b) on trading derivatives 258,044 444,267 5) Maximum and Minimum of 100*PV01 observed during the year *** a) on hedging b) on trading (Maximum) 506,252 756,242 c) on trading (Minimum) 148,787 7,049
The notional principal amount of outstanding foreign exchange contracts classified as trading and hedging as at March 31, 2016 amounted to Rs. 2,118,369,138 thousand and Rs. 14,043,365 thousand respectively.
* Currency Derivatives include currency futures, cross-currency swaps and currency options. ** Interest Rate Derivatives include interest rate swaps and interest rate futures. *** absolute values considered. # Credit exposure is computed based on the current exposure method representing the sum of potential future exposure and
positive mark-to-market value of contracts6. Asset quality (i) Non Performing Assets (Funded) (Rs. ‘000)
Sr. No. Item As at As at March 31, 2017 March 31, 2016
1) Net NPAs to Net Advances (%) Nil Nil 2) Movement of NPAs (Gross) (a) Opening balance Nil 144,838 (b) Additions during the year 1,100,000 Nil (c) Reductions during the year Nil 144,838 (d) Closing balance 1,100,000 Nil 3) Movement of Net NPAs (a) Opening balance Nil 98,082 (b) Additions during the year Nil Nil (c) Reductions during the year (recoveries) Nil 98,082 (d) Closing balance Nil Nil 4) Movement of provisions for NPAs (excluding provisions on standard assets) (a) Opening balance Nil 46,756 (b) Provisions made during the year 1,100,000 Nil (c) Write-off Nil Nil (d) Write-back of excess provisions Nil 46,756 (e) Closing balance 1,100,000 Nil
SCHEDULES FORMING PART OF THE FINANCIAL STATEMENTS FOR THE YEAR ENDED MARCH 31, 2017

BANK OF AMERICA, N.A.(INDIA BRANCHES)(Incorporated in U.S.A. With Limited Liability)
Economic & Political Weekly EPW july 15, 2017 vol LII no 28 93
6
(ii)
Part
icul
ars o
f acc
ount
s res
truc
ture
d
SCH
ED
UL
ES
FOR
MIN
G P
AR
T O
F T
HE
FIN
AN
CIA
L ST
AT
EM
EN
TS
FO
R T
HE
YE
AR
EN
DE
D M
AR
CH
31,
201
7
Rs.
cror
e
Sr
Ty
pe o
f Res
truc
turi
ng
U
nder
CD
R M
echa
nism
U
nder
SM
E D
ebt
Oth
ers
To
tal
N
o
Res
truc
turi
ng M
echa
nism
Ass
et C
lass
ifica
tion
Stan
d-
Sub-
D
oubt
- Lo
ss
Tota
l St
and-
Su
b-
Dou
bt-
Loss
To
tal
Stan
d-
Sub-
D
oubt
ful
Loss
To
tal
Stan
d-
Sub-
D
oubt
ful
Loss
To
tal
ard
Stan
d-
ful
ard
Stan
d-
ful
ard
Stan
d-
ar
d St
and-
D
etai
ls
ar
d
ar
d
ar
d
ar
d
1 Re
struc
ture
d N
o. of
bor
row
ers
– –
– –
– –
– –
– –
– –
– –
– –
– –
– –
Acc
ount
s as o
n A
mou
nt ou
tstan
ding
–
– –
– –
– –
– –
– –
– –
– –
– –
– –
–
1s
t Apr
il, 20
16
Prov
ision
ther
eon
– –
– –
– –
– –
– –
– –
– –
– –
– –
– –
2
Fr
esh r
e-str
uctu
ring
No.
of b
orro
wer
s –
–
–
–
–
–
–
–
–
–
–
1 –
–
1
–
1 –
– 1
durin
g the
fina
ncial
A
mou
nt ou
tstan
ding
–
–
–
–
–
–
–
–
–
–
–
110.
00
–
–
110.
00
–
110.
00
– –
110.
00
ye
ar 20
16-1
7 Pr
ovisi
on th
ereo
n –
–
–
–
–
–
–
–
–
–
–
110.
00
–
–
110.
00
–
110.
00
– –
110.
00
3 U
pgra
datio
n N
o. of
borro
wer
s –
–
–
–
–
–
–
–
–
–
–
–
–
–
–
–
–
–
–
–
to re
struc
ture
d A
mou
nt ou
tstan
ding
–
–
–
–
–
–
–
–
–
–
–
–
–
–
–
–
–
–
–
sta
ndar
d cat
egor
y Pr
ovisi
on th
ereo
n –
–
–
–
–
–
–
–
–
–
–
–
–
–
–
–
–
–
–
–
durin
g the
fina
ncia
l
ye
ar 20
16-1
7
4
Restr
uctu
red
No.
of b
orro
wer
s –
–
–
–
–
–
–
–
sta
ndar
d adv
ance
s
w
hich
ceas
e to a
ttrac
t A
mou
nt ou
tstan
ding
–
–
–
–
–
–
–
–
high
er pr
ovisi
onin
g
and/
or ad
ditio
nal
Prov
ision
ther
eon
–
–
–
–
–
–
–
–
risk w
eigh
t at t
he en
d
of th
e yea
r and
henc
e
ne
ed no
t be s
how
n as
restr
uctu
red s
tand
ard
adva
nces
at th
e
be
ginn
ing o
f the
ne
xt ye
ar
5
Dow
n gra
datio
ns
No.
of b
orro
wer
s –
–
–
–
–
–
–
–
–
–
–
–
–
– –
– –
– –
of re
struc
tured
acco
unts
Am
ount
outst
andi
ng
–
–
–
–
–
–
–
–
–
–
–
–
du
ring t
he fi
nanc
ial
Prov
ision
ther
eon
–
–
–
–
–
–
–
–
–
–
–
– –
–
–
–
–
–
–
–
ye
ar 20
16-1
7
6
W
rite-
offs
of
No.
of b
orro
wer
s –
–
–
–
–
–
–
–
–
–
–
–
– –
– –
– –
– –
re
struc
ture
d acc
ount
s A
mou
nt ou
tstan
ding
–
–
–
–
–
–
–
–
–
–
–
–
–
– –
– –
– –
–
durin
g the
fina
ncia
l Pr
ovisi
on th
ereo
n –
–
–
–
–
–
–
–
–
–
–
–
–
–
–
–
–
–
– –
year
2015
-16
7
Restr
uctu
red
No.
of b
orro
wer
s –
– –
– –
– –
– –
– –
1 –
1
– 1
– –
1
Acc
ount
s as o
n A
mou
nt ou
tstan
ding
–
– –
– –
– –
– –
– –
110.
00
–
110.
00
– 11
0.00
–
– 11
0.00
3
1st M
arch
, 201
7 Pr
ovisi
on th
ereo
n –
– –
– –
– –
– –
– –
110.
00
–
110.
00
– 11
0.00
–
– 11
0.00
For p
revi
ous y
ear e
nded
Mar
ch 31
, 201
6, th
e Ban
k di
d no
t hav
e any
acco
unts
that
wer
e sub
ject
to re
stru
ctur
ing
and
acco
rdin
gly
the d
isclo
sure
s wer
e not
appl
icab
le.

BANK OF AMERICA, N.A.(INDIA BRANCHES)(Incorporated in U.S.A. With Limited Liability)
july 15, 2017 vol LII no 28 EPW Economic & Political Weekly94
(iii) Details of financial assets sold to Securitization/ Reconstruction Company for Asset Reconstruction No Financial assets were sold to Securitization/Reconstruction Company for asset reconstruction during the current year or the previous year. (iv) Details of non-performing financial assets purchased/sold There were no non-performing financial assets that were purchased or sold during the current year or the previous year. (v) Provision on standard assets (Rs. ‘000) Particulars As at As at March 31, 2017 March 31, 2016 Provision on standard assets 767,415 767,415
7. Business Ratios Sr. No. Particulars For the year ended For the year ended March 31, 2017 March 31, 2016 a) Interest income as a percentage to working funds* 5.91% 7.35% b) Non-interest income as a percentage to working funds* 3.09% 2.09% c) Operating Profit as a percentage to working funds* 4.65% 4.41% d) Return on assets@ 2.32% 2.58% e) Business (Deposits plus Advances) per employee (Rs. ‘000)# 717,279 576,420 f) Profit per employee (Rs. ‘000) 15,873 16,319
* Working funds are the average of total assets as reported to RBI in Form X under Section 27 of the Banking Regulation Act, 1949 during the twelve months of the financial year
@ Return on assets computed with reference to working funds as described above. # For the purpose of Business (Deposits plus Advances) per employee, inter-bank deposits are excluded.8. Asset Liability Management Maturity Pattern of certain items of assets and liabilities (Rs. Crores) As at March 31, 2017 Advances Investments Deposits Borrowings Foreign Foreign Currency Currency Assets Liabilities Day 1 465 3,315 2,693 210 – 54 2 to 7 days 1,363 – 2,201 – 56 54 8 to 14 days 647 – 891 – 109 54 15 to 30 days 1,778 1,191 1,030 110 140 110 31 days and upto 2 months 2,029 265 569 979 654 979 Over 2 months and upto 3 months 2,023 394 494 – 1,178 – Over 3 months and upto 6 months 1,832 255 1,487 – 993 – Over 6 months and upto 1 year 1,505 647 2,744 – 8 – Over 1 year and upto 3 years 1,918 1,210 7,039 – – 1,316 Over 3 years and upto 5 years 90 340 3 – – – Over 5 Years and upto 7 years – – – – – – Over 7 Years and upto 10 years – – – – – – Over 10 Years and upto 15 years – – – – – – Over 15 Years – – – – – – Total 13,650 7,617 19,151 1,299 3,138 2,567 Note: Foreign currency assets include balances in respect of advances and overseas lending. Foreign currency liabilities include
balances in respect of deposits and borrowings. (Rs. Crores) As at March 31, 2016 Advances Investments Deposits Borrowings Foreign Foreign Currency Currency Assets Liabilities Day 1 292 2,925 309 104 3 115 2 to 7 days 1,547 7,406 2,230 7,417 124 70 8 to 14 days 754 2,415 965 2,440 5 53 15 to 30 days 1,509 797 601 – 391 – 31 days and upto 2 months 1,352 151 643 166 34 166 Over 2 months and upto 3 months 1,058 276 380 – 463 – Over 3 months and upto 6 months 2,461 65 293 – 868 – Over 6 months and upto 1 year 1,446 639 2,090 1,325 35 1,325 Over 1 year and upto 3 years 1,669 1,178 5,512 – – 1,166 Over 3 years and upto 5 years 258 80 16 – – – Over 5 Years and upto 7 years – 20 – – – – Over 7 Years and upto 10 years – – – – – – Over 10 Years and upto 15 years – – – – – – Over 15 Years – – – – – – Total 12,346 15,952 13,039 11,452 1,923 2,895 Note: Foreign currency assets include balances in respect of advances and overseas lending. Foreign currency liabilities include
balances in respect of deposits and borrowings.
SCHEDULES FORMING PART OF THE FINANCIAL STATEMENTS FOR THE YEAR ENDED MARCH 31, 2017

BANK OF AMERICA, N.A.(INDIA BRANCHES)(Incorporated in U.S.A. With Limited Liability)
Economic & Political Weekly EPW july 15, 2017 vol LII no 28 95
9. Exposures (i) Exposure to Real Estate Sector (Rs.’000)
Category As at As at March 31, 2017 March 31, 2016 Direct Exposure i) Residential Mortgages Lending fully secured by mortgages on residential property that is or will be occupied by the borrower or that is rented; 1,849 2,102 ii) Commercial Real Estate Lending secured by mortgages on commercial real estates (office buildings, retail space, multi-purpose commercial premises, multi-family residential buildings, multi-tenanted commercial premises, industrial or warehouse space, hotels, land acquisition, development and construction, etc.). Exposure would also include non-fund based (NFB) limits; Nil Nil iii) Investment in mortgage backed securities(MBS) and other securitized exposures a. Residential, b. Commercial Real Estate. Nil Nil Indirect Exposure Fund based and non-fund based exposures to National Housing Bank and Housing Finance Companies 1,411,324 7,323,141
Total Exposure to Real Estate Sector 1,413,173 7,325,243
(ii) Exposure to Capital Market (Rs. ‘000)
Sr. No. Particulars As at As at March 31, 2017 March 31, 2016 1) Direct investment in equity shares, convertible bonds, convertible debentures and units of equity oriented mutual funds the corpus of which is not exclusively invested in corporate debt; • Investment in equity shares Nil 600 2) Advances against shares/bonds/ debentures or other securities or on clean basis to individuals for investment in shares (including IPOs/ESOPs), convertible bonds, convertible debentures and units of equity oriented mutual funds; Nil Nil 3) Advances for any other purposes where shares or convertible bonds or convertible debentures or units of equity oriented mutual funds are taken as primary security; Nil Nil 4) Advances for any other purposes to the extent secured by the collateral security of shares or convertible bonds or convertible debentures or units of equity oriented mutual funds i.e. where the primary security other than shares/convertible bonds/convertible debentures/units of equity oriented mutual funds does not fully cover the advances; Nil Nil 5) Secured and unsecured advances to stockbrokers and guarantees issued on behalf of stockbrokers and market makers; Nil Nil 6) Loans sanctioned to corporate against the security of shares/ bonds/debentures or other securities or on clean basis for meeting promoter’s contribution to the equity of new companies in anticipation of raising resources; Nil Nil 7) Bridge loans to companies against expected equity flows/issues; Nil Nil 8) Underwriting commitments taken up by the Bank in respect of primary issue of shares or convertible bonds or convertible debentures or units of equity oriented mutual funds; Nil Nil 9) Financing to stockbrokers for margin trading; Nil Nil 10) All exposures to Venture Capital Funds (both registered and unregistered) Nil Nil 11) Non-fund based exposure in the nature of guarantees 351,145 330,000
Total Exposure to Capital Market 351,145 330,600 (iii) Risk Category-wise Country Exposure (Rs. ‘000) Risk Category Exposure (net) Provision held Exposure (net) Provision held as at as at as at as at March 31, 2017 March 31, 2017 March 31, 2016 March 31, 2016 Insignificant 5,315,629 2,401 967,594 Nil Low 92,406 Nil 189,148 Nil Moderate Nil Nil 138,991 Nil High Nil Nil Nil Nil Very High Nil Nil Nil Nil Restricted Nil Nil Nil Nil Off-Credit Nil Nil Nil Nil Total 5,408,035 2,401 1,295,733 Nil
SCHEDULES FORMING PART OF THE FINANCIAL STATEMENTS FOR THE YEAR ENDED MARCH 31, 2017
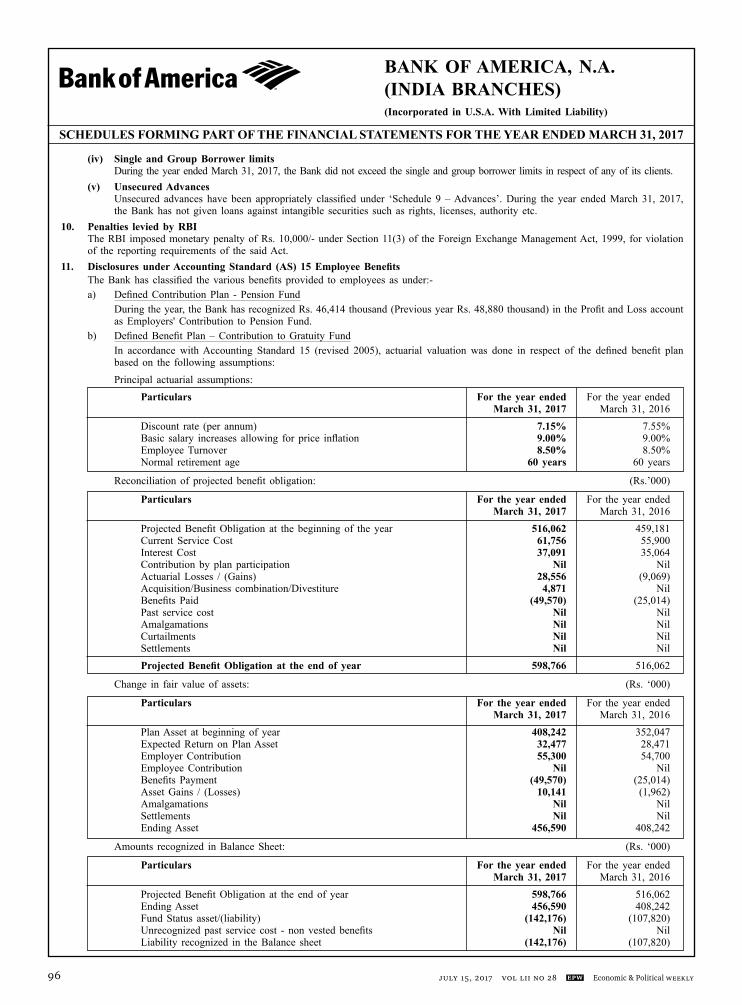
BANK OF AMERICA, N.A.(INDIA BRANCHES)(Incorporated in U.S.A. With Limited Liability)
july 15, 2017 vol LII no 28 EPW Economic & Political Weekly96
SCHEDULES FORMING PART OF THE FINANCIAL STATEMENTS FOR THE YEAR ENDED MARCH 31, 2017
(iv) Single and Group Borrower limits During the year ended March 31, 2017, the Bank did not exceed the single and group borrower limits in respect of any of its clients. (v) Unsecured Advances Unsecured advances have been appropriately classified under ‘Schedule 9 – Advances’. During the year ended March 31, 2017,
the Bank has not given loans against intangible securities such as rights, licenses, authority etc.10. Penalties levied by RBI The RBI imposed monetary penalty of Rs. 10,000/- under Section 11(3) of the Foreign Exchange Management Act, 1999, for violation
of the reporting requirements of the said Act.11. Disclosures under Accounting Standard (AS) 15 Employee Benefits The Bank has classified the various benefits provided to employees as under:- a) Defined Contribution Plan - Pension Fund During the year, the Bank has recognized Rs. 46,414 thousand (Previous year Rs. 48,880 thousand) in the Profit and Loss account
as Employers' Contribution to Pension Fund. b) Defined Benefit Plan – Contribution to Gratuity Fund In accordance with Accounting Standard 15 (revised 2005), actuarial valuation was done in respect of the defined benefit plan
based on the following assumptions: Principal actuarial assumptions: Particulars For the year ended For the year ended March 31, 2017 March 31, 2016 Discount rate (per annum) 7.15% 7.55% Basic salary increases allowing for price inflation 9.00% 9.00% Employee Turnover 8.50% 8.50% Normal retirement age 60 years 60 years
Reconciliation of projected benefit obligation: (Rs.’000)
Particulars For the year ended For the year ended March 31, 2017 March 31, 2016 Projected Benefit Obligation at the beginning of the year 516,062 459,181 Current Service Cost 61,756 55,900 Interest Cost 37,091 35,064 Contribution by plan participation Nil Nil Actuarial Losses / (Gains) 28,556 (9,069) Acquisition/Business combination/Divestiture 4,871 Nil Benefits Paid (49,570) (25,014) Past service cost Nil Nil Amalgamations Nil Nil Curtailments Nil Nil Settlements Nil Nil Projected Benefit Obligation at the end of year 598,766 516,062
Change in fair value of assets: (Rs. ‘000)
Particulars For the year ended For the year ended March 31, 2017 March 31, 2016 Plan Asset at beginning of year 408,242 352,047 Expected Return on Plan Asset 32,477 28,471 Employer Contribution 55,300 54,700 Employee Contribution Nil Nil Benefits Payment (49,570) (25,014) Asset Gains / (Losses) 10,141 (1,962) Amalgamations Nil Nil Settlements Nil Nil Ending Asset 456,590 408,242
Amounts recognized in Balance Sheet: (Rs. ‘000)
Particulars For the year ended For the year ended March 31, 2017 March 31, 2016 Projected Benefit Obligation at the end of year 598,766 516,062 Ending Asset 456,590 408,242 Fund Status asset/(liability) (142,176) (107,820) Unrecognized past service cost - non vested benefits Nil Nil Liability recognized in the Balance sheet (142,176) (107,820)
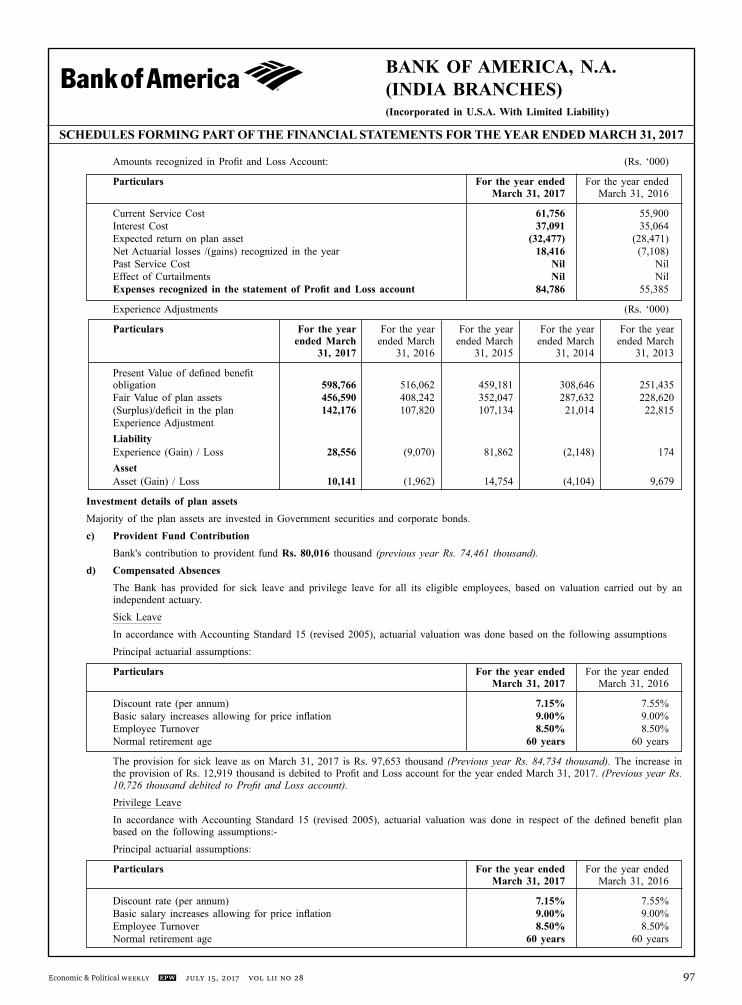
BANK OF AMERICA, N.A.(INDIA BRANCHES)(Incorporated in U.S.A. With Limited Liability)
Economic & Political Weekly EPW july 15, 2017 vol LII no 28 97
SCHEDULES FORMING PART OF THE FINANCIAL STATEMENTS FOR THE YEAR ENDED MARCH 31, 2017
Amounts recognized in Profit and Loss Account: (Rs. ‘000)
Particulars For the year ended For the year ended March 31, 2017 March 31, 2016
Current Service Cost 61,756 55,900 Interest Cost 37,091 35,064 Expected return on plan asset (32,477) (28,471) Net Actuarial losses /(gains) recognized in the year 18,416 (7,108) Past Service Cost Nil Nil Effect of Curtailments Nil Nil Expenses recognized in the statement of Profit and Loss account 84,786 55,385
Experience Adjustments (Rs. ‘000)
Particulars For the year For the year For the year For the year For the year ended March ended March ended March ended March ended March 31, 2017 31, 2016 31, 2015 31, 2014 31, 2013
Present Value of defined benefit obligation 598,766 516,062 459,181 308,646 251,435 Fair Value of plan assets 456,590 408,242 352,047 287,632 228,620 (Surplus)/deficit in the plan 142,176 107,820 107,134 21,014 22,815 Experience Adjustment Liability Experience (Gain) / Loss 28,556 (9,070) 81,862 (2,148) 174 Asset Asset (Gain) / Loss 10,141 (1,962) 14,754 (4,104) 9,679
Investment details of plan assets Majority of the plan assets are invested in Government securities and corporate bonds. c) Provident Fund Contribution Bank's contribution to provident fund Rs. 80,016 thousand (previous yearRs. 74,461 thousand). d) Compensated Absences The Bank has provided for sick leave and privilege leave for all its eligible employees, based on valuation carried out by an
independent actuary. Sick Leave In accordance with Accounting Standard 15 (revised 2005), actuarial valuation was done based on the following assumptions Principal actuarial assumptions:
Particulars For the year ended For the year ended March 31, 2017 March 31, 2016
Discount rate (per annum) 7.15% 7.55% Basic salary increases allowing for price inflation 9.00% 9.00% Employee Turnover 8.50% 8.50% Normal retirement age 60 years 60 years
The provision for sick leave as on March 31, 2017 is Rs. 97,653 thousand (Previous yearRs. 84,734 thousand).The increase in the provision of Rs. 12,919 thousand is debited to Profit and Loss account for the year ended March 31, 2017. (PreviousyearRs.10,726 thousanddebited toProfit andLoss account).
Privilege Leave In accordance with Accounting Standard 15 (revised 2005), actuarial valuation was done in respect of the defined benefit plan
based on the following assumptions:- Principal actuarial assumptions:
Particulars For the year ended For the year ended March 31, 2017 March 31, 2016
Discount rate (per annum) 7.15% 7.55% Basic salary increases allowing for price inflation 9.00% 9.00% Employee Turnover 8.50% 8.50% Normal retirement age 60 years 60 years

BANK OF AMERICA, N.A.(INDIA BRANCHES)(Incorporated in U.S.A. With Limited Liability)
july 15, 2017 vol LII no 28 EPW Economic & Political Weekly98
Reconciliation of projected benefit obligation: (Rs.’000) Particulars For the year ended For the year ended March 31, 2017 March 31, 2016 Projected Benefit Obligation at the beginning of the year 126,756 112,711 Current Service Cost 50,601 33,148 Interest Cost 8,976 8,373 Contribution by plan participation Nil Nil Net Actuarial (Gains) / Losses (33,871) (15,368) Benefits Paid (15,737) (12,108) Past service cost Nil Nil Amalgamations Nil Nil Curtailments Nil Nil Settlements Nil Nil Projected Benefit Obligation at the end of year 136,725 126,756 Change in fair value of assets: (Rs. ‘000) Particulars For the year ended For the year ended March 31, 2017 March 31, 2016 Plan Asset at beginning of year Nil Nil Expected Return on Plan Asset Nil Nil Employer Contribution Nil Nil Employee Contribution Nil Nil Benefits Payment Nil Nil Asset Gains / (Losses) Nil Nil Amalgamations Nil Nil Settlements Nil Nil Ending Asset Nil Nil Total actuarial gain/(loss) recognized immediately Nil Nil Amounts recognized in Balance Sheet: (Rs. ‘000) Particulars For the year ended For the year ended March 31, 2017 March 31, 2016 Projected Benefit Obligation at the end of year 136,725 126,756 Ending Asset Nil Nil Funded Status asset / (liability) (136,725) (126,756) Unrecognized past service cost - non vested benefits Nil Nil Liability recognized in Balance Sheet (136,725) (126,756) Amounts recognized in Profit and Loss Account: (Rs. ‘000) Particulars For the year ended For the year ended March 31, 2017 March 31, 2016 Current Service Cost 50,601 33,148 Interest Cost 8,976 8,373 Expected return on plan asset Nil Nil Net Actuarial (gains)/losses recognized in the year (33,871) (15,368) Past Service Cost Nil Nil Effect of Curtailments Nil Nil Income (-) / Expenses (+) recognized in the statement of Profit and Loss account 25,706 26,153 Experience Adjustments (Rs.‘000) Particulars For the year For the year For the year For the year For the year ended March ended March ended March ended March ended March 31, 2017 31, 2016 31, 2015 31, 2014 31, 2013 Present Value of defined benefit obligation 136,725 126,756 112,710 102,522 160,813 Fair Value of plan assets Nil Nil Nil Nil Nil (Surplus)/ deficit in the plan 136,725 126,756 112,710 102,522 160,813 Experience Adjustment Liability Experience (Gain) / Loss (33,871) (15,368) (19,471) (102,576) (29,601) Asset Asset (Gain) / Loss Nil Nil Nil Nil Nil
12. Segmental Reporting In accordance with the RBI guidelines, the Bank has identified two primary segments: Treasury and Corporate Banking. These segments
are identified based on nature of services provided, risk and returns, organizational structure of the Bank and the internal financial reporting system.
SCHEDULES FORMING PART OF THE FINANCIAL STATEMENTS FOR THE YEAR ENDED MARCH 31, 2017
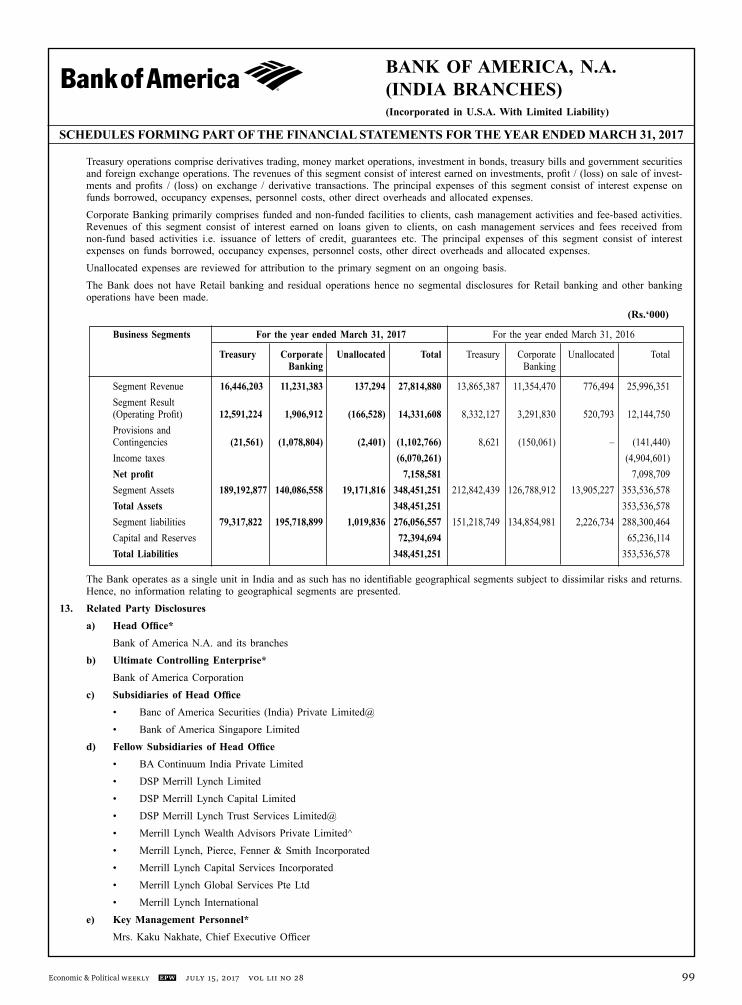
BANK OF AMERICA, N.A.(INDIA BRANCHES)(Incorporated in U.S.A. With Limited Liability)
Economic & Political Weekly EPW july 15, 2017 vol LII no 28 99
Treasury operations comprise derivatives trading, money market operations, investment in bonds, treasury bills and government securities and foreign exchange operations. The revenues of this segment consist of interest earned on investments, profit / (loss) on sale of invest-ments and profits / (loss) on exchange / derivative transactions. The principal expenses of this segment consist of interest expense on funds borrowed, occupancy expenses, personnel costs, other direct overheads and allocated expenses.
Corporate Banking primarily comprises funded and non-funded facilities to clients, cash management activities and fee-based activities. Revenues of this segment consist of interest earned on loans given to clients, on cash management services and fees received from non-fund based activities i.e. issuance of letters of credit, guarantees etc. The principal expenses of this segment consist of interest expenses on funds borrowed, occupancy expenses, personnel costs, other direct overheads and allocated expenses.
Unallocated expenses are reviewed for attribution to the primary segment on an ongoing basis. The Bank does not have Retail banking and residual operations hence no segmental disclosures for Retail banking and other banking
operations have been made. (Rs.‘000)
Business Segments For the year ended March 31, 2017 For the year ended March 31, 2016
Treasury Corporate Unallocated Total Treasury Corporate Unallocated Total Banking Banking
Segment Revenue 16,446,203 11,231,383 137,294 27,814,880 13,865,387 11,354,470 776,494 25,996,351 Segment Result (Operating Profit) 12,591,224 1,906,912 (166,528) 14,331,608 8,332,127 3,291,830 520,793 12,144,750 Provisions and Contingencies (21,561) (1,078,804) (2,401) (1,102,766) 8,621 (150,061) – (141,440) Income taxes (6,070,261) (4,904,601) Net profit 7,158,581 7,098,709 Segment Assets 189,192,877 140,086,558 19,171,816 348,451,251 212,842,439 126,788,912 13,905,227 353,536,578 Total Assets 348,451,251 353,536,578 Segment liabilities 79,317,822 195,718,899 1,019,836 276,056,557 151,218,749 134,854,981 2,226,734 288,300,464 Capital and Reserves 72,394,694 65,236,114 Total Liabilities 348,451,251 353,536,578
The Bank operates as a single unit in India and as such has no identifiable geographical segments subject to dissimilar risks and returns. Hence, no information relating to geographical segments are presented.
13. Related Party Disclosures a) Head Office* Bank of America N.A. and its branches b) Ultimate Controlling Enterprise* Bank of America Corporation c) Subsidiaries of Head Office • Banc of America Securities (India) Private Limited@ • Bank of America Singapore Limited d) Fellow Subsidiaries of Head Office • BA Continuum India Private Limited • DSP Merrill Lynch Limited • DSP Merrill Lynch Capital Limited • DSP Merrill Lynch Trust Services Limited@ • Merrill Lynch Wealth Advisors Private Limited^ • Merrill Lynch, Pierce, Fenner & Smith Incorporated • Merrill Lynch Capital Services Incorporated • Merrill Lynch Global Services Pte Ltd • Merrill Lynch International e) Key Management Personnel* Mrs. Kaku Nakhate, Chief Executive Officer
SCHEDULES FORMING PART OF THE FINANCIAL STATEMENTS FOR THE YEAR ENDED MARCH 31, 2017

BANK OF AMERICA, N.A.(INDIA BRANCHES)(Incorporated in U.S.A. With Limited Liability)
july 15, 2017 vol LII no 28 EPW Economic & Political Weekly100
SCHEDULES FORMING PART OF THE FINANCIAL STATEMENTS FOR THE YEAR ENDED MARCH 31, 2017 Transactions with related parties are in the ordinary course of business (Current year figures are shown in bold. Previous year’s figures
are shown in brackets): (Rs. ‘000) Items/Related Party Subsidiaries of Fellow Subsidiaries Head office of Head office Transactions during the year Sales/Redemption of Securities 123,238,285 Nil (55,102,170) (Nil) Purchase of Securities 78,046,620 Nil (26,449,105) (Nil) Term Deposits (note 1) Nil 52,155,000 (Nil) (67,054,709) Documentary Collections Nil 288,832 (Nil) (308,157) Guarantees issued Nil Nil (Nil) (Nil) Interest Paid Nil 1,394,629 (Nil) (1,261,426) Depository Participant charges Nil 3 (Nil) (4) Commission Received Nil 301 (Nil) (452) Bank charges Received Nil 561 (Nil) (1,169) Recovery / (Payment) in respect of retirement benefits of transferred employees, net Nil 4,871 (Nil) (Nil) Reimbursement of Expense received / (paid) Nil 10,888 (Nil) (Nil) Rendering of Services Nil 93,307 (1,507) (130,869) Receipt of Services Nil 70,988 (Nil) (45,661) Outstanding at the year end Term Deposits (note 1) Nil 28,082,924 (Nil) (22,903,085) Demand Deposits Nil 651,728 (Nil) (788,114) Advances Nil 39,237 (Nil) (41,180) Other Assets Nil 48,212 (Nil) (57,178) Other Liabilities Nil 393,535 (Nil) (336,185) Derivatives Contracts: Notional Value Nil 7,831,482 (Nil) (16,219,532) Positive Mark-to-Market value Nil Nil (Nil) (317,474) Negative Mark-to-Market value Nil 89,958 (Nil) (316,400) Guarantees Nil 25,608 (Nil) (39,062) Maximum outstanding during the year Term Deposits (note 1) Nil 30,598,085 (Nil) (26,493,085) Guarantees Nil 39,062 (Nil) (41,360) Note 1: Includes deposits which are lien marked.
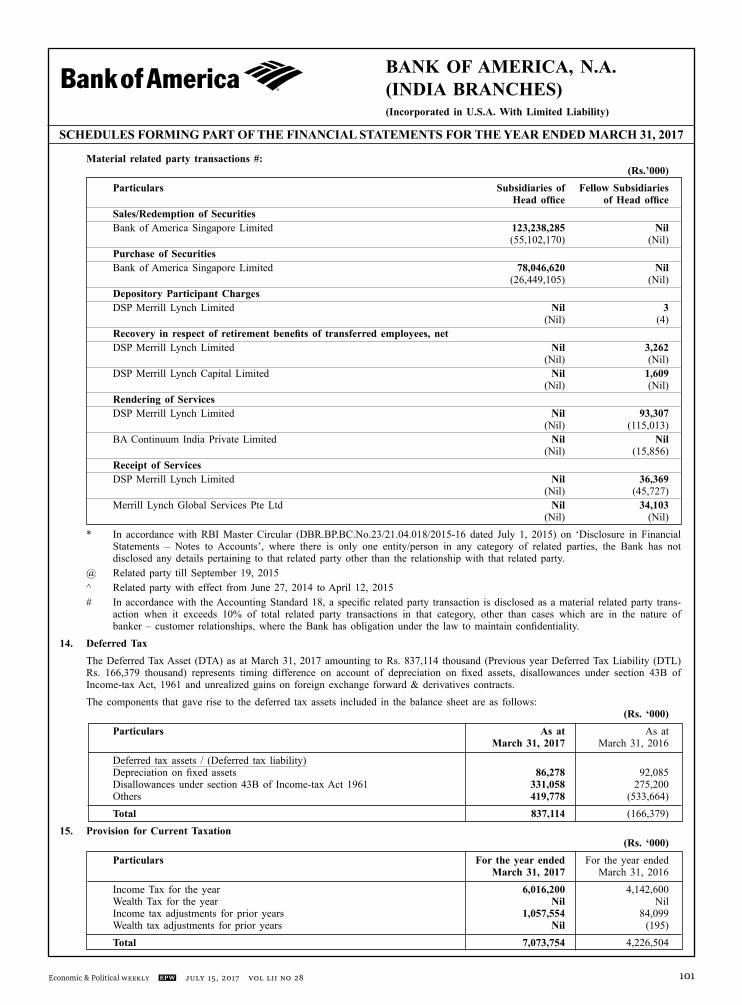
BANK OF AMERICA, N.A.(INDIA BRANCHES)(Incorporated in U.S.A. With Limited Liability)
Economic & Political Weekly EPW july 15, 2017 vol LII no 28 101
SCHEDULES FORMING PART OF THE FINANCIAL STATEMENTS FOR THE YEAR ENDED MARCH 31, 2017
Material related party transactions #: (Rs.’000) Particulars Subsidiaries of Fellow Subsidiaries Head office of Head office Sales/Redemption of Securities Bank of America Singapore Limited 123,238,285 Nil (55,102,170) (Nil) Purchase of Securities Bank of America Singapore Limited 78,046,620 Nil (26,449,105) (Nil) Depository Participant Charges DSP Merrill Lynch Limited Nil 3 (Nil) (4) Recovery in respect of retirement benefits of transferred employees, net DSP Merrill Lynch Limited Nil 3,262 (Nil) (Nil) DSP Merrill Lynch Capital Limited Nil 1,609 (Nil) (Nil) Rendering of Services DSP Merrill Lynch Limited Nil 93,307 (Nil) (115,013) BA Continuum India Private Limited Nil Nil (Nil) (15,856) Receipt of Services DSP Merrill Lynch Limited Nil 36,369 (Nil) (45,727) Merrill Lynch Global Services Pte Ltd Nil 34,103 (Nil) (Nil) * In accordance with RBI Master Circular (DBR.BP.BC.No.23/21.04.018/2015-16 dated July 1, 2015) on ‘Disclosure in Financial
Statements – Notes to Accounts’, where there is only one entity/person in any category of related parties, the Bank has not disclosed any details pertaining to that related party other than the relationship with that related party.
@ Related party till September 19, 2015 ^ Related party with effect from June 27, 2014 to April 12, 2015 # In accordance with the Accounting Standard 18, a specific related party transaction is disclosed as a material related party trans-
action when it exceeds 10% of total related party transactions in that category, other than cases which are in the nature of banker – customer relationships, where the Bank has obligation under the law to maintain confidentiality.
14. Deferred Tax The Deferred Tax Asset (DTA) as at March 31, 2017 amounting to Rs. 837,114 thousand (Previous year Deferred Tax Liability (DTL)
Rs. 166,379 thousand) represents timing difference on account of depreciation on fixed assets, disallowances under section 43B of Income-tax Act, 1961 and unrealized gains on foreign exchange forward & derivatives contracts.
The components that gave rise to the deferred tax assets included in the balance sheet are as follows: (Rs. ‘000) Particulars As at As at March 31, 2017 March 31, 2016 Deferred tax assets / (Deferred tax liability) Depreciation on fixed assets 86,278 92,085 Disallowances under section 43B of Income-tax Act 1961 331,058 275,200 Others 419,778 (533,664) Total 837,114 (166,379)15. Provision for Current Taxation (Rs. ‘000) Particulars For the year ended For the year ended March 31, 2017 March 31, 2016 Income Tax for the year 6,016,200 4,142,600 Wealth Tax for the year Nil Nil Income tax adjustments for prior years 1,057,554 84,099 Wealth tax adjustments for prior years Nil (195) Total 7,073,754 4,226,504

BANK OF AMERICA, N.A.(INDIA BRANCHES)(Incorporated in U.S.A. With Limited Liability)
july 15, 2017 vol LII no 28 EPW Economic & Political Weekly102
SCHEDULES FORMING PART OF THE FINANCIAL STATEMENTS FOR THE YEAR ENDED MARCH 31, 2017
16. Leases Information in respect of premises taken on operating lease of non-cancellable nature is as under: (Rs. ‘000) Sr. No. Future minimum lease payments As at March 31, 2017 As at March 31, 2016 1) Up to 1 year 169,009 214,725 2) More than 1 year and up to 5 years 30,822 199,828 3) More than 5 years Nil Nil • The lease payments, recognized in the Profit and Loss account: Rs. 311,751 thousand (Previous yearRs. 365,930 thousand). • The Bank has not sub-leased any part of the above premises. • There are no lease payments recognized in the Profit and Loss Account for contingent rent. • The terms of renewal and escalation clauses are those normally prevalent in similar agreements. There are no undue restrictions
or onerous clauses in the agreements.17. Other Fixed Assets (including furniture & fixtures) Other Fixed Assets under Schedule 10(II) include software acquired by the Bank, details for which are given below: (Rs. ’000) Particulars For the year ended For the year ended March 31, 2017 March 31, 2016 At Cost as at March 31, of preceding year 154,857 135,714 Additions during the year 10,300 19,143 Deductions during the year 12 Nil At Cost as at March 31 165,145 154,857 Accumulated amortization (139,087) (123,547) Written down value as at March 31 26,058 31,31018. Provisions, Contingent Liabilities and Contingent Assets Description of Contingent Liabilities stated in Schedule 12 a) Claims against the Bank not acknowledged as Debts The Bank is a party to certain legal proceedings in the normal course of business. This also includes claims/demands raised by
income tax and service tax authorities which are disputed by the Bank. b) Liability on account of forward exchange and derivative contracts The Bank enters into forward exchange contracts, currency options, currency swaps, interest rate swaps, forward rate agreements
and currency futures with inter-bank participants on its own account and for its customers. Forward exchange contracts are commitments to buy or sell foreign currency at a future date at the contracted rate. Currency
options give the buyer, on payment of a premium, the right but not an obligation, to buy or sell specified amounts of currency at agreed rates of exchange on or before a specified future date. Currency Futures contract is a standardized foreign exchange derivative contract traded on a recognized stock exchange to buy or sell one currency against another on a specified future date, at a price specified on the date of contract. Currency Swaps are commitments to exchange cash flows by the way of interest/principal in one currency against another, based on predetermined rates. Interest rate swaps are commitments to exchange fixed and floating interest rate cash flows. The notional amounts that are recorded as contingent liabilities are typically amounts used as a basis for the calculation of interest component of the contract and do not necessarily indicate the amounts of future cash flows involved or the current fair value of such contracts and therefore do not indicate the Bank’s exposure to credit or price risks. These contracts become favorable (assets) or unfavorable (liabilities) as a result of movements in the market rates or prices relative to their terms.
c) Guarantees given on behalf of Constituents, Acceptances, Endorsements and other obligations As a part of its corporate banking activities, the Bank issues documentary credit and guarantees on behalf of its customers.
Documentary credits such as letters of credit enhance the credit standing of the customers of the Bank. Guarantees generally represent irrevocable assurances that the Bank will make payments in the event of customer failing to fulfill its financial or per-formance obligations.
d) Other items for which the Bank is contingently liable These include a) Committed Lines of Credit and b) Capital Commitments. e) Movement in Provision for Contingencies (Rs. ‘000) Particulars As at March 31, 2017 As at March 31, 2016 Opening Provision 20,392 20,630 Additions 651 Nil Reversals Nil 238 Closing Provision 21,043 20,392
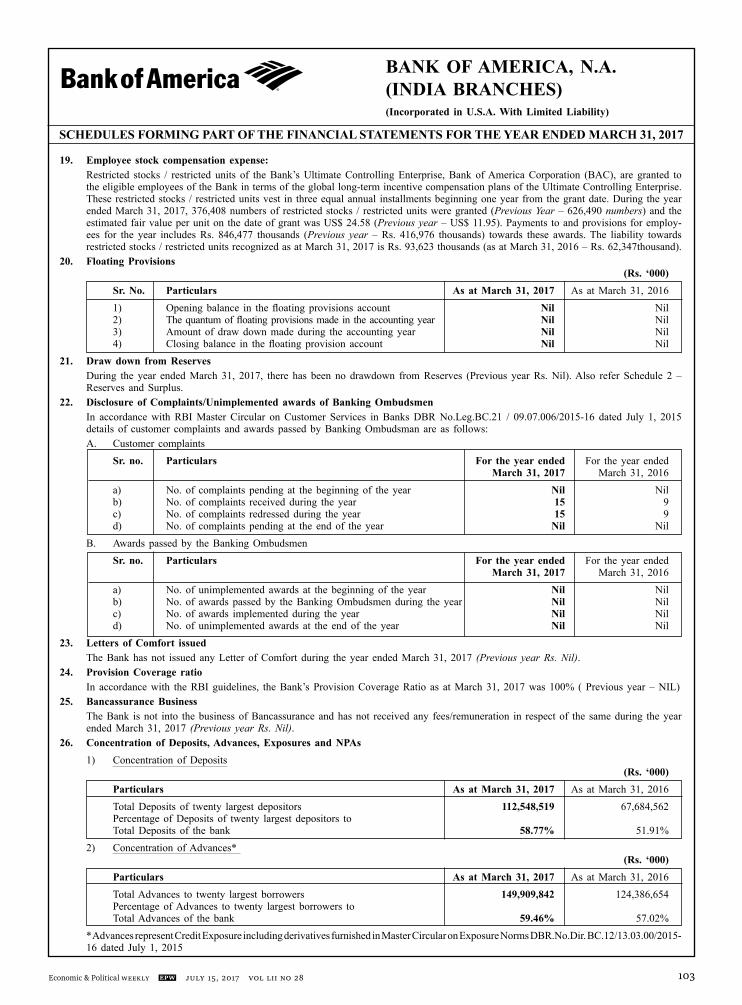
BANK OF AMERICA, N.A.(INDIA BRANCHES)(Incorporated in U.S.A. With Limited Liability)
Economic & Political Weekly EPW july 15, 2017 vol LII no 28 103
19. Employee stock compensation expense: Restricted stocks / restricted units of the Bank’s Ultimate Controlling Enterprise, Bank of America Corporation (BAC), are granted to
the eligible employees of the Bank in terms of the global long-term incentive compensation plans of the Ultimate Controlling Enterprise. These restricted stocks / restricted units vest in three equal annual installments beginning one year from the grant date. During the year ended March 31, 2017, 376,408 numbers of restricted stocks / restricted units were granted (PreviousYear – 626,490 numbers) and the estimated fair value per unit on the date of grant was US$ 24.58 (Previousyear – US$ 11.95). Payments to and provisions for employ-ees for the year includes Rs. 846,477 thousands (Previous year – Rs. 416,976 thousands) towards these awards. The liability towards restricted stocks / restricted units recognized as at March 31, 2017 is Rs. 93,623 thousands (as at March 31, 2016 – Rs. 62,347thousand).
20. Floating Provisions (Rs. ‘000) Sr. No. Particulars As at March 31, 2017 As at March 31, 2016 1) Opening balance in the floating provisions account Nil Nil 2) The quantum of floating provisions made in the accounting year Nil Nil 3) Amount of draw down made during the accounting year Nil Nil 4) Closing balance in the floating provision account Nil Nil21. Draw down from Reserves During the year ended March 31, 2017, there has been no drawdown from Reserves (Previous year Rs. Nil). Also refer Schedule 2 –
Reserves and Surplus.22. Disclosure of Complaints/Unimplemented awards of Banking Ombudsmen In accordance with RBI Master Circular on Customer Services in Banks DBR No.Leg.BC.21 / 09.07.006/2015-16 dated July 1, 2015
details of customer complaints and awards passed by Banking Ombudsman are as follows: A. Customer complaints Sr. no. Particulars For the year ended For the year ended March 31, 2017 March 31, 2016 a) No. of complaints pending at the beginning of the year Nil Nil b) No. of complaints received during the year 15 9 c) No. of complaints redressed during the year 15 9 d) No. of complaints pending at the end of the year Nil Nil B. Awards passed by the Banking Ombudsmen Sr. no. Particulars For the year ended For the year ended March 31, 2017 March 31, 2016 a) No. of unimplemented awards at the beginning of the year Nil Nil b) No. of awards passed by the Banking Ombudsmen during the year Nil Nil c) No. of awards implemented during the year Nil Nil d) No. of unimplemented awards at the end of the year Nil Nil23. Letters of Comfort issued The Bank has not issued any Letter of Comfort during the year ended March 31, 2017 (Previous yearRs.Nil).24. Provision Coverage ratio In accordance with the RBI guidelines, the Bank’s Provision Coverage Ratio as at March 31, 2017 was 100% ( Previous year – NIL)25. Bancassurance Business The Bank is not into the business of Bancassurance and has not received any fees/remuneration in respect of the same during the year
ended March 31, 2017 (Previous yearRs.Nil).26. Concentration of Deposits, Advances, Exposures and NPAs 1) Concentration of Deposits (Rs. ‘000) Particulars As at March 31, 2017 As at March 31, 2016 Total Deposits of twenty largest depositors 112,548,519 67,684,562 Percentage of Deposits of twenty largest depositors to Total Deposits of the bank 58.77% 51.91% 2) Concentration of Advances* (Rs. ‘000) Particulars As at March 31, 2017 As at March 31, 2016 Total Advances to twenty largest borrowers 149,909,842 124,386,654 Percentage of Advances to twenty largest borrowers to Total Advances of the bank 59.46% 57.02% * Advances represent Credit Exposure including derivatives furnished in Master Circular on Exposure Norms DBR.No.Dir. BC.12/13.03.00/2015-
16 dated July 1, 2015
SCHEDULES FORMING PART OF THE FINANCIAL STATEMENTS FOR THE YEAR ENDED MARCH 31, 2017

BANK OF AMERICA, N.A.(INDIA BRANCHES)(Incorporated in U.S.A. With Limited Liability)
july 15, 2017 vol LII no 28 EPW Economic & Political Weekly104
3) Concentration of Exposures (Rs. ‘000)
Particulars As at March 31, 2017 As at March 31, 2016 Total Exposure of twenty largest borrowers/customers 149,909,842 124,386,654 Percentage of Exposure to twenty largest borrowers/customers to Total Exposure of the bank on borrowers/customers 59.46% 57.02%
4) Concentration of NPAs (Rs. ‘000) Particulars As at March 31, 2017 As at March 31, 2016 Total Exposure of top four NPA accounts 1,100,000 NIL
27 a. Sector-wise advances (Rs. ‘000)
SI NO. Sector As at March 31, 2017 Outstanding Gross NPAs Percentage of Gross Total Advances NPAs to Total Advances in that sector Priority Sector* 1 Agriculture and allied activities Nil Nil Nil 2 Advances to industries sector eligible as priority sector lending 29,556,077 Nil Nil 3 Services 10,191,694 Nil Nil 4 Personal loans Nil Nil Nil Sub- Total (A) 39,747,771 Nil Nil Non-Priority Sector 1 Agriculture and allied activities Nil Nil Nil 2 Industry 48,646,961 1,100,000 2.26% 3 Services 48,107,688 Nil Nil 4 Personal loans 5,316 Nil Nil Sub- Total (B) 96,759,965 1,100,000 1.14% Total (A+B) 136,507,736 1,100,000 0.81%
(Rs. ‘000)
SI NO. Sector As at March 31, 2016 Outstanding Gross NPAs Percentage of Gross Total Advances NPAs to Total Advances in that sector Priority Sector* 1 Agriculture and allied activities Nil Nil Nil 2 Advances to industries sector eligible as priority sector lending 22,083,213 Nil Nil 3 Services 7,904,743 Nil Nil 4 Personal loans Nil Nil Nil Sub- Total (A) 29,987,956 Nil Nil Non-Priority Sector 1 Agriculture and allied activities Nil Nil Nil 2 Industry 36,667,246 Nil Nil 3 Services 56,803,774 Nil Nil 4 Personal loans 4,778 Nil Nil Sub- Total (B) 93,475,798 Nil Nil Total (A+B) 123,463,754 Nil Nil
* Does not include investments in Pass Through Certificates (PTC)
27 b. Investment in Priority Sector Lending Certificate During the FY 2016-17, the Bank had invested in Priority Sector Lending Certificate (PSLC) of Agriculture category for Rs. 150,000
thousands (Previous yearNIL).
SCHEDULES FORMING PART OF THE FINANCIAL STATEMENTS FOR THE YEAR ENDED MARCH 31, 2017

BANK OF AMERICA, N.A.(INDIA BRANCHES)(Incorporated in U.S.A. With Limited Liability)
Economic & Political Weekly EPW july 15, 2017 vol LII no 28 105
28. Movement of NPAs (Rs. ‘000) Particulars As at As at March 31, 2017 March 31, 2016 Gross NPAs as on April 01 (Opening Balance) Nil 144,838 Additions (Fresh NPAs during the year) 1,100,000 Nil Sub-total (A) 1,100,000 144,838 Less: - (i) Upgradations Nil Nil (ii) Recoveries (excluding recoveries made from upgraded accounts) Nil 144,838 (iii) Write-offs Nil Nil Sub-total (B) Nil 144,838 Gross NPAs as on March 31 (Closing balance) (A-B) 1,100,000 Nil29. Overseas Assets, NPAs and Revenue (Rs. ‘000) Particulars March 31, 2017 March 31, 2016 Total Assets Nil Nil Total NPAs Nil Nil Total Revenue Nil Nil30. Off-balance sheet SPVs (Domestic & Overseas) sponsored – Rs. Nil (Previous yearRs.Nil).31. Unamortised Pension and Gratuity Liabilities – Rs. Nil (Previous yearRs.Nil).32. Disclosures on Remuneration The Bank’s compensation policies including that of CEO's, is in conformity with the Financial Stability Board principles and standards.
In accordance with the requirements of the RBI Circular No. DBOD No.BC.72/29.67/001/2011-12 dated January 13, 2012; the Re-gional Office of the Bank has submitted a declaration to RBI confirming the aforesaid matter.
33. Corporate Social Responsibility (CSR) expenditure Bank’s CSR approach in India is aligned to the global strategy, adapted to focus on local priorities. This year, the grants focused on
community investments which benefit children (especially adolescent girls), women and disadvantaged communities. Accordingly, the bank extended support to non-governmental organizations (NGOs) in the areas of Sanitation and Hygiene, Education and Skills Devel-opment. Further, it continued to support NGOs which provide renewable energy access to remote households and enhance livelihoods. As a first, given the global focus on disability, it has supported an NGO that focuses on enhancing employability skills for the differ-ently abled. The bank also continued to support Art & Culture.
(Rs. ‘000) Particulars Year Ended Year Ended March 31, 2017 March 31, 2016 (1) Gross amount required to be spent by the Bank during the year 234,933 204,986 (2) Amount spent during the year on: i) Construction / acquisition of any asset – in cash – – – Yet to be paid in cash – – ii) any other purpose – in cash 235,063 205,163 – Yet to be paid in cash – – Total 235,063 205,16334. Disclosure relating to securitization There are no securitization transactions which are originated by the bank hence these disclosures are not applicable.35. Disclosures pertaining to Micro and Small Enterprises There are no delays in payments to micro and small enterprises as required to be disclosed under The Micro, Small and Medium Enterprises
Development Act, 2006. The determination has been made to the extent such parties were identified based on the information available. 36. Credit Default Swaps The Bank has not transacted in credit default swaps during the current year or the previous year. 37. Intra Group Exposures: (Rs. ‘000) Particulars As at March 31, 2017 As at March 31, 2016 (a) Total amount of intra-group exposures 952,653 1,857,488 (b) Total amount of top-20 intra-group exposures 952,653 1,857,488 (c) Percentage of intra-group exposures to total exposure of the bank on borrowers / customers 0.29% 0.65%
SCHEDULES FORMING PART OF THE FINANCIAL STATEMENTS FOR THE YEAR ENDED MARCH 31, 2017
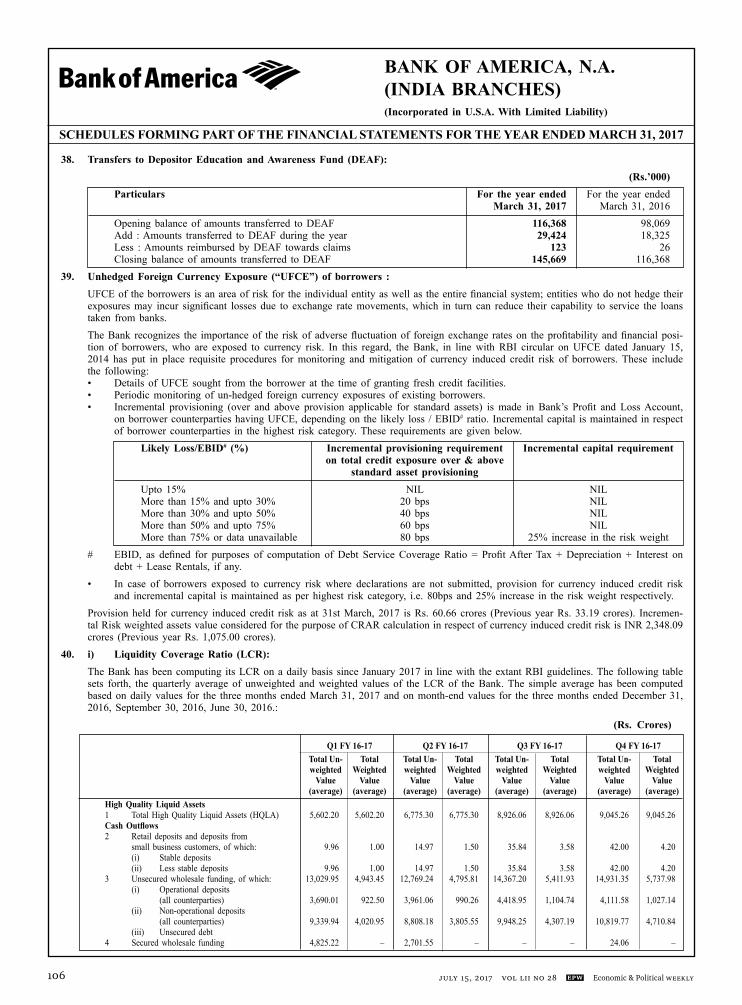
BANK OF AMERICA, N.A.(INDIA BRANCHES)(Incorporated in U.S.A. With Limited Liability)
july 15, 2017 vol LII no 28 EPW Economic & Political Weekly106
SCHEDULES FORMING PART OF THE FINANCIAL STATEMENTS FOR THE YEAR ENDED MARCH 31, 2017
38. Transfers to Depositor Education and Awareness Fund (DEAF): (Rs.’000) Particulars For the year ended For the year ended March 31, 2017 March 31, 2016 Opening balance of amounts transferred to DEAF 116,368 98,069 Add : Amounts transferred to DEAF during the year 29,424 18,325 Less : Amounts reimbursed by DEAF towards claims 123 26 Closing balance of amounts transferred to DEAF 145,669 116,36839. Unhedged Foreign Currency Exposure (“UFCE”) of borrowers : UFCE of the borrowers is an area of risk for the individual entity as well as the entire financial system; entities who do not hedge their
exposures may incur significant losses due to exchange rate movements, which in turn can reduce their capability to service the loans taken from banks.
The Bank recognizes the importance of the risk of adverse fluctuation of foreign exchange rates on the profitability and financial posi-tion of borrowers, who are exposed to currency risk. In this regard, the Bank, in line with RBI circular on UFCE dated January 15, 2014 has put in place requisite procedures for monitoring and mitigation of currency induced credit risk of borrowers. These include the following:
• Details of UFCE sought from the borrower at the time of granting fresh credit facilities. • Periodic monitoring of un-hedged foreign currency exposures of existing borrowers. • Incremental provisioning (over and above provision applicable for standard assets) is made in Bank’s Profit and Loss Account,
on borrower counterparties having UFCE, depending on the likely loss / EBID# ratio. Incremental capital is maintained in respect of borrower counterparties in the highest risk category. These requirements are given below.
Likely Loss/EBID# (%) Incremental provisioning requirement Incremental capital requirement on total credit exposure over & above standard asset provisioning Upto 15% NIL NIL More than 15% and upto 30% 20 bps NIL More than 30% and upto 50% 40 bps NIL More than 50% and upto 75% 60 bps NIL More than 75% or data unavailable 80 bps 25% increase in the risk weight # EBID, as defined for purposes of computation of Debt Service Coverage Ratio = Profit After Tax + Depreciation + Interest on
debt + Lease Rentals, if any. • In case of borrowers exposed to currency risk where declarations are not submitted, provision for currency induced credit risk
and incremental capital is maintained as per highest risk category, i.e. 80bps and 25% increase in the risk weight respectively. Provision held for currency induced credit risk as at 31st March, 2017 is Rs. 60.66 crores (Previous year Rs. 33.19 crores). Incremen-
tal Risk weighted assets value considered for the purpose of CRAR calculation in respect of currency induced credit risk is INR 2,348.09 crores (Previous year Rs. 1,075.00 crores).
40. i) Liquidity Coverage Ratio (LCR): The Bank has been computing its LCR on a daily basis since January 2017 in line with the extant RBI guidelines. The following table
sets forth, the quarterly average of unweighted and weighted values of the LCR of the Bank. The simple average has been computed based on daily values for the three months ended March 31, 2017 and on month-end values for the three months ended December 31, 2016, September 30, 2016, June 30, 2016.:
(Rs. Crores)
Q1 FY 16-17 Q2 FY 16-17 Q3 FY 16-17 Q4 FY 16-17 Total Un- Total Total Un- Total Total Un- Total Total Un- Total weighted Weighted weighted Weighted weighted Weighted weighted Weighted Value Value Value Value Value Value Value Value (average) (average) (average) (average) (average) (average) (average) (average) High Quality Liquid Assets 1 Total High Quality Liquid Assets (HQLA) 5,602.20 5,602.20 6,775.30 6,775.30 8,926.06 8,926.06 9,045.26 9,045.26 Cash Outflows 2 Retail deposits and deposits from small business customers, of which: 9.96 1.00 14.97 1.50 35.84 3.58 42.00 4.20 (i) Stable deposits (ii) Less stable deposits 9.96 1.00 14.97 1.50 35.84 3.58 42.00 4.20 3 Unsecured wholesale funding, of which: 13,029.95 4,943.45 12,769.24 4,795.81 14,367.20 5,411.93 14,931.35 5,737.98 (i) Operational deposits (all counterparties) 3,690.01 922.50 3,961.06 990.26 4,418.95 1,104.74 4,111.58 1,027.14 (ii) Non-operational deposits (all counterparties) 9,339.94 4,020.95 8,808.18 3,805.55 9,948.25 4,307.19 10,819.77 4,710.84 (iii) Unsecured debt 4 Secured wholesale funding 4,825.22 – 2,701.55 – – – 24.06 –

BANK OF AMERICA, N.A.(INDIA BRANCHES)(Incorporated in U.S.A. With Limited Liability)
Economic & Political Weekly EPW july 15, 2017 vol LII no 28 107
Q1 FY 16-17 Q2 FY 16-17 Q3 FY 16-17 Q4 FY 16-17
Total Un- Total Total Un- Total Total Un- Total Total Un- Total weighted Weighted weighted Weighted weighted Weighted weighted Weighted Value Value Value Value Value Value Value Value (average) (average) (average) (average) (average) (average) (average) (average)
5 Additional requirements, of which 2,328.53 960.26 2,402.27 1,113.94 2,921.91 1,317.43 3,341.53 1,831.89 (i) Outflows related to derivative exposures and other collateral requirements 690.56 690.56 905.50 905.50 1,027.82 1,027.82 1,537.04 1,537.04 (ii) Outflows related to loss of funding on debt products (iii) Credit and liquidity facilities 1,637.97 269.70 1,496.77 208.44 1,894.09 289.61 1,804.49 294.85 6 Other contractual funding obligations 308.51 308.51 279.94 279.94 908.54 908.54 436.18 436.18 7 Other contingent funding obligations 14,564.11 673.74 15,157.68 705.58 15,393.24 717.79 14,996.47 690.59 8 Total Cash Outflows 35,066.28 6,886.96 33,325.65 6,896.77 33,626.73 8,359.27 33,771.59 8,700.84 Cash Inflows 9 Secured lending (e.g. reverse repos) 944.39 – 1,265.81 – 4,464.17 – 5,241.85 – 10 Inflows from fully performing exposures 5,184.05 3,748.91 4,562.41 3,125.86 4,804.70 3,107.74 4,825.19 3,205.46 11 Other cash inflows 570.86 238.86 822.84 490.84 1,113.56 781.56 1,147.98 956.11 12 Total Cash Inflows 6,699.30 3,987.77 6,651.06 3,616.70 10,382.43 3,889.30 11,215.02 4,161.57 13 TOTAL HQLA 5,602.20 5,602.20 6,775.30 6,775.30 8,926.06 8,926.06 9,045.26 9,045.26 14 Total Net Cash Outflows 28,366.98 2,899.19 26,674.59 3,280.07 23,244.30 4,469.97 22,556.57 4,539.27 15 Liquidity Coverage Ratio (%) 193.23 206.56 199.69 199.27
Financial Year : 2015-2016 The LCR positions of the bank based on simple average of values for the three months ended March 31, 2016, December 31, 2015,
September 30, 2015 and June 30, 2015. Q1 FY 15-16 Q2 FY 15-16 Q3 FY 15-16 Q4 FY 15-16
Total Un- Total Total Un- Total Total Un- Total Total Un- Total weighted Weighted weighted Weighted weighted Weighted weighted Weighted Value Value Value Value Value Value Value Value (average) (average) (average) (average) (average) (average) (average) (average)
High Quality Liquid Assets 1 Total High Quality Liquid Assets (HQLA) 3,850.55 3,850.55 5,070.64 5,070.64 4,346.29 4,346.29 3,870.23 3,870.23 Cash Outflows 2 Retail deposits and deposits from small business customers, of which: 4.81 0.48 8.73 0.87 14.01 1.40 6.98 0.70 (i) Stable deposits (ii) Less stable deposits 4.81 0.48 8.73 0.87 14.01 1.40 6.98 0.70 3 Unsecured wholesale funding, of which: 9,918.46 3,975.34 12,277.88 4,779.55 11,838.00 4,501.03 11,338.89 4,260.17 (i) Operational deposits (all counterparties) 2,935.48 733.87 3,257.74 814.43 3,421.41 855.35 3,595.65 898.91 (ii) Non-operational deposits (all counterparties) 6,982.97 3,241.47 9,020.14 3,965.12 8,416.59 3,645.68 7,743.25 3,361.25 (iii) Unsecured debt 4 Secured wholesale funding 7,784.14 – 4,312.36 – 4,162.99 – 6,816.74 – 5 Additional requirements, of which 1,620.95 824.72 2,199.17 1,147.66 1,933.85 1,039.43 2,077.91 1,074.77 (i) Outflows related to derivative exposures and other collateral requirements 679.87 679.87 866.81 866.81 784.35 784.35 868.51 868.51 (ii) Outflows related to loss of funding on debt products (iii) Credit and liquidity facilities 941.08 144.85 1,332.35 280.84 1,149.49 255.08 1,209.40 206.26 6 Other contractual funding obligations 648.29 648.29 481.51 481.51 578.64 578.64 230.15 230.15 7 Other contingent funding obligations 12,621.09 631.05 12,872.49 643.62 13,278.46 663.92 14,719.33 698.70 8 Total Cash Outflows 32,597.74 6,079.89 32,152.14 7,053.22 31,805.94 6,784.42 35,189.99 6,264.48 Cash Inflows 9 Secured lending (e.g. reverse repos) 340.79 – 18.67 – 467.04 – 1,444.30 – 10 Inflows from fully performing exposures 3,070.96 1,713.15 3,796.50 2,154.81 4,435.38 2,510.67 4,589.10 2,966.00 11 Other cash inflows 672.37 354.37 841.69 523.69 575.27 257.27 763.20 431.20 12 Total Cash Inflows 4,084.12 2,067.52 4,656.86 2,678.51 5,477.68 2,767.94 6,796.60 3,397.20 13 TOTAL HQLA 3,850.55 3,850.55 5,070.64 5,070.64 4,346.29 4,346.29 3,870.23 3,870.23 14 Total Net Cash Outflows 28,513.61 4,012.37 27,495.29 4,374.71 26,328.26 4,016.49 28,393.39 2,867.27 15 Liquidity Coverage Ratio (%) 95.97 115.91 108.21 134.98
SCHEDULES FORMING PART OF THE FINANCIAL STATEMENTS FOR THE YEAR ENDED MARCH 31, 2017
BANK OF AMERICA, N.A.(INDIA BRANCHES)(Incorporated in U.S.A. With Limited Liability)
july 15, 2017 vol LII no 28 EPW Economic & Political Weekly108
40. ii) Qualitative disclosure around LCR :
The Bank measures and monitors the LCR in line with Reserve Bank of India’s guidelines on “BASEL III Framework on Liquidity Standards – Liquidity Coverage Ratio (LCR), Liquidity Risk Monitoring Tools and LCR Disclosure Standards” dated June 09, 2014 as amended by “Prudential Guidelines on Capital Adequacy and Liquidity Standards” dated March 31, 2015 along with the amendments issued on March 23, 2016.
The LCR guidelines aim at measuring and promoting short term resilience of banks to potential liquidity disruptions, by ensuring that banks maintain an adequate level of unencumbered High Quality Liquid Assets (HQLAs) to meet net cash outflows over next 30 days in a severe liquidity stress scenario.
With a view to provide a transition time for banks, the LCR requirements were introduced in a phased manner with banks required to maintain minimum LCR of 60% from January 2015 onwards and the requirement increases by 10% annually to 100% by January 2019. Thus minimum LCR requirement effective January 01, 2017 was 80%.
The Bank has incorporated LCR as part of its risk appetite statement and has maintained LCR well above the regulatory threshold for every month end from April 2016 to March 2017.
The Bank has been maintaining HQLA in the form of excess CRR balance and SLR investments over and above mandatory requirement apart from regulatory dispensation allowed in the form of borrowing limit available through Marginal Standing Facility (MSF) and Facility to Avail Liquidity for Liquidity Coverage Ratio (FALLCR). The Bank’s HQLA consists entirely of Level 1 assets which are the most liquid assets as indicated by the RBI. The main drivers of the LCR computation consist of outflows from eligible deposits and inflows from eligible advances, computed on the basis of run-off rates prescribed by RBI.
The Bank’s Asset Liability Committee (ALCO) is the primary governing body for the oversight of the Bank’s liquidity risk management, while the day-to-day management of liquidity risk is the responsibility of Corporate Treasury.
41. Other expenditure in ‘Schedule 16 – Operating Expenses’ includes Head office administration. Expenditure of Rs. 499,155 thousand (Previous year Rs. 577,736 thousand).
42. Miscellaneous Income includes service fee income of Rs. 928,155 thousand (Previous year Rs. 829,031 thousand) from overseas branches and affiliates accounted as per contractual terms.
43. Outstanding commitments as of March 31, 2017 relating to securities purchase and sale contracts stood at Rs. 9,096,935 thousand & Rs. 20,986,282 thousand respectively (Previous year Rs. 17,030,095 thousand and Rs. 24,400,554 thousand respectively).
44. The Bank believes that the MCA notification G.S.R. 308(E) dated March 30, 2017 regarding holdings as well as dealings in Specified Bank Notes during the period from 8th November, 2016 to 30th December, 2016 is not applicable to banking companies. Accordingly, the disclosures prescribed under the said notification are not required to be made by the Bank.
45. RBI vide its circular dated 18th April 2017, has directed that banks shall make suitable disclosures, wherever either (a) the additional provisioning requirements assessed by RBI exceed 15 percent of the published net profits after tax for the reference period or (b) the additional Gross NPAs identified by RBI exceed 15 percent of the published incremental Gross NPAs for the reference period, or both. There has been no divergence observed by RBI for the financial year 2015-16 in respect of the Bank’s asset classification and provisioning under the extant prudential norms on income recognition asset classification and provisioning (IRACP) which require such disclosures.
46. Previous year figures have been regrouped and reclassified wherever necessary to confirm to current year’s presentation.
Signatures to schedules 1 to 18
For Price Waterhouse Chartered Accountants LLP For BANK OF AMERICA, N.A. (INDIA BRANCHES)Firm Registration No. 012754N/N500016
Sd/- Sd/- Sd/-Sharad Vasant Kaku Nakhate Kumar ShahPartner Chief Executive Officer Chief Financial OfficerMembership Number: 101119
Mumbai: June 22, 2017
SCHEDULES FORMING PART OF THE FINANCIAL STATEMENTS FOR THE YEAR ENDED MARCH 31, 2017
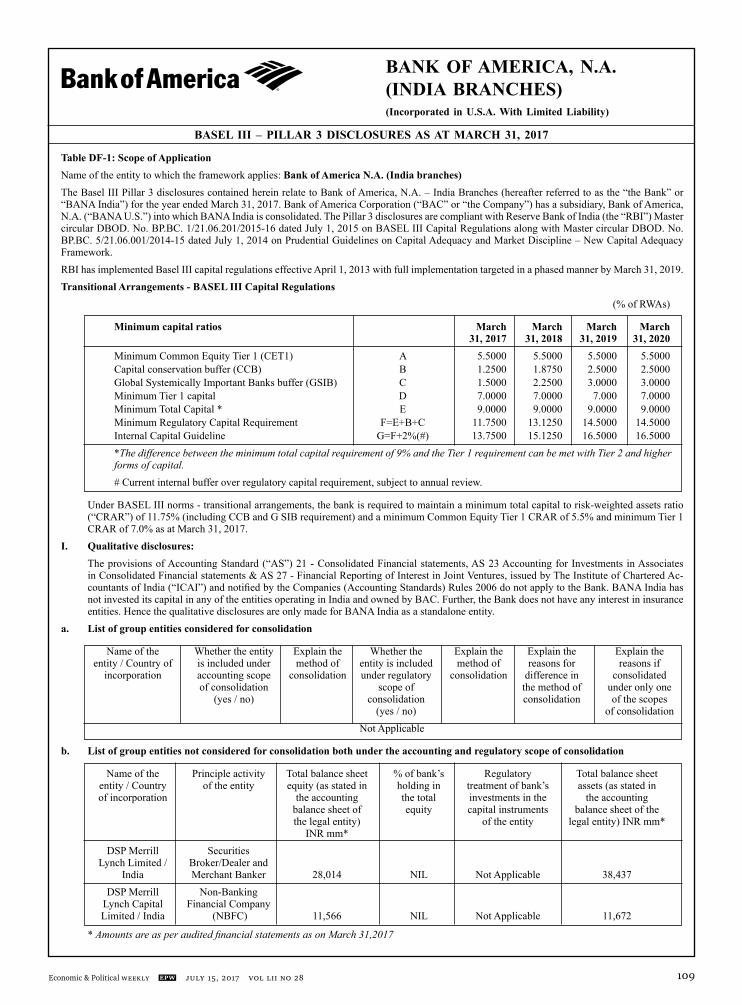
BANK OF AMERICA, N.A.(INDIA BRANCHES)(Incorporated in U.S.A. With Limited Liability)
Economic & Political Weekly EPW july 15, 2017 vol LII no 28 109
Table DF-1: Scope of Application Name of the entity to which the framework applies: Bank of America N.A. (India branches)The Basel III Pillar 3 disclosures contained herein relate to Bank of America, N.A. – India Branches (hereafter referred to as the “the Bank” or “BANA India”) for the year ended March 31, 2017. Bank of America Corporation (“BAC” or “the Company”) has a subsidiary, Bank of America, N.A. (“BANA U.S.”) into which BANA India is consolidated. The Pillar 3 disclosures are compliant with Reserve Bank of India (the “RBI”) Master circular DBOD. No. BP.BC. 1/21.06.201/2015-16 dated July 1, 2015 on BASEL III Capital Regulations along with Master circular DBOD. No. BP.BC. 5/21.06.001/2014-15 dated July 1, 2014 on Prudential Guidelines on Capital Adequacy and Market Discipline – New Capital Adequacy Framework. RBI has implemented Basel III capital regulations effective April 1, 2013 with full implementation targeted in a phased manner by March 31, 2019.Transitional Arrangements - BASEL III Capital Regulations (% of RWAs)
Minimum capital ratios March March March March 31, 2017 31, 2018 31, 2019 31, 2020 Minimum Common Equity Tier 1 (CET1) A 5.5000 5.5000 5.5000 5.5000 Capital conservation buffer (CCB) B 1.2500 1.8750 2.5000 2.5000 Global Systemically Important Banks buffer (GSIB) C 1.5000 2.2500 3.0000 3.0000 Minimum Tier 1 capital D 7.0000 7.0000 7.000 7.0000 Minimum Total Capital * E 9.0000 9.0000 9.0000 9.0000 Minimum Regulatory Capital Requirement F=E+B+C 11.7500 13.1250 14.5000 14.5000 Internal Capital Guideline G=F+2%(#) 13.7500 15.1250 16.5000 16.5000 *Thedifferencebetweentheminimumtotalcapitalrequirementof9%andtheTier1requirementcanbemetwithTier2andhigher formsofcapital. # Current internal buffer over regulatory capital requirement, subject to annual review.
Under BASEL III norms - transitional arrangements, the bank is required to maintain a minimum total capital to risk-weighted assets ratio (“CRAR”) of 11.75% (including CCB and G SIB requirement) and a minimum Common Equity Tier 1 CRAR of 5.5% and minimum Tier 1 CRAR of 7.0% as at March 31, 2017.
I. Qualitative disclosures: The provisions of Accounting Standard (“AS”) 21 - Consolidated Financial statements, AS 23 Accounting for Investments in Associates
in Consolidated Financial statements & AS 27 - Financial Reporting of Interest in Joint Ventures, issued by The Institute of Chartered Ac-countants of India (“ICAI”) and notified by the Companies (Accounting Standards) Rules 2006 do not apply to the Bank. BANA India has not invested its capital in any of the entities operating in India and owned by BAC. Further, the Bank does not have any interest in insurance entities. Hence the qualitative disclosures are only made for BANA India as a standalone entity.
a. List of group entities considered for consolidation
Name of the Whether the entity Explain the Whether the Explain the Explain the Explain the entity / Country of is included under method of entity is included method of reasons for reasons if incorporation accounting scope consolidation under regulatory consolidation difference in consolidated of consolidation scope of the method of under only one (yes / no) consolidation consolidation of the scopes (yes / no) of consolidation Not Applicable
b. List of group entities not considered for consolidation both under the accounting and regulatory scope of consolidation
Name of the Principle activity Total balance sheet % of bank’s Regulatory Total balance sheet entity / Country of the entity equity (as stated in holding in treatment of bank’s assets (as stated in of incorporation the accounting the total investments in the the accounting balance sheet of equity capital instruments balance sheet of the the legal entity) of the entity legal entity) INR mm* INR mm* DSP Merrill Securities Lynch Limited / Broker/Dealer and India Merchant Banker 28,014 NIL Not Applicable 38,437 DSP Merrill Non-Banking Lynch Capital Financial Company Limited / India (NBFC) 11,566 NIL Not Applicable 11,672
*AmountsareasperauditedfinancialstatementsasonMarch31,2017
BASEL III – PILLAR 3 DISCLOSURES AS AT MARCH 31, 2017
BANK OF AMERICA, N.A.(INDIA BRANCHES)(Incorporated in U.S.A. With Limited Liability)
july 15, 2017 vol LII no 28 EPW Economic & Political Weekly110
II. Quantitative disclosuresc. List of group entities considered for consolidation
Name of the entity / Principle activity Total balance sheet equity Total balance sheet assets country of incorporation of the entity (as stated in the (as stated in the accounting (as indicated in (i)a. above) accounting balance sheet balance sheet of the of the legal entity) legal entity)
Not Applicable
d. The aggregate amount of capital deficiencies in all subsidiaries which are not included in the regulatory scope of consolidation i.e. that are deducted:
Name of the subsidiaries / Principle activity Total balance sheet % of bank’s holding Capital deficiencies country of incorporation of the entity equity (as stated in the total equity in the accounting balance sheet of the legal entity) Not Applicable
e. The aggregate amounts (e.g. current book value) of the bank’s total interests in insurance entities, which are risk-weighted: Name of the insurance Principle activity Total balance sheet % of bank’s holding in Quantitative impact entities / country of of the entity equity (as stated in the total equity / on regulatory capital incorporation the accounting balance proportion of of using risk weighting sheet of the legal entity) voting power method versus using the full deduction method Not Applicable
f. Any restrictions or impediments on transfer of funds or regulatory capital within the banking group: Disclosures for BANA India are given as a standalone entity and therefore this disclosure requirement is not applicable.
Table DF-2: Capital AdequacyI. Qualitative disclosures The Bank is required to comply with all applicable laws and regulations in India including guidelines issued by RBI and other relevant regu-
latory bodies. The Internal Capital Adequacy Assessment Process (“ICAAP”) document assesses the capital adequacy for the Bank and details the process by which
this assessment is made based on a reference date and looking forward, over a three-year planning horizon (“ICAAP Planning Horizon”). ICAAP establishes a framework for banks to perform a comprehensive assessment of the risks they face and relate capital to those risks.
The capital analysis performed by the Bank is expected to encompass all risks, not just the risks captured by the Basel III Pillar 1 minimum regulatory capital calculation. Successful risk identification and measurement requires having a comprehensive process to quantify measure and aggregate these various risks in order to ensure that the Bank’s capital resources are sufficient to cushion volatility in earnings due to unexpected losses.
The authority to develop the ICAAP document is delegated to the Finance department. The Bank’s Chief Financial Officer (“CFO”) is re-sponsible for the production of ICAAP with inputs from Front Line Units (“Businesses” or “Business”), Independent Risk Management and Control Functions. Enterprise-wide functions, including Treasury and Control Function (“TCF”) Risk and International Capital Management and Advisory (“ICMA”) also review the ICAAP to ensure adequate challenge and consistency with Enterprise practices.
The Bank has established an Internal Capital Guideline (“IGL”) and maintains capital levels in excess of this guideline. IGL is set above minimum regulatory requirements to serve as an early warning signal to prompt action and avoid a capital breach.
The ICAAP document is presented to the Asset Liability Committee (“ALCO”) and the LMT for final review and approval on an annual basis. The ICAAP is also validated by Corporate Audit periodically, as required under RBI guidelines.
ICAAP is an integral management tool for determining the adequacy of the Bank’s capital resources throughout the ICAAP planning horizon. It is also utilized to assess the risks being faced by the Bank and assess the adequacy of BANA India’s capital under Baseline as well as Stress Scenarios over the ICAAP Planning Horizon. The ALCO and the LMT are responsible for acting at an early stage to prevent capital from falling below the minimum levels required to support risk characteristics.
Capital Requirements for Pillar 1 risks (i.e. Credit Risk, Market Risk and Operational Risk) The Bank has adopted Standardized Approach (“SA”) for credit risk, Standardized Duration Approach (“SDA”) for market risk and Basic
Indicator Approach (“BIA”) for operational risk for computing its capital requirement. Under the SA for credit risk, the Bank relies upon the ratings issued by the external credit rating agencies specified by the RBI for assigning
risk weights for capital adequacy purposes under the Basel III guidelines. The risk weights applicable for claims against banks, sovereign, corporate and other Assets are as per the Basel III guidelines. In compiling the credit exposures, the Bank does not reduce cash collateral received if any, against credit exposures as eligible credit mitigants, as permitted by the RBI.
Under the SDA for computing the capital requirement for market risk, the Bank has adopted the “duration” method. The minimum capital requirement for market risk is computed in terms of: a. “Specific risk" charge for each security, to protect against an adverse movement in the price of an individual security owing to factors
related to the individual issuer.
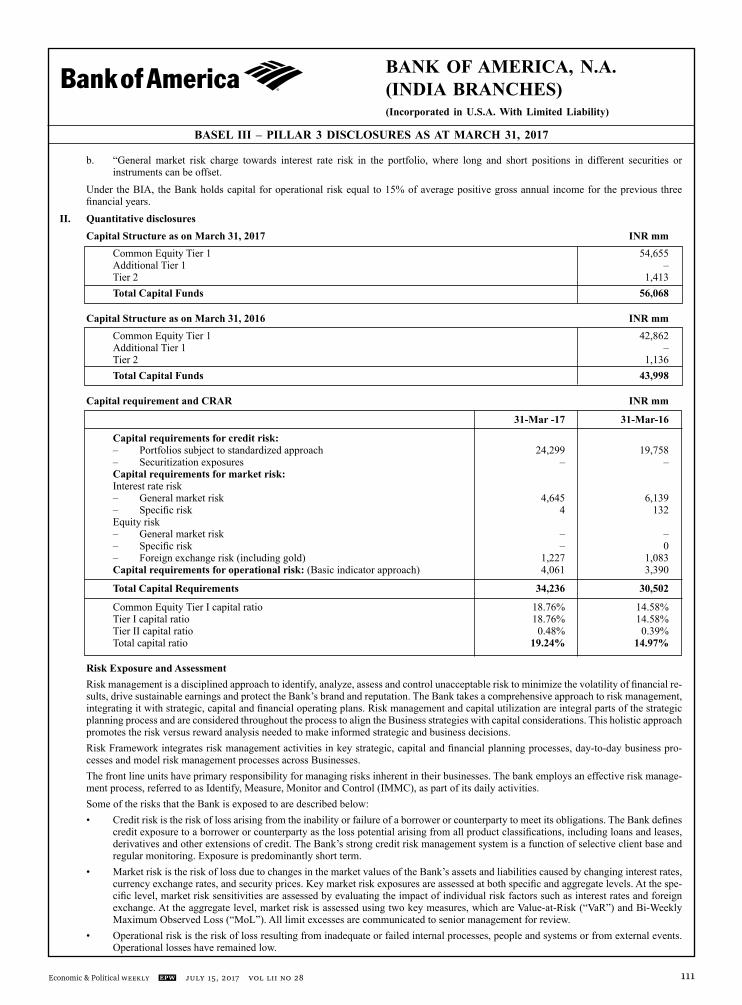
BANK OF AMERICA, N.A.(INDIA BRANCHES)(Incorporated in U.S.A. With Limited Liability)
Economic & Political Weekly EPW july 15, 2017 vol LII no 28 111
BASEL III – PILLAR 3 DISCLOSURES AS AT MARCH 31, 2017
b. “General market risk charge towards interest rate risk in the portfolio, where long and short positions in different securities or instruments can be offset.
Under the BIA, the Bank holds capital for operational risk equal to 15% of average positive gross annual income for the previous three financial years.
II. Quantitative disclosures Capital Structure as on March 31, 2017 INR mm Common Equity Tier 1 54,655 Additional Tier 1 – Tier 2 1,413 Total Capital Funds 56,068
Capital Structure as on March 31, 2016 INR mm Common Equity Tier 1 42,862 Additional Tier 1 – Tier 2 1,136 Total Capital Funds 43,998
Capital requirement and CRAR INR mm
31-Mar -17 31-Mar-16
Capital requirements for credit risk: – Portfolios subject to standardized approach 24,299 19,758 – Securitization exposures – – Capital requirements for market risk: Interest rate risk – General market risk 4,645 6,139 – Specific risk 4 132 Equity risk – General market risk – – – Specific risk – 0 – Foreign exchange risk (including gold) 1,227 1,083 Capital requirements for operational risk: (Basic indicator approach) 4,061 3,390
Total Capital Requirements 34,236 30,502
Common Equity Tier I capital ratio 18.76% 14.58% Tier I capital ratio 18.76% 14.58% Tier II capital ratio 0.48% 0.39% Total capital ratio 19.24% 14.97%
Risk Exposure and Assessment Risk management is a disciplined approach to identify, analyze, assess and control unacceptable risk to minimize the volatility of financial re-
sults, drive sustainable earnings and protect the Bank’s brand and reputation. The Bank takes a comprehensive approach to risk management, integrating it with strategic, capital and financial operating plans. Risk management and capital utilization are integral parts of the strategic planning process and are considered throughout the process to align the Business strategies with capital considerations. This holistic approach promotes the risk versus reward analysis needed to make informed strategic and business decisions.
Risk Framework integrates risk management activities in key strategic, capital and financial planning processes, day-to-day business pro-cesses and model risk management processes across Businesses.
The front line units have primary responsibility for managing risks inherent in their businesses. The bank employs an effective risk manage-ment process, referred to as Identify, Measure, Monitor and Control (IMMC), as part of its daily activities.
Some of the risks that the Bank is exposed to are described below: • Credit risk is the risk of loss arising from the inability or failure of a borrower or counterparty to meet its obligations. The Bank defines
credit exposure to a borrower or counterparty as the loss potential arising from all product classifications, including loans and leases, derivatives and other extensions of credit. The Bank’s strong credit risk management system is a function of selective client base and regular monitoring. Exposure is predominantly short term.
• Market risk is the risk of loss due to changes in the market values of the Bank’s assets and liabilities caused by changing interest rates, currency exchange rates, and security prices. Key market risk exposures are assessed at both specific and aggregate levels. At the spe-cific level, market risk sensitivities are assessed by evaluating the impact of individual risk factors such as interest rates and foreign exchange. At the aggregate level, market risk is assessed using two key measures, which are Value-at-Risk (“VaR”) and Bi-Weekly Maximum Observed Loss (“MoL”). All limit excesses are communicated to senior management for review.
• Operational risk is the risk of loss resulting from inadequate or failed internal processes, people and systems or from external events. Operational losses have remained low.

BANK OF AMERICA, N.A.(INDIA BRANCHES)(Incorporated in U.S.A. With Limited Liability)
july 15, 2017 vol LII no 28 EPW Economic & Political Weekly112
BASEL III – PILLAR 3 DISCLOSURES AS AT MARCH 31, 2017
• Strategic risk including business risk is the risk that results from adverse business decisions, inappropriate business plans, ineffective business strategy execution, or failure to respond in a timely manner to changes in the macroeconomic environment, such as business cycles, competitor actions, changing customer preferences, product obsolescence, technology developments and the regulatory envi-ronment. BANA India manages strategic risk through the following approaches:
• Assessment of strategic risk in connection with its strategic and operating plans through the ICAAP process. • Assessing earnings and risk profile throughout the year. These are periodically discussed in various governance committees. • Liquidity risk is the potential inability to meet expected or unexpected cash flow and collateral needs while continuing to support our
business and customer needs under a range of economic conditions. The primary objective of liquidity risk management is to ensure that BANA India can meet expected and unexpected cash flow and collateral needs while continuing to support our businesses and customers with the appropriate funding sources, under a range of economic conditions. BANA India maintains a Liquidity Risk Policy (Branch Supplement) and Contingency Funding Plan for managing its asset and liability position in accordance with the RBI guidelines.
• Reputational risk is the potential that negative publicity regarding an organization’s business practices will adversely affect its profit-ability, operations or customer base or require costly litigation or other measures. It is the potential risk that negative publicity regarding an organization's conduct, or business practices, will adversely affect its profitability, operations or customer base, or require costly litigation or other defensive measures, is by its nature extremely difficult to quantify and lends itself to being mitigated by good gover-nance controls.
• Compliance risk is the risk of legal or regulatory sanctions arising from the failure to comply with requirements of banking and fi-nancial services laws, rules and regulations. Compliance is at the core of the Company’s culture and is a key component of the risk management discipline
Risk Governance BANA India has the following senior management level local committees or groups for risk governance. Local Management Team (“LMT”) The LMT is chaired by the Country Executive Officer of the Bank. It is the primary body which provides strategic direction to the Bank and
ensures compliance with regulatory requirements and the internal policies of the Bank. It is responsible for branch governance and oversight of branch operations. It is also responsible for reviewing and approving new business and products. It reviews the country performance with respect to strategic objectives. The LMT holds meetings six times in a financial year or more frequently if required. The LMT reviews and approves the ICAAP on an annual basis or upon any revision in the interim.
Asset Liability Committee (“ALCO”) The ALCO is chaired by the Country Executive Officer of the Bank. The ALCO is responsible for establishing policies and providing direc-
tives to manage the structural balance sheet risks arising over time, resulting from the Bank’s business activities originating from the changing asset-liability mix. It provides management oversight of balance sheet, capital and liquidity management activities of the Bank. The ALCO holds meetings four times in a financial year or more frequently if required. The ALCO reviews and approves the ICAAP on an annual basis or upon any revision in the interim.
Risk Management Committee (“RMC”) RMC is chaired by the Chief Risk Officer. RMC serves as an oversight body to provide strategic direction for a progressive risk management
system and policies & strategy to be followed to mitigate the risks associated with the business. RMC comprises senior management of the Bank and representatives from front line units and relevant control & support functions. RMC meets at least on a quarterly basis.
Customer Service Committee (“CSC”) Customer Service Committee (‘CSC’) is responsible for activities relating to customer service and client services issues. CSC meets four
times in a year. The committee is chaired by Head - Banking Operations. Audit Council The Audit Council assists LMT in exercising oversight of the effectiveness of the Bank’s system of internal controls and policies and proce-
dures for managing and accessing risk, integrity of the financial statements of the Bank, and compliance by the Bank with legal and regulatory requirements. The Council also provides direct oversight over the audit function. The Audit Council meets at least four times in a year.
Technology Steering Committee (“TSC”) The TSC is chaired by the Chief Information Officer ("CIO"). The Technology Steering Committee (TSC) oversees projects in partnership
with the Regional / Global Technology and other Functional teams across the Bank including common infrastructure or other projects cutting across businesses or support groups. The TSC meets at least six times in a year or more frequent, if required.
The TSC is mainly responsible for: • To assist the Executive Management in implementing Information technology (“IT”) Strategy that has been approved by the by global/
regional and local management forums, • Setting project priorities, reviewing critical project status and milestones, • Monitoring IT governance, risk and controls, and • Providing regular updates to the India LMT on significant Technology matters. Regulatory Governance Group (“RGG”) Returns Governance Group (RGG) was formed based on guidance by RBI in ‘Approach Paper on Automated Data Flow from Banks’ and
guidance on Supervisory Program for Assessment of Risk and Capital (SPARC). RGG is the governance body responsible for providing over-sight to all regulatory submissions, including Risk Based Supervision. RGG, as required by RBI shall inter-alia comprise of representatives from Compliance, Business, Technology, etc. and perform inter-alia the following roles.
BANK OF AMERICA, N.A.(INDIA BRANCHES)(Incorporated in U.S.A. With Limited Liability)
Economic & Political Weekly EPW july 15, 2017 vol LII no 28 113
BASEL III – PILLAR 3 DISCLOSURES AS AT MARCH 31, 2017BASEL III – PILLAR 3 DISCLOSURES AS AT MARCH 31, 2017BASEL III – PILLAR 3 DISCLOSURES AS AT MARCH 31, 2017BASEL III – PILLAR 3 DISCLOSURES AS AT MARCH 31, 2017
• Act as the owner of all the layers indicated in the end state from the process perspective and in the context of automated submission systems ensure governance around Data Acquisition, Data conversion and Data submission.
• Provide oversight and guidance to Technology Steering Committee, which is currently managing the automation of RBS reports, etc.
• Review and escalation point for Technology Steering Committee for handling change request for any new requirement by Reserve Bank and also handling ad-hoc queries.
• Ensuring governance that the metadata is as per the regulatory definitions.
Table DF-3: Credit Risk: General Disclosures
I. Qualitative disclosures
Robust risk management policies and procedures are laid out in the Global Banking and Markets Core policy. It is supplemented by the Credit Compliance Manual. Written policies, procedures, standards, and guidelines are updated on a regular basis to provide a clear direction to officers for meeting the requirements for which they are accountable. Approval authority is vested via an Approval Grid which takes into account the quantum, internal risk rating and nature of exposure and the position/experience of the approver.
The Bank manages credit risk based on the risk profile of the borrower or counterparty, repayment sources, the nature of underlying col-lateral, and other support given current events, conditions and expectations. Credit risk management begins with an assessment of the credit risk profile of the borrower or counterparty based on an analysis of their financial position. As part of the overall credit risk assessment of a borrower or counterparty, credit exposures are assigned a risk rating and are subject to approval based on defined credit approval standards. Subsequent to loan origination, risk ratings are monitored on an ongoing basis. If necessary, risk ratings are adjusted to reflect changes in the financial condition and cash flow of a borrower or counterparty.
The Bank has a policy of internal rating on a scale of Risk Rating (“RR”) 1-11, and the RR is continuously monitored with a change in RR as and when it is warranted. Exposures with RR of 8 or more (criticized assets) are subject to intensive scrutiny by the senior management.
Definitions
• Overdue: Any amount due to Bank under any credit facility is ‘overdue’ if it is not paid by the due date.
Norms for determining when to classify various types of assets as non-performing
• Term loans are treated as non-performing if the interest and/or installments of principal remain overdue for a period of more than 90 days.
• Cash credits & overdrafts are treated as non-performing if the accounts remain out of order for a period of more than 90 days.
• An account will be treated “out of order” if the outstanding balance remains continuously in excess of the sanctioned limit/drawing power. In case where the outstanding balance is less than the sanctioned limit/drawing power, but there are no credits continuously for 90 days as on balance-sheet date or credits are not enough to cover the interest debited during the same period, these accounts will be treated as out of order.
• Bills purchased/discounted are treated as non-performing if the bill remains overdue and unpaid for a period of more than 90 days.
• Any overdue receivables representing positive mark-to-market value of a foreign exchange and interest rate derivative contracts will be treated as non- performing asset if these remain unpaid for 90 days or more, upon becoming due.
• Any other facility will be treated as non-performing if any amount to be received remains overdue for a period of more than 90 days during the financial year.
II. Quantitative disclosures
a. Total Gross credit exposures INR mm
31-Mar -17 31-Mar-16
Fund Based 262,179 200,217 Non-Fund Based 2 57,579 65,256
b. Geographic distribution INR mm
31-Mar -17 31-Mar-16
Domestic Overseas 3 Domestic Overseas 3
Fund Based 262,179 – 200,217 – Non-Fund Based 2 57,579 – 65,256 –
2 Includesmarketaswellasnon-marketrelatedexposures 3 AspertheclarificationgivenintheguidelinesforPillar3disclosures,definitionofOverseasandDomesticshouldbeasadoptedfor
segmentreportingincompliancewithAccountingStandard-17issuedbyICAI.AstheBankdoesnothaveanyoverseasoperations,allexposuresarereportedunderdomesticexposures.
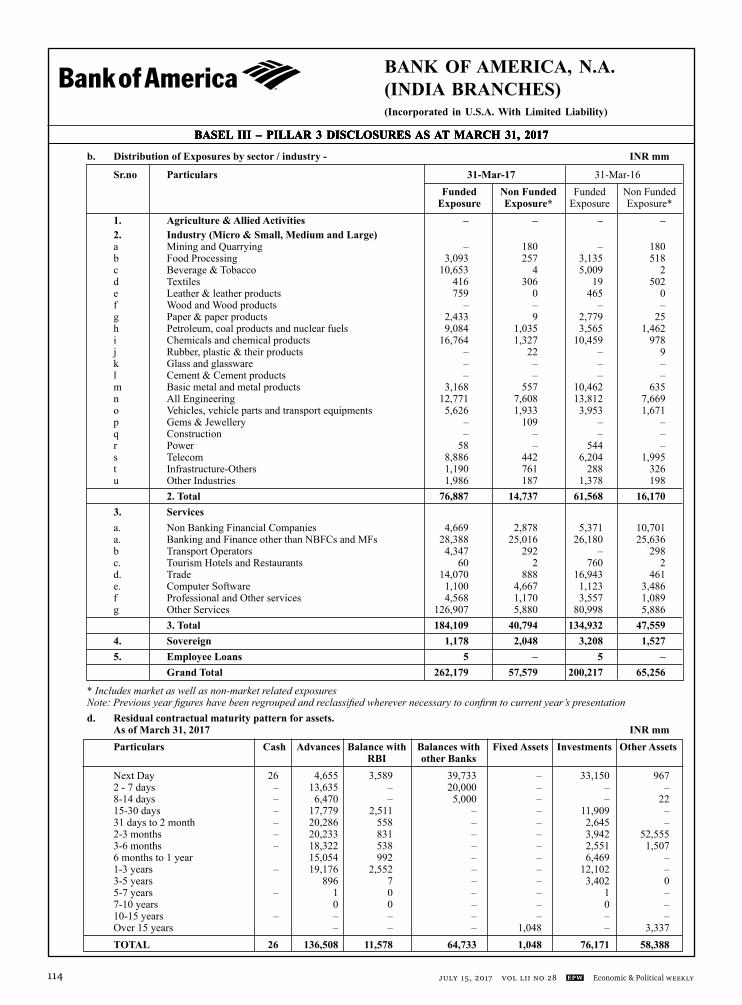
BANK OF AMERICA, N.A.(INDIA BRANCHES)(Incorporated in U.S.A. With Limited Liability)
july 15, 2017 vol LII no 28 EPW Economic & Political Weekly114
BASEL III – PILLAR 3 DISCLOSURES AS AT MARCH 31, 2017BASEL III – PILLAR 3 DISCLOSURES AS AT MARCH 31, 2017BASEL III – PILLAR 3 DISCLOSURES AS AT MARCH 31, 2017BASEL III – PILLAR 3 DISCLOSURES AS AT MARCH 31, 2017
b. Distribution of Exposures by sector / industry - INR mm
Sr.no Particulars 31-Mar-17 31-Mar-16 Funded Non Funded Funded Non Funded Exposure Exposure* Exposure Exposure* 1. Agriculture & Allied Activities – – – – 2. Industry (Micro & Small, Medium and Large) a Mining and Quarrying – 180 – 180 b Food Processing 3,093 257 3,135 518 c Beverage & Tobacco 10,653 4 5,009 2 d Textiles 416 306 19 502 e Leather & leather products 759 0 465 0 f Wood and Wood products – – – – g Paper & paper products 2,433 9 2,779 25 h Petroleum, coal products and nuclear fuels 9,084 1,035 3,565 1,462 i Chemicals and chemical products 16,764 1,327 10,459 978 j Rubber, plastic & their products – 22 – 9 k Glass and glassware – – – – l Cement & Cement products – – – – m Basic metal and metal products 3,168 557 10,462 635 n All Engineering 12,771 7,608 13,812 7,669 o Vehicles, vehicle parts and transport equipments 5,626 1,933 3,953 1,671 p Gems & Jewellery – 109 – – q Construction – – – – r Power 58 – 544 – s Telecom 8,886 442 6,204 1,995 t Infrastructure-Others 1,190 761 288 326 u Other Industries 1,986 187 1,378 198 2. Total 76,887 14,737 61,568 16,170 3. Services a. Non Banking Financial Companies 4,669 2,878 5,371 10,701 a. Banking and Finance other than NBFCs and MFs 28,388 25,016 26,180 25,636 b Transport Operators 4,347 292 – 298 c. Tourism Hotels and Restaurants 60 2 760 2 d. Trade 14,070 888 16,943 461 e. Computer Software 1,100 4,667 1,123 3,486 f Professional and Other services 4,568 1,170 3,557 1,089 g Other Services 126,907 5,880 80,998 5,886 3. Total 184,109 40,794 134,932 47,559 4. Sovereign 1,178 2,048 3,208 1,527 5. Employee Loans 5 – 5 – Grand Total 262,179 57,579 200,217 65,256
*Includesmarketaswellasnon-marketrelatedexposures Note:Previousyearfigureshavebeenregroupedandreclassifiedwherevernecessarytoconfirmtocurrentyear’spresentation d. Residual contractual maturity pattern for assets. As of March 31, 2017 INR mm Particulars Cash Advances Balance with Balances with Fixed Assets Investments Other Assets RBI other Banks Next Day 26 4,655 3,589 39,733 – 33,150 967 2 - 7 days – 13,635 – 20,000 – – – 8-14 days – 6,470 – 5,000 – – 22 15-30 days – 17,779 2,511 – – 11,909 – 31 days to 2 month – 20,286 558 – – 2,645 – 2-3 months – 20,233 831 – – 3,942 52,555 3-6 months – 18,322 538 – – 2,551 1,507 6 months to 1 year 15,054 992 – – 6,469 – 1-3 years – 19,176 2,552 – – 12,102 – 3-5 years 896 7 – – 3,402 0 5-7 years – 1 0 – – 1 – 7-10 years 0 0 – – 0 – 10-15 years – – – – – – – Over 15 years – – – 1,048 – 3,337 TOTAL 26 136,508 11,578 64,733 1,048 76,171 58,388

BANK OF AMERICA, N.A.(INDIA BRANCHES)(Incorporated in U.S.A. With Limited Liability)
Economic & Political Weekly EPW july 15, 2017 vol LII no 28 115
BASEL III – PILLAR 3 DISCLOSURES AS AT MARCH 31, 2017
As of March 31, 2016 INR mm
Particulars Cash Advances Balance with Balances with Fixed Assets Investments Other Assets RBI other Banks Next Day 46 2,923 2,636 1,038 – 29,254 1,332 2 - 7 days – 15,469 – 14,131 – 74,060 – 8-14 days – 7,536 – – – 24,146 3 15-30 days – 15,088 1,635 – – 7,970 – 31 days to 2 month – 13,524 311 – – 1,514 – 2-3 months – 10,582 433 – – 2,761 39,587 3-6 months – 24,611 113 – – 647 2,476 6 months to 1 year – 14,459 1,311 – – 6,390 – 1-3 years – 16,689 2,126 – – 11,776 – 3-5 years 2,580 10 – – 802 – 5-7 years 1 – – – 203 – 7-10 years 1 – – – – – 10-15 years – – – – – – – Over 15 years – – – – 725 – 2,638 TOTAL 46 123,464 8,574 15,169 725 159,523 46,035
e. Amount of NPAs (Gross) – INR 1,100mm (March 31, 2016 – NIL) f. Net NPAs – INR NIL (March 31, 2016 – NIL) g. NPA Ratios – Gross NPA to Gross Advances – 0.80% (March 31, 2016 – NIL) – Net NPA to Net Advances –NIL (March 31, 2016 – NIL) h. Movement of NPAs (Gross) INR mm
31-Mar-17 31-Mar-16 Opening balance – – Additions during the year 1,100 – Reductions during the period – – Closing balance 1,100 –
i. Movement of provision for NPAs INR mm
31-Mar-17 31-Mar-16 Opening balance – – Provisions made during the year 1,100 – Write-off – – Write-back of excess provisions – – Closing balance 1,100 –
j. Non-Performing Investments: NIL (March 31, 2016 – NIL) k. Provisions for Non-Performing Investments – NIL (March 31, 2016 – NIL) l. Movement of provision for Depreciation on Investments INR mm
31-Mar-17 31-Mar-16 Opening balance – – Provisions made during the year – – Write-off – – Write-back of excess provisions – – Closing balance – –
Table DF-4 - Credit Risk: Disclosures for Portfolios Subject to the Standardised ApproachI. Qualitative disclosures The Bank adopts the following basis for assignment of risk weights for different categories of counterparties: a. Scheduled Banks including foreign bank branches in India: All exposures to scheduled banks for the purpose of Pillar 1 calculation, have been applied a 20% risk weight, since these exposures
are made to counterparty banks having overall capital adequacy ratio of 9% and above. b. Foreign Banks: Ratings for foreign banks have been sourced from websites of Fitch, Moody’s and Standard & Poor’s. The bank has applied risk
weights relevant to the ratings assigned by international credit rating agencies as prescribed by RBI. c. Corporates: Where the obligors have obtained rating of the facility from any of the accredited credit rating agencies viz. Brickwork Ratings India
Pvt. Limited, Credit Analysis & Research Limited (CARE), CRISIL Limited, ICRA Limited (ICRA), India Ratings and Research Private Limited (Fitch), SME Rating Agency of India Ltd. (SMERA) as specified by the RBI, the Bank has applied the risk weights relevant to the ratings assigned by the credit rating agencies. Where the obligors have not obtained a rating, the exposures are taken as unrated and 100% risk weights applied.
BANA India does not transfer public issue ratings into comparable assets in the banking book.

BANK OF AMERICA, N.A.(INDIA BRANCHES)(Incorporated in U.S.A. With Limited Liability)
july 15, 2017 vol LII no 28 EPW Economic & Political Weekly116
BASEL III – PILLAR 3 DISCLOSURES AS AT MARCH 31, 2017
II. Quantitative disclosures
a. Total Gross credit exposuress INR mm 31-Mar-17 31-Mar-16
Fund Based Below 100% risk weight 70,814 95,404 100% risk weight 191,365 104,813 More than 100% risk weight Deducted
Total 262,179 200,217
INR mm 31-Mar-17 31-Mar-16 Non-Fund Based5 Below 100% risk weight 29,334 28,109 100% risk weight 28,169 37,147 More than 100% risk weight 76
Total 57,579 65,256
5Includesmarketaswellasnon-marketrelatedexposures.Table DF-5: Credit Risk Mitigation: Disclosures for Standardized ApproachesI. Qualitative disclosures In determining credit risk capital, the Bank has not reduced the facility amounts by any corresponding eligible collateral amount in the form
of cash margins. The risk weighted assets are computed based on the gross outstanding facility amount.II. Quantitative disclosures The Bank has not availed Credit Risk Mitigation Techniques (“CMT”) as at March 31, 2017.Table DF-6: Securitization Exposures: Disclosure for Standardized ApproachI. Qualitative disclosures There are no securitization transactions originated by the Bank. II. Quantitative disclosures A. Banking Book Total amount of exposures securitized by the Bank: Nil (March 31, 2016: Nil) Amount of assets intended to be securitized within a year: Nil (March 31, 2016: Nil) Total amount of assets securitized and unrecognized gain or losses on sale: Nil (March 31, 2016: Nil) Aggregate amount of on-balance sheet and off-balance sheet securitization exposures purchased and break-up by exposure type
31-Mar-17 31-Mar-16
INR mm Exposure Type Exposure Amount Exposure Type Exposure Amount On Balance Sheet – – – – Off Balance Sheet – – – –
Total – –
Securitization exposures purchased and the associated capital charge by different risk weight bands
As at 31-Mar-2017 As at 31-Mar-2016
INR mm Exposure Risk Capital Exposure Risk Capital Weighted Requirement Weighted Requirement Assets Assets
Below 100% risk weight – – – – – – 100% risk weight – – – – – – More than 100% risk weight – – – – – –
Total – – – – – –
Securitization Exposures deducted entirely from Tier 1 capital, credit enhancing Interest Only Strips (I/Os) deducted from total capital, and other exposures deducted from total capital: Nil (March 31, 2016: Nil)

BANK OF AMERICA, N.A.(INDIA BRANCHES)(Incorporated in U.S.A. With Limited Liability)
Economic & Political Weekly EPW july 15, 2017 vol LII no 28 117
BASEL III – PILLAR 3 DISCLOSURES AS AT MARCH 31, 2017
B. Trading book • Aggregate amount of exposures securitised by Bank for which bank has retained some exposures and which is subject to market risk
approach: Nil (March 31, 2016: Nil) • Aggregate amount of on-balance sheet securitisation exposures retained or purchased: Nil (March 31, 2016: Nil) • Aggregate amount of off-balance sheet securitisation exposures: Nil (March 31, 2016: Nil) • Aggregate amount of securitization exposures retained or purchased subject to Comprehensive Risk Measure for specific risk : Nil
(March 31, 2016: Nil) • Aggregate amount of securitization exposures retained or purchased subject to securitization framework for specific risk broken into
different risk weight bands: Nil (March 31, 2016: Nil) • Aggregate amount of capital requirements for the securitisation exposures subject to securitisation framework: Nil (March 31, 2016: Nil) • Securitisation Exposures deducted entirely from Tier 1 capital, credit enhancing Interest Only Strips (I/Os) deducted from total capital,
and other exposures deducted from total capital: Nil (March 31, 2016: Nil)
Table DF-7: Market Risk in Trading Book
I. Qualitative disclosures Market risk is the risk of loss due to changes in the market values of the Bank’s assets and liabilities caused by changing interest rates,
currency exchange rates, and security prices. Market risk is inherent in the Bank’s operations and arises from both trading and non-trading positions. Trading exposures represent positions taken in a wide range of financial instruments and markets which expose the Bank to various risks, such as interest rate risk, foreign exchange risk, etc. The Bank manages these risks by using trading strategies and other hedging actions which encompass a variety of financial instruments in both the cash and derivatives markets.
Key market risk exposures are assessed at both specific and aggregate levels. At the specific level, market risk sensitivities are assessed by evaluating the impact of individual risk factors such as interest rates and foreign exchange. At the aggregate level, market risk is assessed using two key measures, which are Value-at-Risk (“VaR”) and Bi-Weekly Maximum Observed Loss (“MoL”).
VaR is a statistical measure of potential portfolio market value loss resulting from changes in market variables, during a given holding period, measured at a specified confidence level. The Branch uses historical simulation approach for VaR and it is calculated over a one-day holding period at a 99% confidence level, using three years of historical data. The performance of VaR model is monitored through daily back-testing and is performed at both Entity and Line of Business (LoB) level. MOL is the potential market value loss on a portfolio over a 10-day holding period using historical data with start date anchored to January 1st, 2007.
VaR and MOL are supplemented with stress tests, which are performed to assess extreme tail events or shocks. The stress tests are designed to highlight exposures to unlikely but plausible events or extremely volatile conditions, both hypothetically and historically.
Market Risk Management Architecture The market risk function is independent of the front office and monitors all prudential limits governing trading activities and reports excep-
tions to senior management.
Market Risk Management Control Market risk of the Branch is primarily managed through establishing and monitoring limits. Investment policy and FX/derivatives policy of
the Branch (or BANA Mumbai) lists the applicable limits and approval processes. Market Risk Management utilizes a suite of reports which assess risk on a daily basis. These reports are distributed to Senior Management on
daily basis. Limit excesses, limit changes (temporary, or permanent) are communicated to Senior Management, as well as to relevant forum such as the LMT, Risk management Committee and the ALCO where applicable.
Market Risk Management Policies and Procedures The Market Risk Management is guided by market risk policies and guidelines. Global market risk management policy is in place and is fol-
lowed. The policy describes how market risk is managed by establishing the key market risk measures, defining roles and responsibilities and describing key monitoring processes in place. In addition, the Investment policy and FX/derivatives policy of the Branch lists the applicable limits and approval processes.
The market risk capital requirement is expressed in terms of two separately calculated charges: • General market risk charge from the interest rate risk in the portfolio in different securities or instruments. • Specific risk charge for each security, which is designed to protect against an adverse movement in the price of an individual security
owing to factors related to the individual issuer. For regulatory capital, the requirements for general market risk are designed to capture the risk of loss arising from changes in market prices
and interest rates. The capital charge is the sum of four components: • the net short or long position in the whole trading book. • a small proportion of the matched positions in each time-band - vertical disallowance. • a larger proportion of the matched positions across different time bands - horizontal disallowance. • a net charge for positions in options. The general market risk charge is measured by using the modified duration method. Foreign exchange open positions (higher of limit or
actual) are risk-weighted at 100%.

BANK OF AMERICA, N.A.(INDIA BRANCHES)(Incorporated in U.S.A. With Limited Liability)
july 15, 2017 vol LII no 28 EPW Economic & Political Weekly118
BASEL III – PILLAR 3 DISCLOSURES AS AT MARCH 31, 2017
II. Quantitative disclosures INR mm 31-Mar-17 31-Mar-16 Capital requirements for: Interest rate risk – general market risk 4,645 6,139 – specific risk 4 132 Equity position risk – – – general market risk – – – specific risk – 0 Foreign exchange risk 1,227 1,083 Total 5,876 7,354
Table DF-8: Operational Risk
Operational RiskIt is the risk of loss resulting from inadequate or failed internal processes, people and systems or from external events. This definition includes legal risk.
Operational Risk Events Inadequate or failed internal processes, people, systems and external events may result in unexpected or undesired consequences including a fi-nancial loss, an unexpected gain, a near miss and/or an opportunity cost (lost future revenue). The events associated with these unintended and/or undesired consequences are termed as operational risk events.
Operational Loss An operational loss is the recorded financial consequence (excluding insurance reimbursements or tax effects) resulting from an operational loss event, including all expenses associated with an operational loss event except for opportunity costs, foregone revenue, and costs related to risk man-agement and control enhancements implemented to prevent future operational losses. Operational loss events can also result in unintended financial gains. BAC classifies operational losses using the Basel II categories and definitions: Internal Fraud; External Fraud; Employment Practices and Workplace Safety; Clients, Products, and Business Practices; Damage to Physical Assets; Business Disruption and System Failures; and Execution, Delivery, and Process Management.BAC manages the operational risks of its business activities using the enterprise-wide Operational Risk Framework. Enterprise-wide Operational Risk policies, processes, tools, and standards are established by Corporate Operational Risk (“COR”) (Global Function) and implemented by Busi-nesses / Enterprise Control Functions (“ECFs”) with oversight from the Independent Business/ECF Risk Teams (Regional Function). Each have a quality assurance role and through direct action or oversight, these stakeholders are collectively responsible for execution of the Operational Risk Program requirements, achievement of risk management objectives, and ensuring timely action is taken in response to concerns and issues.
Governance of Operational RiskGovernance of BAC operational risk is accomplished through formal oversight by the Board of Directors (“the Board”), and the Chief Risk Officer (“CRO”) and the Bank is aligned to the BAC’s overall risk governance framework and practices through the LMT and the local risk oversight groups.
Risk Management ProcessThe BAC Enterprise-wide Operational Risk Management Program includes processes for identification, measurement, mitigating, controlling, monitoring, testing, reviewing and reporting operational risk information to management and the Board. This is implemented through 1) Risk and Control Self Assessment (“RCSA”), 2) Operational Risk Appetite, Key Risk Indicators (“KRIs”), 3) Scenario Analysis, 4) Operational Loss Event Data, 5) External Operational Loss Events, 6) Issues Management Process, 7) Quality Assurance (“QA”) & Validation Framework. Certain elements of bank’s operational risk program may only be performed at global level and / or at regional level by local operational risk officer. The results, relevant to Bank are shared with LMT.
Table DF-9: Interest Rate Risk in the Banking Book (IRRBB)
I. Qualitative disclosures IRRBB represents the banking book’s exposure to adverse movements in interest rates. Client facing activities, primarily lending and deposit
taking, create interest rate sensitive positions on the balance sheet. This exposes the Bank to risk from changes in interest rates. These assets and liabilities essentially reside in the banking book.
IRRBB is measured using both earnings perspective (traditional gap analysis) and economic value perspective (duration gap analysis) and reviewed by the ALCO on a regular basis.
Earnings perspective (traditional gap analysis): measures the sensitivity of net interest income to changes in interest rate over the next 12 months. It involves bucketing of rate sensitive assets and liabilities in the banking book as per residual maturity/re-pricing dates in various time bands and computing the change in net interest income over a one year time horizon for 100 basis points upward and downward rate shocks.
Economic value perspective (duration gap analysis): measures the changes in the Market Value of Equity of the Bank for a 200 basis points upward and downward rate shock. It involves bucketing the interest rate sensitive assets and liabilities as per residual maturity in various time bands and computing the Modified Duration Gap (“MDG”). The MDG is used to evaluate the impact of the upward and downward rate movement on the Market Value of Equity of the Bank.
II. Quantitative disclosures The increase / (decline) in earnings and economic value (on a pre-tax basis) for an upward/downward rate shock broken down by currency is as below
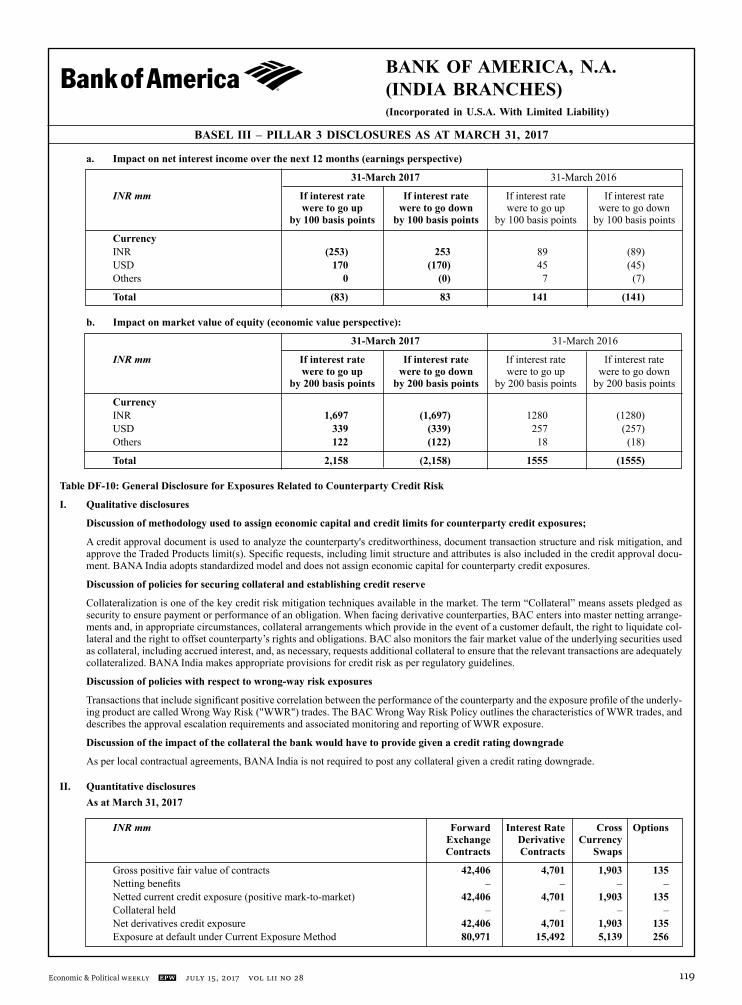
BANK OF AMERICA, N.A.(INDIA BRANCHES)(Incorporated in U.S.A. With Limited Liability)
Economic & Political Weekly EPW july 15, 2017 vol LII no 28 119
a. Impact on net interest income over the next 12 months (earnings perspective)
31-March 2017 31-March 2016
INR mm If interest rate If interest rate If interest rate If interest rate were to go up were to go down were to go up were to go down by 100 basis points by 100 basis points by 100 basis points by 100 basis points
Currency INR (253) 253 89 (89) USD 170 (170) 45 (45) Others 0 (0) 7 (7)
Total (83) 83 141 (141)
b. Impact on market value of equity (economic value perspective):
31-March 2017 31-March 2016
INR mm If interest rate If interest rate If interest rate If interest rate were to go up were to go down were to go up were to go down by 200 basis points by 200 basis points by 200 basis points by 200 basis points
Currency INR 1,697 (1,697) 1280 (1280) USD 339 (339) 257 (257) Others 122 (122) 18 (18)
Total 2,158 (2,158) 1555 (1555)
Table DF-10: General Disclosure for Exposures Related to Counterparty Credit Risk
I. Qualitative disclosures
Discussion of methodology used to assign economic capital and credit limits for counterparty credit exposures;
A credit approval document is used to analyze the counterparty's creditworthiness, document transaction structure and risk mitigation, and approve the Traded Products limit(s). Specific requests, including limit structure and attributes is also included in the credit approval docu-ment. BANA India adopts standardized model and does not assign economic capital for counterparty credit exposures.
Discussion of policies for securing collateral and establishing credit reserve
Collateralization is one of the key credit risk mitigation techniques available in the market. The term “Collateral” means assets pledged as security to ensure payment or performance of an obligation. When facing derivative counterparties, BAC enters into master netting arrange-ments and, in appropriate circumstances, collateral arrangements which provide in the event of a customer default, the right to liquidate col-lateral and the right to offset counterparty’s rights and obligations. BAC also monitors the fair market value of the underlying securities used as collateral, including accrued interest, and, as necessary, requests additional collateral to ensure that the relevant transactions are adequately collateralized. BANA India makes appropriate provisions for credit risk as per regulatory guidelines.
Discussion of policies with respect to wrong-way risk exposures
Transactions that include significant positive correlation between the performance of the counterparty and the exposure profile of the underly-ing product are called Wrong Way Risk ("WWR") trades. The BAC Wrong Way Risk Policy outlines the characteristics of WWR trades, and describes the approval escalation requirements and associated monitoring and reporting of WWR exposure.
Discussion of the impact of the collateral the bank would have to provide given a credit rating downgrade
As per local contractual agreements, BANA India is not required to post any collateral given a credit rating downgrade.
II. Quantitative disclosures As at March 31, 2017
INR mm Forward Interest Rate Cross Options Exchange Derivative Currency Contracts Contracts Swaps
Gross positive fair value of contracts 42,406 4,701 1,903 135 Netting benefits – – – – Netted current credit exposure (positive mark-to-market) 42,406 4,701 1,903 135 Collateral held – – – – Net derivatives credit exposure 42,406 4,701 1,903 135 Exposure at default under Current Exposure Method 80,971 15,492 5,139 256
BASEL III – PILLAR 3 DISCLOSURES AS AT MARCH 31, 2017
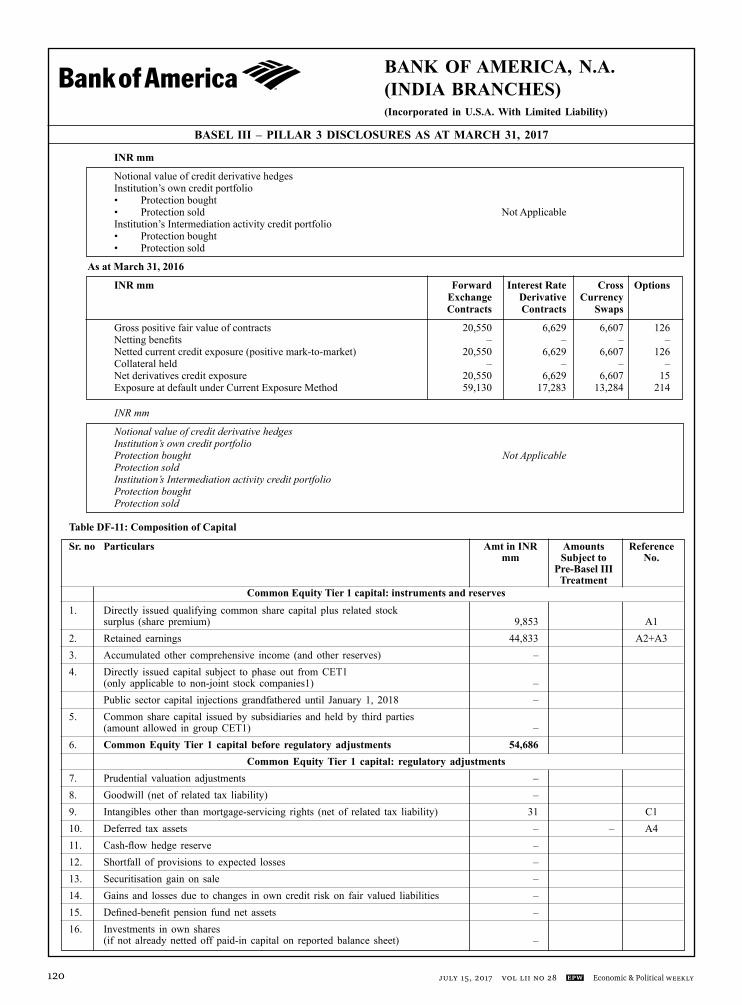
BANK OF AMERICA, N.A.(INDIA BRANCHES)(Incorporated in U.S.A. With Limited Liability)
july 15, 2017 vol LII no 28 EPW Economic & Political Weekly120
INR mm
Notional value of credit derivative hedges Institution’s own credit portfolio • Protection bought • Protection sold Not Applicable Institution’s Intermediation activity credit portfolio • Protection bought • Protection sold
As at March 31, 2016
INR mm Forward Interest Rate Cross Options Exchange Derivative Currency Contracts Contracts Swaps
Gross positive fair value of contracts 20,550 6,629 6,607 126 Netting benefits – – – – Netted current credit exposure (positive mark-to-market) 20,550 6,629 6,607 126 Collateral held – – – – Net derivatives credit exposure 20,550 6,629 6,607 15 Exposure at default under Current Exposure Method 59,130 17,283 13,284 214
INRmm
Notionalvalueofcreditderivativehedges Institution’sowncreditportfolio Protectionbought NotApplicable Protectionsold Institution’sIntermediationactivitycreditportfolio Protectionbought Protectionsold
Table DF-11: Composition of Capital
Sr. no Particulars Amt in INR Amounts Reference mm Subject to No. Pre-Basel III Treatment
Common Equity Tier 1 capital: instruments and reserves1. Directly issued qualifying common share capital plus related stock surplus (share premium) 9,853 A12. Retained earnings 44,833 A2+A33. Accumulated other comprehensive income (and other reserves) – 4. Directly issued capital subject to phase out from CET1 (only applicable to non-joint stock companies1) – Public sector capital injections grandfathered until January 1, 2018 – 5. Common share capital issued by subsidiaries and held by third parties (amount allowed in group CET1) – 6. Common Equity Tier 1 capital before regulatory adjustments 54,686
Common Equity Tier 1 capital: regulatory adjustments7. Prudential valuation adjustments – 8. Goodwill (net of related tax liability) – 9. Intangibles other than mortgage-servicing rights (net of related tax liability) 31 C110. Deferred tax assets – – A411. Cash-flow hedge reserve – 12. Shortfall of provisions to expected losses – 13. Securitisation gain on sale – 14. Gains and losses due to changes in own credit risk on fair valued liabilities – 15. Defined-benefit pension fund net assets – 16. Investments in own shares (if not already netted off paid-in capital on reported balance sheet) –
BASEL III – PILLAR 3 DISCLOSURES AS AT MARCH 31, 2017
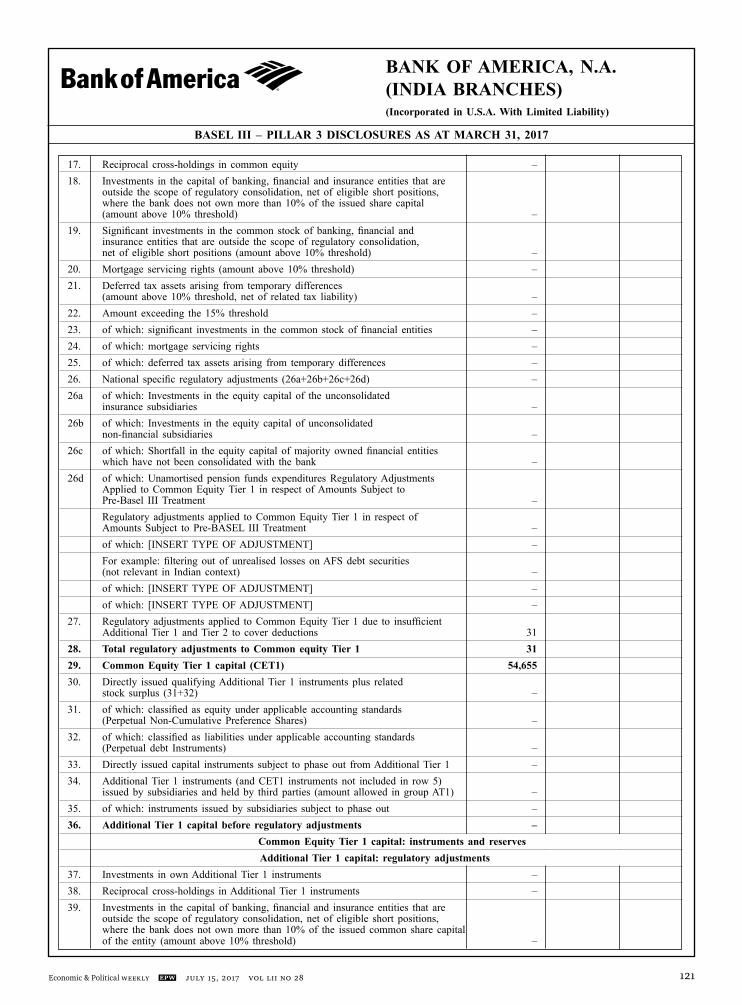
BANK OF AMERICA, N.A.(INDIA BRANCHES)(Incorporated in U.S.A. With Limited Liability)
Economic & Political Weekly EPW july 15, 2017 vol LII no 28 121
BASEL III – PILLAR 3 DISCLOSURES AS AT MARCH 31, 2017
17. Reciprocal cross-holdings in common equity – 18. Investments in the capital of banking, financial and insurance entities that are outside the scope of regulatory consolidation, net of eligible short positions, where the bank does not own more than 10% of the issued share capital (amount above 10% threshold) – 19. Significant investments in the common stock of banking, financial and insurance entities that are outside the scope of regulatory consolidation, net of eligible short positions (amount above 10% threshold) – 20. Mortgage servicing rights (amount above 10% threshold) – 21. Deferred tax assets arising from temporary differences (amount above 10% threshold, net of related tax liability) – 22. Amount exceeding the 15% threshold – 23. of which: significant investments in the common stock of financial entities – 24. of which: mortgage servicing rights – 25. of which: deferred tax assets arising from temporary differences – 26. National specific regulatory adjustments (26a+26b+26c+26d) – 26a of which: Investments in the equity capital of the unconsolidated insurance subsidiaries – 26b of which: Investments in the equity capital of unconsolidated non-financial subsidiaries – 26c of which: Shortfall in the equity capital of majority owned financial entities which have not been consolidated with the bank – 26d of which: Unamortised pension funds expenditures Regulatory Adjustments Applied to Common Equity Tier 1 in respect of Amounts Subject to Pre-Basel III Treatment – Regulatory adjustments applied to Common Equity Tier 1 in respect of Amounts Subject to Pre-BASEL III Treatment – of which: [INSERT TYPE OF ADJUSTMENT] – For example: filtering out of unrealised losses on AFS debt securities (not relevant in Indian context) – of which: [INSERT TYPE OF ADJUSTMENT] – of which: [INSERT TYPE OF ADJUSTMENT] – 27. Regulatory adjustments applied to Common Equity Tier 1 due to insufficient Additional Tier 1 and Tier 2 to cover deductions 31 28. Total regulatory adjustments to Common equity Tier 1 31 29. Common Equity Tier 1 capital (CET1) 54,655 30. Directly issued qualifying Additional Tier 1 instruments plus related stock surplus (31+32) – 31. of which: classified as equity under applicable accounting standards (Perpetual Non-Cumulative Preference Shares) – 32. of which: classified as liabilities under applicable accounting standards (Perpetual debt Instruments) – 33. Directly issued capital instruments subject to phase out from Additional Tier 1 – 34. Additional Tier 1 instruments (and CET1 instruments not included in row 5) issued by subsidiaries and held by third parties (amount allowed in group AT1) – 35. of which: instruments issued by subsidiaries subject to phase out – 36. Additional Tier 1 capital before regulatory adjustments – Common Equity Tier 1 capital: instruments and reserves
Additional Tier 1 capital: regulatory adjustments37. Investments in own Additional Tier 1 instruments – 38. Reciprocal cross-holdings in Additional Tier 1 instruments – 39. Investments in the capital of banking, financial and insurance entities that are outside the scope of regulatory consolidation, net of eligible short positions, where the bank does not own more than 10% of the issued common share capital of the entity (amount above 10% threshold) –
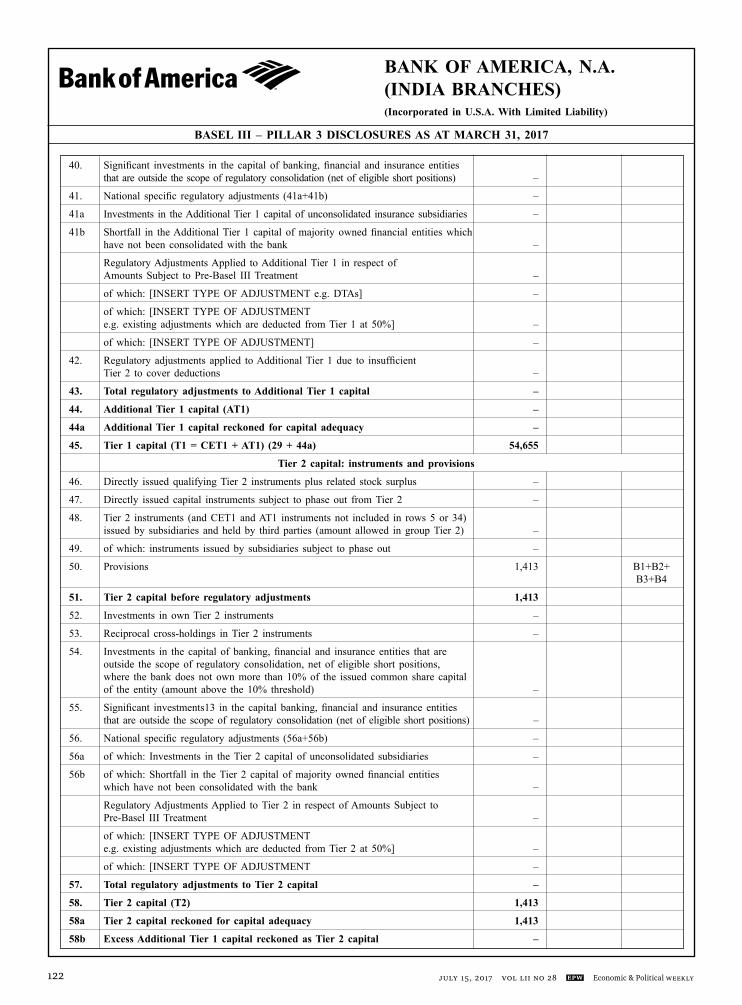
BANK OF AMERICA, N.A.(INDIA BRANCHES)(Incorporated in U.S.A. With Limited Liability)
july 15, 2017 vol LII no 28 EPW Economic & Political Weekly122
BASEL III – PILLAR 3 DISCLOSURES AS AT MARCH 31, 2017
40. Significant investments in the capital of banking, financial and insurance entities that are outside the scope of regulatory consolidation (net of eligible short positions) –
41. National specific regulatory adjustments (41a+41b) –
41a Investments in the Additional Tier 1 capital of unconsolidated insurance subsidiaries –
41b Shortfall in the Additional Tier 1 capital of majority owned financial entities which have not been consolidated with the bank –
Regulatory Adjustments Applied to Additional Tier 1 in respect of Amounts Subject to Pre-Basel III Treatment –
of which: [INSERT TYPE OF ADJUSTMENT e.g. DTAs] –
of which: [INSERT TYPE OF ADJUSTMENT e.g. existing adjustments which are deducted from Tier 1 at 50%] –
of which: [INSERT TYPE OF ADJUSTMENT] –
42. Regulatory adjustments applied to Additional Tier 1 due to insufficient Tier 2 to cover deductions –
43. Total regulatory adjustments to Additional Tier 1 capital –
44. Additional Tier 1 capital (AT1) –
44a Additional Tier 1 capital reckoned for capital adequacy –
45. Tier 1 capital (T1 = CET1 + AT1) (29 + 44a) 54,655
Tier 2 capital: instruments and provisions
46. Directly issued qualifying Tier 2 instruments plus related stock surplus –
47. Directly issued capital instruments subject to phase out from Tier 2 –
48. Tier 2 instruments (and CET1 and AT1 instruments not included in rows 5 or 34) issued by subsidiaries and held by third parties (amount allowed in group Tier 2) –
49. of which: instruments issued by subsidiaries subject to phase out –
50. Provisions 1,413 B1+B2+ B3+B4
51. Tier 2 capital before regulatory adjustments 1,413
52. Investments in own Tier 2 instruments –
53. Reciprocal cross-holdings in Tier 2 instruments –
54. Investments in the capital of banking, financial and insurance entities that are outside the scope of regulatory consolidation, net of eligible short positions, where the bank does not own more than 10% of the issued common share capital of the entity (amount above the 10% threshold) –
55. Significant investments13 in the capital banking, financial and insurance entities that are outside the scope of regulatory consolidation (net of eligible short positions) –
56. National specific regulatory adjustments (56a+56b) –
56a of which: Investments in the Tier 2 capital of unconsolidated subsidiaries –
56b of which: Shortfall in the Tier 2 capital of majority owned financial entities which have not been consolidated with the bank –
Regulatory Adjustments Applied to Tier 2 in respect of Amounts Subject to Pre-Basel III Treatment –
of which: [INSERT TYPE OF ADJUSTMENT e.g. existing adjustments which are deducted from Tier 2 at 50%] –
of which: [INSERT TYPE OF ADJUSTMENT –
57. Total regulatory adjustments to Tier 2 capital –
58. Tier 2 capital (T2) 1,413
58a Tier 2 capital reckoned for capital adequacy 1,413
58b Excess Additional Tier 1 capital reckoned as Tier 2 capital –

BANK OF AMERICA, N.A.(INDIA BRANCHES)(Incorporated in U.S.A. With Limited Liability)
Economic & Political Weekly EPW july 15, 2017 vol LII no 28 123
BASEL III – PILLAR 3 DISCLOSURES AS AT MARCH 31, 2017
58c Total Tier 2 capital admissible for capital adequacy (58a + 58b) 1,413
59. Total capital (TC = T1 + T2) (45 + 58c) 56,068 Risk Weighted Assets in respect of Amounts Subject to Pre- Basel III Treatment
of which: [INSERT TYPE OF ADJUSTMENT]
of which: …
60. Total risk weighted assets (60a + 60b + 60c) 291,365 60a of which: total credit risk weighted assets 206,796
60b of which: total market risk weighted assets 50,006
60c of which: total operational risk weighted assets 34,563
Capital ratios 61. Common Equity Tier 1 (as a percentage of risk weighted assets) 18.76% 62. Tier 1 (as a percentage of risk weighted assets) 18.76% 63. Total capital (as a percentage of risk weighted assets) 19.24%
64. Institution specific buffer requirement (minimum CET1 requirement plus capital conservation and countercyclical buffer requirements, expressed as a percentage of risk weighted assets) 8.25%
65. of which: capital conservation buffer requirement 1.25%
66. of which: bank specific countercyclical buffer requirement –
67. of which: G-SIB buffer requirement 1.50%
68. Common Equity Tier 1 available to meet buffers (as a percentage of risk weighted assets) – (Point 61 – Point 71) 9.76%
National minima (if different from Basel III)69. National Common Equity Tier 1 minimum ratio (if different from Basel III minimum) 5.50%
70. National Tier 1 minimum ratio (if different from Basel III minimum) 7.00%
71. National total capital minimum ratio (if different from Basel III minimum) 9.00%
Amounts below the thresholds for deduction (before risk weighting)72. Non-significant investments in the capital of other financial entities –
73. Significant investments in the common stock of financial entities –
74. Mortgage servicing rights (net of related tax liability) NA
75. Deferred tax assets arising from temporary differences (net of related tax liability) NA
Applicable caps on the inclusion of provisions in Tier 276. Provisions eligible for inclusion in Tier 2 in respect of exposures subject to standardised approach (prior to application of cap) 1,413
77. Cap on inclusion of provisions in Tier 2 under standardised approach 2,585
78. Provisions eligible for inclusion in Tier 2 in respect of exposures subject to internal ratings-based approach (prior to application of cap) –
79. Cap for inclusion of provisions in Tier 2 under internal ratings-based approach –
Capital instruments subject to phase-out arrangements (only applicable between March 31, 2017 and March 31, 2022)80. Current cap on CET1 instruments subject to phase out arrangements –
81. Amount excluded from CET1 due to cap (excess over cap after redemptions and maturities) –
82. Current cap on AT1 instruments subject to phase out arrangements –
83. Amount excluded from AT1 due to cap (excess over cap after redemptions and maturities) –
84. Current cap on T2 instruments subject to phase out arrangements –
85. Amount excluded from T2 due to cap (excess over cap after redemptions and maturities) –
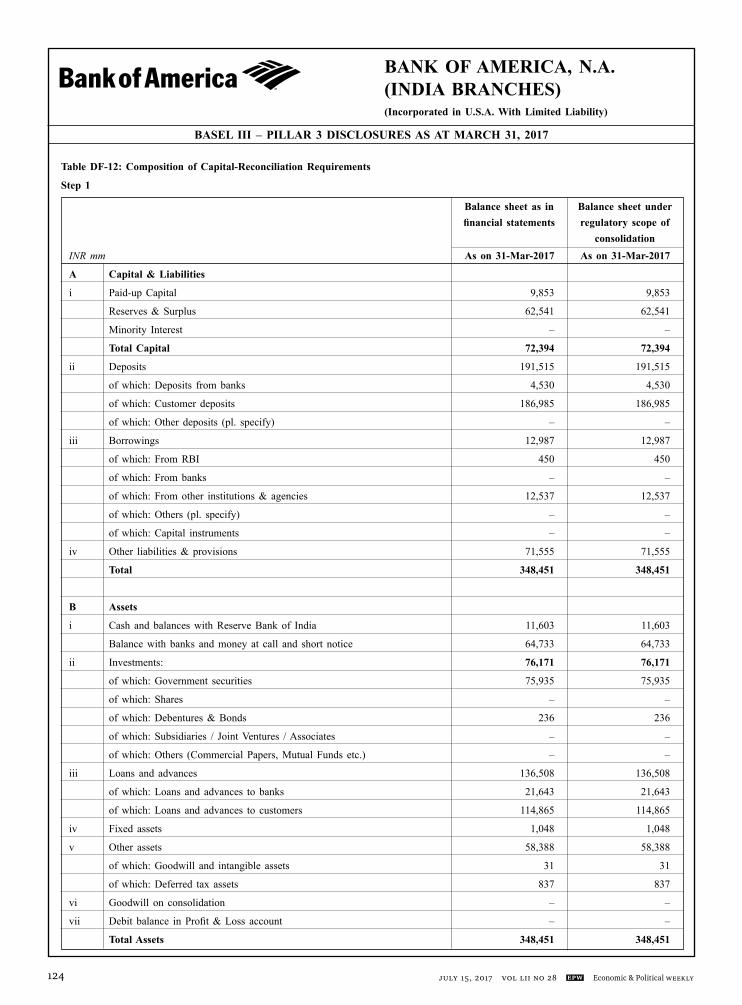
BANK OF AMERICA, N.A.(INDIA BRANCHES)(Incorporated in U.S.A. With Limited Liability)
july 15, 2017 vol LII no 28 EPW Economic & Political Weekly124
BASEL III – PILLAR 3 DISCLOSURES AS AT MARCH 31, 2017
Table DF-12: Composition of Capital-Reconciliation Requirements
Step 1
Balance sheet as in Balance sheet under financial statements regulatory scope of consolidationINRmm As on 31-Mar-2017 As on 31-Mar-2017
A Capital & Liabilities
i Paid-up Capital 9,853 9,853
Reserves & Surplus 62,541 62,541
Minority Interest – –
Total Capital 72,394 72,394
ii Deposits 191,515 191,515
of which: Deposits from banks 4,530 4,530
of which: Customer deposits 186,985 186,985
of which: Other deposits (pl. specify) – –
iii Borrowings 12,987 12,987
of which: From RBI 450 450
of which: From banks – –
of which: From other institutions & agencies 12,537 12,537
of which: Others (pl. specify) – –
of which: Capital instruments – –
iv Other liabilities & provisions 71,555 71,555
Total 348,451 348,451
B Assets
i Cash and balances with Reserve Bank of India 11,603 11,603
Balance with banks and money at call and short notice 64,733 64,733
ii Investments: 76,171 76,171
of which: Government securities 75,935 75,935
of which: Shares – –
of which: Debentures & Bonds 236 236
of which: Subsidiaries / Joint Ventures / Associates – –
of which: Others (Commercial Papers, Mutual Funds etc.) – –
iii Loans and advances 136,508 136,508
of which: Loans and advances to banks 21,643 21,643
of which: Loans and advances to customers 114,865 114,865
iv Fixed assets 1,048 1,048
v Other assets 58,388 58,388
of which: Goodwill and intangible assets 31 31
of which: Deferred tax assets 837 837
vi Goodwill on consolidation – –
vii Debit balance in Profit & Loss account – –
Total Assets 348,451 348,451
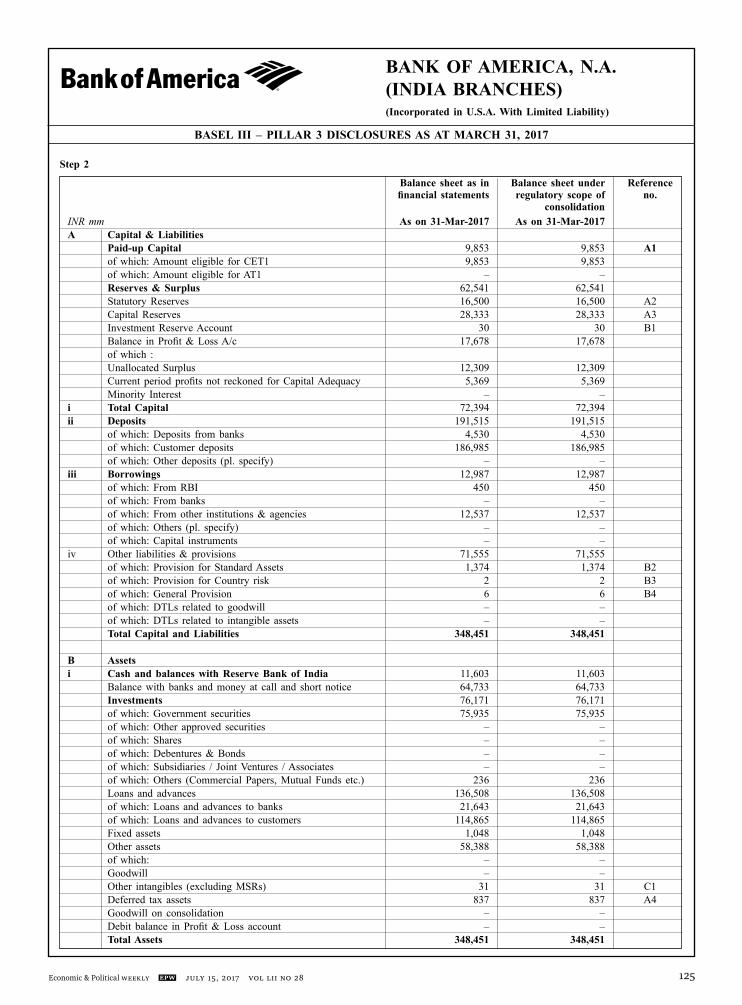
BANK OF AMERICA, N.A.(INDIA BRANCHES)(Incorporated in U.S.A. With Limited Liability)
Economic & Political Weekly EPW july 15, 2017 vol LII no 28 125
BASEL III – PILLAR 3 DISCLOSURES AS AT MARCH 31, 2017
Step 2 Balance sheet as in Balance sheet under Reference financial statements regulatory scope of no. consolidation INRmm As on 31-Mar-2017 As on 31-Mar-2017 A Capital & Liabilities Paid-up Capital 9,853 9,853 A1 of which: Amount eligible for CET1 9,853 9,853 of which: Amount eligible for AT1 – – Reserves & Surplus 62,541 62,541 Statutory Reserves 16,500 16,500 A2 Capital Reserves 28,333 28,333 A3 Investment Reserve Account 30 30 B1 Balance in Profit & Loss A/c 17,678 17,678 of which : Unallocated Surplus 12,309 12,309 Current period profits not reckoned for Capital Adequacy 5,369 5,369 Minority Interest – – i Total Capital 72,394 72,394 ii Deposits 191,515 191,515 of which: Deposits from banks 4,530 4,530 of which: Customer deposits 186,985 186,985 of which: Other deposits (pl. specify) – – iii Borrowings 12,987 12,987 of which: From RBI 450 450 of which: From banks – – of which: From other institutions & agencies 12,537 12,537 of which: Others (pl. specify) – – of which: Capital instruments – – iv Other liabilities & provisions 71,555 71,555 of which: Provision for Standard Assets 1,374 1,374 B2 of which: Provision for Country risk 2 2 B3 of which: General Provision 6 6 B4 of which: DTLs related to goodwill – – of which: DTLs related to intangible assets – – Total Capital and Liabilities 348,451 348,451 B Assets i Cash and balances with Reserve Bank of India 11,603 11,603 Balance with banks and money at call and short notice 64,733 64,733 Investments 76,171 76,171 of which: Government securities 75,935 75,935 of which: Other approved securities – – of which: Shares – – of which: Debentures & Bonds – – of which: Subsidiaries / Joint Ventures / Associates – – of which: Others (Commercial Papers, Mutual Funds etc.) 236 236 Loans and advances 136,508 136,508 of which: Loans and advances to banks 21,643 21,643 of which: Loans and advances to customers 114,865 114,865 Fixed assets 1,048 1,048 Other assets 58,388 58,388 of which: – – Goodwill – – Other intangibles (excluding MSRs) 31 31 C1 Deferred tax assets 837 837 A4 Goodwill on consolidation – – Debit balance in Profit & Loss account – – Total Assets 348,451 348,451

BANK OF AMERICA, N.A.(INDIA BRANCHES)(Incorporated in U.S.A. With Limited Liability)
july 15, 2017 vol LII no 28 EPW Economic & Political Weekly126
BASEL III – PILLAR 3 DISCLOSURES AS AT MARCH 31, 2017
Table DF-13: Main Features of Regulatory Capital InstrumentsThe Bank has not issued any Regulatory Capital instruments
Disclosure template for main features of regulatory capital instruments1 Issuer 2 Unique identifier (e.g. CUSIP, ISIN or Bloomberg identifier for private placement) 3 Governing law(s) of the instrument Regulatory treatment 4 Transitional Basel III rules 5 Post-transitional Basel III rules 6 Eligible at solo/group/ group & solo 7 Instrument type 8 Amount recognised in regulatory capital (Rs. in million, as of most recent reporting date) 9 Par value of instrument 10 Accounting classification 11 Original date of issuance 12 Perpetual or dated 13 Original maturity date 14 Issuer call subject to prior supervisory approval 15 Optional call date, contingent call dates and redemption amount Not Applicable 16 Subsequent call dates, if applicable Coupons / dividends17 Fixed or floating dividend/coupon 18 Coupon rate and any related index 19 Existence of a dividend stopper 20 Fully discretionary, partially discretionary or mandatory 21 Existence of step up or other incentive to redeem 22 Noncumulative or cumulative 23 Convertible or non-convertible 24 If convertible, conversion trigger(s) 25 If convertible, fully or partially 26 If convertible, conversion rate 27 If convertible, mandatory or optional conversion 28 If convertible, specify instrument type convertible into 29 If convertible, specify issuer of instrument it converts into 30 Write-down feature 31 If write-down, write-down trigger(s) 32 If write-down, full or partial 33 If write-down, permanent or temporary 34 If temporary write-down, description of write-up mechanism 35 Position in subordination hierarchy in liquidation (specify instrument type immediately senior to instrument) 36 Non-compliant transitioned features 37 If yes, specify non-compliant features
Table DF-14: Full Terms and Conditions of Regulatory Capital Instruments Instruments Full Terms and Conditions The Bank has not issued any Regulatory Capital instruments
Table DF-15: Disclosure Requirements for RemunerationThe Bank’s compensation policies including that of CEO's, is in conformity with the Financial Stability Board principles and standards. In accordance with the requirements of the RBI Circular No. DBOD No.BC.72/29.67/001/2011-12 dated January 13, 2012; the Regional Office of the Bank has submitted a declaration to RBI confirming the aforesaid matter and hence this disclosure is not applicable.Table DF-16: Equities – Disclosure for Banking Book PositionNIL
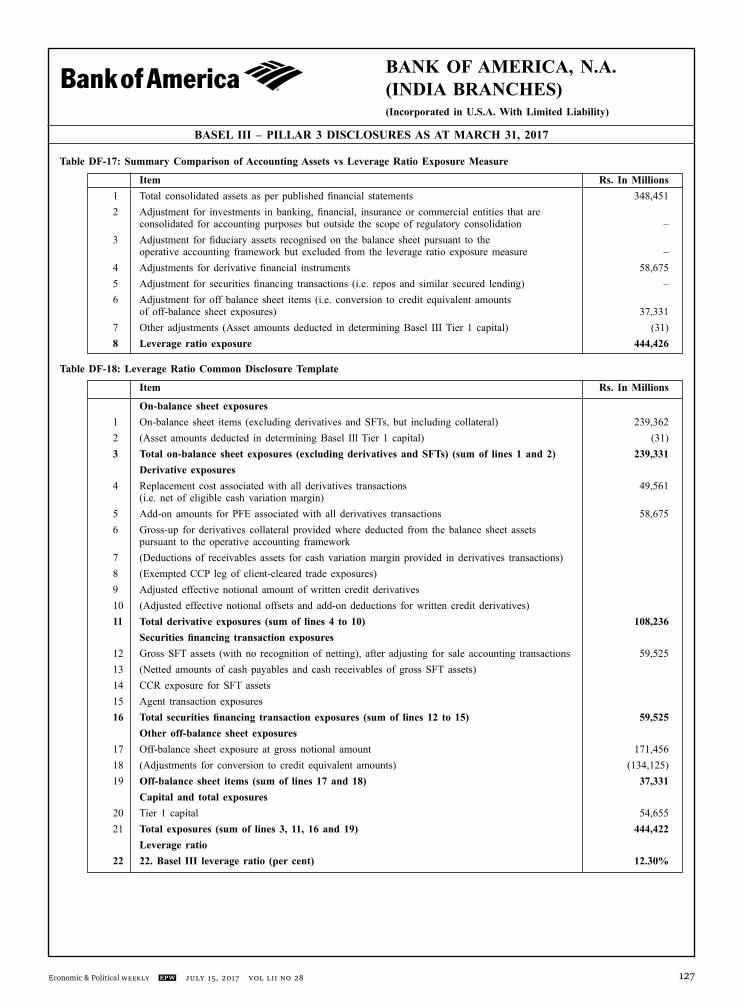
BANK OF AMERICA, N.A.(INDIA BRANCHES)(Incorporated in U.S.A. With Limited Liability)
Economic & Political Weekly EPW july 15, 2017 vol LII no 28 127
Table DF-17: Summary Comparison of Accounting Assets vs Leverage Ratio Exposure Measure
Item Rs. In Millions 1 Total consolidated assets as per published financial statements 348,451 2 Adjustment for investments in banking, financial, insurance or commercial entities that are consolidated for accounting purposes but outside the scope of regulatory consolidation – 3 Adjustment for fiduciary assets recognised on the balance sheet pursuant to the operative accounting framework but excluded from the leverage ratio exposure measure – 4 Adjustments for derivative financial instruments 58,675 5 Adjustment for securities financing transactions (i.e. repos and similar secured lending) – 6 Adjustment for off balance sheet items (i.e. conversion to credit equivalent amounts of off-balance sheet exposures) 37,331 7 Other adjustments (Asset amounts deducted in determining Basel III Tier 1 capital) (31) 8 Leverage ratio exposure 444,426
Table DF-18: Leverage Ratio Common Disclosure Template
Item Rs. In Millions
On-balance sheet exposures 1 On-balance sheet items (excluding derivatives and SFTs, but including collateral) 239,362 2 (Asset amounts deducted in determining Basel Ill Tier 1 capital) (31) 3 Total on-balance sheet exposures (excluding derivatives and SFTs) (sum of lines 1 and 2) 239,331 Derivative exposures 4 Replacement cost associated with all derivatives transactions 49,561 (i.e. net of eligible cash variation margin) 5 Add-on amounts for PFE associated with all derivatives transactions 58,675 6 Gross-up for derivatives collateral provided where deducted from the balance sheet assets pursuant to the operative accounting framework 7 (Deductions of receivables assets for cash variation margin provided in derivatives transactions) 8 (Exempted CCP leg of client-cleared trade exposures) 9 Adjusted effective notional amount of written credit derivatives 10 (Adjusted effective notional offsets and add-on deductions for written credit derivatives) 11 Total derivative exposures (sum of lines 4 to 10) 108,236 Securities financing transaction exposures 12 Gross SFT assets (with no recognition of netting), after adjusting for sale accounting transactions 59,525 13 (Netted amounts of cash payables and cash receivables of gross SFT assets) 14 CCR exposure for SFT assets 15 Agent transaction exposures 16 Total securities financing transaction exposures (sum of lines 12 to 15) 59,525 Other off-balance sheet exposures 17 Off-balance sheet exposure at gross notional amount 171,456 18 (Adjustments for conversion to credit equivalent amounts) (134,125) 19 Off-balance sheet items (sum of lines 17 and 18) 37,331 Capital and total exposures 20 Tier 1 capital 54,655 21 Total exposures (sum of lines 3, 11, 16 and 19) 444,422 Leverage ratio 22 22. Basel III leverage ratio (per cent) 12.30%
BASEL III – PILLAR 3 DISCLOSURES AS AT MARCH 31, 2017