an investigation of the odontocete inner ear
TRANSCRIPT

Is The Hearing of Whales and Dolphins Fully Developed at Birth?:
An investigation of the odontocete inner ear
A thesis submitted for the fulfilment of the degree of
Master of Science in Marine Science
At the University of Otago, Dunedin,
New Zealand
Tiffany Plencner August 2017

Acknowledgements
There has been a huge amount of support from many different people
during the course of my MSc thesis. Firstly, a big thank you to my supervisors
Ewan Fordyce and Steve Dawson for continued encouragement, support and
guidance throughout my time at the University of Otago. Thank you Museum of
New Zealand Te Papa for providing access to a massive cetacean collection and to
Andrew Stewart, who was wonderfully helpful and always made me feel welcome
during my visits. Thank you Emma Betty at Massey University in Auckland for
providing rare foetal material that proved to be really exciting to x-ray.
A key aspect of my thesis would not have been achievable without the help
of Te Upokorehe iwi of Ohiwa Harbour. Your hospitality was overwhelmingly
generous and it was a privilege to meet and work together during our 10 days
collecting data in the pop-up lab at Roimata marae. Special thanks to Wallace
Aramoana (Snr), Puti Aramoana, Trevor Ransfield, Lance Reha, Sandra Aramoana,
Irene Almond, Gaylene Kohunui, Glen Aramoana, Christine Martin, Kahukore Baker
and Te Upokorehe whānau for their leadership and kindness. To Ramari Stewart,
‘Tohunga Tohorā’ for her life-long expertise, initiative and guidance in processing
the Upokorehe customary collection, her commitment and dedication made this
collection possible. I am looking forward to visiting again with an update after
submitting.
This thesis came with some huge learning curves in terms of new imaging
software and analysis programs. So a huge thank you to everyone who helped me
wade through all of it: Andrew McNaughton and Karla Rovaris for teaching me
micro-CT, Luke Easterbrook and Hamish Bowman for helping with all the various
imaging software, and Tim Jowett for all the statistics guidance and help with the R
language.
My friends Anna Meissner, Sophie White, and Shaun Wilson, you were also a
massive part of the work at Ōhiwa Harbour. I want to thank you and all my
Dunedin friends for the support, advice and keeping me sane throughout the
course of my thesis.

Abstract
Sound is an essential component of toothed whale and dolphin
(odontocete) biology. The advanced hearing-dependent activities of precocial
calves lead us to believe that hearing is fully functional by birth. Nevertheless, few
studies have investigated the ontogeny of cetacean ears. This thesis investigates
the odontocete ear region (bones of the tympanoperiotic complex, TPC),
particularly the organ of hearing (cochlea) in the inner ear. I used radiography to
examine ossification in six odontocete foetuses, and micro-CT scans to reconstruct
3D cochlear models for four life stages (foetal, neonate, juvenile and adult) from
four ecologically divergent species from New Zealand: Hector’s dolphin
(Cephalorhynchus hectori), bottlenose dolphin (Tursiops truncatus), long-finned
pilot whale (Globicephala melas), and Gray’s beaked whale (Mesoplodon grayi).
Individuals ranging from newborns to adults showed no significant intraspecific
differences in the size and shape of their cochlear canals (p= 0.998) and TPCs, but
there were significant interspecific differences (p<0.001). Consistent with their
phylogeny, M. grayi cochleae significantly differed from the three delphinid study
species (p<0.05), while the cochlea of the three delphinids did not significantly
differ from each other (p>0.05). No ecological parallels were apparent within
cochlear structures. Radiographs of foetuses ranging from Stages 7-12 (of Štěrba et
al., 2000 classification) did not show evidence of ossification. The more advanced
Stage 11 G. melas foetuses, however, showed minor mineralisation of the TPC, and
a cochlear canal could be seen in the largest foetus (69cm). Cochlear and TPC size
and shape results suggest rapid prenatal development of hearing structures and
are consistent with the hypothesis that calves have fully functional hearing
abilities at birth.


ACKNOWLEDGEMENTS II
ABSTRACT III
CHAPTER 1: INTRODUCTION 1
1.1 Evolution of Cetacean Hearing and its Research 1
1.1.1 Evolution 1
1.1.2 Research History 2
1.1.3 Significance of Micro-CT 3
1.1.4 Significance of Morphometrics 4
1.2 Components of the Hearing Pathway 5
1.3 The Inner Ear in Detail 7
1.3.1 Cochlear Canal and Factors that Impact Hearing 9
1.3.2 Vestibular Complex 10
1.4 Significance of Age and Ecology 10
1.4.1 Age 11
1.4.2 Ecology 12
1.5 Study Aims: Is Hearing Fully Developed at Birth? 14
2 CHAPTER 2: METHODS 17
2.1 Sources of Material 17
2.2 Aging and Staging 20
2.3 Skull and TPC Measurements and Analysis 21
2.3.1 Measurements 21
2.3.2 Analysis 22
2.4 Building 3D Cochlear Models 24
2.4.1 Micro CT Scanning 24
2.4.2 3D Modeling Software 24
2.5 Inner Ear Measurements and Analyses 28
2.5.1 Measurements 28
2.5.2 Inner Ear Analyses 29

3 CHAPTER 3: RESULTS 33
3.1 Tympanoperiotic Complex and Skull Measurements 33
3.2 Radiography of Foetal Material 34
3.3 Inner Ear Measurements 35
3.3.1 Geometric Morphometrics 35
3.3.2 Linear Measurements and Ratios 37
4 CHAPTER 4: DISCUSSION 40
4.1 Significance to Age- Ontogeny 40
4.2 Significance to Species- Phylogeny and Ecology 42
4.3 Observational Notes 44
4.4 Future research 45
5 CONCLUSION 46
6 REFERENCES 47
Appendix A 67
Appendix B 75

Chapter 1: Introduction| 1
Chapter 1: Introduction
The following is an investigation into the ontogenetic development of the
hearing apparatus of toothed whales and dolphins (odontocetes). While we know
how dolphins receive sound (e.g. Brill et al., 1988), the current literature reveals
little of when these crucial hearing structures become fully developed. This study
focuses on development of the inner ear’s cochlear canal from four different age
classes of odontocetes. In this chapter, I first outline the current understanding of
how cetacean hearing has evolved. I describe the hearing pathway, with an
explanation of the essential parts of the inner ear, and finish with a brief
description of the study species and aims. Chapter 2 explains methods for
acquiring the material analysed, the collection of data and analyses including the
use of micro-CT, 3D models, and geometric morphometrics. Chapter 3 provides the
results, and Chapter 4 discusses their meaning with suggestions for future
research.
1.1 Evolution of Cetacean Hearing
1.1.1 Evolution
Hearing in cetaceans (whales and dolphins) has a fascinating evolutionary
history. Deriving from land mammals, cetaceans had to adapt the morphology,
physiology and behaviour to live successfully in an aquatic environment. Amongst
many changes, there was a streamlining of the body, loss of pinnae (external part
of the ear), telescoping of the skull and a shift in their hearing mechanism (Kellogg,
1928; Miller, 1923; Nummela et al., 2007; Thewissen et al., 2009). Terrestrial
mammals rely on acoustic vibrations from the air to hear. Cetaceans on the other
hand rely on acoustic vibrations that travel through water almost five times faster
than air (Reysenbach De Haan, 1960). Early cetaceans thus underwent some major
changes in their hearing structure and pathway to accommodate for the physical
properties of living an aquatic lifestyle.
This transition is displayed throughout the fossil record. Cetacean ancestors
likely shifted to marine living around 50 million years ago during the Eocene
Epoch (Reysenbach De Haan, 1957; Thewissen et al., 2009; Thewissen & Williams,
2002). Evidence suggests that ancestral cetaceans like basilosaurids,
mammalodontids and aetiocetids had low frequency hearing (less than 1000Hz;

Chapter 1: Introduction| 2
Ekdale & Racicot, 2015; Park et al., 2017), as inferred from the long cochlea and
number of turns similar to those found in modern baleen whales (mysticetes),
which have had a remarkably consistent hearing morphology over the last 34-45
million years (Ekdale & Racicot, 2015; Kellogg, 1936; Lancaster, 1990). On the
other hand, toothed whales (odontocetes) experienced a drastic shift into
specialised high frequency hearing (more than 30,000 Hz; Churchill et al., 2016;
Hemilä et al., 2001; Nachtigall et al., 2007; Ridgway et al., 1981). This likely
occurred early in the odontocete-mysticete divergence, during the Eocene-
Oligocene boundary around 34 million years ago (Fordyce & Muizon, 2001; Park et
al., 2017). Fossil specimens have revealed that some of the earliest diverging
odontocete stem groups had ear morphology already adapted for high-frequency
specialisation (Churchill et al., 2016; Ekdale & Racicot, 2015; Park et al., 2016).
In addition to a shift in frequency specialisation, evolution within an aquatic
environment resulted in parts of the ear region becoming reduced, vestigial or lost
completely in cetaceans. For example, pinnae have disappeared (Cozzi et al., 2017;
Thewissen et al., 2009), the ear canals have become vestigial (McCormick et al.,
1970; Yamada, 1953) and there have been some intriguing changes to the inner
ear as well. The vestibular complex, known for its role in spatial perception and
balance (Angelaki & Cullen, 2008; Cawthorne et al., 1956), involves three semi-
circular canals whose sizes have also been greatly reduced in Cetacea (Hyrtl, 1845;
Spoor et al., 2002). The cause and significance of this reduction is still uncertain,
and it is not clear whether the function attributed to the vestibular complex has
also been reduced or lost altogether.
1.1.2 Research History
Hearing has been a topic of scientific interest since the 1700s. Petrus
Camper was first to publish research into sperm whale’s organ of hearing (Camper,
1765). John Hunter recorded many detailed necropsy observations, some of which
focused on cetacean hearing structures (Hunter & Banks, 1787). Due to
accessibility to cetacean material, early research on hearing often focussed on the
ears of terrestrial mammals, with opportunistic findings from cetaceans (Gray,
1908; Hyrtl, 1845; von Békésy, 1960). Research on various mammalian species has
provided a solid framework for advancing our knowledge of cetacean hearing

Chapter 1: Introduction| 3
structures. Additionally, Munesato Yamada and Gerald Fleischer provided a
foundation of detailed observations, and established anatomical terminology and a
standardised procedure for investigating the ear region (Fleischer, 1976; Yamada
& Yoshizaki, 1959).
In the 1960s, a major paradigm shift completely changed our understanding
of the odontocete hearing pathway. Contrary to the belief at the time, that the ear
canal was believed to be the primary source of sound reception (Fraser & Purves,
1960), Ken Norris’s revolutionary ‘jaw-hearing’ hypothesis proposed that sound
reception starts with sound entering a thin part of the lower jaw, nicknamed the
‘acoustic window’ (Norris, 1964, 1968). We now know that specialised fats behind
the acoustic window also help to channel sound into the Tympanoperiotic complex
(TPC) and inner ear (Koopman et al., 2006; Norris, 1964, 1968; Zosuls et al., 2015).
Experiments by Brill (1988) supported the jaw-hearing hypothesis, finding that
the hearing abilities of captive bottlenose dolphins (Tursiops truncatus) were
significantly impaired when a neoprene hood masked the lower jaws. Additionally,
a study of evoked potentials found that hearing was less sensitive near the ear
canal than it was next to the jaw (Brill, 1991). Today, the jaw-hearing hypothesis is
widely accepted as the primary channel for sound reception in toothed whales and
dolphins (odontocetes; Ketten, 2000).
1.1.3 Significance of Micro-CT
Recent advancements in the understanding of the inner ear reflect the
positive impact of developments of micro Computed Tomography (micro-CT) and
associated analysis software (eg. Costeur et al., 2017; Grohé et al., 2016; Thean et
al., 2016). Initially, research on the inner ear was restricted to destructive
sampling, which usually involved cutting through the pars cochlearis with a bone
drill to access and observe the interior of the bony labyrinth (eg. Fleischer, 1976).
However, this was not ideal because vibrations from the drill could damage the
delicate structures inside. Fortunately, micro-CT was developed in the 1980s by
Jim Elliott (Elliott & Dover, 1982) and was commercially available by the 1990s.
Since then, ease, cost and accessibility to micro-CT machines have quickly
improved for a wider range of users. Conceptually, micro-CT is the same as the
more familiar Computerised Axial Tomography (CAT) scans used in medicine, but

Chapter 1: Introduction| 4
with specialisation to image smaller objects at higher resolutions. CT scans use X-
rays to take a series of digital “slices” of an object (Abel et al., 2012). These slices
can then be stacked to form a 3D model that can be manipulated, examined and
analysed by the researcher. Technology including both the micro-CT machine and
various manipulation software packages are still improving. Although this study
used the SkyScan 1172 model, which can achieve 0.5 µm resolution, new models
have been developed to image at an even smaller scale. In addition to the
avoidance of destructive sampling, CT-scanning also offers the opportunity to
share specimens between scientists and museums digitally rather than physically.
1.1.4 Significance of Morphometrics
One way to utilise micro-CT models and investigate structure is through the
application of geometric morphometrics. Morphometrics is described as the study
of shape variation and its covariation with other variables (Bookstein, 1997; Rohlf
& Marcus, 1993). Initially, morphometric analysis was done through statistical
analysis of linear measurements from morphological points, ratios or angles
(Adams et al., 2004). Geometric morphometrics on the other hand, takes a more
robust and dynamic approach by running statistical analyses after the
incorporation of a standardised landmark coordinate system (Corti, 1993). This
method has been described as a revolution in the field of morphometrics (Rohlf &
Marcus, 1993).
First, the researcher places homologous landmarks in noteworthy places
that can be identified on all the included 2D images or 3D-models. The landmarks
may be anchors for series of semi-landmarks, indistinct surface points that are
computer generated at equally spaced positions. Then the combined landmark and
semi-landmark coordinate sets are run through a superimposition process called a
Generalised Procrustes Analysis (GPA), which calculates a ‘mean’ shape that allows
for multivariate statistic analyses. Although there are other approaches to
completing geometric morphometrics, this is one of the most common due to the
high statistical power of the ideal shape-space (Kendall’s shape-space) used to
create the ‘mean’ shape in GPA (Kent, 1994; Rohlf, 1999, 2000).
Ultimately, GPA is a statistical method for finding the optimum placement in
space for multiple superimposed objects (Rohlf, 1999; Slice, 2001) and allows for

Chapter 1: Introduction| 5
complex shape analysis. It has become fundamental to modern shape analyses
(Adams et al., 2004) and a valuable tool to a range of disciplines (e.g. Adams et al.,
2013; Ekdale, 2016; Tsai & Fordyce, 2014).
1.2 Components of the Hearing Pathway
Since the jaw-hearing hypothesis of the 1960s we have established a much
better understanding of the odontocete hearing pathway and the inner
mechanisms of their hearing complexes. The hearing pathway can be thought of as
a series of steps that eventually reach the organ of hearing (cochlea) and the focus
of this thesis (Figure 1).
[1] Sound is first received through a thin posterior portion of the lower jaw,
called the pan bone or “acoustic window” (Norris, 1964, 1968).
[2] Specialised acoustic fats, located medial to the pan bone, channel these
sound vibrations towards the tympanoperiotic complex (earbone; Koopman et al.,
2006; Norris, 1964, 1968; Zosuls et al., 2015). Mandibular acoustic fats are similar
to those found in the melon and, biochemically, are unlike fats found anywhere
else in the body (Koopman et al., 2006; Litchfield et al., 1973). These specialised
fats are structured to act as a funnel, in which the outermost mandibular fats (long-
chain fatty acids) can receive fast moving sounds from a broad area and transfer
them to the slower inner mandibular fats (short-chain fatty acids), which are
directly adjacent to the tympanoperiotic complex (TPC; Hustad et al., 1971;
Koopman et al., 2006). At a size roughly the size of a golf ball in dolphins, the TPC
is largely made up of two parts, the ventral conch-like tympanic bulla, and the
dorsal periotic that houses the inner ear. Since the TPC is extremely dense and
almost completely isolated by the air-filled peribullary sinus, interference between
hearing and the vibrations of self-produced sound emissions are minimised
(Fraser & Purves, 1960; Norris, 1964; Nummela et al., 1999).
[3] Once they reach the TPC, sound vibrations are transferred from the
tympanic bulla into a series of three middle ear bones called the ossicular chain.
This is made up of the malleus (hammer), incus (anvil) and stapes (stirrup), which

Chapter 1: Introduction| 6
concentrate sound into the small opening of the oval window, the fenestra ovalis
(Hemilä et al., 1999). Sound pressure increases when going from a large area to a
smaller one, and the ossicular chain’s function is to transmit energy with a particle
velocity that is suitable for the inner ear to receive (Nummela, 2009). Frequency
range is largely governed by the structure and elasticity of the middle ear and its
ability to transmit energy (Fleischer, 1978; Nummela, 2009; Plassmann & Brandle,
1992; Rosowski, 1992). The cetacean malleus is fused to the tympanic bulla,
producing a sound path from the sound-receiving outer lip of the bulla to the
middle and inner ear (Lancaster et al., 2015) and is significant in preventing the
attenuation of propagating sound frequencies before they reach the cochlea
(Zosuls et al., 2015).
[4] After being transferred via the stapes through the oval window,
vibrations reach the fluid-filled bony labyrinth. A general overview is given here,
and a closer look at properties of the bony labyrinth is provided in the following
Figure 1: Anatomical parts of the cetacean hearing pathway. Areas of interest are highlighted in red. Note the tpc is laterally displaced from the skull. Starting from the skull (top), sound travels through the pan bone (pb) and is channelled towards the middle ear bones and tympanoperiotic complex (tpc; bottom left). The cochlea (co; bottom right) is housed within the periotic (pr; bottom centre), and transforms sound vibrations into electrical signals for the brain. Abbreviations: anterior (ant), fenestra cochleae (fc), lateral (lat), laminar gap (lg), pars cochlearis (pc), posterior (pos), semicircular canals (sc), stapes (st), tympanic bulla (tb), vestibular complex (vc), ventral (ven)

Chapter 1: Introduction| 7
section. Vibrations enter the portion of the bony labyrinth called Rosenthal’s canal
(or the cochlear spiral), where they propagate along the basilar membrane that
supports the organ of Corti. As vibrations follow the cochlear spiral ventrally from
base to apex, the paddle-like basilar membrane increases in width and flexibility,
while thickness decreases (Morell et al., 2015). The rigidity of the basilar
membrane is critical in identifying frequencies (Echteler et al., 1994); higher
frequencies typically stimulate hair cells towards the basal end and lower
frequencies stimulate hair cells closer towards the apex (Hudspeth, 1989).
[5] Finally, vibrations are transduced from mechanical energy into electrical
signals for the brain to process (Fleischer, 1976; Wartzok & Ketten, 1999). This
occurs when soundwaves bend and stimulate sensory hair cells on the organ of
Corti, which then send signals to the auditory nerve leading to the brainstem (von
Békésy, 1960). The spiral ganglion (modiolus) runs up the centre of the cochlear
spiral and generally gets wider as it travels from the ventral apex towards the
dorsal base (Ekdale, 2016). Auditory signals are processed via a feedback loop,
where afferent neurons carry signals to the brainstem, and efferent neurons send
signals back to the ear (Raphael & Altschuler, 2003).
1.3 The Inner Ear in Detail
The bony labyrinth is an intricate space. It is made up of two main parts, the
organ of hearing (cochlea) and the organ of balance (vestibular complex).
Additionally, there are more than 75,000 mechanical and electrical parts that fit
within a single cubic centimetre (Reynolds et al., 2000). Needless to say, the inner
ear is a complex and intricate organ.
In odontocetes, the larger portion of the bony labyrinth is the cochlear
canal. It is a fluid-filled spiral that is divided into three sections: the scala vestibula,
scala tympani, and scala media (Kirk & Gosselin-Ildari, 2009; Slepecky, 1996;
Figure 2). Progressing ventrally from base to apex, the walls separating the
cochlear turns get thinner (Ekdale & Racicot, 2015). In therian mammals, cochlear
coiling likely originated during the Cretaceous period (Manley, 2012), but the
reason behind it is still unclear. Some convincing arguments are that it may have
been a more efficient way to fit a longer cochlea into a smaller space (Meyer, 1907;
Manley, 2016), or that it could function in reducing length differences in acoustic

Chapter 1: Introduction| 8
nerve fibres (West, 1985).
There are two types
of odontocete cochlear
spirals, Type I and Type II,
which have been defined
from properties of the
basilar membrane (Ketten,
2000). The basilar
membrane (Figure 2)
follows the curve of the
cochlea down from base to
apex, almost splitting the
canal in half. Its role is to
provide support for the
organ of Corti, and to adjust
rigidity, so that higher-
frequency sounds can be
received towards the
narrow and stiff base, and
lower frequency sounds
can be received towards
the wide and flexible apex
(Ketten & Wartzok, 1990).
The two different types of
odontocete cochleae that
have been observed are: (Type I) short, thick basilar membranes typical of inshore
or riverine species that detect ultra-high frequencies (over 100kHz), or (Type II)
long, thin basilar membranes typical of lower ultrasonic frequencies (under
100kHz; Ketten, 2000).
The hearing element of the cochlea is the organ of Corti (Figure 2). It rests
on the basilar membrane, which travels the length of the cochlear spiral, and is
made up of both supportive and sensory cells (Echteler et al., 1994). Sensory hair
cells, namely the inner hair cells (IHCs), contribute the large majority of afferent
Figure 2: Diagram showing major elements of the cochlear structure (C hectori- MM2410): (top) Cochlear canal sliced to reveal three fluid-filled compartments, the scala vestibuli (SV), scala media (SM) and scala tympani (ST); (bottom) Magnified region containing primary elements of the organ of hearing. The Organ of Corti is supported by the basilar membrane (BM), and contains sensory inner hair cells (IHC) and outer hair cells (OHC). The tectorial membrane (TM) covers their apical surfaces. Bottom schematic redrawn from Slepecky (1996).
Chapter 1: Introduction| 9
signals to the cochlear nerve fibres (Ryugo, 1992). High densities of nerve cells in
the organ of Corti are throught to result in improved frequency discrimination
(Ekdale, 2015).
It is also important to note that although there is visible asymmetry in
odontocete skulls (Fahlke et al., 2011; Ness, 1967), there has been no significant
variation reported between left and right bony labyrinths. Ear symmetry has been
reported in cetacean research (Ary et al., 2016; Schnitzler et al., 2017), as well as in
studies on various other mammals (Mennecart & Costeur, 2016; Welker et al.,
2009).
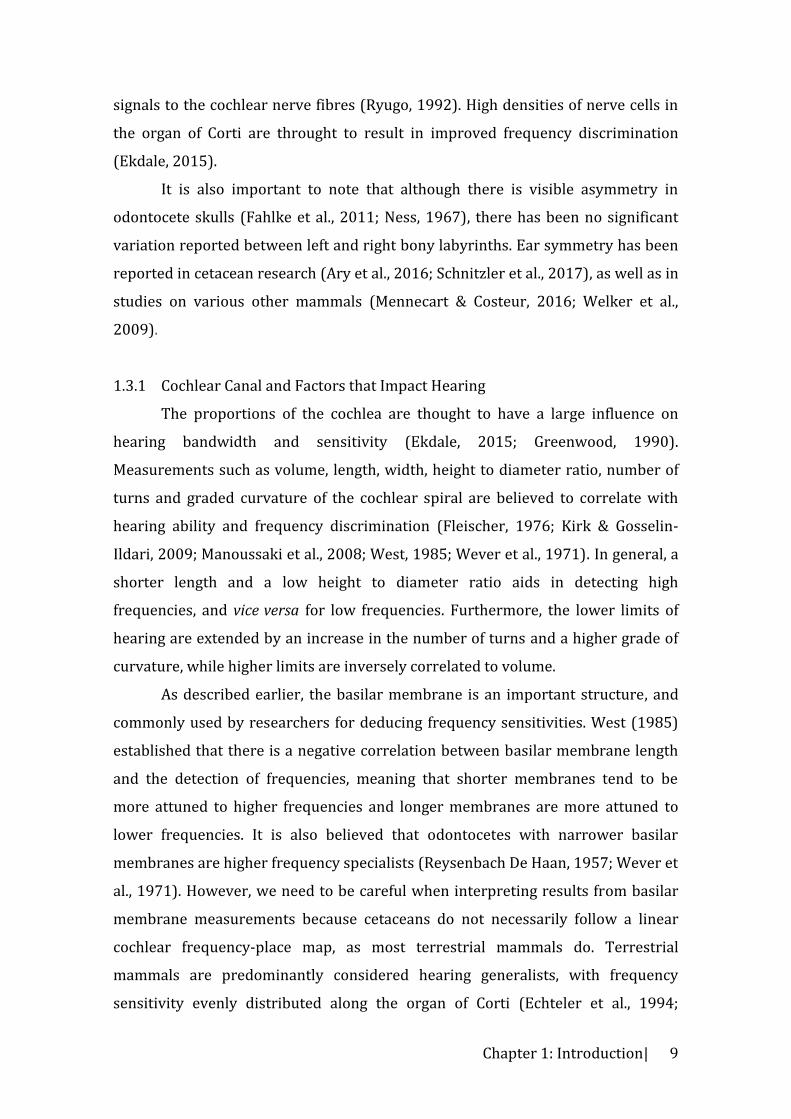
1.3.1 Cochlear Canal and Factors that Impact Hearing
The proportions of the cochlea are thought to have a large influence on
hearing bandwidth and sensitivity (Ekdale, 2015; Greenwood, 1990).
Measurements such as volume, length, width, height to diameter ratio, number of
turns and graded curvature of the cochlear spiral are believed to correlate with
hearing ability and frequency discrimination (Fleischer, 1976; Kirk & Gosselin-
Ildari, 2009; Manoussaki et al., 2008; West, 1985; Wever et al., 1971). In general, a
shorter length and a low height to diameter ratio aids in detecting high
frequencies, and vice versa for low frequencies. Furthermore, the lower limits of
hearing are extended by an increase in the number of turns and a higher grade of
curvature, while higher limits are inversely correlated to volume.
As described earlier, the basilar membrane is an important structure, and
commonly used by researchers for deducing frequency sensitivities. West (1985)
established that there is a negative correlation between basilar membrane length
and the detection of frequencies, meaning that shorter membranes tend to be
more attuned to higher frequencies and longer membranes are more attuned to
lower frequencies. It is also believed that odontocetes with narrower basilar
membranes are higher frequency specialists (Reysenbach De Haan, 1957; Wever et
al., 1971). However, we need to be careful when interpreting results from basilar
membrane measurements because cetaceans do not necessarily follow a linear
cochlear frequency-place map, as most terrestrial mammals do. Terrestrial
mammals are predominantly considered hearing generalists, with frequency
sensitivity evenly distributed along the organ of Corti (Echteler et al., 1994;

Chapter 1: Introduction| 10
Manley, 1972). Odontocetes on the other hand are often hearing specialists, with
tightly focused frequency sensitivity along certain regions of the organ of Corti
(Echteler et al., 1994; Parks et al., 2007).
1.3.2 Vestibular Complex
In terrestrial mammals, the vestibular complex functions in detecting
accelerations of the body and angular movements of the head relative to the force
of gravity (Angelaki & Cullen, 2008; Cawthorne et al., 1956). It is made up of the
utricle, saccule and three semi-circular canals (i.e. lateral canal, anterior canal and
posterior canal). It is an especially interesting part of the ear complex because, by
comparison, the size of the cetacean vestibular complex is about three times
smaller than those of mammals with the same body mass (Fleischer, 1976; Spoor
et al., 2002; Yamada & Yoshizaki, 1959). Generally, mammalian canals are more
sensitive to head movements when two semi-circular canals approach angles close
to 90 degrees (Berlin et al., 2013; Malinzak et al., 2012). In humans, there is little
change in the shape of the vestibular complex once it reaches an adult size, but
there are small changes in orientation relative to the cochlea, and the semi-circular
canals keep opening laterally until complete ossification of the compartment (
(Jeffery & Spoor, 2004; Spoor, 1993). Interestingly, the lateral canal seems to
develop at a slower rate than the other semi-circular canals (Rinkwitz et al., 2001).
Current knowledge of the vestibular complex in cetacean species remains limited.
1.4 Significance of Age and Ecology
Age- and ecology-dependent structural changes could affect a cetacean’s
ability to detect certain frequencies. Ketten (1997) suggested that body size,
behaviour and habitat could influence auditory anatomy, and thereby create
variation in hearing ability. Cetaceans are distinctive amongst mammals in that
their environment requires them to be precocious in water; they must swim
independently and surface immediately after birth (Dearolf et al., 2000;
Rauschmann et al., 2006). Additionally, hearing is a vital part of odontocete
ecology, playing a central role in navigating the environment, identifying and
communicating with conspecifics and mother-calf imprinting (Fripp & Tyack,

Chapter 1: Introduction| 11
2008; King et al., 2016; Mooney et al., 2012), all of which are critical from a very
early age.
1.4.1 Age
Even without these unique pressures for aquatic precocial development,
many terrestrial mammals display a pattern of advanced ear development. Rabbits
have been found to have fully grown bony labyrinths at birth, with tympanic bullae
that increase in width for the following 22 days (Hoyte, 1961). Humans have a
bony labyrinth that reaches an adult size and shape well before birth and before
ossification approximately halfway through gestation (17-19 weeks; Bast, 1930;
Jeffery & Spoor, 2004; Spector & Ge, 1993). The development of the cochlea
progresses from base to apex, and it is suspected that cochlear function begins
with the opening of the organ of Corti around gestational week 20 (Pujol et al.,
1991). Humans have been documented to be functionally capable of hearing for at
least two and a half to three months before birth (Pujol et al., 1991).
Ruminants, which are close terrestrial relatives to cetaceans belonging to
the clade Cetartiodactyla, have similar patterns in their hearing complexes. The
bony labyrinth has been shown to ossify in the fourth gestational month and
reaches an adult size around that same mid-gestational timeframe (Costeur et al.,
2017; Mennecart & Costeur, 2016). Around mid-gestation, the total volume of bony
labyrinths is similar to that of adults, and there is even evidence to suggest that
they are slightly larger than the adult counterparts (Mennecart & Costeur, 2016).
However, there are still some uncertainties over observed variability in semi-
circular canals and slower development of open features like the cochlear
aqueduct of ruminants.
Hypothesized first by Perrin (1975), recent research on cetaceans has
indicated a very similar pattern of precocial hearing development to what we
observe in other mammals. The tympanoperiotic complex is undeniably the
densest part of a newborn odontocete skeleton, and changes little in size from
juvenile to adult (Cozzi et al., 2012; Kasuya, 1973; Lancaster et al., 2015). Middle
earbones are also known to rotate into their adult position during early stages of
foetal development (Reidenberg & Laitman, 2009). A recently published study has
given us a particularly interesting insight into the development of the cetacean

Chapter 1: Introduction| 12
bony labyrinth. Thean et al. (2016) found that cetacean inner ears may ossify and
reach adult size as early as 32% through the gestational period, and as a whole had
earlier precocial inner ear development when compared against suid artiodactyls.
Contrary to other mammalian studies, ossification of the cetacean bony labyrinth
seems to begin before the labyrinth reaches an adult size. In addition, the study
found that the earliest embryos displayed a more flattened cochlear spiral,
compared to later stages and adult counterparts, although the implications are
unknown. There is the potential for small age-related differences in the bony
labyrinth, but ecological factors have been known to influence structure and
orientation of the bony labyrinth as well.
Almost half the world’s cetacean species can be sighted in New Zealand
waters. With eight species of mysticetes and thirty species of odontocetes, there is
more variety here than almost any other single region in the world (Baker, 1990;
Baker & van Helden, 1999). Odontocetes are heavily reliant on their hearing as a
means to navigate, hunt for prey, and communicate with others (Richardson et al.,
2013; Tyack, 2008). With the exception of Gray’s beaked whale, all the species
included in this study are dolphins from the Family Delphinidae, and all have
different ecologies. Due to the potential for ecological factors to influence hearing
ability (Ketten, 1997), below I will introduce our species of interest and summarise
their hearing limit and ecology.
1.4.2 Ecology
Hector’s dolphins
Hector’s dolphins (Cephalorhynchus hectori) also known as NZ dolphins, are
probably the most iconic cetacean species in New Zealand, and are well known for
their ‘Endangered’ classification (Reeves et al., 2013). The species comprises two
subspecies. Cephalorhynchus hectori maui is found only off the North Island west
coast, numbers around 51 individuals (Baker et al., 2016), and is considered
Critically Endangered. The South Island subspecies, Cephalorhynchus hectori
hectori numbers at least 7000 (Slooten et al., 2004). The subspecies are visually
identical. Hector’s dolphins tend to aggregate in pods of 2-8 individuals in shallow
turbid waters, often within eight kilometres of the coast (Dawson, 2009). Adult
individuals usually have a body length within the range of 117-145cm with a
Chapter 1: Introduction| 13
weight of about 50 kilograms (Dawson & Slooten, 1988; Folkens & Randall, 2002).
They also prey on a variety of benthic and pelagic fish and cephalopods (Miller et
al., 2013). Hector’s dolphins can be quite vocal, with high frequency clicks around
125 kHz (Dawson & Thorpe, 1990).
Pilot whales
There are two species of pilot whales, both of which reach a length of about
six meters (Olson, 2009; Wilson & Mittermeier, 2014). The short-finned pilot
whales (Globicephala macrohynchus) favour warmer waters, while the long-finned
pilot whales (Globicephala melas) favour cooler temperate waters (Olson, 2009).
This study collected data from the latter. Pilot whales are highly social and
cohesive with their pod, usually consisting of about 20-100 individuals (Wilson &
Mittermeier, 2014). This cohesive nature also means that they are prone to mass
stranding (Kritzler, 1952; Perrin & Geraci, 2002). Generally, they live offshore and
deep-dive to feed on squid nocturnally (Baird et al., 2002). Sometimes these deep
dives can separate group members by hundreds of meters, requiring vocalisations
for the whales to relocate one another (Visser et al., 2016). Adults hear best at
frequencies ranging from 11-50kHz (Pacini et al., 2010). There is insufficient data
to assess the species’ conservation status, and it remains in the IUCN “Data
Deficient” category (Taylor et al., 2008).
Gray’s beaked whales
Gray’s beaked whales (Mesoplodon grayi) were recently reassessed and
classified as IUCN ‘Not Threatened’ due to the large number of records and high
genetic diversity (Thompson et al., 2013). Beaked whales in general tend to be
difficult to sight in the wild (Barlow, 1999) and most of our current knowledge has
been compiled from stranding records. They live offshore in waters deeper than
200m and in pods of five or less individuals; they are evasive of boat activity and
dive for extended periods of time (Zimmer et al., 2008). Despite this, Gray’s beaked
whales are still the most common beaked whales to strand in New Zealand (Baker
& van Helden, 1999), and have mostly been found in areas with deep, cold waters
south of 30°S (Folkens & Randall, 2002). Gray’s beaked whales feed on deep-water
fish and cephalopods, foraging in depths that reach 500 meters or more (MacLeod
Chapter 1: Introduction| 14
et al., 2003; Pitman, 2009; Wilson & Mittermeier, 2014). Adults reach a body
length of over five meters (Baker & van Helden, 1999), and although audiograms
are yet reported, we know that close relatives like Blainville’s beaked whales
(Mesoplodon densirostris) make sounds around 30-50kHz (Johnson et al., 2004).
Bottlenose dolphins
The decision to collect data on bottlenose dolphins (Tursiops truncatus) was
largely because material is common in collections and there is an excellent
literature base. Although the number of species is currently controversial, the
genus is comprehensively studied and has a world-wide distribution of both
nearshore and offshore populations (Hoelzel et al., 1998). Presence of both
populations is unconfirmed in New Zealand but there have been occasional
sightings of non-local bottlenose dolphins in addition to the more common coastal
populations (Constantine, 2002). On average, groups contain 15 individuals and
adults reach a length of about 235-270cm (Sergeant, 1973; Wursig & Wursig,
1977). In general, coastal populations spend the majority of their time in waters
less than ten meters in depth (Wursig & Wursig, 1979) and have displayed both
cooperative and individual feeding behaviours in shallow waters (Leatherwood,
1975). Bottlenose dolphins feed on a variety of fish and squid (Wilson &
Mittermeier, 2014). They also develop their own vocal signatures in the first few
months after birth, which helps facilitate mother-offspring recognition and
reunion (Sayigh et al., 1990; Smolker et al., 1993; Tyack, 1997). Bottlenose
dolphins have a rich repertoire of sounds within the human hearing range (i.e.
<20kHz), and make broadband echolocation clicks extending to beyond 120kHz
(Au, 2009; Au et al., 1974). Their hearing is better studied than that of any cetacean
and shows good sensitivity to about 140kHz (e.g. Au et al., 2002; Johnson, 1967)
1.5 Study Aims: Is Hearing Fully Developed at Birth?
The aim of this study is to identify the degree to which odontocete hearing
structures are developed at birth. By tracing back the origins of principal
structures we can identify which parts develop first and are therefore fundamental
towards hearing ability. Even though there are many reasons why one might
assume that hearing is fully developed prenatally, few studies have investigated

Chapter 1: Introduction| 15
the ontogeny of key hearing-dependent structures such as the cochlea. Even fewer
studies have been able to analyse multiple samples from the same species.
In this study I have analysed a range of different-aged individuals from four
different species local to New Zealand waters. Samples from multiple species give
the opportunity to identify whether patterns of ear development are taxonomic
(reflecting phylogeny), or ecological, or both. Through the use of micro-CT, I take a
closer look at the inner ear, and by utilising geometric morphometrics, I can gain
more robust and accurate results for reliable interpretation.
As discussed above, precocial ear development is reported in various
mammalian species, and some recent studies (Lancaster et al., 2015; Thean et al.,
2016) propose the same in odontocetes. Additionally, newborn cetaceans are
required to be precocious in many other ways in order to survive as an air-
breather in an oceanic environment. Evidence generally suggests that odontocetes
do indeed develop their hearing structures early in life, I seek to evaluate this
suggestion, elucidate the timing of development, and investigate if any components
of the cochlea take longer to develop than others.
As we improve our knowledge of the cochlea, we may be able to use its
structure with more confidence as a proxy for hearing ability. In turn, this would
make it easier to learn about rare or extinct species, for which there are no means
of using auditory evoked potentials. The hard tissues of the ossified bony labyrinth
have a direct structural relationship with the soft tissue. Although the hard tissue
of the bony labyrinth cannot represent the cochlear and vestibular complexes
exactly, it does show a maximum size and accurate shape of the soft tissue
structures it contained (Spoor et al., 1994; Walsh et al., 2009). The structure of the
basilar membrane, in particular, has been critical in deducing hearing ability
(Echteler et al., 1994; Ketten & Wartzok, 1990). Further, the membrane can be
measured by the impression it leaves in the bony labyrinth, as a laminar gap.
Palaeontologists increasingly use features of the middle and inner ear to
reconstruct the phylogenies of extinct species (e.g. Benoit et al., 2015; Tanaka &
Fordyce, 2016; Tsai & Fordyce, 2016). Earbones are extremely dense and can
therefore be more likely to survive burial and fossilisation than other parts of a
skeleton, which makes them an especially useful tool.

Chapter 1: Introduction| 16
Our understanding of the structural aspects of odontocete hearing is
steadily improving due to the relatively recent utilisation of non-destructive
micro-CT and development of more robust analyses. The key steps now are to
identify factors that affect how sound is processed and transduced internally, and
to ascertain how these factors develop and affect hearing ability in ontogeny. My
hope is for this study to build a better understanding of the development of
hearing in modern odontocetes, perhaps ultimately helping to provide insight into
mass strandings or the effects of widespread oceanic noise pollution.

Chapter 2: Methods| 17
2 Chapter 2: Methods
2.1 Sources of Material
When studying cetacean morphology, there is a heavy reliance on the
availability and accessibility to stranding material for research. This makes it
difficult to obtain large sample sizes and even more uncommon to find and use
material from early age classes like neonates and foetuses. For this project, skull
and tympanoperiotic complex (earbone) measurements were collected from two
primary sources (Table 1 and 2). Most material came from the National Museum of
New Zealand Te Papa Tongarewa in Wellington. Additional contributions were
from a collection created and maintained by Te Upokorehe iwi, tāngata whenua
tūturu of the Ōhiwa Harbour in the Bay of Plenty region.
Together with Te Upokorehe and under a Memorandum of Understanding
(MOU; Appendix A), we established a novel research partnership to support
scientific engagement in the community and provide access to rare material for
this study. Material came from a stranding involving over 40 long-finned pilot
whales at the entrance of Ōhiwa Harbour in November of 2014. Under the
guidance of well-known tohunga tohorā (cetologist) Ramari Stewart, forty skulls
were collected and prepared by Te Upokorehe iwi to create a unique and well-
preserved community collection.
For my study, standard external measurements were taken from the skulls
and earbones (tympanoperiotic complexes; TPCs) of 60 individuals (15 individuals
per study species). Due to the cost of micro-CT and some incomplete specimens,
only earbones from the right side of each individual were included in this study.
Recent study of labyrinth symmetry has found however, that mammals (including
cetaceans) have no significant variations between the left and right bony
labyrinths (Ary et al., 2016; Mennecart & Costeur, 2016; Schnitzler et al., 2017;
Welker et al., 2009). Species of odontocetes used in this study are long-finned pilot
whale (Globicephala melas), bottlenose dolphin (Tursiops truncatus), Gray’s beaked
whale (Mesoplodon grayi), and Hector’s dolphin (Cephalorhynchus hectori).

Chapter 2: Methods| 18
Table 1: List of all skulls and TPC material used with the source and type of analysis conducted. Four species of odontocete total 61 individuals, and 14 specimens were additionally scanned with Micro CT. Abbreviations: Average mandible length (AML), condylobasal length (CBL), Museum of New Zealand Te Papa Tongarewa (MoNZ), total body length (TBL).
Location Species ID Number Analysis Age Class CBL (mm) AML (mm)
MoNZ Cephalorhynchus hectori MM001615 External Measurements, Adult 305 243 MoNZ Cephalorhynchus hectori MM002007 External Measurements, Micro CT Juvenile 259 203 MoNZ Cephalorhynchus hectori MM002014 External Measurements Neonate - 162 MoNZ Cephalorhynchus hectori MM002019 External Measurements Adult 284 230 MoNZ Cephalorhynchus hectori MM002067 External Measurements Neonate - 156 MoNZ Cephalorhynchus hectori MM002282 External Measurements Juvenile 264 210 MoNZ Cephalorhynchus hectori MM002286 External Measurements Adult 279 224 MoNZ Cephalorhynchus hectori MM002290 External Measurements Adult 277 220 MoNZ Cephalorhynchus hectori MM002410 External Measurements, Micro CT Adult 298 247 MoNZ Cephalorhynchus hectori MM002834 External Measurements Neonate 249 198 MoNZ Cephalorhynchus hectori MM002838 External Measurements Neonate - 190 MoNZ Cephalorhynchus hectori MM002839 External Measurements, Micro CT Neonate - 150 MoNZ Cephalorhynchus hectori MM002842 External Measurements Adult 294 216 MoNZ Cephalorhynchus hectori MM002846 External Measurements Juvenile 271 213 MoNZ Cephalorhynchus hectori MM002863 External Measurements Neonate 305 146 MoNZ Globicephala melas MM001840 External Measurements, Micro CT Neonate - 250 MoNZ Globicephala melas MM001848 External Measurements, Micro CT Juvenile 529 419 MoNZ Globicephala melas TMP25921 External Measurements, Micro CT Adult 619 495 Upokorehe Globicephala melas T1W2 External Measurements Adult 710 570 Upokorehe Globicephala melas T2W4 External Measurements Adult 657 535 Upokorehe Globicephala melas T3W1 External Measurements Adult 679 546 Upokorehe Globicephala melas T4W1 External Measurements Adult 695 550 Upokorehe Globicephala melas T4W2 External Measurements Adult 643 517 Upokorehe Globicephala melas T6W5 External Measurements Adult 605 485 Upokorehe Globicephala melas T7W1 External Measurements Adult 587 465 Upokorehe Globicephala melas T8W3 External Measurements Adult 568 451 Upokorehe Globicephala melas T8W4 External Measurements Adult 537 424 Upokorehe Globicephala melas T9W2 External Measurements Neonate 444 343 Upokorehe Globicephala melas T9W3 External Measurements Neonate 455 356 Upokorehe Globicephala melas T9W4 External Measurements Neonate 441 348 Upokorehe Globicephala melas T9W5 External Measurements, Micro CT Foetus - 85

Chapter 2: Methods| 19
Location Species ID Number Analysis Age Class CBL (mm) AML (mm) MoNZ Mesoplodon grayi MM002130 External Measurements Adult 722 636 MoNZ Mesoplodon grayi MM002234 External Measurements Adult 607 527 MoNZ Mesoplodon grayi MM002610 External Measurements Adult 613 515 MoNZ Mesoplodon grayi MM002624 External Measurements, Micro CT Adult 882 778 MoNZ Mesoplodon grayi MM002626 External Measurements Adult 711 631 MoNZ Mesoplodon grayi MM002890/1 External Measurements Neonate 444 379 MoNZ Mesoplodon grayi MM002891 External Measurements, Micro CT Neonate - 335 MoNZ Mesoplodon grayi MM002896 External Measurements Adult 818 723 MoNZ Mesoplodon grayi MM002935 External Measurements, Micro CT Juvenile 485 409 MoNZ Mesoplodon grayi MM002938/1 External Measurements Adult 724 623 MoNZ Mesoplodon grayi TMP013512 External Measurements Neonate 383 338 MoNZ Mesoplodon grayi TMP025923 External Measurements Juvenile 511 416 MoNZ Mesoplodon grayi TMP025924 External Measurements Adult 881 771 MoNZ Mesoplodon grayi TMP025925 External Measurements Neonate 484 401 MoNZ Mesoplodon grayi TMP025926 External Measurements Juvenile 487 430 MoNZ Tursiops truncatus MM000688 External Measurements Neonate 331 268 MoNZ Tursiops truncatus MM001872 External Measurements Juvenile 459 390 MoNZ Tursiops truncatus MM002867 External Measurements Adult 525 440 MoNZ Tursiops truncatus MM002868 External Measurements Adult 554 487 MoNZ Tursiops truncatus MM002974 External Measurements Adult 559 485 MoNZ Tursiops truncatus MM002975 External Measurements Adult 543 470 MoNZ Tursiops truncatus MM002979 External Measurements Adult 531 418 MoNZ Tursiops truncatus MM002980 External Measurements Adult 554 476 MoNZ Tursiops truncatus MM002981 External Measurements Adult 543 477 MoNZ Tursiops truncatus MM002982 External Measurements, Micro CT Juvenile 421 358 MoNZ Tursiops truncatus MM002983 External Measurements, Micro CT Neonate - 251 MoNZ Tursiops truncatus MM002984 External Measurements, Micro CT Adult 561 476 MoNZ Tursiops truncatus MM002985 External Measurements Adult 509 432 MoNZ Tursiops truncatus MM002986 External Measurements Adult 547 477 MoNZ Tursiops truncatus TMP012839 External Measurements Juvenile 426 340

Chapter 2: Methods 20
Table 2: List of all radiographed foetal material. Two species of odontocete total 6 individuals. Foetal stages follow criteria from Štěrba et al. (2000). Abbreviations: Institute for Applied Ecology New Zealand of Auckland University of Technology (AUT), Museum of New Zealand Te Papa Tongarewa (MoNZ), total body length (TBL).
Location Species Type ID Number Analysis Stage TBL (cm)
AUT Globicephala melas Whole Frozen GM230a X-ray 11 42.5 AUT Globicephala melas Whole Frozen GM247a X-ray 11 47 AUT Globicephala melas Whole Fixed GM254a X-ray 7 17 AUT Globicephala melas Whole Fixed GM274a X-ray 12 28.6 AUT Globicephala melas Whole Frozen GM406a X-ray 11 69 MoNZ Mesoplodon grayi Whole Fixed MM002875 X-ray 8 18.5
Further odontocete foetuses were obtained from Massey University in
Auckland and the Museum of New Zealand, Te Papa Tongarewa. Since specimens were
still whole, I chose to maintain the integrity of the material and avoid destructive
sampling by using radiography to identify if ossification was present before further
investigation. Three frozen and two fixed pilot whales were supplied from Massey
University, and one fixed Gray’s beaked whale was supplied from Museum of New
Zealand, Te Papa Tongarewa. Radiography was completed in the Dunedin Hospital’s
Radiology Department, and images were stored as DICOM files on CD-ROMs provided
by the hospital.
2.2 Aging and Staging
There are several methods for determining age in odontocetes, and one of the
most common, primarily in adults, is tooth sectioning. Cetacean teeth have growth
bands called Growth Layer Groups (GLGs), which can be counted to determine the age
of an individual in years (Hohn et al., 1989). Teeth were sent to the University of
Otago’s Histology Services Unit within the Department of Pathology, where they were
decalcified, sliced at 4m and stained with a standard Toluidine Blue. Unfortunately,
in this case, sections did not produce well-defined GLGs clear enough to determine
accurate ages.
If GLGs are too unclear, or specimens are too young to have GLGs, other
methods may be used to approximate age instead. The amount of closure and fusion in

Chapter 2: Methods| 21
the sutures of a skull (Jordan et al., 2015; Perrin, 1975; Figure 3), consideration of
skull size and closure of pulp cavities in the teeth can also indicate age class. As an
animal ages the sutures between its skull bones close and eventually fuse, creating a
strong seam. Therefore, open sutures can indicate neonates and young juveniles.
Additionally, because tooth pulp cavities build layers over the course of years, adults
tend to have full and dense pulp cavities, whereas young animals have thin and hollow
teeth (Besharse, 1971; Kasuya & Marsh, 1984). For this study, I relied on the above
methods to establish age classes: neonate, juvenile and adult. Individuals included in
the foetal age class were identified by total body length and stranding record
information. Staging of foetuses followed criteria from Štěrba et al. (2000).
2.3 Skull and TPC Measurements and Analysis
2.3.1 Measurements
The main focus of this study, to analyse differences in the inner ear, was
limited by the cost of micro-CT per specimen. Therefore, along with the standard skull
measurements, I also collected measurements from the tympanoperiotic complexes
(TPCs) to analyse earbone growth from external dimensions and make the overall
Figure 3: Four age classes represented by Globicephala melas specimens: Foetus (T9W5), Neonate (T9W3), Juvenile (MM1848), Adult (TMP25921). Photo credit for the foetus and neonate: Shaun Wilson.

Chapter 2: Methods| 22
study more robust. Measurements were taken from 15 individuals per species, plus an
additional foetal specimen for Globicephala melas. TPCs
for later micro-CT scanning were chosen from these same individuals.
Standard measurements followed those of Kasuya (1973) for the skulls and those of
Gutstein et al. (2014) for the TPCs (Figure 4, Table 3). Skulls were placed on a flat
surface with the rostrum propped upwards to lie parallel with the table surface.
Measurements were taken to the nearest millimetre using standard callipers, straight
edges and rulers. Skulls and TPCs have many rounded and irregular surfaces that
make accurate measurements difficult. To increase the accuracy of my data, I collected
the measurements of each feature on three separate occasions and took the average.
2.3.2 Analysis
Traditionally, the most widely used age-related dimensions have been condylobasal
length (CBL) and bizygomatic width (See Figure 4 and Table 3; Perrin, 1975; Pyenson
Figure 4: External measurements displayed with an adult Globicephala melas (OU22805): (A) Skull and mandible, (B) Top: Left tympanoperiotic complex resting on the ventral surface of the tympanic bulla; Bottom: Left isolated periotic resting on its dorsal surface. Measurements 2 and 4 are transverse. Refer to Table 1 for measurement descriptions.
A B

Chapter 2: Methods| 23
& Sponberg, 2011). However, young individuals have unfused skulls that are often in
disarticulated pieces, which makes traditional age-related dimensions difficult. To
analyse measurements across all age classes, I decided to use the readily available
average mandible length (AML) as a proxy for age in this study.
Nevertheless, it is important to express caution when interpreting results from
mandible growth, as feeding apparatus development is known to show allometric
growth that follows cranial length in cetaceans (Perrin, 1975).
Using the Akaike information criterion (AIC) I chose to run a Generalised Least
Squares Model (GLS) with residuals weighted by species and measurement name.
Weighted measurement names allow for correlation caused by using the same set of
bones for each measured feature. To compare between species, I also standardised the
x and y-axes by making each value a percentage of the species’ maximum value for
that measurement. Simply put, both axes represent a percentage of maximum size.
The percentage of maximum mandible size and proxy for age is on the x-axis, and the
percentage of maximum size for each TPC feature is expressed on the y-axis. This is
done because the size range of each measurement differs between each species and
measurement type.
Table 3: List of external measurements taken from 15 individuals in each of the four species. Measurements follow those of Kasuya (1973) and Gutstein et al. (2014).
Measurement # Description 1 Skull condylobasal length (CBL) 2 Skull bizygomatic width 3 Skull height 4 Rostrum width (left to right antorbital notch) 5 Rostrum length 6 Mandible length (left and right) 7 Mandible width (left and right) 8 Length of tympanic bulla 9 Maximum width of tympanic bulla 10 Width of internal acoustic meatus (IAM) 11 Length of internal acoustic meatus (IAM) 12 Length of periotic 13 Length of the pars cochlearis from anteriormost point to cochlear window 14 Width of the pars cochlearis (medio laterally) 15 Cochlear window diameter (medio laterally) 16 Width of the fossa for the stapedial muscle

Chapter 2: Methods| 24
2.4 Building 3D Cochlear Models
2.4.1 Micro CT Scanning
Thirteen TPCs were scanned with micro Computed Tomography (micro-CT):
one neonate, one juvenile and one adult sample from each of the four target species,
plus an additional foetal TPC from Globicephala melas. Scans were run using a SkyScan
1172 model (Control Program v. 1.5, build 21A from Bruker-MicroCT). The machine
uses X-rays from different angles to gather a set of 2D density image slices, which are
later stacked to form a 3D model. Samples were limited to a 60 x 60 mm cube and
mounted securely with radiotransparent material (If not mounted properly, slight
rotation wobbles can show up as artefacts in the scan and disrupt image clarity.).
Scanning time varied depending on the size of the specimen and the resolution
required. This study used medium resolution for all micro-CT scans. For more
information on the micro-CT process see Abel et al. (2012).
2.4.2 3D Modeling Software
Micro-CT images were processed to generate 3D models of the inner ear using
a combination of freeware techniques. To simplify and keep the methods clear I have
divided the of 3D model preparation into steps, with a list of the tools used in each
software program (Table 4). It was important reduce noise left by the micro-CT scan
and to reduce file sizes so that final models could be properly measured and analysed
without crashing the computer. Careful processing was essential to avoid
compromising the true structure of the inner ear.
Step 1: Reconstruction (NRecon)
Residual noise can be minimised by reconstructing the sample’s image series.
NRecon Reconstruction Software (v. 1.6.10.2) adjusts factors like beam hardening (the
reflection of photons from the object surface) and ring artefacts (rings that are created
from the rotation of the object during the scan) that may have impaired the final

Chapter 2: Methods| 25
image. After settings were adjusted appropriately, the programme was run to export a
new clearer (.tif) image series.
Step 2: Isolate Region of Interest (CTan)
CTanalyser (v.1.14.41; CTan) was used to isolate the cochlear canal located
within the scanned TPC. The top and bottom of the image series were selected and
extra slices that did not contain the cochlear were cut to reduce file size. I used the
following task list to isolate the cochlear canal and create a binary .tif image series
output file: Reload Thresholding Morphological Operations Despeckle
Bitwise Operations Reload Thresholding Bitwise Operations Save Bitmaps.
Step 3: Scale and Finalise (Fiji, Meshlab, Meshmixer)
The final steps in producing each 3D model make the model more presentable
and easier to measure during analysis. It is essential to scale the file by converting
pixels to millimetres for later measurements. When finished, save as an .obj file. Fiji
6.2 (Schindelin et al., 2012) was used to scale and reduce excess file size and noise.
Meshlab (v.1.3.3)(Cignoni et al., 2008) was used to invert the model surface and
export an .obj file. Meshmixer (v.3.1.377)(Schmidt & Singh, 2010) was used to remove
and smooth out any of the remaining noise.

Chapter 2: Methods 26
Table 4: List of software and tools used create 3D cochlear models
Software Tool Description/Command String
Step 1:
Reconstruction NRecon
Smoothing Pixels in the image series are smoothed
Ring Artifacts
Reduction
Corrects for rings artifacts that develop when
the object is rotated during the scan.
Beam-
Hardening
Reduction
Corrects for beam-hardening that occurs when
x-rays are reflected off the surface of the
object.
Output Set destination of .tif image series output file
Step 2:
Region of
Interest
CTanalyser
(CTan)
Reload Loads fresh data series from the micro-CT scan
Thresholding Segmentation process that establishes a cut-off
value along the grayscale. Depending on this
value, the pixels in the image will be included
as bone or excluded as empty space, thereby
turning the dataset into a simple binary black
and white configuration.
Morphological
Operations
Establishes the Region of Interest (ROI) using a
series of shapes and/or drawing tools. Since
the cochlear canal is not an entirely enclosed
space (there are openings for the cochlear
window, and vessels), the ROI border for each
image was manually adjusted to close it off.
Despeckle Removes obvious artefacts or ‘speckles’ from
the images
Bitwise
Operations
Isolates the ROI from the rest of the image
through the operation “Image= ROI – Image”
Save Bitmaps “Apply to the image inside the ROI” and save as
a discrete data series file
Step 3:
Scale and
Finalise
Fiji
Set Scale Under the ‘Analyze’ tab, click ‘Set Scale’. The
parameters of these scans are equivalent to
0.01734mm for every one pixel and there is an
aspect ratio of one. These details are recorded
in the information log that comes with the
micro-CT image stack.

Chapter 2: Methods| 27
Step 3:
(Continued)
Fiji
(Continued)
Crop Draw a box around the area of interest and
under ‘Image’ click ‘Crop’. This reduces the file
size by removing surrounding pixels that don’t
contribute towards the final model.
Remove
Outliers
Under the ‘Process’ tab, click ‘Noise’ and then
‘Remove Outliers’. Repeat for both ‘Bright’ and
‘Dark’ at 10 pixels. This removes most noise
around the model and fills small holes.
Save Open ‘Plugins’, click ‘3D Viewer’. Display as a
surface by clicking on the ‘Edit’ tab. Then save
as a waveform/object file (.obj).
Meshlab
Invert Under ‘Filters’ and ‘Normals, Curves and
Orientation’, click ‘Invert faces orientation’.
This makes sure that the triangles making up
the model surface face outwards.
Meshmixer
Shell Under the Edit tab, click ‘Separate Shells’ and
delete everything in the list except for the first
item, which is the core object model. This
function deletes volumes that are not
connected to the main body of the model.
Make Solid Under the Edit tab, click ‘Make Solid’ and adjust
conditions to 128 and an ‘accurate’ type. This
minimizes file size while still keeping an
appropriate resolution.
Select Any major lumps or unwanted parts of the
bony labyrinth (e.g. nerve canal) that don’t
belong in the final model were removed by
selecting ‘Erase and Fill’ or ‘Remove’. The
‘Inspector’ tool under the ‘Select’ button was
also useful for filling any breaks in the surface
mesh.
Sculpt The robust smooth brush was used to target
and reduce any leftover noise.
Chapter 2: Methods 28
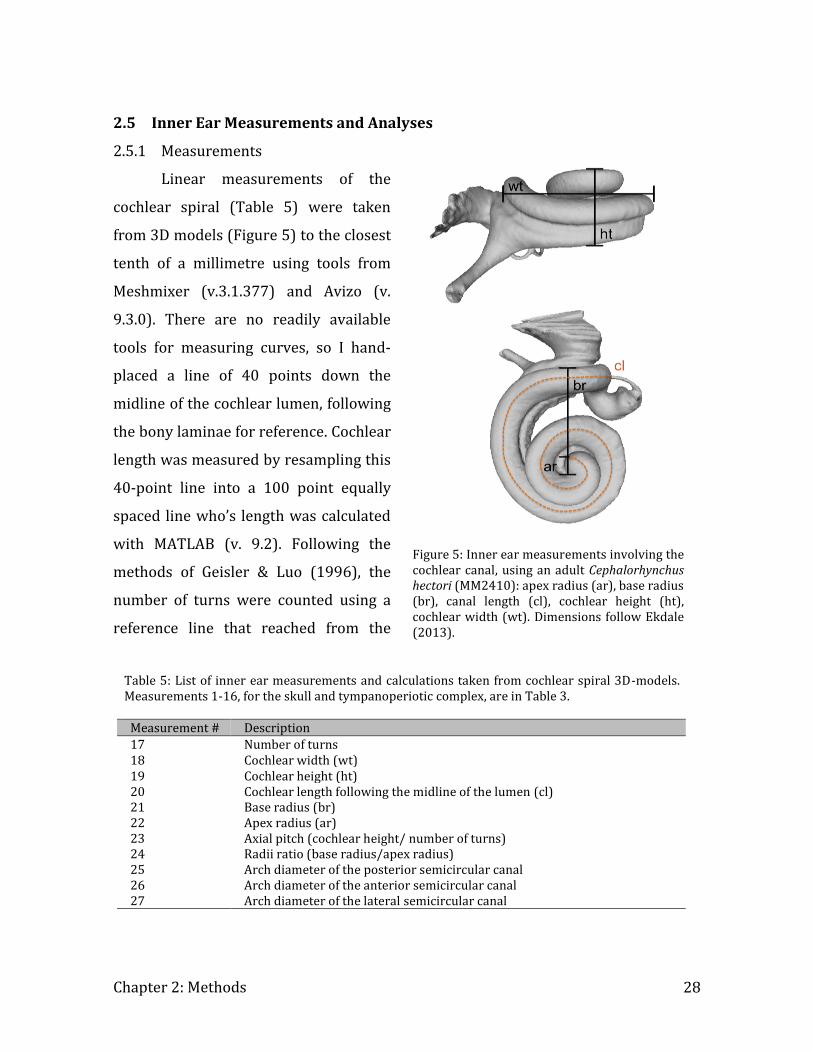
2.5 Inner Ear Measurements and Analyses
2.5.1 Measurements
Linear measurements of the
cochlear spiral (Table 5) were taken
from 3D models (Figure 5) to the closest
tenth of a millimetre using tools from
Meshmixer (v.3.1.377) and Avizo (v.
9.3.0). There are no readily available
tools for measuring curves, so I hand-
placed a line of 40 points down the
midline of the cochlear lumen, following
the bony laminae for reference. Cochlear
length was measured by resampling this
40-point line into a 100 point equally
spaced line who’s length was calculated
with MATLAB (v. 9.2). Following the
methods of Geisler & Luo (1996), the
number of turns were counted using a
reference line that reached from the
Table 5: List of inner ear measurements and calculations taken from cochlear spiral 3D-models. Measurements 1-16, for the skull and tympanoperiotic complex, are in Table 3.
Measurement # Description
17 Number of turns 18 Cochlear width (wt) 19 Cochlear height (ht) 20 Cochlear length following the midline of the lumen (cl) 21 Base radius (br) 22 Apex radius (ar) 23 Axial pitch (cochlear height/ number of turns) 24 Radii ratio (base radius/apex radius) 25 Arch diameter of the posterior semicircular canal 26 Arch diameter of the anterior semicircular canal 27 Arch diameter of the lateral semicircular canal
Figure 5: Inner ear measurements involving the cochlear canal, using an adult Cephalorhynchus hectori (MM2410): apex radius (ar), base radius (br), canal length (cl), cochlear height (ht), cochlear width (wt). Dimensions follow Ekdale (2013).

Chapter 2: Methods| 29
laminar gap at the base of the first turn to the centre of apex coiling. Turns were
rounded to the closest eighth of a turn. All measurements were taken three times and
then averaged for a more accurate value.
2.5.2 Inner Ear Analyses
Two forms of analysis were used for the inner ear:
1) a geometric morphometric shape analysis using structural landmarks
to interpret general morphology (Adams et al., 2013; Zelditch et al.,
2012), and
2) plots for standard cochlear dimensions.
Line plots were used to observe potential patterns in cochlear measurements
because there were not enough samples available to run a statistical analysis
confidently. These preliminary plots can be used to identify areas of interest that are
worth investigating in future research.
1. Geometric Morphometrics
Geometric morphometric analysis relies on a common coordinate system to
find a statistically optimum placement in space for multiple superimposed 2D or 3D
objects (Corti, 1993; Rohlf, 1999; Slice, 2001). Each 3D model requires the placement
of fixed landmarks, which are placed at distinguishable homologous points, and semi-
landmarks that are placed equidistantly along the model. Landmark and semi-
landmark coordinate sets are then superimposed through a General Procrustes
Analysis, which allows for complex shape analysis with a choice of statistical tests.
Step 1: Landmarking
Three sets of coordinates were collected from each 3D model using Avizo:
1) semi-landmarks for the cochlear midline
2) semi-landmarks for the semicircular canal midlines, and
3) landmarks for distinctive locations on the cochlear model that can be
easily identified between specimens.

Chapter 2: Methods 30
1
2
Figure 6: Diagram of landmarks (1-10) and semi-landmarks used for shape analysis. Landmarks are shown as yellow squares, and the two cochlear and vestibular splines are represented through an orange curve and spherical points. (See Table 6 for landmark position descriptions)

Chapter 2: Methods 31
Unforeseen compatibility issues with my 3D models restricted me from the
Avizo tools: ‘Measure’, ‘Slice’ and ‘Spline Probe’, used in landmarking. Similar Avizo
tools (‘B-Spline’ and ‘Landmark’) however, allowed me to follow essentially the same
landmark-sampling methodologies from Ekdale (2016).
Modules ‘B-Spline’ and ‘Landmark’ are tools used to create lists of 3D-
coordinates for each inner ear model (Figure 6). Following the same method
described previously to measure cochlear length, points were hand-placed along the
midline of each lumen forming a spline (i.e. curve formed by joining designated
points). The cochlear splines and vestibular splines were then resampled in Matlab (v.
9.2) to create 100 equally spaced curve coordinates for the cochlea and 60 for the
vestibular complex. Additionally, landmarks were hand-placed at homologous
locations on the surface of the 3D model (Table 6). These mark key locations that
assist with superimposition in the next step.
Step 2: Generalized Procrustes Analysis (GPA)
Shape-analysis for all coordinate sets were run using the Geomorph package
(Adams & Otárola-Castillo, 2013; Adams et al., 2017) in R-Studio (v. 1.0.136). A
Generalized Procrustes Analysis (GPA), superimposed each 3D model’s landmarks and
semi-landmarks to a common coordinate system, minimizing residuals from rotation,
translation, and scaling to form the most ideal shape-space (Kendall's shape-space;
Gower, 1975; Rohlf & Slice, 1990). By taking this ‘mean’ shape and running it through
additional statistical analyses as routinely done in other work (e.g. Ekdale, 2016;
Table 6: List of bony labyrinth fixed landmarks. See Figure 6 for visual placement.
Landmark # Placement Description 1 Junction between the anterior and posterior semicircular canal 2 Junction between the posterior and lateral semicircular canal 3 Junction between the lateral and anterior semicircular canal 4 Base of the ampulla, under the junction between the anterior and posterior
semicircular canal 5 Crux between the fenestra cochlearis and the cochlear aquaduct 6 Base of fenestra cochlearis, at the bony lamina impression 7 One full turn from landmark 6, placed along the bony lamina impression 8 Apex 9 One half turn from landmark 6, placed along the bony lamina impression 10 Centroid

Chapter 2: Methods| 32
Grohé et al., 2016; Schnitzler et al., 2017), I could identify significant differences
between bony labyrinth shapes.
Step 3: Supplementary Statistics
Finally, I analysed changes in cochlear morphometrics with a Procrustes
analysis of variance, pairwise comparisons, and a descriptive principal component
analysis (PCA). All statistics were run through R-Studio (v. 1.0.136). The Procrustes
analysis of variance is similar to the more familiar permutation analysis of variance
(PERMANOVA), and was used to identify any differences in cochlear shape as a factor
of ontogeny or as a factor of phylogeny. Subsequently, any detected differences were
run through pairwise comparisons to statistically pinpoint where they differed within
age class or species. A principle component analysis was then used to visualise how all
the cochlear shapes related to one another and to see how different they were from
each other.
2. Linear data plots
Data were standardised as the percentage of maximum mandible size (here,
taken as a proxy for age) plotted on the x-axis, and the percentage of maximum size
for each cochlear dimension expressed on the y-axis. Plots display potential trends in
size change of different cochlear dimensions. Results can guide areas for future
research, but more samples would need to be collected to make statistical claims.

Chapter 3: Results| 33
3 Chapter 3: Results
3.1 Tympanoperiotic Complex and Skull Measurements
There were minimal changes in size and shape of the tympanoperiotic complex
(TPC) relative to age. Measurements were standardised to be percentages of
maximum size within the sample set. A Generalized Least Squares Model was used to
identify the rate of ontogenetic change in specific TPC measurements (via mandible
measurements). The statistical three-way interaction between measurement, species
and age was significant (p= 0.0001; Table 5). This indicates that at least one species
had a growth pattern significantly different from the other species: Cephalorhynchus
hectori ontogenetic size change of the pars cochlearis width significantly differed from
all three other species (p<0.05; Figure 7), and its tympanic bulla width size change
differed from both those of Globicephala melas and Tursiops truncatus (p<0.05; Figure
7).
Table 5: ANOVA results comparing tympanoperiotic complex measurements between species and/or mandible lengths (age proxy). Note the significant p-value for the 3-way interaction at the bottom of the table. Abbreviation: number of degrees of freedom (numDF).
numDF F-value p-value (Intercept) 1 191226.26 <.0001 Measurement 8 26.02 <.0001 Species 3 11.34 <.0001 Average Mandible Length 1 81.84 <.0001 Measurement: Species 24 5.40 <.0001 Measurement: Average Mandible Length 8 5.53 <.0001 Species: Average Mandible Length 3 2.04 0.1069 Measurement: Species: Average Mandible Length 24 2.57 0.0001
With the minor exceptions found within Cephalorhynchus hectori, features of
the TPC held very similar trend lines overall. There was a slightly positive correlation
between age and features of the TPC, but for the most part, size changed at a rate close
to zero (Figure 7). This indicates minimal changes in TPC features between younger
animals and adults of the same species.

Chapter 3: Results| 34
3.2 Radiography of Foetal Material
The pilot whales and single Gray’s beaked whale foetuses spanned the
developmental Stages 7-12 of Štěrba et al. (2000), with Stage 11 being the most
advanced. These foetal stages in turn are based on the Carnegie staging system
(O’Rahilly, 1973) which follows generalised mammalian criteria. Štěrba et al.
rearranged the usual stage numbers to accommodate premature opening of eyelids
relative to the average mammal (see explanation by Štěrba et al. 2000, page 41). For
clarification, I have included chronological stage numbers that are consistent with the
progression of cetacean development (See Table 6).
Figure 7: Nine measured features of the tympanoperiotic complex, plotted as a function of age (via mandible length). Axes are standardized by calculating the percentage of the species’ maximum size. Abbreviations: internal acoustic meatus (IAM), muscle fossa (MF).

Chapter 3: Results| 35
Table 6: List of observations from the six foetuses and corresponding radiography. Chronological stages are the cetacean- specific stages proposed by Štěrba et al. (2000) labelled in chronological order. For supporting images see Appendix B. Abbreviations: total body length (TBL), tympanoperiotic complex (TPC).
ID GM254a GM274a GM230a GM247a GM406a MM002875 Species G. melas G. melas G. melas G. melas G. melas M. grayi Stage (Chronological) 7 10 12 12 12 8 Stage (Štěrba) 7 12 11 11 11 8 TBL (cm) 17 28.6 42.5 47 69 18.5 % Birth length 11% 18% 27% 29% 43% 8% Umbilical stalk closed Y Y Y Y Y Y Eyelids open N Y Y Y Y N Elongated fluke N Y Y Y Y N Skin pigment N Y Y Y Y N Blue/black skin pigment N N Y Y Y N Ossified ribs N Y Y Y Y Y Ossified vertebrae N Y Y Y Y N Ossified braincase N Y Y Y Y N Ossified rostrum N Y Y Y Y N Ossified flippers N N Y Y Y N Outline of TPCs N N Y Y Y N Dense TPCs N N N N N N Cochlea spiral visible N N N N Y N Teeth visible N N N Y Y N
Radiography revealed questionable signs of ossification in the ear region, with
clear ossification seen only in the oldest (Stage 11, TBL= 69cm) G. melas foetus.
Although the TPCs were not distinctly more dense than the rest of the skull, they were
mineralised enough to detect the cochlear canal void (Appendix B). Additionally, faint
outlines of the tympanoperiotic complexes were detected in the smaller Stage 11
foetuses (Table 6; Appendix B). To keep the integrity of rare foetal specimens, I
decided not to dissect and isolate the ears for further micro-CT scanning. For images
of the foetuses and X-rays see Appendix B.
3.3 Inner Ear Measurements
3.3.1 Geometric Morphometrics
Landmarks from 3D cochlear models were run through a General Procrustes
Analysis (GPA), which creates a ‘mean shape’ formed by superimposing models into a
common coordinate system with the least amount of residuals (Kendall's shape-space;

Chapter 3: Results| 36
Gower, 1975; Rohlf & Slice, 1990). Post-GPA analyses uses this ‘mean shape’ to detect
morphological differences as well as calculate the degree of variation. Based on the
results of a Procrustes ANOVA, I found that the shape of the cochlear spiral is not
significantly different between age classes (p= 0.998), but is significantly different
between species (p<0.001; Table 7). There were not enough samples to properly
compute a further two-way interaction with statistical confidence (that is, to establish
the combined effect of age and species on shape).
Table 7: Results of the Procrustes ANOVA main effect model at 10,000 permutations. Note there is a significant p-value for species, but not age class. Abbreviations: degrees of freedom (Df), sum of squares (SS), mean squares (MS), residuals squared (Rsq). Df SS MS Rsq F Z Pr(>F) Age 3 0.013 0.004 0.100 0.848 0.380 0.998 Species 3 0.086 0.029 0.666 5.670 2.797 1.00E-04*** Residuals 6 0.030 0.005 Total 12 0.130
Table 8: List of pairwise comparison results analysing cochlear morphology between species. Distance and Z-Score show the degree to which these cochlear comparisons differ. Note the p-values for M. grayi that show cochlear shapes to be significantly different to all the other species. P-values C. hectori G. melas M. grayi T. truncatus C. hectori 1.000 0.121 0.002 0.220 G. melas 0.121 1.000 0.000 0.336 M. grayi 0.002 0.000 1.000 0.005 T. truncatus 0.220 0.336 0.005 1.000 Distance (d) C. hectori G. melas M. grayi T. truncatus C. hectori 0.000 0.103 0.174 0.095 G. melas 0.103 0.000 0.174 0.082 M. grayi 0.174 0.174 0.000 0.164 T. truncatus 0.095 0.082 0.164 0.000 Z-Score C. hectori G. melas M. grayi T. truncatus C. hectori 0.000 1.292 2.050 1.111 G. melas 1.292 0.000 2.181 1.032 M. grayi 2.050 2.181 0.000 1.928 T. truncatus 1.111 1.032 1.928 0.000

Chapter 3: Results| 37
Following the results of the Procrustes ANOVA, I ran a pairwise-comparison
(Table 8) to find which species significantly differed from one another. Results
showed that the shape of M. grayi cochlear spirals were significantly different from all
the other study species (p<0.05), while C. hectori, G. melas, and T. truncatus did not
differ significantly from one another. Based on pairwise distance results, G. melas and
T. truncatus were found to be the most similar in shape (d= 0.082), whereas G. melas
and M. grayi were the most different (d= 0.174). The degree of difference between all
individual cochleae can also be visualised through a Principal Component Analysis
(PCA) diagram (Figure 8). Note the clustering of each species and how M. grayi
cochleae lay far away from the rest of the samples.
3.3.2 Linear Measurements and Ratios
Statistics on linear measurements of the bony labyrinth were limited by sample
size. It can be difficult to acquire rare foetal material, and even if there were plenty of
samples to choose from, the cost of micro-CT can severely limit sample size. Despite
C. hectori
G. melas
M. grayi
T. truncatus
Figure 8: Principal Component Analysis (PCA) diagram of bony labyrinth shape variation. As PC1 increases, the cochlear canal forms a tighter spiral and increases in height. The semicircular canals also form longer and wider arches.

Chapter 3: Results| 38
these caveats, it can still be useful to plot raw data as a means of identifying potential
patterns to further investigate in future research. I would just like to express caution
when drawing conclusions from the following plots (Figure 9).
Overall, linear measurements of the bony labyrinth seem to follow similar
growth patterns to the TPC features discussed earlier. There is little to no slope as age
increases, and even the youngest possible individuals have dimensions that are
already at 70% or more of their expected maximum size. However, some
measurements have a somewhat positive slope as well. Cochlear height, apex radius,
axial pitch and the diameter of the posterior semicircular canal arch all increase
slightly with age (Figure 9, Table 9). On the other hand, the radii ratio is the only
calculation that seems to decrease with age on average.
Figure 9: Plots of bony labyrinth dimensions and ratios as a function of age (via mandible length). Axes are standardised by calculating percentages from the species’ maximum size.

Chapter 3: Results 39
Table 9: List of all cochlear measurements to the closest one hundredth of a millimetre. Abbreviations: anterior semicircular canal width
(Ant-SC), average mandible length (AML), lateral semicircular canal width (Lat-SC), and posterior semicircular canal width (Post-SC).
AML Turns Cochlear
width
Cochlear
height
Cochlear
length
Base
radius
Apex
radius
Axial
Pitch
Radii
ratio
Post-
SC
Ant-
SC
Lat-
SC
C.
hec
tori
Adult 247 2.125 8.37 3.88 26.12 5.50 0.93 1.83 6.15 1.03 1.40 1.71
Juvenile 203 2 8.20 3.53 25.29 5.03 1.12 1.77 4.49 1.06 1.59 1.99
Neonate 150 2 8.39 3.70 26.33 5.14 1.09 1.85 4.76 0.93 1.40 2.01
G.
mel
as
Adult 495 2.125 11.08 5.17 36.31 7.76 1.15 2.43 6.86 1.21 1.88 2.44
Juvenile 419 2.125
11.40 5.05 38.67 7.79 1.33 2.38 5.94 1.25 1.90 2.51
Neonate 250 2.125
11.28 4.62 37.05 7.69 1.18 2.17 6.55 1.17 1.99 2.44
Foetal 85 2.125
11.27 4.26 37.05 7.68 1.00 2.00 7.77 1.04 2.01 2.71
M.
gra
yi Adult 778
1.875 11.21 5.68 32.10 7.18 1.14 3.03 6.31 2.33 3.03 3.29
Juvenile 409 1.75 11.97 5.70 28.50 7.41 1.17 3.26 6.50 1.71 2.49 2.52
Neonate 335 1.75 11.22 5.75 27.47 7.11 0.94 3.29 7.57 1.94 2.77 2.91
T.
tru
nca
tus Adult 476 2 10.76 4.85 33.78 6.92 1.60 2.42 4.37 1.53 1.76 2.71
Juvenile 358 2 9.92 4.46 32.72 6.23 1.52 2.23 4.21 1.30 1.82 2.58
Neonate 251 2.125 10.05 4.62 32.36 6.74 1.12 2.18 6.01 1.08 1.41 1.97

Chapter 4: Discussion 40
4 Chapter 4: Discussion
Newborn odontocetes display many forms of precocial development. From
swimming and surfacing right after birth, to navigating and communicating with
conspecifics, it should be no surprise that their primary sensory system, hearing, is
also well developed at an early stage. The goal of this study was to establish if the
cochlea hearing organ (and the tympanoperiotic complexes which house them) is fully
developed at birth, both in terms of size and morphology. Below I will discuss my
results for analysing size, shape and timing of ossification in the tympanoperiotic
complex (TPC) and its relevance to age-class and species. I will also review some
observational notes and discuss applications to conservation and the direction of
future research.
4.1 Significance to Age- Ontogeny
Overall, features of the TPC and morphology of the bony labyrinth (i.e. cochlear
canal and vestibular complex) did not significantly differ between age classes for any
one species. This was made clear by the statistical analysis of both TPC linear
measurements and bony labyrinth geometric morphometrics. Additionally, non-
statistical plots of the cochlear proportion data gave some preliminary insight into
growth patterns (Figure 9). Most cochlear dimensions showed minor changes in size,
which indicated minimal differences between age classes. The radii ratio however,
differed from the other plots, and with the exception of Cephalorhynchus hectori
tended to decrease with age. This could mean that younger animals are more sensitive
to lower frequency limits, a finding congruent with Greenhow (2013) who reported an
increased hearing sensitivity at the upper and lower frequency limits for a captive
short-finned pilot whale (Globicephala macrorhynchus) calf. High frequency hearing
loss with age has also been reported in captive bottlenose dolphins (Ridgway &
Carder, 1997).
The minimal size and shape differences between age classes are consistent
with other research, but it was unusual to not see a statistically significant difference

Chapter 4: Discussion| 41
in growth rates between features of the tympanic bulla and periotic as has been
reported in a range of odontocetes (Kasuya, 1973). Although the length and width of
the studied tympanic bullae visually appear to show growth, there was not significant
difference when comparing the rate of their size change to other TPC measurements.
This could be because I analysed differences based on the percentage of their
maximum size rather than raw unstandardized measurements. Nevertheless, I believe
this was a more useful comparison because it put all species and measurement
features on the same scale, and allowed me to identify common growth patterns
between variables. A larger sample size would help clarify my results.
Additionally, radiography revealed that the most advanced foetus (i.e.
Globicephala melas, Stage 11, 69cm) had visible cochlear canals, and the two other
Stage 11 foetuses had faint outlines of their TPCs (Appendix B) showing that there is
some degree of early ossification. All other foetuses studied were younger than Stage
11 and did not have ossified TPCs that could be definitively identified. These findings
indicate that there is some degree of ossification by or at the time of Stage 11 foetal
development, and supports the hypothesis (Ridgway & Carder, 2001) of precocial
hearing development in young odontocetes. Cochlear ossification is presumed to be
essential for the development of the basilar membrane and the Organ of Corti. Recent
studies have reported similar observations, where ossification seems to occur just
after Carnegie Stage 23 (Sterba Stages 10 and 11; Moran et al., 2011), or as early as
32% of the gestation period in various cetacean species (Thean et al., 2016). TPCs
continue to ossify and become the densest part of the skeleton by the time of birth
(Cozzi et al., 2015). Research has also found volumes of foetal and juvenile bony
labyrinths to be the same (if not slightly larger) than their adult counterparts
(Mennecart & Costeur, 2016).
This precocial development is significant because it implies that the presence
of fully functional hearing is important for postnatal survival. Whether it is
communicating with their conspecifics or navigating a poorly lit environment,
proficient hearing is a critical sense. Prenatal hearing has been suggested to influence

Chapter 4: Discussion| 42
early imprinting in humans (DeCasper & Fifer, 1980; DeCasper & Spence, 1986), and it
is possible that a similar process could be happening in Cetacea. We know that human
hearing becomes fully functional around the start of the third trimester (Forbes &
Forbes, 1925; Pujol et al., 1991; Sontag & Wallace, 1935), and although it is unclear
when hearing becomes fully functional in odontocetes, ossification does begin earlier
than in humans (Cozzi et al., 2015; Thean et al., 2016). It would be interesting to know
if intrauterine imprinting occurs, as this might help us to better understand mother-
calf interactions postnatally.
4.2 Significance to Species- Phylogeny and Ecology
Even though there was no age-related change found in the features of TPCs or
bony labyrinths, there were statistically significant shape differences found between
species. The morphologies of Mesoplodon grayi cochleae were considered to be
significantly different from all three other odontocete species, while Cephalorhynchus
hectori, Globicephala melas and Tursiops truncatus all had cochleae that did not
significantly differ from each other. Congruent with their phylogeny, these
morphological patterns in cochleae could, hypothetically, be consistent with ecological
factors.
Ketten (2000) used cochlear shape changes to establish what is now a widely-
cited system of three cetacean ear types and associated ecotypes:
Type I: short, thick basilar membranes representative of inshore or
riverine species that detect ultra-high frequencies (over 100kHz),
Type II: long, thin basilar membranes representative of lower ultrasonic
frequencies (under 100kHz), and
Type M: large cochlea with flexible basilar membrane specific to
mysticetes.
All species of this study had cochleae considered to be Type II. Other research
has also shown a relationship between inner (cochlear) and outer morphologies of the
pars cochlearis and different (marine versus riverine) environments (Gutstein et al.,

Chapter 4: Discussion| 43
2014). If ecology played a role in bony labyrinth shape, my study might have revealed
a close relationship between the cochleae of the two offshore, deep-diving species G.
melas and M. grayi, or similarities related to social behaviour like pod size or how
‘talkative’ they are. No ecological parallels were apparent between the study species
that would also fit the PCA descriptive plot, though.
A phylogenetic explanation would certainly make sense. In addition to having
the most morphologically distant cochleae, M. grayi is also phylogenetically the most
distantly related out of the four species studied. M. grayi belongs to the Family
Ziphiidae, whereas the other three species are Delphinidae. Furthermore, my results
(Figure 8, Table 8) found T. truncatus and G. melas bony labyrinth shapes to be the
most closely related of the four study species, which is phylogenetically congruent as
well (McGowen et al., 2009). The morphology of the tympanic bullae and periotics is
sufficiently distinct that the TPC has been used to identify specimens down to the
genus (Kasuya, 1973). I suggest that, based on my current results, it is more likely that
odontocete bony labyrinth morphology is only dependent on phylogenetic differences,
not ecological ones. Further samples with more species are needed to clarify these
results.
Specific cochlear measurements can give some insight into odontocete hearing
properties. For instance, axial pitch (= cochlear height/ number of turns) is negatively
proportional to frequency, and the radii ratio (= base radius/ apex radius) is strongly
correlated to the low frequency limits of hearing (Ketten & Wartzok, 1990). Cochlear
length however, does not correlate with frequency like it does in terrestrial mammals
(Ketten, 1992a; West, 1985). It is, instead, found to relate strongly with animal size in
cetaceans (Ketten, 1992a). A useful addition to this study would have been to add
bony laminae measurements, as they show stiffness of the basilar membrane (Ekdale
& Racicot, 2015) and is therefore a good indicator of hearing frequency.

Chapter 4: Discussion| 44
4.3 Observational Notes
This was a study focused on establishing the structural changes of odontocetes
from different age classes, but it also proved to be an opportunity for observational
notes of material rarely seen from the perspective of a micro-CT scan. One of the more
interesting features to observe has been the vestibular complex. Here, both the lumen
thickness and arch diameter have been significantly reduced compared to that of land
mammals. Orientations of semicircular canals relative to the cochlea are also different.
I observed lateral canals that open out to a wider angle, and have shifted the start and
end points of the arch relative to the other semicircular canals.
The vestibular complex is comprised of the fluid-filled utricle, saccule and
semicircular canals, and is known for its role in balance perception (Cozzi et al., 2017).
Cetacean semicircular canals have been of particular interest because of their notable
reduction in size relative to the cochlea and body mass, compared to those of land
mammals (Hyrtl, 1845; Spoor et al., 2002). There have even been some reports of
incomplete semicircular canals in some adult odontocete species (Ketten, 1992b;
Ketten & Wartzok, 1990), which questions the structure’s functionality in cetaceans in
general. My observations from four ecologically diverse species of different age
classes found that semicircular canals were indeed reduced but not absent or
incomplete. Overall, of the four odontocete species, this study found the semicircular
canals to be the largest and most defined in Gray’s beaked whales (M. grayi).
Currently, the leading hypothesis to explain reduced semicircular canals is
attributed to limited head movements (shortened and/or fused cervical vertebrae)
and slower velocity of body movements due to life in a dense aqueous environment
(Gray, 1908; Ketten, 1992a). However, evidence suggests increased angular head
rotations due to inflexibility of the neck do not significantly justify the size of cetacean
semicircular canals (Kandel & Hullar, 2010). The vestibular complex plays a role in
compensating for uncontrolled head movements to stabilise gaze (Berthoz, 1997).
Perhaps the reduced reliance on eyesight (and therefore, need to stabilise it)

Chapter 4: Discussion| 45
contributed to the smaller semicircular canals. The cause and significance of the
cetacean vestibular size reduction remains very much a mystery.
4.4 Future research
Micro-CT and geometric morphometrics have been valuable tools in analysing
inaccessible, complex shapes. There are many more tools available in the R package
‘Geomorph’ that were not covered in this thesis, but could help with a more detailed
shape analysis. The package includes analyses for shape allometry, (ontogenetic)
shape trajectories and phylogenetic signal (Adams & Otárola-Castillo, 2013). The key
limitation is the need for a large sample size and the cost of micro-CT scanning. To
understand more about the ontogeny of hearing in odontocetes, much more
investigation into foetal samples is needed. Nevertheless, micro-CT is getting
increasingly affordable with time and I believe that we will be able to clarify much of
the current research with these valuable, non-destructive tools.
Researching the basics of hearing structure development is an important first
step to learning more about odontocete hearing abilities in general. For example,
there is wide interest in the cause of mass strandings in New Zealand (e.g. Brabyn &
Mclean, 1992). Golden Bay is a particularly interesting location where there is usually
at least one pilot whale mass stranding event annually. This year, 2017, there was a
particularly large stranding event where more than 400 whales were re-floated and
more than 200 whales died. The cause of such mass strandings is debated, but one
leading hypothesis is that the shallow water of this area and flat ocean floor causes
higher noise reflection and disorientation in the animal. To fully understand this
phenomenon there is a need to learn how odontocete ears function in different
environments and, in this case, find what makes pilot whales different from other
odontocetes and more vulnerable to mass stranding.
Other whale strandings have been linked to military exercises and SONAR (e.g.
Rommel et al., 2005). Most of the time, it is unlikely that the sound itself is causes
damage to ears, but that the sudden sound may startle and cause erratic behaviour

Conclusion| 46
like surfacing too quickly, leading to the bends and/or haemorrhaging with air
bubbles in the blood stream (Cox et al., 2006; Weilgart, 2007). Additionally,
anthropogenic noise like boat traffic can cause displacement of cetacean populations
(Bejder et al., 2006; Nowacek et al., 2007). The results of this study show that young
whales have fully developed ears that are just as vulnerable to anthropogenic noise as
adults. I would caution these activities around near shore areas where calving and
nurseries often occur.
5 Conclusion
Overall, this micro-CT study showed little to no change in the size and shape of
odontocete ears from birth to adulthood. With minor exceptions, tympanoperiotic
complex (TPC) measurements had minimal size changes as a factor of age, and general
growth patterns were similar between the four study species. Morphometrically the
bony labyrinth only showed shape changes between species, not age classes.
Furthermore, although X-ray images of foetuses did not display dense ossification of
the ear region, there was enough to detect cochlear canals (Appendix B) in a 69cm G.
melas foetus at 43% of its newborn length. Further investigations should focus on
whether all of the parts and proportions of the TPC reach maturity at the same stage,
and if this is a universal pattern that can be observed across all odontocete species.

References| 47
6 References
Abel, R. L., Laurini, C. R., & Richter, M. (2012). A palaeobiologist’s guide to
“virtual” micro-CT preparation. Palaeontologia Electronica, 15(2), 1–16.
Adams, D. C., Collyer, M. L., Kaliontzopoulou, A., & Sherratt, E. (2017). Software
for geometric morphometric analyses. R package.
Adams, D. C., & Otárola-Castillo, E. (2013). Geomorph: An R package for the
collection and analysis of geometric morphometric shape data. Methods in
Ecology and Evolution, 4(4), 393–399.
Adams, D. C., Rohlf, F. J., & Slice, D. E. (2004). Geometric morphometrics: Ten
years of progress following the “revolution.” Italian Journal of Zoology,
71(1), 5–16.
Adams, D. C., Rohlf, F. J., & Slice, D. E. (2013). A field comes of age: Geometric
morphometrics in the 21st century. Hystrix, 24(1), 7–14.
Angelaki, D. E., & Cullen, K. E. (2008). Vestibular system: The many facets of a
multimodal sense. Annual Review of Neuroscience, 31(1), 125–150.
Ary, W. J., Cranford, T. W., Berta, A., & Krysl, P. (2016). Functional morphology
and symmetry in the odontocete ear complex. In A. N. Popper & A. Hawkins
(Eds.), The Effects of Noise on Aquatic Life II, Advances in Experimental
Medicine and Biology 875 (pp. 57–64). New York: Springer Science &
Business Media.
Au, W. W. L. (2009). Echolocation. In W. F. Perrin, B. Würsig, & J. G. M.
Thewissen (Eds.), Encyclopedia of Marine Mammals (2nd ed., pp. 348–357).
Academic Press.
Au, W. W. L., Floyd, R. W., Penner, R. H., & Murchison, a E. (1974). Measurement
of echolocation signals of the Atlantic bottlenose dolphin, Tursiops
truncatus Montagu, in open waters. The Journal of the Acoustical Society of
America, 56(4), 1280–1290.

References| 48
Au, W. W. L., Lemonds, D. W., Vlachos, S., Nachtigall, P. E., & Roitblat, H. L.
(2002). Atlantic bottlenose dolphin (Tursiops truncatus) hearing threshold
for brief broadband signals. Journal of Comparative Psychology, 116(2),
151–157.
Baird, R. W., Borsani, J. F., Hanson, M. B., & Tyack, P. L. (2002). Diving and night-
time behavior of long-finned pilot whales in the Ligurian Sea. Marine
Ecology Progress Series, (237), 301–305.
Baker, A. N. (1990). Whales and dolphins of New Zealand and Australia: an
identification guide. Victoria University Press.
Baker, A. N., & van Helden, A. L. (1999). New records of beaked whales, Genus
Mesoplodon, from New Zealand (Cetacea: Ziphiidae). Journal of the Royal
Society of New Zealand, 29(3), 235–244.
Baker, C. S., Steel, D. J., Hamner, R. M., Hickman, G., Boren, L., Arlidge, W., &
Constantine, R. (2016). Estimating the abundance and effective population
size of Maui ’ s dolphins using microsatellite genotypes in 2015–16, with
retrospective matching to 2001–16. Department of Conservation, Auckland,
1–44.
Barlow, J. (1999). Trackline detection probability for long-diving whales.
Marine Mammal Survey and Assessment Methods, 209–221.
Bast, T. H. (1930). Ossification of the optic capsule in human fetuses.
Contributions to Embryology, 121, 55–82.
Bejder, L., Samuels, A., Whitehead, H., Gales, N., Mann, J., Connor, R., … Krützen,
M. (2006). Decline in relative abundance of bottlenose dolphins exposed to
long-term disturbance. Conservation Biology, 20(6), 1791–1798.
Benoit, J., Lehmann, T., Vatter, M., Lebrun, R., Merigeaud, S., Costeur, L., &
Tabuce, R. (2015). Comparative anatomy and three-dimensional
geometric-morphometric study of the bony labyrinth of Bibymalagasia

References| 49
(Mammalia, Afrotheria). Journal of Vertebrate Paleontology, 35(3),
e930043-3.
Berlin, J. C., Kirk, E. C., & Rowe, T. B. (2013). Functional implications of
ubiquitous semicircular canal non-orthogonality in mammals. PLoS ONE,
8(11), 24–26.
Berthoz, A. (1997). Le sens du mouvement. Paris: Odile Jacob.
Besharse, J. C. (1971). Maturity and sexual dimorphism in the skull, mandible,
and teeth of the beaked whale. Journal of Mammalogy, 52(2), 297–315.
Bookstein, F. L. (1997). Landmark methods for forms without landmarks:
morphometrics of group differences in outline shape. Medical Image
Analysis, 1(3), 225–243.
Brabyn, M. W., & Mclean, I. G. (1992). Oceanography and coastal topography of
herd-stranding sites for whales in New Zealand. American Society of
Mammalogists, 73(3), 469–476.
Brill, R. L. (1988). The jaw-hearing dolphin: preliminary behavioral and
acoustical evidence. In P. E. Nachtigall & P. W. B. Moore (Eds.), Animal
Sonar: Processes and Performances (pp. 281–287). New York, NY: Springer.
Brill, R. L. (1991). The effects of attenuating returning echolocation signals at
the lower jaw of a dolphin (Tursiops truncatus). The Journal of the
Acoustical Society of America, 89(6), 2851–2857.
Brill, R. L., Sevenich, M. L., Sullivan, T. J., Sustman, J. D., & Witt, R. E. (1988).
Behavioral evidence for hearing through the lower jaw by an echolocating
dolphin (Tursiops truncatus). Marine Mammal Science, 4(3), 223–230.
Camper, P. (1765). Verhandeling over het gehoor van de Cachelot of Pot-
Walvisch. Verh. Hollandsche Mij. Der Weetenschappen, D1 IX. St, 3.
Cawthorne, T., Dix, M. R., Hallpike, C. S., & Hood, J. D. (1956). The investigation
of vestibular function. British Medical Bulletin, 12(2), 131–142.
References| 50
Churchill, M., Martinez-Caceres, M., de Muizon, C., Mnieckowski, J., & Geisler, J.
H. (2016). The Origin of High-Frequency Hearing in Whales. Current
Biology, 26(16), 2144–2149.
Cignoni, P., Callieri, M., Corsini, M., Dellepiane, M., Ganovelli, F., & Ranzuglia, G.
(2008). MeshLab: an open-source mesh processing tool. Eurographics
Italian Chapter Conference, 129–136.
Constantine, R. (2002). The behavioural ecology of the bottlenose dolphins (
Tursiops truncatus ) of northeastern New Zealand : A population exposed to
tourism. University of Auckland, Auckland, New Zealand.
Corti, M. (1993). Geometric morphometrics: an extension of the revolution.
Trends in Ecology & Evolution, 8(8), 302–303.
Costeur, L., Mennecart, B., Muller, B., & Schulz, G. (2017). Prenatal growth
stages show the development of the ruminant bony labyrinth and petrosal
bone. Journal of Anatomy, 230(2), 347–353.
Cox, T. M., Ragen, T., Read, A., Vos, E., Baird, R. W., Balcomb, K. C., … Benner, L.
(2006). Understanding the impacts of anthropogenic sound on beaked
whales. Journal of Cetacean Research and Management, 7(3), 177–187.
Cozzi, B., Huggenberger, S., & Oelschläger, H. A. (2017). Head and senses. In
Anatomy of Dolphins: Insights into Body Structure and Function (1st ed., pp.
171–196). Academic Press.
Cozzi, B., Podestà, M., Mazzariol, S., & Zotti, A. (2012). Fetal and early post-natal
mineralization of the tympanic bulla in fin whales may reveal a hitherto
undiscovered evolutionary trait. PLoS ONE, 7(5), 3–7.
Cozzi, B., Podestà, M., Vaccaro, C., Poggi, R., Mazzariol, S., Huggenberger, S., &
Zotti, A. (2015). Precocious ossification of the tympanoperiotic bone in
fetal and newborn dolphins: An evolutionary adaptation to the aquatic
environment? The Anatomical Record, 298(7), 1294–1300.

References| 51
Dawson, S. M. (2009). Cephalorhynchus dolphins. In W. F. Perrin, B. Würsig, & J.
G. M. Thewissen (Eds.), Encyclopedia of Marine Mammals (2nd ed., pp. 191–
196). San Diego: Academic Press.
Dawson, S. M., & Slooten, E. (1988). Studies on Hector’s Dolphin,
Cephalorhynchus hectori: a progress report. In R. L. Brownell Jr & G. P.
Donovan (Eds.), Biology of the Genus Cephalorhynchus (pp. 325–338).
Cambridge (UK): International Whaling Commission.
Dawson, S. M., & Thorpe, C. W. (1990). A quantitative analysis of the acoustic
repertoire of Hector’s dolphin. Ethology, 86(2), 131–145.
Dearolf, J. L., McLellan, W. A., Dillaman, R. M., Frierson, D., & Pabst, D. A. (2000).
Precocial development of axial locomotor muscle in bottlenose dolphins
(Tursiops truncatus). Journal of Morphology, 244(3), 203–215.
DeCasper, A. J., & Fifer, W. P. (1980). Of Human Bonding : Newborns Prefer their
Mothers ’ Voices. American Association for the Advancement of Science,
208(4448), 1174–1176.
DeCasper, A. J., & Spence, M. J. (1986). Prenatal maternal speech influences
newborns’ perception of speech sounds. Infant Behavior and Development,
9(2), 133–150.
Echteler, S. M., Fay, R. R., & Popper, A. N. (1994). Structure of the mammalian
cochlea. In R. R. Fay (Ed.), Comparative Hearing: Mammals (4th ed., pp.
134–171). Springer-Verlag New York.
Ekdale, E. G. (2015). Form and function of the mammalian inner ear. Journal of
Anatomy, 228(2), 324–337.
Ekdale, E. G. (2016). Morphological variation among the inner ears of extinct
and extant baleen whales (Cetacea: Mysticeti). Journal of Morphology,
277(12), 1599–1615.
Ekdale, E. G., & Racicot, R. A. (2015). Anatomical evidence for low frequency

References| 52
sensitivity in an archaeocete whale: comparison of the inner ear of
Zygorhiza kochii with that of crown Mysticeti. Journal of Anatomy, (226),
22–39.
Elliott, J. C., & Dover, S. D. (1982). X‐ray microtomography. Journal of
Microscopy, 126(2), 211–213.
Fahlke, J. M., Gingerich, P. D., Welsh, R. C., & Wood, A. R. (2011). Cranial
asymmetry in Eocene archaeocete whales and the evolution of directional
hearing in water. Proceedings of the National Academy of Sciences of the
United States of America, 108(35), 14545–14548.
Fleischer, G. (1976). Hearing in extinct cetaceans as determined by cochlear
structure. Journal of Paleontology, 50(1), 133–152.
Fleischer, G. (1978). Evolutionary principles of the mammalian middle ear.
Advances in Anatomy, Embryology and Cell Biology, 55(5), 1–76.
Folkens, P. A. R., & Randall, R. (2002). Guide to marine mammals of the world.
National Audubon Society.
Forbes, H. S., & Forbes, H. B. (1925). Fetal sense reaction: Hearing. Journal of
Comparative Psychology, 7(5), 353–355.
Fordyce, R. E., & Muizon, C. De. (2001). Evolutionary history of cetaceans: a
review. In J. M. Mazin & V. de Buffrenil (Eds.), Secondary Adaptation of
Tetrapods to Life in Water (pp. 169–233). Munich: Verlag Dr. Friedrich
Pfeil.
Fraser, F. C., & Purves, P. E. E. (1960). Anatomy and function of the cetacean ear.
Proceedings of the Royal Society of London B: Biological Sciences, 152(946),
62–77.
Fripp, D., & Tyack, P. L. (2008). Postpartum whistle production in bottlenose
dolphins. Marine Mammal Science, 24(3), 479–502.
Geisler, J. H., & Luo, Z. (1996). The petrosal and inner ear of Herpetocetus sp.

References| 53
(Mammalia: Cetacea) and their implications for the phylogeny and hearing
of archaic mysticetes. Journal of Paleontology, 70(6), 1045–1066.
Gower, J. C. (1975). Generalized procrustes analysis. Psychometrika, 40(1), 33–
51.
Gray, A. A. (1908). An investigation on the anatomical structure and
relationships of the labyrinth in the reptile, the bird, and the mammal.
Proceedings of the Royal Society of London. Series B, 80(543), 507–528.
Greenhow, D. R. (2013). Hearing and Echolocation in Stranded and Captive
Odontocete Cetaceans. University of South Florida.
Greenwood, D. D. (1990). A cochlear frequency-position function for several
species- 29 years later. The Journal of the Acoustical Society of America,
87(6), 2592–2605.
Grohé, C., Tseng, Z. J., Lebrun, R., Boistel, R., & Flynn, J. J. (2016). Bony labyrinth
shape variation in extant Carnivora: A case study of Musteloidea. Journal of
Anatomy, 228(3), 366–383.
Gutstein, C. S., Figueroa-Bravo, C. P., Pyenson, N. D., Yury-Yañez, R. E., Cozzuol,
M. A., & Canals, M. (2014). High frequency echolocation, ear morphology,
and the marine-freshwater transition: A comparative study of extant and
extinct toothed whales. Palaeogeography, Palaeoclimatology,
Palaeoecology, 400, 62–74.
Hemilä, S., Nummela, S., & Reuter, T. (1999). A model of the odontocete middle
ear. Hearing Research, 133(1–2), 82–97.
Hemilä, S., Nummela, S., & Reuter, T. (2001). Modeling whale audiograms:
Effects of bone mass on high-frequency hearing. Hearing Research, 151(1),
221–226.
Hoelzel, A. R., Potter, C. W., & Best, P. B. (1998). Genetic differentiation between
parapatric “nearshore” and “offshore” populations of the bottlenose

References| 54
dolphin. Proceedings of the Royal Society B: Biological Sciences, 265(1402),
1177–1183.
Hohn, A. A., Scott, M. D., Wells, R. S., Sweeney, J. C., & Irvine, A. B. (1989). Growth
Layers in Teeth From Known-Age, Free-Ranging Bottlenose Dolphins.
Marine Mammal Science, 5(4), 315–342.
Hoyte, D. A. N. (1961). The postnatal growth of the ear capsule in the rabbit.
American Journal of Anatomy, 108(1), 1–16.
Hudspeth, A. J. (1989). How the ear’s works work. Nature, 341(6241), 397–404.
Hunter, J., & Banks, J. (1787). Observations on the Structure and Oeconomy of
Whales. By John Hunter, Esq. F. R. S.; Communicated by Sir Joseph Banks,
Bart. P. R. S. Philosophical Transactions of the Royal Society of London, 77,
371–450.
Hustad, G. O., Richardson, T., Winder, W. C., & Dean, M. P. (1971). Acoustic
Properties of Some Lipids. Chemistry and Physics of Lipids, 7, 61–74.
Hyrtl, J. (1845). Vergleichend-anatomische Untersuchungen über das innere
Gehörorgan des Menschen und der Säugethiere. F. Ehrlich.
Johnson, C. S. (1967). Sound detection thresholds in marine mammals. Marine
Bio-Acoustics, 2, 247–260.
Johnson, M., Madsen, P. T., Zimmer, W. M. X., Aguilar de Soto, N., & Tyack, P. L.
(2004). Beaked whales echolocate on prey. Proceedings of the Royal Society
London B: Biological Sciences, 271(Suppl), S383-6.
Johnson, M., & Spoor, C. F. (2004). Prenatal growth and development of the
modern human labyrinth. Journal of Anatomy, 204(2), 71–92.
Jordan, F. F. J., Murphy, S., Martinez, E., Amiot, C., van Helden, A. L., & Stockin, K.
A. (2015). Criteria for assessing maturity of skulls in the common dolphin,
Delphinus sp., from New Zealand waters. Marine Mammal Science, 31(3),
1077–1097.
References| 55
Kandel, B. M., & Hullar, T. E. (2010). The relationship of head movements to
semicircular canal size in cetaceans. The Journal of Experimental Biology,
213, 1175–1181.
Kasuya, T. (1973). Systematic consideration of recent toothed whales based on
the morphology of tympano-periotic bone. Scientific Reports of the Whales
Research Institute, Tokyo, 25(25), 1–103.
Kasuya, T., & Marsh, H. (1984). Life history and reproductive biology of the
short-finned pilot whale, Globicephala macrorhynchus, off the Pacific coast
of Japan. Report of the International Whaling Commission (Special Issue 6).
Kellogg, R. (1928). The history of whales- their adaptation to life in the water.
The Quarterly Review of Biology (Vol. 3). The University of Chicago Press.
https://doi.org/10.1086/516403
Kellogg, R. (1936). A review of the Archaeoceti, 482, 1–366.
Kent, J. T. (1994). The complex Bingham distribution and shape analysis.
Journal of the Royal Statistical Society, 56(2), 285–299.
Ketten, D. R. (1992a). The cetacean ear: Form, frequency, and evolution. In J.
Thomas, R. Kastelein, & A. Supin (Eds.), Marine Mammal Sensory Systems
(pp. 53–75). New York: Plenum Press.
Ketten, D. R. (1992b). The marine mammal ear : Specializations for aquatic
eudition and echolocation. In D. B. Webster, R. R. Fay, & A. N. Popper (Eds.),
The Evolutionary Biology of Hearing (pp. 717–750). Springer-Verlag.
Ketten, D. R. (1997). Structure and Function in Whale Ears. Bioacoustics, 8(1–2),
103–135.
Ketten, D. R. (2000). Cetacean Ears. In Hearing by Whales and Dolphins (pp. 43–
108). New York: Springer-Verlag.
Ketten, D. R., & Wartzok, D. (1990). Three-dimendional reconstruction of the
dolphin ear. In A. Thomas & R. A. Kastelein (Eds.), Sensory Abilities of

References| 56
Cetaceans: Laboratory and Field Evidence (pp. 81–105). New York, NY:
Plenum Press.
King, S. L., Guarino, E., Donegan, K., Hecksher, J., & Jaakkola, K. (2016). Further
insights into postpartum signature whistle use in bottlenose dolphins (
Tursiops truncatus ). Marine Mammal Science, 32(4), 1458–1469.
Kirk, E. C., & Gosselin-Ildari, A. D. (2009). Cochlear labyrinth volume and
hearing abilities in primates. Anatomical Record, 292(6), 765–776.
Koopman, H. N., Budge, S. M., Ketten, D. R., & Iverson, S. J. (2006). Topographical
distribution of lipids inside the mandibular fat bodies of odontocetes:
Remarkable complexity and consistency. IEEE Journal of Oceanic
Engineering, 31(1), 95–106.
Kritzler, H. (1952). Observations on the Pilot Whale in Captivity. Journal of
Mammalogy, 33(3), 321–334.
Lancaster, W. C. (1990). The middle ear of the Archaeoceti. Journal of Vertebrate
Paleontology, 10(1), 117–127.
Lancaster, W. C., Ary, W. J., Krysl, P., & Cranford, T. W. (2015). Precocial
development within the tympanoperiotic complex in cetaceans. Marine
Mammal Science, 31(1), 369–375.
Leatherwood, S. (1975). Some observations of feeding behavior of bottle-nosed
dolphins (Tursiops truncatus) in the northern Gulf of Mexico and (Tursiops
cf. T. gilli) off southern California, Baja California, and Nayarit, Mexico.
Marine Fisheries Review, 37(9), 10–16.
Litchfield, C., Karol, R., & Greenberg, A. J. (1973). Compositional topography of
melon lipids in the Atlantic bottlenosed dolphin Tursiops truncatus:
Implications for echo-location. Marine Biology, 23(3), 165–169.
MacLeod, C. D., Santos, M. B., & Pierce, G. J. (2003). Review of data on diets of
beaked whales: evidence of niche separation and geographic segregation.

References| 57
Journal of the Marine Biological Association of the UK, 83(3), 651–665.
Malinzak, M. D., Kay, R. F., & Hullar, T. E. (2012). Locomotor head movements
and semicircular canal morphology in primates. Proceedings of the National
Academy of Sciences, 109(44), 17914–17919.
Manley, G. A. (1972). A review of some current concepts of the functional
evolution of the ear in terrestrial vertebrates. Evolution, 26(4), 608–621.
Manley, G. A. (2012). Evolutionary paths to mammalian cochleae. Journal of the
Association for Research in Otolaryngology, 13(6), 733–743.
Manley, G. A. (2016). The mammalian Cretaceous cochlear revolution. Hearing
Research, 352, 1–7.
Manoussaki, D., Chadwick, R. S., Ketten, D. R., Arruda, J., Dimitriadis, E. K., &
O’Malley, J. T. (2008). The influence of cochlear shape on low-frequency
hearing. Proceedings of the National Academy of Sciences of the United
States of America, 105(16), 6162–6166.
McCormick, J. G., Wever, E. G., Palin, J., & Ridgway, S. H. (1970). Sound
conduction in the dolphin ear. The Journal of the Acoustical Society of
America, 48(6), 1418–1428.
McGowen, M. R., Spaulding, M., & Gatesy, J. (2009). Divergence date estimation
and a comprehensive molecular tree of extant cetaceans. Molecular
Phylogenetics and Evolution, 53(3), 891–906.
Mennecart, B., & Costeur, L. (2016). Shape variation and ontogeny of the
ruminant bony labyrinth, an example in Tragulidae. Journal of Anatomy,
229(3), 422–435.
Meyer, M. (1907). An introduction to the mechanics of the inner ear, Univ. The
University of Missouri Studies Science Series., 2, 123.
Miller, E., Lalas, C., Dawson, S., Ratz, H., & Slooten, E. (2013). Hector’s dolphin
diet: The species, sizes and relative importance of prey eaten by

References| 58
Cephalorhynchus hectori, investigated using stomach content analysis.
Marine Mammal Science, 29(4), 606–628.
Miller, G. S. (1923). The Telescoping of the Cetacean Skull. Smithsonian
Miscellaneous Collections, 76(5), 1–70.
Mooney, T. A., Yamato, M., & Branstetter, B. K. (2012). Hearing in cetaceans:
from natural history to experimental biology. In Advances in Marine Biology
(Vol. 63, pp. 197–246). Elsevier Ltd.
Moran, M. M., Nummela, S., & Thewissen, J. G. M. (2011). Development of the
skull of the pantropical spotted Dolphin (Stenella attenuata). Anatomical
Record, 294(10), 1743–1756.
Morell, M., Lenoir, M., Shadwick, R. E., Jauniaux, T., Dabin, W., Begeman, L., …
André, M. (2015). Ultrastructure of the Odontocete Organ of Corti:
Scanning and transmission electron microscopy. Journal of Comparative
Neurology, 523(3), 431–448.
Nachtigall, P. E., Mooney, T. A., Taylor, K. a., & Yuen, M. M. L. (2007). Hearing
and auditory evoked potential methods applied to odontocete cetaceans.
Aquatic Mammals, 33(1), 6–13.
Ness, A. R. (1967). A measure of asymmetry of the skulls of odontocete whales.
Journal of Zoology, 153(2), 209–221.
Norris, K. S. (1964). Some problems of echolocation in cetaceans. In W. N.
Tavolga (Ed.), Marine Bioacoustics (Vol. 1, pp. 317–336). Pergamon Press,
New York.
Norris, K. S. (1968). The Evolution of Acoustic Mechanisms in Odontocete
Cetaceans. In E. Drake (Ed.), Evolution and Environment (pp. 297–324).
New Haven: Yale University Press.
Nowacek, D., Thorne, L. H., Johnston, D. W., & Tyack, P. L. (2007). Reponses of
cetaceans to anthropogenic noise. Mammal Review, 37(2), 81–115.

References| 59
Nummela, S. (2009). Hearing. In W. F. Perrin, B. Würsig, & J. G. M. Thewissen
(Eds.), Encyclopedia of marine mammals (2nd ed., pp. 553–562). Elsevier
Inc.
Nummela, S., Thewissen, J. G. M., Bajpai, S., Hussain, S. T., & Kumar, K. (2007).
Sound transmission in archaic and modern whales: Anatomical adaptations
for underwater hearing. The Anatomical Record: Advances in Integrative
Anatomy and Evolutionary Biology, 290(6), 716–733.
Nummela, S., Wägar, T., Hemilä, S., & Reuter, T. (1999). Scaling of the cetacean
middle ear. Hearing Research, 133(1–2), 71–81.
O’Rahilly, R. (1973). Developmental stages in human embryos, including a survey
of the Carnegie collection (Vol. 1). Carnegie Institution of Washington.
Olson, P. A. (2009). Pilot whales Globicephala melas and G. macrorhynchus. In
W. Perrin, B. Würsig, & J. Thewissen (Eds.), Encyclopedia of Marine
Mammals (2nd ed., pp. 847–852). Academic Press.
Pacini, A. F., Nachtigall, P. E., Kloepper, L. N., Linnenschmidt, M., Sogorb, a, &
Matias, S. (2010). Audiogram of a formerly stranded long-finned pilot
whale (Globicephala melas) measured using auditory evoked potentials.
The Journal of Experimental Biology, 213(Pt 18), 3138–3143.
Park, T., Evans, A. R., Gallagher, S. J., & Fitzgerald, E. M. G. (2017). Low-
frequency hearing preceded the evolution of giant body size and filter
feeding in baleen whales. Proceedings of the Royal Society B, 284,
e20162528.
Park, T., Fitzgerald, E. M. G., & Evans, A. R. (2016). Ultrasonic hearing and
echolocation in the earliest toothed whales. Biology Letters, 12(4),
e20160060.
Parks, S. E., Ketten, D. R., O’Malley, J. T., & Arruda, J. (2007). Anatomical
predictions of hearing in the North Atlantic right whale. Anatomical Record,

References| 60
290(6), 734–744.
Perrin, W. F. (1975). Variation of spotted and spinner porpoise (genus Stenella)
in the Eastern Pacific and Hawaii. Bulletin of the Scripps Institution of
Oceanography, 21, 1–206.
Perrin, W. F., & Geraci, J. R. (2002). Stranding. In W. F. Perrin, B. Würsig, & J. G.
M. Thewissen (Eds.), Encyclopedia of Marine Mammals (2nd ed., pp. 1192–
1197). San Diego, California: Academic Press.
Pitman, R. L. (2009). Mesoplodont whales: (Mesoplodon spp.). In W. F. Perrin,
B. Würsig, & J. G. M. Thewissen (Eds.), Encyclopedia of Marine Mammals
(2nd ed., pp. 721–726).
Plassmann, W., & Brandle, K. (1992). A functional model of the auditory system
in mammals and its evolutionary implications. In D. B. Webster, A. N.
Popper, & R. R. Fay (Eds.), The Evolutionary Biology of Hearing (pp. 637–
653). Springer New York.
Pujol, R., Lavigne-Rebillard, M., & Uziel, A. (1991). Development of the human
cochlea. Acta Oto-Laryngologica. Supplementum, 482(March), 7–12.
Pyenson, N. D., & Sponberg, S. N. (2011). Reconstructing body size in extinct
crown Cetacea (Neoceti) using allometry, phylogenetic methods and tests
from the fossil record. Journal of Mammalian Evolution, 18(4), 269–288.
Raphael, Y., & Altschuler, R. A. (2003). Structure and innervation of the cochlea.
Brain Research Bulletin, 60(5–6), 397–422.
Rauschmann, M., Huggenberger, S., Kossatz, L. S., & Oelschläger, H. A. (2006).
Head morphology in perinatal dolphins: a window into phylogeny and
ontogeny. Journal of Morphology, 267(11), 1295–1315.
Reeves, R. R., Dawson, S. M., Jefferson, T. A., Karczmarski, L., Laidre, K. G.,
O’Corry-Crowe, … Zhou, K. (2013). Cephalorhynchus hectori. The IUCN Red
List of Threatened Species.

References| 61
Reidenberg, J. S., & Laitman, J. T. (2009). Cetacean Prenatal Development. In W.
F. Perrin, B. Würsig, & J. G. M. Thewissen (Eds.), Encyclopedia of marine
mammals (2nd ed., pp. 120–130).
Reynolds, J. E., Wells, R. S., & Eide, S. D. (2000). The bottlenose dolphin: biology
and conservation. In Animal Conservation forum (Vol. 289, pp. 185–186).
University Press of Florida.
Reysenbach De Haan, F. (1957). Hearing in whales. Acta Otolaryngologica,
Supplement, 1–114.
Reysenbach De Haan, F. (1960). Some aspects of mammalian hearing under
water. Proceedings of the Royal Society of London. Series B, Biological
Sciences, 152(946), 54–62.
Richardson, W. J., Greene Jr, C. R., Malme, C. I., & Thomson, D. H. (2013). Marine
mammals and noise. Academic press.
Ridgway, S. H., Bullock, T. H., Carder, D. A., Seeley, R. L., Woods, D., & Galambos,
R. (1981). Auditory brainstem response in dolphins. Proceedings of the
National Academy of Sciences of the United States of America, 78(3), 1943–
1947.
Ridgway, S. H., & Carder, D. a. (1997). Hearing deficits measured in some
Tursiops truncatus, and discovery of a deaf/mute dolphin. The Journal of
the Acoustical Society of America, 101(1), 590–594.
Ridgway, S. H., & Carder, D. A. (2001). Assessing hearing and sound production
in cetaceans not available for behavioral audiograms: Experiences with
sperm, pygmy sperm, and gray whales. Aquatic Mammals, 27(3), 267–276.
Rinkwitz, S., Bober, E., & Baker, R. (2001). Development of the vertebrate inner
ear. Annals of the New York Academy of Sciences, 942, 1–14.
Rohlf, F. J. (1999). Shape statistics: Procrustes superimpositions and tangent
spaces. Journal of Classification.
References| 62
Rohlf, F. J. (2000). Statistical power comparisions among alternative
morphometric methods. American Journal of Physical Anthropology,
111(March 1999), 463–478.
Rohlf, F. J., & Marcus, L. F. (1993). A revolution morphometrics. Trends in
Ecology and Evolution, 8(4), 129–132.
Rohlf, F. J., & Slice, D. E. (1990). Extensions of the Procrustes Method for the
Optimal Superimposition of Landmarks. Zool, 39(1), 40–59.
Rommel, S. A., Costidis, A. M., Fernández, A., Jepson, P. D., Pabst, D. A., McLellan,
W. A., … Barros, N. B. (2005). Elements of beaked whale anatomy and
diving physiology and some hypothetical causes of sonar-related stranding.
Journal of Cetacean Research and Management, 7(3), 189–209.
Rosowski, J. J. (1992). Hearing in transitional mammals : predictions from the
middle-Ear anatomy and hearing capabilities of extant mammals. In D. B.
Webster, A. N. Popper, & R. R. Fay (Eds.), The Evolutionary Biology of
Hearing (pp. 615–631). Springer New York.
Sayigh, L. S., Tyack, P. L., Wells, R. S., & Scott, M. D. (1990). Signature whistles of
free-ranging bottlenose dolphins Tursiops truncatus : stability and mother-
offspring comparisons. Behavioral Ecology and Sociobiology, 26(4), 247–
260.
Schindelin, J., Arganda-Carreras, I., Frise, E., Kaynig, V., Longair, M., Pietzsch, T.,
… Schmid, B. (2012). Fiji: an open-source platform for biological-image
analysis. Nature Methods. Nature Publishing Group.
Schmidt, R., & Singh, K. (2010). Meshmixer: an interface for rapid mesh
composition. ACM SIGGRAPH. Los Angeles.
Schnitzler, J. G., Frédérich, B., Früchtnicht, S., Schaffeld, T., Baltzer, J., Ruser, A., &
Siebert, U. (2017). Size and shape variations of the bony components of
sperm whale cochleae. Scientific Reports, 7, DOI: 10.1038/srep46734.

References| 63
Sergeant, D. (1973). Age, growth, and maturity of bottlenosed dolphin
(Tursiops truncatus) from northeast Florida. Journal of the Fisheries …,
30(7), 1009–1011.
Slepecky, N. B. (1996). Structure of the mammalian cochlea. In P. Dallos, A. N.
Popper, & R. R. Fay (Eds.), The Cochlea (pp. 44–129). Springer New York.
Slice, D. E. (2001). Landmark coordinates aligned by Procrustes analysis do not
lie in Kendall’s shape space. Systematic Biology, 50(1), 141–149.
Slooten, E., Dawson, S. M., & Rayment, W. (2004). Aerial surveys for coastal
dolphins: abundance of Hector’s dolphins off the South Island west coast,
New Zealand. Marine Mammal Science, 20(3), 477–490.
Smolker, R. A., Mann, J., & Smuts, B. B. (1993). Use of signature whistles during
separations and reunions by wild bottlenose dolphin mothers and infants.
Behavioral Ecology and Sociobiology, 33(6), 393–402.
Sontag, L. W., & Wallace, R. F. (1935). The movement response of the human
fetus to sound stimuli. Child Development, 6(4), 253–258.
Spector, J. G., & Ge, X. (1993). Ossification patterns of the tympanic facial canal
in the human fetus and neonate. The Laryngoscope, 103(9), 1052–1065.
Spoor, C. F. (1993). The comparative morphology and phylogeny of the human
bony labyrinth. Universiteit Utrecht, Faculteit Geneeskunde.
Spoor, C. F., Bajpai, S., Hussain, S. T., Kumar, K., & Thewissen, J. G. M. (2002).
Vestibular evidence for the evolution of aquatic behaviour in early
cetaceans. Nature, 417, 163–166.
Spoor, C. F., Wood, B., & Zonneveld, F. (1994). Implications of early hominid
labyrinthine morphology for evolution of human bipedal locomotion.
Nature, 369, 645–648.
Štěrba, O., Klima, M., & Schildger, B. (2000). Embryology of Dolphins: Staging
and Aging of Embryos and Fetuses of Some Cetaceans. Advances in

References| 64
Anatomy, Embryology and Cell Biology, 157, 1–133.
Tanaka, Y., & Fordyce, R. E. (2016). Papahu -like fossil dolphin from Kaikoura,
New Zealand, helps to fill the Early Miocene gap in the history of
Odontoceti. New Zealand Journal of Geology and Geophysics, 59(4), 551–
567.
Taylor, B. L., Baird, R. W., Barlow, J., Dawson, S. M., Ford, J., Mead, J. G., … Pitman,
R. L. (2008). Globicephala melas. The IUCN Red List of Threatened Species.
The IUCN Red List of Threatened Species.
Thean, T., Kardjilov, N., & Asher, R. J. (2016). Inner ear development in
cetaceans. Journal of Anatomy, 230, 249–261.
Thewissen, J. G. M., Cooper, L. N., George, J. C., & Bajpai, S. (2009). From Land to
Water: the Origin of Whales, Dolphins, and Porpoises. Evolution: Education
and Outreach, 2, 272–288.
Thewissen, J. G. M., & Williams, E. M. (2002). The Early Radiations of Cetacea
(Mammalia): Evolutionary Pattern and Developmental Correlations.
Annual Review of Ecology and Systematics, 33, 73–90.
Thompson, K. F., Millar, C. D., Scott Baker, C., Dalebout, M. L., Steel, D. J., van
Helden, A. L., & Constantine, R. (2013). A novel conservation approach
provides insights into the management of rare cetaceans. Biological
Conservation, 157, 331–340.
Tsai, C. H., & Fordyce, R. E. (2014). Disparate Heterochronic Processes in Baleen
Whale Evolution. Evolutionary Biology, 41, 299–307.
Tsai, C. H., & Fordyce, R. E. (2016). Archaic baleen whale from the Kokoamu
Greensand: earbones distinguish a new late Oligocene mysticete (Cetacea:
Mysticeti) from New Zealand. Journal of the Royal Society of New Zealand,
46(2), 117–138.
Tyack, P. L. (1997). Development and Social Functions of Signature Whistles in

References| 65
Bottlenose Dolphins Tursiops truncatus. Bioacoustics, 8, 21–46.
Tyack, P. L. (2008). Implications for marine mammals of large-scale changes in
the marine acoustic environment. Journal of Mammalogy, 89(3), 549–558.
Visser, F., Curé, C., Kvadsheim, P. H., Lam, F.-P. A., Tyack, P. L., & Miller, P. J. O.
(2016). Disturbance-specific social responses in long-finned pilot whales,
Globicephala melas. Scientific Reports, DOI: 10.1038/srep28641.
von Békésy, G. (1960). Experiments in Hearing. The Journal of the Acoustical
Society of America, 8.
Walsh, S. a, Barrett, P. M., Milner, A. C., Manley, G. A., & Witmer, L. M. (2009).
Inner ear anatomy is a proxy for deducing auditory capability and
behaviour in reptiles and birds. Proceedings of the Royal Society B,
276(January), 1355–1360.
Wartzok, D., & Ketten, D. R. (1999). Marine mammal sensory systems. In J.
Reynolds & S. A. Rommel (Eds.), Biology of Marine Mammals (pp. 117–175).
Smithsonian Institution.
Weilgart, L. S. (2007). The impacts of anthropogenic ocean noise on cetaceans
and implications for management. Canadian Journal of Zoology, 85(11),
1091–1116.
Welker, K. L., Orkin, J. D., & Ryan, T. M. (2009). Analysis of intraindividual and
intraspecific variation in semicircular canal dimensions using high-
resolution X-ray computed tomography. Journal of Anatomy, 215(4), 444–
451.
West, C. D. (1985). The relationship of the spiral turns of the cochlea and the
length of the basilar membrane to the range of audible frequencies in
ground dwelling mammals. The Journal of the Acoustical Society of America,
77(3), 1091–1101.
Wever, E. G., McCormick, J. G., Palin, J., & Ridgway, S. H. (1971). The cochlea of
References| 66
the dolphin, Tursiops truncatus: hair cells and ganglion cells. Proceedings of
the National Academy of Sciences of the United States of America, 68(12),
2908–2912.
Wilson, D. E., & Mittermeier, R. A. (2014). Handbook of the mammals of the
world (Vol. 4). Barcelona: Lynx.
Wursig, B., & Wursig, M. (1977). The photographic determination of group size,
composition, and stability of coastal porpoises (Tursiops truncatus).
Science, 198(1971), 755–756.
Wursig, B., & Wursig, M. (1979). Behavior and Ecology of the Bottlenose
Dolphin , Tursiops Truncatus , in the South Atlantic. Fishery Bulletin, 77(2),
399–412.
Yamada, M. (1953). Contribution to the anatomy of the organ of hearing of
whales. The Scientific Reports of the Whales Research Institute, 8, 3–79.
Yamada, M., & Yoshizaki, F. (1959). Osseous Labyrinth of Cetacea. Scientific
Reports of the Whales Research Institute, Tokyo, 14, 291–304.
Zelditch, M. L., Swiderski, D. L., & Sheets, H. D. (2012). Geometric Morphometrics
for Biologists: a primer. Academic Press.
Zimmer, W. M. X., Harwood, J., Tyack, P. L., Johnson, M., & Madsen, P. T. (2008).
Passive acoustic detection of deep-diving beaked whales. The Journal of the
Acoustical Society of America, 124(5), 2823–2832.
Zosuls, A., Mountain, D. C., & Ketten, D. R. (2015). How is sound conducted to
the cochlea in toothed whales? In Mechanics of Hearing: Protein to
Perception (pp. 1–6). AIP Publishing LLC.

Appendices| 67
Appendix A: Eight page Memorandum of Understanding (MOU) made with Te Upokorehe iwi regarding research on their pilot whale (Globicephala melas) material. This includes a two page Research Agreement Proposal. The Upokorehe collection is composed of 40 whales, including three neonates and a foetus, collected during the 2014 Ōhiwa Harbour stranding.
Appendices| 68

Appendices| 69

Appendices| 70

Appendices| 71

Appendices| 72

Appendices| 73

Appendices| 74

Appendices| 75
Appendix B: Foetal material X-rayed to check for ossification of the ear region. Six specimens were observed, five Globicephala melas and one Mesoplodon grayi all ranging from stages 7-11 using Štěrba et al. (2000) criteria. Note that Stage 12 comes before Stage 11 for cetaceans in this system. Also note the cochlear spiral (arrows) seen in individual GM406a. (Left) foetus photos, (Middle) lateral X-ray images, and (Right) dorsoventral X-ray images of the head.
GM254a: Globicephala melas Stage 7 (Total body length= 17cm)
GM274a: Globicephala melas Stage 12 (Total body length= 28.6cm)

Appendices| 76
GM230a: Globicephala melas Stage 11 (Total body length= 42.5cm)
GM247a- Globicephala melas Stage 11 (Total body length= 47cm)

Appendices| 77
GM406a- Globicephala melas Stage 11 (Total body length= 69cm)
MM002875- Mesoplodon grayi Stage 8 (Total body length= 18.5cm)