an investigation of peer influences on risky child and...
TRANSCRIPT
An Investigation of Peer Influences on Risky Child and Adolescent
Pedestrian Road Crossing
Jodie M. Plumert, PhD
Professor
Psychological & Brain Sciences
University of Iowa
Joseph K. Kearney, PhD
Professor
Computer Science
University of Iowa

An Investigation of Peer Influences on Risky Child and Adolescent Pedestrian Road Crossing
Jodie M. Plumert
Professor & Chair
Psychological & Brain Sciences
University of Iowa
Joseph K. Kearney
Professor
Computer Science
University of Iowa
A Report on Research Sponsored by the
SAFER-SIM University Transportation Center
U.S. Department of Transportation, Research and Innovative Technology Division
June 2017

iii
Table of Contents
Table of Contents ...................................................................................................................................... iii
List of Figures ............................................................................................................................................. v
Abstract ..................................................................................................................................................... vi
1 Experiment 1: Perceiving and Acting on Joint Affordances: How Children Cross Roads Together .... 1
1.1 Introduction ............................................................................................................................... 1
1.2 Background Literature ............................................................................................................... 1
1.3 The Current Investigation .......................................................................................................... 2
1.4 Methods ..................................................................................................................................... 3
1.4.1 Apparatus ..................................................................................................................... 3
1.4.2 Data Recording and Performance Variables................................................................. 4
1.4.3 Participants ................................................................................................................... 4
1.4.4 Procedure ..................................................................................................................... 5
1.5 Results........................................................................................................................................ 5
1.5.1 Data Analysis Strategy .................................................................................................. 5
1.5.2 Crossing through the Same Gap ................................................................................... 6
1.5.3 Crossing Through the Different Gaps ......................................................................... 10
1.6 Discussion ................................................................................................................................ 12
2 Experiment 2: Action Coordination with Agents: Crossing Roads with a Computer-Generated Agent
in a Virtual Environment.................................................................................................................... 15
2.1 Introduction ............................................................................................................................. 15
2.1 Background Literature ............................................................................................................. 16
2.1.1 Joint Action and Road Crossing .................................................................................. 16
2.1.2 Interactions with Agents in Virtual Reality ................................................................. 17
2.2 Methods ................................................................................................................................... 18
2.2.1 Task ............................................................................................................................. 18
2.2.2 Virtual Environment ................................................................................................... 18
2.2.3 Experiment Design ...................................................................................................... 19

iv
2.2.4 Character Design ........................................................................................................ 19
2.2.5 Procedure ................................................................................................................... 20
2.2.6 Data Recording and Performance Variables............................................................... 20
2.2.7 Partner interaction ..................................................................................................... 21
2.2.8 Participants ................................................................................................................. 21
2.3 Results...................................................................................................................................... 21
2.3.1 How did the risky and safe agents influence participants? ........................................ 22
2.3.2 How did participants interact with agents vs. real partners? .................................... 24
2.4 Discussion ................................................................................................................................ 25
References ............................................................................................................................................... 28

v
List of Figures
Figure 1.1.- The Hank Large Screen Pedestrian Simulator. ........................................................................ 3
Figure 1.2 - Solo and joint road crossing in the pedestrian simulator. Images are shown
from the camera viewpoint for clarity. In the real experiment, each participant saw a separate image
stream rendering in non-stereo for their eyepoint. ............................................................................ 4
Figure 1.3 - Logistic regression curves representing the likelihood of taking a gap in the
solo condition and pair condition........................................................................................................ 7
Figure 1.4 - Logistic regression curves representing the likelihood of taking a gap when
pairs crossed the same gap by age. ..................................................................................................... 8
Figure 1.5 - Logistic regression curves depicting the likelihood of taking a gap for first
crossers, second crossers, and solo crossers. ................................................................................... 11
Figure 2.1 - Photograph of street crossing with another person or a computer-generated
agent in the pedestrian simulator (the visual angles are correct from the viewpoint of
the pedestrian). ................................................................................................................................. 16
Figure 2.2 - A child rider with the virtual peer. ........................................................................................ 17
Figure 2.3 - Partner average walking trajectory in 3 conditions. The safe and risky agent partner’s walking
path were the same........................................................................................................................... 20
Figure 2.4 - Logistic regression curves depicting the likelihood of participants taking gaps
of each size with a Real Partner, Safe Agent, or Risky Agent. ........................................................... 23
Figure 2.5 - Average walking trajectory in 3 conditions showing that participants
synchronized their movement with their partners. .......................................................................... 25

vi
Abstract
Pedestrian injuries and fatalities involving children and adolescents are a significant public
health concern in the U.S. In 2013 alone, 236 child pedestrians died and 10,000 were injured in
traffic collisions [1]. One factor that may increase the risk of such collisions is peer influence.
Although it is well known that having multiple peers in the car dramatically increases risky
behavior among teen drivers, little is known about how child, adolescent, and adult pedestrians
cross roads with peers, and whether joint road crossing with peers puts pedestrians at
heightened risk for collisions with motor vehicles. This project conducted two experiments
investigating social influence on road-crossing behavior. The first experiment examined how
adults and children jointly cross traffic-filled roadways with a real partner in a pedestrian
simulator. The second experiment investigated how people jointly coordinate their decisions
and actions with a computer-generated agent that was programmed to be either safe (taking
only large gaps) or risky (also taking relatively small gaps).
The results of the two experiments consistently showed that participants were inclined to cross
the same gap as their partner, even when not explicitly instructed to do so, and in doing so, they
tightly synchronized their movements with their partner. This was true for children and adults,
for friendly and unacquainted partners, and for partners that were real or computer-generated
agents. The experiments also showed that adult participants often adjusted their gap choices
and the timing of their crossing to accommodate their partner – picking bigger gaps that allowed
more time for crossing. Children were less likely adjust their choices, leading to riskier road
crossing. Lastly, the experiments showed that the riskiness of the partner’s gap choices
influenced the riskiness of the gaps selected by the participant.
This report presents the design, methods, and results of the two experiments and discusses the
implications for future research investigating pedestrian safety.

1 Using Connected Vehicle Technology to Deliver Timely Warnings to Pedestrians
1 Experiment 1: Perceiving and Acting on Joint Affordances: How Children Cross Roads
Together
1.1 Introduction
Children cross streets every single day, both alone and with others. Crossing the street can be a
difficult task that requires choosing a sufficient gap size and then coordinating movement with
the traffic in order to safely make it across the street. In 2013, 10,000 child pedestrians were
injured in traffic collisions and 236 were killed [1]. The task of crossing the street can be even
more complicated when it involves a peer. The two children must pay close attention to the
traffic and time their movements together. However, nothing is known about whether crossing
the street with a peer puts children at a greater risk for injury than crossing alone. The goal of
this study was to see if there are differences between child and adult pedestrians crossing the
street alone compared to crossing the street with a friend. Additionally, we were interested in
whether there were differences in gap choices and movement timing between pairs of adult
friends and pairs of 12-year-old friends.
Our main goal was to examine how pairs of friends cross streets compared to how solo crossers
cross streets. We also wanted to see if there were differences in gap selection and movement
timing between adults and 12-year-olds. In order to test this, we used a large-screen, immersive
pedestrian simulator that included a single lane of traffic. Pedestrians had to cross the street by
looking at the cars coming from the left and judging when it was safe to cross. When they felt it
was safe, they physically crossed the street. We predicted that those in the pair condition would
choose larger gaps than those in the solo condition. Specifically, in order for pairs to fit through
the gap, bigger gaps must be chosen than when crossing alone. We also expected that pairs
would coordinate their movement by entering the roadway at the same time, resulting in less
time between the pair member on the right and the lead car in the gap than between the pair
member on the left and the lead car in the gap. We also predicted that solo 12-year-old crossers
would be more conservative in their gap selection than solo adult crossers. In research by
O’Neal et al. [2], 12-year-olds were more conservative in their choices, so we expected that the
same pattern would emerge. We wanted to test how the additional task of coordinating
movement with a partner would affect their gap choices and movement timing.
1.2 Background Literature
Crossing the street first requires pedestrians to choose a safe gap to cross. Once the gap is
chosen, they must coordinate their movement with that of the traffic to cross safely. This
requires that children cut in closely behind the lead car and walk at a speed that allows them to
reach the other side before the tail car reaches them. O’Neal et al. [2] looked at gap choices and
movement timing in 6-, 8-, 10-, 12-, and 14-year-olds, as well as adults. Gap size choices were
very similar across all age groups except for 12-year-olds. Twelve-year-olds were more
conservative in their choices, choosing bigger gaps than all the rest of the age groups. In
addition, 6-, 8-, and 10-year-olds timed their entry into the road less tightly than adults, which
led to less time to spare and more collisions than older age groups. Importantly, even though
12-year-olds had poorer timing of entry, their choice of bigger gap sizes led to similar time to
spare as the 14-year-olds and adults. By age 14, the children’s road crossing looked like that of

2 Using Connected Vehicle Technology to Deliver Timely Warnings to Pedestrians
adults. Over development, children learn to coordinate their movements correctly in order to
cross the street safely. An interesting finding was that the 12-year-old group was more
conservative in their gap choices than adults. For the present study, we chose to compare 12-
year-olds and adults because we predicted that we would again see differences in solo crossers
for both age groups that may also be seen in children and adults crossing with a friend.
Barton and Schwebel [3] also measured road-crossing ability in children ages 5 to 8 and
compared the results to those of adults. They had children and adults cross a wooden crosswalk
that was placed in the grass next to a crosswalk by a school. They found that the 5- to 6-year-
olds took more risks and had more tight fits that could have led to collisions with cars. However,
most child crossing behaviors were very similar to adult crossing behaviors. One explanation is
that adults also engage in risky behavior, but they can better coordinate their movements in
order to cross safely. This can also be seen in findings by Plumert et al. [4]. They had children
and adults bicycle across a virtual road with high-density traffic. Children and adults both took
risky gaps and timed their entry into the roadway more tightly to compensate for their risky gap
choices. However, children taking risky gaps got hit 20% of the time whereas adults never got
hit. This suggests that children have more difficulty adjusting their actions to match their risky
decisions. Geraghty, Holland, and Rochelle [5] studied road-crossing errors in older adults
crossing the street and found that as age increased, so did the number of errors that were
made. They also found that walking speed and start-up delay were predictors of unsafe crossing
in older adults. These factors could also affect how children cross the road. If children have
start-up delays due to slower cognitive processes, it could create more unsafe crossing. We
could also see decreases in motor coordination that lead to unsafe crossing as well.
Crossing with a peer requires joint action in gap choices and movement timing. Not only do pair
members have to cross the road safely, they have to understand and anticipate what their
partner is going to do. Jiang et al. [6] studied how two unfamiliar partners cross a single lane of
virtual traffic together and how they differ from solo crossers. They found that pairs were highly
likely to cross together and tightly synchronized their entry into the roadway. They chose larger
gaps than solo crossers, presumably to allow both members of the pair to cross the roadway
safely. Because they entered the roadway at the same time, pair members on the left had more
time between themselves and the lead vehicle in the gap than pair members on the right. This
synchronous timing occurred between pedestrians who did not know each other and who
provided few verbal and gestural cues to their partner. At present, it is unknown whether gap
decisions and movement timing differs when pairs of friends cross roads together.
1.3 The Current Investigation
The main goal of this study was to examine how pairs of friends cross streets compared to how
solo crossers cross streets. We also wanted to see if there were differences in gap selection and
movement timing between adults and 12-year-olds. In order to test this, we used a large-screen,
immersive pedestrian simulator that included a single lane of traffic. Pedestrians had to cross
the street by looking at the cars coming from the left and judging when it was safe to cross.
When they felt it was safe, they physically crossed the street. We predicted that those in the
pair condition would choose larger gaps than those in the solo condition. Specifically, in order
for pairs to fit through the gap, bigger gaps must be chosen than when crossing alone. We also
expected that pairs would coordinate their movement by entering the roadway at the same

3 Using Connected Vehicle Technology to Deliver Timely Warnings to Pedestrians
time, resulting in less time between the pair member on the right and the lead car in the gap
than between the pair member on the left and the lead car in the gap. We also predicted that
solo 12-year-old crossers would be more conservative in their gap selection than solo adult
crossers. In research by O’Neal et al. [2], 12-year-olds were more conservative in their choices,
so we expected that the same pattern would emerge. We wanted to test how the additional
task of coordinating movement with a partner would affect their gap choices and movement
timing.
1.4 Methods
1.4.1 Apparatus
The experiment was conducted in a large-screen pedestrian simulator (see Figure 1.1),
consisting of three screens that are placed at right angles to each other. This created a three-
walled room that was 10 ft. wide x 14.2 ft. long x 8 ft. tall. Stereo projectors were used to back-
project images onto the side screens. A fourth stereo projector front-projected images onto the
floor. There were 17 Flex 13 infrared motion-tracking cameras mounted to the virtual
environment (VE)1. Participants wore Volfoni ActiveEyes stereo shutter glasses that were
synchronized with the displays so that images were alternately visible in the left and right eyes.
This permitted us to show stereo images with the correct perspective for each participant (see
Figure 1.2). An OptiTrack motion capture system was used to determine the position and
orientation of the participants’ heads based on the marker locations viewed from 17 Flex 13
cameras surrounding the volume. Each participant’s eye point was estimated from the head
data and used to render the scene correctly for their viewpoint (in an image stream that only
they could see). The VE software is based on the Unity3D gaming platform. In-house code
generated traffic and recorded the positions and orientations of vehicles and the pedestrians
during the experiment for later analysis.
Figure 1.1.- The Hank Large Screen Pedestrian Simulator.
1 The terms “simulator” and “virtual environment” both refer the graphically simulated world
used in our experiments. We use the two terms interchangeably through the report.

4 Using Connected Vehicle Technology to Deliver Timely Warnings to Pedestrians
Figure 1.2 - Solo and joint road crossing in the pedestrian simulator. Images are shown from
the camera viewpoint for clarity. In the real experiment, each participant saw a separate
image stream rendering in non-stereo for their eyepoint.
1.4.2 Data Recording and Performance Variables
The master computer recorded the position and orientation of all movable entities in the VE,
including the locations of the pedestrians’ heads and all vehicles on every time step. This
method of data recording allowed us to reconstruct key aspects of the experiment off-line. A 3D
visualizer was developed in-house in Unity 3D to graphically replay trials. This application
enabled researchers to visualize the pedestrian motion and traffic from different viewpoints
(e.g., top-down, first-person, or third-person views) and navigate through the entire recorded
experiment using the play, pause, stop, fast-forward, and rewind buttons. In addition, the
visualizer automatically produced a record of the following performance variables:
Number of gaps seen: the number of gaps seen before crossing the roadway, including
the gap crossed (a measure of waiting).
Gap size: the temporal size of the gap selected for crossing.
Timing of entry: the time between the moment the rear of the lead vehicle in the gap
passed the participant and the moment the participant entered the path of the vehicles.
Road-crossing time: the time it took the participant to cross the road (from the moment
they entered the road to the moment they exited the road).
Time to spare: the time between the moment the participant cleared the path of the
vehicles and the moment the front of the tail vehicle in the gap passed the participant.
Close call: a road crossing was classified as a close call if the time to spare was less than
or equal to 0.5 s.
1.4.3 Participants
There was a total of 96 participants in four groups: 12-year-old pairs of friends (mean age: 12
years, 9 months; 16 females), 12-year-old solo crossers (mean age: 12 years, 2 months; 8
females), adult pairs of friends (mean age: 20 years, 5 months; 18 females), and adult solo
crossers (mean age: 19 years, 7 months; 8 females). Fifteen additional participants were
excluded from the analyses for the following reasons: 10 participants had videos that did not

5 Using Connected Vehicle Technology to Deliver Timely Warnings to Pedestrians
record or contained no sound, two participants had the data overridden, two participants had
simulators that froze and would not restart, and the members of one pair were different
genders. The sample was 91.70% Caucasian, 4.2% Asian, 2.1% African American, and 2.1%
biracial. Participants were recruited through the Psychological and Brain Sciences Child Research
Participant registry or from mass-emails sent to the University of Iowa community. Participants
were each paid $15 for participating in the study.
1.4.4 Procedure
The session began with familiarization with the VE and task. The experimenter explained that
there would be a stream of traffic coming from the left-hand side. The participant would stand
on the sidewalk in the back of the simulator and would have to wait to cross the street until the
first car, always colored purple, had passed. Once the purple car passed, participants could wait
as long as they needed before crossing the street. Once they reached the other side, the traffic
ceased being generated and the participant could walk back to the other side. The goal of the
task was to cross the street without getting hit by the car.
Participants had two practice trials where the experimenter would follow the participant’s lead
and walk across the street with them. In the pair condition, after the first practice, participants
swapped sides. After the practice trials, participants crossed the road 30 times. In the pair
condition, participants switched sides after 15 trials so that each member of the pair crossed on
both the right and the left.
1.5 Results
1.5.1 Data Analysis Strategy
We analyzed trials separately when the pair crossed the gap together and when the pair chose
different gaps. A majority of the gaps were taken together in the pair (M=82%, SD=3). It was
slightly higher for adults (M=89%, SD= 31%) compared to 12-year-olds (M=73%, SD=44%). When
they crossed the same gap, we were interested in how gap selection in the pair compared to
that of solo crossers, and how the left and right crossers in the pair timed their movements
relative to each other and to solo crossers. When pairs crossed separate gaps, we were
interested to see how gap selection and movement timing differed between the first and second
crosser. Trials crossed together comparing left and right crossers were analyzed in repeated
measures analyses of variance (ANOVAs) with standing position (left, right) and order (first,
second) as within-subjects factors and age (12, adult) as a between-subjects factor. Separate
ANOVAs were conducted comparing left pair members to solo crossers, right pair members to
solo crossers, and left pair members to right pair members. When pairs crossed different gaps,
repeated measures ANOVAs were used with role (1st crosser, 2nd crosser) as a within-subjects
factor and age (12, adult) as a between-subjects factor. Separate ANOVAs were conducted for
1st crossers compared to solo crossers, 2nd crossers compared to solo crossers, and 1st crossers
compared to 2nd crossers. For both types of trials, an ANOVA was used to compare the pair
condition to solo crossers. We also used a mixed effects logistic regression to determine
whether the likelihood of choosing a certain size gap was different for solo crossers compared to
left pair members and right pair members. We also wanted to test the likelihood of choosing a
gap depending on the age group.

6 Using Connected Vehicle Technology to Deliver Timely Warnings to Pedestrians
1.5.2 Crossing through the Same Gap
1.5.2.1 Gap Selection
Mean gap size. We expected pairs to choose bigger gaps to allow both crossers to fit through
safely. However, there was no significant difference in mean gap size between the left crossers
and the solo crossers, F(1,63)= .001, ns, or between right and solo crossers, F(1,63)= 1.12, ns.
Likewise, there was no effect of age for left compared to solo crossers, F(1,63)=1.12, ns, or right
crossers compared to solo crossers, F(1,63)=1.04, ns.
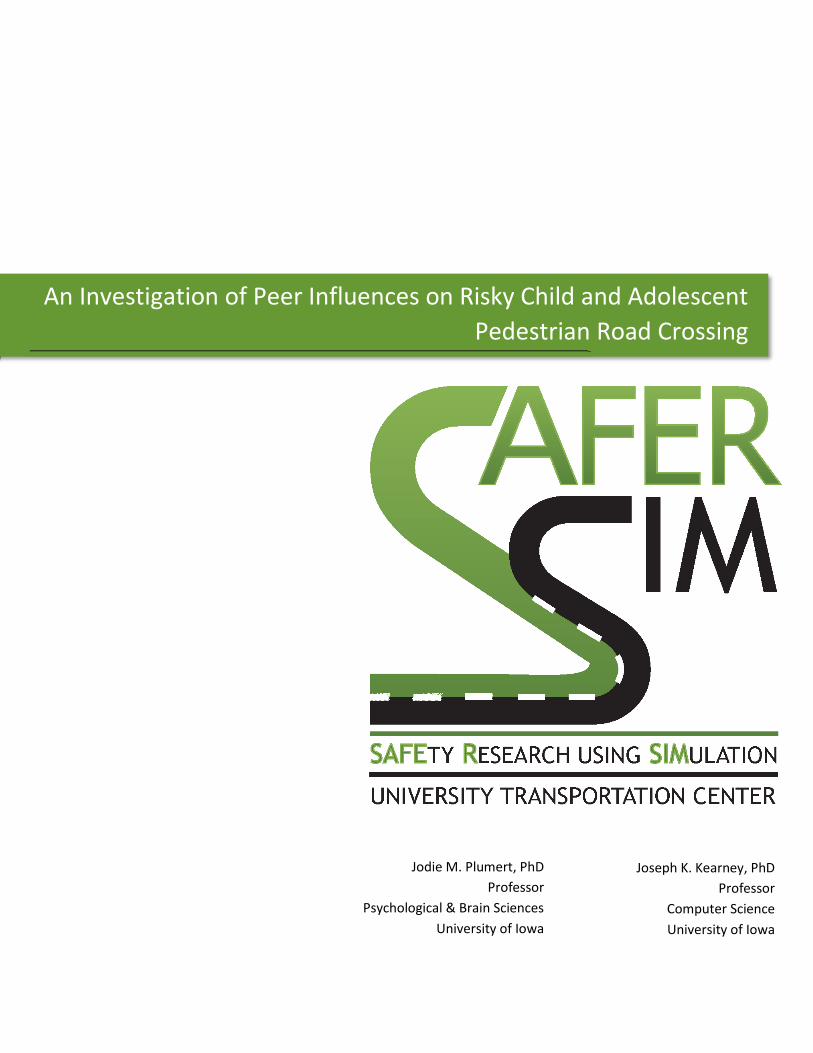
Likelihood of taking a gap. We analyzed the likelihood of taking a gap using gap size, condition
(solo, pair), and age (12-year-olds, adults) as predictors. As expected, participants in both
conditions were more likely to take larger than smaller gaps, z = 15.56, p < .001, with the
average odds of choosing a gap increasing by 19.98 with each .5 s increase in gap size. The gap
acceptance thresholds of those in the pair and solo conditions were not significantly different
from one another, z = 1.51, ns. Similarly, there were no significant differences in gap acceptance
thresholds between the age groups.
However, condition moderated gap size acceptance, z = 2.39, p = .02, indicating that pairs were
more discriminating in their gap selection than solo crossers (Figure 1.3). Those in the solo
condition, z = 15.19, p < .001, had 18.93 increased odds of accepting a given gap with each .5 s
increase in gap size. Those who crossed in pairs, z = 13.01, p < .001, had 51.94 increased odds of
accepting a given gap with each .5 s increase in gap size. Additionally, age group moderated gap
size slope differences, z = -2.30, p = .02 (Figure 1.4). Children, z = 21.97, p = .02, were less
sensitive in their gap selection; they took a higher proportion of small gaps and a larger
proportion of larger gaps compared to adults, z = 21.42, p = .02. Further, adults had 25.37
increased odds of gap acceptance with each .5 s increase in gap size, while 12-year-olds only had
12.01 increased odds of accepting a gap with each .5 s increase in gap size.
7 Using Connected Vehicle Technology to Deliver Timely Warnings to Pedestrians
Figure 1.3 - Logistic regression curves representing the likelihood of taking a gap in the solo
condition and pair condition.
8 Using Connected Vehicle Technology to Deliver Timely Warnings to Pedestrians
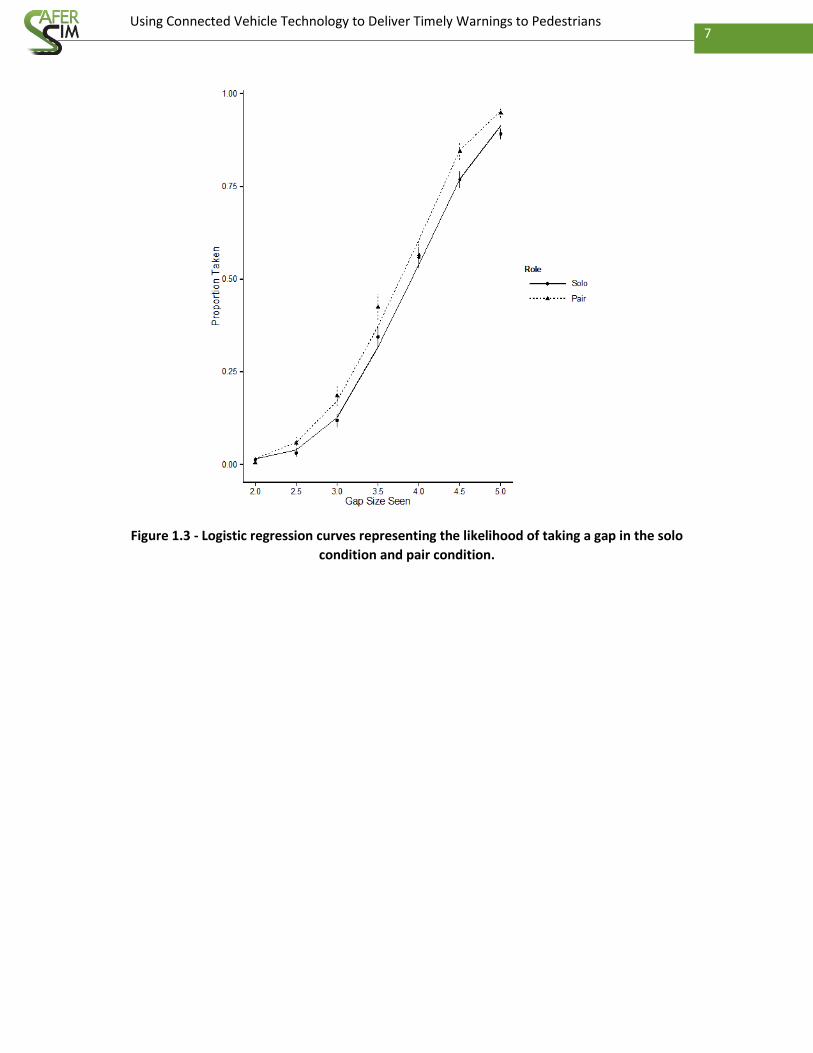
Figure 1.4 - Logistic regression curves representing the likelihood of taking a gap when pairs
crossed the same gap by age.
To test our hypothesis that adults and 12-year-olds would choose different gap sizes, we
conducted separate logistic regression analyses for each age group. Adults showed a preference
for larger rather than smaller gaps, z = 15.77, p < .001, with the odds of taking a gap increasing
by 19.52 with each .5 s gap increase. Additionally, condition moderated gap size slope
differences, z = 2.50, p = .01. Adults in the solo condition, z = 14.59, p < .001, were more
discriminating in their gap choices than those in the pair condition, z = 12.10, p < .001, taking
more of the small gaps and fewer of the large gaps. Twelve-year-olds also showed a preference
for larger rather than smaller gaps, z = 13.74, p < .001, with the odds of taking a gap increasing
by 11.46 with each .5 s gap increase. However, condition did not moderate gap size slope
differences.
1.5.2.2 Movement Timing
Timing of entry. There was no significant difference in timing of entry for the pair member on
the left and solo crossers, F(1,63)=.37, ns. However, those on the right (M= .63 s, SD=.15) cut in
more tightly behind the lead car than solo crossers (M= .75 s, SD=.17), F(1,63)= 10.894, p=.029,
and than pair members on the left (M= .78 s, SD=.15), F(1,30)= 101.331, p<.001. There was no
effect of age for left pair members compared to solo crossers, F(1,63)=.32, ns, right pair

9 Using Connected Vehicle Technology to Deliver Timely Warnings to Pedestrians
members compared to solo crossers, F(1,63)=.12, ns, or left pair members compared to right
pair members, F(1,30)=1.76, ns.
Variability in timing of entry. There was a significant effect of standing position on variability of
timing of entry for left pair members, (M= .23, SD=.09), F(1,63)= 18.75, p<.001, and right pair
members, (M= .22, SD=.07), F(1,63)=17.00, p<.001, compared to solo crossers (M= .15, SD=.06).
Both left and right pair members were more variable in their timing of entry than solo crossers.
When comparing left to right pair members, there was no effect of standing position,
F(1,30)=2.13, ns. There was no effect of age for left pair members compared to solo crossers,
F(1,63)=2.09, ns, right pair members compared to solo crossers, F(1,63)=2.34, ns, or left pair
members compared to right pair members, F(1,30)=.02, ns.
Road-crossing time. There was a significant Age x Standing Position interaction for both left (M=
2.13, SD=.20), F(1,63) = 5.00, p=.03, and right crossers (M= 2.13, SD=.22), F(1,63)= 6.08, p=.02,
compared to solo crossers (M= 2.16, SD=.18). Simple effects tests revealed no effect of standing
position for adults who crossed on the left (M= 2.19, SD=.18), F(1,31)=1.03,ns, and for those
who crossed on the right (M= 2.21, SD=.18), F(1,31)= 1.76, ns, compared to solo crossers (M=
2.11, SD=.21). However, there was a significant effect of standing position for 12-year-olds
crossing on the left (M= 2.07, SD=.22), F(1,31)=5.28, p=.029, and for those crossing on the right
(M= 2.06, SD=.24), F(1,31)= 4.82, p=.04, compared to solo crossers (M= 2.20, SD=.11). Twelve-
year-olds in the pair condition crossed the road more quickly than 12-year-olds in the solo
condition.
Time to spare. There was no effect of standing position on time to spare for left pair members
compared to solo crossers, F(1,63)= .000, ns. However, there was a marginally significant effect
of standing position for right pair members compared to solo crossers, F(1,63)=3.67, p=.06, with
right pair members (M= 1.63 s, SD=.30) having more time to spare than solo crossers (M= 1.48 s,
SD=.33). We also found a significant effect of standing position between left and right pair
members, F(1,30)= 68.45, p<.001, with right pair members (M= 1.63, SD=.30) having more time
to spare than left pair members (M= 1.48, SD=.29). Order also had a significant effect on time to
spare, F(1,30)= 18.94, p=.01. Participants in the pair condition had more time to spare during
the second 15 trials than the first 15 trials. There was no effect of age for left pair members
compared to solo crossers, F(1,63)=.79, ns, right pair members compared to solo crossers,
F(1,63)=.35, ns, or left pair members compared to right pair members, F(1,30)=.01, ns.
Collisions. There was a significant effect of standing position on collisions for solo crossers (M=
.20, SD=.14) compared to left pair members (M= .021, SD=.03), F(1,63)=49.09, p=.000, and right
pair members (M= .004, SD=.01), F(1,1)=63.99, p<.001. Solo crossers were hit more often than
those crossing in the pair condition. There was no effect of age for left pair members compared
to solo crossers, F(1,63)=.72, ns, or for right pair members compared to solo crossers,
F(1,63)=.09, ns. For left pair members compared to right pair members, there was a significant
Standing Position x Age interaction for collisions, F(1,30)=5.42, p=.03. Simple effects tests
revealed no effect of standing position for adults, F(1,30)=1.0, ns. However, there was a
significant effect of standing position for 12-year-olds, F(1,30)= 9.19, p=.008, with left pair
members (M= .034, SD=.04) having more collisions than right pair members (M= .004, SD=.02).
There was also a significant effect of order on collisions, F(1,30)=4.49, p=.04, with those crossing
10 Using Connected Vehicle Technology to Deliver Timely Warnings to Pedestrians
in the first half of the trials having fewer collisions than those crossing in the second half of
trials.
1.5.3 Crossing Through the Different Gaps
The pairs only crossed through different gaps 18% of the time. However, when analyzing these
gaps, we were interested to see how 1st and 2nd crossers differed in their gap size selection.
We hypothesized that when the pair did not cross the same gap, first crossers would likely be
crossing a riskier gap than the second crosser was willing to take.
1.5.3.1 Gap Selection
Mean gap size. As predicted, those crossing first (M= 3.55 s, SD=.59) chose smaller gaps than
solo crossers (M= 4.38 s, SD=.23), F(1,54)= 49.41, p<.001. They also chose significantly smaller
gaps than second crossers (M= 4.20 s, SD=.54), F(1,20)=35.98, p<.001. However, there was no
effect of standing position for first or second crossers, F(1,20)= 2.47, ns. There was no effect of
age for first crossers compared to solo crossers, F(1,54)=.20, ns, second crossers compared to
solo crossers F(1,54)=1.67, ns, or first crossers compared to second crossers, F(1,20)=.49, ns.
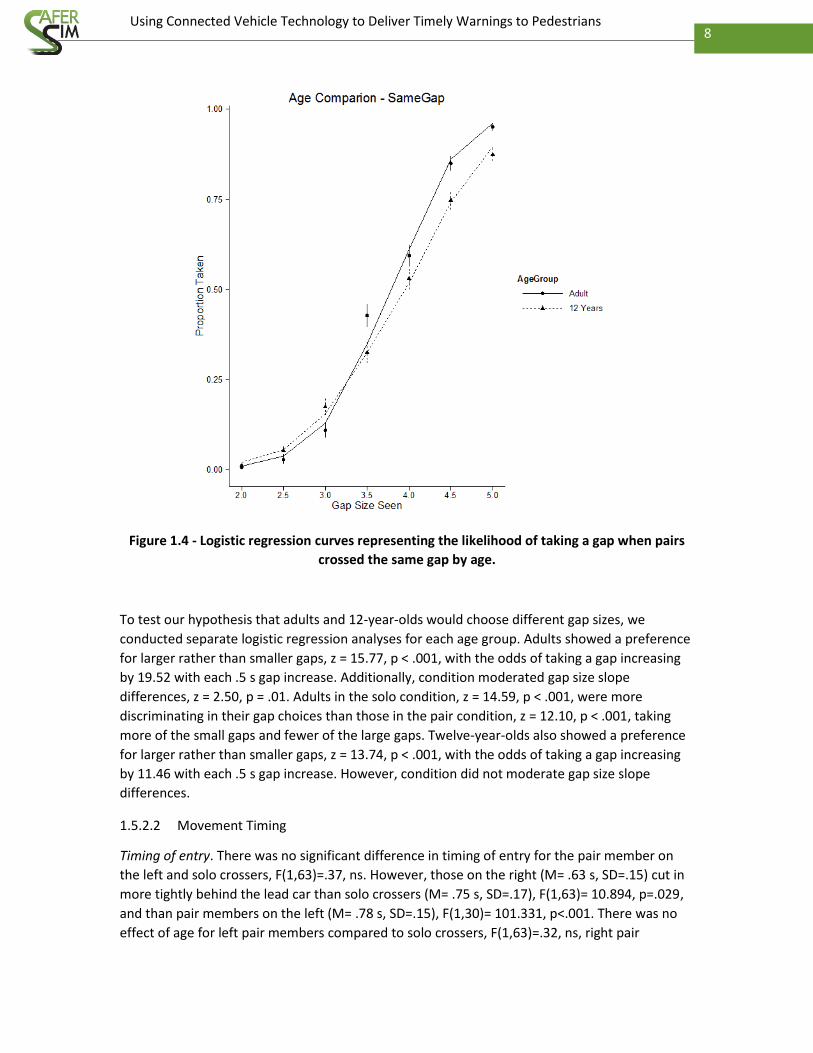
Likelihood of taking a gap. As would be expected, mixed effects logistic regression analyses
showed that first, second, and solo crossers preferred larger over smaller gaps, z = 15.11, p <
.001, with the average odds of taking a given gap increasing by 19.12 per .5 s increase in gap size
(Figure 1.5). Additionally, compared to solo crossers, first crossers had lower gap acceptance
thresholds, z = 3.52, p < .001, with the first crossers having 8.88 increased odds of taking a gap.
Conversely, second crossers, z = -1.88, p = .06, had .77 decreased odds of accepting a gap
compared to solo crossers, albeit this finding was marginal. The model also revealed a three-way
interaction between age, role, and gap size, z = -2.40, p = .02, when comparing first vs. solo
crossers. When broken down by age, adults showed no interaction of role and gap acceptance.
First crossers had 8.52 increased odds of accepting a gap of a given size. For 12-year-olds, role
moderated gap size slope differences for 1st crossers, z = -4.89, p < .001, compared to solo
crossers. First crossers, z = 2.44, p = .01, were less discriminating in their gap choices than solo
crossers, z = 13.42, p < .001.

11 Using Connected Vehicle Technology to Deliver Timely Warnings to Pedestrians
Figure 1.5 - Logistic regression curves depicting the likelihood of taking a gap for first crossers,
second crossers, and solo crossers.
1.5.3.2 Movement Timing
Timing of entry. There was no effect of role for solo crossers compared to first crossers,
F(1,54)=1.80, ns, or first crossers compared to second crossers, F(1,20)= .34, ns. There was a
significant effect of role on timing of entry for second crossers compared to solo crossers,
F(1,54)= 4.50, p=.04. Those crossing second (M= .662, SD=.13) cut in more closely behind the
lead car than those crossing solo (M= .75, SD=.17). There was no effect of age for first crossers
compared to solo crossers, F(1,54)=1.12, ns, second crossers compared to solo crossers,
F(1,54)=1.67, ns, or first crossers compared to second crossers, F(1,20)=.02, ns.
Variability in timing of entry. Those crossing first (M= .28, SD=.12) had more variability in their
timing of entry than solo crossers (M= .15, SD=.06), F(1,54)= 23.681, p<.001, but 12-year-olds
and adults did not differ in variability of timing of entry, F(1,54)=1.34, ns. There was a main
effect of age, with 12-year-olds being more variable than adults, F(1,54)=6.53, p=.014. There
was also a significant Standing Position x Age interaction when comparing solo (M= .152,

12 Using Connected Vehicle Technology to Deliver Timely Warnings to Pedestrians
SD=.06) to second crossers (M= .20, SD=.15), F(1,54)=5.93, p=.019. Simple effects tests showed
that adults did not differ in their variability due to standing position, F(1,1)= .80, ns. However,
12-year-old second crossers exhibited more variability in timing of entry (M= .26, SD=.18) than
solo crossers (M= .15, SD=.04), F(1,27)=5.62, p=.025. When comparing first to second crossers,
those crossing first (M= .28, SD=.12) were more variable in their timing of entry than those
crossing second (M= .20, SD=.15), F(1,20)=20.00, p=.008; further, there was a marginal effect of
age, F(1,20)=3.96, p=.061, with adults exhibiting less variability than 12-year-olds.
Crossing time. There was a significant effect of role on crossing time. Pair members crossing first
(M= 1.95, SD=.26) crossed significantly more quickly than solo crossers, (M= 2.16, SD=.18),
F(1,54)=12.11, p=.001. Pair members crossing second (M= 2.04, SD=.21) also crossed more
quickly than solo crossers F(1,54)=5.142, p=.028. Those crossing first also crossed significantly
more quickly than those crossing second, F(1,20)=5.48, p=.03. There was no effect of age for
first crossers compared to solo crossers, F(1,54)=.13, ns, or second crossers compared to solo
crossers, F(1,54)=2.74, ns.
Time to spare. There was a significant effect of role between solo crossers and first crossers,
F(1,54)=28.44, p<.001. This is expected because 1st crossers choose smaller gaps than both 2nd
and solo crossers. Those crossing first (M= .93, SD=.43) had significantly less time to spare than
solo crossers (M= 1.48, SD=.33) and second crossers (M= 1.50, SD=.51). There was no effect of
role when comparing second crossers to solo crossers, F(1,54)= .07. There was a significant
effect of role when comparing first crossers to second crossers, F(1,20)= 31.91, p<.001. There
was no effect of age for first crossers compared to solo crossers, F(1,54)=.61, ns, second crossers
compared to solo crossers, F(1,54)=1.850, ns, or first crossers compared to second crossers,
F(1,20)=.41, ns.
Collisions. Analysis showed that those crossing solo (M= .20, SD=.14) were hit more often than
those crossing first (M= .08, SD=.14), F(1,54)= 9.94, p=.003, and those crossing second (M= .02,
SD=.04), F(1,54)=37.09, p<.001. We would expect pair crossers to get hit more often due to the
riskier gaps chosen; however, we see the opposite in this case. Additionally, those who crossed
first were hit more often than those who crossed second, F(1,20)= 4.48, p=.047. This is likely due
to the fact that those crossing first chose smaller gaps than those crossing second. There was no
effect of age for first crossers compared to solo crossers, F(1,54)=.14, ns, second crossers
compared to solo crossers, F(1,54)=.58, ns, or first crossers compared to second crossers,
F(1,20)=.43, ns.
1.6 Discussion
The goal of this study was to compare pedestrian road-crossing behavior in pairs of friends vs.
solo crossers of the same age. We also wanted to examine potential differences between adults
and children in road-crossing behavior. We found that pairs and solo crossers chose similar gaps
sizes to cross and that overall behavior looked very similar between the two age groups. Pairs
also synchronized their movements very closely. The timing of entry for those on the left was
similar to solo crossers, but right pair members cut in more tightly behind the lead car. In order
to cross safely, pairs crossed more quickly than solo crossers. That led to left crossers and solo
crossers with similar times to spare, and those on the right with good timing entry had more
time to spare. We also did not find many differences between 12-year-olds and adults in gap

13 Using Connected Vehicle Technology to Deliver Timely Warnings to Pedestrians
choices or movement timing. The only differences in movement timing between the two age
groups was that 12-year-olds walked more quickly than adults and were more variable in their
timing of entry.
In contrast to our expectations, there were not many differences between pairs of friends
and solo crossers. We would expect pairs of friends to choose larger gaps to allow both
pedestrians to safely cross through the gap. However, in this study they chose gaps very similar
to those of solo crossers. Jiang et al. [6] found that pairs of unfamiliar peers chose larger gaps
than solo crossers. This leads to the conclusion that, when crossing with a friend, pedestrians
take more risks. We also found that, in the pair condition, those crossing on the right cut in
more tightly behind the lead car and had more time to spare than solo and left crossers. Given
that gap choices were relatively tight and that the pair walked in synchrony, the pair member on
the right had to enter the road more tightly behind the lead car. In other words, the right pair
member had to adjust his or her crossing actions in order to match the pair’s risky gap decisions.
We also saw that 12-year-olds in the pair crossed the road more quickly than solo crossers.
Again, we see that those in the pair condition are not adjusting their decisions in order to cross
safely, but rather they are adjusting their movement to compensate for their riskier gap choices.
We also observed a greater number of risky choices when pairs chose to take different gaps.
Those who crossed the street first chose smaller gaps and had less time to spare than solo and
second crossers. In order for first crossers to make it across safely, they adjusted their
movement timing by crossing the street more quickly. Second crossers likely found the gap
crossed by the first crosser too small and therefore waited for a larger gap to cross. By choosing
a bigger gap, second crossers were able to walk more slowly and still have more time to spare
than first crossers.
One unexpected finding between pairs and solo crossers was that solo crossers were hit
significantly more often than pedestrians in the pair. We would expect that the riskier behavior
in choosing a smaller gap size would have led pedestrians in the pairs to be hit more often.
However, because of the adjustment in timing of entry and walking speed, pedestrian pairs
were hit less often than solo pedestrians.
We were also surprised to find that there were not very many differences in crossing behavior in
adults and 12-year-olds. The only differences we found were that 12-year-olds overall crossed
the road more quickly than adults. Twelve-year-olds were also more variable in their timing of
entry compared to adults, which matches results from O’Neal et al. [2]. We hypothesized that
12-year-old solo crossers would be more conservative in their gap choices than adult solo
crossers. O’Neal et al. [2] found that 12-year-olds chose bigger gaps than adults, and we
expected to see the same results. Perhaps the age of the child isn’t as important as how mature
they are. It could be that we had younger 12-year-olds and less-mature 12-year-olds that
crossed the street much more like 6- to 10-year old children instead of the 12-year-olds in the
O’Neal et al. study.
From this study we can conclude that pairs of friends who cross the road together take more
risks than solo crossers. The pairs chose gaps similar in size to those chosen by solo crossers
when they should have chosen larger gaps that allowed both pedestrians to safely cross. Their
poor gap choices led them to adapt their movement timing to allow for safe crossing. They

14 Using Connected Vehicle Technology to Deliver Timely Warnings to Pedestrians
crossed the road more quickly, and those on the right cut in more tightly behind the lead car.
Parents should be aware that their children may take more risks when with a peer and that it
may be beneficial to teach them how to make better gap choices when crossing with a friend.
More research needs to look at how different age groups cross the road with a peer and how
that compares to crossing alone. By understanding the behavior of children, we can teach them
more effectively and keep them safer.

15 Using Connected Vehicle Technology to Deliver Timely Warnings to Pedestrians
2 Experiment 2: Action Coordination with Agents: Crossing Roads with a Computer-
Generated Agent in a Virtual Environment
2.1 Introduction
We spend much of our active lives surrounded by other people: on city sidewalks, in malls, at
sporting events, and in museums. Both observational studies and laboratory experiments have
found that the actions of others around us influence our behavior, often in subtle and
inconspicuous ways. Observers anticipate the actions of others, leading to a priming of motor
activation systems in the observer [7, 8, 9]. Merely watching others perform an action increases
an observer’s tendency to perform the action even when the observer did not intend to perform
the action themselves [10]. One everyday manifestation of this effect happens at street corners.
Studies of pedestrian road crossing show that the likelihood of a person crossing against a red
light is increased when someone nearby starts to cross against the red light [11, 12, 13, 14]. This
tendency to follow the leader can lead to an increased risk of injury from a collision.
Virtual environments provide a powerful medium in which to conduct controlled experiments
on how people are influenced by the behaviors of others [15]. We can populate VEs with
computer-generated (CG) characters (also called agents) and study how the agent behavior
influences human participants. Moreover, we can conduct these studies in a safe environment
where the risk of injury to participants is minimal. A key question is whether people respond to
CG characters in the same way they respond to a real person.
Our earlier work examined how two
real people cross through traffic in a
co-occupied, large-screen VE [6].
Each participant was presented with
independent, viewpoint-correct
non-stereo images of the VE. We
found that pairs often crossed
together, even with no instructions
to do so, and closely synchronized
their movements when crossing.
Pairs also chose larger gaps than
solo crossers, presumably to
accommodate the joint action of crossing the road together.
In this project we conducted an experiment comparing road crossing with a real person to road
crossing with a CG character programmed to be risky or safe (see Error! Reference source not
found.). The experiment had two purposes. One was to examine how the risky or safe road-
crossing behavior of a CG character influences the behavior of a participant. The second was to
assess the degree to which people interact similarly with a real person vs. a CG character.
Three terms are frequently used to describe
computer-generated graphic characters in VR and
AR: Characters, agents, and avatars. We use the
terms CG character and agent interchangeably to
mean animated characters that are computer
controlled. We reserve the term avatar to refer to
animated characters that mimic the real-time
motions of a real person in a shared virtual
environment.

16 Using Connected Vehicle Technology to Deliver Timely Warnings to Pedestrians
Figure 2.1 - Photograph of street crossing with another person or a computer-generated agent
in the pedestrian simulator (the visual angles are correct from the viewpoint of the
pedestrian).
2.1 Background Literature
2.1.1 Joint Action and Road Crossing
Joint action has been intensely studied by psychologists using both behavioral and neuro-
physiological methods. What this work reveals is that we are wired to coordinate our actions
with others [16]. Watching others perform an action increases the tendency to perform the
action even when the observers did not intend to perform the action themselves [10]. Observers
also anticipate the actions of others, leading to a priming of motor activation systems in the
observer [7, 8, 9].
The impulse to “do as your companion does” has important implications for tasks in which
timing is critical, such as road crossing. In particular, following the lead of another person into a
tight gap in traffic could lead to a collision. Field studies and surveys have shown that
pedestrians have an increased willingness to cross against a red light when another pedestrian
starts to cross first [11, 12, 13, 14].
Joint action frequently involves making judgments about affordances, or possibilities for action
that depend on the relationship between the characteristics of the individual and the properties
of the environment [17]. In the case of an individual making judgments about whether a gap in
traffic affords crossing, he or she must take into account the relationship between how long it
will take to cross the road and the size of the temporal gap between the vehicles [18]. Making
judgments about affordances becomes more complex when two people are crossing the road
because they must take into account the time needed for both people to cross through the
temporal gap between the cars. There is evidence that when two people perform a joint action
they act as a unit, making decisions that take into account the impact of their actions on their
partner [19]. For example, using functional magnetic resonance imaging (fMRI), Radke et al. [20]
found increased brain activation in the medial prefrontal cortex following errors that had
consequences for their co-actor in a cooperative computer-gaming task. Similarly, when two
people are asked to walk side-by-side through an aperture, they are sensitive to the fit required
for the pair to pass through the aperture [21]. Also, we found in our previous study that when

17 Using Connected Vehicle Technology to Deliver Timely Warnings to Pedestrians
pairs cross a virtual road, as compared to singletons, they tend to act together, pick larger gaps,
and synchronize their movement when crossing together [6].
2.1.2 Interactions with Agents in Virtual Reality
A growing body of research has examined social interactions mediated through conversational
interactions with CG characters in VEs, focusing on how the fidelity of agent appearance and
movement influences co-presence in conversational activities [22-27]. However, there is
relatively little research examining how people interact with CG characters while performing
full-body activities such as bicycling in large-scale environments. One study that involved full-
body motion of the participant (but not the agent) examined the influence of behavioral realism
on interpersonal distance in VEs [28]. The researchers found that people exhibit patterns of
interpersonal distance between themselves and virtual agents similar to what has been
reported in previous studies with real people.
We have examined social influences on children’s road crossing using a CG character as a virtual
peer in a bicycling simulator (see Figure 2.2) [29]. Specifically, we looked at whether 10- and 12-
year-olds chose tighter gaps after riding with a virtual peer who selected smaller versus larger
gaps. Participants were instructed to watch the virtual peer cross each intersection before
attempting to cross on their own. After crossing a gap in traffic, the virtual peer waited on the
other side of the intersection for the participant to cross. They then jointly rode to the next
intersection. After six intersections, the peer said goodbye to the rider and rode off down a side
street. Child riders then continued on their own for the next six intersections. We found that
children in the risky (small gap) peer condition were more likely to cross 3.5 and 4.5 s gaps than
were children in the safe (large gap) peer condition. These gaps are ambiguous in the sense that
they are neither too small to cross nor are they easily crossable.
Figure 2.2 - A child rider with the virtual peer.
In this report, we present the results of an experiment that examined how people cross roads as
pedestrians in a VE with a CG character who took either risky or safe gaps. We compared their
road-crossing behavior with the CG character to a control condition in which people crossed
roads with another person.

18 Using Connected Vehicle Technology to Deliver Timely Warnings to Pedestrians
2.2 Methods
2.2.1 Task
We used a pedestrian road-crossing task to examine the effects of a real vs. a CG partner on
joint decision-making and action coordination. Two previously unacquainted participants or a
single participant and a CG character stood next to each other at the edge of a one-lane road
and watched continuous traffic coming from the left. Participants were asked to cross the road
without being hit by a car. They were given no instructions about whether or not they should
cross together. Once both participants had crossed the road, the traffic ceased to be generated.
Participants then walked back across the empty road to the starting point, and a new trial
commenced.
The traffic traveled at a constant speed of 25 MPH, with randomly ordered, uniformly
distributed temporal gaps between cars that ranged in size from un-crossable to easily crossable
(2-5 s gaps, including half-second intervals). The traffic was composed of different models of
compact cars with random colors, all similar in size.
2.2.2 Virtual Environment
The experiment was conducted in a large-screen VE similar to a CAVE [30], consisting of three
screens placed at right angles relative to each other. The screens formed a three-walled room
that was 10 ft. wide x 14.2 ft. long x 8 ft. tall. Three DPI MVision 400 Cine 3D high-resolution
projectors were used to back-project images onto the side screens. A fourth projector front-
projected images onto the floor. Stereo surround sound with the Doppler Effect was used to
generate ambient traffic sounds.
We used an OptiTrack motion capture system to track the movements of the participants. The
tracking system consisted of 17 Flex 13 infrared cameras mounted on the top and the back of
the VE. Participants wore a helmet with reflective markers mounted on it to track their head
position and orientation.
A real participant (which we call the target participant) was paired with either another real
participant or a CG character (in both cases, we call the second entity the crossing partner). Our
analysis focuses on the target participant. At the start of each trial, the target participant stood
at the edge of a virtual one-lane road to the right of the crossing partner. The target participants
in all conditions viewed stereo images based on the estimated position and orientation of their
eyes. A fixed inter-pupillary distance of 6.5 cm was used to render images for the left and right
eyes. Active shutter glasses were used to split the left- and right-eye image streams to create a
stereo effect. Non-target participants, who served as crossing partners in the real condition, saw
the same stereo images that the target participants saw.
The VE software is based on the Unity3D gaming platform. A detailed description of the
hardware and software is presented by Rahimian et al. [31]. The simulation frame rate was
about 30 fps without noticeable lag or jitter. Images were displayed at a rate of 120 Hz.

19 Using Connected Vehicle Technology to Deliver Timely Warnings to Pedestrians
2.2.3 Experiment Design
The experiment used a between-subjects design with three conditions: real, safe, and risky. In
the real condition, the road-crossing partner was a real person. In the safe and risky conditions,
the road-crossing partner was a stereo CG character that mimicked the crossing motion of a real
partner.
2.2.4 Character Design
The character’s standing location and crossing motion were designed to match observations of
real partners from our previous work [6]. The character motion was created by the Mecanim
animation engine, using full-body, motion-captured walking and turning motions blended and
controlled by a state machine. The risky agent was programmed to cross any gap that was larger
than or equal to 3.5 s, while the safe agent crossed any gap that was larger than or equal to 4.5
s. We know from our previous study that gaps around the size of 3.5 s are crossable but tight for
people crossing in pairs, and that gaps of 4.5 s and above are safe and easy to cross. The agent
stood to the left of the participants. When the agent crossed the road, its time of entry relative
to the lead car in the gap was the same as the average time of entry we observed for the left
member of the pair in our previous study of two real crossers (M=0.80 s, SD=0.16). The crossing
time of the agent was approximately 2.08 s, which was also similar to the left member in a pair
observed from our previous study (M=2.09 s, SD=0.25). Thus, the agent basically replicated the
crossing motion of a real partner standing on the left. Only the gap acceptance criterion level
varied across the risky and safe CG characters.
As a check on the decision-making and movement timing of the virtual partners, we compared
the gap selection and crossing motions of the virtual partners to the gap selection and crossing
motions of the left person (the real partner) in the control condition of this experiment. The
safe agent crossed significantly larger gaps than the real partner, M=4.76 s (SD=0.05) vs. M=
4.48 s (SD=0.27), p<.001. The risky agent crossed significantly smaller gaps than the real
partner, M= 4.26 s (SD=0.09) vs. M= 4.48 s (SD=0.27), p=.025. This verified our agent design.
The safe agent (M=0.83 s, SD=0.81), p=.015, and the risky agent (M=0.81 s, SD=0.02), p=.034,
entered the road more slowly than the real partner (M=0.67 s, SD=0.20), but the road-crossing
times of the safe agent, (M=2.07 s, SD=0.04), the risky agent (M=2.08 s, SD=0.03), and the real
partner (M=2.05 s, SD=0.23) were nearly identical. As shown in Figure 2.3, the agents’ crossing
trajectory was similar to that of the real partner, but the slight delay when entering the road
caused a slight overall delay in crossing. We will return to this difference when we look at how
the targets synchronized their crossing motion with the partner.
Because of the immersive stereo display, the CG character actually appeared to be standing
inside the simulator volume, at the location where the real partner stood in our previous study.
Participants sometimes even reached out to touch the character.

20 Using Connected Vehicle Technology to Deliver Timely Warnings to Pedestrians
Figure 2.3 - Partner average walking trajectory in 3 conditions. The safe and risky agent
partner’s walking path were the same.
2.2.5 Procedure
The session began with the experimenter obtaining informed consent from participants in an
adjoining room. Participants were then taken to the simulator room and fitted with the tracking
helmet, shutter glasses, and a harness that was connected to a post at the back of the VE to
prevent them from walking into the front screen. In the real condition, one of the two
participants was randomly selected to serve as the crossing partner and the other as the target
participant. The partner always stood on the left side of the target as the pair waited to cross
through the stream of traffic.
After a brief introduction to the virtual neighborhood, target participants performed a single
practice road-crossing trial with the partner. The experimenter instructed participants to watch
the traffic and to cross without getting hit by a car. Participants then completed 20 road-
crossing test trials with their partner. After finishing the road-crossing task, participants filled
out a demographics questionnaire and were debriefed about road-crossing safety. The
experiment took approximately 30 min. to complete.
2.2.6 Data Recording and Performance Variables
With respect to the target’s road-crossing performance, we focused on two main aspects of
road crossing: gap selection and movement timing. We also examined how the target interacted
with the partner in terms of movement synchrony and standing distance. Participants in all
three conditions rarely talked or gestured to their partners. Scores for each measure
represented the average across the 20 test trials.
2.2.6.1 Gap Selection
Waiting time represented how long participants waited from the start of a trial until crossing.

21 Using Connected Vehicle Technology to Deliver Timely Warnings to Pedestrians
Gap size was the temporal size of the gap selected for crossing.
2.2.6.2 Movement Timing
Timing of entry was the time between the back of the lead vehicle and the participant at the
moment the participant entered the road. This measure describes how tightly participants timed
their movement relative to the lead vehicle in the gap.
Crossing time was the amount of time that the participant took to cross the road.
Time to spare was the time between the participant and the front of the tail vehicle at the time
the participant cleared the path of the cars. This measure describes how close the participants
were to getting hit by the tail vehicle.
Hits were extremely rare. In only 3 of nearly 900 crossings did a vehicle virtually collide with a
participant (one in the safe agent condition and 2 in the risky agent condition). While there
were no physical consequences to being hit, participants did seem to be aware of very close
calls and hits – they would sometimes do a jump at the end of a crossing to avoid being hit. The
number of hits was too small to statistically analyze.
All measures were averaged across the 20 road-crossing trials to arrive at aggregate scores. We
also computed a variability of timing of entry score by calculating the standard deviation of each
participant’s timing of entry across all 20 test trials.
2.2.7 Partner interaction
Interpersonal distance. We also measured the distance between the target and the partner
when the first car of the traffic stream crossed the middle of the simulator. At that time, both
the target and the partner were waiting for a gap. This measure reflects how much
interpersonal distance the target maintained from the partner.
Movement synchrony. We examined two aspects of movement synchrony between the target
and partner. One was how closely they started moving together, and the other was how closely
they finished the crossing together.
2.2.8 Participants
The participants were 64 undergraduate students enrolled in an elementary psychology course
at the University of Iowa. There were 16 participants (8 male, 8 female) who crossed with the
risky agent (risky condition), 16 participants (8 male, 8 female) who crossed with the safe agent
(safe condition), and 16 participants (8 male, 8 female) who crossed with a real partner (real
condition). An additional 16 participants served as the partners in the real condition. One pair in
the real condition had to be dropped due to tracking errors. Participants received course credit
for their participation.
2.3 Results
There were two primary questions of interest. First, how did the risky and safe agents influence
the participants’ gap selection and movement timing? Second, how did participants interact with
the agents as compared to a real partner?

22 Using Connected Vehicle Technology to Deliver Timely Warnings to Pedestrians
Group differences were analyzed in one-way ANOVAs with partner type (real, safe, risky) as a
between-subjects factor. As a complement to the ANOVAs, mixed-effects logistic regression
analyses were conducted to evaluate gap size and partner type as predictors of gap choices.
2.3.1 How did the risky and safe agents influence participants?
2.3.1.1 How did the safe and risky agents influence gap selection?
Participants in all three conditions preferred to cross with their partner. Participants crossed
with the safe agent on 64% of the trials, with the risky agent on 72% of the trials, and with the
real partner on 76% of the trials. The likelihoods of crossing with the partner were not
significantly different across the three conditions, and were all significantly different from
chance (50%), p=.009, p<.001, p<.001, respectively.
We first analyzed gap choices on all trials, combining trials on which the participants crossed the
same gap as their partner and trials on which they crossed a different gap than their partner. As
shown in Figure 2.4, mixed-effects logistic regression analyses showed that participants in all
conditions were more likely to take larger than smaller gaps, p < .001. Additionally, the gap
acceptance thresholds of those in the risky condition were significantly less conservative than of
those in the real partner condition, p = .01; they were 3.51 times more likely to accept a given
gap compared to those in the real partner condition. Further, the gap acceptance thresholds of
those in the risky condition were significantly less conservative than those in the safe condition,
p = .04, with those in the risky condition having 2.72 increased odds of accepting a gap
compared to those in the safe condition.

23 Using Connected Vehicle Technology to Deliver Timely Warnings to Pedestrians
Figure 2.4 - Logistic regression curves depicting the likelihood of participants taking gaps of
each size with a Real Partner, Safe Agent, or Risky Agent.
We then analyzed gap choices on the trials in which the participants crossed the same gap with
their partner. As would be expected, targets in the risky agent condition (M=4.43 s, SD=0.14)
chose significantly smaller gaps than targets in both the safe agent condition (M=4.74 s,
SD=0.07), p<.001, and the real partner condition (M=4.61 s, SD=0.20), p<.029. Those in the real
partner condition chose marginally smaller gaps than those in the safe agent condition, p=.066.
Finally, we analyzed gap choices on the trials in which the participants did not cross the same
gap with their partner. When crossing different gaps, targets in the safe agent condition were
highly likely to cross before the agent (80%), significantly different from chance (50%), p<.001,
and taking gaps that were smaller than the safe agent would take, M=4.00 s (SD=0.18) vs.
M=4.75 s (SD=0.13). In contrast, targets in the risky condition rarely crossed before the agents
(4%), significantly different from chance (50%), p<.001, preferring to wait for a larger gap than
the risky agent took, M=4.33 s (SD=0.43) vs. M=3.83 s (SD=0.18). As a consequence, when
crossing by themselves, targets in the safe agent condition (M=4.00 s, SD=0.18) picked
significantly smaller gaps than those in both the risky agent condition (M=4.33 s, SD=0.43),
p=.022, and the real partner condition (M=4.48 s, SD=0.31), p=.001.

24 Using Connected Vehicle Technology to Deliver Timely Warnings to Pedestrians
2.3.1.2 How did the safe and risky agents influence movement timing?
a. When crossing together
Timing of entry. The targets’ timing of entry when crossing with the partners did not differ
significantly between the three groups: safe agent condition M=0.69 s (SD=0.14), risky agent
condition M=0.64 s (SD=0.20), real partner condition M=0.57 s (SD=0.13).
Crossing time. When crossing the same gap, targets paired with safe agents (M=2.29 s, SD=0.15),
p<.001, and risky agents (M=2.24 s, SD=0.17), p=.015, took significantly longer to cross the road
than those who crossed with a real partner (M=2.07 s, SD=0.16).
Time to spare. Participants who crossed with a real partner (M=1.97 s, SD=0.35) had more time
to spare than those who crossed with a risky agent (M=1.55 s, SD=0.29), p=.001. The time to
spare in the safe agent condition (M=1.77 s, SD=0.20) did not differ from the risky partner
condition, nor from the real partner condition.
b. When crossing separate gaps
Timing of entry. The entry timing was not significantly different among the three groups: safe
agent condition, M=0.58 s (SD=0.10), risky agent condition, M=0.57 s (SD=0.18), real partner
condition M=0.61 s (SD=0.14).
Crossing time. As was the case when they crossed the same gap as the partner, targets in the safe
agent (M=2.27 s, SD=0.20) and risky agent (M=2.24 s, SD=0.23) conditions crossed more slowly
than did targets in the real partner condition (M=2.04 s, SD=0.18), even when they crossed
different gaps than the partner, p=.008 and p=.031, respectively.
Time to spare. Targets in the safe agent condition (M=1.14 s, SD=0.19) had less time to spare than
targets in both the risky agent (M=1.52 s, SD=0.50), p=.031, and real partner (M=1.83 s, SD=0.50),
p=.001, conditions. As noted in the gap selection section (4.1.1), when targets in the safe condition
did not cross with the agent, they tended to cross smaller gaps. Given the smaller gap size and
longer crossing time, targets in the safe agent condition naturally ended up with less time to spare
when they crossed different gaps than their partner.
2.3.2 How did participants interact with agents vs. real partners?
2.3.2.1 Interpersonal distance
To what degree did participants keep similar interpersonal distance between themselves and real
partners vs. agent partners? A comparison of interpersonal distance across the three conditions
showed that interpersonal distance did not differ significantly across the three conditions: safe
agent condition M=.13m (SD=0.08), risky agent condition M=.10m (SD=0.09), real partner
condition M=.10m (SD=0.07).
2.3.2.2 Movement Synchrony
Entering the road. Targets in all three groups entered the road in close synchrony with their
partner when crossing through the same gaps, with an average difference in entry time of M=0.24
s (SD=0.11) in the safe agent condition, M=0.24 s (SD=0.08) in the risky agent condition, and
M=0.24 (SD=0.17) in the real partner condition.

25 Using Connected Vehicle Technology to Deliver Timely Warnings to Pedestrians
Clearing the road. Likewise, targets in all three groups cleared the road together with their
partners in very tight synchrony, with an average difference in clear time of M=0.28 s (SD=0.13)
in the safe agent condition, M=0.29 s (SD=0.16) in the risky agent condition, and M=0.28 (SD=0.14)
in the real partner condition.
The small enter and clear road time difference between the two members of the pair showed that
in all three conditions participants synchronized their crossing with the partner. This finding is
further confirmed by Figure 2.5 where the average walking path of the partner and target in the
three conditions is shown.
Figure 2.5 - Average walking trajectory in 3 conditions showing that participants synchronized
their movement with their partners.
This tight synchronization between targets and partners may explain why targets who were
crossing with an agent had longer crossing times than targets who were crossing with a real
partner. It appears that targets who crossed with an agent slightly slowed their motion to
synchronize with the agent (which timed its entry slightly later relative to the lead vehicle).
2.4 Discussion
This report presents the results of an experiment investigating how people jointly coordinate their
decisions and actions with a CG character in a large-screen VE. We focused on two main questions:
How does the riskiness of a CG character’s road-crossing behavior influence the behavior of a
participant? To what degree do people interact similarly with a real person vs. a CG character?
In many respects, participants treated CG characters similarly to real partners in the joint road-
crossing task. Participants in all three conditions were more likely to cross the same gap as the
partner than not, and kept a similar interpersonal distance between themselves and their partner.
In addition, they coordinated their crossing movement with both real and CG agent partners,
entering and exiting the roadway in tight synchrony. Notably, targets paired with CG characters
appeared to slow their crossing movement to allow the later starting agents to catch up with them
and then continued the crossing in synchrony with the agent.
When paired with the risky partner, targets were willing to take more borderline gaps (3.5 and 4
s) than they took with the safe or real partner. This is consistent with our previous work showing
that child cyclists are more likely to take riskier gaps after experience riding with a risky CG peer

26 Using Connected Vehicle Technology to Deliver Timely Warnings to Pedestrians
than a safe CG peer [29]. Interestingly, the safe partner seemed to exert a less powerful influence
on targets than did the risky partner. Targets were less likely to cross with the safe peer, most
often crossing smaller gaps before a gap arrived that was sufficiently large for the safe partner to
accept.
The group differences in the target participants’ willingness to accept risky gaps when paired with
risky agents are likely due, at least in part, to the targets coupling their decisions and actions with
the decisions and actions of their partner. This tendency to “do what the partner is doing” results
in targets taking more small gaps when the partner took small gaps. That this happened with the
risky agent shows that the pull to couple motions can lead to greater risk taking and demonstrates
that this pull holds for CG characters. Both observations are important: (1) that pedestrians will
adjust their gap threshold to take greater risk in response to greater risk taking by a nearby
pedestrian, and (2) that this behavior can be elicited with a relatively crude CG agent.
The story is even more interesting when combined with the asymmetry of the effect – targets
were less willing to wait for the safe agent when a large gap came late in the sequence. Overall,
this may suggest that actual movement is a necessary component for partner influence (i.e., the
motion of the risky agent triggered action in the target, but the presence of the safe peer waiting
for a large gap was not enough to hold the target in place). Alternatively, it may reflect a greater
willingness to adjust gap acceptance thresholds downward (taking more small gaps) than to wait
for larger gaps. It would be interesting to test the limits of this coupling to see how tight of gaps
participants would take with an agent. It would also be interesting to use human confederates as
partners who could be instructed to be more or less risky in their gap choices.
This study demonstrates the potential for using large-screen VEs to study how people interact
with CG characters. Our characters were realistic in many respects: they appeared plausibly
human; their movements were based on real human motions; they had idle motions that gave
some sense of liveness; and their gaze tracked the motion of the lead car in the gap to be crossed.
However, it was very evident that they were simulated entities: their clothes and hair were stiff;
their motions were highly repetitive; the transitions between motions were somewhat abrupt;
and the agent neither acknowledged nor engaged with the participants. Other work might explore
how different levels of fidelity in both the appearance and behavior of the character influence
participant behavior. The road-crossing task also provided robust behavioral measures for
examining how people adjust their behavior in the presence of animated characters. The wide
field of view allowed participants to keep the agent in their peripheral vision even when they were
attending to the traffic, something that would be more difficult in a head-mounted display system.
This study also provides a foundation for future studies examining joint action in physically
separated, shared VEs where participants are represented by graphic avatars in their partner’s
VE. Such shared VEs have been investigated for teleconferencing [32, 33], task performance [22,
34], and rehearsal [35]. This research has largely focused on how the fidelity of self-avatars
impacts an individual’s perception, performance, and sense of body ownership [36, 37], and on
how avatar fidelity influences conversational interactions [22, 26, 38]. However, little is known
about what levels of motion and appearance fidelity are needed to effectively represent other
actors and to support full-body joint actions in a shared virtual space. Road crossing is an excellent
model system for studying coordinated action in complex perceptual-motor tasks that involve
making decisions and timing movement. The results of this experiment provide a baseline which

27 Using Connected Vehicle Technology to Deliver Timely Warnings to Pedestrians
could be compared to similar data collected with avatars of various levels of fidelity. In future
work, we plan to investigate how the fidelity of both avatar appearance and movement influences
interactions between participants in road crossing.

28 Using Connected Vehicle Technology to Deliver Timely Warnings to Pedestrians
References
1. National Highway Traffic Safety Administration (2014). Traffic Safety Facts 2014. DOT HS 812
261, U.S. Department of Transportation, Washington, DC.
2. O’Neal, E. E., Jiang, Y., Franzen, L., Rahimian, P., Yon, J. P., Kearney, J. K., & Plumert, J. M.
(2017). Changes in perception-action tuning over long time scales: How children and adults
perceive and act on dynamic affordances when crossing roads. Journal of Experimental
Psychology: Human Perception and Performance. http://doi.org/10.1037/xhp0000378.
3. Barton, B. K. & Schwebel, D. C. (2007). The roles of age, gender, inhibitory control, and
parental supervision in children’s pedestrian safety. Journal of Pediatric Psychology, 32(5),
517-526.
4. Plumert, J. M., Cremer, J., Kearney, K., Recker, K., & Strutt, J. (2011). Changes in children's
perception-action tuning over short time scales: Bicycling across traffic-filled intersections in
a virtual environment. Journal of Experimental Child Psychology, 108, 322-337
5. Geraghty, J., Holland, C., & Rochelle, K. (2015). Examining links between cognitive markers,
movement initiation and change, and pedestrian safety in older adults. Accident Analysis
and Prevention, 89, 151-159.
6. Jiang, Y., O’Neal, E., Yon, J.P., Frazen, L., Rahimian, P., Plumert, J., & Kearney, J. (in press).
Acting Together: Joint Pedestrian Road Crossing in an Immersive Virtual Environment. ACM
Transactions on Applied Perception.
7. Cisek, P. & Kalaska, J. F. (2004). Neural correlates of mental rehearsal in dorsal premotor
cortex. Nature, 431, 7011, 993–996.
8. Kilner, J. M., Vargas, C., Duval, S., Blakemore, S.-J., & Sirigu, A. (2004). Motor activation prior
to observation of a predicted movement. Nature Neuroscience, 7, 12, 1299–1301.
9. Van Schie, H. T., Mars, R. B., Coles, M. G. H., & Bekkering, H. (2004). Modulation of activity in
medial frontal and motor cortices during error observation. Nature Neuroscience, 7, 5, 549–
554. http://doi.org/10.1038/nn1239
10. Lakin, J. L. & Chartrand, T. L. (2003). Using nonconscious behavioral mimicry to create
affiliation and rapport. Psychological Science, 14, 4, 334–339.
11. Faria, J. J., Krause, S., & Krause, J. (2010). Collective behavior in road crossing pedestrians:
The role of social information. Behavioral Ecology, 21, 6, 1236–1242.
12. Guéguen, N. & Pichot, N. (2001). The influence of status on pedestrians’ failure to observe a
road-safety rule. The Journal of Social Psychology, 141, 3, 413–415.
13. Lefkowitz, M., Blake, R. R., & Mouton, J. S. (1955). Status factors in pedestrian violation of
traffic signals. Journal of Abnormal Psychology, 51, 3, 704–706.
14. Zhou, R. & Horrey, W. J. (2010). Predicting adolescent pedestrians’ behavioral intentions to
follow the masses in risky crossing situations. Transportation Research Part F: Traffic
Psychology and Behaviour, 13, 3, 153–163. http://doi.org/10.1016/j.trf.2009.12.001
15. Blascovich, J., Loomis, J., Beall, A. C., Swinth, K. R., Hoyt, C. L., & Bailenson, J. N. (2002).
Immersive virtual environment technology as a methodological tool for social psychology.
Psychological Inquiry, 13, 2, 103–124.
16. Sebanz, N., Bekkering, H., & Knoblich, G. (2006). Joint action: bodies and minds moving
together. Trends in Cognitive Sciences, 10, 2, 70–76.

29 Using Connected Vehicle Technology to Deliver Timely Warnings to Pedestrians
17. Gibson, J. J. (1979). The ecological approach to visual perception. Hillsdale, NJ:Erlbaum.
http://doi.org/10.1080/08838158409386516
18. Young, D. S. & Lee, D. N. (1987). Training children in road crossing skills using a roadside
simulation. Accident Analysis and Prevention, 19, 5, 327–341.
19. Marsh, K. L., Johnston, L., Richardson, M. J., & Schmidt, R. C. (2009). Toward a radically
embodied, embedded social psychology. European Journal of Social Psychology, 39, 7, 1217–
1225. http://doi.org/10.1002/ejsp.666
20. Radke, S., De Lange, F. P., Ullsperger, M., & De Bruijn, E. R. A. (2011). Mistakes that affect
others: An fMRI study on processing of own errors in a social context. Experimental Brain
Research, 211, 3-4, 405–413. http://doi.org/10.1007/s00221-011-2677-0
21. Davis, T. J., Riley, M. A., Shockley, K., & Cummins-Sebree, S. (2010). Perceiving affordances
for joint actions. Perception, 39, 12, 1624–1644. http://doi.org/10.1068/p6712
22. Bailenson, J. N., Beall, A. C., & Blascovich, J. (2002). Gaze and task performance in shared
virtual environments. Journal of Visualization and Computer Animation, 13, 5, 313–320.
23. Bailenson, J. N., Yee, N., Merget, D., & Schroeder, R. (2005). The effect of behavioral realism
and form realism of real-time avatar faces on verbal disclosure, nonverbal disclosure,
emotion recognition, and copresence in dyadic interaction. Presence: Teleoperators and
Virtual Environments, 15, 4, 359–372. http://doi.org/10.1162/pres.15.4.359
24. Garau, M. (2006). Selective fidelity: investigating priorities for the creation of expressive
avatars. Avatars at Work and Play SE - 2, 34, 17–38. http://doi.org/10.1007/1-4020-3898-
4_2
25. Garau, M., Slater, M., Bee, S., & Sasse, M. A. (2001). The impact of eye gaze on
communication using humanoid avatars. Proceedings of the SIGCHI Conference on Human
Factors in Computing Systems CHI 01, 309–316. http://doi.org/10.1145/365024.365121
26. Garau, M., Slater, M., Vinayagamoorthy, V., Brogni, A., Steed, A., & Sasse, M. A. (2003). The
impact of avatar realism and eye gaze control on perceived quality of communication in a
shared immersive virtual environment. New Directions in Video Conferencing, pp. 529–536.
27. Welbergen, H. Van, Basten, B. J. H. Van, Eggers, A., Ruttkay, Z. M., & Overmars, M. H. (2010).
Real time animation of virtual humans: a trade-off between naturalness and control.
Computer Graphics Forum, 29, 8, 2530–2554.
28. Bailenson, J. N., Blascovich, J., Beall, A. C., & Loomis, J. M. (2003). Interpersonal Distance in
Immersive Virtual Environments. Personality and Social Psychology Bulletin, 29, 7, 819–833.
http://doi.org/10.1177/0146167203253270
29. Babu, S. V., Grechkin, T. Y., Chihak, B., Ziemer, C., Kearney, J. K., Cremer, J. F., & Plumert, J.
M. (2011). An immersive virtual peer for studying social influences on child cyclists’ road-
crossing behavior. IEEE Transactions on Visualization and Computer Graphics, 17, 1, 14–25.
30. Cruz-Neira, C., Sandin, D. J., DeFanti, T. A., Kenyon, R. V., & Hart, J. C. (1992). The CAVE:
audio visual experience automatic virtual environment. Communications of the ACM, 35(6),
64-73.
31. Rahimian, P., Jiang, Y., Yon, J. P., Franzen, L., Plumert, J. M., & Kearney, J. K. (2015).
Designing an immersive pedestrian simulator to study the influence of texting and cellphone
alerts on road crossing. In 2015 Road Safety and Simulation International Conference.
32. Greenhalgn, C. & Benford, S. (1995). MASSIVE: A collaborative virtual environment for
teleconferencing. ACM Transactions on Computer-Human Interaction, 2, 3, 239–261.

30 Using Connected Vehicle Technology to Deliver Timely Warnings to Pedestrians
33. Isbister, K., Nakanishi, H., Ishida, T., & Nass, C. (2000, April). Helper agent: Designing an
assistant for human-human interaction in a virtual meeting space. In Proceedings of the
SIGCHI conference on Human Factors in Computing Systems (pp. 57-64). ACM.
34. Slater, M., Sadagic, A., Usoh, M., & Schroeder, R. (2000). Small-group behavior in a virtual
and real environment: A comparative study. Presence, 9, 1, 37–51.
http://doi.org/10.1162/105474600566600
35. Normand, J.-M., Spanlang, B., Tecchia, F., Carrozzino, M., Swapp, D., & Slater, M. (2012). Full
body acting rehearsal in a networked virtual environment — a case study. Presence, 21, 2,
229–243.
36. McManus, E. A., Bodenheimer, B., Streuber, S., De La Rosa, S., Bülthoff, H. H., & Mohler, B. J.
(2011, August). The influence of avatar (self and character) animations on distance
estimation, object interaction and locomotion in immersive virtual environments.
In Proceedings of the ACM SIGGRAPH Symposium on Applied Perception in Graphics and
Visualization, (pp. 37-44). ACM.
37. Ries, B., Interrante, V., Kaeding, M., & Phillips, L. (2009). Analyzing the effect of a virtual
avatarʼs geometric and motion fidelity on ego-centric spatial perception in immersive virtual
environments. Proceedings of the 16th ACM Symposium on Virtual Reality Software and
Technology, 1, 212, 59–66.
38. Raij, A. B., Johnsen, K., Dickerson, R. F., Lok, B. C., Cohen, M. S., Deurson, M., Pauly, R. R.,
Stevens, A. O., Wagner, P, & Lind, D.S. (2007). Comparing interpersonal interactions with a
virtual human to those with a real human. IEEE Transactions on Visualization and Computer
Graphics, 13, 3, 443–57.