an investigation of k-means clustering to high and multi
TRANSCRIPT
An investigation of K-means clustering to high andmulti-dimensional biological data
Barilee B. BaridamDepartment of Computer Science, University of Pretoria, South Africa
Email: [email protected]
M. M. AliSchool of Computational and Applied Mathematics,
Witwatersrand University, Wits 2050, Johannesburg, South AfricaEmail: [email protected]
AbstractThe K-means clustering algorithm has been intensely researched owing to its simplic-
ity of implementation and usefulness in the clustering task. However, there have also beencriticisms on its performance, in particular, for demanding the value of K before the ac-tual clustering task. It is evident from previous researches that providing the number ofclusters a priori does not in any way assist in the production of good quality clusters. Ourinvestigations in this paper also confirm this finding.
The objective of this paper is to investigate further, the usefulness of the K-meansclustering in the clustering of high and multi-dimensional data by applying it to biologicalsequence data. The squared Euclidean distance and the cosine measure are used as the sim-ilarity measures. We use the silhouette validity index first to show that K-means algorithmis not suitable for clustering high and multi-dimensional biological data irrespective of thedistance or similarity measure employed. A preprocessor scheme is then added to the K-means algorithm. The scheme is used to automatically initialize a suitable value of K priorto the execution of the K-mean algorithm. Central to the preprocessor is the average sil-houette value of the clusters. Our investigation suggests that the use of the silhouette valuein the preprocessor improves the quality of clusters significantly for the biological datasetsconsidered.
Furthermore, we suggest a scheme which maps the high dimensional data into low di-mensions. We have then shown that the K-means algorithm with preprocessor producesgood quality, compact and well-separated clusters of the biological data mapped in low di-mensions. For the purpose of clustering we conduct a character-to-numeric conversions totransform the nucleic/amino acids symbols to numeric values.
Keywords: Clustering, Dimensionality, Categorical data, Silhouette validity index.
1 IntroductionClustering is a statistical concept that has to do with the problem of identifying interestingdistribution patterns and similarities between objects in a data set [1, 2]. It is an optimiza-
1

tion problem that seeks to classify objects based on their proximity to one another. In thissense, objects that are most similar are grouped together forming groups of similar ob-jects referred to as clusters. Clustering tasks involve generating clusters that are compactand well-separated from one another. It follows then that clustering task has to do withminimizing the intra-cluster distance or the within-cluster dispersion and maximizing theinter-cluster distance or the between-cluster dispersion.
There are two broad categories of clustering algorithms, namely hierarchical and partition-based clustering. K-means [4] is a well known partition-based clustering technique. It hasbeen widely used since it was first introduced in 1967. It, as a general rule, demands thevalue of K, the number of clusters expected, to be provided before the actual clustering.This is common to partition-based clustering algorithms [5]. Besides the provision of thevalue of K a priori, it is actually expected that the clusters centers are also to be identified,and then the algorithm performs the partitioning tasks iterative until a solution is achieved.On the contrary, hierarchical clustering algorithms group objects into clusters without anyknowledge of how many clusters there should be in the clustering task. This paper dealswith the partition-based K-means clustering.
The task of determining K a priori actually results into the problem of determiningwhich cluster each object belongs. Clearly, the initial K has impact on the performance ofthe algorithm. A wrong choice ofK results in the algorithm converging to a local minimuminstead of an expected global minimum solution. Running the algorithm several times withdifferent initializations tend to overcome this problem. However, this process results inhigh computational time. A number of algorithms have been suggested to determine asuitable value of initial K, see for example ISODATA [3], SYNERACT [7], DYNOC [8]and MLBG [9]. However, all these algorithms contain sensitive parameters, and this meansthat trying to solve one problem creates another of similar nature.
Under the above circumstances, we incorporate a preprocessor prior to the executionof K-means. The silhouette validity index [20] plays an important role in determining theinitial K in the preprocessor. We have shown that this optimizes K-means’ performance inclustering the high dimensional data sets.
The remaining part of this paper is divided into sections as follows: Section 2 focuseson the preliminaries and related literature; Section 3 describes the new approach suggestedfor high dimensional data. Section 4 briefly presents the silhouette validity index. Section 5shows the experimental results and Section 6 presents the concluding remarks.
2 The clustering task: data sets, similarity measuresand algorithms
2.1 The data setAssociated with a given data set
S ={x1, x2, · · · , xN
}, (1)
that needs clustering, are the attributes (xi1, xi2, · · · , xiD) of xi ∈ S and N is the maxi-
mum number of items in the data set. For a numerical data set S, each j-th attribute xijin xi is real and hence xi ∈ RD. However, for a mixed data set features of xi are gen-erally two: numerical and categorical. Therefore, the attributes of xi can be written as(xi1, x
i2, · · · , xip, yi1, yi2, · · · , yiq), p+ q = D, where yi1, y
i2, · · · , yiq are categorical values.
Biological data being considered in this paper are that of nucleic acids - Deoxyribonu-cleic acid (DNA) and ribonucleic acid (RNA). Thus the categorical biological data set S
xi = (AAAAUUUUGGGCCAAAGGCCCUUUAAGCCCGG) for RNA (2)
2

and
xi = (AAAATTTTGGGCCAAAGGCCCTTTAAGCCCGG) for DNA. (3)
DNA is a double helix structure with two strands of re-occurring nucleotides held togetherby base pairing. The top of the helix consists of a Guanine-Cytosine (GC) pair, referredto as purines, while the bottom consists of an Adeline-Thymine (AT) pair, referred to aspyrimidines. The GC base pair forms three hydrogen bonds, whereas the AT base pairforms two hydrogen bonds. DNA is a polymer with the nucleotides forming the monomerunits. In its double stranded form, DNA is the genetic material of most organisms. The twostrands form a double helix with the strands running in opposite directions as determined bythe sugar-phosphate backbone of the molecule. DNA is represented in chains of symbols- AGCT (Adenine, Guanine, Cytosine, Thymine). For the purpose of this research theyare represented as in (3). RNA is a bi-molecule made up of a chain of nucleotides asDNA, except that RNA introduces uracil (U) in place of Thymine (T). RNA and DNA arefunctionally and structurally different. A RNA strand folds onto itself. The folds formhydrogen bonds between G and C, A and U, and G and U, and their respective mirrorimages. The hydrogen bonds bind the base pairs to form DNA. There are enough literaturefor those interested in studying more of the structure of nucleic acids [12, 13, 14, 15].
The clustering process involved in this paper uses the above type of data. However,for the clustering purpose the biological sequence data have been converted into numericaldata. Nucleic acids are represented in 3 dimension. During the sequencing process (that is,the process of converting nucleic acids into readable sequences) the 3 dimensional structureis rendered in a chain of nucleotides. The sequencing process renders the sequences in high-and multi-dimensions.
2.2 The similarity measureAn important component of a clustering algorithm is the distance measure between datapoints, say xi and xj . For continuous numerical data sets the squared Euclidean distance
dij = d(xi, xj) =D∑
k=1
(xik − xjk)2 (4)
is often used. The other well known similarity measure is the cosine similarity measure:
dij = d(xi, xj) =xi·xj
‖xi‖‖xj‖, (5)
where ‖xi‖ is the length of the vector xi, and xi·xj is the dot product between vectors xi
and xj . We have implemented both measures for comparison purposes.
2.3 The K-means algorithmThe minimization problem involved in the K-means algorithm for numerical data set canbe formally written as follows [10]:
minK∑
m=1
N∑i=1
rim d(xi, Cm), rim ∈ {0, 1}, subject to
K∑m=1
rim = 1, ∀i, andN∑i=1
rim > 0, ∀m,
3
where Cm is the centroid of the m-th cluster and d(xi, Cm) is defined by equation (4) or(5). If xi is assigned to cluster m then rim = 1. The clustering process partitions a data setinto K clusters Si (i = 1, 2, · · · ,K) such that
(i) Si 6= ∅, i = 1, · · · ,K;(ii)⋃K
i=1 Si = S
(iii) Si ∩ Sj = ∅,∀ i, j = 1 · · · ,K and i 6= j.
The basic steps of the K-means algorithm for numerical data set are as follows.
Algorithm 1: K-means clustering
Step 1. Assign K initial centroids C1, C2, · · · , CK , one for each cluster Sm.
Step 2. For each data element xi ∈ S find the nearest Cm according to some similaritymeasure, e.g. the measures (4) or (5), and assign xi to the cluster Sm.
Step 3. For each cluster Sm calculate a new centroid Cm.
Step 4. If some stopping condition λ is reached stop Algorithm 1 else goto Step 2 with thenew centroids C1, C2, · · · , CK .
2.4 The modified K-means algorithmsA number of modified K-means algorithms have been proposed in the literature. Thepurpose of these modified versions is to handle the problem related to initial K value.
Turi [6] proposed a K-means algorithm by dynamically changing the value of K asthe iterations progress. Central to this algorithm are the merging and splitting of clusters.However, the algorithm requires the user to specify the values of several parameters (e.g.the merging and splitting thresholds). These parameters have a profound effect on theperformance of making the result subjective.
Huang [7] proposed a K-means algorithms, referred to as SYNERACT. SYNERACTcombinesK-means algorithm with hierarchical divisive approaches to overcomeK-means’setbacks. SYNERACT employs a hyper-plane to split a cluster into two smaller clustersand then compute their centroids, performs an iterative clustering to assign objects intoclusters, and constructs a binary tree to store clusters generated from the splitting process.This method does not demand the initial provision ofK and the initial location of centroidsbefore the clustering task. However, the user is expected to specify the values of twoparameters needed for the splitting process.
The dynamic optimal cluster-seek (DYNOC) algorithm was introduced by Tou [8].DYNOC is a dynamic clustering algorithm. It achieves a maximization of the ratio ofthe minimum inter-cluster distance to the maximum intra-cluster distance through an iter-ative procedure with the capability of splitting and merging clusters. There are howeveruser-specified parameters that suggest whether splitting or merging are necessary.
Rosenberger and Chehdi [9] attempted an improvement on K-means by introducing aniterative procedure known as the modified Linde-Buzo-Gray (MLBG) algorithm. MLBGautomatically finds the number of clusters in a data set by using intermediate results. Acluster maximizing an intra-cluster distance measure is chosen for splitting iteratively. Inthe process, two cluster centroids are generated from the initial cluster. The first clustercentroid, C1, is initialized to the centroid of the original (initial) cluster. The second clustercentroid, C2, is chosen to be the object in the original cluster which is the most distant fromC1. At this point, K-means is on the new K + 1 centroids. The acceptance of the new setof centroids depends on if an evaluation criterion based on a dispersion measure is satisfied.This process is repeated until there are no valid partitions in the data set. The main problemwith this method is that it requires the specification of the values of four parameters whichhave a fundamental effect on the resultant number of clusters [11].
4

The K-means algorithm is found to be the best applied to numeric data [16], andthe modifications, discussed above, dealing with numerical data set are very encourag-ing. However, the application of the K-means algorithm to mixed data set are extremelylimited. An attempt is made by Gupta et. al. [17] to apply the K-means algorithm byadopting two different similarity measures. An integrated cost function is suggested whichhas two components. A cost owing to numeric attributes is minimized by usual way i.e.assigning elements to clusters, while the other cost, owing to categorical attributes, is min-imized by selecting the categorical elements of centroid. However, the method of Guptaet. al. [17] has neither been justified by mathematical means nor has it been validatedby sufficient numerical testing. In addition, the method is not parameter-free. Finally,although Andreopoulos, et al. introduced a bi-level clustering of mixed categorical andnumerical biomedical (gene expression) data [24], the clustering of categorical biologicaldata set (nucleic or amino acids) is not so much addressed in the literature. This paperis concerned with the investigation of the performance of K-means in the clustering ofhigh/multi-dimensional data of which biological sequence data is one. Biological data setsinvestigated in this paper contains high and multi-dimensional data sequence xi, and to thebest of our knowledge, there is no K-means algorithm developed for clustering of thesedata sets. Also, conventional clustering methods cannot be applied to the clustering of bi-ological data owing to the structural nature of the data [25]. Hence, we have decided tostudy this clustering problem.
3 Application of K-means to biological sequence dataIn this paper, we investigate the ability of K-means in the clustering of high and multi-dimensional data sets - a situation where the input data are of several dimensions. In addi-tion, the biological sequence data sets we consider are naturally not numeric. The originalobjective of the K-means algorithm [4] and the subsequent findings [16] suggest that thenumerical presentations of the categorical biological data set is needed for successful appli-cations ofK-means. For this, we use conversions from symbols to numeric by representingeach sequence in the data set in a D-dimensional space through the application of a commadelimited conversion format. In particular, the nucleic acid symbols are represented numer-ically as follows: A = 1, C = 2, G = 3 and U or T = 4. For the clustering of a biologicalsequence data set, we adopt the following two separate approaches.
• Firstly, the sequences in the data set were truncated to a uniform dimension beforethe clustering, leaving the sequences in their high-dimensional state.
• Secondly, the dimension of each of the sequences was reduced to a uniform lowdimension (Dr) before clustering.
We define the dimension reduction by introducing the following concepts and definitions.LetN represent the number of nucleotides in a sequence; l, the sequence length; ni, the i-thindividual nucleotides (symbols) in a sequence already represented in numeric format. It isimportant to note that it is conventional to state that N = l in cases where the delimitersare not counted to constitute part of the length e.g. as presented by equations (2) and (3).We calculate the coordinates of a sequence xi ∈ S as follows:
Qi =
d1∑i=1
ni,
d2∑i=d1+1
ni, · · · ,D∑
i=dj+1
ni
, (6)
where dp =∑p
i=1 di with d1 = d1, p = 1, 2, · · · , j. We use dp = dq, p 6= q for all p, q =1, 2, · · · , j, whenever possible. When this is not possible an integer in {d1, d2, · · · , dj} is
5

selected at random and its value is adjusted so that(j∑
k=1
dk
)+(D − dj
)= D.
where di is any converted nucleotide in xi.A two dimensional representation of Equation (6) is given by:
Qi =
d1∑i=1
ni,N∑
i=d1+1
ni
. (7)
If the coordinates ofQi become large then they can be represented in ratios of least commonmultiples, but this was not required for the data sets we considered for numerical testing.We have implemented both the above procedures for the clustering of the nucleic acidsequences.
4 The silhouette indexThe silhouette validity index for each data element is simply a measure of how similarthat data element is to elements in its own cluster compared to elements in other clusters[18, 19]. It ranges from -1 to +1. The silhouette validation index is particularly useful whenseeking to know the number of clusters that will produce compact and clearly separatedclusters [21, 22, 20]. The silhouette index [20, 23] of the element xi of a cluster Sj isdefined as
qi =b(i)− a(i)
max {a(i), b(i)}, −1 ≤ qi ≤ 1, (8)
where a(i) is the average similarity between xi and the rest of the objects in cluster Sj andb(i) is the minimum average similarity between object xi and the rest of the objects in allthe clusters, defined as
minSm 6=Sj
d(xi, Sm) (m = 1, 2, · · · ,K;m 6= j).
Every object xi with a silhouette index close to 1 indicates it belongs to the cluster beingassigned. A value of zero indicates that the object could also be assigned to another closestcluster. A value close to -1 indicates that the object is in a wrong cluster or somewherein between the clusters. The highest value indicates the best clustering, meaning that thenumber of clusters selected for the clustering is the best [20].
5 Experimental results and performance analysis
5.1 Application to high dimensional dataWe begin with the application of theK-means algorithm on high dimensional data sets. Sixdatasets were used, namely emblFasta Rickettsia typhi str. RNA sequences with AccessionNumber AE017197 from Wilmington Complete Genome of 1111500 nucleotides, Homosapiens’ melanatonic melanoma DNA sequences, mRNA bos taurus sequences from Ge-netic Sequence Databank with Accession Number BE484664 obtained from the work ofSonstegard, et al [26], and DNA dental sequences from Department of Micro-biology, Uni-versity of Pretoria, South Africa. Each data set contains data elements (sequences) of equal
6

length, due to the truncation mentioned earlier. The K-means algorithm was applied morethan once on a data set to see the effect of K in the clustering process. Results of thisinvestigation is presented in Table 1. In Table 1, the following symbols are used: i (dataset), N (size of data set), D (dimension), K (number of clusters), IE (number of iterationsrequired when using squared Euclidean distance), IC (number of iterations required whenusing cosine similarity measure), TdE (distance using squared Euclidean), TdC (distanceusing cosine measure), ShE (silhouette mean under Euclidean distance) and ShC (silhou-ette mean under cosine measure). The data in columns under ‘Total distance’ are the totalintra cluster distance from the centroid of formed clusters1. That is if there are three clus-ters and dij is the distance the i-th element (of the j-th cluster Sj with nj elements) andits centroid Cj , then the total is calculated over the three centroids of clusters of the dataset, generated during the iteration process. This means that the total sum of distance is thevalue realized at the last iteration when the algorithm reaches a minimum, and the total iscalculated over the set {
n1∑i=1
d1i,
n2∑i=1
d2i,
n3∑i=1
d3i
}.
The data in columns under ‘Silhouette mean’ are the average of the silhouette values. Forexample, the average silhouette index values for the m-th cluster is given by
Q(m) =1
n(m)
n(m)∑i=1
qi(m),
where qi(m) is the silhouette value for the i-th member of them-th cluster, and n(m) is thetotal number of elements in the m-th cluster. The values presented in the last two columnsin Table 1 are therefore the values 1
K
∑Km=1Q(m), whereK is the total number of clusters.
Table 1: Effects of K in the K-means algorithm applied to the high dimensional dataIterations Total distance Silhouette mean
i N D K IE IC TdE TdC ShE ShC1 117 128 5 7 11 16264.3 8.71803 0.0335 0.0338
117 128 10 11 9 14791.7 7.99373 0.0533 0.03962 117 198 5 20 10 25844.5 9.03496 0.0180 0.0288
117 198 10 11 7 23776.3 8.32794 0.0309 0.03183 100 50 4 12 10 4654.08 6.19611 0.0622 0.0561
100 50 6 7 11 4968.8 7.8109 0.0663 0.06564 50 50 5 8 5 2366.79 3.24409 0.0916 0.0742
50 50 4 7 11 2512.22 3.3818 0.0707 0.07205 50 20 5 6 5 865.011 2.93337 0.1260 0.1270
50 20 4 4 11 937.727 3.13017 0.0995 0.12816 20 50 4 4 3 829.083 1.16313 0.1193 0.1134
20 50 3 3 4 919.786 1.30774 0.0962 0.1077
To see the effect of K we study the the 4th and 5th major columns (Total sum of dis-tances and Silhouette mean) in Table 1. The total sum of distances should be as low aspossible–a better clustering should give a lower value of the total sum of distances. How-ever, these values seem quite high. We therefore study the silhouette means in Table 1.
1The total sum of distances decreases at each iteration as K means reassigns points between clusters andrecomputes cluster centroids.
7

(a) (b)
(c) (d)
(e) (f)
Figure 1: The Silhouette plots for clusters of high dimensional data with various values of K,with the squared Euclidean distance measure [(Figs. 1(a), (c) - (128D) and (f) - (50D)) and theCosine similarity measure (Figs. 1(b) and (d) - (128D) and (e) - (50D))].
8

These values determine how far apart the clusters are. With a high value, the cluster qual-ity is near optimal. Again these values seems non-optimal. To visualize the cluster-wisesilhouette index values, we present in Figure 1 the silhouette plot of generated clusters.For this we have used data sets 1 and 3 in Table 1. Figures 1(a) and 1(c) are, respectively,for K=5 and 10 using squared Euclidean measure, data set 1. Figures 1(b) and 1(d) are,respectively, for K=5 and 10 using cosine measure, data set 1. Figures 1(e) and 1(f) arefor the data set 3 using cosine and Euclidean measures respectively, K=4. Figure 1 clearlyshows that the many silhouette values are negative and the overall results are unsatisfactory.Observe from Table 1 and Figure 1 that as the dimension decreases, the result of the clus-tering becomes better. It is clear from the figures that the value of K greatly determines thecluster quality.
5.2 The preprocessor of the K-means algorithmTo deal with the initialization problem ofK, we suggest an automatic initialization scheme.The silhouette mean under Euclidean distance measure, ShE , presented in Table 1 playsthe most important role in the scheme. For an initial value of K, provided by the user, theAlgorithm 1 (the K-means algorithm) is run for a small number of iterations (e.g. typically3) three times, respectively using K − 2, K and K + 2. Three corresponding ShE valuescorresponding to K − 2, K and K + 2 are found (hereafter denoted as ShE(K − 2),ShE(K) and ShE(K + 2), respectively). The initial value, Ko, of K is then assignedusing the following procedure:
1. If ShE(K − 2) < ShE(K) and ShE(K) > ShE(K + 2) then the Algorithm 1is run again twice (each time for 3 iterations) using K + 1 and K − 1 and the cor-responding ShE(K − 1) and ShE(K + 1) are found. The maximum value of three{ShE(K−1), ShE(K) andShE(K+1)} then determinesKo. For example if ShE(K−1)is the maximum then we assign Ko = K − 1.
2. If ShE(K + 2) > ShE(K) and ShE(K + 2) > ShE(K − 2) then the Algorithm 1 isrun again using K + 1, K + 3 and K + 4. The K value corresponding to the maximum in{ShE(K + 1), ShE(K + 2), ShE(K + 3), ShE(K + 4)} is then assigned to Ko.
3. If ShE(K + 2) < ShE(K − 2) and ShE(K) < ShE(K − 2) then the value corre-sponding to the maximum in {ShE(K − 1), ShE(K − 2), ShE(K − 3), ShE(K − 4)} isthen assigned to Ko.
The initial value2, Ko, of K found using the above procedure is then used to find Ko
clusters using K-means algorithm, i.e. the Algorithm 1. To test the effectiveness of theabove procedure we use two data sets from Table 1, namely the first and the third data sets.We have used the initial K in the preprocessor as given in Table 1. Results obtained arepresented in Table 2. Table 2 clearly shows that the results have been improved for both
Table 2: Effects of preprocessor in the K-means algorithmIterations Total distance Silhouette mean
i N D K Ko IE IC TdE TdC ShE ShC1 117 128 5 8 10 7 14576.1 7.8258 0.0437 0.04153 100 50 4 5 6 5 3052.75 3.05384 0.1163 0.1143
2The above process consisting of steps 1-3 can be repeated anew (with a new K) if the ShE increases mono-tonically. However, this was not needed for our implementation.
9
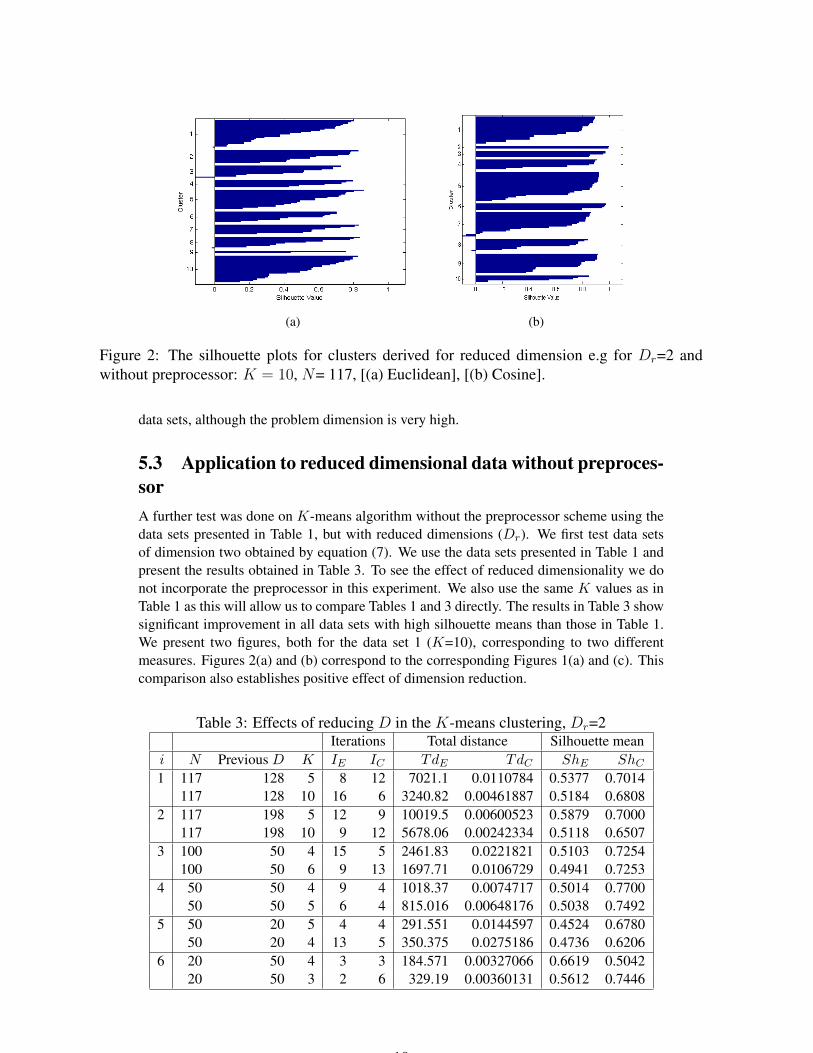
(a) (b)
Figure 2: The silhouette plots for clusters derived for reduced dimension e.g for Dr=2 andwithout preprocessor: K = 10, N= 117, [(a) Euclidean], [(b) Cosine].
data sets, although the problem dimension is very high.
5.3 Application to reduced dimensional data without preproces-sorA further test was done on K-means algorithm without the preprocessor scheme using thedata sets presented in Table 1, but with reduced dimensions (Dr). We first test data setsof dimension two obtained by equation (7). We use the data sets presented in Table 1 andpresent the results obtained in Table 3. To see the effect of reduced dimensionality we donot incorporate the preprocessor in this experiment. We also use the same K values as inTable 1 as this will allow us to compare Tables 1 and 3 directly. The results in Table 3 showsignificant improvement in all data sets with high silhouette means than those in Table 1.We present two figures, both for the data set 1 (K=10), corresponding to two differentmeasures. Figures 2(a) and (b) correspond to the corresponding Figures 1(a) and (c). Thiscomparison also establishes positive effect of dimension reduction.
Table 3: Effects of reducing D in the K-means clustering, Dr=2Iterations Total distance Silhouette mean
i N Previous D K IE IC TdE TdC ShE ShC1 117 128 5 8 12 7021.1 0.0110784 0.5377 0.7014
117 128 10 16 6 3240.82 0.00461887 0.5184 0.68082 117 198 5 12 9 10019.5 0.00600523 0.5879 0.7000
117 198 10 9 12 5678.06 0.00242334 0.5118 0.65073 100 50 4 15 5 2461.83 0.0221821 0.5103 0.7254
100 50 6 9 13 1697.71 0.0106729 0.4941 0.72534 50 50 4 9 4 1018.37 0.0074717 0.5014 0.7700
50 50 5 6 4 815.016 0.00648176 0.5038 0.74925 50 20 5 4 4 291.551 0.0144597 0.4524 0.6780
50 20 4 13 5 350.375 0.0275186 0.4736 0.62066 20 50 4 3 3 184.571 0.00327066 0.6619 0.5042
20 50 3 2 6 329.19 0.00360131 0.5612 0.7446
10

(a) (b)
(c) (d)
Figure 3: The silhouette plots for clusters of 50 data points (data set 4)[(a) Ko= 4 (Cosinemeasure) and (b) Ko=4 (squared Euclidean measure)] and 88 data points (data set 10)[(c) Ko=3(cosine measure), and (d) Ko=3 (squared Euclidean measure)]
Table 4: Optimal Ko in the K-means algorithmIterations Total distance Silhouette mean
i N Ko K IE IC TdE TdC ShE ShC1 117 7 5 6 7 3940.84 0.146286 0.6587 0.81102 117 6 5 5 5 5767.98 0.608631 0.6837 0.73583 100 5 6 6 7 6142.24 0.453146 0.6687 0.79234 50 4 5 9 6 7338.64 0.625917 0.7508 0.78595 50 6 4 10 7 12943.3 0.967989 0.7246 0.80216 20 7 3 13 7 3322.21 0.137556 0.7537 0.78987 88 6 7 5 9 4017.84 0.148084 0.6869 0.80728 88 5 5 5 4 4210.39 0.319518 0.7433 0.81439 88 4 3 6 5 8646.92 0.46525 0.6207 0.7772
10 88 3 6 6 3 9514.41 0.64087 0.7546 0.8348
5.4 Application to reduced dimensional data with preprocessorWe now study the effect of both reduced dimension and preprocessor on 10 data sets. Wefirst consider Dr=2 and present the results in Table 4, where the first 6 data sets are thesame data sets considered before.
To see the effect of the dimension reduction we now compare the same data set inTables 2 and 4, i.e. the data set 1 in Tables 2 and 4. Results show that Ko correspondingto this data set in both tables are very close. This proves the effect of preprocessor as wellas the dimension reduction in K-means for categorical biological data sets. Notice that for
11

data set 8, K and Ko are the same. This means that the initial K assigned to preprocessorremained the same.
We further present the silhouette values in Figure 3 for two data sets of 50 and 88data points, respectively, with reduced dimensions. These are respectively the 4th and 10thdata sets presented in Table 4. These figures clearly shows well separated clusters. Theusefulness of the silhouette value in the clustering task as well as the incorporation of thepreprocessor are now evident.
An obvious question that one may rise is how to identify an appropriate value for thereduced dimension, Dr. To address this question, we reproduce the values of the data set 1in Table 3 using Dr=3. Results obtained are very similar. For example, for K=10 we ob-tained the following values: TdE=5448.01, TdC=0.1872, ShE=0.4210, and ShC=0.6062.We present the corresponding graph for K=10 in Figure 4. In addition, we present a graphfor the data set 3.
(a) (b)
Figure 4: The silhouette plots for clusters of 117 data points (data set 1)[(a) K= 10 (Euclideanmeasure) and (b) K=4 (Euclidean measure)] and 100 data points (data set 3)
Although preprocessor has not been used for this experiment, the graphs produced showthat silhouette values are fairly acceptable. These results can be further improved by theuse of preprocessor. Our experiments have shown that the optimized values are not exactlythe same, for Dr=2 and 3, but they are within an acceptable level of closeness. Hence, wesuggest that Dr=2 is a good value to choose.
6 Conclusion and further researchWe have studied the usefulness of the K-means algorithm for clustering the categoricalbiological sequence data. These sequences consist of alphabets and are of high and multi-dimensional in nature. We introduced a numerical equivalence sequence of the categoricaldata. To reduce the effect of initial K in K-means we have introduced a preprocessorscheme. We have shown that significant gains in optimality can be achieved by using thepreprocessor. In addition, we introduced a dimension reduction technique which whenapplied with the preprocessor produces well separated clusters.
It is necessary to state here that the work presented in this paper is not about comparingthe performance of algorithms. We have not also said that K-means is better than any otheralgorithm. Since K-means clustering algorithm have been widely researched, we have onlyinvestigated its performance in the clustering of high and multi-dimensional categoricaldata (in this case biological sequence data were used). Suffice us to say that the clusteringtechnique introduced in the paper is new and thus can be applied to many similar practicalproblems.
12

References[1] P. Berkhin, ‘Survey of clustering data mining techniques’, Technical report 4, Accrue
Software, Inc., San Jose, California, 2002.
[2] D. A. Binder, ‘Cluster analysis under parametric models’, PhD thesis, University ofLondon, 1977.
[3] J. Tou and R. Gonzalez, ‘Pattern Recognition Principles’, Addison-Wesley, Mas-sachusetts, USA, 1974.
[4] J. B. MacQueen, ‘Some methods for classification and analysis of multivariate obser-vations’, Proceedings of the 5th Berkeley Symposium on Mathematical Statistics andProbability, University of California Press, Berkeley, 281–297, 1967.
[5] F. D. Smet, J. Mathys, K. Marchal, G. Thijs B. D. Moor and Y. Moreau, ‘Adaptivequality-based clustering of gene expression profiles’, Bioinformatics, 18(6),:735–748,2002.
[6] R. H. Turi, ‘Clustering-based Colour Image Segmentation’, PhD thesis, Monash Uni-versity, 2001.
[7] K. Huang, ‘A Synergistic Automatic Clustering Technique (SYNERACT) for Mul-tispectral Image Analysis’, Photogrammetric Engineering and Remote Sensing,1(1):33–40, 2002
[8] J. Tou, ‘DYNOC - A Dynamic Optimal Cluster-seeking Technique’, InternationalJournal of Computer and Information Sciences, 8(6):541–547, 1979.
[9] C. Rosenberger and K. Chehdi, ‘Unsupervised Clustering Method with Optimal Esti-mation of the Number of Clusters: Application to Image Segmentation’, Proceedingsof the International Conference on Pattern Recognition (ICPR’00), pages 1656–1659,2000.
[10] J. C. Bezdek, ‘A Convergence Theorem for the Fuzzy ISODATA Clustering Algo-rithms’, IEEE Transactions on Pattern Analysis and Machine Intelligence, 2:1-8,1980.
[11] M. G. H. Omran, ‘Particle Swarm Optimization Methods for Pattern Recognition andImage Processing’, PhD thesis, University of Pretoria, Faculty of Engineering, BuiltEnvironment and Information Technology, Department of Computer Science, 2004.
[12] P. E. Bourne and H. Weissig. ‘In Phillip Bourne and Helge Weissig’, editors, Struc-tural Bioinformatics, pages 35–49. Wiley-Liss, Inc., Hoboken, New Jersey, 2003.
[13] National Human Genome Research Institute. The structure of Ribonucleic and De-oxyribonucleic Acids. National Institutes of Health, Division of Intramural Research.Available online: www.nhgri.gov.
[14] M. F. Ramoni, P. Sebastiani, and I. I. Kohane. ‘Cluster analysis of gene expressiondynamics’. In Proceedings of National Academy of Science, volume 99, pages 9121–9126, July 2002.
[15] Y. Xu, V. Olman, and D. Xu. ‘Clustering gene expression data using a graph theoreticapproach: an application of minimum spanning trees’. Bioinformatics, 18(4):536–545, 2002.
13
[16] R. Xu and D. Wunsch II, ‘Survey of Clustering Algorithms’, International Journal ofIntelligent Computing and Cybernetics, 16(3):601–614, 2005.
[17] S. R. Gupta, K. S. Rao and V. Bhatnagar, ‘K-means clustering algorithm for categori-cal attributes’, Proceedings of 1st International Conference on Data Warehousing andKnowledge Discovery, pages 203–208, Florence, Italy, 1999.
[18] MATLAB, ‘The Language of Technical Computing’,version 7.0, The Mathworks,Inc., 2004.
[19] L. Kaufman and P. Rousseuw, ‘Finding Groups in Data: An Introduction to ClusterAnalysis’, Wiley, 1990.
[20] P. Rousseuw, ‘Silhouettes:A practical aid to the interpretation and validation of clusteranalysis’, Computational and applied mathematics, 20, 1987.
[21] F. Azuaje, ‘Cluster validity framework for genome expression data’, Bioinformatics,18(2), 2002.
[22] M. D. Gonzalez” Teledo, ‘A comparison in cluster validation techniques’, Univer-sity of Puerto Rico, Department of Mathematics(Statistics), Master of science thesis,2005.
[23] N. Bolshakova and F. Azuaje, ‘Cluster validation techniques for genome expressiondata’, Signal Processing, 83:825–833, 2003.
[24] B. Andreopoulos, A. An and X. Wang, ‘Bi-level clustering of mixed categorical andnumerical biomedical data’, International Journal of Data Mining and Bioinformatics,1(1):19–56, 2006.
[25] B. B. Baridam and O. Owolabi, ‘Conceptual Clustering of RNA Sequences withthe Codon Usage Model’, Global Journal of Computer Science and Technology,10(8):41–45, 2010.
[26] T. Sonstegard, A. V. Capuco, J. White, C. P. Van Tastell, E. E. Connor, J. Cho, R.Sultana, L. Shade, J. E. Wray, K. D. Wells and Quackenbush, J.”, ‘Analysis of bovinemammary gland EST and functional annotation of the Bos Taurus gene index’, Mam-mary Genome, 13(7):373–379, 2002.
14