an investigation of indian security...
TRANSCRIPT
International Journal of Economics, Commerce and Management United Kingdom Vol. V, Issue 12, December 2017
Licensed under Creative Common Page 1033
http://ijecm.co.uk/ ISSN 2348 0386
AN INVESTIGATION OF INDIAN SECURITY MARKET: THE VIEWPOINT
OF FMCG COMPANIES WHO VOYAGE FROM GOOD TO GREAT
Syed Mohammad Faisal
Assistant professor, Department of Accounting, Faculty of Administrative Sciences,
Jazan University, Kingdom of Saudi Arabia
Ahmad Khalid Khan
Assistant professor, Department of Accounting, Faculty of Administrative Sciences,
Jazan University, Kingdom of Saudi Arabia
Omar Abdullah
Assistant professor, Department of Accounting, Faculty of Administrative Sciences,
Jazan University, Kingdom of Saudi Arabia
Abstract
In post recession period Indian Security Market over the years has seen many ups and downs
in different sectors including our research area of FMCG sector in terms of profitability, dividend
distribution policy, consumer preferences and choices in actual market conditions and getting
hold of confidence level of investors . We started noticing consumer goods market in India that
has seen massive growth and competition both in local (Indian) market and at trans-national
level that led high demand and huge contest amongst different FMCG companies despite tough
times in economy as a whole. Our familiarity, proficiency and experience about FMCG sector
stirred us to write this paper focusing different aspects of this segment. This study aims at
analyzing various brands of FMCG companies in the viewpoint of implicit performance in the
stock market as well as its actual achievement and its performance in the market in terms of
consumers’ choices and preferences. To be specific and more accurate in our study we have
selected only FMCG sector else it would be then vast level of study and due to time constraint

© Faisal, Khan & Abdullah
Licensed under Creative Common Page 1034
that is not viable. That is why we researchers spotlight on one particular segment from the index
(BSE) taken from Indian security market and selected FMCG one of the leading sectors
amongst all other sectors available in the BSE’s SENSEX 30. In our study it is apparent that
HUL (Hindustan Unilever Limited) emerged as really great company despite many tough time in
Indian Stock Market.
Keywords: Dividend Pay Out, EPS (Earning Per Share), FMCG, Market Capitalization, P/E
Ratio
INTRODUCTION
Fast Moving Consumer Goods (FMCG) often known as in modern parlance as „packaged
consumer goods‟ are one of fastest growing products (Food and non-food) of any country in the
world.
Since our study is based in India and revolves around performance in stock exchange
(BSE), SENSEX-30 therefore all study including stock market performance and consumers‟
preferences and perceptions are taken in Indian perspective.
Part of some research is also done in Saudi Arabia during collection of feedback in the
form of consumers‟ preferences as researchers are employed in that country, therefore there
are chances that some respondents might not aware of some FMCG products launched in
Indian market.
It is known that in any study of composition of index (BSE and Nifty) all sectors such as
FMCG, Banking, Agricultural products, Real Estate, Consumer Durables etc all are significant
due to their Market Performance, Market Capitalization, Earning Per Share (EPS), Dividend
Payout Ratio and other confounding factors.
But studying all the sectors and their respective companies could be a wild goose chase
study and due to time constraint collection of data would be difficult task. To overcome such
difficulty we‟ve assumed first that FMCG sector is a great sector and all listed companies on
SENSEX 30 are good and great companies.
Now we will examine through our source of primary data and secondary data that which
one is considered great company that fulfil set criteria in the context of its performance during
five years in the stock market and apart from this study researchers would make an attempt to
classify consumers‟ preferences and choices over other brands in the same sectors through our
questionnaire.
International Journal of Economics, Commerce and Management, United Kingdom
Licensed under Creative Common Page 1035
In the first part of our study we examine and analyze performance of Hindustan Uniliver Limited
and thus compare with other FMCG companies listed in SENSEX 30 on the stock market. And
this study based on its Market Capitalization, P/E Ratio i.e. Price to Earnings Ratio and EPS;
and in the second part of study we, researchers make an attempt to classify consumers‟
preferences and perceptions of different brands of Hindustan Uniliver Limited and comparative
study and analysis will be done by their feedback and thus generating results in conclusion part.
LITERATURE REVIEW
The authors have undertaken the aforesaid subject for research there is no dearth of study
material on the aforementioned subject, plethora of work article has been written on the subject
matter, some of the articles has been discussed here (Richa Vij - 2017) examined Mergers and
Acquisitions (M&As) are often used as chosen paraphernalia of commercial arrangement to
provide a range of industrial purposes and attach worth for the investors. In another study (Amit
Kumar Singh – 2017) investigated the impact of corporate governance practices on revenue
management. To achieve the objectives analyzed a sample of 50 large capitalization companies
from 10 different sectors viz. automotive, oil and gas, pharmaceuticals, cement/construction,
chemical, real estate/ retail, food and beverage, technology, engineering and metals and mining
listed on BSE for the period 2005–06 to 2015–16. Pragmatic results of general scrutiny
disclosed that board size and revenue management are pessimistically linked while board
meeting regularity is certainly linked with revenue management. In the sector-wise analysis,
impact of commercial authority in restricting revenue management was found to be moderately
upper and steady in Oil and Gas sector and Technology sector as compared to other sectors.
The result of the study have important strategy connotation as they support accepting corporate
governance apply in firms in order to alleviate revenue management. In one more study (Tariq
Aziz - 2017) have investigated about MAX and MIN (maximum daily returns and minimum daily
returns) by providing a few current practical proof viewing the extrapolative aptitude of maximum
daily returns (MAX) in the cross-section of share returns, examine the relationship between
minimum daily returns (MIN) and successive monthly proceeds in the rising share market of
India during the period 1999-2014. In new- fangled study (Dr Gurmeet Singh – 2017) surveyed
for NSE and NIFTY for the period of 2000 to 2014. Applied many tools and techniques ARCH
family models outperform the conventional OLS models, TARCH model, the GARCH, EGARCH
and TARCH models, the GARCH, EGARCH and TARCH models. The precariousness in the
Indian share market demonstrates characteristics analogous to those found earlier in numerous
of the key growth and promising share markets. In different methods applied results indicate the
existence of leverage outcome and positive impact of volatility on returns. In another study (S.
© Faisal, Khan & Abdullah
Licensed under Creative Common Page 1036
Sathyanaraya - 2017) scrutinize the relationship in the midst of a diversity of recognized causes
(Profitability, Tangibility, Growth Rate, Business and etc. choices of principal merchandise,
FMCG, Infrastructure and IT sector in Indian Stock market. The instigator based their study on
secondary data for ten years i.e. 2006 – 2015. On that data they applied various statistical tools
on different industries. Their analysis discovered irregularity in independent variables
manipulates the economic leverage element, although there is numerical bearing for the
proposed grounds with reverence to earnings and augmentation rate persuading the economic
leverage.
RESEARCH GAP
As we researchers were influenced by one book titled „Good to Great‟ published in 2001
authored by Jim Collins as one of the most influential management consultants of his time. As
his studies were restricted in U.S.A. alone where he conducted surveys of many good
companies and identified only eleven companies that emerged as great companies that
sustained its greatness for fifteen years.
So we researchers studied in Indian Market and found many good as well great
companies in different sectors such as Software, FMCG, Consumer Durables, Energy sector
etc. Many companies emerged as great companies on our set parameters in which Hindustan
Unilever Limited from FMCG sector is one of them.
Literature Review is evident that no research has been done on aforementioned area
and there is research gap, therefore, investigators did courage to undertake this topic for
investigation, so, we identified HUL as a great company and tried to rationalize our assortment
on the basis of following criterion mentioned below:-
Market leadership
Market performance (Stock Market )
Financial Reports (Balance Sheet, Dividend History during past five years)
Survey (Primary data questionnaire – closed ended)
WHY HINDUSTAN UNILIVER LIMITED?
Hindustan Uniliver Limited is one of the earnest FMCG companies with heritage of more formed
in the year 1933 under unilever with that controls 67% of the share. The headquarter is based
in Mumbai.
In our hypothesis we‟ve considered that Hindustan Uniliver Limited is a great company in
the perspective of its performance in the stock market also in the context of consumers‟
preferences.

International Journal of Economics, Commerce and Management, United Kingdom
Licensed under Creative Common Page 1037
Our entire study revolves around Hindustan Uniliver Limited and its mainstay competitors in the
closing stages we analyze whether our hypothesis is true or false on the basis of set
parameters.
OBJECTIVE OF THE STUDY
This study comprises of two objectives one is primary and erstwhile is secondary objective.
During our study an attempt has been made being fully unbiased and fully conservative to read
and analyze financial reports and generating financial data on the basis of our findings. During
even recession share prices and market capitalization of HUL didn‟t go declined as compared to
its counterparts. It has diversified brands under its placard and we will try to justify our criteria of
selection. The authors used in this study primary as well as secondary data. Obtained results
from the research questionnaires were analyzed by using Multiple Statistical tools.
Consumers‟ Preferences based on survey and review of primary data
To identify the market position of Hindustan Uniliver Limited
Analyzing core competition
RESEARCH METHODOLOGY
Our research is based on primary as well as secondary data as undermentioned.
Primary Data
Population and Sample
This study population consist of all Indian residing in Jazan, Kingdom of Saudi Arabia. The
questionnaire was distributed to the aforesaid people, whom 150 members representing the
entire research population, the number of received questionnaire which valid for analysis was
137, so the response rate was more than 91% from population‟s study.
Measures
We developed this questionnaire from many validated scales. Some changes were made to fit
for our context. It consisted of 10 items and included 5 items for Personal Care Products, 2
items for Home Care Products and 3 items for Food and Drink Products.
Secondary Data
In our study we have taken FMCG index of BSE that comprises of 10 base companies as on
November, 2017. During analysis it is quite possible that out of FMCG index one or more FMCG
company get converged and become great company provided it should be listed one on the

© Faisal, Khan & Abdullah
Licensed under Creative Common Page 1038
stock exchange. In this research paper we first examine to analyze financial reports of
Hindustan Uniliver Limited and thus make comparative analysis with other FMCG in and out of
index on BSE.
ANALYSIS AND FINDINGS
Analysis Based on Primary Data
In our study we have designed our questionnaire and distributed amongst 150 consumers and
get back 137 respondents. And, preliminary screening reflected some very surprising results
about the preferences of consumers regarding many brands of FMCG companies.
Table 1. Personal Details of the Respondents
Variables Elements Frequency Percentage
Gender
Male 24 17.52
Female 113 82.48
Total 137 100.00
Age
20-30 28 20.44
31-40 56 40.88
41-50 42 30.66
More than 50 11 8.03
Total 137 100.00
Marital Status
Married 108 78.83
Unmarried 29 21.17
Total 137 100.00
Qualifications
Graduates 37 27.01
Post Graduates 53 38.69
Doctorate 41 29.93
None of these 6 4.38
Total 137 100.00
Profession
Job 124 90.51
Business 13 9.49
Student 0 -
None of these 0 -
Total 137 100.00
Brand Loyalty of Products
Yes 97 70.80
No 38 27.74
Can‟t Say 2 1.46
Total 137 100.00

International Journal of Economics, Commerce and Management, United Kingdom
Licensed under Creative Common Page 1039
Frequencies of sample‟s members are outlined in Table - 1, which show 83% of sample are
females, about 39% are middle aged 41-50 years group and 60% are in the young age 20-40
years group. Their marital status almost 79% members are married; their qualifications also
varied from Graduates to Doctorates, 39% of the members are Post Graduates 27% are
Graduates and 30% are holding Doctorate Degree, sample members are mostly in jobs i.e. 91%
very little amount of members are in business i.e. 9%. When we look towards their loyalty of
products we see 71% of sample members are committed with their brands and negligible (1%)
percent of members are confused and 28% they use whatever they get.
Table 2. Personal Care Products
Variables Elements Frequency Percentage
Toothpaste Close-up 58 42.34
Miswak 24 17.52
Colgate 39 28.47
Signal 13 9.49
Other 3 2.19
Total 137 100.00
Mouthwash Colgate 23 16.79
Pepsodent 61 44.53
Listrene 49 35.77
None of these 0 -
Other 4 2.92
Total 137 100.00
Deodorant Nivea 29 21.17
Axe 64 46.72
Adidas 37 27.01
None 2 1.46
Other 5 3.65
Total 137 100.00
Shampoo Dove 79 57.66
Pantene 38 27.74
Head and Shoulders 19 13.87
None 0 -
Other 1 0.73
Total 137 100.00
Talcum powder Pond's 48 35.04
Cinthol 37 27.01
Nycil 42 30.66
None 2 1.46
Other 8 5.84
Total 137 100.00

© Faisal, Khan & Abdullah
Licensed under Creative Common Page 1040
Frequencies of sample‟s members are summarized about the personal care products in Table -
2 which is consist of 5 items (toothpaste, mouthwash, deodorant, shampoo and talcum powder)
which demonstrate that 42% of sample members are using close-up (HUL product), colgate is
28% and 18% miswak that show huge margin among the different toothpaste brands. In
mouthwash about 45% are using Pepsodent (HUL product) the other product very close to it is
Listrene i.e. 36% so here the call is very close. If we see the third product deodorant 47%
sample members are using Axe (HUL product) and the gap is vast with other brands i.e. 27%
Adidas and 21% is Nivea. In forth product – Shampoo more than half of the sample members
(58%) uses Dove (HUL product) the other product i.e. Pentene and Head & Shoulders used by
the members 28% and 14% respectively it depicts mammoth cleft between the distant products
and the last product of this list is talcum powder here the crevice is little between HUL product
(Pond‟s 35%) and others products i.e. Nycil 31% and Cinthol 27%.
Table 3. Home Care Products
Variables Elements Frequency Percentage
Detergent Tide 35 25.55
Surf Excel 46 33.58
Ariel 40 29.20
None 0 -
Other 16 11.68
Total 137 100.00
Dish wash (liquid or bar) Prill 43 31.39
Vim 48 35.04
Lux 39 28.47
None 0 -
Other 7 5.11
Total 137 100.00
Frequencies of sample‟s members are concise about the home care products in Table - 3 which
is made up of 2 items (detergent and dish wash) which express that 34% of sample members
are using Surf Excel (HUL product) and Tide is 26% and 29% Ariel that show petite margin
among the different detergent brands. Same as in dish wash (liquid or bar) about 35% are using
Vim (HUL product) the other product very close to it is Prill i.e. 31% and lux is 38%, so here the
call is very close.

International Journal of Economics, Commerce and Management, United Kingdom
Licensed under Creative Common Page 1041
Table 4. Food and Drink Products
Variables Elements Frequency Percentage
Tea Brooke bond 83 60.58
Yorkshire 35 25.55
Tata 13 9.49
Wagh Bakri 3 2.19
None 3 2.19
Total 137 100.00
Coffee Nescafe 65 47.45
Tata 23 16.79
Bru 48 35.04
None 0 -
Other 1 0.73
Total 137 100.00
Ketchup Heinz 43 31.39
Kisan 48 35.04
Maggie 28 20.44
Saudia 17 12.41
None 1 0.73
Total 137 100.00
Frequencies of sample‟s members are potted about the food and drink products in Table 4
which is based on 3 items (tea, coffee and ketchup) which exhibit that major chunk 61% of
sample members are using Brooke bond (HUL product), Yorkshire is 26% and 9 % Tata that
show huge margin among the different tea brands. In coffee about 47% are using Nescafe, Bru
(HUL product) 35% sample members uses so here case is reverse and Bru is less popular
among sample members. The third product ketchup 35% sample members are using Kissan
(HUL product) and the gap is not vast with other brands i.e. 32% Heinz and 20% is Maggie.
Data Analysis on Secondary Sources
FMCG Index of BSE (As On 27th, Nov, 2017)
1. Colgate Palmolive India Ltd.
2. Dabur India Ltd
3. Tata global
4. Godrej consumer products Ltd.
5. Hindustan Unilever ltd (Mkt. Cap- Rs 273,265.42 crore , CMP(1,263.35), P/E 35.82)
6. ITC ltd (MktCap.-274,464.94, CMP- (343.20) P/E 32.53)
7. Marico Ltd.
8. Nestle India Ltd.
9. United Breweries ltd.
10. United Sprits Ltd.
© Faisal, Khan & Abdullah
Licensed under Creative Common Page 1042
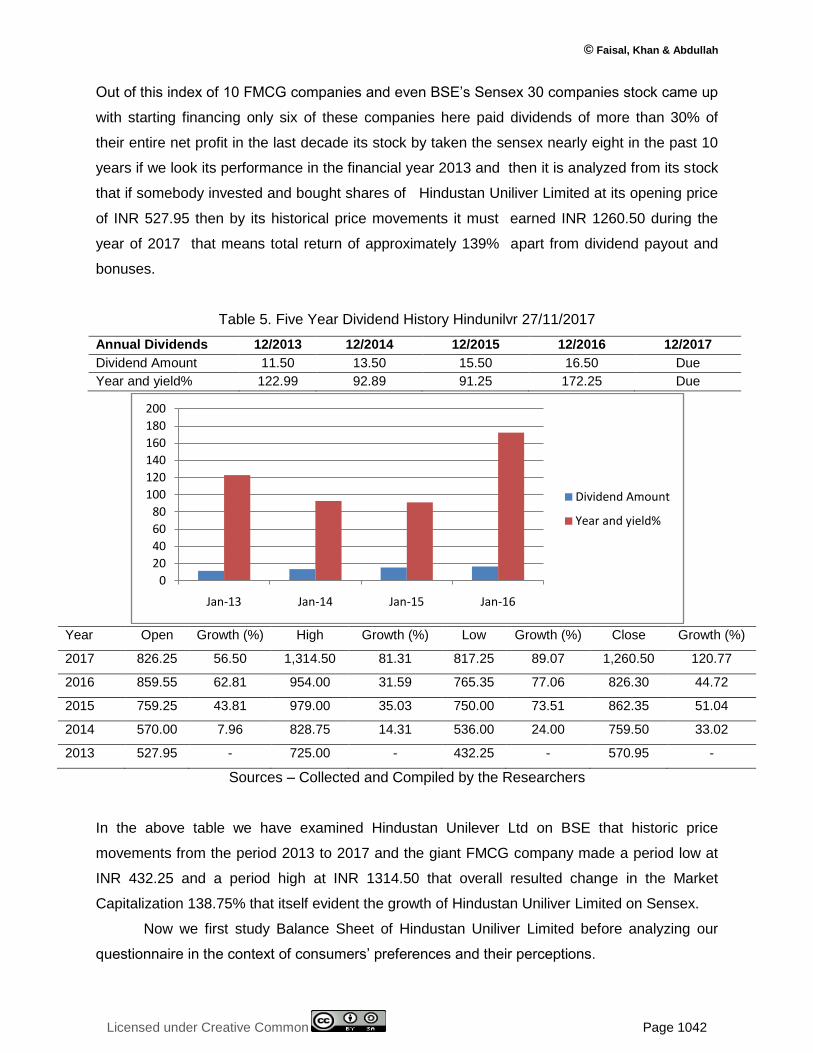
Out of this index of 10 FMCG companies and even BSE‟s Sensex 30 companies stock came up
with starting financing only six of these companies here paid dividends of more than 30% of
their entire net profit in the last decade its stock by taken the sensex nearly eight in the past 10
years if we look its performance in the financial year 2013 and then it is analyzed from its stock
that if somebody invested and bought shares of Hindustan Uniliver Limited at its opening price
of INR 527.95 then by its historical price movements it must earned INR 1260.50 during the
year of 2017 that means total return of approximately 139% apart from dividend payout and
bonuses.
Table 5. Five Year Dividend History Hindunilvr 27/11/2017
Annual Dividends 12/2013 12/2014 12/2015 12/2016 12/2017
Dividend Amount 11.50 13.50 15.50 16.50 Due
Year and yield% 122.99 92.89 91.25 172.25 Due
Year Open Growth (%) High Growth (%) Low Growth (%) Close Growth (%)
2017 826.25 56.50 1,314.50 81.31 817.25 89.07 1,260.50 120.77
2016 859.55 62.81 954.00 31.59 765.35 77.06 826.30 44.72
2015 759.25 43.81 979.00 35.03 750.00 73.51 862.35 51.04
2014 570.00 7.96 828.75 14.31 536.00 24.00 759.50 33.02
2013 527.95 - 725.00 - 432.25 - 570.95 -
Sources – Collected and Compiled by the Researchers
In the above table we have examined Hindustan Unilever Ltd on BSE that historic price
movements from the period 2013 to 2017 and the giant FMCG company made a period low at
INR 432.25 and a period high at INR 1314.50 that overall resulted change in the Market
Capitalization 138.75% that itself evident the growth of Hindustan Uniliver Limited on Sensex.
Now we first study Balance Sheet of Hindustan Uniliver Limited before analyzing our
questionnaire in the context of consumers‟ preferences and their perceptions.
0
20
40
60
80
100
120
140
160
180
200
Jan-13 Jan-14 Jan-15 Jan-16
Dividend Amount
Year and yield%

International Journal of Economics, Commerce and Management, United Kingdom
Licensed under Creative Common Page 1043
As seen in the Balance Sheet it is evident that total share holders‟ funds increased from INR
2,674.02 crore in the year 2013 to INR 6,274 crore in 2017.
Also total non-current as well as current liabilities seen decreased from our periodic
study from 2013 to 2017. Similarly it has witnessed an increase in its current as well as non-
current assets from 2013 to 2017.
Table 6. Balance Sheet as on November 2017
Mar, 2017 Mar,2016 Mar,2015 Mar,2014 Mar,2013
12 mths 12 mths 12 mths 12 mths 12 mths
Equities and liabilities
Shareholder's funds
Equity Share Capital 216.00 216.39 216.35 216.27 216.25
Total Share Capital 216.00 216.39 216.35 216.27 216.25
Revaluation Reserves - 0.67 0.67 0.67 0.67
Reserves and Surplus 6,274.00 3,470.23 3,507.76 3,060.11 2,457.10
Total Reserves and Surplus 6,274.00 3,470.90 3,508.43 3,060.78 2,457.77
Total Share holders’ funds 6,490.00 3,687.29 3,724.78 3,277.05 2,674.02
Non-Current Liabilities
Other Long Term Liabilities 574.00 218.20 170.11 278.82 476.25
Long Term Provisions 485.00 1,124.39 956.35 838.69 706.34
Total Non-Current Liabilities 1,059.00 1,342.59 1,126.46 1,117.51 1,182.59
Current Liabilities
Trade Payables 6,006.00 5,497.89 5,288.90 5,793.89 5,167.69
Other Current Liabilities 809.00 853.79 908.05 852.94 616.15
Short Term Provisions 387.00 2,785.47 2,585.87 1,957.01 1,872.02
Total Current Liabilities 7,202.00 9,137.15 8,782.82 8,603.84 7,655.86
Total Capital And Liabilities 14,751.00 14,167.03 13,634.06 12,998.40 11,512.47
ASSETS
Non-Current Assets
Tangible Assets 3,654.00 2,902.73 2,435.50 2,397.94 2,256.79
Intangible Assets 370.00 12.00 22.03 24.12 36.11
Capital Work-In-Progress 203.00 385.97 479.01 312.08 205.32
Intangible Assets Under Development - - - 7.70 10.32
Fixed Assets 4,227.00 3,300.70 2,936.54 2,741.84 2,508.54
Non-Current Investments 260.00 669.03 654.11 636.17 548.03
Deferred Tax Assets [Net] 160.00 230.86 195.96 161.73 204.78

© Faisal, Khan & Abdullah
Licensed under Creative Common Page 1044
Long Term Loans And Advances 623.00 581.30 583.46 605.51 384.29
Other Non-Current Assets 70.00 0.17 0.44 0.68 296.84
Total Non-Current Assets 5,340.00 4,782.06 4,370.51 4,145.93 3,942.48
Current Assets
Current Investments 3,519.00 2,297.52 2,623.82 2,457.95 1,782.63
Invent*ories 2,362.00 2,528.36 2,602.68 2,747.53 2,526.99
Trade Receivables 928.00 2,758.82 782.94 816.43 833.48
Cash And Cash Equivalents 1,671.00 1,064.52 2,537.56 2,220.97 1,707.89
306.00 673.29 657.27 537.68 648.26
Short Term Loans And Advances
Other Current Assets 625.00 62.46 59.28 71.91 70.74
Total Current Assets 9,411.00 9,384.97 9,263.55 8,852.47 7,569.99
Total Assets 14,751.00 14,167.03 13,634.06 12,998.40 11,512.47
Sources – Collected and Compiled by the Researchers
In our questionnaire we will observe category wise analysis and draw our conclusion. Since to
make our study not too complex and obstruct we will pick some indispensable segments and
not all. Also we will do competitive analysis of our selected grand company Hindustan Uniliver
Limited and its rivals in the fragment of FMCG. For the competitive analysis with Hindustan
Uniliver Limited, we have taken FMCG index of BSE. Apart from this index of ten companies
some may emerge on the basis of our market review. Below are the competitors of Hindustan
Uniliver Limited both from the FMCG index (Nov, 27, 2017) and on the basis of market survey:
1. ITC
2. Nirma
3. Emami
4. Nestle
5. Marico
6. Dabur
7. Godrej
8. Henkel
9. Colgate Palmolive
10. Jyothy Lab
11. Reckit Benckiser
12. Proctor & Gamble
13. L‟Oreal

International Journal of Economics, Commerce and Management, United Kingdom
Licensed under Creative Common Page 1045
On the basis of market survey and secondary data, four companies emerged as top rivals of
Hindustan Uniliver Limited in terms of products segmentation, market capitalisation, Earning Per
Share, dividend payout, bonuses and quality of the product.
1. ITC
2. Dabur
3. Godrej
4. P&G
CONCLUSION
On the basis of our entire study based on primary as well as secondary data, it was analysed in
FMCG sector Hindustan Uniliver Limited holds either top position or giving very close
competition to many other brands of FMCG products of different companies. It is also analyzed
on the basis of secondary data that Hindustan Uniliver Limited is considered very reputed
company listed on BSE and NSE. Since we were closely monitoring BSE since 2008 therefore
we analyzed that Unilever maintained its place and consistency and maintained its blue chip
status at BSE and placed in SENSEX-30. It is evident that the current market price of the share
is moderately reaching further new heights and expected to cross its present value soon.
It is also analyzed that because of its dividend policies and wealth maximization policies
showing largest market capitalization reflected in our study. That is why Hindustan Uniliver
Limited is considered not only a good reputed company but considered as great company in
FMCG sector not only in Indian market but also in middle east(Saudi Arabia) as found during
our research based study.
LIMITATIONS OF THE STUDY
We researchers tried to do justice in order to accomplish our objectives but still there were some
restrictions and limitations as our study of HUL (Indian Multinational) was confined to Jazan
(upcoming city) which is in South of Saudi Arabia, where exposure to Indian community is
limited in terms of:
horizon of our population of study is narrowed.
majority of Indian community is working as labourers therefore less brand conscious.
due to paucity of time researchers applied only traditional statistical tools.

© Faisal, Khan & Abdullah
Licensed under Creative Common Page 1046
REFERENCES
Amit Kumar Singh, Annu Aggarwal, Ashween Kaur Anand, 2017, The Impact of Corporate Governance Mechanisms on Earnings Management: A Case Study of Indian Stock Exchange Listed Companies, Asia-Pacific Journal of Management Research and Innovation, https://doi.org/10.1177/2319510X17725982.
Chandrasekhar, B. V. N. G. (2012), “Consumer buying behaviour and brand loyalty in rural markets: FMCG”, IOSR Journal of Business and Management, Vol. 3, Issue 2, pp. 50-67.
Dr Gurmeet Singh, 2017, Time Varying Volatility in the Stock Market, SSRN, 21-38, https://ssrn.com/abstract=2979115.
Franco-Laverde, J., Littlewood, A., Ellis, C., Schraner, I., and Varua, M-E, (2012), “FMCG portfolio budget allocation to price promotions using modern portfolio theory”, International Review of Business Research Papers, Vol. 8, No. 5, pp. 16-30.
Gautam, N., and Gangal, V. K. (2011), “Consumers‟ preference for FMCG products in rural India: a comparative study of Hindustan Uniliver Limited & ITC”, APOTHEOSIS: Tirpude‟s National Journal of Business Research, Vol. 2, Issue 1, pp. 115-123.
Jain, A., and Sharma, M. (2012), “Brand awareness and customer preferences for FMCG products in rural market: an empirical study on the rural market of Garhwal region”, VSRD International Journal of Business & Management Research, Vol. 2, No. 8, pp. 434-443.
Jayswal, M., and Shah, K. (2012), “A study of effect of negative emotional appeals on cognitive message processing style of Indian house wives with specific focus on FMCG product‟s television advertisements”, Asian Journal of Research in Business Economics and Management, Vol. 2, Issue 3, pp. 58-72.
Kundu, Surinder Singh and Kumar, Vinod (2013). Modes of Advertisements Used by Rural Populace: An Empirical Study, In Kundu, Subash C., Punia, Bijender K., Shabnam Saxena, Suresh K. Mittal and Anjali Gupta (Eds.), Researches in Business and Management–Academic and Professional Perspective, Delhi: Wisdom Publications, p. 404.
Malhotra, Naresh K. and Dash, Satyabhusan. Marketing Research-An Applied Orientation. 6th (New Delhi: Pearson Education, Inc. 2010), pp. 591-601.
Mishra, U. S., Das, J. R., Mishra, B. B. and Mishra, P. (2012), “Perceived benefit analysis of sales promotion: a case of consumer durables”, International Research Journal of Finance and Economics, Issue 98, pp. 145-154.
Prajapati, S. and Thakor, M. (2012), “Competitive and innovative promotional tools used by toothpaste companies for rural market and its impact on consumer buying behavior in Gujarat”, International Referred Research Journal, Vol. 3, Issue 3(2), pp. 82-86.
Ranu, G., and Rishu, R. (2012), “Ingredient branding: a differentiation strategy for FMCG companies”, Asian Journal of Management Research, Vol. 2, Issue 2, pp. 761-768.
Richa Vij, 2017, Impact of M&A Announcement on Stock Returns of Acquirer Companies: New Evidence from Indian Stock Market, World Journal of Business and Management, 86-101, https://doi.org/10.5296/wjbm.v3i1.11248.
S. Sathyanaraya, S. N. Harish, Hemanth Kumar, 2017, Determinants of Capital Structure: Evidence from Indian Stock Market with Special Reference to Capital Goods, FMCG, Infrastructure and IT Sector, SDMIMD Journal of Management, 55-73, DOI:10.18311/sdmimd/2017/15725.
Sridhar, G., and Mishra, D. (2010), “Executives social representation of rurality and product adaptation: a case of rural markets in India”, APJML, Vol. 23, No. 3, pp. 285-303.
Srinivastava, T N and Rego, Sahilaja. Business Research Methodology. 1st ed., New Delhi: Tata McGraw Hill Education Private Limited. 2011, pp. 14.66-14.86.
Tariq Aziz and Valeed Ansari, 2017, Are extreme negative returns priced in the Indian stock market?, ScienceDirect, https://doi.org/10.1016/j.bir.2017.09.002.