an investigation of factors influencing the productivity
TRANSCRIPT

AN ABSTRACT OF THE THESIS OF
William Thomas Sharp for the degree of Doctor of Philosophy
in Pharmacy presented on June 1, 1979
Title: An Investigation of Factors Influencing the Productivity of
Pharmacists in Community Pharmac*cs
Abstract approved:
Redacted for privacyLee Strandberg, Ph.D.
Redacted for privacyRobert W. Sager, Ph.".
This study sampled the work activities of community pharmacists in
eighteen western Oregon pharmacies (9 chain and 9 independent, strati-
fied by daily prescription volume). Utilizing a technique of recording
at least 960 observations in each pharmacy, a total of 41,542 observa-
tions were recorded into 28 mutually exclusive task activity categories.
The sampling process provided a data base for productivity outputs in
prescriptions per pharmacist per hour.
The primary objective of this study was to identify the relation-
ships of input factors in the community pharmacy prescription processing
function with observed levels of productivity (outputs) in different
sizes and types of pharmacies. Multiple regression was utilized to
examine possible relationships of inputs with the productivity outputs
measured in prescriptions per pharmacist per hour.
Five hypotheses were developed and tested, including one hypothesis
which suggested a positive relationship with an increase in productivity
and the utilization of subprofessionals in the prescription procesing
function. In addition to testing the hypotheses, the costs were exam-
ined of several specified services (third-party clerical activities,
clerical activities concerning patient profiles and clerical activities
involving written customer receipts).
Finally, models were developed which could be utilized to predict
the influence of independent variables upon the cost of pharmacist labor
in the prescription processing function. Two predictive models were
developed which provided r2values greater than 0.78.

) 1979
WILLIAM THOMAS SHARP
ALL RIGHTS RESERVED

An Investigation of Factors Influencing theProductivity of Pharmacists in
Community Pharmacies
by
William Thomas Sharp
A THESIS
submitted to
Oregon State University
in partial fulfillment ofthe requirements for the
degree of
Doctor of Philosophy
Completed (June 1, 1979)
Commencement June 1980

APPROVED:
Redacted for privacyfrofeisor of Pharmacy in charO/of major
Redacted for privacyProfessor 61 Pharmacy in charge ofIa4Dik.
Redacted for privacyHead of Department of Pharmacy
Redacted for privacyDean of Graduate School
Date thesis is presented June 1, 1979
Typed by Kay Hepworth for William Thomas Sharp
ACKNOWLEDGEMENTS
I am deeply indebted to a number of people and organizations whose
help, encouragement and expertise made this study possible.
First, I would like to express my appreciation to the professors who
helped to guide me in the direction of conducting scholarly research.
Without the guidance of my major professors, Dr. Lee R. Strandberg and
Dr. Robert W. Sager, this study could not have been completed. My
appreciation is also expressed to Dr. James L. Riggs who helped me to
develop the general methodology and the data recording methods used in
this research. I would also like to express my appreciation to the
other members of my committee, Dr. Murray Wolfson, Dr. Eugene Abrassart
and Dr. Peter Freeman for the time they spent in reading and discussing
this research.
Dean Frank Cosgrove of the Idaho State University College of
Pharmacy, Dean Richard Ohvall of the Oregon State University School of
Pharmacy and Dean emeritus Charles 0. Wilson provided encouragement
during the course of this study. I wish to express my most sincere
appreciation to these deans for their support during the course of this
dissertation.
The advice and assistance on the multivariate statistical
procedures provided by Dr. Kenneth E. Rowe of the Oregon State
University Statistics Department and by doctoral candidate, Doug Henry
of the Oregon State University College of Pharmacy, is gratefully
acknowledged.
I would like to acknowledge the Oregon State Board of Pharmacy,
particularly their past executive officer A.G. "Mike" McLain, for
providing a list of Oregon licensed pharmacies. I would also like to
express my gratitude to the pharmacists and pharmacy organizations
that permitted me to make observations during the study.
Financial assistance provided through a 1974-1975 fellowship from
the American Foundation for Pharmaceutical Education permitted me with the
ability to collect data for this research. A grant from the Oregon
State University Computer Science Department provided me with funds to
analyze this study. Assistance from both of these organizations is
gratefully acknowledged.
Deepest appreciation goes to my wife, "Betta," for her never-ending
patience and encouragement, and to my children for their understanding
of the time involved in this study. Finally, I would like to express
my deep appreciation to my parents for teaching me the attribute of
not quitting when the task becomes difficult.

TABLE OF CONTENTS
I. Introduction 1
Alternative One 1
Alternative Two 2
Alternative Three 5
Summary and Implications 6
Problem Statement 7
II. Roles of the Pharmacist 8
Changing Roles of the Pharmacist 8
Environmental Influence on the Pharmacist's Role 13
Demand and Influence of Pharmacy Size 16
Summary and Implications 16
III. Literature Review and Research Questions 19
Size Influences 21
Question One 22
Question Two 22
Question Three 23
Capital Influences 23
Question Four 24
Service Influences 25
Question Five 26
Question Five A 26
Question Five B 27
Question Five C 27
IV. Methodology 29
Objectives 29
Work Measurement 29
Activities of the Pharmacist 31
Sample Selection 32
Selection and Stratification of Pharmacies 32
Observations 33
Limitations of the Study 35
Data Analyses 36
Hypotheses 36
V. Results 39
Data Sources and Work Categories 39
Sample Size 43
Comparison of All Activities by Size 47
Comparison of All Activities by Type 51
Prescription Activities by Type and Size 54
Comparison of Prescription Activities by Size 56
Comparison of Prescription Activities by Type 58
Productivity Rates of Pharmacists 62
Factors Influencing Productivity 64
Research Questions 67
Influence of Services on Productivity 80
Third-Party Prescriptions 82
Patient Profiles 86
Financial Records 94
VI. Discussion 100
Comparison with Other Research 100
Influence of Subprofessional on Costs 105
Pharmacy Type 113
Predictive Model for Labor Costs 115
VII. Sulaulary and Conclusions 122
S uninia ry 122
Conclusions and Recommendations 125
Applications of this Research 125
LIST OF ILLUSTRATIONS
Figure Page
1 Comparison of Y2 productivity with the dailyprescription dispensing rates 68
2 Comparison of Y2 productivity with daily prescriptiondispensing rate in chain pharmacies 71
3 Comparison of Y2 productivity with daily prescriptiondispensing rate in independent pharmacies 72
LIST OF TABLES
Table Page
1 Summary titles of task categories 41
2 Observations in task categories 42
3 Pharmacy characteristics 44
4 Observations by type and size of pharmacy 45
5 Comparing work activities of the same pharmacist on twodifferent days 47
6 Combined task category activities 49
7 Percent of time engaged in combined activities bypharmacy size 50
8 Percent of time engaged in all task categories bypharmacy size 52
9 Percent of time engaged in combined activities bypharmacy size 53
10 Percent of time engaged in all task categories bypharmacy type 55
11 Prescription activities as a percent of all activitiesby type and size of pharmacy 57
12 Percent of time engaged in combined prescriptionactivities by pharmacy size 57
13 Percent of time engaged in all prescription activitiesby pharmacy size 59
14 Percent of time engaged in combined prescriptionactivities by pharmacy type 60
15 Percent of time engaged in all prescription activitiesby pharmacy type 61
16 Productivity rates in prescriptions per pharmacistper hour 65
17 Summary comparison of prescription volume withproductivity rates 69

LIST OF TABLES (continued)
Table
18 Summary comparison ofproductivity rates
19 Summary comparison ofproductivity rates
the nonprofessional with
size variables with
20 Summary comparison ofrates
equipment with productivity
21 Sampling days by pharmacy
Page
75
78
81
85
22 Characteristics of pharmacies providing third-partyclerical activities 87
23 Characteristics of pharmacies offering patient profiles . . . 89
24 Characteristics of pharmacies utilizing nonprofessionalsto provide patient profiles 91
25 Characteristics of pharmacies utilizing only pharmacists toprovide patient profiles 93
26 Characteristics of pharmacies providing monetary receiptswith prescriptions 95
27 Characteristics of pharmacies utilizing only pharmaciststo provide monetary receipts 98
28 Comparison of activities with the results of Rodowskasand Dickson 101
29 Comparison of activities with the results of Ryanand Smith 106
30 Characteristics of pharmacies utilizing only pharmacistsin the prescription processing area 108
31 Characteristics of pharmacies utilizing nonpharmacists inthe prescription processing area 110
32 Summary comparison of Y2 dependent variable withstepwise regression 114
33 Prediction of prescriptions per pharmacist per hour bytype and size of pharmacy 118
34 Estimated influence that variables Xl, X2, and X3 woulddecrease the pharmacist wages per prescription 120
AN INVESTIGATION OF FACTORS INFLUENCING THE PRODUCTIVITY
OF PHARMACISTS IN COMMUNITY PHARMACIES
INTRODUCTION
The complexity of the medical care labor force in the United States
is of great concern to the delivery of medical care. A lack of quali-
fied professional manpower in the medical care delivery system has been
suggested as a contributory factor to the "crisis" in our medical care.
Various alternatives to the professional manpower problem have been
suggested. In an approach to possible alleviation of this problem, three
general alternatives may be considered:
1. Increase the size of the professional manpower pool.
2. Provide more efficient utilization of the existing professional
personnel.
3. Do nothing and/or provide lower standards of medical care.
Alternative One
The first suggested alternative of increasing the supply of profes-
sional medical care personnel has been partially accomplished by imple-
mentation of the Health Professions Educational Assistance Amendments
of 1965 (PL 89-290). This legislation and subsequent acts have appar-
ently served to increase the number of health professionals by providing
direct financial assistance to schools producing medical care personnel.
The Health Manpower Act of 1968 (PL 90-490) and the Comprehensive Health
Manpower Training Act of 1971 (PL 92-157) provided financial incentives
to increase health manpower in funding schools of dentistry, medicine,
osteopathy, pharmacy, optometry, podiatry, and veterinary medicine.
2
Increased enrollment since the inception of capitation funding may be
illustrated by an increase in first year medical students from approxi-
mately 10,000 in 1969 to nearly 14,000 in 1973 (Sprague, 1974). Pharm-
acy school enrollments (final three years) increased from 15,326 in the
year 1970 to 23,884 in the year 1977. (Schools Report Modest Enrollment
Decline, 1978).
Increasing the supply of medical professionals is not, however, a
panacea to the manpower problem in the practice of pharmacy. If the
supply of practitioners continues to increase in the long run, addition-
al resources must be allocated to preparing this new manpower pool. The
cost of additional allocations for new facilities, equipment, supplies,
and faculty must necessarily be passed on to consumers of medical care
who have seen the cost of medical care rise from 4.5 percent of the
gross national product in.1955 to 8.6 percent in 1976. (Gibson and
Mueller, 1977).
Alternative Two
If greater productivity could be obtained from medical care profes-
sionals, then serious consideration must be given to the second alterna-
tive, ie. providing more efficient utilization of existing professional
personnel. In economic terminology, a factor of labor substitution may
be utilized in a production function when one input factor is substitu-
ted for another. This substitution process may, if organized properly,
result in increased productivity. Labor substitution may be applied to
the production of health services by substituting nonprofessionals (sub-
professionals) for various routine tasks which do not require the educa-
tional backgrounds of professionals. For example, in studying the work
3
functions of pediatricians, Bergman et. al. (1966) indicated that only
48 percent of the total work day was spent with patients. Recently,
society has become more aware of the possible advantages to substitute
nonprofessional labor, as evidenced by the increasing number of states
which have changed their legal structure to accomodate the utilization
of physician assistants.1
It is apparent that pharmacy should also examine the services of
nonprofessionals to perform routine tasks. The practice of pharmacy
providing prescribed medication is a significant cost in medical care.
Approximately ten percent of the 1976 aggregate health care expenditures
in the United States was made for drugs (Gibson and Mueller, 1977).
Although the dispensing of prescription medication involves both regis-
tered pharmacists and nonprofessionals, not all pharmacies utilize both
personnel categories in the drug distribution process. The employment
of nonprofessionals in the United States has not been as well developed
as in various other countries. A special professional Task Force exam-
ining rules of pharmacists indicated:
that the average American pharmacist may be unusual ifnot unique among university-educated professions in the pro-portion of his efforts invested in functions perhaps not de-manding a professional level of knowledge and skill. (Report
of the Task Force, 1969).
This Task Force suggested the utilization of pharmacy personnel in three
broad categories: (1) tasks that only a pharmacist should perform,
(2) tasks that a nonpharmacist may perform with a minimum level of con-
1Forty-two states had enacted legislation pertaining to physician
assistants by the end of 1977 (Physician's Assistants, 1978).

4
trol from the pharmacist and (3) tasks performed by a nonpharmacist with
procedures explicitly defined by and personally controlled by a pharma-
cist. Thus, the concept of utilizing nonprofessionals to perform spe-
cialized tasks of pharmacists has been recognized among professional
organizations representing pharmacy. Further, it has been indicated
that pharmacists involved in the environment of small hospitals and
chain stores performed a variety of tasks which may not require the
pharmacist's educational expertise (Barker, 1971 and Rodowskas and
Dickson, n.d.).
Understandably, it must be realized that a pharmacist is not a
divisible unit of production. The fulltime services of a pharmacist may
be necessary to comply with the statutes in many states which require a
pharmacist to be on duty during the hours when a pharmacy is open to the
public. Although a pharmacist may be required to be physically present
in an operating pharmacy, the fulltime services of the pharmacist may or
may not be necessary for the level of professional services in a pre-
scription processing function. In addition, a uniform demand for a
pharmacist's professional services would not be expected throughout an
average working day, as the pharmacist does not have an opportunity to
schedule the public's demand for professional services. Thus, there
appears to be a variety of reasons that pharmacists become involved in
tasks which do not utilize their educational background.
In contrast, there is also evidence that pharmacists in certain
pharmacy organizations utilize the services of nonprofessionals and the
substitution of other inputs to achieve relatively high rates of produc-
tivity. For example, McCaffree and Newman (1968) reported that 16
5
pharmacists and 30 nonprofessionals were employed to provide prescrip-
tion services to 95,000 enrollees in a prepaid group medical program.
This ratio of approximately 17 pharmacists per 100,000 enrollees may be
compared with a ratio of 79.4 pharmacists per 100,000 population in the
State of Washington where the drug system was located (National Associa-
tion, 1968). McCaffree and Newman (1968) indicated managerial influ-
ences such as a drug formulary, administrative controls, and certain
economies of size were key characteristics of the drug program. There
are numerous situations in which pharmacies have demonstrated sharp in-
creases in productivity. For example, one pharmacist displayed a pre-
scription processing technique "which enables him to fill 400 Rxs in 8
hours" (What Top, 1973). This latter pharmacy utilized an electronic
tablet counter, a specialized drug storage retrieval unit and a prepack-
aging process. Thus, the relatively high rate of productivity appears
to result from either labor specialization, technological advantages, or
a combination of these two factors.
Alternative Three
The third suggested alternate solution to the professional manpower
problem must be considered as unacceptable because other alternatives
offer the possibility of lowering the cost of medical care without lower-
ing the standards of medical care. A White Paper (1971) on health poli-
cy suggested that innovation and reform of the medical care delivery
system may provide the same or better quality of medical services while
utilizing a smaller complement of medical care professionals. Thus, it
would be untenable to not make changes in the medical care delivery sys-
tem or to provide lower standards of medical care at lower costs when it
6
may be possible to lower the cost of medical care and concurrently im-
prove the quality.
Summary and Implications
It appears that the quantity and utilization of professional man-
power is of great consequence to the cost and delivery of medical care
in the United States. Pharmacy, as an essential element of the contem-
porary medical care delivery system, appears to offer potential alterna-
tives for improving its manpower problems.
Three basic alternatives were considered as potential solutions to
improving manpower problems in the delivery of pharmaceutical services.
The first alternative suggested an increase in the size of the profes-
sional manpower complement. This alternative, being attempted at the
present time, has provided federally funded financial incentives to
pharmacy schools and other specified health related educational institu-
tions which meet minimum enrollment requirements. Alternative number
two suggested that an increase in the productivity rate of medical care
professionals may be accomplished by utilizing both professionals and
nonprofessionals in the delivery of medical care and pharmaceutical ser-
vices.
The third alternative suggested not making any changes in the pro-
fessional manpower complement, or possibly lowering the standards for
the recipients of pharmaceutical services. This final alternative was
rejected since it appears to be possible to introduce change into the
system and thereby lower costs without an apparent influence in the
effectiveness of medical care and pharmaceutical services. Thus, the
second alternative pointed out an opportunity to examine the potential

7
of lowering costs in the prescription processing function, improving the
system or both.
Problem Statement
Several studies2have examined the utilization of pharmacists and
the potential utilization of nonprofessionals within a relatively homo-
genous environment. However, the nature and extent of the relationships
existing with varying types and quantities of inputs in the prescription
processing function have not been investigated.
This study provides information on the utilization of professional
time and productivity under varying work levels and in contrasting organ-
izations. Utilizing work sampling, pharmacists employed in the pre-
scription processing function were observed for the nature and quantity
of their activities under actual working conditions.
2Studies investigating pharmacist work activities have been com-
pleted by Barker (1971), Rodowskas and Dickson (n.d.), Linn and Davis(1971) and Rodowskas and Gagnon (1972). Ryan and Smith (n.d.).
8
CHAPTER II
ROLES OF THE PHARMACIST
It is the purpose of this chapter to examine some major roles of
the community pharmacist in the drug distribution process and to inves-
tigate possible factors that may influence present and projected roles
of the pharmacist practitioner. For this reason, it is imperative to
examine not only specific roles of the pharmacist, but also to investi-
gate environmental factors influencing pharmacy and the expected demand
for prescribed medication.
Changing Roles of the Pharmacist
The function of the pharmacist has been characterized succinctly by
Dr. Donald C. Brodie (1966) as drug use control. Drug use control in-
cludes " the sum total of knowledge, understanding, judgment, pro-
cedures, skills, control and ethics that assure optimal safety and
effectiveness in the distribution and use of medication." Thus, drug
use control goes beyond the dispensing of prescriptions and suggests the
role of the pharmacist should be expanded beyond the distributive func-
tions.
A pharmacist's role is constrained by the legal environment which
may restrict certain practices to only licensed pharmacists. An Oregon
statute indicates the "practice of pharmacy"
means the art of preparing, compounding and dispensing of drugs
and medicines, whether dispensed on the prescription of alicensed medical practitioner or lawfully dispensed and soldto the ultimate consumer, or any other act incidental to such
preparing, compounding or dispensing but does not includemanufacturing of drugs or medicines or the wholesale of drugsor medicines (ORS 689.010 (19)).
9
Except as provided for pharmacy interns or physicians and agents of phy-
sicians, the practice of pharmacy in Oregon is limited to licensed phar-
macists (ORS 689.110(1) and ORS 689.160). Although Oregon laws do not
permit the nonprofessional to prepare any part of the prescription, a
nonpharmacist is permitted to work in the prescription department and
perform a variety of nondispensing activities. Appendix A provides
recommendations from the Oregon Board of Pharmacy for work activities of
non-licensed persons.
The terms "practice of pharmacy" and "dispensing" are commonly de-
fined by the laws of the state. For this reason, these terms do not
have a universal definition, but they may vary among different states.
Because the terms lack a universal definition, and the definition of
"drug use control" is relatively nondescriptive of the functions in-
volved, the term "prescription processing function" will be utilized.
For the purpose of this study, the term prescription processing function
may be articulated as the procedures necessary to label and containerize
prescription medication, clerical and communicative functions which are
involved in receiving the medication order or consummating the final
sales transaction and other supportive types of functions, such as order-
ing, pricing. It also includes placing merchandise or empty containers
in the prescription processing area. In order to examine the time spent
in various work activities of the prescription processing function,
these work activities were categorized into 28 mutually exclusive acti-
vities listed in Appendix B.
The prescription processing function may vary considerably from
pharmacy to pharmacy, possibly influencing input processes (e.g. the

10
functions of a subprofessional or the percent of time spent in communi-
cative activities by pharmacists). Output processes may also vary among
pharmacies providing a difference in the quality of the product received.
Although there are no standard definitions of quality for prescription
services, quality attributes may be defined for a given study. For
example, Jang (1971) defined quality and examined the differences in the
quality of prescription services that were provided by two contrasting
pharmacist input systems--pharmacists in poverty areas and pharmacists
in non-poverty areas. Although the quality of pharmaceutical services
may vary, the laws controlling the distribution of prescribed medicine
provide for a minimum level of quality criteria within a state. For
example, legal criteria are indicated for labeling of prescriptions,
nonsubstitution of a trademarked name, and the professional qualifica-
tions for licensed pharmacists. Prescription services being provided
beyond minimum legal requirements are at the option of the individual
pharmacy or pharmacist. However, the public could receive higher qual-
ity standards if such standards were imposed by law upon all providers.
Recently, several states have examined quality criteria in the dispens-
ing process and have increased the minimum legal requirements. On April
1, 1972, the New Jersey Board of Pharmacy promulgated a regulation re-
quiring a "patient profile record system" (Patient Profile Record System,
1972). The Washington State Board of Pharmacy indicated that a pharm-
cist is required to provide oral and/or written directions to patients
with new prescriptions "to assure the proper utilization of the medica-
tion prescribed" (Washington, 1974). It must be recognized that addi-
tional quality requirements which have been implemented as minimum legal
11
requirements would be expected to result in additional tasks during the
drug distribution process. Such additional prescription processing
tasks may be normally completed by either the pharmacist or his (her)
surrogate.
In addition to traditional drug distribution roles, pharmacy and
health planners have been investigating and attempting to develop a cli-
nical role for the pharmacist. Clinical pharmacy, according to Provost
(1972), "means many things to many people, and any definition at this
time lies in the eyes of the beholder or individual practitioner."
Although the clinical role lacks precise definition, efforts have been
conducted to investigate possible functions of the pharmacist in a cli-
nical situation. In 1971, the National Center for Health Research and
Development presented a Report of a Task Force on the Pharmacist's
Clinical Role (1971). This task force report examined arbitrary classi-
fications of functions that a pharmacist might be expected to perform
in a clinical role. These functions were discussed under the following
seven headings:
A. Prescribed Drugs.B. Dispensing and Administering Drugs.
C. Documenting Professional Activities.
D. Direct Patient Involvement.E. Reviewing Drug Utilization.F. Education.G. Consultation.
These seven functions suggested that a clinical pharmacist would be per-
forming many activities in addition to drug distribution functions.
Such increased activities imply an increase in the demand for pharma-
cists or nonprofessionals.
With new roles being proposed for pharmacists, many questions may

12
be raised concerning the level of experience and training of the person-
nel being utilized to provide many traditional pharmaceutical services.
Franke (1972) stated: "Every industrialized nation in the world, except
the United States, has specially educated and trained technicians to do
what most pharmacists in America do." This problem of pharmacist role
has been investigated by health and pharmacy planners and recommenda-
tions have been made to expand the role of nonprofessionals in pharmacy.
The Final Report Task Force on Prescription Drugs (1969) indicated
that pharmacy should study its manpower requirements more closely when
it recommended:
7. The Bureau of Health Manpower should support-(a) The development of a pharmacist aide curriculum injunior colleges and other educational institutions.(b) The development of appropriate curricula in medicaland pharmacy schools for training pharmacists to serve asdrug information specialists on the health term.(c) A broad study of present and future requirements inpharmacy, adequacy of current pharmacy education, and theeducational changes which must be made.
This report was followed by a special pharmacy Task Force report on the
Practitioner's and Subprofessional's Roles in Pharmacy (1969). The Task
Force report, arising from a conference involving executive officers of
four pharmacy organizations,3recommended that task categories should be
shared by professionals and nonprofessionals. Certain task categories
were recommended to be performed by pharmacists, certain task categories
to be performed by nonpharmacists under the supervision of a pharmacist,
and other task categories to be performed independently by nonpharma-
3American Association of Colleges of Pharmacy, National Association
of Boards of Pharmacy, American Pharmaceutical Association, and AmericanSociety of Hospital Pharmacists.
13
cists. Since the completion of these two task force reports, studies by
Barker (1971) and Rodowskas and Dickson (n.d.) have indicated that an
opportunity exists for many routine functions to be fulfilled by non-
pharmacists primarily in the drug distribution process.
Environmental Influence on the Pharmacist's Role
For many years, the independent community pharmacy has been a domi-
nant structure of drug distribution in the United States. In 1967, this
segment of the retail pharmacy market dispensed 89 percent ($2,903,288,-
000) of the prescription dollar volume for community pharmacies (The
1969 Prescription, 1970). More recently, the domination of the prescrip-
tion market by independent pharmacies has been changing rapidly, because
the chain store segment of the market has been receiving an increasingly
larger proportion of the total prescription market. Between 1967 and
1973, independent community pharmacies had increased total prescription
sales to $4,795,548,000 but their share of the $6,202,702,000 total com-
munity pharmacy prescription market in 1973 had decreased to 77 percent,
thus, losing 12 percent of the market share to drug chains (Complete
Findings, 1974, and Third Party Rx Ratio Drugs for the First Time, 1978).
While it may be difficult to distinguish productivity rate differ-
ences between chains and independents, differences are apparently re-
lated to the volume of prescriptions dispensed within certain classes of
pharmacies. The NACDS-Lilly Digest (1972) suggests that productivity
increases as the average daily output of prescriptions increases. At
least one chain organization has attempted to increase productivity
rates by eliminating pharmacy departments in low volume outlets and de-

14
creasing the hours of prescription services in other outlets, with the
total effect resulting in a smaller number of pharmacists and hopefully
a higher level of productivity. (Thrifty, 1973.)
The health maintenance organization (HMO), gaining prominence in the
health care delivery system, has been predicted to become more influen-
tial in the drug distribution system. By the end of the 1970's it was
the goal of the Nixon Administration "to have a sufficient number of
HMO's to enroll 90 percent of the population, if they desire to enroll."
(Towards a Comprehensive Health Policy, 1971). Prototypes of HMO's sug-
gest that these institutions may lead to decreased utilization of pharma-
cists. In a survey of HMO prototype drug distribution systems, Johnson
and Campbell (1973) reported a relatively efficient pharmacist labor
productivity rate for several centralized systems. Provost (1973) indi-
cated the data from this study extrapolated to the entire United States
would suggest that " the country could be served by less than 37,000
pharmacists working in about 12,000 locations." Thus, environment appar-
ently provides a significant influence to the pharmacist's role and re-
sulting productivity.
Legal constraints also may influence the environment where pharmacy
is practiced. Most states have laws similar to the State of Oregon in
which a statute requires a pharmacist to be present and in active per-
sonal charge of the pharmacy during the hours of operation (ORS 689.
110(2b)). This type of legislation apparently produces an artificial
increase in the demand for pharmacists and a decrease in productivity,
as the services of a pharmacist would be required even when prescriptions
are not demanded by pharmacy patrons.
15
The right of a state to restrict the ownership of a pharmacy to
registered pharmacists may influence the practice of pharmacy, since
pharmacy owners conduct their practice in a different environment than
chain pharmacies. The 1928 Liggett decision of the United States Sup-
reme Court indicated that states could not restrict the ownership of a
pharmacy to pharmacists. However, in December, 1973, the Supreme Court
over-ruled the Liggett decision, indicating that it would be permissable
for states to restrict the ownership of a pharmacy to a registered phar-
macist (North Dakota, 1974). After the 1973 decision it was assumed
that pharmacy organizations would display a renewed interest in enacting
restrictive legislation. Five days after the decision, one publication
reported: "It can be assumed that, by now, almost every pharmaceutical
asscn. exec. (sic) and State Board official has developed a 'restrictive'
ownership law for presentation to the state legislature." (Nationwide
Chain Drug, 1973). However, by 1978, North Dakota, with its restrictive
legislation enacted prior to the 1973 Supreme Court decision, remains as
the only state restricting the ownership of pharmacies to pharmacists.
Technological changes have been attributed to altering the role and
productivity functions of pharmacists. During the past decade, mechani-
cal devices have been made available for counting prefabricated medica-
tion. One of the more sophisticated counting devices (Baker Automated
Prescription System) stores up to 108 different medications and counts
capsules or tablets at a rate up to 600 units per minute (Baker Automa-
ted Rx Dispensing System, 1972). Prepackaging of medication has been
combined with the use of tablet counters to increase productivity. One
pharmacy, utilizing assembly-line techniques, "batch processing" of
16
prescriptions, and the assistance of a computer, has indicated that it
is possible for five pharmacists to dispense more than 1500 prescrip-
tions daily (How One Pharmacy, 1973). This dispensing rate of approxi-
mately 300 prescriptions per pharmacist per day is considerably above
the average pharmacist's daily prescription dispensing rate in the
United States, but this relatively high level of productivity appears to
be more prevalent among mail order prescription pharmacies than the ave-
rage daily prescription processing rate of 86 prescriptions in community
pharmacies (Third-Party Rx Ratio Drops for First Time, 1978).
Demand and the Influence of Pharmacy Size
Rodowskas (1973) suggested the average annual trend of an increas-
ing number of prescriptions being demanded from community pharmacies
will increase from approximately 1.4 billion in 1972 to 3.6 billion in
1985. He further suggested that the number of prescription outlets will
continue to increase in the future. The result of his projection indi-
cates that 3.6 billion prescriptions may be dispensed from 40,000 out-
lets, or an average of 300 prescriptions daily. Based upon the expected
increase in demand for prescription services, manpower requirements were
projected on the basis of existing staffing patterns. If, as expected
by Rodowskas, this average consumption rate of prescriptions increases,
then the average pharmacy would utilize 6.8 pharmacists in 1985.
Summary and Implications
Pharmacy and health planners appear to be confused in the role
requirements of the pharmacist. New roles ancillary to the drug deliv-
ery system, including drug use control and clinical pharmacy, are being
17
defined and examined. Although new roles are being investigated, it is
apparent that many of the traditional drug distribution roles have not
been fully achieved. Two apparent differences, the lack of quality in
drug distribution and the failure to utilize pharmacists and nonpharma-
cists to a greater extent, are indicators of resource allocation defic-
iencies in the system.
Environmental factors in the drug distribution system have been
suggested as important attributes to the pharmacists's role. Proposed
changes being forecast in the pharmaceutical environment include in-
creasing the pharmacist's productivity rate and providing greater levels
of technology in larger drug distribution centers, such as chain drug
outlets and health maintenance organizations. Environmental changes
have been tempered by a legal environment regulating the practice of
pharmacy. A recent decision of the United States Supreme Court indica-
ted that a state may restrict pharmacy ownership by legislative action
to registered pharmacists (North Dakota, 1974). Such a legal environ-
ment may also serve to stagnate changes in productivity and pharmacist
role alterations.
Demand in the United States for pharmaceuticals during the next
decade is expected to be more than two times the present demand. This
anticipated increase in demand, coupled with a possible decrease in the
number of pharmacies may lead to a drug distribution system in which the
average pharmacy dispenses approximately 300 prescriptions daily.
Although there are many environmental forces influencing the prac-
tice of pharmacy, it appears that the pharmaceutical distribution pro-
cess could benefit from exploring relationships in the present system

18
before significant role changes have the opportunity to influence the
system.
19
CHAPTER III
LITERATURE REVIEW AND RESEARCH QUESTIONS
Wide variations in the productivity rates of the prescription pro-
cessing function are apparent. Results from the work of Rodowskas and
Gagnon (1972), a study of 29 pharmacies, indicated relatively wide varia-
tions in the relationships between the amount of time spent in work
"directly related to prescription dispensing." For example, this study
indicated the pharmacy ranked with the greatest prescription income dur-
ing the study period ($86,311) had less time reported in prescription
dispensing activities than the pharmacy ranked number 27 by prescrip-
tion income ($14,751). However, these two pharmacies had similar labor
characteristics of one fulitime pharmacist and no other personnel invol-
ved in the prescription processing function. Another illustration of
manpower differences in the prescription processing function has been
made by Rucker and Sobaski (1970). Using data from the 1969 Lilly
Digest, these researchers indicated that 9 percent of the pharmacists
were dispensing 20 percent of the prescriptions while at the low pro-
ductivity end of the scale, 37 percent of the pharmacists were dispen-
sing only 23 percent of the total prescriptions.
It is the differences in such relationships and the wide variation
in pharmacist activities that suggest further questioning of labor pro-
ductivity in the prescription processing function. Two major questions
are raised:
(1) What factors are purported to influence labor productivity in
the prescription processing function?

20
(2) What types of relationships exist among the factors which may
influence labor productivity?
The first question provides an opportunity to examine the litera-
ture concerning personnel activities in the prescription processing func-
tion and to suggest research questions involving potential relationships
in labor productivity. The second question provides an opportunity to
develop a methodology for measuring existing relationships. This metho-
dology is discussed in the following chapter.
The prescription processing function may be considered as an eco-
nomic production function in which joint inputs result in prescription
outputs. There are two distinct cost elements in the processing func-
tion: (1) the cost of the product or materials used in compounding (ac-
quisition costs) and; (2) the cost incurred by the pharmacy in preparing
the product for use (processing costs). Most pharmacists are relatively
well constrained by the first type of cost, especially in states where
pharmacists are not permitted to substitute when the product is pre-
scribed with a trademarked name. Similar to a majority of states at the
time of this investigation, the Oregon law did not permit the substitu-
tion of a specified brand name (ORS 689.865(4)). However, an opinion of
the Oregon Attorney General construed that the statute "... ..authorized
authorization in advance by a prescriber identifying one or more other
specific brandnamed products which may be substituted for a specific
brand name product which the prescriber may later designate in a pre-
scription." (Opinion No. 6992, July 5, 1973). Subsequent to the com-
pletion of this study, the Oregon Revised Statutes were changed to permit
substitution.
21
The second type of costs, and those of primary interest in this
study, are processing costs displaying a relatively wide range in
variability and raising questions of controllability. These costs may
be altered among organizations by substituting increased or decreased
amounts of one or more input factors to achieve a given level of output.
If a less expensive factor can be substituted for a more expensive input
factor without altering the output, then it is expected that processing
costs would be reduced.
Labor inputs are considered to be one of the larger input proces-
sing costs. Berki and Hornbrook (1971) stated: "Operating costs are
principally professional and non-professional labor costs " Thus,
the interest of the literature review is to determine some of the major
factors influencing labor utilization and"productivity in the prescrip-
tion processing function. While the literature indicates there are a
myriad of factors which may have a possible influence on the utilization
of labor, this study will limit the investigation to organizational in-
fluences. Questions raised in these relationships will be utilized to
formulate specific hypotheses for testing.
Size Influences
Size has many different dimensions which may be utilized for mea-
surement and analysis. For example, it may be the physical size of a
prescription department, the physical size of the total pharmacy, the
distance a phalmacist must walk in dispensing a prescription, the number
of employees, the number of prescriptions dispensed, or the dollar rate
of prescription sales in an organization. However, the use of prescrip-
tion volume provides discretely quantifiable data.
22
Question One
What are the relationships of pharmacist utilization and produc-tivity to prescription volume?
If the optimum mixing of input factors is utilized in a prescrip-
tion production process, it would be expected that production costs
would be minimized. Economic theory also suggests that average unit
costs could be reduced even further as output increases commonly known
as increasing returns to scale. Although relatively large productivity
rates have been indicated in certain pharmacies with large outputs, n-
creasing returns to scale among community pharmacies has not been accep-
ted as a general principle (Myers, 1969 and Berki and Hornbrook, 1971).
Rodowskas and Dickson (n.d.) indicated changes in work patterns of phar-
macists as prescription volume increased, with more time being spent in
preparation of the prescription and less time being spent with patient
communications as prescription volume increased. Thus, prescription
volume influences both inputs and outputs in the prescription processing
function.
Question Two
What are the relationships of pharmacist utilization and produc-tivity to the number of employees involved in the prescriptionprocessing function?
As the prescription volume of a pharmacy increases, the opportunity
for labor specialization increases. McCaffree and Newman (1968) in the
study of pharmaceutical services being provided to a 95,000 membership
prepayment plan, indicated: "The specialization of tasks in the pharma-
cies and the employment of pharmacy clerks in lieu of additional licen-
sed junior pharmacists have helped to reduce costs." Pharmacy litera-
23
ture suggests that specialization of tasks in the pharmacy leads to in-
creased productivity. McCaffree and Newman (1968) further stated:
The clerks who work under the direction of licensed pharmacistsdo many of the routine duties in the pharmacies....and assistin precounting and prepackaging of some medications and drugs.This system has increased the number of prescriptions filledper employee by several times as compared with the averageneighborhood pharmacy.
In a chain pharmacy, pharmacist Shatkin indicated that extensive pre-
packaging had been utilized to increase productivity (What Top Chain Men
Saw, 1973). One chain pharmacy organization separated the pharmacist
from the public in order to provide an opportunity for the pharmacist to
concentrate on the preparation of prescriptions (Medicare: Prescriptions
Provide Expansion Power, 1973).
Question Three
What are the relationships of pharmacist utilization and produc-tivity to the physical size and layout of the prescription pro-cessing area?
The physical size of the prescription processing area and the lay-
out of the pharmacy appear to have a considerable impact upon the time
spent in the prescription processing function. Rodowskas and Dickson
(n.d.) indicated that more than seven percent of their observations
involved the time spent by pharmacists in drug selection and travel for
drug selection, file selection and travel for file selection and general
travel. Thus, if the time spent in travel could be decreased, then
total productivity of the prescription processing function would be
expected to increase.
Capital Influences
Capital is one of the inputs influencing all prescription process-
24
ing functions, and a minimum level of capital investment is necessary in
order to perform the necessary functions. However, certain capital ex-
penditures apparently influence the prescription processing function
which are not common to all pharmacies. Thus, it is the innovative mone-
tary expenditures for unique equipment that are of interest in the pre-
scription processing function. Counting devices for capsules and tablets
and electronic data processing equipment represent such influences.
Question Four
What are the relationships of pharmacist productivity to theexpenditures for specialized equipment and processes utilizedin the prescription processing function?
Rodowskas and Dickson (n.d.) indicated that 8.8 percent of the
pharmacist's activities studied were involved in product preparation.
Since most prescriptions consist of precompounded tablets or capsules,
it is apparent that a considerable amount of time is spent in actual
counting or pouring of medication into quantities requested by physi-
cians. If counting devices could be partially substituted for the phar-
macist's time in prescription processing, then it would be expected that
the amount of time spent in the prescription processing function could
be decreased. For example, the results of a drug prepackaging study
program indicated that labor cost savings of two cents to five cents per
prescription was realized when a counting device was combined with a
prepackaging process (Campbell et al., 1974).
The use of electronic data processing equipment represents another
type of a capital expenditure which is not common to the prescription
processing function. Thus, these innovative capital expenditures are of
interest to an analysis of inputs, since such capital inputs could be
25
substituted for other forms of labor inputs. Although electronic data
processing equipment has been used in pharmacy demonstration projects,
it is only since the early 1970's that such a system has been within the
cost feasibility of an average community pharmacy. For example, one
wholesale drug organization announced that a national distribution of
such equipment could be expected within the next 12 months. (Fay, Per-
sonal Communications, 1974).
Service Influences
As indicated in the previous chapter, there is an increasing inter-
est in changing the pharmacist's role to one of greater involvement in
the provision of services. Without examining activities of the pharma-
cist, it is relatively easy to imagine that this person is primarily
involved in a production like process in which the majority of time is
spent in the actual manipulative skills of dispensing a prescription.
However, actual observations have indicated that pharmacists involved
in prescription activities spend the majority of their time in nonmanip-
ulative functions. For example, Rodowskas and Gagnon (1972) indicated
that pharmacists spent 53.6 percent of their time in prescription re-
lated activities, but only 16.4 percent of this total time was spent in
manipulative prescription skills. The remainder of the pharmacist's
time spent in prescription related activities was attributed to clerical
(23.0 percent), consultative (8.3 percent), and supportive (5.9 percent)
activities. Thus, the provision of services appears to be an important
work classification for the pharmacist.
26
Question Five
What are the relationships of pharmacy manpower productivity tothe differences in types and levels of services provided withprescribed medication?
Since various types of services are possible, this question can be
subdivided into several service categories. Some of the services appear-
ing to involve greater time utilization of the pharmacist are considered
in greater detail in questions Five A, Five B, and Five C. This ques-
tion, of-course, deals implicitly with the type of pharmacy, since
service levels vary with the goals of the organization.
Question Five A
What are the relationships between pharmacist productivity andthird party payment for prescriptions?
Payment for outpatient prescription drugs by third-parties has been
increasing rapidly. In the United States, 25 percent of community phar-
macy prescriptions were financed by third-parties in 1977. The growth
of third-party prescription financing has been marked by a dramatic in-
crease. Only eight years earlier (1969) the ratio of third-party to
total prescriptions was 11.9 percent. Thus, the ratio has more than
doubled during a relatively short period of time. (Third-Party Pre-
scription Ratio, 1978).
The increasing importance of the benefit and a possible increase in
the amount of time utilized by the pharmacist to prepare third-party
prescriptions and the total cost suggest questioning the pharmacist labor
utilization for this activity. It is a commonly held view by pharma-
cists that third-party prescriptions require more time to prepare due to
the additional forms that must be completed. A recent study involving

27
factor analysis indicated that third-party prescription involvement
would tend to increase prescription prices (Gosselin, 1971).
Question Five B
What are the relationships between pharmacist productivity andthe use of patient profiles?
With the increasing abundance of drugs being prescribed in our so-
ciety, the risk of two or more drugs interacting within a given patient
has been well recognized. In one retrospective study it was reported
that the incidence of drug-drug interactions could have occurred in more
than 7 1/2 percent of the cases (Talley and Laventurier, 1972).
Medication profiles have been suggested as a possible method to
decrease the incidence of drug-drug interactions and other therapeutic
problems. Although the State of New Jersey requires pharmacists to em-
ploy patient profiles, the use of medication profiles is still contro-
versial and the adoption of patient profile records is not universal.
Solomon et al. (1974), studying the use of medication profiles to detect
potential therapeutic problems, reported a detection incidence rate of
potential therapeutic problems as 5.8 percent. While it must be recog-
nized that patient profiles offer improved services to patients, the use
of such records appears to require an increase in the utilization of
labor in the prescription processing function.
Question Five C
What are the relationships between pharmacist productivity andthe provision of prescription financial records to patients?
Although third-party payment of prescribed medication is increas-
ing, the majority of consumers are still involved with out-of-pocket
costs for prescribed medication. Such prescribed medication payments

28
may be potential deductions from federal and state taxes, and many
pharmacies offer a hand written receipt at the time of sale. The labor
cost of providing this service does not appear to exist in the litera-
ture. However, it would appear to be valuable in determining this cost
as a total part of the prescription processing function.

CHAPTER IV
METHODOLOGY
Objectives
29
The previous discussion suggests the necessity to provide a further
examination of productivity in the prescription processing function. A
literature review has indicated that certain organizational characteris-
tics appeared to provide a more efficient utilization of labor in the
prescription processing function. Therefore, it was the intent of this
study to examine specified input factors which have been indicated to
influence labor utilization in the prescription processing function.
Specific objectives of this study were to identify the relation-
ships of input factors in the community pharmacy prescription processing
function with observed levels of productivity under varying environmen-
tal conditions.
This objective was further clarified into the following sub-objec-
tives:
(1) To determine the nature and extent of involvement in the
prescription processing function by professional personnel.
(2) To investigate the influence of temporal relationships with
structural factors in the prescription processing function.
(3) To investigate the relationships existing between levels of
services and the utilization of personnel inputs in the
prescription processing function.
Work Measurement
The objectives of this study suggest a research design in which the
30
amount of time to accomplish particular functions in the performance of
a task can be measured. (Nadler (1970) employs the term work measure-
ment and indicates that:
Work measurement determines the time an operation or elementof an operation should take when performed with a given methodunder given job conditions; when worked on by an operator withthe necessary skill and sufficient training to perform theoperation properly, working at the performance level, main-tainable throughout the day, week, etc.
Work measurement may be accomplished by direct time study or by ran-
dom time sampling. The intent of both techniques is to measure the pro-
portion of time spent in specified work activities. If a choice is to
be made between techniques, then it would be expected that the selected
alternative should provide the required data with a minimum of expense.
Hanson (1960) indicated that random time sampling, often used inter-
changably with the term work sampling, appears to meet the data require-
ments with the least expense involved in actual data collection.
Most work sampling involves random time intervals for recording
observations. While randomness is essential to this experimental design,
randomness is not required to be in the time interval if the nature of
the work is performed in a random manner. Thus, it is possible to ob-
tain random observations at set time intervals if the nature of the work
is random. Heiland and Richardson (1957) suggest: "Work sampling is
particularly useful in the analysis of nonrepetitive or irregularly
occurring activity, where no complete methods and frequency description
method is available."
There are many indications that certain activities in the health
professions are performed in a random manner. Abdellah and Levine (1954)
31
reported that the activities of nurses are random and do not follow a
periodic pattern. Since nursing consists of random activities, these
two researchers were able to complete a work sampling study of nurses by
recording an observation every five minutes. There are indications that
pharmacists perform prescription processing activities in a random man-
ner, since the pharmacist does not have direct control over the timing
of many events in the pharmacy. For example, the timing of communica-
tive events such as answering the telephone or providing information to
patrons are not at the control of the pharmacist and such events may
interrupt other activities in the prescription processing function.
Several studies of pharmacist activities have utilized the randomness of
activities by collecting data at constant time intervals (Rodowskas and
Dickson,n.d.; Rodowskas and Gagnon, 1972; and Barker, 1971).
Activities of the Pharmacist
Elements to be observed in the prescription processing function
were identified by preparing a process chart of the work activities in-
volved. The process chart was then utilized to develop a list and
description of activities normally encountered in the prescription pro-
cessing function. The listing of pharmacist activities was then com-
pared with the work categories defined by Barker (1971) and Rodowskas
and Dickson (n.d.). Preliminary testing was completed in two pharma-
cies utilizing both professionals and nonprofessionals (as permitted by
Oregon law) in the prescription processing function. Additional refine-
ments were made upon completion of the preliminary testing and two work
activities were added as a result of the preliminary testing. These task
32
activity category descriptions and examples are listed in Appendix B.
Sample Selection
Selection and Stratification of Pharmacies
The study population was drawn from a universe of community pharma-
cies located in eight western Oregon communities. These communities
were selected because they provided an opportunity to compare the acti-
vities of pharmacists operating in both chain and independently owned
pharmacies of varying prescription output levels.
The sample selection goal was to obtain an equal number of pharma-
cies in two ownership categories (chain and independent) and three pre-
scription volume categories (less than 80 prescriptions a day, 80-120
prescriptions a day, and more than 120 prescriptions a day). The re-
search design with two ownership categories and three size categories,
provided six sampling strata or cells (2 ownership categories by 3 size
categories). Each cell had three pharmacies with a total of eighteen
pharmacies participating in the study.
In order to solicit cooperation, a preliminary questionnaire and
covering letter (Appendix C) were mailed to all pharmacies in the six
western Oregon communities. Results from the questionnaire provided an
opportunity to personally interview the pharmacist manager in each of
the pharmacies indicating an interest to participate in the study. A
structured questionnaire (see Appendix D) was utilized during the inter-
view in order to obtain pharmacy characteristics. Based on the ques-
tionnaire results, an attempt was made to obtain three pharmacies of the
desired size category and ownership characteristics in each cell. Five
33
of the six strata were completed by utilizing these preliminary informa-
tion gathering techniques. Pharmacies for the remaining cell were ob-
tained by telephoning three pharmacies in other cities from a list of
names provided by an anonymous consultant who was knowledgable of pharm-
acy characteristics in the State of Oregon. Two pharmacies in two addi-
tional communities were obtained from this source.
Observations
The number of observations in a study is dependent upon the varia-
bility of the data collected, and the researcher's limits of acceptabil-
ity. Ideally, data collection procedure should provide the required
data at an acceptable accuracy level with the smallest number of obser-
vations. One method of providing relatively strong statistical infer-
ence with a limited amount of data collection is the utilization of
stratified sampling. Davidson (1960) suggests that stratified sampling
has the advantage of closer confidence limits; therefore, providing a
greater accuracy than random sampling for the same number of observa-
tions.
The amount of variation within sample strata could provide diffi-
culties in predicting sample size, since frequencies cannot be predicted
in advance. However, previous studies provided a method of estimating
the percent of total time occupied within a given activity category.
Since work activities are defined differently in other studies, the
time spent in the activity can only be considered as an approximation.
For example, the study of Rodowskas and Dickson (n.d.) included 28 dif-
ferent categories ranging in time frequency from 0.2 percent to 16.8
percent. Barker's (1971) study defined 142 mutually exclusive work
34
activities which were later combined into 15 major categories of work
activity. The percent of time spent in these 15 categories ranged from
less than 1 percent to a high of more than 48 percent. This study uti-
lized 28 mutually exclusive task activity categories which were similar
to many of the categories Rodowskas and Dickson utilized. However,
because of these differences, direct comparisons cannot be made for each
category in the previous studies. In calculating sample size for this
study, it was assumed that activity categories of significant interest
will involve one percent or more of the work activities.
The limits of acceptability by the researcher for this study have
been set at the 95 percent confidence level and the desired level of
accuracy has been set at 10 percent. These limits mean that a resear-
cher may be confident that random data observations will represent the
facts 95 percent of the time within the specified level of accuracy.
For example, if a given activity category is recorded with a frequency
of 20 percent, the level of accuracy for the activity category in this
study would be expected to lie between the 18.0 and 22.0 percent fre-
quency level for 95 percent of the samples chosen.
In calculating the total sample size for this study, Barnes (1964)
suggests the following formula for a 95 percent confidence level:
Sp = 2\irp(1-p)
where S = desired accuracy
p = percent of time in a given activity category
N = number of observations.
If S = 10 percent and p = 1 percent, the following substitution
35
and computation may be utilized to calculate the sample size N.
(.10)(.01) = V(.01)(.99)
N = 39,600
Therefore, if the entire sample is utilized at these indicated
levels, a sample size of 39,600 would be required.
Limitations of the Study
This investigation is subject to some limitations. First, some
pharmacies may have a lower productivity rate because the prescription
which they dispense is of a "higher quality" than the prescription of
competitors. Quality for this study, as indicated previously, is de-
fined as meeting the drug and labeling requirements of the Oregon Board
of Pharmacy. At the time of this data collection there were no pending
actions against any of these 18 pharmacies for quality factors, or any
other reason. Thus, the pharmacies sampled appeared to meet the minimum
requirement level of quality. It is evident that some pharmacies may
have exceeded the minimum legal requirements by offering such services
as patient profile records, mail order patient counseling and so forth.
An attempt was made to control for this factor by subtracting the amount
of time spent in these activities. The control method is discussed
later in the study results under the heading "Productivity Rate of
Pharmacists."
A second shortcoming which must be recognized is different indivi-
dual levels of productivity among pharmacists. From the viewpoint of
methodology, it would be helpful if the same pharmacist could be utili-
zed in all of the observations. However, this is not practical since
36
the pharmacist would not be familiar with his(her) surroundings. There-
fore, one must utilize pharmacists that are familiar with their sur-
roundings.
A third shortcoming is the geographical limitations. Data were
collected only from Oregon pharmacies, and the data were not intended to
represent a random national or regional sample. Sampling was not com-
pleted in a random manner, since the intent was to select quotas of
three pharmacies in each type by size cell.
Data Analyses
Two types of statistical analyses were utilized to examine the
data. An analysis of variance was utilized to compare the percent of
time spent in specified task activity categories by type and size of
pharmacy. Multiple stepwise regression was utilized to examine indepen-
dent variables that influenced pharmacist productivity rates. The use
of stepwise multiple regression is discussed in greater detail in the
next chapter.
Hypotheses
From the research questions in Chapter Three, hypotheses were de-
veloped and tested in Chapter Five. For the purpose of clarity, the
research questions are restated and the questions are followed with
hypotheses developed from the research questions.
Question One
What are the relationships of pharmacist utilization and produc-
tivity to prescription volume?

37
Hypothesis One
Pharmacy prescription volume will not display a significant posi-tive linear relationship with the productivity rate of the pharma-cists observed in this study.
Question Two
What are the relationships of pharmacist utilization and produc-tivity to the number of employees involved in the prescriptionprocessing function?
Hypothesis Two
A positive linear relationship will not be established between the
number of pharmacists involved in the prescription processing func-tion and the level of productivity.
Hypothesis Two-A
Subprofessionals (nonprofessionals) working directly in the pre-scription processing function will make a positive influence in the
productivity rate of pharmacies employing these subprofessionals.
Question Three
What are the relationships of pharmacist utilization and productiv-
ity to the physical size and layout of the prescription processingarea?
Hypothesis Three
Prescription department size and average travel distance from the
primary work station to other areas in the prescription department
will not have a significant influence on the productivity of the
pharmacist.
Question Four
What are the relationships of pharmacist productivity to the expen-ditures for specialized equipment and processes utilized in the
prescription processing function?
Hypothesis Four
The utilization of capital inputs in the pharmacy will not have a
significant positive influence in the productivity rate of pharma-
cists.
Research questions 5, 5A, 5B and 5C were utilized to examine
38
the cost influences of producing services, but hypotheses were not devel-
oped from these questions. These research questions are:
Question Five
What are the relationships of pharmacy manpower productivity to the
differences in types and levels of services provided with pre-
scribed medication?
Question Five A
What are the relationships between pharmacist productivity and
third-party payment for prescriptions?
Question Five B
What are the relationships between pharmacist productivity and the
use of patient profiles?
Question Five C
What are the relationships between pharmacist productivity and the
provision of prescription financial records to patients?

39
CHAPTER V
RESULTS
Data Sources and Work Categories
This study sampled the work activities of pharmacists in eighteen
pharmacies (9 chain and 9 independent) located in western Oregon. Uti-
lizing a methodology of observing a pharmacist for at least one work-
day4
in each fulltime pharmacist position in each pharmacy, data were
collected for a total of 42 days, beginning on November 19, 1974 and
ending on March 28, 1975.
Prior to data collection, the pharmacist who was to be observed,
was given a copy of the form entitled "Explanation to Participants"
(Appendix E). The intent of this message was to indicate that only the
usual behavior patterns of the pharmacist were to be expected, and the
pharmacist should not engage in special activities due to the observa-
tion procedure. Each pharmacist read this explanation prior to the col-
lection of data.
The pharmacist and the nonprofessionals (if they were permitted in
the prescription processing area) were given a copy of the Daily Time
Log (Appendix F) and requested to complete the information on this log
each time that they left the work area. The work area was not confined
to just the prescription processing area, but included any area in the
4A work-day was
a lunch break. Mostone pharmacy did notbetween the hours of
defined as the first 9 hours of the day, includingdata were recorded from 9 am. to 6 pm. However,
open until 10 am.; therefore, data were obtained10 am. and 7 pm. in this particular pharmacy.

40
pharmacy that the observer was permitted to enter and follow the pharma-
cist.
Work activities were classified into 29 mutually exclusive categor-
ies. Prior to analysis, one category (Other I), containing activities
which appeared to be unique to specific pharmacies, was edited into
categories which were more descriptive of the activity than the term
"Other." For example, one pharmacist would retype each prescription
that was received by telephone. It is believed that such an activity
would be more descriptive and more correct in category two (General
Clerical Activities). Thus, this one category, containing very little
data, was edited into the remaining 28 categories. Table 1 provides a
summary description of these work activities, while Appendix A provides
a more complete description of the task category descriptions.
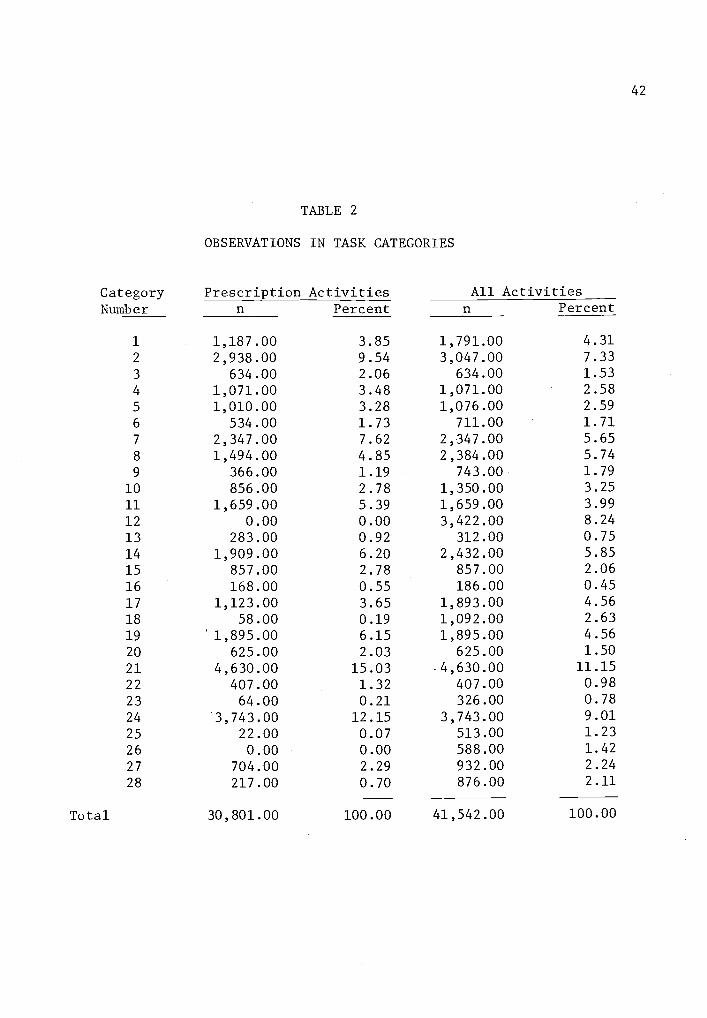
A primary subdivision of pharmacist work activities is the amount
of time spent in the prescription processing function. Data in Table 2
provide a synopsis of the number and percent of recordings taken in each
of the 28 task activity categories. These data were subdivided into
prescription activities,and all activities which include both prescrip-
tion activities and nonprescription activities. Prescription activi-
ties, recorded on the Data Recording Form (Appendix G) in red pen or red
pencil, included only the activities involved in the prescription pro-
cessing function. Such activities are restricted to the time spent by
the pharmacist in preparing or distributing prescriptions. For example,
the ordering of prescription medication, the stocking of shelves with
legend items, or the discussion of prescription medication with a patron
were defined as prescription activities; while the ordering of nonpre-

41
TABLE 1
SUMMARY TITLES OF TASK CATEGORIES
CategoryNumber Descriptive Title
1 Cashier2 Clerical (General)3 Clerical (Monetary Receipt of Prescription)4 Clerical (Patient Profile of Prescribed Medication)
5 Clerical (Third-Party)6 Communications in Purchasing7 Communicating on the Telephone (Prescribers)
8 Communicating on the Telephone (Other)
9 Communicating with Patrons (Health Concerns)10 Communicating with Patrons (Other)11 Drug Selection12 Idle13 Information Acquisition or Dispersal (Professional)14 Inventory Maintenance15 Labeling of Prescription Medication16 Mail or Delivery Preparation17 Managerial Communications18 Managerial (Other)19 Prescription File Selection20 Pricing of Prescriptions21 Product Preparation (Prescription)22 Product Preparation (Mixing Prescriptions)23 Travel24 Typing Prescription Labels25 Unobservable (Organizational Activities)26 Unobservable (Personal Activities)27 Upkeep of the Pharmacy28 Other
42
TABLE 2
OBSERVATIONS IN TASK CATEGORIES
Category Prescription Activities All ActivitiesNumber n Percent n Percent
1 1,187.00 3.85 1,791.00 4.31
2 2,938.00 9.54 3,047.00 7.33
3 634.00 2.06 634.00 1.53
4 1,071.00 3.48 1,071.00 2.58
5 1,010.00 3.28 1,076.00 2.59
6 534.00 1.73 711.00 1.71
7 2,347.00 7.62 2,347.00 5.65
8 1,494.00 4.85 2,384.00 5.74
9 366.00 1.19 743.00 1.79
10 856.00 2.78 1,350.00 3.25
11 1,659.00 5.39 1,659.00 3.99
12 0.00 0.00 3,422.00 8.24
13 283.00 0.92 312.00 0.75
14 1,909.00 6.20 2,432.00 5.85
15 857.00 2.78 857.00 2.06
16 168.00 0.55 186.00 0.45
17 1,123.00 3.65 1,893.00 4.56
18 58.00 0.19 1,092.00 2.63
19 1,895.00 6.15 1,895.00 4.56
20 625.00 2.03 625.00 1.50
21 4,630.00 15.-03 4,630.00 11.15
22 407.00 1.32 407.00 0.98
23 64.00 0.21 326.00 0.78
24 3,743.00 12.15 3,743.00 9.01
25 22.00 0.07 513.00 1.23
26 0.00 0.00 588.00 1.42
27 704.00 2.29 932.00 2.24
28 217.00 0.70 876.00 2.11
Total 30,801.00 100.00 41,542.00 100.00
43
scription medication, the stocking of shelves with nonprescription items
or a discussion with a patron concerning a nonprescribed medication were
defined as nonprescription activities. Some task activity categor-
ies involved only prescription activities (categories 3, 4, 7, 11, 15,
19, 20, 21, 22, and 24) while other task activity categories involved
only nonprescription functions (categories 12 and 26). All other task
activity categories were a mixture of prescription and nonprescription
activities.
Data from Table 3 provide some descriptive characteristics of
pharmacies involved in the study. The average daily prescription dis-
pensing rate, obtained by actual count during the study, ranged from a
low of 49 to a maximum of 289. Seven of the pharmacies employed the
services of one fulltime pharmacist, six pharmacies utilized two fulltime
pharmacists, three pharmacies utilized three fulltime pharmacists, while
two of the larger pharmacies utilized four fulltime pharmacists. Size
of the prescription processing area varied from 200 square feet in one
of the larger volume pharmacies to 525 square feet in the largest vol-
ume pharmacy. Interestingly, the six smallest pharmacies (rated by the
average number of prescriptions per day) had a larger average size
(square feet) than the medium sized pharmacies (rated by the average
number of prescriptions per day).
Sample Size
A total of 41,542 observations (Table 4) were obtained, providing
at least 960 observations in each pharmacy. Data in Table 4 indicate
that at least 5,000 observations were obtained in each of the six cells
categorizing pharmacies by organizational type and size. Small indepen-
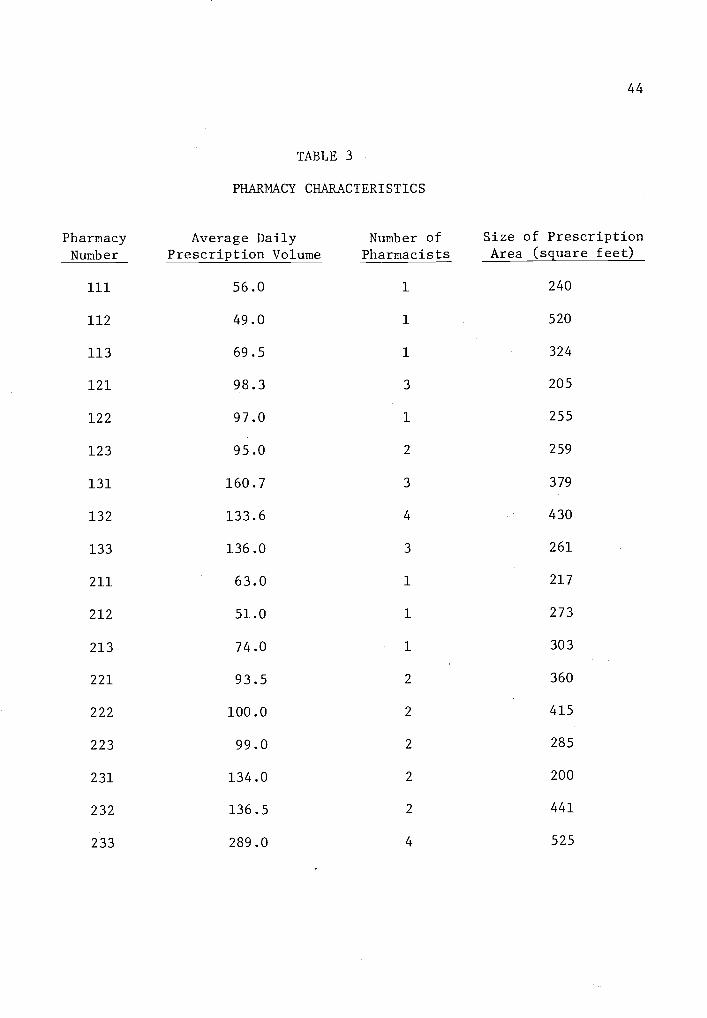
44
TABLE 3
PHARMACY CHARACTERISTICS
Pharmacy Average Daily Number of Size of Prescription
Number Prescription Volume Pharmacists Area (square feet)
111 56.0 1 240
112 49.0 1 520
113 69.5 1 324
121 98.3 3 205
122 97.0 1 255
123 95.0 2 259
131 160.7 3 379
132 133.6 4 430
133 136.0 3 261
211 63.0 1 217
212 51.0 1 273
213 74.0 1 303
221 93.5 2 360
222 100.0 2 415
223 99.0 2 285
231 134.0 2 200
232 136.5 2 441
233 289.0 4 525

45
TABLE 4
OBSERVATIONS BY TYPE AND SIZE OF PHARMACY
Size
Type
Chain Independent Total
n percent n percent n percent
Small 6,000 29.7 5,004 23.4 11,004 26.5
Medium 5,288 26.2 5,741 26.9 11,029 26.5
Large 8,890 44.1 10,619 49.7 19,509 47.0
Total 20,178 100.0 21,364 100.0 41,542 100.0
46
dent pharmacies received the fewest observations (5,004), while the cate-
gory of large independent pharmacies received the greatest number of
observations (10,619). Independent pharmacies, as compared to chain
pharmacies, received more than one-half (51.4 percent) of the total
observations. In comparing the number of observations by size category,
large pharmacies received the greatest number of observations (19,509)
while the small and medium pharmacies, because of the sample design,
each received slightly more than 11,000 observations.
Since the methodology utilized in this study would be expected to
provide a smaller number of observations from pharmacies with only one
fulitime pharmacist position, data were obtained from several of the
smaller pharmacies during two days of observing the same pharmacist.
This second day of data collection served two functions. It increased
the number of observations in small pharmacy cells and provided an oppor-
tunity to determine the level of reliability in task activity categories
during the first and second day.
Since most prescriptions are pre-compounded, and it requires approx-
imately the same amount of time to prepare each pre-compounded prescrip-
tion, it was believed that a chi square test could be utilized to deter-
mine if additional data collection would be necessary in the smaller
pharmacies. Chi square comparisons were made with task activity cate-
gories 11 (drug selection), 15 (labeling), 21 (product preparation) and
24 (typing labels). These task activity categories were chosen because
they cannot be delayed in the output of the prescription function, and
thus could be expected to have a direct relationship with the number of
prescriptions dispensed.

47
The chi square test (Table 5) was made by comparing activity inputs
from the second day of observation with the activity from the first day
of observation. This comparison indicated no significant difference
between these two levels at the 95 percent level of confidence. Fur-
thermore, this test suggests that the number of observations in each
cell was sufficiently large for comparison purposes.
TABLE 5
COMPARING WORK ACTIVITIES OFTHE SAME PHARMACIST ON TWO DIFFERENT DAYS
PharmacyNumber Day
Prescrip-tionsn
Task Activity Categories
X2 df11
n15
n21
n24
n
113 1 65 41 22 109 73 .050 3 p>.99
2 74 43 25 117 79
213 1 76 42 38 116 139 .054 3 p>.99
2 72 33 31 97 114
Comparison of All Activities by Size
Since the primary design of this study involves blocking by type
and size, the initial process in examining study results will be to in-
vestigate the environmental influences of type and size upon the percent
of time spent in certain task activity categories. In an initial exami-
nation, the 28 task activity categories were combined into six descrip-
tive activities; thus, providing a greater sample size for statistical
comparison within each cell. These six descriptive activities were:
clerical activities, communicative activities, managerial activities,
dispensing activities, no observable activities and other activities.

48
Table 6 shows the task activities incorporated into each of the six des-
criptive functions.
Data in Table 7 provide an opportunity to examine the percent of
all pharmacist activities within the six categorized descriptive activi-
ties. In these six categories, dispensing activities involved a greater
percentage of time than any other activity. As pharmacies increased in
size, pharmacists spent more time in dispensing activities. The cate-
gory of dispensing activities is not to be confused with prescription
processing activities which were recorded during the observation period
in a red color. Dispensing activities (Task Activity Categories 11, 15,
19, 20, 21, 22, and 24) consist of all prescription activities; however,
there are many prescription activities - such as calling a physician to
obtain approval for a refill (Category 7) - that are required prior to
dispensing a prescription.
In these combined activities, communication is the second most time
consuming activity of the pharmacist. A significant difference was re-
ported in communication activities by size of pharmacy, with the largest
percent of communicative activities occurring in the largest pharmacies
and the smallest percent of communication occurring in medium sized
pharmacies.
Of the remaining categories, no significant differences are repor-
ted; however, some interesting relationships are indicated in clerical
and managerial activities. The percent of pharmacist time spent in
clerical activities decreased as pharmacies increased in size. The per-
cent of pharmacist time spent in managerial activities increased by
approximately one percent between small and medium sized pharmacies;

Description ofActivity
49
TABLE 6
COMBINED TASK CATEGORY ACTIVITIES
Task Activity Category
Clerical 1. CashierActivities 2. Clerical (General)
3. Clerical (Monetary Receipt)4. Clerical (Patient Profile)5. Clerical (Third-Party)
CommunicativeActivities
ManagerialActivities
6. Communications Involving Purchasing7. Communications Utilizing the Telephone
(Prescribers)
8. Communications Utilizing the Telephone (Other)
9. Communications with Patrons (Health Related)
10. Communications with Patrons (Other)13. Information (Professional)17. Managerial Communications
14. Inventory Maintenance18. Managerial (Other)
Dispensing 11. Drug SelectionActivities 15. Labeling
19. Prescription File Selection20. Pricing21. Product Preparation22. Product Preparation (Mixing)24. Typing Prescription Labels
No ObservableActivities
12. Idle25. Unobservable (Organizational)26. Unobservable (Personal)
Other 16. Mail or Delivery Preparation
Activities 23. Travel27. Upkeep28. Other
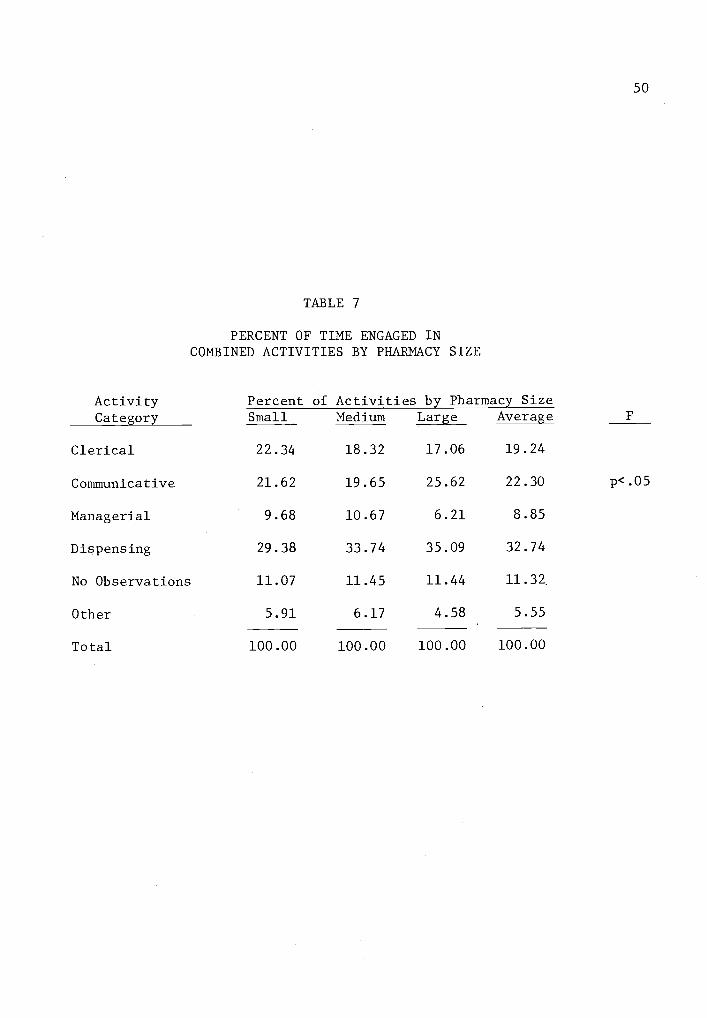
TABLE 7
PERCENT OF TIME ENGAGED INCOMBINED ACTIVITIES BY PHARMACY SIZE
ActivityCategory
Percent of Activities by Pharmacy SizeSmall Medium Large Average
50
F
Clerical
Communicative
Managerial
Dispensing
No Observations
Other
Total
22.34
21.62
9.68
29.38
11.07
5.91
18.32
19.65
10.67
33.74
11.45
6.17
17.06
25.62
6.21
35.09
11.44
4.58
19.24
22.30
8.85
32.74
11.32
5.55
p<.05
100.00 100.00 100.00 100.00
51
however, this activity decreased by more than four percent in large
pharmacies, when a comparison was made with medium sized pharmacies.
Task activity categories comprising the communicative activities
were further examined for differences by pharmacy size, with category 7
(Communicating with Prescribers by Telephone) and 17 (Managerial Commun-
ications) displaying significant differences. In this analysis, cate-
gory 9 (Health Related Communications with Patrons) displayed a highly
significant difference (p .01), with pharmacists in small pharmacies
spending a much greater percent of their time in this activity (Table 8).
These results are not unexpected, as the opportunity for a pharmacist in
a small pharmacy to be in direct contact with patrons is usually much
greater than it is in larger pharmacies. Some pharmacists in the larger
pharmacies of this study were relatively inaccessible to the public. As
pharmacies increased in size, the pharmacist employees spent consider-
ably more time in co municating with physicians and in managerial com-
munications. Again, this increase in physician communications with an
increase in size would be anticipated, as the larger pharmacies were
generally located in larger communities where the physician's authoriza-
tion for refilling of prescriptions was apparently adhered to more
stringently than in a small community. One also would expect an in-
crease in managerial communications with an increase in the number of
employees.
Comparison of All Activities by Type
In examining the influence of pharmacy type upon the activities of
the pharmacist, the data in Table 9 indicated that pharmacists in chain
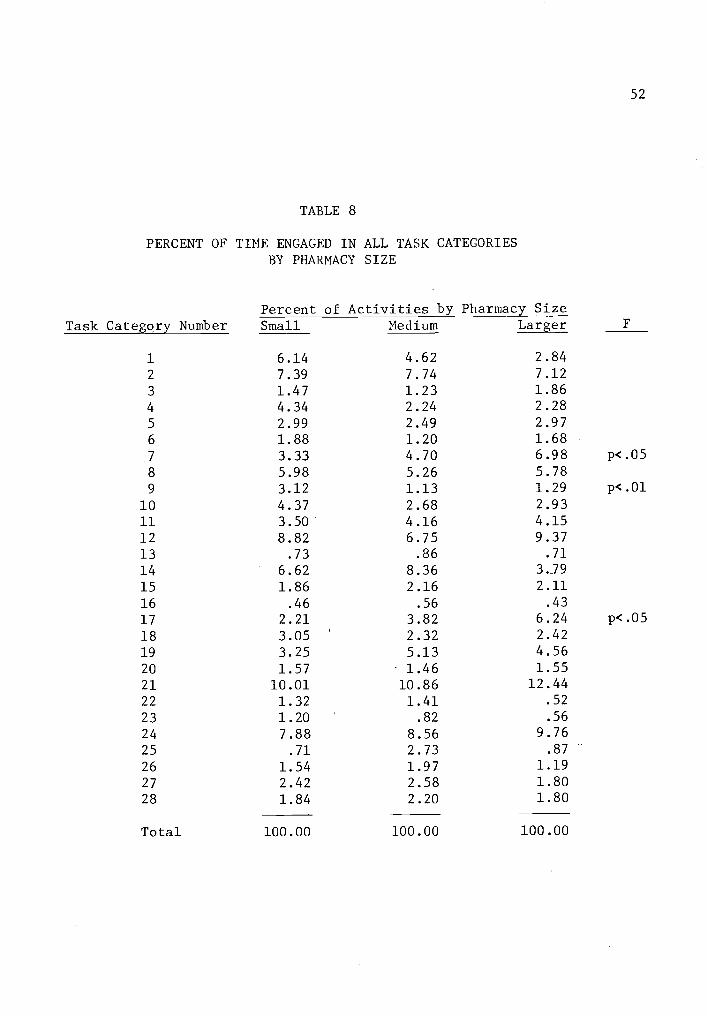
52
TABLE 8
PERCENT OF TIME ENGAGED IN ALL TASK CATEGORIESBY PHARMACY SIZE
Task Category NumberPercent of Activities by Pharmacy SizeSmall Medium Larger
1 6.14 4.62 2.84
2 7.39 7.74 7.12
3 1.47 1.23 1.86
4 4.34 2.24 2.28
5 2.99 2.49 2.97
6 1.88 1.20 1.68
7 3.33 4.70 6.98 p<.05
8 5.98 5.26 5.78
9 3.12 1.13 1.29 p<.01
10 4.37 2.68 2.93
11 3.50 4.16 4.1512 8.82 6.75 9.3713 .73 .36 .71
14 6.62 8.36 3.J9
15 1.86 2.16 2.11
16 .46 .56 .43
17 2.21 3.82 6.24 p<.05
18 3.05 2.32 2.42
19 3.25 5.13 4.56
20 1.57 1.46 1.55
21 10.01 10.86 12.44
22 1.32 1.41 .52
23 1.20 .82 .56
24 7.88 8.56 9.76
25 .71 2.73 .87
26 1.54 1.97 1.19
27 2.42 2.58 1.80
28 1.84 2.20 1.80
Total 100.00 100.00 100.00

53
TABLE 9
PERCENT OF TIME ENGAGED IN COMBINED ACTIVITIESBY PHARMACY TYPE
ActivityCategory
Percent of Activities by Pharmacy TypeFIndependent Chain Average
Clerical 20.72 17.77 19.24
Communicative 20.55 24.04 22.30 p<.05
Managerial 8.33 9.37 8.85
Dispensing 33.41 32.06 32.74
No Observations 10.34 12.30 11.32
Other 6.65 4.46 5.55 p.05
Total 100.00 100.00 100.00

54
pharmacies spent more time in the categories of communicative activities,
managerial activities, and no observed activity. Pharmacists in inde-
pendently owned pharmacies as compared with chain pharmacies spent a
greater percent of time in clerical activities, dispensing activities,
and the miscellaneous category entitled other activities.
In comparing the six descriptive activities by pharmacy type, the
category of communicative activities was again significantly different.
When specific task activity categories comprising the communicative
activities were examined, category 7 (Communicating with Prescribers by
Telephone) and category 9 (Health Related Communications with Patrons)
displayed significantly greater differences by pharmacists employed in
chain pharmacies (Table 10), suggesting that greater prescriber communi-
cations and managerial communications are characteristics of organiza-
tional type, as well as size.
In the examination of the six descriptive functions by type of
pharmacy, the combined category of "Other" displayed a significant dif-
ference, with independent pharmacists spending the greatest amount of
time in this combined category (Table 9). Although the combined cate-
gories displayed a difference, the individual categories making up this
miscellaneous category did not provide any significant differences.
Prescription Activities by Type and Size
As previously explained, any activity contributing to the prescrip-
tion processing function was recorded in a red color. Thus, these acti-
vities were examined as a separate entity and comparisons were made with
the time spent in the prescription processing activities by type and
size of pharmacy.
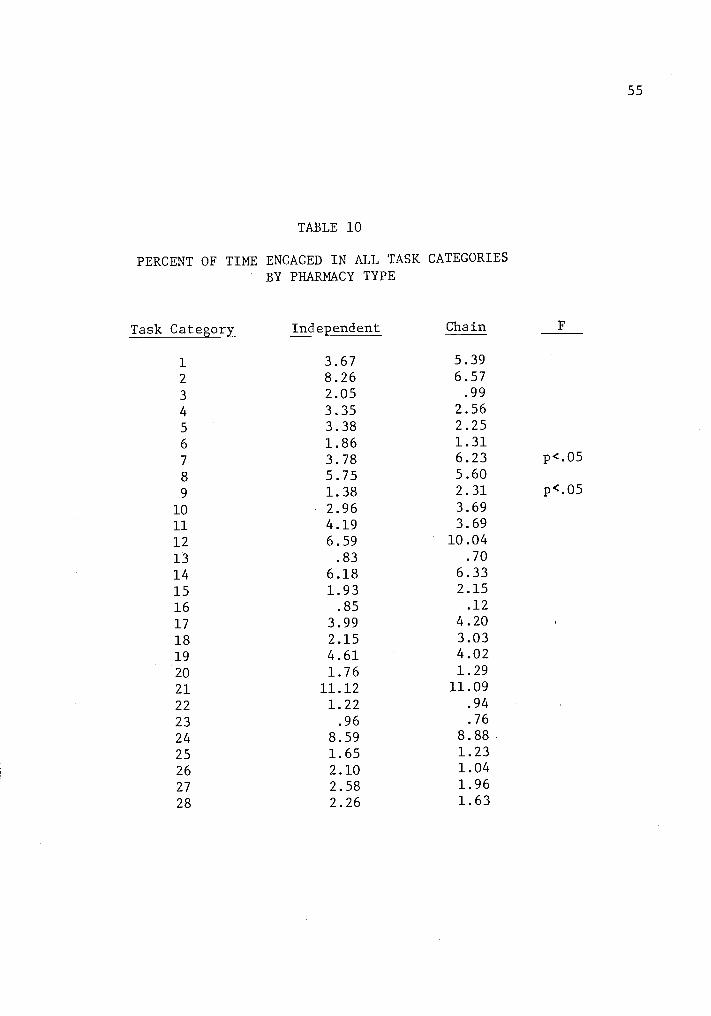
55
TABLE 10
PERCENT OF TIME ENGAGED IN ALL TASK CATEGORIESBY PHARMACY TYPE
Task Category Independent Chain
1
2
3
4
5
6
3.678.262.05
3.35
3.381.86
5.396.57.99
2.562.251.31
7 3.78 6.23 p<.05
8 5.75 5.60
9 1.38 2.31 p.0510 2.96 3.69
11 4.19 3.69
12 6.59 10.04
13 .83 .70
14 6.18 6.33
15 1.93 2.15
16 .85 .12
17 3.99 4.20
18 2.15 3.03
19 4.61 4.02
20 1.76 1.29
21 11.12 11.09
22 1.22 .94
23 .96 .76
24 8.59 8.88
25 1.65 1.23
26 2.10 1.04
27 2.58 1.96
28 2.26 1.63
56
More than 74 percent of the pharmacist's activities were spent in
prescription processing activities (Table 11). However, the time spent
in prescription processing varied by pharmacy type and size. Pharma-
cists in independently owned pharmacies spent a greater percent of time
in the prescription processing function than their counterparts in chain
organizations (76.5 percent to 71.6 percent). In size comparisons,
pharmacists employed in large pharmacies spent the greatest proportion
of their time in prescription processing activities (78.3 percent), while
pharmacists employed in medium sized pharmacies spent the smallest pro-
portion with 69.4 percent of their time spent in prescription related
activities. In type and size comparisons, pharmacists employed in med-
ium sized chain pharmacies spent the smallest percent of time in pre-
scription processing activities, while pharmacists working in large
independent pharmacies spent the largest percent of time (82.6 percent)
in prescription processing activities (Table 11).
Comparison of Prescription Activities by Size
Again, task activity categories were combined into the six descrip-
tive functions of clerical activities, communicative activities, mana-
gerial activities, dispensing activities, no observable activities, and
other. Of these six descriptors, only one (communicative activities),
displayed a significant difference with respect to pharmacy size
(Table 12).
As communicative activities were further examined for relationships,
a significant difference was noted in the proportion of time spent com-
municating with prescribers by telephone. Pharmacists in large pharma-
cies spent more time in this activity than pharmacists in medium sized

TABLE 11
57
PRESCRIPTION ACTIVITIES AS A PERCENT OF ALL ACTIVITIESBY TYPE AND SIZE OF PHARMACY
SizeType Small Medium Large Average
Independent 69.6 71.3 82.6 76.5
Chain 73.4 67.3 73.0 71.6
Average 71.7 69.4 78.3 74.1
TABLE 12
PERCENT OF-TIME ENGAGED IN COMBINED PRESCRIPTIONACTIVITIES BY PHARMACY SIZE
Activity CategoryPercent of Activity by Pharmacy Size
FSmall Medium Large Average
Clerical 27.88 21.86 20.43 23.39
Communicative 19.04 19.24 26.16 21.48 p<.05
Managerial 8.06 8.06 4.47 6.86
Dispensing 41.60 46.56 45.31 44.49
No Observable .07 .07 .07 .07
Activities
Other 3.35 4.21 3.56 3.71
Total 100.00 100.00 100.00 100.00
58
pharmacies, while pharmacists in small pharmacies spent the smaller per-
cent of time communicating with physicians (Table 13). Although a high-
ly significant relationship was displayed by pharmacy size in the cate-
gory Communication with Patrons (Health Concerns), the relatively small
sample size for this task activity category (Category 9) would suggest
discounting the category. However, Managerial Communications (Category
17) in prescription activities also indicated a highly significant dif-
ference. Again, the proportion of time spent in this category varied by
pharmacy size with pharmacists in large pharmacies spending the greatest
amount of time in this category, and pharmacists in small pharmacies
spending the least amount of time in the category (Table 13).
Comparison of Prescription Activities by Type
In examining combined prescription activities by pharmacy type,
communicative activities again displayed a significant difference.
Chain pharmacists spent a significantly greater portion of their pre-
scription processing time in communicative activities than did their
counterparts employed in independent pharmacies (Table 14). In examin-
ing task activity differences within this combined category, Communicat-
ing with Prescribers by Telephone (task activity category 7) displayed a
highly significant difference, with chain pharmacists spending a greater
percentage of time communicating with physicians (Table 15).
Independent pharmacists spent a significantly greater percentage of
their time in the combined category of "other" activities (Table 14).
From Table 15, this difference can be partially explained by the addi-
tional percent of time spent in mailing prescriptions (task activity
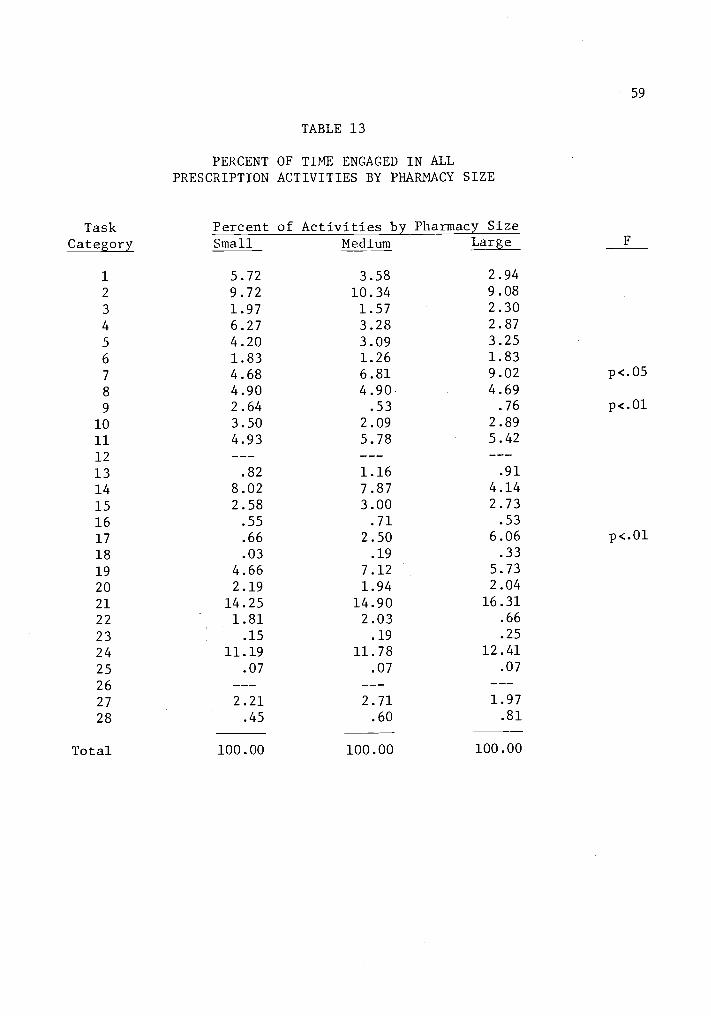
59
TABLE 13
PERCENT OF TIME ENGAGED IN ALLPRESCRIPTION ACTIVITIES BY PHARMACY SIZE
TaskCategory
Percent of Activities by Pharmacy SizeSmall Medium Large
1 5.72 3.58 2.94
2 9.72 10.34 9.08
3 1.97 1.57 2.30
4 6.27 3.28 2.87
5 4.20 3.09 3.25
6 1.83 1.26 1.83
7 4.68 6.81 9.02 p<.05
8 4.90 4.90 4.69
9 2.64 .53 .76 P<.01
10 3.50 2.09 2.89
11 4.93 5.78 5.42
12
13 .82 1.16 .91
14 8.02 7.87 4.14
15 2.58 3.00 2.73
16 .55 .71 .53
17 .66 2.50 6.06 p<.01
18 .03 .19 .33
19 4.66 7.12 5.73
20 2.19 1.94 2.04
21 14.25 14.90 16.31
22 1.81 2.03 .66
23 .15 .19 .25
24 11.19 11.78 12.41
25 .07 .07 .07
26
27 2.21 2.71 1.97
28 .45 .60 .81
Total 100.00 100.00 100.00

60
TABLE 14
PERCENT OF TIME ENGAGED IN COMBINEDPRESCRIPTION ACTIVITIES BY PHARMACY TYPE
Percent of Activity by Pharmacy TypeActivity Category Independent Chain Average F
Clerical 25.47 21.32 23.39
Communicative 18.34 24.62 21.48 p<.05
Managerial 7.27 6.45 6.86
Dispensing 44.17 44.81 44.49
No Observations .14 .07
Other 4.61 2.80 3.71 p<.05
Total 100.00 100.00 100.00
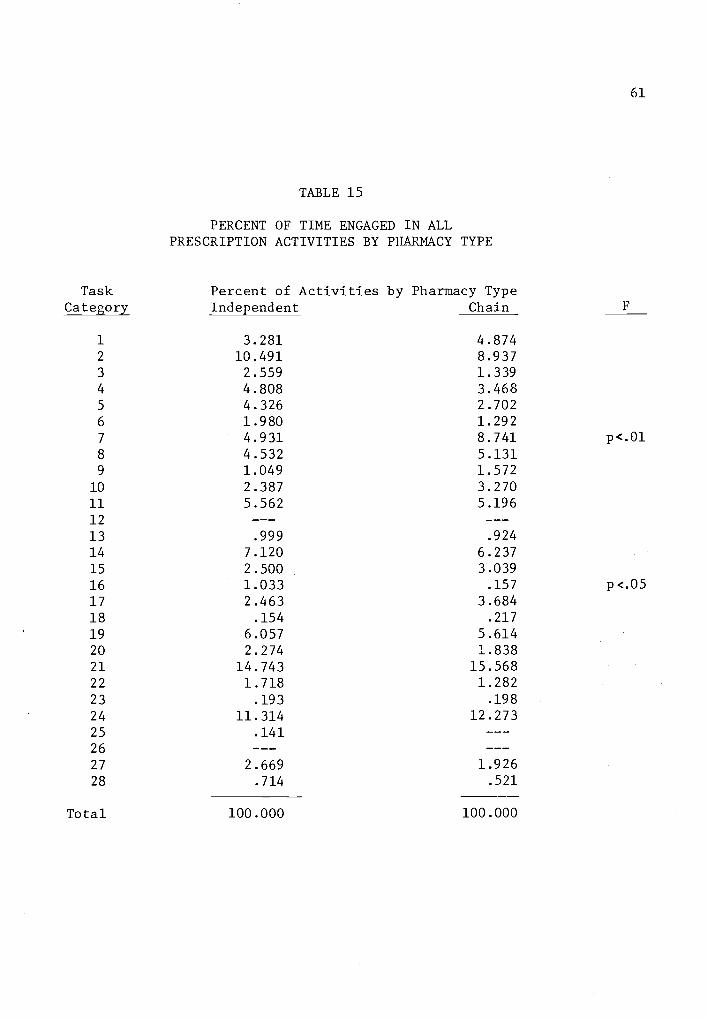
61
TABLE 15
PERCENT OF TIME ENGAGED IN ALLPRESCRIPTION ACTIVITIES BY PHARMACY TYPE
TaskCategory
Percent of Activities by Pharmacy TypeIndependent Chain
1
2
3
4
5
6
3.28110.4912.5594.8084.3261.980
4.8748.9371.3393.4682.7021.292
7 4.931 8.741 p<.01
8 4.532 5.1319 1.049 1.572
10 2.387 3.270
11 5.562 5.196
12
13 .999 .924
14 7.120 6.237
15 2.500 3.039
16 1.033 .157 p<.05
17 2.463 3.684
18 .154 .217
19 6.057 5.61420 2.274 1.83821 14.743 15.56822 1.718 1.282
23 .193 .198
24 11.314 12.273
25 .14126
27 2.669 1.92628 .714 .521
Total 100.000 100.000

62
category 16) and upkeep of the pharmacy (task activity category 27) by
the independent pharmacists.
Productivity Rates of Pharmacists
In an attempt to measure pharmacist work, productivity rates were
prepared for each of the eighteen pharmacies in the study. The rate of
productivity was measured as the average number of prescriptions dispen-
sed per pharmacist per hour. For the purpose of this analysis, three
different types of productivity rates were developed:
Overall Productivity Rate
Prescription Function Productivity Rate
Non-Service Prescription Productivity Rate.
The "Overall Productivity Rate" was prepared by dividing the number
of prescriptions dispensed during the day of observation by the number
of hours that all of the pharmacists spent in the pharmacy during the
hours of observation. Since this Overall Productivity Rate was more
dependent upon the rate of demand than actuarproduction, a second method
of calculating a productivity rate utilized only the time spent by pharm-
acists in the prescription processing function. This second method,
referred to as the "Prescription Function Productivity Rate," was com-
puted by dividing the daily number of prescriptions dispensed by the
proportion of time actually spent in prescription processing activities.
Since some pharmacies spent more time in providing ancillary ser-
vices, or telephone communications, the Non-Service Prescription Produc-
tivity Rate was developed to give a comparison between pharmacies pro-
viding the basic activities of the prescription processing function.

63
Thus, task activity categories 1, 3, 4, 5, 7, 8, 9, 10, and 16 were ex-
cluded in this third productivity rate, since there may be considerably
different levels of activity from pharmacy to pharmacy in these particu-
lar service task activities. This method was computed by subtracting
the time spent in the nine service categories from the time spent in
prescription processing activities. This remaining time (in hours) was
divided into the number of prescriptions dispensed during the day of
observation. This Non-Service Productivity Rate was particularly useful
in attempting to equalize many of the quality differences that may exist
between pharmacies.
An example of calculating the productivity rates is provided from
the data of pharmacy number 131.5
The prescription productivity rates
5The pharmacists in pharmacy 131 dispensed 482 prescriptions during
the 61.42 hours that all pharmacists were in the pharmacy during theobservation period. Dividing the 482 prescriptions by the 61.42 hoursprovided an Overall Productivity Rate of 7.85 prescriptions per pharma-cist per hour.
The Prescription Function Productivity Rate is based only on thepercent of time spent in prescription processing activities. Since the
pharmacists in pharmacy number 131 spent 82.64 percent of their time inprescription processing activities, the 61.42 hours was multiplied bythe percent (82.64) of time spent in prescription activities which rep-resents the number of hours (50.75) actually spent in prescription pro-cessing activities. The 482 prescriptions divided by the adjusted 50.75hours provides the Prescription Function Productivity Rate of 9.50 pre-scriptions per pharmacist per hour.
The Non-Service Prescription Productivity Rate would be calculatedin the same manner as the Prescription Function Productivity Rate, ex-cept that the percent of time spent in the prescription processing func-tion would be reduced by the percent of time spent in the previouslyindicated service categories (1, 3, 4, 5, 7, 8, 9, 10, and 16). In
pharmacy 131, 30.69 percent of the pharmacist's activities were spent inservice activities. Therefore, the 30.69 percent was subtracted from the82.64 percent of time spent in prescription processing activities, leav-ing 51.95 percent of the pharmacist's time spent in non-service prescrip-tion activities. This resultant percentage multiplied by the 61.42hours of time suggests that 31.90 hours were spent in non-service pre-scription activities. Dividing the 482 prescriptions by the 31.90 hours
64
for all pharmacies in the study are reported in Table 16.
Factors Influencing Productivity
If the productivity rates are viewed as output factors, or as depen-
dent variables, then it is possible to examine the influence of a number
of input or independent variables influencing the prescription produc-
tivity rate. Utilizing the tool of multiple regression, it is possible
to examine some of these influences. The multiple stepwise regression
package utilized to test for the relationship between the independent
and dependent variables was the Statistical Package for the Social
Sciences (Nie, 1975).
In referring to the dependent variables for the remainder of the
study, the following terms will be utilized:
Y1 = Overall Productivity Rate
Y2 = Prescription Function Productivity Rate
Y3 = Non-Service Prescription Productivity Rate.
In stepwise multiple regression, the number of independent vari-
ables must be one less than the sample size. Since each of the 18
pharmacies represents a sampling unit, and originally there were 28 dif-
ferent independent variables, the number of independent variables had to
be decreased. A multiple regression model is much more effective if the
independent variables do not have a high degree of interdependence.
Therefore, from a correlation matrix, any independent variable with more
than 0.7 correlation with another independent variable was examined.
5 continuedprovides the Non-Service Prescription Productivity Rate of 15.11
prescriptions per pharmacist per hour.
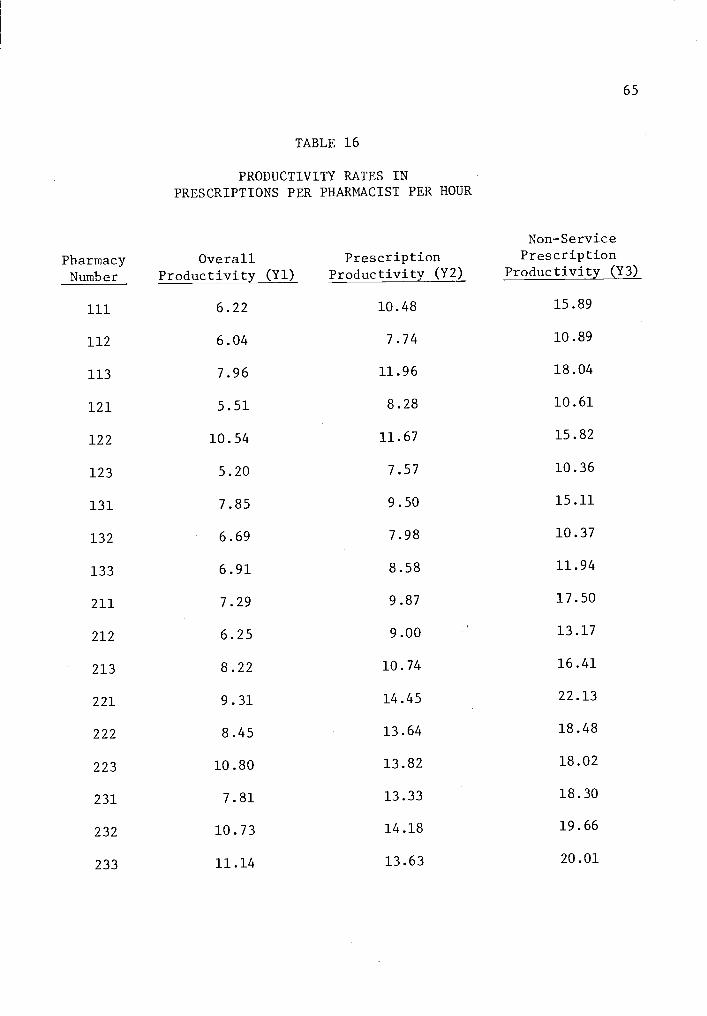
65
TABLE 16
PRODUCTIVITY RATES INPRESCRIPTIONS PER PHARMACIST PER HOUR
PharmacyNumber
OverallProductivity (Y1)
PrescriptionProductivity (Y2)
Non-ServicePrescription
Productivity (Y3)
111 6.22 10.48 15.89
112 6.04 7.74 10.89
113 7.96 11.96 18.04
121 5.51 8.28 10.61
122 10.54 11.67 15.82
123 5.20 7.57 10.36
131 7.85 9.50 15.11
132 6.69 7.98 10.37
133 6.91 8.58 11.94
211 7.29 9.87 17.50
212 6.25 9.00 13.17
213 8.22 10.74 16.41
221 9.31 14.45 22.13
222 8.45 13.64 18.48
223 10.80 13.82 18.02
231 7.81 13.33 18.30
232 10.73 14.18 19.66
233 11.14 13.63 20.01
66 .
Then, the independent variable with the lowest correlation on the Y2 and
Y3 dependent variables was deleted. This process was continued until the
number in independent variables was reduced to fourteen. The indepen-
dent variables remaining were:
Average number of prescriptions dispensed per day
Size of the prescription processing area in square feet
Average travel distance of the pharmacist
Hours that the pharmacy was open each week
Semi-automatic tablet counter
Electronic data processing terminals
Desk top calculator
Communications equipment
Number of prescription drugs prepackaged
Nonprofessional filing prescriptions
Nonprofessional completing patient profiles
Nonprofessional completing monetary receipts
Nonprofessional in the prescription processing area
Nonprofessional answering the telephone.
Since some of the independent variables did not have quantitative
measures, a "dummy" variable was utilized in place of a real numerical
value. If the factor was present as an independent variable, it was
given the value of one. If the factor was not present, then the value
of zero was assigned. For example, the pharmacies that utilized a non-
professional to file prescriptions were given the value of one for this
variable, while the pharmacies that did not utilize the nonprofessional
in the prescription processing area were given the value of zero.
67
Research Questions
The first research question was concerned with the influence of
pharmacist productivity and prescription volume. While economic theory
suggests economies of scale, previous research examining economies of
scale in the pharmacy (Myers, 1969 and Berki and Hornbrook, 1971) sug-
gests that such scale economies apparently do not exist in the pharmacy.
This previous research, coupled with the general observation that larger
pharmacies generally do not provide a production line organization or a
capital intensive process, suggests the background for hypothesis one
which states:
Pharmacy prescription volume will not display a significantpositive linear relationship with the productivity rate ofthe pharmacists observed in this study.
Figure 1, illustrating the average daily number of prescriptions
dispensed with the Prescription Function Productivity Rate (Y2) suggests
a potential increase in productivity with an increase in prescription
output. However, a least squares statistical fit provides an r2value of
only 0.096 and the test is not significant at the 95 percent confidence
level.
Utilizing the SPSS (1975) multiple regression technique with Y2 as
the dependent variable, the independent variable of daily prescription
volume was never brought into the equation. In similar regression with
Y3 as the dependent variable, average daily prescription size was the
12th independent variable brought into the equation, and it was not
significant at the 95 percent confidence level (Table 17).
A further analysis was made by examining productivity and output
within the category of chain and independent pharmacies. In regressing
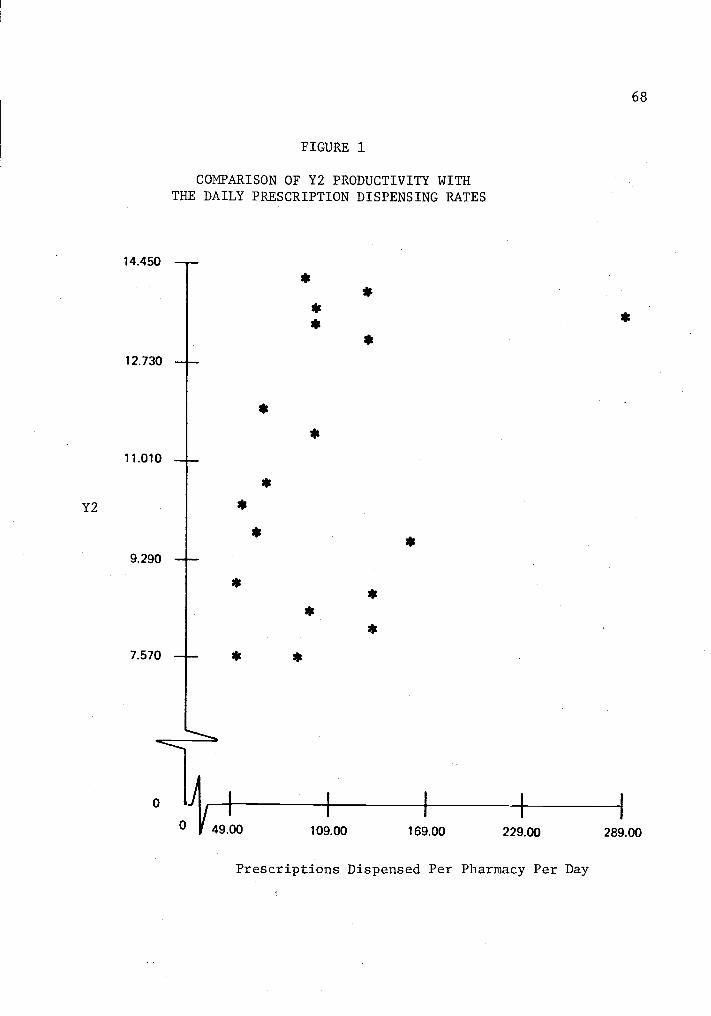
Y2
14.450
12.730
11.010
9.290
7.570
FIGURE 1
COMPARISON OF Y2 PRODUCTIVITY WITHTHE DAILY PRESCRIPTION DISPENSING RATES
0 49.00I I I
68
109.00 169.00 229.00 289.00
Prescriptions Dispensed Per Pharmacy Per Day
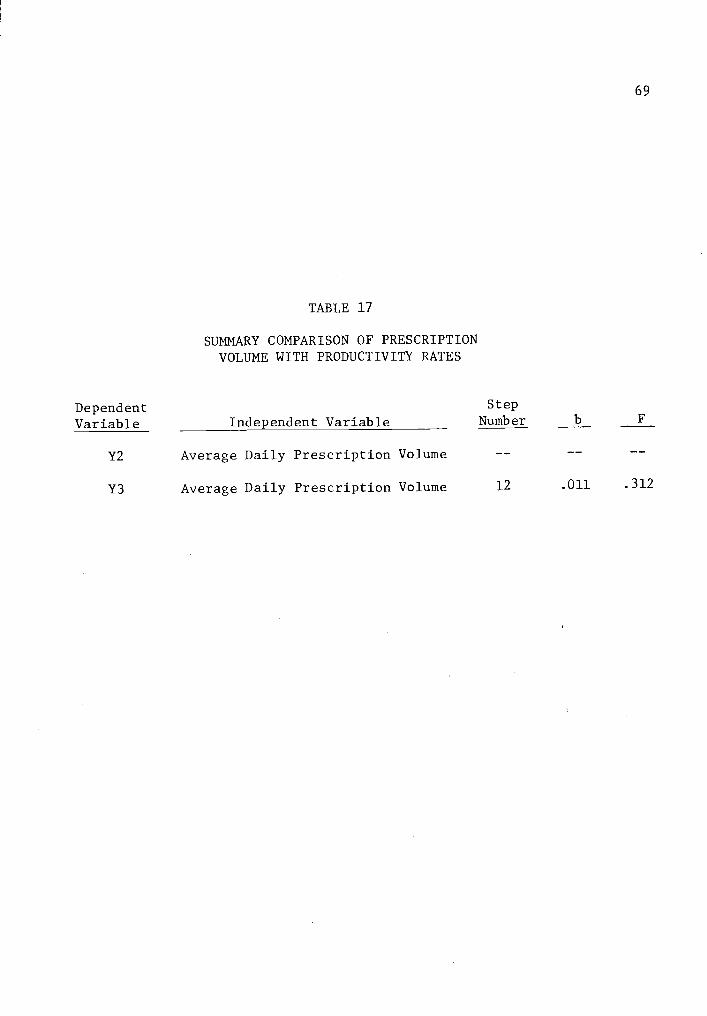
69
TABLE 17
SUMMARY COMPARISON OF PRESCRIPTIONVOLUME WITH PRODUCTIVITY RATES
Dependent Step
Variable Independent Variable Number b F
Y2 Average Daily Prescription Volume
Y3 Average Daily Prescription Volume 12 .011 .312
70
Y2 and Y3 with the daily prescription volume of chain pharmacies, the r2
value for the Y2 regression was 0.096 and the r2 value for the Y3 re-
gression was 0.064. Neither of these regressions was significant at the
95 percent confidence level. Although the sample of nine pharmacies is
relatively small, it suggests that productivity increases as pharmacies
increase their daily prescription volume, but the increase does not con-
tinue as the daily prescription volume expands beyond 100 prescriptions
per day (Figure 2). As might be expected from examining Figure 3, inde-
pendent pharmacies had little relationship with the variables of produc-
tivity, and no significant relationship was shown. Therefore, hypothe-
sis one is accepted, as the examination of the data does not suggest a
linear relationship between productivity and the number of prescriptions
dispensed.
Research question two examines potential relationships between pro-
ductivity of pharmacists and the number of employees involved in the
prescription processing function. Although McCaffree and Newman (1968)
indicated productivity increases in an organization utilizing a rela-
tively large number of pharmacists, there are several differences be-
tween the pharmaceutical services of a large prepaid medical care plan
that McCaffree and Newman (1968) examined and the pharmaceutical ser-
vices provided in a community pharmacy. For example, a pharmacy opera-
ting with a prepaid medical care plan is able to suggest and obtain com-
pliance from prescribers on such factors as a uniform prescription size,
and a drug formulary to reduce the number of prescription items. Thus,
a prepaid medical care organization has an opportunity to utilize high
levels of labor specialization in ordering, prepackaging and dispensing
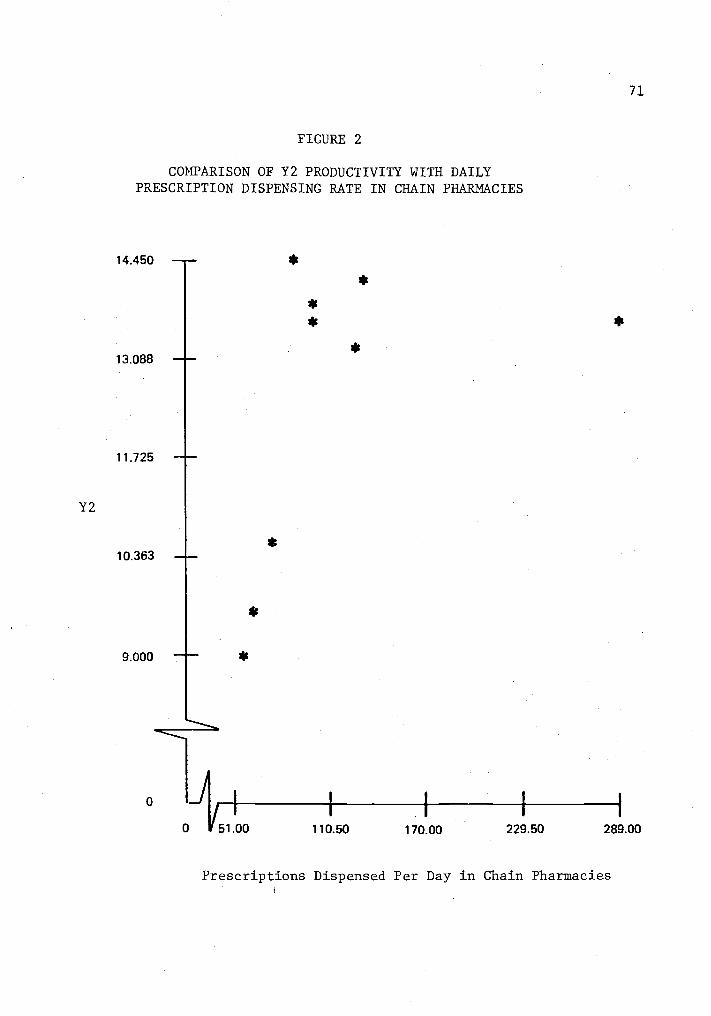
Y2
FIGURE 2
COMPARISON OF Y2 PRODUCTIVITY WITH DAILYPRESCRIPTION DISPENSING RATE IN CHAIN PHARMACIES
14.450 --
13.088
11.725
10.363
9.000
0
0
*
71
51.00 110.50 170.00 229.50 289.00
Prescriptions Dispensed Per Day in Chain Pharmacies
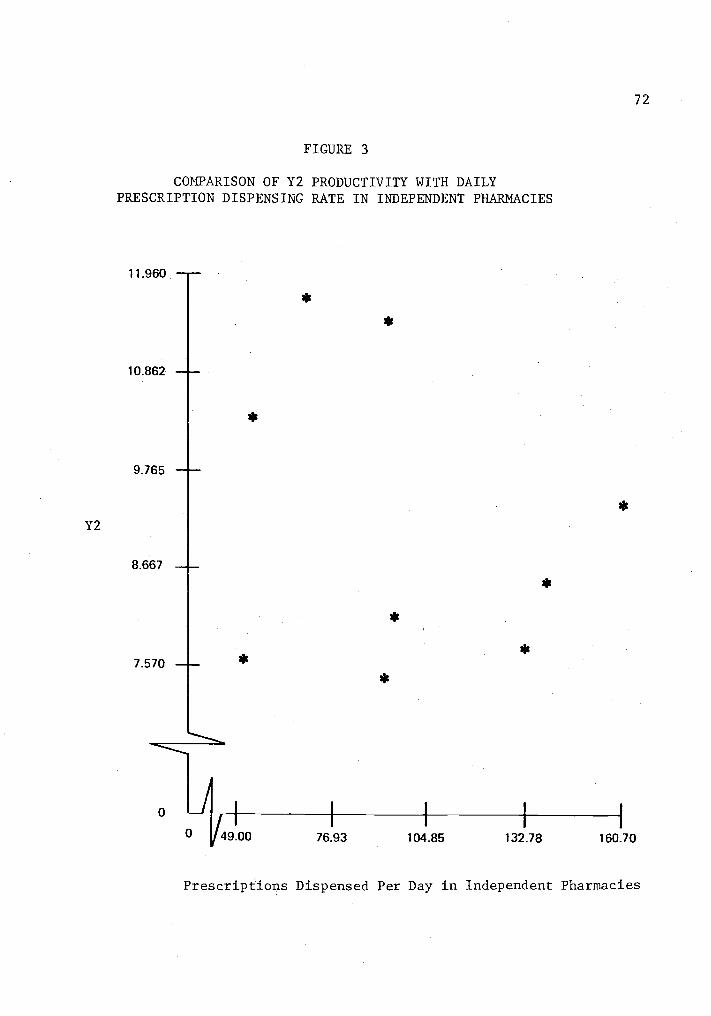
Y2
FIGURE 3
COMPARISON OF Y2 PRODUCTIVITY WITH DAILYPRESCRIPTION DISPENSING RATE IN INDEPENDENT PHARMACIES
11.960
10.862
9.765
8.667
7.570
0 J0
72
/9.00 76 93 104.85 132.78 160.70
Prescriptions Dispensed Per Day in Independent Pharmacies

73
prescribed medications. Apparently this same opportunity for labor spe-
cialization does not exist in today's community pharmacy.
From the speculation that little opportunity for labor specializa-
tion exists in the present community pharmacy, hypothesis two was formu-
lated:
A positive linear relationship will not be established betweenthe number of pharmacists involved in the prescription proces-sing function and the level of productivity.
In the stepwise regression analysis, one of the independent vari-
ables was the number of fulltime pharmacists employed in each pharmacy.
This independent variable was not added to the equations when Y2 and Y3
were utilized as the dependent variables. Therefore, hypothesis two is
accepted, as the number of pharmacists does not significantly influence
the productivity rates.
Research question two also provides the opportunity to examine the
influence of the subprofessional on the prescription processing function.
There appears to be considerable opportunity for the subprofessional to
influence the productivity rate of the pharmacist. The Report of the
Task Force...Practitioner's and Subprofessional's Roles in Pharmacy
(1969) suggested a number of potential functions that the subprofession-
al might be performing. Rodowskas and Dickson (n.d.) indicated the
pharmacist was performing a number of functions that could probably be
carried out effectively by a subprofessional. One pharmacist (How One
Pharmacy Fills, 1973) suggested that the method he utilized to increase
productivity was to add the services of a second subprofessional to the
staff instead of a second pharmacist. Thus, the literature strongly
supports the position of a subprofessional as a method of improving

74
productivity, leading to hypothesis number two A:
Subprofessionals (nonprofessionals) working directly in theprescription processing function will make a positive in-fluence in the productivity rate of pharmacies employingthese subprofessionals.
Each pharmacist manager of the pharmacies involved in this study,
when questioned, indicated that a subprofessional was utilized in the
pharmacy. However, during the data collection, it was noticed that sub-
professionals in some pharmacies were permitted to perform certain tasks
in the prescription processing area, while subprofessionals in other
pharmacies were not permitted to perform any activities in the prescrip-
tion processing area. Thus, the position in the pharmacy where the sub-
professional was permitted to perform tasks became an important factor
to examine, since they obviously could not perform certain duties recom-
mended by the Task Force (1969), if they were not permitted to work in
the prescription processing area.
The stepwise regression analysis of the Y2 and Y3 productivity
values indicated that the position of the subprofessional was the first
independent variable to enter the regression equation, while the function
of filing prescription files by the subprofessional was the second vari-
able to enter the regression equation. Although the second independent
variable was not significant at the 95 percent confidence level, the
first variable was significant at the 99 percent level of confidence
when it was added (Table 18). Therefore, hypothesis two A is accepted.
Research question three attempts to investigate the relationships
of productivity with size and layout of the prescription processing area.
The literature directed to practicing pharmacists has occasional discus-
sions on methods to improve productivity by changing the layout or size.
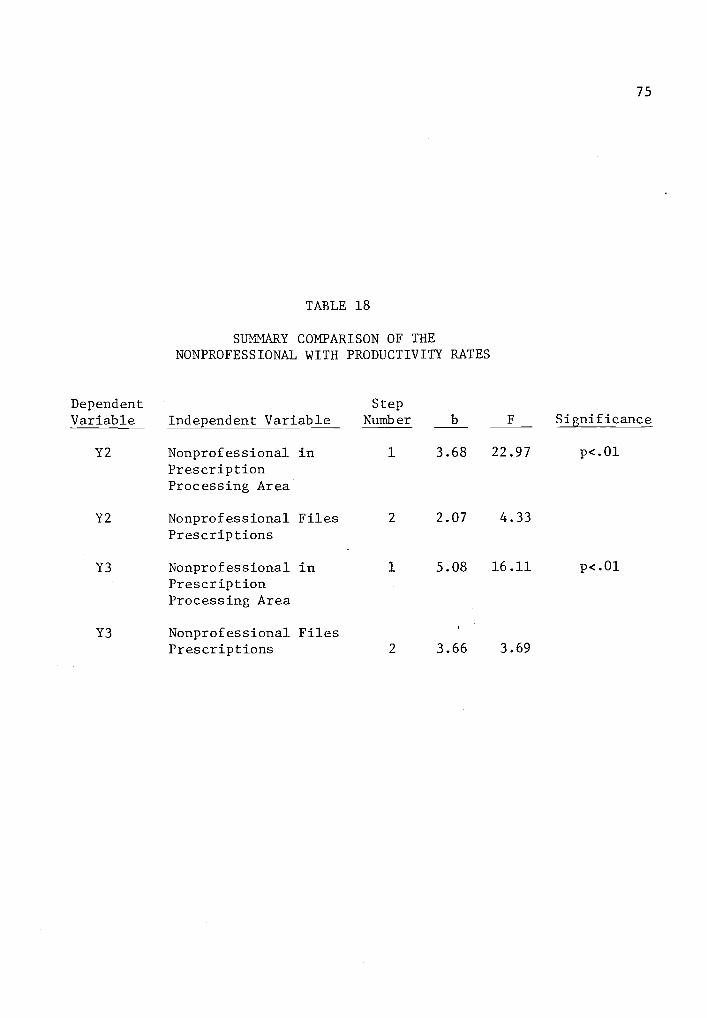
75
TABLE 18
SUMMARY COMPARISON OF THENONPROFESSIONAL WITH PRODUCTIVITY RATES
Dependent StepVariable Independent Variable Number b F Significance
Y2 Nonprofessional in 1 3.68 22.97 p<.01
PrescriptionProcessing Area
Y2 Nonprofessional Files 2 2.07 4.33
Prescriptions
Y3 Nonprofessional in 1 5.08 16.11 p<.01
PrescriptionProcessing Area
Y3 Nonprofessional FilesPrescriptions 2 3.66 3.69
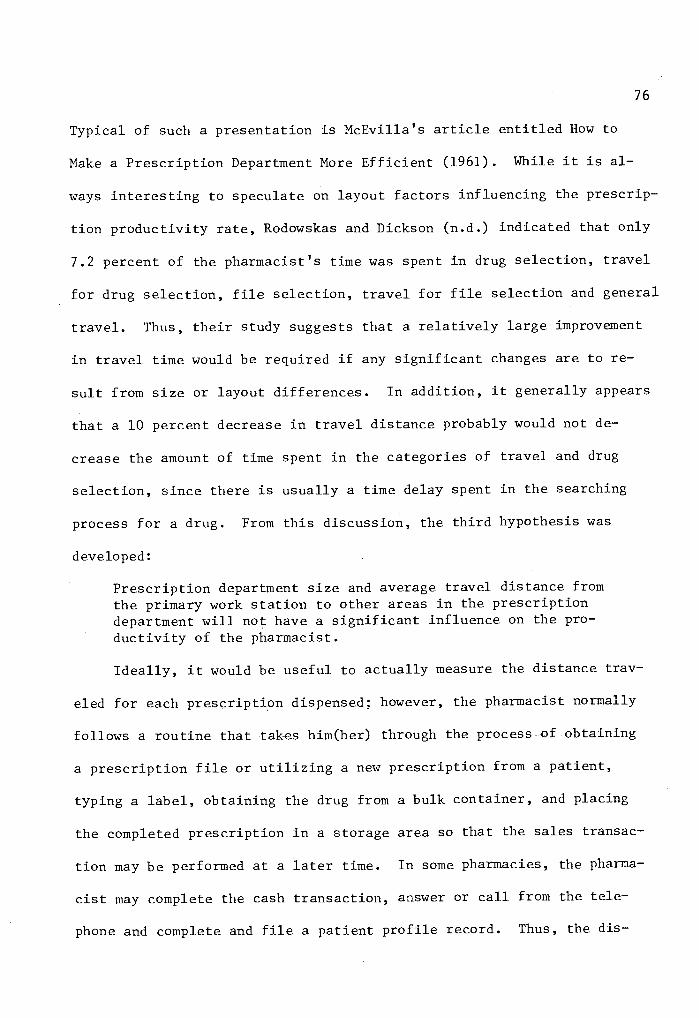
76
Typical of such a presentation is McEvilla's article entitled How to
Make a Prescription Department More Efficient (1961). While it is al-
ways interesting to speculate on layout factors influencing the prescrip-
tion productivity rate, Rodowskas and Dickson (n.d.) indicated that only
7.2 percent of the pharmacist's time was spent in drug selection, travel
for drug selection, file selection, travel for file selection and general
travel. Thus, their study suggests that a relatively large improvement
in travel time would be required if any significant changes are to re-
sult from size or layout differences. In addition, it generally appears
that a 10 percent decrease in travel distance probably would not de-
crease the amount of time spent in the categories of travel and drug
selection, since there is usually a time delay spent in the searching
process for a drug. From this discussion, the third hypothesis was
developed:
Prescription department size and average travel distance fromthe primary work station to other areas in the prescriptiondepartment will not have a significant influence on the pro-ductivity of the pharmacist.
Ideally, it would be useful to actually measure the distance trav-
eled for each prescription dispensed; however, the pharmacist normally
follows a routine that takes him(her) through the process of obtaining
a prescription file or utilizing a new prescription from a patient,
typing a label, obtaining the drug from a bulk container, and placing
the completed prescription in a storage area so that the sales transac-
tion may be performed at a later time. In some pharmacies, the pharma-
cist may complete the cash transaction, answer or call from the tele-
phone and complete and file a patient profile record. Thus, the dis-

77
tance to each of these task areas could be an important factor in pro-
ductivity. The questionnaire utilized in each pharmacy, prior to the
collection of task activity data, provided an opportunity to measure the
distance from the primary prescription processing center (typing station)
to the drug storage area, prescription file storage area, nearest cash
register, nearest telephone and storage area for completed prescrip-
tions (question 9, Appendix D). The primary prescription processing
center was defined as the typing station since pharmacists appear to
initiate their activities from the typing station. The average of these
distances provided a quantification factor that was utilized as a surro-
gate of efficient layout in the prescription department. Physical size,
as measured in square feet, was utilized as the prescription processing
area size factor.
In regressing with the Y2 dependent variable, size in square feet
was the 11th variable to be added to the regression equation, while the
average distance traveled was the 12th variable added to the equation.
In regressing the Y3 dependent variable, these same two independent
variables added on at the 7th and 8th step; however, none of these inde-
pendent variables were significant at the 95 percent confidence level
(Table 19). Thus, hypothesis three is accepted.
Research question four suggests a search to find relationships be-
tween equipment utilized in the prescription processing function and the
resulting change in productivity. The prescription processing function
is generally recognized as a relatively labor intensive process. For
example, the telephone, typewriter, and counting tray are the primary
mechanical tools utilized by most pharmacists. Although equipment can
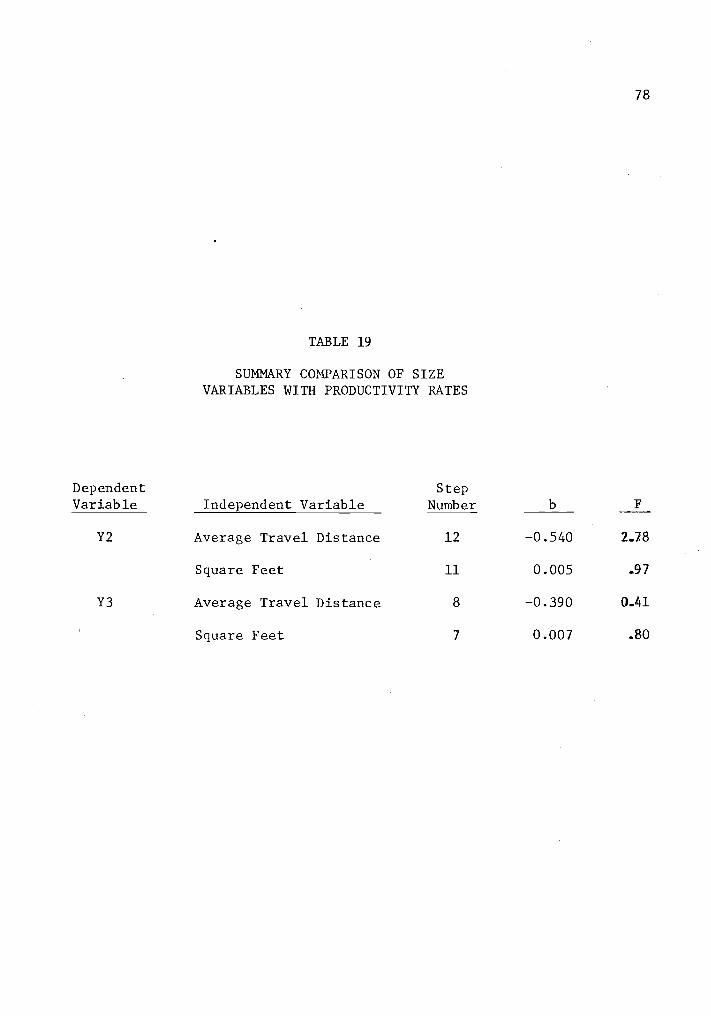
78
TABLE 19
SUMMARY COMPARISON OF SIZEVARIABLES WITH PRODUCTIVITY RATES
Dependent StepVariable Independent Variable Number b F
Y2 Average Travel Distance 12 -0.540 2.78
Square Feet 11 0.005 .97
Y3 Average Travel Distance 8 -0.390 0.41
Square Feet 7 0.007 .80

79
be utilized for counting tablets or capsules, most of this equipment is
relatively slow, or requires considerable capital input for the amount
of use that the equipment may receive. For example, most of the semi-
automatic tablet counters on the market today appear to be most useful
when they are utilized to count a relatively large number of units at
any one time. It is the belief of some pharmacists that the adjustments
to prepare the tablet counter for counting may actually require more
time than the actual counting of the tablets by a pharmacist. Thus, as
indicated in the study by Campbell et al. (1974), a counting device may
be useful when it is coupled with a prepackaging process. Unfortunately,
the community pharmacy has little control over the package size that is
to be dispensed. Except for a very limited number of prescribed medica-
tions, prepackaging is generally not considered by community pharmacists
to be useful, since the number of tablets in a container for a particu-
lar medication cannot be anticipated.
The use of electronic data processing equipment also suggests the
possibility of saving pharmacist input time in the prescription proces-
sing function. This is especially true if the data processing equipment
is programmed to provide other prescription processing functions, such
as the processing of third-party prescription claims, providing informa-
tion to consumers, and so forth. During the time of data collection for
this study, electronic data processing equipment in Oregon was not
sophisticated enough to provide anything except the prescription label.
In addition, the input terminals, since they were more difficult to cor-
rect than a typewriter, possibly served as a source of confusion, in-
stead of an asset, to some pharmacists operating the system. From deduc-

80
tive reasoning of the previous information, hypothesis four was stated:
The utilization of capital inputs in the pharmacy will nothave a significant positive influence in the productivityrate of pharmacists.
In the regression equation with Y2 as the dependent variable, elec-
tronic data processing was the 5th variable added to the equation, while
the use of a desk calculator was the 6th variable added. However, both
variables had a negative beta value and neither was significant. A
tablet counter and communications equipment were the 13th and 14th vari-
ables added to the equation. Neither of these factors was significant.
In regressing with Y3 as the dependent variable, electronic data proces-
sing and the use of a calculator maintained the negative beta value,
while communications equipment, the 14th variable added to the equation,
was not significant (Table 20). Therefore, hypothesis four was accepted.
Influence of Services on Productivity
In examining previous factors influencing prescription processing
productivity, the primary investigation centered around an attempt to
identify independent variables with a positive influence on productivity.
Now, the investigation moves to examining the provision of services pro-
vided by pharmacies. Services usually would be expected to decrease
productivity rates, since time inputs are required to provide services.
Although some of these labor inputs may be substituted among either
pharmacists or nonpharmacists, a primary interest of this investigation
is the average cost in pharmacist time to provide some of these service
levels.
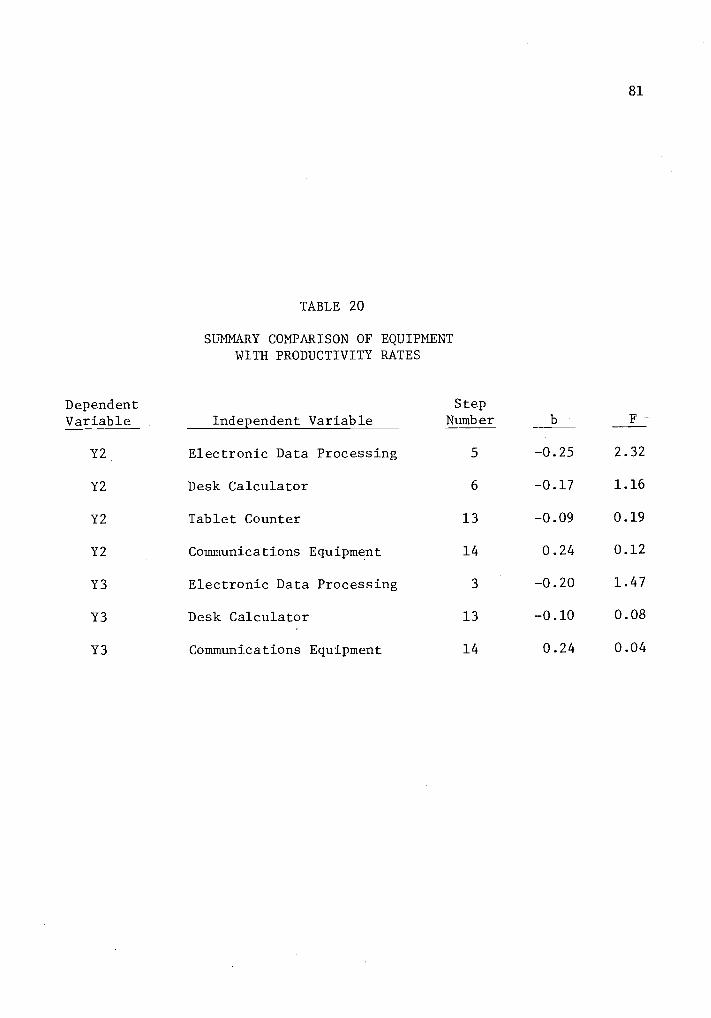
81
TABLE 20
SUMMARY COMPARISON OF EQUIPMENTWITH PRODUCTIVITY RATES
Dependent Step
Variable Independent Variable Number b F
Y2 Electronic Data Processing 5 -0.25 2.32
Y2 Desk Calculator 6 -0.17 1.16
Y2 Tablet Counter 13 -0.09 0.19
Y2 Communications Equipment 14 0.24 0.12
Y3 Electronic Data Processing 3 -0.20 1.47
Y3 Desk Calculator 13 -0.10 0.08
Y3 Communications Equipment 14 0.24 0.04
82
Third-Party Prescriptions
In a monopsony type of market where third-party payment systems
exert a strong influence in the market place, pharmacists and pharmacist
organizations have suggested that some third-party organizations may not
provide a reimbursement level that is sufficient to cover the cost of
services (Gibson, 1975 and Jones, 1972). For example, the State of Ore-
gon through the Adult and Family Services Division of the Department of
Human Resources pays for the medication of those eligible for Medicaid.
In reimbursing pharmacy providers, this organization has a fee schedule
which reimburses .a pharmacy at the rate of $2.70 per prescription. If a
pharmacy has a "usual or customary" fee which is less than the Oregon
fee schedule, the lower fee would be the required reimbursement level to
the pharmacy. However, if the "usual and customary" fee is higher than
the schedule fee, then the pharmacy would be reimbursed at the lower fee
schedule rate.
In addition to controlled fees for pharmaceutical services, it has
been indicated that third-party prescription payments do not approximate
the true economic cost of providing services (Siecker, 1977). Perhaps
some services may include the completion of third-party forms which are
required by the third-party in order for the pharmacist to make a claim
for the payment of prescribed medication. Question 5A of this study
suggests examining the amount of time spent in third-party clerical
activities by pharmacists, and thus, project the average time spent by
a pharmacist in completing these clerical activities.
Of the 18 pharmacies surveyed, only pharmacy number 123 did not
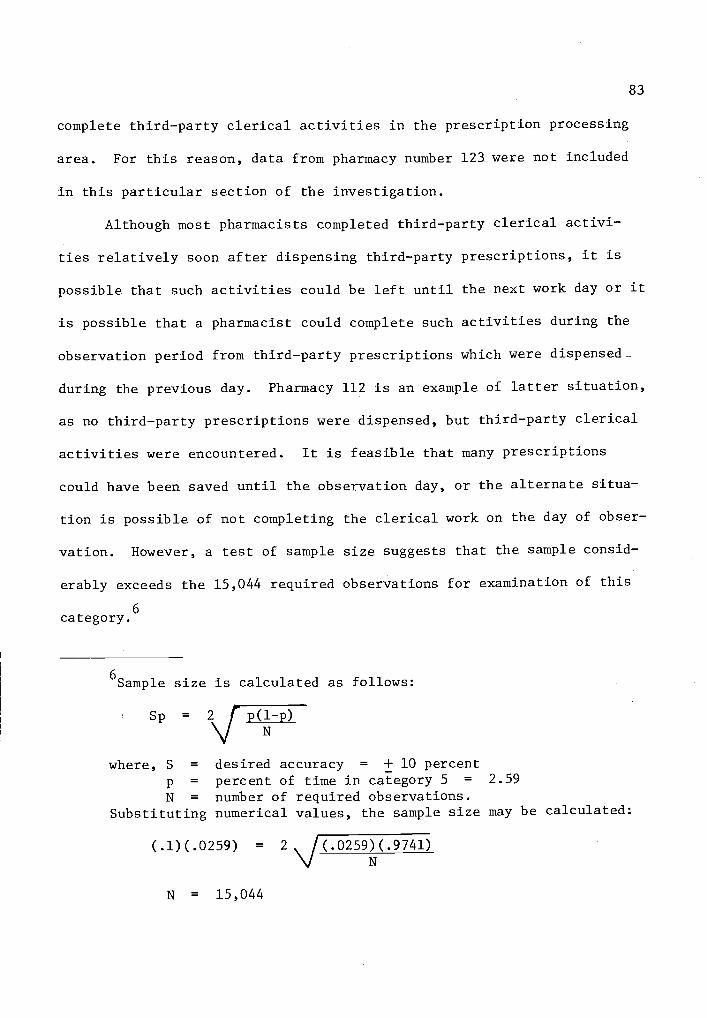
83
complete third-party clerical activities in the prescription processing
area. For this reason, data from pharmacy number 123 were not included
in this particular section of the investigation.
Although most pharmacists completed third-party clerical activi-
ties relatively soon after dispensing third-party prescriptions, it is
possible that such activities could be left until the next work day or it
is possible that a pharmacist could complete such activities during the
observation period from third-party prescriptions which were dispensed
during the previous day. Pharmacy 112 is an example of latter situation,
as no third-party prescriptions were dispensed, but third-party clerical
activities were encountered. It is feasible that many prescriptions
could have been saved until the observation day, or the alternate situa-
tion is possible of not completing the clerical work on the day of obser-
vation. However, a test of sample size suggests that the sample consid-
erably exceeds the 15,044 required observations for examination of this
category.6
6Sample size is calculated as follows:
Sp = 2,\ir p(1-p)
where, S =
p=N=Substituting
desired accuracy = ± 10 percentpercent of time in category 5 = 2.59
number of required observations.numerical values, the sample size may be calculated:
(.1)(.0259) = 2 V(.0259)(.9741)
N = 15,044
84
Since the sample size for the 17 pharmacies in this study exceeds
39,000 observations, it can be assumed that the sample size is suffic-
iently large to discount the potential bias influences of the pharmacist
not completing clerical work on the same day that the prescription is
dispensed.
It is also possible to suggest that sampling bias may have influ-
enced the amount of time spent in third-party clerical activities; as
many third-party agencies pay only on a certain day of the month. How-
ever, it is believed that sampling bias in this study would be minimized,
as Table 21 indicates the days of the month when sampling was conducted.
Ten sampling days were conducted during the first week, while 11 sampling
days (pharmacy number 123 excluded) were conducted during the last week,
leaving 19 days of sampling in the middle of the month.
In the questionnaire utilized to interview pharmacists at the begin-
ning of this study (see Appendix D), only two pharmacies provided a "yes"
answer when they were asked if a nonprofessional was permitted to record
information on third-party payment forms. Three other pharmacies indica-
ted that nonpharmacists were permitted to provide "some" of the activi-
ties, while the remainder of the sample apparently believed that the
function was too complicated for nonprofessionals, or did not utilize the
services of a nonprofessional in this activity. In spite of these
answers, each of the pharmacies utilized pharmacist input to complete
third-party clerical activities.
A primary concern about third-party clerical activities is the
amount of pharmacist time (and expense) associated with these activities.
It is generally believed that the drug distribution system should be

85
TABLE 21
SAMPLING DAYS BY PHARMACY
Day ofMonth November December January February March
12
3 231 112 1124 2225 2216 221 132 1137 132 11389 122
10 211 2311112 232 13213 232141516 212 13217 1311819 111 13120 121 13121 12122 231 13223 23324 212 213 13325 121 13326 123 233 213 13327 123 23328 233 223
2930 21131 222
86
reimbursed for pharmacist activities if pharmacist input is required to
complete this work. Utilizing the data from Table 22, it is indicated
that the average amount of pharmacist input spent in third-party cleri-
cal activities is 1.91 minutes.7 If a pharmacist received a wage of
$12.00 per hour or 20 cents per minute, the pharmacist wage cost would
be 38.26 cents for the average clerical activities of each third-party
prescription.
Patient Profiles
The use of patient profiles is receiving more attention in the pre-
scription processing function, as the responsibility for increased
knowledge of drug-drug interactions and the potential for increased
liability is placed upon pharmacists. Question 5B suggests an examina-
tion of relationships between productivity and patient profiles. There-
fore, an attempt is made to investigate these relationships.
Of the 18 pharmacies involved in the study, 12 offered patient pro-
files, 5 did not offer any patient records, while 1 pharmacy offered
patient profiles for a limited number of patients. Therefore, this por-
tion of the investigation will be limited to those pharmacies offering
7From the total of 39,622 observations in the 17 pharmacies invol-
ved with third-party clerical activities, 1,010 (2.55 percent) observa-
tions were involved in third-party clerical activities.
(2.55 percent)(359 hours) = 9.15 hours spent in third-party
clerical activities
9.15 hours of clerical activities 0.032 hours of clerical
287 third-party prestriptions activity per prescription
(.032 hours)(60 minutes/hour) = 1.91 minutes per prescription.

87
TABLE 22
CHARACTERISTICS OF PHARMACIES PROVIDINGTHIRD PARTY CLERICAL ACTIVITIES
Observationsof Third-Party
PharmacyNumber
NonpharmacistActivity
Clerical RxActivities
(n)
Third-PartyPrescriptions
(n)
Hours ofObservation
111 no 16 2 9
112 no 21 18
113 no 150 20 18
121 no 46 10 27
122 no 86 15 9
131 some 78 31 27
132 no 110 48 45
133 no 134 48 27
211 no 79 14 18
212 some 15 2 18
213 some 61 8 18
221 no 16 2 17
222 no 20 7 18
223 no 37 8 9
231 yes 68 45 27
232 no 39 5 18
233 yes 34 22 36
Total 1,010 287 359
88
patient profiles to all of their patrons. Table 23 provides some char-
acteristics of the 12 pharmacies which will be utilized to examine the
average amount of pharmacist time involved in clerical patient profile
activities.
Since this calculation represents a reduced portion of the sample,
a confirmation of the sample size was made.8
With 24,938 observations
from the 12 pharmacies, the sample was sufficiently large for this anal-
ysis. From the data in Table 23, it can be projected that the average
cost of pharmacist input time per prescription for patient profile acti-
vities would be more than 4 cents if the pharmacist received a wage of
$12.00 per hour.9
8Sample size was calculated by utilizing:
Sp = \113(1-P)
where, S + desired accuracy = + 10 percentp = percent of time in category 4 = 4.25
N = number of observations.Substituting the numerical values provides the sample size.
(.1)(.0425) = 2 (.0425)(.9575)N
N = 9,012
9Pharmacists in these 12 pharmacies spent 4.25 percent of theirtotal time in completing patient profile clerical activities. The obser-
vation period in these 12 pharmacies consisted of 224 hours. Thus, it
would be expected that 9.53 hours (4.25 percent times 224 hours) wouldhave been spent in clerical activities concerning patient profiles.Dividing the 9.53 hours by the 2.608 prescriptions that were dispensedduring this time period provides an estimate of a pharmacist's timespent (in hours) in clerical activities by patient profiles. Multiply-
ing the resultant quotient by 60 minutes per hour provides an estimateof 0.22 minutes per prescription. If the pharmacist were paid a wage of
$12.00 per hour, the average cost per prescription would be 4.4 cents.

89
TABLE 23
CHARACTERISTICS OF PHARMACIESOFFERING PATIENT PROFILES
ClericalPatient Total Hours of
Nonpharm- Profile Observa- Prescrip- Observa-
Pharmacy Patient acist Activities tions tions tion
Number Profiles Activity (n) (n) (n) (n)
111 yes no 66 960 56 9
112 yes yes 17 1,920 98 18
113 yes yes 73 2,124 139 18
123 yes no 177 1,920 190 18
131 yes yes 47 2,880 482 27
133 yes no 225 2,859 408 27
211 yes no 139 1,920 126 18
213 yes yes 164 2,160 148 18
221 yes yes 59 1,920 187 17
223 yes yes 17 1,465 99 9
231 yes yes 2 2,880 402 27
232 yes yes 75 1,930 273 18
Total 1,061 24,938 2,608 224

90
Part of the sample had nonprofessionals performing the clerical
task with patient profiles, while other pharmacies did not have anyone
except the pharmacist involved in this activity. Since the sample dis-
played these different characteristics, it provided an opportunity to
determine cost differences between these two groups of pharmacies.
Again, this subsample involved a reduction in the number of observations.
Thus, a check of the minimum sample size was performed from the data in
Table 24. Utilizing the same process that was previously utilized in
computing sample size, with the desired accuracy of + 10 percent at the
95 percent confidence level, the minimum acceptable sample size is
4,644. There were 7,659 observations taken in these four pharmacies;
thus, the sample size was sufficiently large.10
Pharmacists in the four pharmacies that did not utilize nonprofes-
sionals, spent an average of 7.93 percent of their time performing
clerical activities with patient profiles. This cost is nearly 9 cents
10Sample size was calculated by using:
Sp = 2 f p(1-p)N
where, S = desired accuracy = + 10 percent
p- percent of time in category 4 = 7.93
N = number of observations.Substituting the numerical values provides the sample size:
(.1)(.0793) = 2 V(.0793)(.9207)
N = 4644
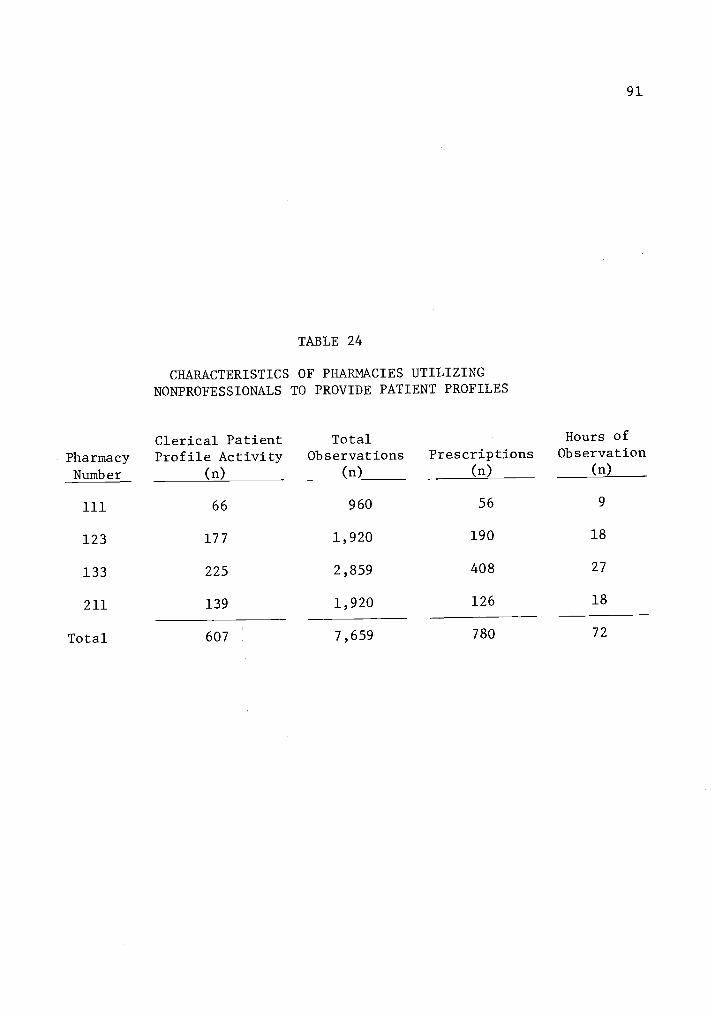
91
TABLE 24
CHARACTERISTICS OF PHARMACIES UTILIZINGNONPROFESSIONALS TO PROVIDE PATIENT PROFILES
PharmacyNumber
Clerical PatientProfile Activity
(n)
TotalObservations
(n)
Prescriptions(n)
Hours ofObservation
(n)
111 66 960 56 9
123 177 1,920 190 18
133 225 2,859 408 27
211 139 1,920 126 18
Total 607 7,659 780 72
92
per prescription if pharmacists were to receive the wage of $12.00 per
hour.11
Results from the eight pharmacies that did not utilize the services
of a subprofessional are reported in Table 25. Utilizing the data from
this table and the previously indicated standards of accuracy within +
10 percent at the 95 percent confidence level, a minimum acceptable sam-
ple size was indicated as 14,809.12 Since 17,279 observations were ob-
tained in these 8 pharmacies, the sample size was sufficiently large to
utilize for comparison purposes.
Only 2.63 percent of the pharmacist's time was spent in this acti-
vity when the pharmacist received assistance from subprofessionals.
This compares favorably with 7.93 percent of the time involved when only
pharmacists were involved in this activity. Again, a cost estimate is
11Multiplying 7.93 percent by the 72 hours that pharmacists in thissubsample spent in the pharmacy suggests that pharmacists in the sub-sample would be expected to spend 5.71 hours in patient profile activi-ty. Dividing the 5.71 hours by the 780 prescriptions dispensed, pro-vided the number of hours per prescription. This figure was convertedto minutes, suggesting that an average of 0.44 minutes were involved for
each prescription. If a pharmacist were paid $12.00 per hour, theresultant cost would be 8.78 cents for the pharmacist time spent inpatient profile clerical activities of each prescription.
12Sp (p) (1-p)
Nwhere, S = desired accuracy = + 10 percent
p = percent of time in category 4 = 2.63
N = number of observationsSubstituting the numerical values provided the sample size:
(.1)(.0263) = 2 V(.0263)(.9737)
N = 14,809

93
TABLE 25
CHARACTERISTICS OF PHARMACIES UTILIZINGONLY PHARMACISTS TO PROVIDE PATIENT PROFILES
PharmacyNumber
Clerical PatientProfile Activity
(n)
TotalObservations
(n)
Prescriptions-(n)
Hours ofObservation
(n)
112 17 1,920 98 18
113 73 2,124 139 18
131 47 2,880 482 27
213 164 2,160 148 18
221 59 1,920 187 17
223 17 1,465 99 9
231 2 2,880 402 27
232 75 1,930 273 18
Total 454 17,279 1,828 152

94
made by suggesting the average amount of time per prescription spent in
clerical patient profile activities.13
At the rate of $12.00 per hour for a pharmacist, the cost would be
2.62 cents per prescription, compared to 8.78 cents per prescription
without the assistance of a subprofessional. Thus, the use of the sub-
professional in this task activity provided a considerable monetary sav-
ing in the prescription processing function.
Financial Records
Prescribed medication is tax deductible and documentation of this
deduction is a service which one would expect to be utilized by many
patrons of -a pharmacy. In this study, four independently owned pharma-
cies and eight chain pharmacies provided a written financial receipt to
customers on a regular basis; however, four of the chain pharmacies uti-
lized a system of combining the patient profile with the monetary
receipt. Thus, observations for these four pharmacies were recorded in
the category of clerical task activities with the patient profile system
instead of the monetary receipt. Eliminating all pharmacies which did
not provide monetary receipts in a regular basis, and all pharmacies
which combined the activity of patient profiles with the monetary receipt,
eight pharmacies remained available for investigation. Table 26 provides
the characteristics of these eight pharmacies.
13(2.63 percent)(152 hours) = 3.99 hours of activity
3.99 hours1828 prescriptions
(.0022 hours)(60 minutes/hour) .131 minutes per prescription
.0022 hours per prescription

95
TABLE 26
CHARACTERISTICS OF PHARMACIES PROVIDINGMONETARY RECEIPTS WITH PRESCRIPTIONS
PharmacyNumber
Clerical ActivityObservations
(n)
TotalObservations
(n)
Prescriptions(n)
Hours ofObservation
(n)
112 113 1,920 98 18
113 2 2,124 139 18
122 28 962 97 9
131 205 2,880 482 27
212 53 1,920 102 18
223 27 1,465 99 9
231 17 2,880 402 27
233 134 4,080 115 36
Total 579 18,231 2,575 162
96
Pharmacists in the eight pharmacies spent 3.18 percent of their
time in the clerical category of providing monetary receipts. This per-
cent of activity would require a sample size of 12,176 observations at
the 95 percent confidence interval and a desired accuracy level of + 10
percent. The sample size of 18,231 exceeded the minimum sample size;
thus, it was utilized to project and compare differences.14
It must be recognized that considerable differences may exist in
the type of receipt issued from pharmacy to pharmacy, and no attempt has
been made to examine these qualitative differences. However, some phar-
macies typed a receipt, while others quickly completed a form with a
pen. Since a record for tax purposes is generally the primary use of the
receipt, the length of time spent in quality differences was not exam-
ined.
Examination of the data in Table 26 indicates that the cost of the
pharmacist's time in preparing the monetary receipt was 2.4 cents, if
the pharmacist was paid at the rate of $12.00 per hour.15
14Sp = 2 (p) (1-p)
where, S = desired accuracy level = + 10 percentp = percent of time in category 3 = 3.18N = number of observations.
Substituting the numerical values provided the sample size:
(.1)(.0318) = 2 V(.0318)(.968)
N = 12,176
15Converting the 3.18 percent of the pharmacist's work activities
to time per prescription was calculated as follows:
(3.18 percent)(162 hours) = 5.14 hours of activity
97
The examination of these data also provided an opportunity to inves-
tigate pharmacies that did not utilize nonprofessionals. Three pharma-
cies provided monetary receipts to patrons, but did not permit the non-
professional to provide this function. Although this examination invol-
ved only three pharmacies, the 8,880 observations exceeded the minimum
requirement of 7,459, at the 95 percent confidence level and a desired
accuracy level of + 10 percent.16
In examining pharmacies that did not utilize a subprofessional to
assist with the preparation of a monetary receipt, an average of 5.09
percent (Table 27) of the pharmacist's time was spent in this task acti-
vity category in these three pharmacies. The average amount of time to
prepare a monetary receipt is .142 minutes, or a cost of 2.85 cents per
15 continued5.14 hours2575 prescriptions
.0020 hours per prescription
(.0020 hours)(60 minutes per hour) = 0.120 minutes per prescrip-tion
Converting the 0.120 minutes to monetary costs at the rate of 20cents per minute ($12.00 per hour) for a pharmacist would provide therate of 2.4 cents per prescription.
16Sample size was calculated by utilizing:
Sp = (p)(1-p)
where, S = desired accuracy level = + 10 percentp = percent of time in categoryN = number of observations.
Substituting the numerical values provides the sample size:
(0.1)(0.0509) = 2\1(0.0509)(0.9491)
N = 7,459

98
TABLE 27
CHARACTERISTICS OF PHARMACIES UTILIZINGONLY PHARMACISTS TO PROVIDE MONETARY RECEIPTS
ClericalActivity Total Hours of
Pharmacy Observations Observations Prescriptions ObservationNumber (n) (n) (n) (n)
112 113 1,920 98 18
131 205 2,880 482 27
233 134 4,080 1,156 36
Total 452 8,880 1,736 81

99
prescription, if the pharmacist was paid at the rate of $12.00 per
hour.17
Although the percent of time (5.09 percent) is considerably
larger than all pharmacies providing this service, the cost increase per
prescription is only slightly less than one-half of a cent per prescrip-
tion, at the rate of 20 cents per minute for a pharmacist wage.
A similar test was attempted for pharmacies utilizing nonprofes-
sionals to assist with the monetary receipt; however, the use of a non-
professional reduced the pharmacist's involvement to 1.36 percent of his
(her) total activities. This small percentage dictated a sample size of
29,011, which exceeded the 9,351 observations in this cell. Therefore,
comparisons were not attempted with this group.18
17(5.09 percent)(81 hours) = 4.12 hours of activity
4.12 hours1736 prescriptions
= 0.0024 hours per prescription
(.0024 hours)(60 minutes/hour) = 0.142 minutes per prescription
(0.142 minutes)(20 cents/minute) = 2.85 cents per prescription
18Sample size is again calculated from:
S = 2\/ (p) (1-p)N
where, S = desired accuracy level = + 10 percent
p = percent of time in category 3 = 1.36
N = number of observations.Substituting the numerical values provided by the sample size:
(0.1) (0.0136) = 2 \4((0.0136)(0.9864)
N = 29,012
100
CHAPTER VI
DISCUSSION
The intent of the discussion section is to examine the results of
this research compared to the results of similar studies. Then, an at-
tempt will be made to investigate some of the costs in the prescription
processing function. Although the intent will not include an examina-
tion of all costs in the prescription processing function, it will focus
upon some of the more obvious applications identified in this research.
Finally, an attempt will be made to examine the influence of some fac-
tors in a predictive model for labor costs.
Comparison with Other Research
In comparing this study with the work of others, an attempt is made
to compare studies of similar environments. Therefore, comparisons are
made with other studies from community pharmacies, but not institutional
pharmacies. The most extensive studies in the community pharmacy are
those of Rodowskas and Dickson (n.d.), Rodowskas and Gagnon (1972), and
Ryan and Smith (n.d.). Many categories in this Oregon study are similar
to those of Rodowskas and Dickson (n.d.) and Table 28 provides a compar-
ison of the percent of time spent in work activities from the two stu-
dies. The work of Rodowskas and Gagnon (1972) is more difficult to
compare in tabular form since many of the task categories refer to func-
tions only in the prescription department. It is important to indicate
that in comparing studies utilizing similar categories, there may still
be differences in activity levels due to differences in category defi-
nition, or possibly even recording the observations.
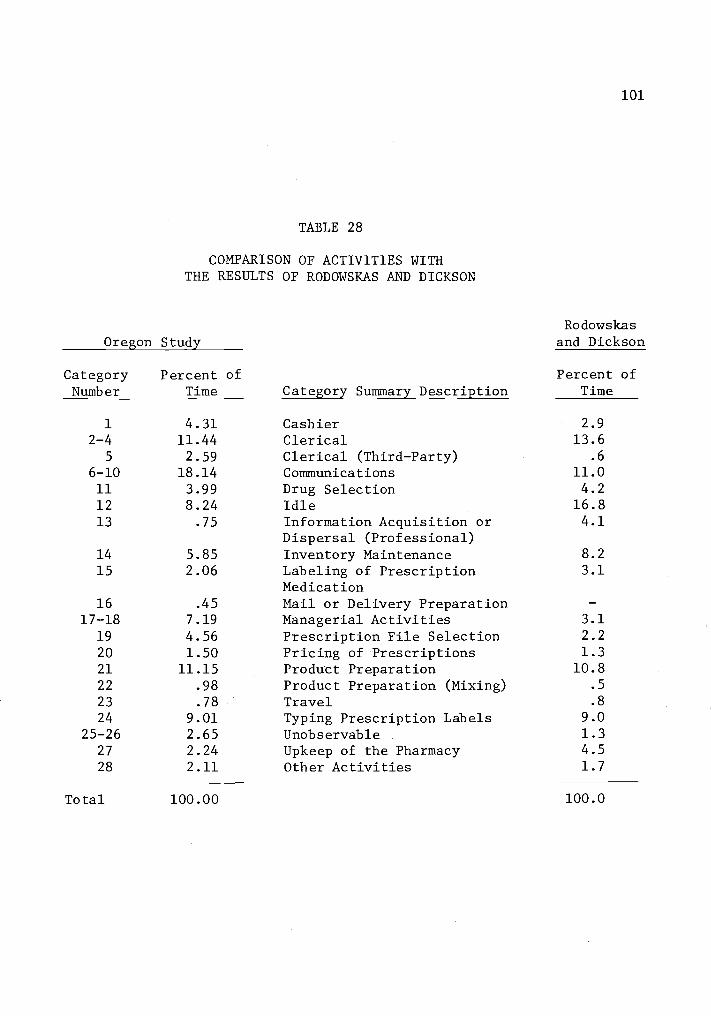
101
TABLE 28
COMPARISON OF ACTIVITIES WITHTHE RESULTS OF RODOWSKAS AND DICKSON
Oregon Study
Category Summary Description
Rodowskasand Dickson
CategoryNumber
Percent ofTime
Percent ofTime
1
2-45
4.3111.442.59
CashierClericalClerical (Third-Party)
2.913.6
.6
6-10 18.14 Communications 11.0
11 3.99 Drug Selection 4.2
12 8.24 Idle 16.813 .75 Information Acquisition or 4.1
Dispersal (Professional)14 5.85 Inventory Maintenance 8.2
15 2.06 Labeling of Prescription 3.1
Medication16 .45 Mail or Delivery Preparation
17-18 7.19 Managerial Activities 3.1
19 4.56 Prescription File Selection 2.2
20 1.50 Pricing of Prescriptions 1.3
21 11.15 Product Preparation 10.8
22 .98 Product Preparation (Mixing) .5
23 .78 Travel .8
24 9.01 Typing Prescription Labels 9.0
25-26 2.65 Unobservable 1.3
27 2.24 Upkeep of the Pharmacy 4.5
28 2.11 Other Activities 1.7
Total 100.00 100.0
102
In comparing the percent of time spent in task activity categories
of this Oregon study with the study of Rodowskas and Dickson (n.d.), it
must be recognized that organizational influences could provide a dif-
ference in the percent of time spent in various task activities. For
example, pharmacists in this study spent a greater percent (4.31 to 2.9)
of time involved in cashier activities (category 1). The percent of
time spent in clerical activities (categories 2-5) were quite similar,
with this study indicating a slightly smaller percentage (14.03 to 14.2)
of time. The Oregon study (category 12) indicated a smaller percent of
time spent in idle activities (8.24 to 16.8 percent). However, several
factors may account for this difference. First, the study of Rodowskas
and Dickson (n.d.) obtained data only from chain pharmacies, and it
appears that pharmacists employed in chain pharmacies may have more idle
time, as the Oregon study indicated that chain pharmacists spent 11.02
percent of their activities in idleness, as compared to 5.61 percent for
pharmacists employed in independently owned pharmacies. A second factor
explaining the difference in idle time may be the time of day, and the
day of the week when the survey was taken. This study utilized the
first nine hours of the day, and sampled only Monday through Friday.
Rodowskas and Dickson (n.d.) sampled during the entire work day, and
seven days of the week. A final factor in explaining this differential
may be in the definition of categories, as it is possible that Rodowskas
and Dickson (n.d.) may have placed more of the unobservable activities
(category 26 and 27) in the "idle" category than was reported in this
study.
Rodowskas and Dickson (n.d.) indicated the pharmacists spent a
103
smaller percent (3.1) of their time in managerial activities (category
17) than reported by this Oregon study (7.19 percent). It is interest-
ing to note, however, that Rodowskas and Gagnon (1972) reported that 10
percent of the pharmacist's time was spent in managerial activities.
Again, the percent of time spent in this activity appears to be a func-
tion of environment.
Although differences were recorded in the percent of time spent in
certain dispensing activities (categories 11, 15, 19, 20, 21, 22, and
24), the total amount of time spent in the seven dispensing categories
of this study was quite comparable with the work of Rodowskas and Dick-
son (n.d.). This study reported 33.25 percent while Rodowskas and
Dickson (n.d.) reported 31.1 percent. This study reported less time
spent in the category of prescription labeling (2.06 percent to 3.1 per-
cent), while Rodowskas and Dickson (n.d.) reported a smaller percent of
time spent in the category of prescription file selection (2.2 percent
to 4.65 percent). Although there does not appear to be a conspicuous
difference in the definition of the task activity for labeling, a slight
difference does exist for the definition of prescription file selection.
Rodowskas and Dickson (n.d.) did not include the reshelving of closed
prescription files which were set aside, in the category of "Prescrip-
tion File Selection." In their study, closed prescription files which
were filed at a later time were placed in category 27 (upkeep). As
might be expected, pharmacists in the study of Rodowskas and Dickson
(n.d.) spent a greater percent of their time in upkeep activities (4.5
percent to 2.24 percent).
One category of interest (information acquisition) provided a rela-
104
tively wide difference between this study and the study of Rodowskas and
Dickson (n.d.). Rodowskas and Dickson (n.d.) reported that pharmacists
spent 4.1 percent of their activity time in acquiring information, while
our study reported that pharmacists spent only 0.75 percent of their
time in this category. An explanation of this difference may have been
the sampling times during which the information was gathered. Rodowskas
and Dickson (n.d.) sampled all seven days of the week, and during all
hours that a pharmacy was open, while this study selected the first nine
hours of each day only, Monday through Friday. This category may be
related to the "Idle" category, and one would assume that pharmacists
with a greater percent of idle time would tend to spend a greater portion
of this time in acquiring information.
In summary, while there are differences in the percent of time spent
in specific work activities, most of these differences appear to be ex-
plainable. However, in general, it appears that the results received
from these two studies are relatively comparable or explainable. Both
this study and the study of Rodowskas and Dickson (n.d.) represent sam-
ples from relatively distant geographical areas (major Eastern metropol-
itan area and Western Oregon). Therefore, it is gratifying to see that
major differences did not exist in the amount of time spent by pharma-
cists in the work activities of these two studies.
In comparing the results of this Oregon study with the results of
Ryan and Smith (n.d.) in Mississippi, the task was more difficult, since
it involved combining categories within both studies. This is extremely
apparent in the category concerning telephone communications. Telephone
communications in the Mississippi study were not indicated in the task

105
activities, and this activity accounts for more than 11 percent of the
total activities in the Oregon study. Results of the comparisons are
in Table 29.
While most of the combined categories appear to mesh reasonably
well, there is a considerable difference in the percent of nonproductive
time reported by Ryan and Smith (n.d.). Nearly 33 percent of the phar-
macist's activities in this Mississippi study were indicated in the non-
productive categories of Idle (20.46 percent) and Personal (12.15 per-
cent). The Oregon study indicated that less than 10 percent of the
activities were reported in the nonproductive categories of Idle (8.24
percent) and Personal (1.42 percent).
Part of this difference may be due to the differing methodology of
the two studies, as the Mississippi study utilized a random selection of
pharmacies, and readings were taken each day of the week, except Sunday.
In general, it appears the Oregon pharmacist had a much smaller percent
of nonproductive time than his (her) southern counterpart.
Influence of the Subprofessional on Costs
The stepwise regression model has indicated that some activities of
the subprofessional may influence the prescription productivity rate.
The position of the subprofessional (working in the prescription proces-
sing area) was the first variable to be reported in the regression pro-
cess, and it was significant at the 95 percent confidence level.
In the discussion of subprofessionals, some of the decisive ques-
tions which remain unanswered are:
1. Should productivity include only the pharmacist, or should
the productivity of all people (professionals and nonpro-
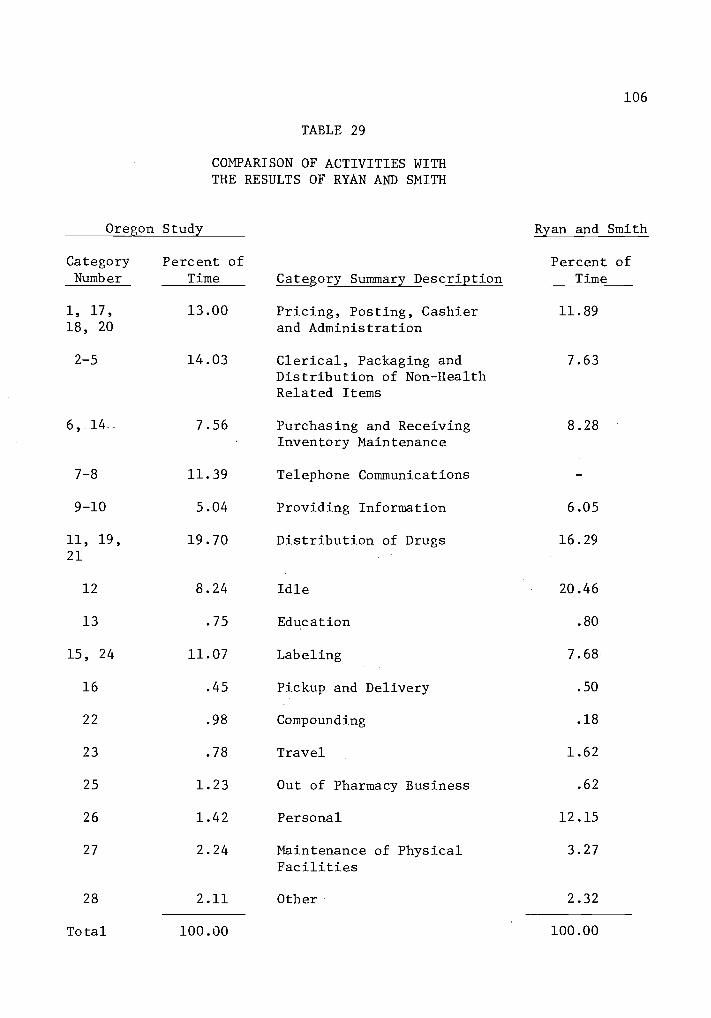
106
TABLE 29
COMPARISON OF ACTIVITIES WITHTHE RESULTS OF RYAN AND SMITH
Oregon Study
Category Summary Description
Ryan and Smith
CategoryNumber
Percent ofTime
Percent ofTime
1, 17, 13.00 Pricing, Posting, Cashier 11.8918, 20 and Administration
2-5 14.03 Clerical, Packaging and 7.63Distribution of Non-HealthRelated Items
6, -14- 7.56 Purchasing and Receiving 8.28Inventory Maintenance
7-8 11.39 Telephone Communications
9-10 5.04 Providing Information 6.05
11, 19, 19.70 Distribution of Drugs 16.2921
12 8.24 Idle 20.46
13 .75 Education .80
15, 24 11.07 Labeling 7.68
16 .45 Pickup and Delivery .50
22 .98 Compounding .18
23 .78 Travel 1.62
25 1.23 Out of Pharmacy Business .62
26 1.42 Personal 12.15
27 2.24 Maintenance of Physical 3.27Facilities
28 2.11 Other 2.32
Total 100.00 100.00

107
fessionals) in the prescription processing function be
considered?
2. Does the use of a subprofessional lower or raise the cost
of labor inputs in the average labor input per prescription?
In an attempt to probe the first question, one must recall that the
purpose of this study was to examine the productivity of a relatively
scarce resource - the licensed pharmacist. If the purpose were to exam-
ine the productivity of all labor inputs in the prescription processing
function, then the work activities of subprofessionals would have been
recorded, as well as the work activities of the pharmacist. If the non-
professional continues to receive relatively high levels of utilization
in the prescription processing function, then future investigations of
activities may wish to examine the work activities of the nonprofession-
al, as well as the work activities of the practicing pharmacist.
Utilizing the data from this study, it was necessary to make some
assumptions concerning the utilization and cost of nonprofessionals in
the prescription processing function. In an attempt to make a compari-
son, it was first assumed that nonprofessionals working outside of the
prescription processing area did not contribute anything to the prescrip-
tion processing function. Secondly, it was assumed that nonprofession-
als performing activities in the prescription processing area contribu-
ted the same percent of time to the prescription processing function as
the pharmacists who perform prescription activities in this function.
Finally, it assumed the pay scale was $12.00 per hour for pharmacists
and $3.00 per hour for nonprofessionals.
Data in table 30 provide a synopsis of the nine pharmacies that
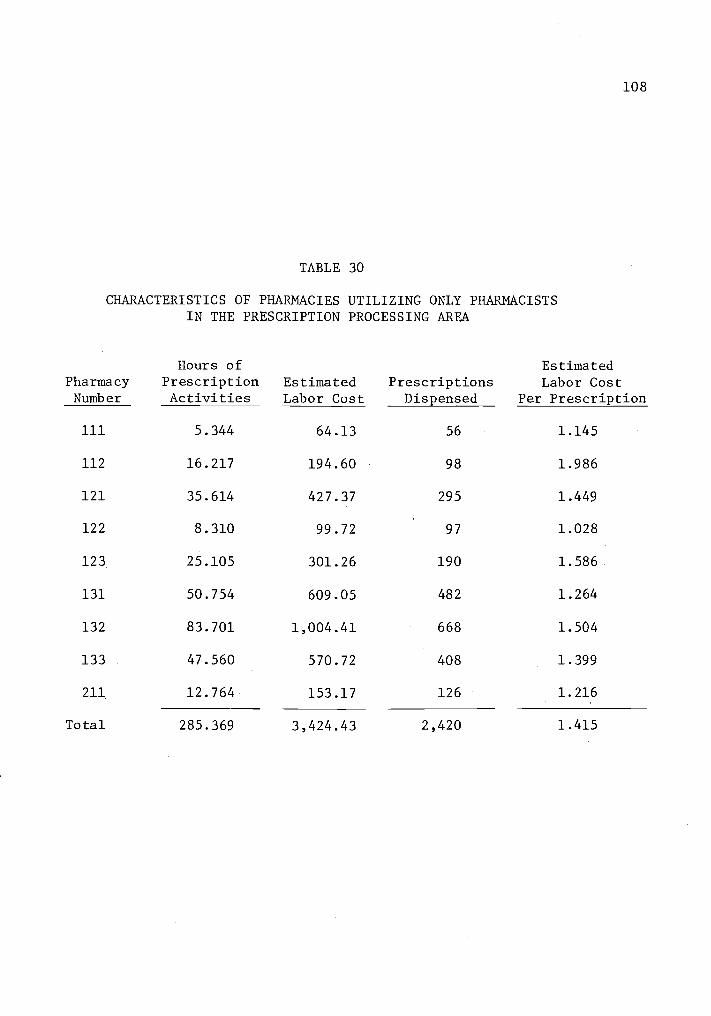
108
TABLE 30
CHARACTERISTICS OF PHARMACIES UTILIZING ONLY PHARMACISTSIN THE PRESCRIPTION PROCESSING AREA
PharmacyNumber
Hours ofPrescriptionActivities
EstimatedLabor Cost
PrescriptionsDispensed
EstimatedLabor Cost
Per Prescription
111 5.344 64.13 56 1.145
112 16.217 194.60 98 1.986
121 35.614 427.37 295 1.449
122 8.310 99.72 97 1.028
123 25.105 301.26 190 1.586
131 50.754 609.05 482 1.264
132 83.701 1,004.41 668 1.504
133 47.560 570.72 408 1.399
211 12.764 153.17 126 1.216
Total 285.369 3,424.43 2,420 1.415

109
did not utilize the assistance of nonprofessionals in the prescription
processing function. The hours of prescription processing activities
were based upon the percent of time spent in prescription activities.
For example, the pharmacist in pharmacy number 111 spent 59.4 percent of
his (her) total activities in prescription activities. This percentage
multiplied by the 9 hours spent in the pharmacy suggested that 5.344
hours were spent in prescription activities. This same process was com-
pleted for each of the other eight pharmacies and the hours were totaled,
indicating that a total of 285.369 hours were spent in prescription
activities by the pharmacists employed in these 9 pharmacies. Utilizing
an assumed wage of $12.00 per hour for a pharmacist, the estimated ave-
rage labor cost per prescription for this group of pharmacies is
$1.42.19
Table 31 provides a summary of data from the nine pharmacies that
utilized the services of a nonprofessional in the prescription proces-
sing function. Again, the hours of prescription activity were computed;
however, this table contained the time of the pharmacist and the pre-
scription activity time of the nonpharmacist which was assumed to be the
same percentage as the pharmacist in each pharmacy. The estimated ave-
rage labor cost for this group of pharmacies is $1.05 per prescription.20
19Multiplying the number of hours by the assumed wage provides a
projection of the total labor cost. 285.369 hours times $12.00 per
hour = $3,424.43. Dividing this estimate by the number of prescrip-tions provides an estimate of the labor cost per prescription.$3,424.432,420
= $1.415 per prescription
20The hours of prescription activities are multiplied by the assumedwage of $12.00 per hour for the pharmacist and $3.00 per hour for the
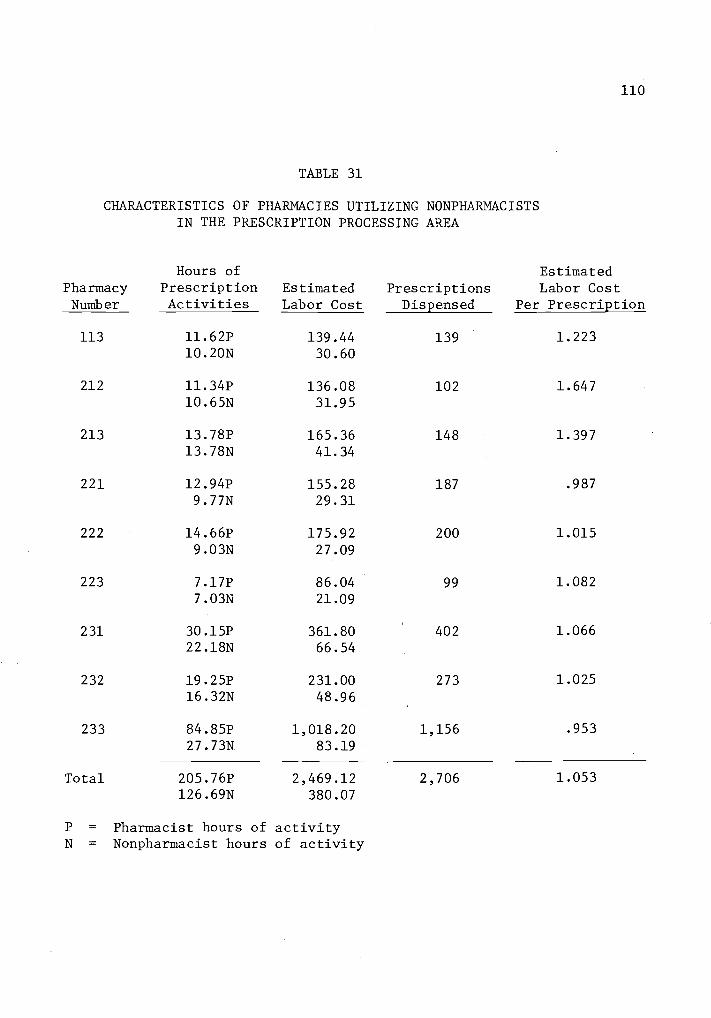
110
TABLE 31
CHARACTERISTICS OF PHARMACIES UTILIZING NONPHARMACISTSIN THE PRESCRIPTION PROCESSING AREA
PharmacyNumber
Hours ofPrescriptionActivities
EstimatedLabor Cost
PrescriptionsDispensed
EstimatedLabor Cost
Per Prescription
113 11.62P 139.44 139 1.22310.20N 30.60
212 11.34P 136.08 102 1.64710.65N 31.95
213 13.78P 165.36 148 1.39713.78N 41.34
221 12.94P 155.28 187 .987
9.77N 29.31
222 14.66P 175.92 200 1.015
9.03N 27.09
223 7.17P 86.04 99 1.0827.03N 21.09
231 30.15P 361.80 402 1.06622.18N 66.54
232 19.25P 231.00 273 1.025
16.32N 48.96
233 84.85P 1,018.20 1,156 .953
27.73N 83.19
Total 205.76P 2,469.12 2,706 1.053126.69N 380.07
P = Pharmacist hours of activityN = Nonpharmacist hours of activity
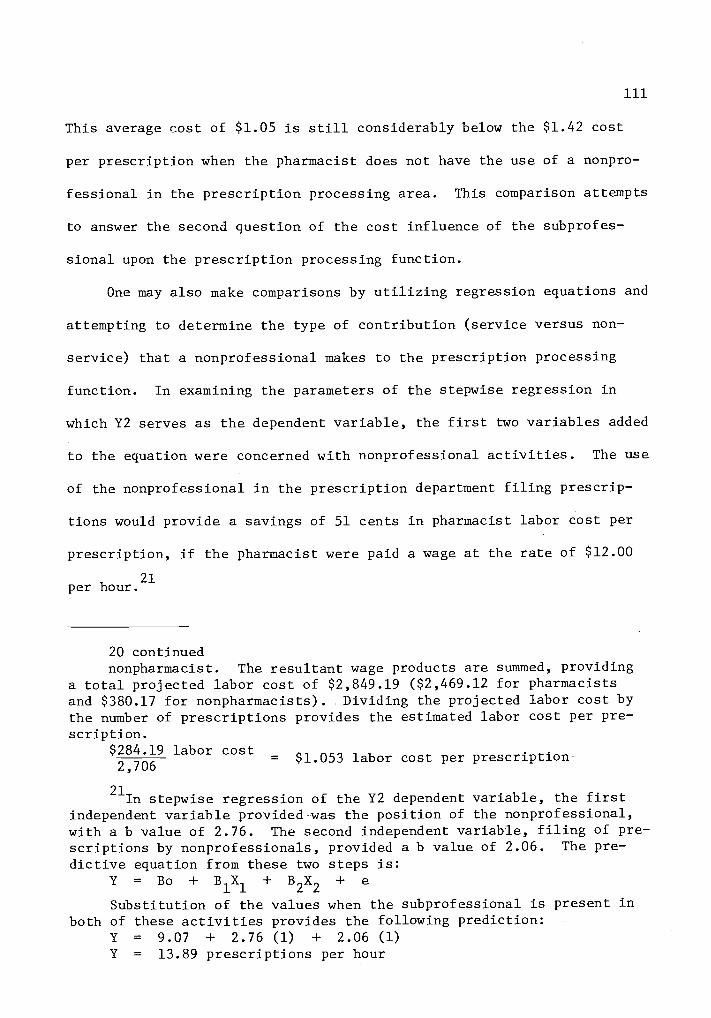
111
This average cost of $1.05 is still considerably below the $1.42 cost
per prescription when the pharmacist does not have the use of a nonpro-
fessional in the prescription processing area. This comparison attempts
to answer the second question of the cost influence of the subprofes-
sional upon the prescription processing function.
One may also make comparisons by utilizing regression equations and
attempting to determine the type of contribution (service versus non-
service) that a nonprofessional makes to the prescription processing
function. In examining the parameters of the stepwise regression in
which Y2 serves as the dependent variable, the first two variables added
to the equation were concerned with nonprofessional activities. The use
of the nonprofessional in the prescription department filing prescrip-
tions would provide a savings of 51 cents in pharmacist labor cost per
prescription, if the pharmacist were paid a wage at the rate of $12.00
per hour.21
20 continuednonpharmacist. The resultant wage products are summed, providing
a total projected labor cost of $2,849.19 ($2,469.12 for pharmacistsand $380.17 for nonpharmacists). Dividing the projected labor cost bythe number of prescriptions provides the estimated labor cost per pre-scription.
$284.19 labor cost=
2,706$1.053 labor cost per prescription
21In stepwise regression of the Y2 dependent variable, the first
independent variable provided was the position of the nonprofessional,with a b value of 2.76. The second independent variable, filing of pre-scriptions by nonprofessionals, provided a b value of 2.06. The pre-
dictive equation from these two steps is:Y = Bo + B1X1 + B2X2 + e
Substitution of the values when the subprofessional is present inboth of these activities provides the following prediction:
Y = 9.07 + 2.76 (1) + 2.06 (1)
Y = 13.89 prescriptions per hour
112
In the Y3 stepwise regression equation, the first two variables
were again the same as entered with the Y2 stepwise regression. How-
ever, the cost savings of utilizing the nonprofessional was estimated to
be 31 cents per prescription.22
The smaller differential cost of pharm-
acist wages in the service activities (categories 1, 3, 5, 7, 8, 9 and
16) suggests that the subprofessional contributed to providing activi-
ties with service attributes.23
21 continuedIf the subprofessional is not providing these functions, then a
zero is entered for the value of X1 and X2, and the predicted value
would be 9.07 prescriptions per pharmacist per hour. Dividing these
two values into an assumed $12.00 per hour wage for the pharmacist, pre-
dicts a pharmacist labor cost of $0.81 per prescription, when the sub-
professional works in the prescription processing area and files pre-
scriptions. If the pharmacist had no assistance, the pharmacist labor
cost per prescription would be predicted at $1.32, or a difference of
$0.51 per prescription.
22Similar to the calculations in footnote 21, the value of 5.081
was substituted for Bl and the value of 3.658 was substituted for B2.
The predictive equation with all activities being performed by subpro-
fessionals would be: Y = 13.16 + 5.081 (1) + 3.658 (1)Y = 20.05 prescriptions per pharmacist per hour
If the subprofessionals were not present in the pharmacy, the ex-
pected rate would be 13.1 6 prescriptions per hour. If these two rates
were divided into the assumed pharmacist wage of $12.00 per hour, the
respective pharmacist labor costs would be predicted as $0.60 and $0.91
per prescription.
23If the average pharmacist wage for preparing a prescription with
no assistant is $1.32 and the amount is reduced to $0.91 when the ser-
vice attributes are not included, the differential is $0.41. In pharma-
cies utilizing nonpharmacists in the prescription processing area, the
average pharmacist wage of preparing a prescription would be predicted
as $0.81. If these same pharmacies utilizing nonprofessionals predict
the cost of $0.60 to produce a prescription without services, the cost
differential is $0.21. Therefore, it can be suggested that the nonpro-
fessional reduces the cost of these services by $0.20 ($0.21 subtracted
from $0.41).

113
Pharmacy Type
In previous portions of this study, pharmacy type and size were
examined with respect to the amount of time spent in various task cate-
gories, and significant differences were noted in communicative activi-
ties. Unfortunately, in a multiple regression process there may be dif-
ficulty in separating the impact of two independent variables when the
variables have a relatively high degree of colinearity. The independent
variables of chain pharmacy and the nonprofessional working in the pre-
scription processing area had a relatively high level of correlation
(0.778). In the process of removing the independent variables with the
least amount of correlation with Y2 and Y3 variables, the independent
variable chain was dropped from the regression equation. Still, type of
pharmacy is an important independent variable and should not be over-
looked. Therefore, additional regressions were attempted to uncover the
influence of pharmacy type.
When the stepwise regression was utilized with both chain and the
nonprofessional working in the prescription department, chain becomes
the seventh variable added to the regression, when a Y2 dependent vari-
able is utilized. On this stepwise addition, the chain pharmacy is not
significant at the 95 percent confidence level (Table 32).
When the Y3 variable is regressed, utilizing both of these indepen-
dent variables, chain is the first independent variable to enter the re-
gression equation. The independent variable chain is highly significant
(p .01) when it is added on this first step. Since the chain pharmacy
is the independent variable added on the first step in a regression
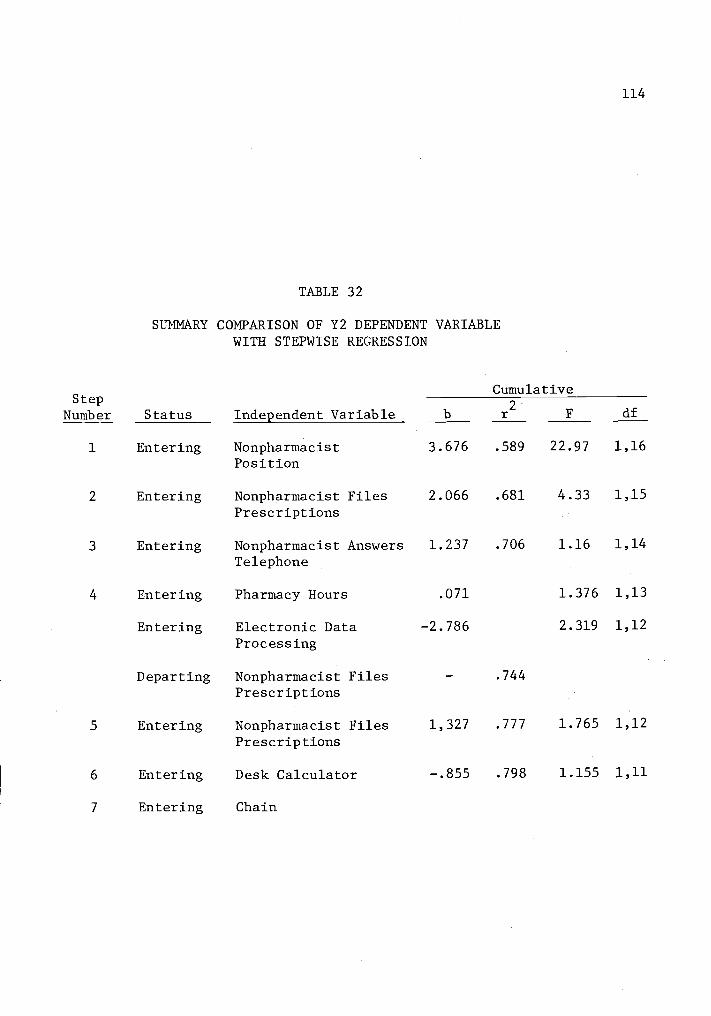
StepNumber
1
2
3
4
5
6
7
TABLE 32
SUMMARY COMPARISON OF Y2 DEPENDENT VARIABLEWITH STEPWISE REGRESSION
Status
Entering
Entering
Entering
Entering
Entering
Departing
Entering
Entering
Entering
114
Cumulative
Independent Variable b r2
F df
Nonpharmacist 3.676 .589 22.97 1,16
Position
Nonpharmacist Files 2.066 .681 4.33 1,15
Prescriptions
Nonpharmacist Answers 1.237 .706 1.16 1,14
Telephone
Pharmacy Hours .071 1.376 1,13
Electronic Data -2.786 2.319 1,12
Processing
Nonpharmacist Files .744
Prescriptions
Nonpharmacist Files 1,327 .777 1.765 1,12
Prescriptions
Desk Calculator -.855 .798 1.155 1,11
Chain

115
with Y3 dependent variable, it is apparent that chain pharmacies have a
decided advantage in productivity when a prescription is to be prepared
without any services or communications with the physician. This result
may be surprising to a number of pharmacists associated with indepen-
dently owned pharmacies, as it has traditionally been suggested that addi-
tional costs in independently owned pharmacies are due to the provision
of additional services. It appears from this research, however, that
additional costs in independently owned pharmacies may eminate from in-
efficiencies in the prescription processing function.
Predictive Model for Pharmacist Labor Costs
Sound management practices and a possible increase in the percent
of third-party prescriptions suggest the necessity for knowledge of the
prescription preparation cost. Although costs can be allocated within
an individual pharmacy, the process is expensive and/or the methodology
may be questionable, particularly with respect to pharmacist labor input
costs. Therefore, it is not without surprise that numerous attempts
have been made to devise a model to predict costs in the prescription
processing function.
Since pharmacists operate in a multiproduct firm, and there may be
certain characteristics of the firm which influence pharmacist output,
then it appears reasonable to allocate labor costs in some manner con-
cerning the characteristics of the pharmacy. Regression of independent
variables in this study has produced relatively gratifying predictive
results as compared with the previous work of others (Abrams, 1962;
Berki and Hornbrook, 1971; Look, n.d.; and Cotton, 1969).

116
Since the Y2 dependent variable indicates productivity with the
actual time spent in the prescription processing function, these models
will be restricted to regression with the Y2 dependent variable. Thus,
if predictions are made by utilizing this model, the prediction would
provide an expected productivity rate based upon the prescription pro-
cessing function, and not from slack activities due to demand of the
public for prescribed medication.
In suggesting a model for predictive purposes, a primary question
is the number of independent variables that should be added to the step-
wise regression equation. While it may be suggested that only variables
of a given level of confidence should be considered in a regression
equation, it also may be argued that additional independent variables
may contribute to the predictability of the model. For example, if the
added variable does not add more to the error of the regression process
than it contributes to the equation (i.e. the F test for the added vari-
able does not drop below one), then one may wish to add this variable if
it improves the regression coefficient (r2value) and decreases the error
term of the regression. Both approaches will be utilized in attempting
to build a functional model.
The stepwise regression of type and size characteristics was com-
pleted with all of the possible interactions of type and size. The first
variable added was chain, while the second variable was the interaction
term of small chain. Both variables were highly significant (p<.01).
At this point, the model had a regression coefficient (r2) value of
0.7557 and the prediction model was:

117
Y = 9.307 + 4.535X1
3.97X2
+ 1.296-
where, Xl = chain
X2 = small size chain.
If the stepwise regression was permitted to add an additional vari-
able, the variable small size pharmacy was added. Although this inde-
pendent variable was not significant, it improved the r2value to
0.7805, and decreased the mean square residual (error term for the equa-
tion). The addition of a fourth independent variable increased the mean
square residual; therefore, the stepwise process was stopped after the
addition of three variables providing the following model:
Y = 8.93 + 4.912X1
5.102X2
+ 1.13X3
+ 1.272
where, Xl - chain
X2 = small size chain
X3 = small size pharmacy.
Table 33 provides an output of this type by size model. Thus, a
pharmacy could be matched with one of these six cells and a prediction
could be made for an expected productivity outcome. If the pharmacist's
wage per hour was known, the expected cost of his (her) wage input per
prescription could be determined.
The stepwise regression of the independent variables examined in
this study provided the opportunity to examine a second model for pre-
dictive purposes. As indicated previously, the model in the first step
of the stepwise regression added the independent variable of the non-
professional working the prescription processing area. The addition of
this highly significant (p .01) variable provided an r2
value of 58.9
percent. The predictive model with one independent variable is:

118
TABLE 33
PREDICTION OF PRESCRIPTIONS PER PHARMACIST PER HOURBY TYPE AND SIZE OF PHARMACY
Type Size Mean
95 percentlimits(lower)
95 percentlimits(upper)
Independent Small 10.06 8.485 11.635
Medium 8.93 7.816 10.044
Large 8.93 7.816 10.044
Chain Small 9.87 8.295 11.445
Medium 13.842 12.72 8 14.955
Large 13.842 12.728 14.955
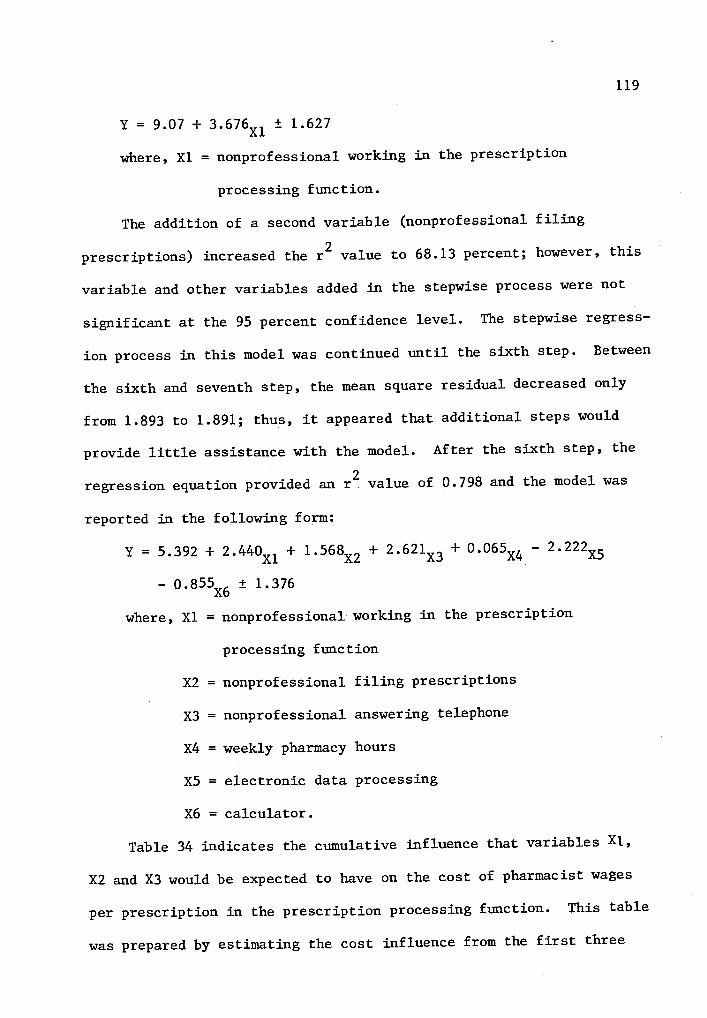
119
Y = 9.07 + 3.676X1
± 1.627
where, X1 = nonprofessional working in the prescription
processing function.
The addition of a second variable (nonprofessional filing
prescriptions) increased the r2 value to 68.13 percent; however, this
variable and other variables added in the stepwise process were not
significant at the 95 percent confidence level. The stepwise regress-
ion process in this model was continued until the sixth step. Between
the sixth and seventh step, the mean square residual decreased only
from 1.893 to 1.891; thus, it appeared that additional steps would
provide little assistance with the model. After the sixth step, the
regression equation provided an r2 value of 0.798 and the model was
reported in the following form:
Y = 5.392 + 2.440X1
+ 1.568X2
+ 2.621X3
+ 0.065X
- 2.222X5
0.8551(6 ± 1.376
where, X1 = nonprofessional working in the prescription
processing function
X2 = nonprofessional filing prescriptions
X3 = nonprofessional answering telephone
X4 = weekly pharmacy hours
X5 = electronic data processing
X6 = calculator.
Table 34 indicates the cumulative influence that variables XI,
X2 and X3 would be expected to have on the cost of pharmacist wages
per prescription in the prescription processing function. This table
was prepared by estimating the cost influence from the first three

120
TABLE 34
ESTIMATED INFLUENCE THAT VARIABLES Xl, X2, AND X3WOULD DECREASE THE PHARMACIST WAGES PER
PRESCRIPTION
PharmacistWages Per Hour Regression Variables
X1
X1+ X
2X1+ X
2+ X
3
$ 8.00 $ .46 $ .63 $ .81
9.00 .52 .71 .92
10.00 .57 .79 1.02
11.00 .64 .87 1.12
12.00 .70 .95 1.23
13.00 .75 1.03 1.33
14.00 .81 1.11 1.44
15.00 .86 1.18 1.53
16.00 .93 1.27 1.64
17.00 .98 1.34 1.74
18.00 1.04 1.43 1.84
19.00 1.09 1.50 1.94
20.00 1.16 1.58 2.05
121
variables in the model. Results of this table suggest that the non-
professionals working in the prescription processing area would decrease
the pharmacist wage cost per prescription. However, as the nonprofes-
sional becomes involved in more activities in the prescription proces-
sing area, the pharmacist wage cost per prescription is reduced even
further. This, of course, assumes that a relatively wide differential
exists between the wage of the pharmacist and the nonprofessional. In
this example a simulated market wage of $12.00 per hour was utilized
for the pharmacist, while the wate of $3.00 per hour was utilized for
the nonprofessional.
This model should be particularly useful to pharmacists who are
considering the addition of nonprofessionals or the use of equipment in
the prescription processing function. If a pharmacist attempts to uti-
lize this second model, all the values are dummy variables except X4
which would represent the number of hours that a pharmacy is open each
week.
In summary, these models, although relatively limited because of
the dummy variables, represent considerable improvement in a model to
estimate labor productivity of the pharmacist in the prescription pro-
cessing function. Although any of the models may be useful, the type
by size model appears to be quite useful to organizations planning store
size, or third-party organizations. In addition, this model deals with
only three independent variables.
Finally, it must be cautioned that models utilized for predictive
purposes should be tested in a variety of actual market situations.
Further testing of these models in different geographical areas is sug-
121A
gested as a method of validation. If further confirmation is obtained,
then the models may be useful tools for actual marketplace predictors.
122
CHAPTER VII
SUMMARY AND CONCLUSIONS
Summary
The primary objective of this study was to identify the
relationship of input factors in the community pharmacy prescription
processing function with observed levels of productivity under varying
environmental conditions. An attempt to accomplish this objective was
initiated with five major research questions which were based upon
previous research in the prescription processing function. Four of
the research questions were developed into five testable hypotheses.
The remaining question was utilized to investigate the cost of various
services on a unit cost per prescription.
Results of this research indicate that the type and size of
pharmacy apparently influences the percent of time spent in certain
activities. Communicative activities consumed a significantly larger
proportion of the pharmacist's total time in large pharmacies and in
chain pharmacies. The percent of time spent in the communicative
function of prescription activities was also significantly larger for
chains and large size pharmacies.
The work sampling data gathered from 18 pharmacies were utilized
to construct productivity rates for pharmacists in prescriptions per
pharmacist per hour. These productivity rates took three forms. An
Overall Productivity Rate (Y1), a Prescription Function Productivity
Rate (Y2) and a Nonservice Prescription Productivity Rate (Y3). The
Y2 and Y3 productivity rates were utilized as dependent variables in
a stepwise multiple regression process. Then, after running the

123
regression with 14 independent variables, it was possible to determine
if an independent variable had a significant influence upon the Y2 and
Y3 productivity factors. Using this statistical process, a test of
several research hypotheses was conducted.
The first research hypothesis indicated that pharmacy
prescription volume did not display a positive linear relationship
with productivity. As pharmacy prescription volume increased, there
was not a corresponding increase in the prescription productivity
rate. Thus, the first hypothesis was accepted.
A second hypothesis indicated there would not be a positive
relationship with an increase in productivity and the number of
pharmacists in the prescription processing function. Since the
independent variable, number of pharmacists, did not enter the
regression because of a lack of relationship, this second hypothesis
was accepted.
A third hypothesis, suggesting a positive relationship between
subprofessionals in the prescription processing area and the level of
productivity, was accepted. There has been considerable discussion
concerning the attributes of a subprofessional, and the acceptance of
this hypothesis connotes the economic feasibility of the subprofession-
al in the prescription processing function.
The fourth hypothesis suggested that a relationship would not be
indicated with Y2 productivity and two variables of physical size
(square feet and average travel distance) in the prescription
processing area. The testing of this fourth hypothesis did not provide
any significant relationships in examining factors that may influence
124
productivity, and this hypothesis was accepted.
The final hypothesis which was accepted,indicated a lack of
relationship with capital inputs and the productivity rate of
pharmacies. Thus, only one significant relationship was uncovered in
examining these five hypotheses.
An attempt was made to examine the costs of providing several
specified services in the pharmacy, with the assumption that a
pharmacist would receive a wage of $12.00 per hour and a
subprofessional would receive a wage of $3.00 per hour. This
analysis indicated that the average pharmacist wage cost for third-
party clerical activities in this study was more than 38 cents per
prescription. The average pharmacist wage cost per prescription for
providing patient profile records was 8.78 cents. However, this
pharmacist wage cost per prescription was reduced to 2.6 cents if the
nonprofessional assisted the pharmacist with this activity.
Other factors that this study brings forth are that subprofess-
ionals, in addition to lowering the average labor input cost of a
prescription, apparently provide a number of quality attributes in
the prescription processing function.
Finally, it appears that independently owned pharmacies,
particularly the medium and large size, may have serious problems
resulting from inefficiencies in the Non-service Prescription
Productivity Rate (Y3).
An attempt was made to prepare predictive models which could be
utilized for forecast productivity based upon type and size of
pharmacy or internal independent variables operating in the

125
prescription processing function.
Conclusions and Recommendations
The utilization of the subprofessional in the prescription
processing area has been shown to have a significant impact upon the
productivity rate of pharmacists. The use of the subprofessional
apparently assists in lowering the average prescription wage cost in
the prescription processing function. It is therefore recommended
that more pharmacies should investigate the utilization of the
subprofessional as a method of increasing pharmacist productivity.
Two basic models have been developed which appear to account for
a relatively large percent of the relationship with productivity. It
appears that the models may be particularly advantageous to third-
party agencies providing for the financing of prescription services.
It is recommended that third-party agencies should test the use of
these models in developing payment systems for prescription services.
Applications of This Research
In utilizing the findings of this research, it appears that
positive contributions can be made to the practice of pharmacy. For
example, there is no standard labor cost factor in the process of
preparing a prescription; nevertheless, labor appears to be the
largest single cost component (other than the drug) in the prescription
processing function (Berki and Hornbrook, 1971). From the predictive
models presented in this research, it appears that the productivity
rates can be easily utilized to convert productivity to an actual cost
factor. Unless new technology is utilized in the prescription
processing function, it would be expected that these rates would not
126
change appreciably over a reasonable time period of approximately 10
to 20 years.
An example of application for this research could apply to the
administrator of a third-party prescription program. If the type and
size of pharmacy were known to the administrator, the data in table 33
could be utilized to estimate time limits, and thus cost limits for a
pharmacist wage per prescription. These data appear to be quite
useful in assisting third-party agencies with an opportunity to set a
more reasonable reimbursement fee based upon the characteristics of
the pharmacy. This, of course, suggests a differential fee may be
utilized for different types of pharmacies.
Finally, data from this study should offer encouragement to
pharmacy managers as they strive to improve productivity rates. It
suggests that many of the medium and large pharmacies should examine
the feasibility of a subprofessional in the prescription processing
function, and suggests practical functions in which the subprofessional
may serve to improve assistance in the prescription processing
function.
127
BIBLIOGRAPHY
Abdellah, F.G. and E. Levine. Work Sampling Applied to the Study of
Nursing Personnel. Nursing Research 3:11-16. June, 1954.
Baker Automated Rx Dispensing System Stores and Counts Capsules/
Tablets, being Used by Thrift (Pa.), on Test in Other Chains,
Hospitals: Hook, Thrifty, Walgreen, Kaiser, Army, V.A. F-D-C
Reports. 34:14. Sept. 11, 1972.
Barker, Kenneth N. An Analysis of the Work and Utilization of the
Pharmacist in Small Mississippi Hospitals to Estimate Some
Effects of the Introduction of a Pharmacy Auxiliary Worker.
Doctoral dissertation. University, Mississippi, University of
Mississippi, 1971. 239 numb. leaves.
Barnes, Ralph M. Motion and Time Study, Design and Measurement of
Work. 6th ed. New York: Wiley, 1968. 799 p.
Bergman, Abraham B., Steven W. Dassel, and Ralph J. Wedgwood.
Time-Motion Study of Practicing Pediatricians. Pediatrics.
38:254-263. 1966.
Berki, Sylvester E. and Mark C. Hornbrook. The Cost of Prescription
Dispensing. Paper presented to a Joint Session of the American
Pharmaceutical Association and the American Public Health
Association, Minneapolis, October 14, 1971.
Brodie, Donald O. The Challenge to Pharmacy in Times of Change.
Washington, American Pharmaceutical Association and the American
Society of Hospital Pharmacists. 1966. 77 p.
Campbell, William H. et al. Identifying Economic Efficiencies Resulting
from a Drug Prepackaging Program. American Journal of Hospital
Pharmacy. 31: 954-960. Oct., 1974.
Davidson, Harold O. Work Sampling Eleven Fallacies. The Journal of
Industrial Engineering. 11: 367-371. 1960.
Deiner, Carl H. (ed.). NACDS-Lilly Digest 1978. Indianapolis. Eli
Lilly. 1972. 40 p.
Fay, John. Personal Communication. April 30, 1974.
Francke, Donald E. The. Pharmacist's Outpatient Role (Editorial).
Drug Intelligence and Clinical Pharmacy. 6: 277. 1972.
Gibson, D.R. Problems Incurred in Michigan's Third-Party Prescription
Payment Program are Discussed. Drug Topics 119:23,30,31.
June 16, 1975.

128
Gibson, Robert M. and Marjorie S. Mueller. National Health Expenditures,
Fiscal Year 1976. Social Security Bulletin. 40:3-22. April, 1977.
Gosselin, R.A. and Company, Inc. Variability Analysis, Pharmacy Charges
for Prescription Drugs Under Third Party Programs. Dedham, Mass.
R.A. Gosselin and Company, Inc. May 1971. 33 p.
Hansen, Bertrand L. Work Sampling for Modern Management. Englewood
Cliffs, N.J.: Prentice-Hall, 1960. 263 p.
Heiland, R. and W. Richardson. Work Sampling. New York: McGraw-Hill,
1957. 243 p.
How One Pharmacy Fills 168,000 Rxs a Year for 75,000 Customers in 50
States. American Druggist Merchandising. 167:25-29. June 15,
1973.
Jang, Raymond. Evaluation of the Quality of Drug-Related ServicesProvided by Community Pharmacists in a Metropolitan Area.
Doctoral dissertation. Columbus, Ohio, The Ohio State University,
1971. 158 numb. leaves.
Johnson, Richard E. and William H. Campbell. Drug Services and Costs
in HMO Prototypes. American Journal of Hospital Pharmacy.
30:405-421. 1973.
Linn, Lawrence S. and Milton S. Davis. Factors Associated with Actual
and Preferred Activities of Pharmacists. Journal of the American
Pharmaceutical Association. NS11:545-548. 1971.
McCaffree, Kenneth M. and Harold F. Newman. Prepayment of Drug Costs
Under a Group Practice Prepayment Plan. American Journal of
Public Health. 58:1212-1218. 1968.
McEvilla, J.D. How to Make an Rx Department More Efficient. American
Druggist. 143:47,49,51. April 3, 1961.
Medicare: Prescriptions. Provide Expansion Power. Chain Store Age/
Drug Edition. 49:102-103. July, 1973.
Myers, Maven J. An Examination of the Existence of Scale Economies inCommunity Pharmacy Operations. Paper presented to the Economicsand Administrative Science Section of the American Pharmaceutical
Association. Montreal, Canada, May 19, 1969.
Nadler, Gerald. Work Design, A Systems Concept. Rev. ed. Homewood,
Irwin, 1970. 835 p.
Nationwide Chain Drug v. "Independent" Pharmacy Confrontation. F-D-C
Reports. 35:3-5. Dec. 10, 1973.
Nie, Norman H. et al. Statistical Package for the Social Sciences
(SPSS). Second ed. New York: McGraw-Hill, 1975. 675 pp.
129
North Dakota State Board of Pharmacy v. Snyder's Drug Stores Inc.Supreme Court Reporter. 94:407-414. Jan. 1, 1974.
Opinions of the Attorney General of the State of Oregon. Opinion
Number 6992. 36:524-526. 1973.
Oregon Revised Statutes, Chapter 689, 1974 Replacement Part.Pharmacists and Pharmacies; Drug Manufacturers and Wholesalers.6:421-443. 1973.
Patient Profile Record System. New Jersey Administrative Code.13:39-45. April 1, 1972.
Physician's Assistants. State Health Legislation Report. 6:12.
March, 1978.
Provost, George P. Clinical Pharmacy Specialty or General Direction?Drug Intelligence and Clinical Pharmacy. 6:285-289. 1972.
Provost, George P. Pharmacy Manpower: Numbers Game. American Journal
of Hospital Pharmacy. 30:299. April, 1973.
Report of the Task Force...Practitioner's and Subprofessional's Rolesin Pharmacy. Journal of the American Pharmaceutical Association.NS9:415-417, 421-422. 1969.
Report on Enrollment in Schools and Colleges of Pharmacy First Semester,Term, or Quarter, 1969-1970. American Journal of Pharmaceutical
Education. 34:92-99. 1970.
Rodowskas, Christopher A. Jr. Pharmacy Manpower: Current Status and
Future Requirements. Medical Marketing and Media. 8:18-30.
July, 1973.
Rodowskas, Christopher A. Jr. and Jean P. Gagnon. Personnel Activities
in Prescription Departments of Community Pharmacies. Journal
of the American Pharmaceutical Association. NS12:407-411. 1972.
Rodowskas, Christopher A. Jr. and Michael W. Dickson. A Task Analysis
of the Community Pharmacist. American Association of Colleges of
Pharmacy. Silver Spring, Maryland. n.d. 242 p.
Rucker, T.D. and W.J. Sobaski. Pharmacy Manpower Tomorrow. Paper
presented to the American Public Health Association, Houston,Oct. 1970.
Ryan, Michael R. and Mickey C. Smith. The Community Pharmacist:Resource Waste or Resource Reserve? Working Paper Research
Institute of the Pharmaceutical Sciences. University of
Mississippi. University, Mississippi. n.d.
Schools Report Modest'Enrollment Decline. AACP News. 6:204. March,
1978.
130
Siecker, Bruce R. The Uniform Cost Accounting Approach for PharmacyPricing Decisions. Journal of the American PharmaceuticalAssociation. NS17:208-212. April, 1977.
Solomon, David K. et al. Use of Medication Profiles to DetectPotential Therapeutic Problems in Ambulatory Patients. AmericanJournal of Hospital Pharmacy. 31:348-354. 1974.
Sprague, Charles C. National Health Policy: Objectives and Strategy.Journal of Medical Education. 49:3-13. 1974.
Talley, Robert B. and Marc F. Laventurier. The Incidence of Drug-DrugInteractions in a Medi-Cal Population. Paper presented beforethe American College of Physicians in Atlantic City, New Jersey,April 20, 1972.
The 1969 Prescription Market Summarized. American Druggist. 161:16.
April 6, 1970.
Third-Party Rx Ratio Drops for First Time. American Druggist. 177:
10,13,17. May, 1978.
Thrifty (L.A.) De-emphasises Pharmacy. Chain Store Age/Drug Editions.49:3. Dec. 1973.
U.S. Department of Health, Education and Welfare. Task Force onPrescription Drugs Final Report. February, 1969. 86 p.
U.S. Department of Health, Education and Welfare. Task Force onPrescription Drugs The Drug Users. December, 1968. 145 p.
U.S. Department of Health, Education and Welfare. Toward aComprehensive Health Policy for the 1970's A White Paper. May,
1971. 52 p.
U.S. Department of Health, Education and Welfare, Public HealthService, Health Services and Mental Health Administration.Report of Task Force on the Pharmacist's Clinical Role.Spring, 1971. 9 p.
Washington Has New Patient Info. Regulation. NABP Newsletter. 3:1-8.
1974.
What Top Chain Men Saw. American Druggist Merchandising. 168:28-29.
Oct. 15, 1973.
131
APPENDIX A
OREGON BOARD OF PHARMACY RECOMMENDATIONS
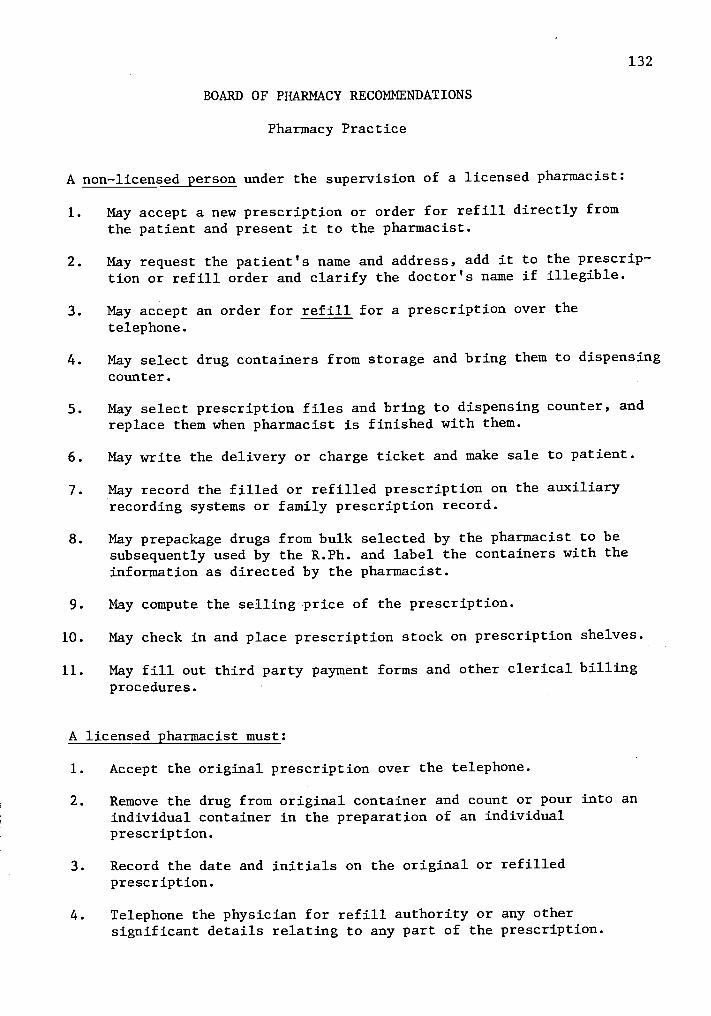
132
BOARD OF PHARMACY RECOMMENDATIONS
Pharmacy Practice
A non-licensed person under the supervision of a licensed pharmacist:
1. May accept a new prescription or order for refill directly fromthe patient and present it to the pharmacist.
2. May request the patient's name and address, add it to the prescrip-tion or refill order and clarify the doctor's name if illegible.
3. May accept an order for refill for a prescription over thetelephone.
4. May select drug containers from storage and bring them to dispensingcounter.
5. May select prescription files and bring to dispensing counter, andreplace them when pharmacist is finished with them.
6. May write the delivery or charge ticket and make sale to patient.
7. May record the filled or refilled prescription on the auxiliaryrecording systems or family prescription record.
8. May prepackage drugs from bulk selected by the pharmacist to besubsequently used by the R.Ph. and label the containers with theinformation as directed by the pharmacist.
9. May compute the selling price of the prescription.
10. May check in and place prescription stock on prescription shelves.
11. May fill out third party payment forms and other clerical billingprocedures.
A licensed pharmacist must:
1. Accept the original prescription over the telephone.
2. Remove the drug from original container and count or pour into anindividual container in the preparation of an individualprescription.
3. Record the date and initials on the original or refilledprescription.
4. Telephone the physician for refill authority or any othersignificant details relating to any part of the prescription.

133
5. Type the label and affix it to the prescription container.
6. Deliver the prescription to the patient if special instructions orwarnings need to be transmitted regarding taking or using the
medication.
7. Personally check any prescription filled by a pharmacy internbefore releasing it to the patient.
8. Be responsible for all acts performed by any non-licensed personnel
relating to the practice of pharmacy as defined in ORS 689.010(19).

134
APPENDIX B
TASK ACTIVITY CATEGORIES
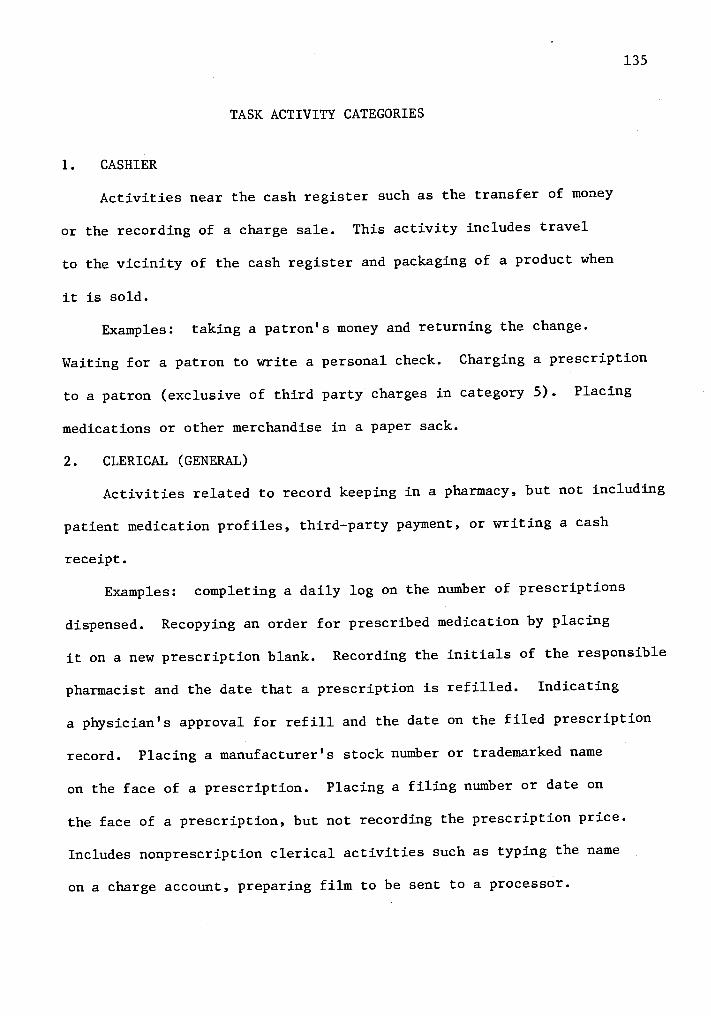
135
TASK ACTIVITY CATEGORIES
1. CASHIER
Activities near the cash register such as the transfer of money
or the recording of a charge sale. This activity includes travel
to the vicinity of the cash register and packaging of a product when
it is sold.
Examples: taking a patron's money and returning the change.
Waiting for a patron to write a personal check. Charging a prescription
to a patron (exclusive of third party charges in category 5). Placing
medications or other merchandise in a paper sack.
2. CLERICAL (GENERAL)
Activities related to record keeping in a pharmacy, but not including
patient medication profiles, third-party payment, or writing a cash
receipt.
Examples: completing a daily log on the number of prescriptions
dispensed. Recopying an order for prescribed medication by placing
it on a new prescription blank. Recording the initials of the responsible
pharmacist and the date that a prescription is refilled. Indicating
a physician's approval for refill and the date on the filed prescription
record. Placing a manufacturer's stock number or trademarked name
on the face of a prescription. Placing a filing number or date on
the face of a prescription, but not recording the prescription price.
Includes nonprescription clerical activities such as typing the name
on a charge account, preparing film to be sent to a processor.

136
3. CLERICAL (MONETARY RECEIPTS)
Activities relating to the preparation of a monetary receipt
for a prescription which is presented to patrons at the time of sale.
This activity may be completed before, during or after the time when
the actual prescription is processed.
Examples: writing a monetary receipt with a pen or typewriter,
including such information as the date, prescription number, and the
initials of the dispenser.
4. CLERICAL (PATIENT PROFILE RECORDS)
Activities relating to the preparation, retrieval, filing and
transfer time involved in the use of patient profiles.
Examples: locating specific patient profiles from the filing
system. Recording the medication provided, and returning the record
to the filing system. Transfer time involved in the removing or returning
of patient profiles.
5. CLERICAL (THIRD-PARTY)
Record keeping activities related to third-party prescription
payment.
Examples: recording names and/or prescription numbers on forms
that are utilized by a pharmacy to obtain payment from a third-party
financing agency. Indicating a code number for a given drug product
on a claim form or using an imprinter to transfer a patron's
identification to a claim form.
6. COMMUNICATIONS INVOLVING PURCHASING
These communications include speaking with a representative of
a firm that sells prescription or health related merchandise, telephoning
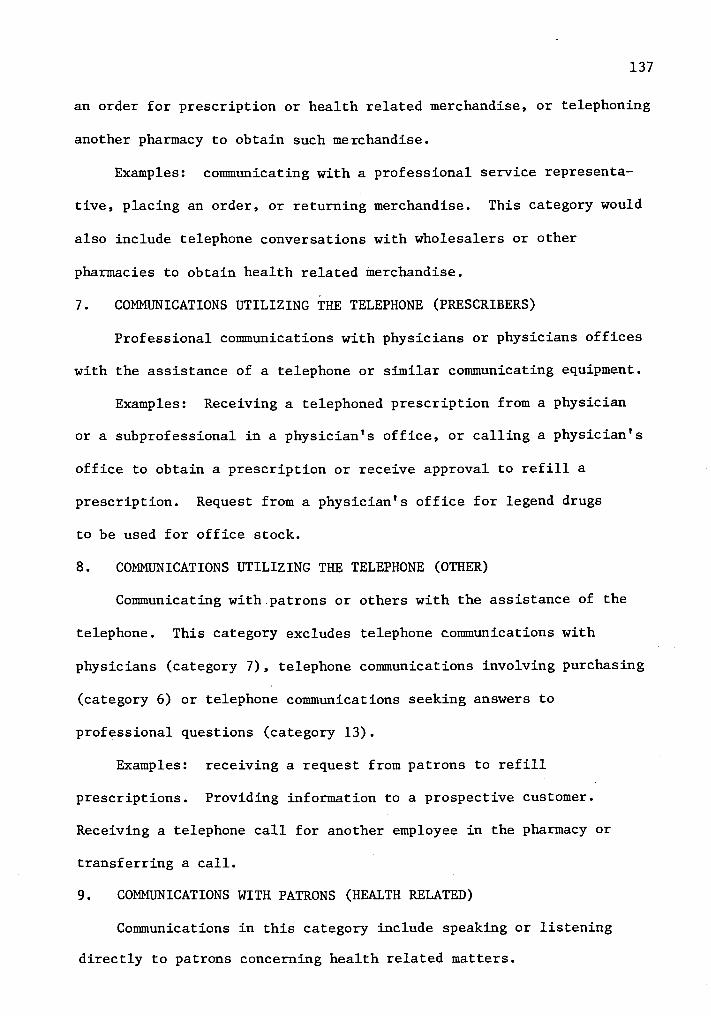
137
an order for prescription or health related merchandise, or telephoning
another pharmacy to obtain such merchandise.
Examples: communicating with a professional service representa-
tive, placing an order, or returning merchandise. This category would
also include telephone conversations with wholesalers or other
pharmacies to obtain health related merchandise.
7. COMMUNICATIONS UTILIZING THE TELEPHONE (PRESCRIBERS)
Professional communications with physicians or physicians offices
with the assistance of a telephone or similar communicating equipment.
Examples: Receiving a telephoned prescription from a physician
or a subprofessional in a physician's office, or calling a physician's
office to obtain a prescription or receive approval to refill a
prescription. Request from a physician's office for legend drugs
to be used for office stock.
8. COMMUNICATIONS UTILIZING THE TELEPHONE (OTHER)
Communicating with patrons or others with the assistance of the
telephone. This category excludes telephone communications with
physicians (category 7), telephone communications involving purchasing
(category 6) or telephone communications seeking answers to
professional questions (category 13).
Examples: receiving a request from patrons to refill
prescriptions. Providing information to a prospective customer.
Receiving a telephone call for another employee in the pharmacy or
transferring a call.
9. COMMUNICATIONS WITH PATRONS (HEALTH RELATED)
Communications in this category include speaking or listening
directly to patrons concerning health related matters.

138
Examples: Helping a patron to choose an over-the-counter (0.T.C.)
medication. Providing answers to questions concerning an 0.T.C. or
a prescription medication. Suggesting that a patron should see a
physician. Explaining how a prescription medication should be taken.
Indicating a possible drug interaction or the usefulness of a patient
profile system.
10. COMMUNICATIONS WITH PATRONS (OTHERS)
Activities include all other direct communications with patrons,
but excluding telephone communications (category 8) and personal
communications (category 12).
EXAMPLES: greeting a patron or giving directions in helping
a patron to locate certain merchandise, and so forth. Explaining
how a clock got lost that was sent for repair. Indicating the length
of time to dispense a prescription, prior to dispensing.
11. DRUG SELECTION
This activity involves searching for a drug, selecting the drug
and returning it to a storage area after use. Travel from the storage
area to the dispensing station is included.
Examples: traveling to the drug storage area and searching with
the eyes or eyes assisted by hand motion in attempting to locate a
specific medication requested in a prescription. Returning the
medication to the storage area after the prescription processing
function has been completed.
12. IDLE
The pharmacist is performing no visible functions toward completing
tasks in the pharmacy. Conversation, if any, is not related directly
or indirectly to the prescription processing function.

139
Examples: smoking and talking with friends. No activity or
activity without a purpose such as pacing the floor.
13. INFORMATION ACQUISITION OR DISPERSAL
Seeking, providing or listening to answers concerning
professionally related functions.
Examples: reading or turning through trade journals,
professional journals, package inserts, or reference material
pertaining to pharmacy or health related functions. Seeking an answer
to a method utilized in prescription compounding by discussing the
problem with another pharmacist. Telephoning another pharmacist or
wholesaler to determine the unit strength of a pharmaceutical product.
Cautioning another pharmacist about the strength or activity of a
new drug.
14. INVENTORY MAINTENANCE
Activities relating to the maintenance of an inventory in the
pharmacy. All inventory related activities are included except the
actual communication of the order (category 6).
Examples: checking inventory levels or writing requests in a
"want book." Pricing and/or cost coding new merchandise when it is
received from a supplier. Moving merchandise from one area to
another area of the pharmacy. Cleaning and straightening merchandise
in storage areas. Placing new merchandise on display or storage.
15. LABELING
Activities involved in the labeling of prescribed medications,
but not including the act of typing a label.
Examples: examining a typed label and checking the instructions
with the medication order. Affixing a completed label to a
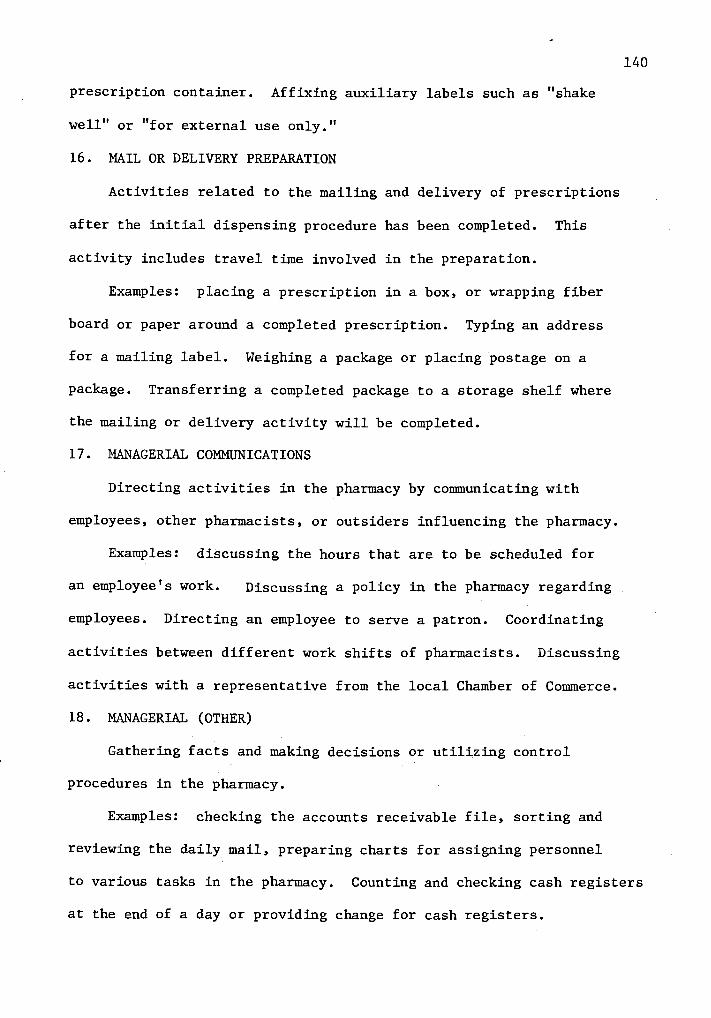
140
prescription container. Affixing auxiliary labels such as "shake
well" or "for external use only."
16. MAIL OR DELIVERY PREPARATION
Activities related to the mailing and delivery of prescriptions
after the initial dispensing procedure has been completed. This
activity includes travel time involved in the preparation.
Examples: placing a prescription in a box, or wrapping fiber
board or paper around a completed prescription. Typing an address
for a mailing label. Weighing a package or placing postage on a
package. Transferring a completed package to a storage shelf where
the mailing or delivery activity will be completed.
17. MANAGERIAL COMMUNICATIONS
Directing activities in the pharmacy by communicating with
employees, other pharmacists, or outsiders influencing the pharmacy.
Examples: discussing the hours that are to be scheduled for
an employee's work. Discussing a policy in the pharmacy regarding
employees. Directing an employee to serve a patron. Coordinating
activities between different work shifts of pharmacists. Discussing
activities with a representative from the local Chamber of Commerce.
18. MANAGERIAL (OTHER)
Gathering facts and making decisions or utilizing control
procedures in the pharmacy.
Examples: checking the accounts receivable file, sorting and
reviewing the daily mail, preparing charts for assigning personnel
to various tasks in the pharmacy. Counting and checking cash registers
at the end of a day or providing change for cash registers.

141
19. PRESCRIPTION FILE SELECTION, FILE UPKEEP AND TRANSFER
Activities related to filing of a written medication order.
Locating and transferring a prescription file to a work area where
a prescription is to be dispensed.
Examples: retrieving a prescription file for a patron who has
requested a refill of a prescription or for a physician or another
pharmacist who has requested information. Returning files to their
proper storage compartment when they are not currently in use.
Preparing new prescriptions for filing and placing them on a file.
20. PRICING
Activities relating to the pricing of prescriptions.
Examples: determining a cost price per 100 tablets or per pint
from a cost price placed on a stock container or by looking up the cost
in a reference manual; then, determining a selling price of a
prescription by utilizing a pricing chart or calculator. Recording
the selling price on each prescription.
21. PRODUCT PREPARATION
Product preparation includes reading or studying a physician's
medication order, or measuring or counting a medication and placing
it in a suitable container for dispensing. This activity also includes
any travel time that is utilized to store a prescription until a patron
returns for the medication.
Examples: measuring a liquid medication by pouring it directly
into a dispensing container or into a graduate. Placing tablets or
capsules on a counting tray or in a mechanized counting device and
counting the prescribed number, then transferring the medications to
a final dispensing container. Placing the finished prescription on a

142
storage shelf when a patron is not immediately available to receive
it.
22. PRODUCT PREPARATION (MIXING)
Mixing together of two or more ingredients and placing these
ingredients in a container suitable for dispensing.
Examples: compounding an ointment by mixing one or more medicinal
agents into an ointment base. Adding water to an antibiotic powder
in order to produce a pediatric suspension.
23. TRAVEL
Activities involved in the movement from one part of the pharmacy
to another, but not involved in the categories which consider travel
to be an integral part of the activity such as drug selection (category
11) or prescription file selection (category 19).
Examples: moving from a primary work station to an area outside
of the primary work station and returning. This travel could be for
a variety of reasons, but would exclude all travel which is specifically
indicated in task activity categories.
24. TYPING PRESCRIPTION LABELS
The process involved in selecting and typing a prescription label
as indicated on a medication order.
Examples: obtaining a label from stock, inserting it in the
typewriter, and typing specified directions on a prescription label.
Correcting mistakes on a mistyped label. Removing a completed label
from the typewriter.
25. UNOBSERVABLE (ORGANIZATIONAL)
This includes the activities of subjects when they are not
observable, from the prescription department, but are completing
143
organizational activities.
Examples: the pharmacist is in the stock room bringing in a new
order of merchandise, banking the daily deposits, picking up mail, or
delivering medication.
26. UNOBSERVABLE (PERSONAL)
This includes the activities of subjects when they are not
observable, from the prescription department, but are completing personal
activities.
Examples: the pharmacist leaves the floor of the pharmacy for
any personal reason such as drinking coffee.
27. UPKEEP
Activities related to the general maintenance, appearance, and
cleanliness of the pharmacy.
Examples: stocking empty prescription containers in the pharmacy
dispensing area, replacing a typewriter ribbon or an adding machine
tape. This activity includes cleaning such as cleaning a sink, sweeping
floors, dusting, placing material in a waste container or carrying a
waste container.
28. OTHER
This category includes activities not defined in the previous 27
categories.
Examples: preparing products for O.T.C. sale by pouring from
larger stock bottles to smaller containers. Preparing an order for a
physician's office, and so forth.

144
APPENDIX C
COVER LETTER
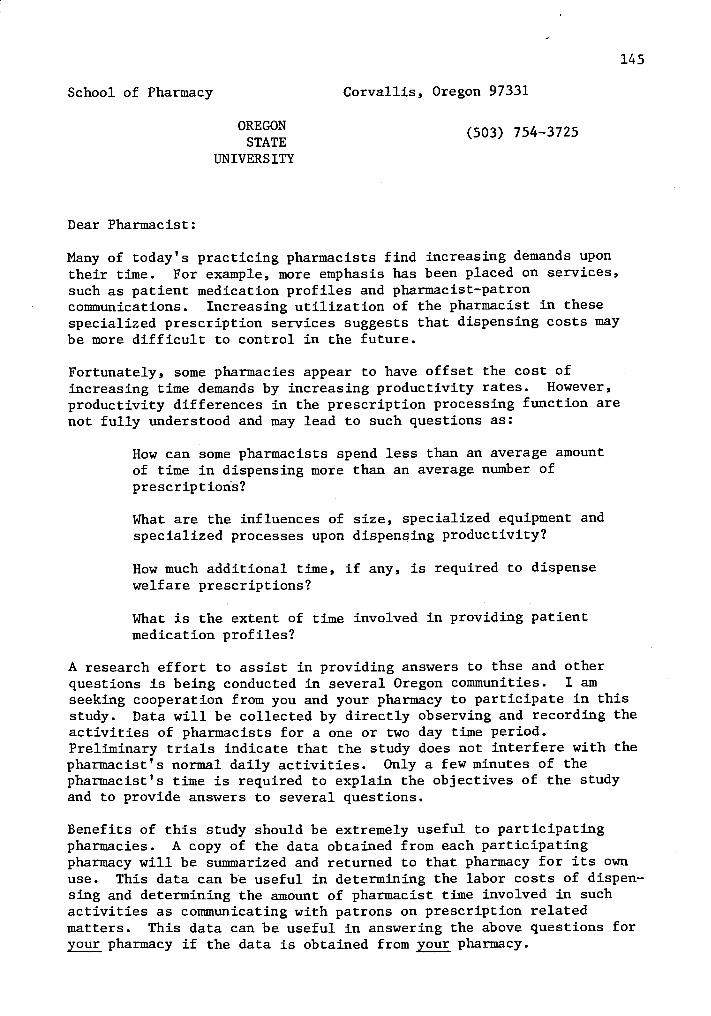
145
School of Pharmacy Corvallis, Oregon 97331
OREGONSTATE
UNIVERSITY
Dear Pharmacist:
(503) 754-3725
Many of today's practicing pharmacists find increasing demands upontheir time. For example, more emphasis has been placed on services,such as patient medication profiles and pharmacist-patroncommunications. Increasing utilization of the pharmacist in thesespecialized prescription services suggests that dispensing costs maybe more difficult to control in the future.
Fortunately, some pharmacies appear to have offset the cost ofincreasing time demands by increasing productivity rates. However,
productivity differences in the prescription processing function arenot fully understood and may lead to such questions as:
How can some pharmacists spend less than an average amountof time in dispensing more than an average number ofprescriptions?
What are the influences of size, specialized equipment andspecialized processes upon dispensing productivity?
How much additional time, if any, is required to dispensewelfare prescriptions?
What is the extent of time involved in providing patientmedication profiles?
A research effort to assist in providing answers to thse and otherquestions is being conducted in several Oregon communities. I amseeking cooperation from you and your pharmacy to participate in thisstudy. Data will be collected by directly observing and recording theactivities of pharmacists for a one or two day time period.Preliminary trials indicate that the study does not interfere with thepharmacist's normal daily activities. Only a few minutes of thepharmacist's time is required to explain the objectives of the studyand to provide answers to several questions.
Benefits of this study should be extremely useful to participatingpharmacies. A copy of the data obtained from each participatingpharmacy will be summarized and returned to that pharmacy for its ownuse. This data can be useful in determining the labor costs of dispen-sing and determining the amount of pharmacist time involved in suchactivities as communicating with patrons on prescription relatedmatters. This data can be useful in answering the above questions foryour pharmacy if the data is obtained from your pharmacy.
146
LetterPage 2
The anonymity of pharmacies participating in this study will be
assured. Although the data will be utilized in studying and reportingvarious productivity relationships, the names of participating
pharmacies will not be associated with the data.
Please complete and return the enclosed card at your early convenience.
Your cooperation is appreciated.
Sincerely,
William T. Sharp, FellowAmerican Foundation for Pharmaceutical Education
147
APPENDIX D
QUEST IONNAIRE
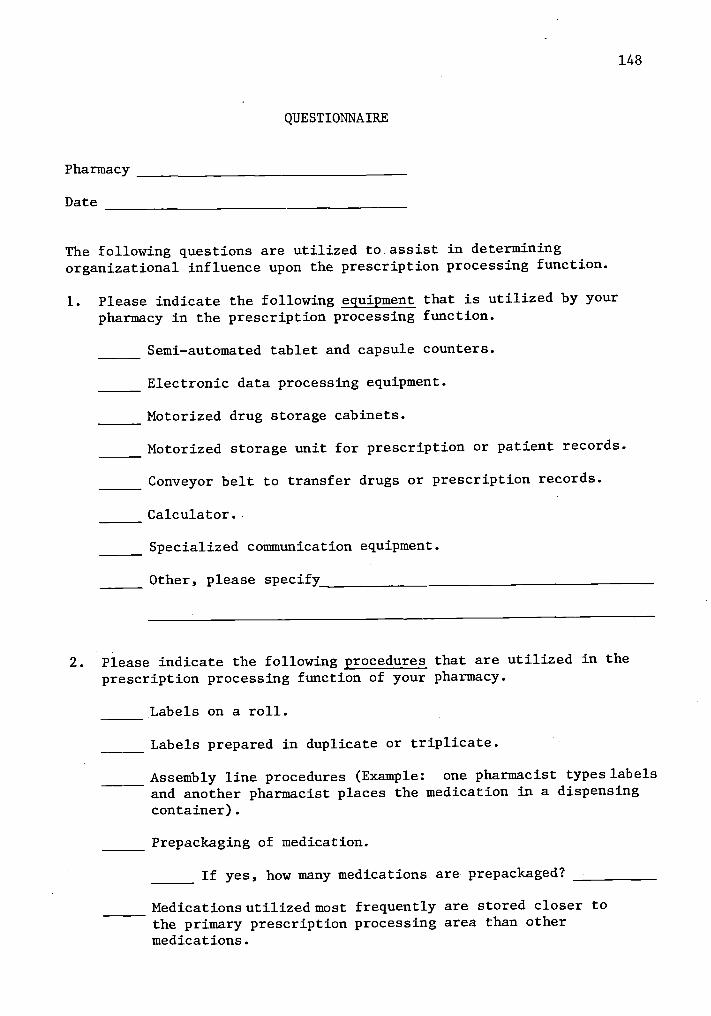
Pharmacy
Date
QUESTIONNAIRE
148
The following questions are utilized to assist in determiningorganizational influence upon the prescription processing function.
1. Please indicate the following equipment that is utilized by your
pharmacy in the prescription processing function.
Semi-automated tablet and capsule counters.
Electronic data processing equipment.
Motorized drug storage cabinets.
Motorized storage unit for prescription or patient records.
Conveyor belt to transfer drugs or prescription records.
Calculator.
Specialized communication equipment.
Other, please specify
2. Please indicate the following procedures that are utilized in the
prescription processing function of your pharmacy.
Labels on a roll.
Labels prepared in duplicate or triplicate.
Assembly line procedures (Example: one pharmacist types labels
and another pharmacist places the medication in a dispensingcontainer).
Prepackaging of medication.
If yes, how many medications are prepackaged?
Medications utilized most frequently are stored closer tothe primary prescription processing area than othermedications.
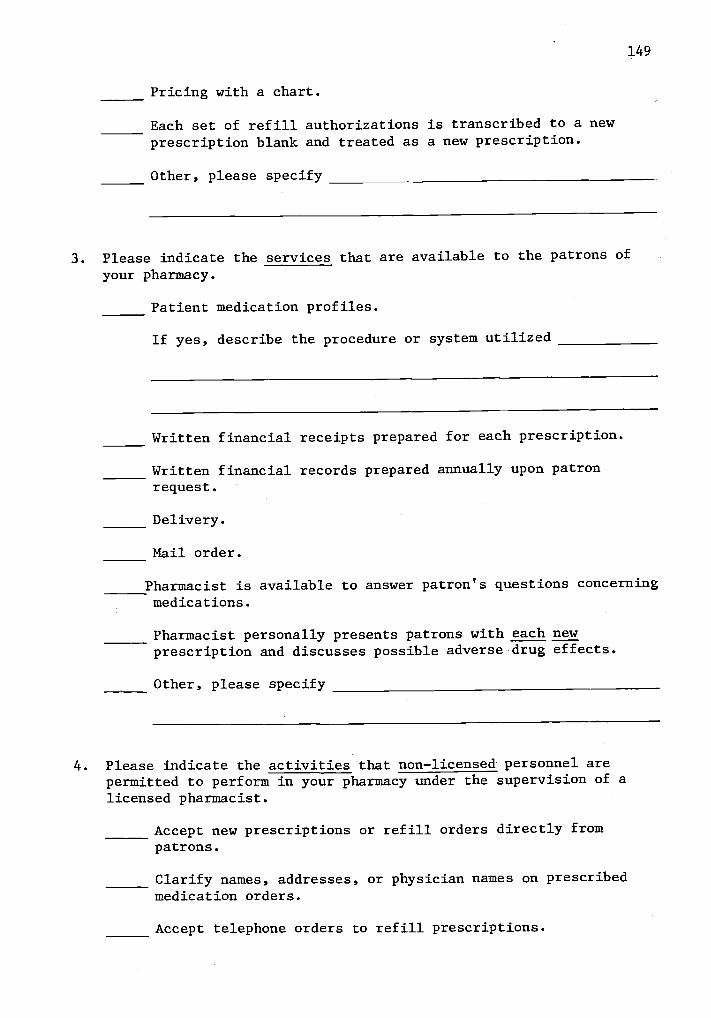
Pricing with a chart.
Each set of refill authorizations is transcribed to a newprescription blank and treated as a new prescription.
Other, please specify
149
3. Please indicate the services that are available to the patrons ofyour pharmacy.
Patient medication profiles.
If yes, describe the procedure or system utilized
Written financial receipts prepared for each prescription.
Written financial records prepared annually upon patronrequest.
Delivery.
Mail order.
Pharmacist is available to answer patron's questions concerningmedications.
Pharmacist personally presents patrons with each newprescription and discusses possible adverse drug effects.
Other, please specify
4. Please indicate the activities that non-licensed personnel arepermitted to perform in your pharmacy under the supervision of alicensed pharmacist.
Accept new prescriptions or refill orders directly frompatrons.
Clarify names, addresses, or physician names on prescribedmedication orders.
Accept telephone orders to refill prescriptions.
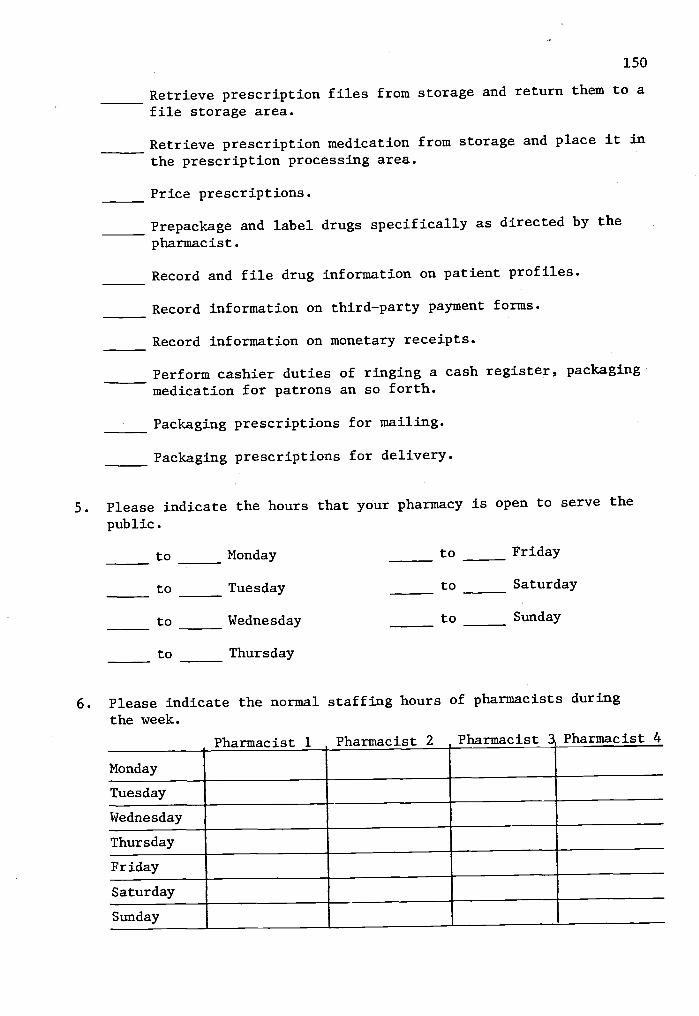
150
Retrieve prescription files from storage and return them to a
file storage area.
Retrieve prescription medication from storage and place it in
the prescription processing area.
Price prescriptions.
Prepackage and label drugs specifically as directed by the
pharmacist.
Record and file drug information on patient profiles.
Record information on third-party payment forms.
Record information on monetary receipts.
Perform cashier duties of ringing a cash register, packaging
medication for patrons an so forth.
Packaging prescriptions for mailing.
Packaging prescriptions for delivery.
5. Please indicate the hours that your pharmacy is open to serve the
public.
to Monday to Friday
to Tuesday to Saturday
to Wednesday to Sunday
to Thursday
6. Please indicate the normal staffing hours of pharmacists during
the week.
Pharmacist 1 Pharmacist 2 Pharmacist 3 Pharmacist 4
Monday
Tuesday
Wednesday
Thursday
Friday
Saturday
Sunday
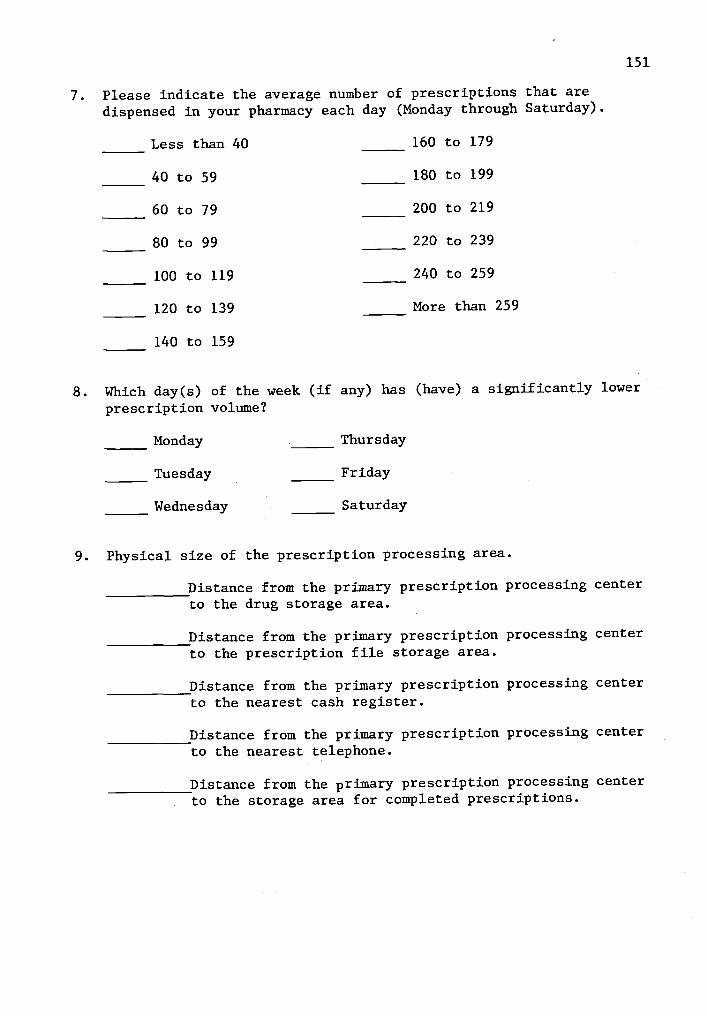
7. Please indicate the average number of prescriptions that aredispensed in your pharmacy each day (Monday through Saturday).
Less than 40
40 to 59
60 to 79
80 to 99
100 to 119
120 to 139
140 to 159
160 to 179
180 to 199
200 to 219
220 to 239
240 to 259
More than 259
151
8. Which day(s) of the week (if any) has (have) a significantly lower
prescription volume?
Monday Thursday
Tuesday Friday
Wednesday Saturday
9. Physical size of the prescription processing area.
Distance from the primary prescription processing centerto the drug storage area.
Distance from the primary prescription processing centerto the prescription file storage area.
Distance from the primary prescription processing centerto the nearest cash register.
Distance from the primary prescription processing centerto the nearest telephone.
Distance from the primary prescription processing centerto the storage area for completed prescriptions.

152
APPENDIX E
EXPLANATION TO PARTICIPANTS

153
EXPLANATION TO PARTICIPANTS
A primary intent of this study is to investigate pharmacist
activities under varying service levels, work loads, and structural
conditions. Data will be gathered by observing the work of
pharmacists in their normal daily activities. For this reason, the
pharmacist being observed should attempt to perform his activities in
a conventional manner. If a pharmacist normally drinks coffee or reads
a newspaper when patrons are not waiting for prescriptions, this activity
should not be discontinued during the survey since it represents a
pharmacist's normal behavior pattern.
Your observer will attempt to place himself out of the
pharmacist's traffic pattern and will follow the activities of one
pharmacist during a full work day (9 Am. to 6 Pm.). The observer will
record the pharmacist's activities for approximately 30 minutes during
each hour. Normally, the observer will be encompassed with his
recording activities and will not converse with the pharmacist. However,
an occasional question may be necessary when an activity is not
thoroughly understood by the observer.
Each pharmacist and each nonprofessional performing work
activities in the prescription processing department will be asked to
keep a daily record of the time when entering and leaving the pharmacy.
Time spent outside of the observer's view should be indicated as
personal or organizational. For example, if an employee leaves the
prescription processing area to drink coffee for 15 minutes, the time
would be indicated as personal. However, if the employee leaves the

154
prescription processing area to deliver a prescription, the time would
be indicated as organizational.
This study is also concerned with the prescription output as
measured by the number of new and refill prescriptions and the dollar
sales volume for all prescriptions. The observer will need to indicate
or tally the number of new and refill prescriptions dispensed during
each hour of observation and the prescription sales volume at the end
of the observation day (6 Pm.).
A data summary will be provided to your pharmacy as soon as
feasible. This summary will be provided as a conglomerate of all
observations in your pharmacy along with comparisons of other
pharmacies in the study. However, the anonymity of all pharmacies
participating in this study will be assured.
Thank you for your cooperation.

155
APPENDIX F
DAILY TIME LOG
Pharmacy
Date
DAILY TIME LOG
Name
Position
TIME IN TIME OUT ACTIVITY
156

157
APPENDIX G
DATA RECORDING FORM

DATA RECORDING FORM
CATEGORY
158
1. Cashier
2. Clerical (General)
3. Clerical (Monetary Rec.)
4. Clerical (Pat. Profile)
5. Clerical (Third-Party)
6. Comm. in Purchasing
7. Comm. Phone (Prescribers)
8. Comm. Phone (Other)
9. Comm. with Patrons (Health)
10. Comm. with Patrons (Other)
11. Drug Selection
12. Idle
13. Information (Professional)
14. Inventory Maintenance
15. Labeling
16. Mail or Del. Preparation
17. Managerial Communications
18. Managerial (Other)
19. Prescription File Selection
20. Pricing
21. Product Preparation
22. Product Prep. (Mixing)
23. Travel
159
24. Typing Labels
25. Unobservable (Org.)
26. Unobservable (Personal)
27. Upkeep
28. Other
Pharmacy Third Party Rx
Pharmacist's Title Other Rx
Date Total Rx
Time