an investigation into the relationship between surface
TRANSCRIPT

An investigation into the relationship between
surface concrete resistivity and chloride
conductivity tests
Lombe Mutale
Supervisor: A/Prof. Hans-Dieter Beushausen
Co-Supervisors: Prof. Mark G. Alexander and Mr Mike Otieno
February 2014
Thesis presented for the degree of Masters of Science
In the Department of Civil Engineering
University of Cape Town
Univers
ity of
Cap
e Tow
n

DECLARATION
I, Lombe Mutale know the meaning of plagiarism and declare that all the work in the
documents, save for which is properly acknowledged is my own.
Signature:

ii
ABSTRACT
The chloride conductivity test (CCT) is a South African-developed Durability Index (DI) test
used for the evaluation and quantification of the quality of concrete cover. It is also used as an
input parameter for service life prediction (SLP) of RC structures in the marine environment,
using a modified version of Crank’s solution to Fick’s second law of diffusion. The surface
concrete resistivity test is an electrochemical test that has a good correlation with the concrete
chloride diffusion process. The surface concrete resistivity test is used as a quick way to
determine the durability of concrete.
The purpose of this study was to provide an in-depth literature review on surface concrete
resistivity and investigate its use for the design and prediction of durability in RC structures.
The study also compared and contrasted surface concrete resistivity with CCT, using results
from previous work, in terms of their application in the design of RC structures. Thereafter, the
study investigated the relationship between surface concrete resistivity and CCT.
The study was carried out by comparing laboratory and field surface concrete resistivity with
CCT results. Then, corrosion initiation periods (CIP’s) and diffusion coefficients were
estimated using Mackechnie’s (1996) CCT SLP model as well as surface concrete resistivity
models by Andrade (2004) and Baroghel-Bouny et al. (2009). Input parameters for the model
such as surface concrete resistivity and CCT results were based on measurements from a
previous study. It was found that moisture gradients, chloride contamination and temperature
gradients easily influence concrete electrical resistivity testing done in-situ. The input
parameters for the surface concrete resistivity models were restricted to laboratory results.
The analysis revealed that for blended cement concrete, w/b ratio has a greater influence on
chloride conductivity than binder type. It was observed that using a different binder type has a
greater influence on surface concrete resistivity at a high w/b ratio than a low one. In addition,
decreasing the w/b ratio for GGBS concrete is more effective than decreasing it for FA concrete
in influencing the surface concrete resistivity. Andrade’s surface concrete resistivity SLP
model resulted in similar CIP values as the CCT model for CEM I only concrete and slag
concrete at 0.40 w/b. A constant links the diffusion coefficients from surface concrete
resistivity and CCT models. An inverse relationship was found between surface concrete
resistivity and the diffusion coefficient calculated from the CCT SLP model.

iii
ACKNOWLEDGEMENTS
A/Prof. Hans Beushausen
Prof. Mark Alexander
Mr Mike Otieno
Ms Elly Yelverton
CoMSIRU
Ms Katlego Loeto
Ms Gladwell Nganga
Mr Nicholas Kizito
Mr Matongo Kabani
Mr Sultan Hassan
Family and friends

iv
TABLE OF CONTENTS
DECLARATION i
ABSTRACT ii
ACKNOWLEDGEMENTS iii
TABLE OF CONTENTS iv
LIST OF FIGURES vii
LIST OF TABLES viii
1 INTRODUCTION 1
1.1 Background 1
1.2 The use of surface concrete resistivity tests– current trends 1
1.3 Research motivation 2
1.4 Objectives 3
1.5 Limitations and scope of the research 4
1.6 Thesis outline 4
2 LITERATURE REVIEW 5
2.1 INTRODUCTION 5
2.2 PART 1: TRANSPORT MECHANISMS AND CHLORIDE INGRESS IN CONCRETE 6
2.2.1 Transport mechanisms in concrete 6
2.2.2 Fick’s 1st and 2nd laws of diffusion 10
2.2.3 Calculation of diffusion coefficients using chloride profiles 12
2.2.4 Chloride ingress in concrete 15
2.2.5 Factors affecting chloride ingress in concrete 18
2.2.6 Diffusion tests 22
2.2.7 Rapid chloride transport tests 24
2.3 PART 2: THE CHLORIDE CONDUCTIVITY TEST 27
2.3.1 Background 27
2.3.2 Theoretical basis of the CCT 28
2.3.3 Test method and practical basis of the CCT 29
2.3.4 Reasons for CCT specifications and assumptions 31
2.3.5 Evaluation of CCT and comparison with other rapid chloride tests 31
2.3.6 The use of CCT for performance-based specifications 34
2.3.7 Prediction of the corrosion initiation period 35
2.3.8 Prediction of the corrosion propagation period 40
2.4 PART 3: SURFACE CONCRETE RESISTIVITY 41
2.4.1 Surface concrete resistivity test methods 41

v
2.4.2 Wenner probe 42
2.4.3 Other concrete resistivity test methods 44
2.4.4 Factors influencing measurement of concrete electrical resistivity 46
2.4.5 Challenges of site measurement of concrete resistivity 49
2.4.6 Concrete electrical resistivity and quality control 54
2.4.7 Prediction of the corrosion initiation period 56
2.4.8 Concrete resistivity and diffusion coefficients 58
2.5 SUMMARY OF LITERATURE REVIEW 60
3 METHODOLOGY OF RESEARCH 63
3.1 Introduction 63
3.2 Data used in the study 64
3.3 Procedures and models used for data analysis 65
3.3.1 Prediction of corrosion initiation period using CCT 65
3.3.2 Prediction of corrosion initiation period using surface concrete resistivity 67
3.3.3 Prediction of diffusion coefficients using surface concrete resistivity 69
4 RESULTS AND DISCUSSION 70
4.1 Introduction 70
4.2 Comparison of concrete resistivity and CCT results 70
4.2.1 General discussion of results 71
4.2.2 The influence of exposure environment on surface concrete resistivity 72
4.2.3 The influence of binder type and w/b ratio on surface concrete resistivity and CCT 72
4.3 Input variables and calculations of corrosion initiation periods 74
4.3.1 CCT model: corrosion initiation period calculations and input variables 74
4.3.2 Surface concrete resistivity model: CIP input variables 75
4.4 Comparison of SLP models for corrosion initiation periods 76
4.4.1 The influence of thickness and quality of concrete cover on the CIP 77
4.4.2 The effect of the resistance of the cover zone on CIP 79
4.5 Diffusion coefficients calculations and results 80
4.5.1 CCT diffusion coefficients: calculations and results 81
4.5.2 Surface concrete resistivity diffusion coefficients: calculations and results 81
4.6 Comparison of CCT and surface resistivity 81
4.6.1 Comparison of diffusion coefficients from CCT and surface resistivity models 81
4.6.2 Ratio of diffusion coefficients for CCT and surface concrete resistivity 83
4.6.3 Relationship between surface concrete resistivity and CCT diffusion coefficient 84
4.6.4 The relationship between CCT diffusion coefficient and surface concrete resistivity 85

vi
4.7 Summary 86
5 CONCLUSIONS AND RECOMMENDATIONS 87
5.1 Introduction 87
5.2 Comparison of test results 87
5.3 Comparison of corrosion initiation periods 87
5.4 Comparison of diffusion coefficients 88
5.5 Recommendations 88
6 REFERENCES 90
APPENDIX A: DATA AND RESULTS 100
APPENDIX B: EBE FACULTY ASSESSMENT OF ETHICS IN RESEARCH PROJECTS 105

vii
LIST OF FIGURES
Figure 2.1: Schematic of literature review .............................................................................................. 5
Figure 2.2: Proportions of lime, silica and alumina in binders ............................................................... 6
Figure 2.3: Setup for migration of ions in concrete ................................................................................ 9
Figure 2.4: Setup for ionic diffusion process in concrete ....................................................................... 9
Figure 2.5: Typical measured chloride profiles .................................................................................... 12
Figure 2.6: Setup for measuring diffusion and migration processes in concrete .................................. 14
Figure 2.7: Simplified service life prediction model ............................................................................ 16
Figure 2.8: Probability of the onset of chloride-induced corrosion ...................................................... 16
Figure 2.9: Effect of FA and GGBS in reducing the chloride conductivity.......................................... 19
Figure 2.10: Average chloride profiles for PC and slag concrete ......................................................... 20
Figure 2.11: Schematic of AASHTO T259 .......................................................................................... 23
Figure 2.12: Schematic of NT Build 443 set-up ................................................................................... 24
Figure 2.13: NT Build 492 migration setup .......................................................................................... 25
Figure 2.14: ASTM C1202 test setup ................................................................................................... 26
Figure 2.15: Vacuum saturation facility for CCT ................................................................................. 29
Figure 2.16: The chloride conductivity test (CCT) apparatus ............................................................... 29
Figure 2.17: Typical test results for CCT, in relation to w/b ratio and binder type .............................. 30
Figure 2.18: Correlation between CCT & ASTM C1202 test results ................................................... 33
Figure 2.19: Correlation between CCT & NT Build 443 test results .................................................... 33
Figure 2.20: CCT versus diffusion coefficient, after two years marine exposure ................................ 36
Figure 2.21: Prediction of fifty-year diffusion coefficient for marine concrete .................................... 38
Figure 2.22: Graphical solution of Crank’s solution to Fick's 2nd law of diffusion ............................. 39
Figure 2.23: Schematic of four-electrode resistivity test, Wenner probe.............................................. 42
Figure 2.24: Commercially available Wenner probe ............................................................................ 43
Figure 2.25: Concrete specimen marking for surface resistivity test .................................................... 43
Figure 2.26: Principle of the Two-Electrode Method ........................................................................... 45
Figure 2.27: Interrelation of the TEM with the Wenner probe ............................................................. 46
Figure 2.28: Concrete resistivity sensitivity analysis ............................................................................ 47
Figure 2.29: Effect of concrete section dimensions on resistivity measurement .................................. 48
Figure 2.30: Wenner probe placement for cubic specimens ................................................................. 49
viii
Figure 2.31: Variation of concrete electrical resistivity with moisture content and salts ..................... 50
Figure 2.32: Electrical resistivity as a function of temperature ............................................................ 52
Figure 2.33: Chloride diffusivity and electrical conductivity from 3 days to 1 year ............................ 55
Figure 2.34: Correlation between inverse resistivity and diffusion exposed to salting and drying ...... 55
Figure 3.1: Summary of the research methodology .............................................................................. 63
Figure 3.2: Laboratory and field concrete specimens from Otieno's study ........................................... 65
Figure 3.3: Example of calculation of concrete resistivity aging factor ............................................... 69
Figure 4.1: Influence of w/b ratio, binder type and age on resistivity for field specimens ................... 70
Figure 4.2: Influence of w/b ratio, binder type and age on resistivity for lab specimens ..................... 71
Figure 4.3: Influence of w/b ratio, binder type and age on CCT lab specimens ................................... 71
Figure 4.4: Lab surface concrete resistivity aging factors (indices) ..................................................... 76
Figure 4.5: Influence of cover depth on CIP for extreme exposure category ....................................... 77
Figure 4.6: Comparison of CIP for extreme exposure at 40mm cover ................................................. 78
Figure 4.7: Comparison of CCT and surface concrete resistivity diffusion coefficients ...................... 82
Figure 4.8: Effect of age on ratio of diffusion coefficients ................................................................... 83
Figure 4.9: Relationship between resistivity and CCT diffusion coefficient – All mixes .................... 84
Figure A. 1: Cape Town temperature and precipitation means .......................................................... 100
LIST OF TABLES
Table 2.1: 6-month diffusivities of chloride ions in concrete in 10-12 m2/s ........................................... 22
Table 2.2: Chloride ion penetrability based on charge passed .............................................................. 26
Table 2.3: Durability classification using CCT values ......................................................................... 34
Table 2.4: Maximum CCT values for 100 year service life as-built structures (cover = 50mm) ......... 35
Table 2.5: Reduction factors of diffusion coefficients for different binder types ................................. 36
Table 2.6: Equations for Initial instantaneous Diffusion coefficients Dc from 28-day CCT results ..... 37
Table 2.7: Surface chloride concentrations (% by mass of binder) ...................................................... 40
Table 2.8: Surface resistivity readings (kΩ-cm) ................................................................................... 44
Table 2.9: Chloride ion penetrability based on surface resistivity at a =38.1mm ................................ 44
Table 2.10: Recommended values for reaction factors ......................................................................... 57

ix
Table 2.11: K values for marine exposure classifications..................................................................... 57
Table 3.1: Concrete mixes for Otieno's study ....................................................................................... 64
Table 3.2: Screenshot of inputs and outputs in UCT spreadsheet for CCT SLP model ....................... 66
Table 3.3: Marine exposure categories for use in CCT SLP ................................................................. 66
Table 3.4: Minimum cover for normal-density and low-density concrete ............................................ 67
Table 3.5: K values following EN 206 exposure classifications .......................................................... 68
Table 3.6: k values based on BS 8110 marine exposure categories ...................................................... 68
Table 4.1: Influence of change in w/b ratio on chloride conductivity .................................................. 73
Table 4.2: Influence of change in binder type on chloride conductivity............................................... 73
Table 4.3: Influence of change in w/b ratio on surface concrete resistivity .......................................... 73
Table 4.4: Influence of change in binder type on surface concrete resistivity ...................................... 74
Table 4.5: CCT SLP model: CIP (t) Input parameters - Extreme exposure .......................................... 75
Table 4.6: Resistivity model: CIP (T) Input parameters - Extreme exposure ....................................... 75
Table 4.7: Calculated aging factors from resistivity measurements ..................................................... 80
Table 4.8: Constants used in the calculation of resistivity diffusion coefficients ................................. 81
Table A. 1: CIP’s for resistivity and CCT, extreme exposure at 20 to 60 mm cover depth ............... 100
Table A. 2: Diffusion coefficients from CCT model (x10-12 m2/s)...................................................... 101
Table A. 3: Diffusion coefficients from resistivity model (x10-12 m2/s).............................................. 102
Table A. 4: Ratio of diffusion coefficients ......................................................................................... 103
Table A. 5: Surface concrete resistivity (laboratory) results from Otieno (2014) .............................. 104

INTRODUCTION 1
1 INTRODUCTION
1.1 Background
Durability refers to the ability of a structure or component to withstand the design environment
over the design life, without undue loss of serviceability or need for major repair (Ballim et al.,
2009). Baroghel-bouny et al. (2009), assert, “long-term durability of reinforced concrete
structures (RC) is a major concern for safety, economic and environmental reasons.” There is
an increasing number of RC structures and components of infrastructure that are not durable
and are failing to realise their design service life (Alexander et al., 2008). Consequently, many
resources in form of time and human capital continue to be expended towards their repair and
rehabilitation. The public has also continued to suffer from the lack of durability of structures
– especially during the closure of roads and bridges during repair, as well as in the event of
high maintenance costs. This inability of RC structures to realise their intended service life has
necessitated the study of concrete durability and factors that hinder it such as corrosion of steel
reinforcement.
Corrosion of reinforcing steel is caused by the ingress, through the concrete cover, of
deleterious species such as chloride ions and carbon dioxide. The degree of penetration of these
species into the concrete depends on the quality of the construction materials, construction
practices and their exposure environment (Otieno et al., 2011b). Knowledge of these factors
facilitates accurate prediction of the corrosion rate and consequently the service life, which will
lead to more durable concrete structures (Ahmad, 2003). For this reason, performance-based
specifications are used whereby relevant material properties are tested to predict the ingress of
deleterious substances. This ensures that:
…the concrete selected for a specified design life achieves the desired quality and
chemical resistance to deterioration that was assumed at the design stage (Alexander et
al., 2011).
The performance-based approach relies on measuring material potential and construction
quality to determine future performance of the concrete structure. An important aspect of the
approach is test methods for determining and predicting the durability of RC structures. The
test methods measure material potential by linking transport mechanisms and deterioration
mechanisms and are then used as input parameters in service life prediction models.
1.2 The use of surface concrete resistivity tests– current trends
Surface concrete resistivity tests are quick and simple tests that assess the resistance of concrete
against the ingress of ionic species. The use of surface concrete resistivity tests to supplement
existing durability tests has become widespread around the world (Riding et al., 2008). Its

INTRODUCTION 2
popularity stems from its non-destructive nature, rapidness and ease of use compared to other
tests. Another reason is the current trend to shift from the traditional prescriptive-based
approach to the performance-based approach for design, making the issue of durability more
pertinent than before. Concrete resistivity is linked to durability as many researchers have
identified its correlation with diffusion, a prominent parameter in the determination of concrete
durability (Kessler et al., 2008; Polder, 1995; Sengul and Gjorv, 2008). Therefore, the test is
an ideal candidate for the performance-based design approach.
In South Africa, the performance-based approach makes use of durability index (DI) testing
comprising the water sorptivity test, oxygen permeability test and the chloride conductivity test
(CCT). While these tests fare well when compared with other durability tests in terms of
reproducibility and repeatability (Beushausen and Alexander, 2008), exploration of ways in
which the DI can be supplemented with other tests is a worthy endeavour. The CCT in
particular produces similar results with other tests with which the surface concrete resistivity
test is being compared. Similar to the CCT, surface concrete resistivity test is a handy tool
because of the ease with which it can be used to quantify the quality of concrete. While the
CCT is characterized as a service life prediction and quality control tool, surface concrete
resistivity is traditionally merely a means for condition assessment of RC structures. Surface
concrete resistivity is used to assess the capacity of the concrete to allow corrosion to occur
and evaluate the rate at which corrosion is occurring in concrete (Alonso et al., 1988;
Broomfield, 2007). However, many other uses of surface concrete resistivity have been
identified. For instance, currently in the USA, concrete resistivity is replacing the Rapid
Chloride Penetrability Test (RCPT) for use as a quality control parameter during construction
to test concrete permeability (Kessler et al., 2008; FDOT, 2004). In the Netherlands, it is also
used as a means for quality control during construction (Rooij et al., 2007; Polder et al., 2010).
Similarly, in Spain, the 28-day concrete resistivity result is being used as a means for service
life prediction incorporating both the corrosion initiation and propagation periods (Andrade
and Andrea, 2010; Andrade, 2004). Additionally, it can also be used to calculate the effective
chloride diffusion coefficient (Baroghel-Bouny et al., 2009).
1.3 Research motivation
According to Icenogle et al. (2012) and Rooij et al. (2007) reasons for the move towards surface
concrete resistivity in durability studies and research include its:
correlation with chloride diffusion
intuitive nature – a high resistivity indicates better quality concrete than a low resistivity
simplicity and ease of use – the test is not highly technical and can easily be taught
rapidness compared to other tests

INTRODUCTION 3
non-destructive nature
small voltage is used when testing resulting in non-destruction of the concrete
microstructure
cheap – substantial cost savings were noticed compared to when the RCPT was used
accuracy – low standard deviation between tests
Controlling the concrete properties of diffusion and resistivity is linked to improved durability,
which diminishes the likelihood of early corrosion (Mackechnie, 1996). On the one hand, there
are numerous studies on the use of the CCT to obtain the diffusion coefficient and service life
of RC structures, although these are mostly done specifically for South African marine
conditions. On the other hand, globally, there is an ongoing shift towards surface concrete
resistivity as a rapid means to predict concrete durability. However, there is a lack of research
thoroughly investigating how surface concrete resistivity is used in the design of RC structures
and its relationship with the CCT.
Although it is intuitive that a correlation exists between the CCT and concrete resistivity, there
is insufficient research or literature on the exact nature of the relationship between the two. In
fact, there has been no reported attempt to quantify or relate the two. However, some studies
have been done that show a good correlation between the results from the RCPT and concrete
resistivity (Smith et al., 2004; Feldman et al., 1999). Since RCPT and CCTs also have a good
correlation (Beushausen and Alexander, 2008), it is reasonable to propose that there could be
a relationship between the CCT and surface concrete resistivity.
1.4 Objectives
The primary objective of this study is to:
i) Investigate the relationship between surface concrete resistivity and CCT.
Other secondary objectives are listed below:
o Carry out a comprehensive literature review of surface concrete resistivity test
by:
- Establishing its properties and theoretical basis
- Identifying the strengths and limitations of the test method
- Discussing existing models for service life prediction and design
of reinforced concrete structures
o Compare and contrast surface concrete resistivity with CCT, using results from
previous work, in terms of their use in the design of RC structures:

INTRODUCTION 4
1.5 Limitations and scope of the research
The bulk of the thesis will be a literature review and an analysis of surface concrete resistivity
and CC results from a previous study by Otieno (2014). The use of another researcher’s work
is a major limitation because there was no control over the parameters tested. For instance,
though not recorded, temperature and porosity would have been useful in this study. This
research is limited to:
Five mixes and three binders namely, CEM I or 100% Portland cement, 50/50 GGBS and
70/30 fly ash.
Two w/b ratios of 0.40 and 0.55.
Results for field and lab surface concrete resistivity tested over a period of two years for
each mix.
28-day and 90-day CCT results for each of the five mixes.
1.6 Thesis outline
The thesis is divided into five chapters with Chapter 1 introducing the topic and explaining the
motivation for the study.
Chapter 2 is a three-part literature review discussing 1) transport mechanisms and chloride
ingress in concrete, 2) the various aspects of the CCT including its underlying theory and use
in prediction of concrete cover durability and 3) surface concrete resistivity focussing on its
fundamental aspects, influencing factors and uses in the concrete industry around the world.
Chapter 3 describes the research methodology followed to achieve the aims of this study. The
chapter includes a description of the data and procedures for each of the three models used in
the study.
Chapter 4 firstly presents the surface concrete and CCT results from Otieno’s (2014) study.
This is followed by a presentation and discussion of the model outputs and an investigation
into the relationship between surface concrete resistivity and the CCT.
Chapter 5 is a treatise on the conclusions and recommendations that can be drawn from the
literature review and data analysis.
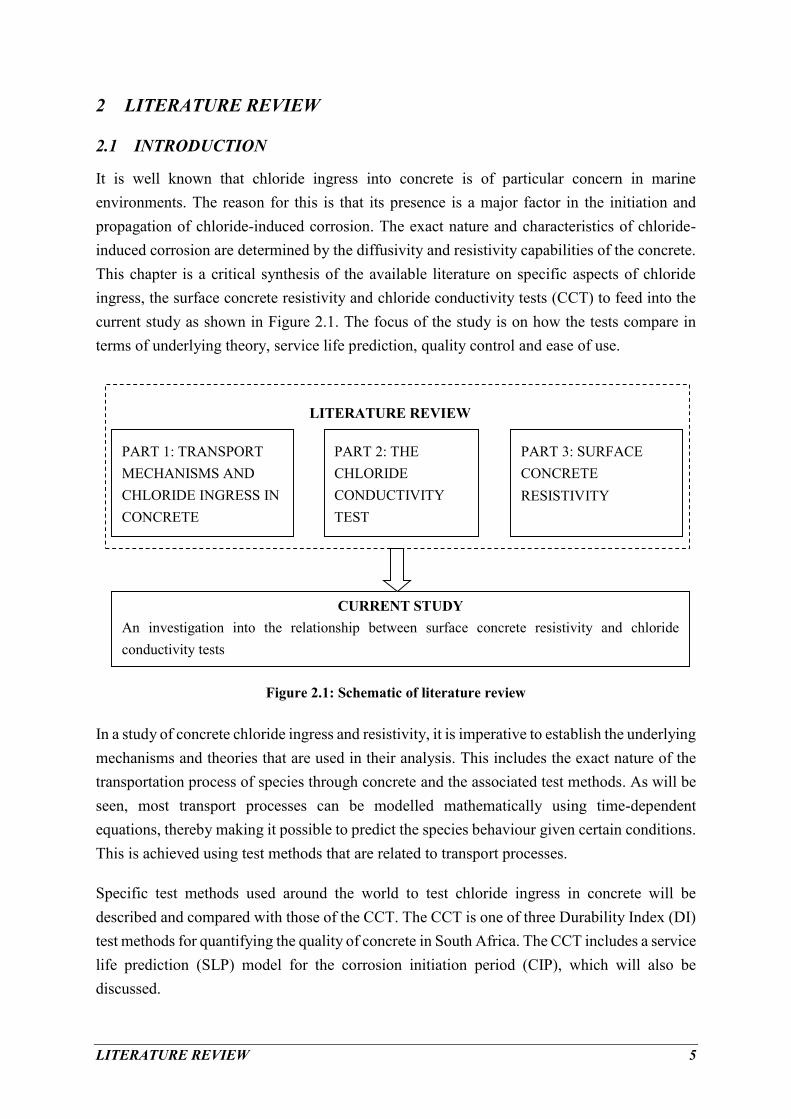
LITERATURE REVIEW 5
2 LITERATURE REVIEW
2.1 INTRODUCTION
It is well known that chloride ingress into concrete is of particular concern in marine
environments. The reason for this is that its presence is a major factor in the initiation and
propagation of chloride-induced corrosion. The exact nature and characteristics of chloride-
induced corrosion are determined by the diffusivity and resistivity capabilities of the concrete.
This chapter is a critical synthesis of the available literature on specific aspects of chloride
ingress, the surface concrete resistivity and chloride conductivity tests (CCT) to feed into the
current study as shown in Figure 2.1. The focus of the study is on how the tests compare in
terms of underlying theory, service life prediction, quality control and ease of use.
Figure 2.1: Schematic of literature review
In a study of concrete chloride ingress and resistivity, it is imperative to establish the underlying
mechanisms and theories that are used in their analysis. This includes the exact nature of the
transportation process of species through concrete and the associated test methods. As will be
seen, most transport processes can be modelled mathematically using time-dependent
equations, thereby making it possible to predict the species behaviour given certain conditions.
This is achieved using test methods that are related to transport processes.
Specific test methods used around the world to test chloride ingress in concrete will be
described and compared with those of the CCT. The CCT is one of three Durability Index (DI)
test methods for quantifying the quality of concrete in South Africa. The CCT includes a service
life prediction (SLP) model for the corrosion initiation period (CIP), which will also be
discussed.
PART 1: TRANSPORT
MECHANISMS AND
CHLORIDE INGRESS IN
CONCRETE
PART 2: THE
CHLORIDE
CONDUCTIVITY
TEST
PART 3: SURFACE
CONCRETE
RESISTIVITY
CURRENT STUDY
An investigation into the relationship between surface concrete resistivity and chloride
conductivity tests
LITERATURE REVIEW

LITERATURE REVIEW 6
The chapter also gives an analysis and description of surface concrete resistivity test methods.
The focus will be on the Wenner probe as this was found to be the most popular method in
practice. Its usage as a quality control parameter during construction and use for SLP purposes
will be discussed. There will also be a detailed explanation of theoretical and practical basis of
the test and its sensitivity to varied test conditions.
Lastly, all of the above will provide a foundation for the comparison and dissection of the
relationship between various components of the two tests in a comprehensive and all-
encompassing conclusion. This will pave the way for the current study as depicted in Figure
2.1.
2.2 PART 1: TRANSPORT MECHANISMS AND CHLORIDE INGRESS IN
CONCRETE
2.2.1 Transport mechanisms in concrete
To form concrete, binders such as Portland cement, ground granulated blastfurnace slag
(GGBS), fly ash (FA) and condensed silica fume (CSF) react with water to produce cementing
products. The products of this reaction are the paste that holds aggregates together to form the
composite material that is concrete. These binders are mostly composed of the compounds
lime, silica and alumina in different proportions as shown below.
Figure 2.2: Proportions of lime, silica and alumina in binders
(where C2S, C3S refer to di- and tri-calcium silicate respectively) (Grieve, 2009b)
The aggregates are usually assumed to be inert so that the paste is the determinant of the
reactivity of the concrete. The chemical and physical composition of the concrete will
determine its properties such as transport processes. Transport processes in concrete refer to

LITERATURE REVIEW 7
the means by which deleterious species such as chloride ions, sulphates, oxygen and carbon
dioxide move through the concrete and eventually react with the reinforcement. Transportation
of these species in concrete occurs through the pore spaces in the cement paste (microstructure)
and the inter-facial transition zone (ITZ) (Poulsen and Mejlbro, 2006).
The science of transport processes is studied to understand the mechanisms by which
deleterious species from the environment and in the concrete move through the pores in
concrete causing deterioration. In marine environments such as Cape Town, chloride-induced
corrosion is the major form of deterioration for reinforced concrete structures (Broomfield,
2007). Both the chloride conductivity and surface concrete resistivity tests measure concrete
properties linked to transport processes, suggesting that they can be tools for the assessment of
concrete durability (Poulsen and Mejlbro, 2006). Examples of transport processes are described
below.
2.2.1.1 Permeation
Permeation is the movement of a fluid from a zone of high hydraulic pressure to one of low
hydraulic pressure through a porous medium. It is easier to assess the permeability of gases
through the fluid such as oxygen and carbon dioxide as opposed to ions such as chlorides and
sulphates. The reason for this is that various ions present in concrete make it difficult to isolate
the movement of a single ion. The Oxygen Permeability Index (OPI) test is a Durability Index
(DI) test for measuring oxygen permeability in South Africa (Alexander et al., 1999a) and the
Torrent Permeability Tester is its European counterpart (Lindvall, 1998). The OPI test is based
on Darcy’s Law and assesses i) the degree of concrete compaction and ii) interconnectedness
of the microstructure (Ballim et al., 2009).
2.2.1.2 Absorption
Absorption refers to the pull of water or capillary suction. This occurs when water is drawn
into the concrete pores or specifically unsaturated material. Examples of ions that undergo
absorption into the concrete include chlorides and sulphates. As one would expect, the capillary
suction force decreases rapidly as the degree of saturation increases. The process usually occurs
near the surface of the concrete where the degree of saturation is effectively zero (McCarter et
al., 1992). It is near the surface (less than a centimetre) that absorption begins as moisture-
containing ions are transmitted from the environment into the concrete. Deeper in the concrete,
the process is impeded by aggregates and the increased degree of saturation. For this reason at
greater concrete depths, the ions are more likely to move through the action of other transport
processes such as diffusion (McCarter et al., 1992).
In marine environments, water absorption increases the surface chloride concentration, which
subsequently leads to chloride diffusion into the depths of the concrete. A similar situation

LITERATURE REVIEW 8
occurs under wetting and drying conditions. The water sorptivity test is the (DI) test for the
measurement of the concrete absorption process, with a low value indicative of a good quality
concrete. Unlike most absorption tests, it can be used to measure both the porosity and the
sorptivity (Ballim et al., 2009). More details on the theory and particulars of absorption are
available in McCarter et al. (1992).
2.2.1.3 Adsorption
Adsorption is the ion binding process that captures ions from the capillary pores into the
concrete microstructure so that they cannot be transferred or react with other materials (Claisse,
2005). Adsorption depends on the matrix chemistry, which is a function of the binder type.
Aluminium oxide (Al2O3) or alumina is part of the chemical composition of most binders as
shown in Figure 2.2 above. Alumina reacts with chlorides to form a compound with the
hydration products or chemically bind the chloride (Luo et al., 2003; Thomas et al., 2012).
However, the chlorides compete with hydroxides and sulphate ion to react with the alumina so
that the more alkaline the concrete the less the bound chlorides.
The adsorption process is important as it determines the number of ions, particularly chloride
ions that are either chemically bound or physically bound. The chloride ions that have been
adsorbed can be determined by calculation of the acid soluble (total chlorides) and the water
soluble (free chlorides). The difference between the two is the adsorbed chlorides (Claisse,
2005).
2.2.1.4 Migration
Migration is the flow of cations or anions towards an applied negative or positive electric field
respectively. Consequently, migration only occurs when zones have differing electrical
potentials. When an electrical field is applied to the surface of concrete, hydroxides are
depleted and chlorides are replenished as chlorides are attracted to the negative electrodes while
hydroxides are attracted to the positive electrodes. Illustrated in Figure 2.3 below, migration
provides a means to measure the ionic flux through concrete. The cathode is upstream and
placed in a catholyte (NaOH) while downstream is the anode placed in an anolyte (NaCl).

LITERATURE REVIEW 9
Figure 2.3: Setup for migration of ions in concrete
(Andrade, 1993)
Another type of migration is thermal migration, which occurs due to the presence of a
temperature gradient causing ions to flow from a warm region to a cooler region. For instance,
marine concrete structures are prone to salt ingress after exposure to warm weather. Due to its
rapidness, migration is the usual mechanism by which the transport of species through concrete
are measured and related to slower processes such as diffusion using the Nernst-Planck
equation (Kropp and Alexander, 2007). The Nernst-Planck equation sums up the equations for
convection, electrical migration and diffusion, and equates them to the total ionic species flux.
The equation is discussed further in Section 2.2.3.2.
2.2.1.5 Diffusion
Diffusion is a time-dependent process of random particle interaction solely driven by
concentration differences between adjacent zones i.e. ions move from zones of high
concentration to zones of low concentration (Cerny and Rovnanikova, 2002). Diffusion of ions
such as sulphates and chlorides can occur in partially saturated concrete. The process is usually
modelled by immersing a concrete in solution with two different concentrations on either side
similar to that shown in Figure 2.4.
Figure 2.4: Setup for ionic diffusion process in concrete
(Andrade, 1993)
From the figure above, the chloride ions will move from the NaCl solution through the
concrete, to the NaOH solution compartment at constant pressure. This setup is used to

LITERATURE REVIEW 10
determine the concrete resistance to the diffusion of deleterious species. It is known that
diffusion is the predominant transport process in concrete when no electric field has been
applied and the moisture conditions are steady or when the concrete is fully saturated. In other
words, diffusion is the most likely mechanism by which transportation of ions occurs in
concrete. Therefore, it is imperative to understand the principles and underlying theory
regarding concrete diffusion and its application.
2.2.2 Fick’s 1st and 2nd laws of diffusion
Fick’s laws of diffusion are used to model the process of diffusion in concrete. The principles
of the equations are based on a setup such as the one in Figure 2.4. The underlying theory is
valid provided the following assumptions (Lu, 1997) are adhered to:
(i) The fluxing species do not react with the matrix
(ii) The matrix has a homogenous structure and composition
Saturated conditions and a constant pressure must be maintained for the assumptions to remain
valid. Fick’s first law of diffusion states that the flux of ions diffusing through the matrix is
directly proportional to the rate of change of the concentration with distance;
𝐹 = −𝐷𝜕𝐶
𝜕𝑥 ( 2.1 )
where C is the concentration of the ion at a specific time t and point x; F is the flux; D is the
diffusion coefficient
Evidently, a high flux implies a high diffusion coefficient. In comparison, Fick’s second law
of diffusion (Equation 2.2) is a mathematical description of the change in concentration per
unit time equated to the change in flux per unit length.
𝜕𝐶
𝜕𝑡=
−𝜕𝐹
𝜕𝑥 ( 2.2 )
where C is the concentration of the ion at a specific time t and point x; F is the flux.
When the concentration increases the flux or diffusion reduces. In other words, the parameters
increase in opposing directions and this is the reason for the negative sign in the equation.
Taking the derivative of Equation 2.1 and equating it to Equation 2.2 yields a simplified version
of Fick’s second law:
𝜕𝐶
𝜕𝑡= 𝐷
𝜕2𝐶
𝜕𝑥2 ( 2.3 )
where C is the concentration of the ion at a specific time t and point x; F is the flux; D is the
diffusion coefficient

LITERATURE REVIEW 11
Although, both ions and gases diffuse through concrete, the modelling of diffusion is usually
restricted to saturated conditions, such that only ions are involved. While sulphates and
chlorides both diffuse, the focus is primarily on chlorides due to their participation in the steel
reinforcement corrosion process. For this reason, the C in Fick’s laws usually refers to the
concentration of chlorides ions in concrete.
Obtaining the diffusion coefficient by means of Fick’s 1st law is not favourable due to the
stringent requirement of steady state conditions (Andrade, 1993). Consequently, Fick’s 2nd
law is favoured by most researchers. Crank’s solution given in Equation 2.4 is the preferred
approach to solving Fick’s 2nd law of diffusion.
𝐶𝑥 = 𝐶𝑠 (1 − ⅇ𝑟𝑓 (𝑥
√4𝐷𝑡)) ( 2.4 )
where D is the diffusion coefficient; Cs is the surface chloride concentration; Cx is the chloride
concentration at time t and depth x; erf is the mathematical error function
The use of Crank’s solution in SLP is based on work by Collepardi et al. (1972) who showed
that it could be applied to chloride diffusion in concrete. Details can be found in Crank (1979).
The solution is valid only if the boundary and material properties are constant and the initial
conditions are such that: Cx = 0 when x > 0 and Cx = Cs for x = 0. In other words, it is assumed
that initially there are no chlorides in the concrete and the only chlorides in the system are the
surface chlorides. As will be seen later, this equation is an integral part of the determination of
the service life of marine reinforced concrete structures prone to chloride ingress.
Nevertheless, the concrete industry is not unanimous in its decision to use Fick’s second law
as a basis for modelling diffusion. For example, Marchand & Samson (2009) have raised
concerns over assumptions specified in the use of Fick's law. For instance, they state that the
assumption of saturated conditions to ensure that only diffusion occurs is not completely
adhered to. In addition, it is suggested that the simplified chemical interactions in the diffusion
of concrete setup (Figure 2.4) do not accurately represent the cementitious compounds and
environment of RC structures. Furthermore, they found that dependence on the environment
makes the equation unsuitable for relating laboratory measured concrete to site exposed
concrete. Instead of Fick’s law, the use of more complex models with a wider variety of input
parameters is recommended (Marchand and Samson, 2009).
While the concerns raised are valid, most models not only use experiments conducted in the
laboratory but also have them validated with existing structures. Consequently, any inherent
errors in the equations used are accounted for in this manner, as will become apparent later in
this chapter. Furthermore, the large number of input parameters that would be required for the
models proposed would not be feasible for practical use (DuraCrete, 1998).

LITERATURE REVIEW 12
2.2.3 Calculation of diffusion coefficients using chloride profiles
One way of calculating diffusion coefficients from Crank’s solution is by fitting chloride
profiles obtained through controlled experiments over time to Equation 2.4 (Muigai et al.,
2012; Morris et al., 2002; Yuan et al., 2009). A chloride profile (Figure 2.5) is a graph of
chloride concentration in percentage mass concrete versus distance from chloride exposed
surface concrete. More often than not, the chloride content is higher at the surface and decreases
with cover depth as depicted in Figure 2.5. This agrees with the assumption in Equation 2.4.
Figure 2.5: Typical measured chloride profiles
(Ballim et al., 2009)
Tests such as the bulk diffusion test are used to establish the chloride profile of a concrete
specimen. This is achieved by grinding and testing the specimen for chloride concentration at
different depths along the length of the sample. The chloride profile is then fitted into Crank’s
solution (Equation 2.4) to obtain the two unknowns – the surface chloride concentration and
the apparent chloride diffusion coefficient. The best fit is determined using curve fitting
software, as done in the figure above, or regression analysis such as a least squares fit.
Chloride profiles are classified as either achieved or potential. The achieved chloride profile
results from exposure of a concrete specimen in a certain environment. The potential or
estimated chloride profile results from laboratory controlled conditions such as temperature
and exposure to a standard solution of chloride (Poulsen and Mejlbro, 2006). Both profiles
depend on the initial chloride content of the concrete, the chloride concentration at the surface
of the concrete and the chloride diffusion coefficient (Poulsen and Mejlbro, 2006). Given the
diffusion coefficient and surface chloride concentration, the chloride profile can be predicted
using Fick’s second law of diffusion and vice versa.
measured chloride contents neglected data points Fick's 2nd law error function
Δx the convection zone

LITERATURE REVIEW 13
Rather than using the chloride profile approach, relationships of diffusion coefficients with
accelerated migration and diffusion tests have been established (Whiting, 1981; Andrade,
1993). These are divided into two. The main ones are the steady state tests that do not account
for binding but focus on ionic chloride transport only, such as the CCT. The less common ones
are the non-steady state tests that do such as the Nord Test (Muigai, 2008). Others such as the
Multi-Regime Method (MRM) are known to measure both steady state and non-steady state
diffusion coefficients (Castellote and Andrade, 2009). These and others will be explored in
more detail in the sections that follow.
Heiyantuduwa et al. (2006) and Song et al. (2008) state that when making use of these
accelerated test methods it is worth considering the following:
(i) The effect of chloride binding and considering that carbonation reduces the amount
of bound chlorides.
(ii) The diffusion of chlorides into concrete and that the buildup of the surface chlorides
can be time-dependent. Moreover, both are dependent on binder types and surface
treatments. The surface chloride concentration is also dependent on the distance to the
sea.
(iii) The effect of the ongoing hydration process, temperature changes and
environmental conditions on the concrete.
2.2.3.1 Time-dependent chloride diffusion
The surface chloride concentration increases with time while the diffusion coefficient reduces
with time. Usually either the time-dependent aspect of the surface chloride concentration or
diffusion coefficient is incorporated into Crank's solution. Researchers usually focus on the
time-dependent aspect of the diffusion coefficient (Nokken et al., 2006). The reason for the
preference could be that environmental factors affecting the surface chloride concentration are
more complex to predict. The reduced diffusion coefficient is linked to the improved
microstructure of the concrete with continued hydration as well as chloride binding. Therefore,
the time reducing factor depends on the mix proportions of the concrete. It is common practice
to lower the measured diffusion coefficient using the following equation:
𝐷(𝑡) = 𝐷0 (𝑡0
𝑡)
𝑚 (2.5)
where 𝐷(𝑡) is the diffusion coefficient at time t, 𝐷0 is the diffusion coefficient at reference
time 𝑡0, m is the reduction factor
The above equation was employed by Mangat and Molloy (1994) who highlighted the
exponential relationship in the reduction of the diffusion coefficient with time. Thereafter, they

LITERATURE REVIEW 14
validated the equation with experimental data. This has been confirmed more recently by
various other researchers (Nokken et al., 2006).
Once the diffusion coefficient at the starting time is measured, the apparent diffusion
coefficient is plotted with time on a log-log scale. Subsequently, the value of the reduction
factor from Equation 2.5 is obtained using linear regression analysis. It is worth noting that
methods for the calculation of the reduction factor make use of either the average time, effective
or total time of chloride exposure thereby producing different values. The total time gives the
least value of reduction factor while the effective time produces the greatest value (Nokken et
al., 2006). Details on the latter can be found in Stanish and Thomas (2003).
2.2.3.2 The use of migration to calculate the diffusion coefficient
While diffusion is the main transport mechanism by which chlorides move through concrete,
it may take up to a year to reach steady-state conditions. This made it impractical for use as a
rapid test method for quickly establishing the quality of concrete.
It is well known that an applied voltage speeds up the movement of ions through a medium by
the process of migration. In view of that, migration was identified as a suitable alternative to
diffusion, in a quest to establish a rapid test to measure chloride transport through concrete
(Whiting, 1981). The Nernst-Planck equation is a description of the transport processes
occurring in solution when an electric field is applied. The equation states that the flux is a sum
of the migration, diffusion and convection processes as depicted in Figure 2.6. A concrete
specimen is immersed in a chloride solution on one side and a sodium hydroxide on the other
side forcing the diffusion of chlorides. The application of an electric field leads to migration of
the various ions in the solutions to the electrodes.
Figure 2.6: Setup for measuring diffusion and migration processes in concrete
(Andrade, 1993)
The Nernst-Planck equation can be simplified using assumptions that render the convection
and diffusion terms redundant. To this end, many researchers use the resulting Nernst-Einstein
LITERATURE REVIEW 15
equation, (Equation 2.6) to establish the relationship between electrochemical properties and
diffusion of concrete (Sengul and Gjorv, 2008).
𝐷 =𝐽⋅𝑅⋅𝑇
𝑧⋅𝐹⋅𝐶𝑐𝑙⋅𝛥𝐸 (2.6 )
where, D is the ion diffusivity [m2/s]; R is the gas constant 8.314 [J/mol]; T is the absolute
temperature [K]; z is the ionic valence; J is the flux [mol/m2s]; F is Faraday’s constant 96500
[C/mol]; 𝐶𝑐𝑙 is the concentration of chlorides in the capillary pores [mol/m3] and ΔE is the
energy in [J/m].
The hydroxyl ion contributes to the maintenance of the high pH necessary to sustain the
passivation of the concrete. In contrast, the main deleterious species that leads to reinforcement
corrosion in concrete is the chloride ion. The danger posed by chlorides at the reinforcement
lies in their ability to cause the destruction of the passivation layer. The next section therefore
explores the properties and interactions of chlorides in concrete and the role it plays in SLP.
2.2.4 Chloride ingress in concrete
2.2.4.1 Chloride in concrete
There are two types of chloride found in concrete, free chloride and bound chloride. Chloride
binding is the process whereby the free chloride ions become bound to hydration products by
adsorption, as described previously. Chloride can be bound either chemically or physically to
hydration products. The higher the content of bound chlorides, the less chloride content is
available to initiate corrosion. This causes a reduction in the free chloride ions thereby lowering
the corrosion rate (Shi et al., 2012).
The sum of all the chlorides in concrete is known as the total chloride content. The total amount
of chloride ions can be determined by dissolution in an acid solution; usually nitric acid and
then potentiometric titration against silver nitrate (Song et al., 2008). The process begins with
the grinding of small increments along the depth of the specimen followed by dissolution. Free
chloride is found by dissolution into an aqueous solution (Poulsen and Mejlbro, 2006). The
chloride bound in the concrete will then be the difference of the two.
It was found that the diffusion coefficient calculated for the total chloride concentration profile
is higher than that calculated for the free chloride concentration profile (Castellote et al., 2001).
This is in line with the theory of free and bound chlorides. Once the chloride content at the
level of reinforcement reaches a certain critical concentration, reinforcement corrosion is
initiated. This level is known as the chloride threshold and is discussed next.

LITERATURE REVIEW 16
2.2.4.2 Chloride threshold
The chloride threshold level is the percentage of chloride by mass of binder at which corrosion
is initiated. This idea stems from the simplified service life prediction (SLP) model established
by Tuutti (1980). Essentially, the model has two service life phases separated by the point at
which the initiation period ends and the propagation period begins, as shown in Figure 2.7.
Figure 2.7: Simplified service life prediction model
(Tuutti, 1980)
Figure 2.8: Probability of the onset of chloride-induced corrosion
(DuraCrete, 1998)
The chloride level at which corrosion is initiated is usually assumed a constant of 0.4 % by
mass of binder (Mackechnie and Alexander, 1997b; Broomfield, 2007). This value is taken
from European standards, based on experimental work, that recommend it as the maximum
allowable total chloride level in reinforced concrete. The work revealed that, assuming there is
enough oxygen and moisture and in the absence of carbonation, the corrosion risk at a chloride
content of 0.4% chloride by mass of cement is low to negligible (Broomfield, 2007). Other

LITERATURE REVIEW 17
researchers reference Figure 2.8 above, which shows that the probability of corrosion is less
than 40% when the chloride content is less than 0.4%.
However, the chloride threshold level depends on the binding capabilities of the concrete
constituents. It increases with increasing hydroxyl ion concentration, which is also affected by
the binder type. Additionally, it increases with the degree of saturation and with decreasing
water/cement ratio. Consequently, the assumption of a constant chloride threshold may be an
overestimate or underestimate depending on the type of binder (Hobbs and Matthews, 1998).
A review of 20 studies by Glass & Buenfeld (1997) revealed that the total chloride values,
measured from structures, for corrosion initiation ranged from 0.17 - 2.5 wt% cement (Glass
and Buenfeld, 1997). Similarly, Hobbs and Matthews (1998) conducted a comprehensive
literature review on the principle factors influencing the time it takes for chlorides to reach the
threshold level and came up with the following list:
degree of exposure to chlorides
water-binder ratio
curing time
moisture state
pH of the pore solution
binder type
temperature
concrete cover
uniformity of bond between concrete and steel
The list covers most of the factors but falls short by excluding carbonation. The interaction of
chloride ions and the carbonation front speeds up the destruction of the depassivation layer as
carbonation reduces the concrete pH. The reduced pH is more conducive for corrosion to occur.
Consequently, when the carbonation front approaches the steel reinforcement, then corrosion
initiation can occur at a lower chloride threshold level (Ballim et al., 2009). Moreover, the
chloride threshold also varies with cracks in the concrete because they provide a quicker path
to the reinforcement (DuraCrete, 1998). Conversely, if the pores are saturated then the oxygen
availability will be low and corrosion initiation will be delayed (Bertolini, 2008).
It is evident that the chloride threshold level is a multi-faceted parameter and the assumption
of it being a fixed value such as 0.4 % by mass of binder needs confirmation. Others such as
Polder (2009) raise the point that 0.4 % has no scientific basis. For instance, different binders
under a variety of conditions will have their own particular chloride threshold levels.

LITERATURE REVIEW 18
Additionally, a lower chloride threshold has been observed for reinforcement bars in concrete
with condensed silica fumes than ones produced with PC (Manera et al., 2008).
It has been proposed by Val & Stewart (2009) that the chloride threshold is taken as the free
chloride concentration to hydroxyl concentration ratio. This was due to the observation that the
corrosion initiation only occurred once a critical ratio of chloride to hydroxyl ions was reached.
However, the review by Glass and Buenfeld (1997) showed that there was no justification for
using free chloride rather than the total chloride for chloride threshold calculations. This was
because evidence showed that bound chlorides could be unbound and partake in corrosion.
2.2.5 Factors affecting chloride ingress in concrete
Uninhibited diffusion and permeation of deleterious species into concrete are likely to lead to
reinforcement corrosion. Specifically, chloride ingress as it occurs in concrete depends on a
variety of factors. These include the concentration of chlorides that are available in the
concrete. Other influences include temperature, carbonation, moisture, porosity, concrete
composition, conditions during construction and exposure conditions (Val and Stewart, 2009;
Claisse, 2005). These are discussed in more detail in the sections that follow to form a basis on
which to compare and relate CCT with the surface concrete resistivity test.
2.2.5.1 Influence of temperature and curing
Temperature and its effect on chloride ingress in concrete are relevant in the study of durability
test methods. This allows developers and users of such tests to be cognisant of the most
appropriate temperature to carry out tests. To investigate the influence of temperature on
concrete chloride ingress, Caré (2008) calculated the diffusion coefficient for cementitious
materials before and after heating. Results revealed increased diffusion or chloride ingress with
increased temperature, which was attributed to the heat inducing a macroscopic crack network
and modifying the pore size distribution. Consequently, the porosity increased and made it
easier for chloride and other ions to be transported through the concrete. Another reason for
the increase could be that the temperature of concrete increases the mobility of the ions and
consequently their diffusion rates (Liu and Beaudoin, 2000). However, the effect of
temperature on chloride binding is complex and further study is required to establish any
correlation with concrete properties (Yuan et al., 2009).
These results can be used in the selection of a suitable temperature for curing. Even though a
recent study revealed that the influence of the period of curing on chloride ingress was found
to be complex, some degree of control can be obtained from temperature. Additionally, curing
did not exhibit any correlation between chloride ingress and either water/binder ratio or binder
(admixture) content (Bertolini et al., 2011). Nevertheless, it is known that water curing gives a
higher degree of hydration than air curing thereby improving the impermeability of the

LITERATURE REVIEW 19
concrete. Therefore, the use of water curing as opposed to air curing can in theory yield higher
chloride ingress resisting properties.
2.2.5.2 Influence of different binder types
The binder and consequently the water/binder ratio determine the microstructure and chemical
properties of the concrete. For instance, some binders give the concrete a finer pore structure,
leading to reduction in the pH value and the total ionic concentration in the pore solution (Liu
and Beaudoin, 2000). Other binders with chloride-binding properties, decrease chloride
permeability, raise the chloride threshold content and improve the homogeneity of the concrete
(Shi et al., 2012). For example, concrete with ground granulated blastfurnace slag (GGBS), fly
ash (FA) and condensed silica fume (CSF) is known to exhibit better resistance to chloride
ingress compared to Portland cement (Mackechnie and Alexander, 1997a; Luo et al., 2003;
Ampadu et al., 1999; Song et al., 2008). Therefore, the time-dependent factor ‘m’ is invariably
lower for PC than for pozzolans (Nokken et al., 2006). Fly ash and GGBS also improve the
pore structure of the concrete in what is known as the “fine filler” effect (Luo et al., 2003). The
fine filler effect improves the homogeneity of the concrete and strengthens the ITZ, making it
less permeable. This results in lower chloride conductivity, depending on the concrete grade,
as illustrated in Figure 2.9 below.
Figure 2.9: Effect of FA and GGBS in reducing the chloride conductivity
(Mackechnie, 1996)
The improvements in performance of the concrete with the addition of GGBS are possibly due
to its chloride binding ability. However, the inclusion of sulphates with GGBS renders these
chloride-binding capabilities of GGBS ineffective (Luo et al., 2003). Another example of the
superior impermeability of slag compared to PC is shown in Figure 2.10.

LITERATURE REVIEW 20
Figure 2.10: Average chloride profiles for PC and slag concrete
(Mackechnie and Alexander, 1997a)
The chloride content in the concrete cover depth is much less for GGBS than for PC. These
results are consistent with those found in related binder experiments conducted by Song et al.
(2008). Furthermore, it is worth noting that the content of cement extender added to the
concrete also affects the extent of improved performance (Hobbs and Matthews, 1998).
Generally, increasing the content of cement extenders in concrete guarantees better
performance. For instance, replacement of Portland cement with at least 50% of GGBS is
required for a substantial improvement in the properties of concrete but only 30 % is required
for fly ash and less than 10% for CSF. Moreover, blended cements results in a higher surface
chloride concentration compared to PC (Song et al., 2008). This is possibly due to their high
chloride binding capacity (Poulsen and Mejlbro, 2006).
In contrast to CSF, GGBS and FA, when limestone is blended with cement, the resulting
diffusion coefficient is much higher than that for PC, irrespective of the water/binder ratio
(Bertolini et al., 2011). Therefore, limestone does not improve the resistance of concrete to
chloride ingress because less hydration products are formed when it replaces cement.
2.2.5.3 Influence of carbonation
Carbonation is the ingress of carbon dioxide into concrete, which reacts with calcium
hydroxide to form calcium carbonate, thereby reducing the pH of concrete. The lowered pH is
conducive for the release of some of the bound chloride in concrete. Not only this, but it also
leads to destruction of the passivation layer which leaves the steel vulnerable to corrosion
(Broomfield, 2007).
Carbonation does not occur when the concrete is completely dry or fully saturated. Leaching
also reduces the chloride binding capability of the concrete (Ballim et al., 2009). However,
even without carbonation occurring, the presence of enough free chlorides at the reinforcement
can also cause corrosion, despite it being only of the localized kind. It is interesting to note that

LITERATURE REVIEW 21
the effect of carbonation on the penetration resistance of chloride ions is more prominent in
blended cements than PC (Ngala and Page, 1997). Nevertheless, carbonation also has the effect
of improving and refining the pore structure of the surface concrete if it is unreinforced (Ballim
et al., 2009).
2.2.5.4 Influence of moisture, time
Diffusion of the chloride ions into the concrete will only occur in the presence of moisture or
in saturated or partially saturated conditions. The higher the levels of moisture in the concrete,
the easier it will be for chloride ions to diffuse into the concrete (Ballim et al., 2009). As the
hydration process continues, the moisture levels in the concrete decrease and chloride ingress
is less likely. This is consistent with results that have shown that older concrete have lower
diffusion coefficients than younger concrete (Song et al., 2008). In a marine environment, the
surface chloride concentration increases with time as seen previously. Similarly, the diffusion
coefficient has been identified as being time dependent.
2.2.5.5 Influence of aggregates
Aggregates are known to have a significant effect on the properties of concrete. Hobbs (2000)
sought to prove that the aggregate in the concrete is as influential on the diffusion coefficient
as the cement paste. Using saturated concrete, he managed to show that the diffusion coefficient
of the aggregate could influence that of the concrete. However, this result is limited to instances
where the diffusion coefficient of the aggregate is between 0.2 and 10 times that of the concrete;
when this is the case, the diffusion coefficient of concrete can increase by a factor of ten
(Hobbs, 2000).
If the aggregate diffusion coefficient is lower than the diffusion coefficient of the cement paste,
the result is concrete with a diffusion coefficient lower than that of the cement paste (Hobbs,
2000). The volume of aggregates in the concrete also affects the diffusion coefficient. Reasons
for this could be porosity of the aggregates, which is linked to their ability to resist chloride
ingress and other deleterious species (Grieve, 2009a).
2.2.5.6 Influence of exposure environment
Structures in marine environments are more prone to deterioration due to chloride-induced
corrosion than inland structures. For this reason, the EN 1992-1-1 and the South African
standard (SANS, 1992) both classify environments depending on the extent of exposure to
seawater or de-icing salt. Marine structures exposed to tidal and splash zones are particularly
susceptible to chloride-induced corrosion. Consequently, some of the most stringent
requirements are specified for these structures. At the other end of the spectrum are marine
structures that are considerably further away from the sea and therefore subject to much less
salt exposure. Specifications for these structures allow for the use of less conservative values
LITERATURE REVIEW 22
for cover and water/binder ratios. In a marine environment, the surface chloride concentration
increases with time. In contrast, the diffusion coefficient decreases with time (Song et al.,
2008). Both effects are intuitive considering the increased hydration and the subsequent loss in
moisture as well as the abundance of chloride ions in the marine environment.
2.2.5.7 Influence of water/binder ratio
The water/binder ratio of the concrete also factors into the rate of chloride ingress (Hobbs and
Matthews, 1998). Generally, increasing the water/binder ratio adversely affects performance.
Hobbs and Matthews (1998) analysed a number of field results from marine structures around
the world. Their analysis revealed that when plotted on a linear-linear basis the effective
diffusion coefficient and the water/cement ratio showed no distinct pattern. However, when
plotted on a log-linear scale, it was apparent that the diffusion coefficient increases with
increasing water/binder ratio. Their study included a wide range of water/binder ratios from
0.3 to 0.9. Although these values are much higher than those used in industry nowadays, studies
done in the last few years with a smaller range of water/binder ratios, 0.4 to 0.6, still reflect
these trends (Bertolini et al., 2011).
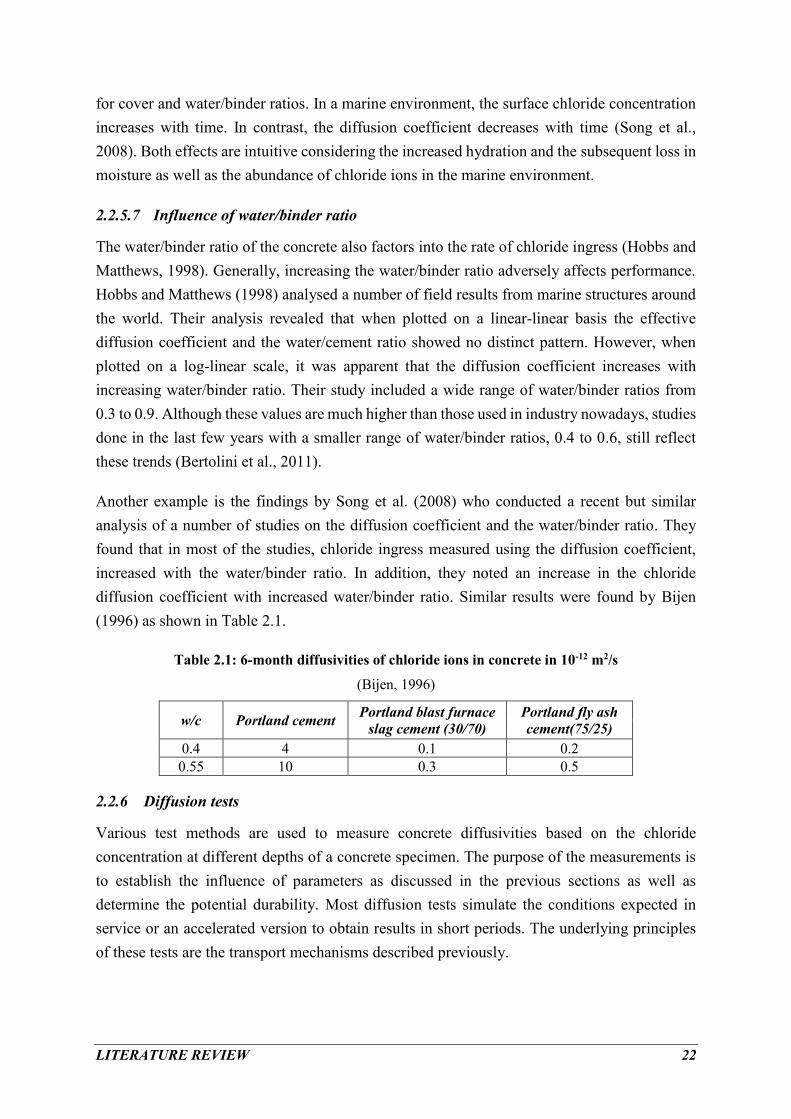
Another example is the findings by Song et al. (2008) who conducted a recent but similar
analysis of a number of studies on the diffusion coefficient and the water/binder ratio. They
found that in most of the studies, chloride ingress measured using the diffusion coefficient,
increased with the water/binder ratio. In addition, they noted an increase in the chloride
diffusion coefficient with increased water/binder ratio. Similar results were found by Bijen
(1996) as shown in Table 2.1.
Table 2.1: 6-month diffusivities of chloride ions in concrete in 10-12 m2/s
(Bijen, 1996)
w/c Portland cement Portland blast furnace
slag cement (30/70) Portland fly ash
cement(75/25)
0.4 4 0.1 0.2 0.55 10 0.3 0.5
2.2.6 Diffusion tests
Various test methods are used to measure concrete diffusivities based on the chloride
concentration at different depths of a concrete specimen. The purpose of the measurements is
to establish the influence of parameters as discussed in the previous sections as well as
determine the potential durability. Most diffusion tests simulate the conditions expected in
service or an accelerated version to obtain results in short periods. The underlying principles
of these tests are the transport mechanisms described previously.

LITERATURE REVIEW 23
2.2.6.1 AASHTO T259 – salt ponding
The American Association of State Highway and Transportation Officials (AASHTO) have
developed a salt ponding test called AASHTO T259 (1980). AASHTO T259 is a long-term
test usually used to validate results of rapid chloride diffusion tests. The test procedure requires
covering the sides of square specimens that have been moist cured for 14 days before drying
for 28 days. Then the tops are dosed with a 3% NaCl solution while the bottom remains in 50%
relative humidity for 90 days, allowing the diffusion process to occur as depicted in Figure
2.11.
Figure 2.11: Schematic of AASHTO T259
After the 90 days, thin slices are cut from the specimen and their chloride concentration is
measured. It is important to note that the test only measures the average chloride concentration
at a certain depth and not the variation (Stanish et al., 2002). Additionally, the drying process
before the test and differences in moisture between the top and bottom surfaces during the test
implies that instead of pure diffusion, sorption and wicking occur. Nevertheless, unlike the
ASTM C1202, it can be used even when concrete contains admixtures and for high quality
concrete even though these take longer than the recommended 90 days (Cho and Chiang, 2006;
Stanish et al., 2002).
2.2.6.2 NT Build 443 – Bulk diffusion
Similar to the AASHTO T259 (1980) is the Bulk Diffusion test (Nord Test) or NT Build 443
(1995). A version of this test modified for American standards is called the ASTM C1556
(2011). Although all three tests undergo 14-day moist curing, unlike AASHTO T259,
AASHTO T259 and ASTM C1556 have the sides and the bottom covered to limit the influence
of absorption and permeability. Additionally, rather than drying after moist curing, concrete
specimens are saturated with limewater to prevent sorption before being immersed in 2.8M
NaCl solution for at least 35 days (NT Build 443, 1995; ASTM, 2011). Thereafter, small
increments (0.5mm) along the depth of the specimen, from the exposed surface, are ground
into powder and tested for chloride content. This enables the measurement of the chloride

LITERATURE REVIEW 24
profile across the depth of the specimen. The error function (erf) is fitted to the chloride
contents (profile) to get the diffusion coefficient and surface chloride concentration from
Crank’s solution of Fick’s second law. This is achieved using non-linear regression analysis
(Stanish et al., 2002; Kessler et al., 2008).
Figure 2.12: Schematic of NT Build 443 set-up
2.2.7 Rapid chloride transport tests
It is generally agreed that a rapid test for chloride ingress in concrete is necessary because the
diffusion process is considerably long (Streicher and Alexander, 1995; Stanish et al., 2006;
Rear et al., 2010). Consequently, while the tests described above may be a good representation
of the diffusion process of chloride ions in concrete, they remain impractical due to the length
of time required. Although the two test durations are rather long, ultimately they allow the
measurement of the natural diffusion process. The tests are a common means of comparison
and assessment of the accuracy of rapid chloride tests such as the ones described subsequently.
Any glaring disparity between results from these tests and short-term results from the rapid
tests is a reason enough to disregard the short-term tests. The main reason is that the rapid tests
do not actually measure the natural progression of the chloride through the concrete.
Rapid Chloride Tests are based on the transport process of migration explained previously in
this section. They require the speeding up of the movement of chloride ions through concrete
by application of a potential difference. The tests are a measure of mechanisms that can be
related to the degree of resistance of concrete against the ingress of chloride ions.
2.2.7.1 NT Build 492 – Rapid Chloride Migration
The NT Build 492 is a rapid chloride migration test that can be completed within 24 hours
(CHLORTEST, 2005). Although the NT Build 492 test is related to chloride diffusivity
(Romer, 2005), the parameter obtained from the test is the so-called non-steady state migration
coefficient rather than the diffusion coefficient. The procedure requires at least three cylindrical

LITERATURE REVIEW 25
concrete specimens of 100 mm diameter and 50 mm thickness, placed in the setup shown in
Figure 2.13.
Figure 2.13: NT Build 492 migration setup
(NT Build 492, 1999)
Each concrete cylinder has a voltage applied axially and the initial current measured to allow
the migration of chloride ions. The duration of voltage application depends on the initial current
and can vary between 6 to 96 hours. As seen previously, the anolyte is NaOH and the catholyte
is NaCl conducive for the transport of chloride ions. The cylinder is split axially and one
exposed circular surface is sprayed with silver nitrate, revealing the depth of chloride
penetration, which can then be measured. Thereafter, the non-steady state migration coefficient
is calculated using a variation of the Nernst-Einstein equation (Equation 2.6). The diffusion
coefficient from the rapid chloride migration is used as an input parameter for the calculation
of the corrosion initiation period in DuraCrete.
2.2.7.2 ASTM C1202 – Rapid Chloride Penetrability Test
The ASTM C1202 whose AASHTO counterpart is the T277 is sometimes referred to as the
rapid chloride penetrability test (RCPT). It is a migration-based chloride test used to measure
the charge (Coulombs) through the concrete by voltage application. The charge is then related
to the concrete’s penetrability (CHLORTEST, 2005). The actual chloride penetrability testing
occurs after a 28-day moist curing regime. The moist curing can be extended until 56 days or
accelerated for a period of only 7 days. The general procedure for both versions of the test is
as follows (ASTM, 2012).
Firstly, the specimen is pre-conditioned by being placed in a vacuum for three hours. Secondly,
it is immersed in water and then vacuum saturated for another hour. Thereafter, it is soaked in
water for 18 hours. This ensures that all specimens have the same moisture content at the start
of the test (Suprenant, 1991). Then the specimen is placed between 2 reservoirs of 0.3 M NaOH
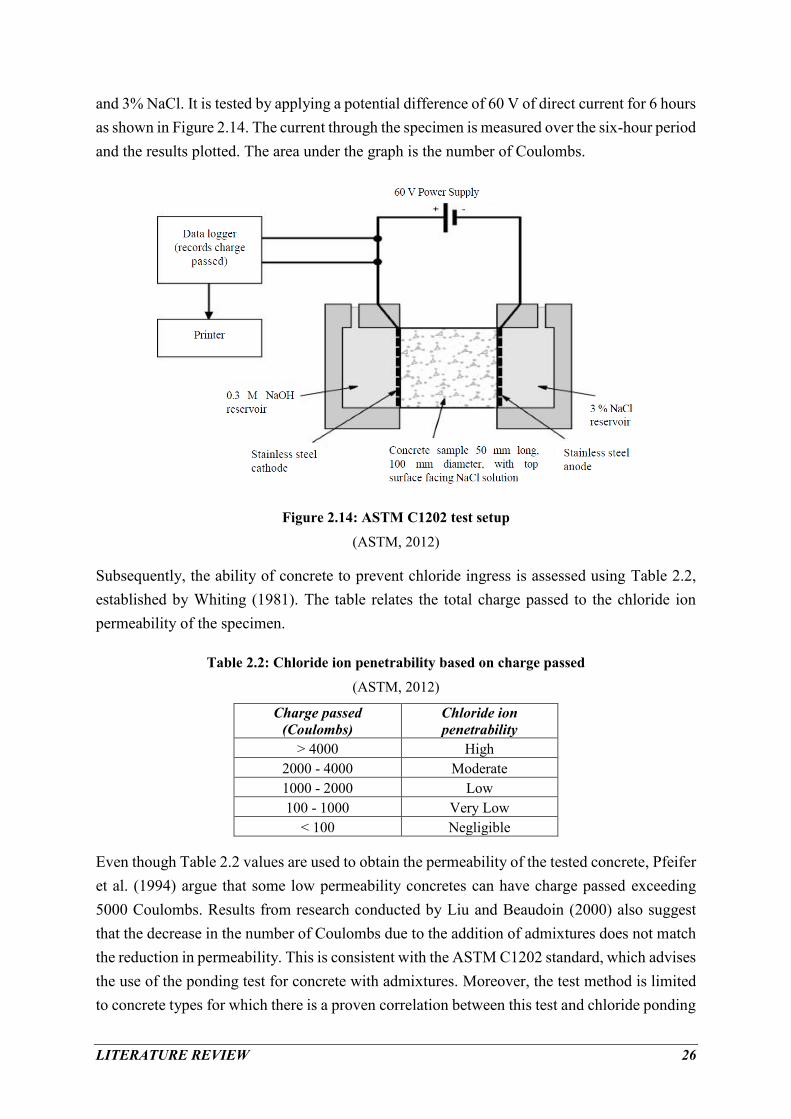
LITERATURE REVIEW 26
and 3% NaCl. It is tested by applying a potential difference of 60 V of direct current for 6 hours
as shown in Figure 2.14. The current through the specimen is measured over the six-hour period
and the results plotted. The area under the graph is the number of Coulombs.
Figure 2.14: ASTM C1202 test setup
(ASTM, 2012)
Subsequently, the ability of concrete to prevent chloride ingress is assessed using Table 2.2,
established by Whiting (1981). The table relates the total charge passed to the chloride ion
permeability of the specimen.
Table 2.2: Chloride ion penetrability based on charge passed
(ASTM, 2012)
Charge passed
(Coulombs) Chloride ion
penetrability
> 4000 High
2000 - 4000 Moderate
1000 - 2000 Low
100 - 1000 Very Low
< 100 Negligible
Even though Table 2.2 values are used to obtain the permeability of the tested concrete, Pfeifer
et al. (1994) argue that some low permeability concretes can have charge passed exceeding
5000 Coulombs. Results from research conducted by Liu and Beaudoin (2000) also suggest
that the decrease in the number of Coulombs due to the addition of admixtures does not match
the reduction in permeability. This is consistent with the ASTM C1202 standard, which advises
the use of the ponding test for concrete with admixtures. Moreover, the test method is limited
to concrete types for which there is a proven correlation between this test and chloride ponding

LITERATURE REVIEW 27
tests such as AASHTO T259 (1980). Despite this, few users of the method ensure the restriction
is adhered to by carrying out the AASHTO T259 or other similar long-term tests (Pfeifer et al.,
1994). In summary, the major shortcomings of the test include:
1) The high voltage increases the temperature thereby affecting the conductivity in what is
known as the Joule effect. However, this is not accounted for.
3) The charge measured is also a function of other ions and is not an exclusive measure of
chloride ions.
4) The test is not under steady state conditions meaning Fick's laws of diffusion cannot be used
to analyse the results for service life prediction.
5) The test cannot be used for concretes with admixtures.
This has caused authors such as Stanish et al. (2002) to question why it is still in use.
Nonetheless, Pfeifer et al. (1994) defend its use and put the blame on contractors and
researchers who fail to fully comprehend what it was designed for and what it measures before
testing. A study on the RCPT, done by Feldman et al. (1994, 1999) offers a comprehensive and
critical analysis of the test.
2.3 PART 2: THE CHLORIDE CONDUCTIVITY TEST
2.3.1 Background
Conductivity (σ) is an electrochemical process (measured in mS/cm) that reflects the ionic
strength of the pore liquid as well as the ease with which ions can move unimpeded through
the microstructure of the concrete. The chloride conductivity test (CCT) is a Durability Index
test (DI) developed in South Africa at the Universities of Cape Town and Witswatersrand
(Streicher 1997). It is used in the performance-based approach for the design of durable
reinforced concrete structures. The test can also be used for quality control and assessment
during and after construction. The development of the CCT was led by Mackechnie (1996) and
Streicher (1997). Their study and subsequent implementation of the test was necessitated by
the need for an accurate rapid chloride test. Streicher assisted in the development of the actual
CCT, while Mackechnie was instrumental in the creation of the service life prediction (SLP)
model for chloride ingress in the DI.
The development of the test included statistical analysis to establish the precision of the test.
In addition, a standardisation process was performed using a ruggedness test to establish the
accuracy of the results in the event of slight deviations from the recommended procedure
(Streicher 1997). The development of the SLP model used a combination of CCTs and case
studies of old structures in the marine environment. The former was used to establish short-
term properties, which were linked to the latter or long-term properties of reinforced concrete

LITERATURE REVIEW 28
structures. Long-term tests such as the Bulk diffusion test were used for validation purposes of
the proffered prediction model (Mackechnie, 1996).
Currently, the CCT is used for quality control purposes during construction, as well as service
life prediction during the design process. Specifically, the CCT is used to determine the cover
quality with respect to chloride ingress and estimate the chloride diffusion coefficient in a
relatively short time. In addition, the test is valid over a range of materials and environments,
a move away from the prescriptive approach, which did not account for these properties.
Furthermore, it has been proven repeatable and reproducible and has good correlation with
other rapid chloride tests and longer-term tests that directly measure diffusion (Stanish et al.,
2006; Mackechnie and Alexander, 2000b; Beushausen and Alexander, 2008).
2.3.2 Theoretical basis of the CCT
The test measures the conductivity of the concrete and relates it to its diffusibility for two
reasons. Firstly, this stems from studies that have shown that the electrical conductivity of
concrete is related to concrete porosity (Brace et al., 1965). Secondly, other researchers have
shown that the diffusibility of cement-based materials is dependent on the porosity (Garboczi
and Bentz, 1992). Since both conductivity and diffusion are dependent on the porosity, which
is a function of the microstructure, it is tenable that the two are related. Using the Nernst-
Einstein equation it can also be shown that the conductivity of a porous solution and that of a
porous material saturated with the pore solution are related by the same material constant or
diffusibility Q. This was confirmed through experiments conducted by Brace et al. (1965)
culminating in Equation 2.7 or the diffusibility equation.
𝐷
𝐷0=
𝜎
𝜎0= 𝑄 (2.7 )
where 𝜎 is the conductivity of the sample saturated with the electrolyte or porous medium
(concrete) [mS/cm]; 𝜎0 is the conductivity of electrolyte or pore solution [mS/cm]; D is the
diffusion coefficient of the porous medium; 𝐷0 is the diffusion coefficient of the pore solution
Atkinson and Nickerson (1984) also illustrated electrical conductivity of a porous material
saturated with a strong solution can be used to rapidly determine the permeability of the porous
material. However, the diffusibility of chloride ion is difficult to isolate because of the
simultaneous interactions of other ions and their own diffusion in concrete.
Nevertheless, the use of the conductivity relation to the diffusibility negates the use of the
complex Nernst-Einstein equation and the ideal conditions that are difficult to replicate in the
laboratory. Q is then multiplied by the diffusivity of the chloride ions to get the diffusivity of
the porous medium or in this case the concrete specimen (Streicher and Alexander, 1995).

LITERATURE REVIEW 29
Results from the CCT confirm that the chloride conductivity of concrete is linearly related to
the diffusibility (Mackechnie and Alexander, 2000a).
2.3.3 Test method and practical basis of the CCT
The CCT quantifies the 28-day electrical conductivity of a concrete specimen following an 8-
day preconditioning regime (Alexander et al., 1999b). The test requires four concrete discs with
a diameter of 70 ± 2 mm and a thickness of 30 ± 2 mm. These discs are heated in the oven at
a temperature of 50 ± 2℃ for a period of 7 days ± 4 hours and weighed. Thereafter, they are
immediately placed in a desiccator to cool for 2 – 4 hours. This is followed by a 3-hour ± 15
minutes period of vacuum saturation with the cores placed on their sides, along their
circumferences.
Figure 2.15: Vacuum saturation facility for CCT
(Alexander, 2009)
Afterwards, the salt solution is allowed into the vacuum saturation apparatus (Figure 2.15) for
up to 1 hour ± 15 minutes. Air is then allowed in and the discs are allowed to soak in the salt
solution for 18 ± 1 hours. When this period elapses, the discs are weighed once more and then
the actual testing begins. The CCT is carried out at a room temperature of 23 ± 2℃ in the setup
shown in Figure 2.16 below.
Figure 2.16: The chloride conductivity test (CCT) apparatus
(Alexander et al., 1999b)

LITERATURE REVIEW 30
The current through the sample is measured simultaneously with the voltage once the DC
power source reading is adjusted to 10 V (Alexander et al., 1999b). A low voltage is maintained
during the test, between 5 and 10 V to prevent heating up of the concrete specimen under
measurement. This precaution also eliminates the possibility of chloride oxidation at the anode
(Prince et al., 1999).
From the results of the test, the conductivity of the concrete specimen can be computed with
the following equation (Streicher and Alexander, 1999):
𝜎 =𝑖
𝑉⋅
𝑡
𝐴 (2.8 )
where 𝜎 is the conductivity of the sample [mS/cm]; 𝑖 is the electric current [mA]; 𝑉 is the
potential difference [V]; 𝑡 is the specimen thickness [cm]; 𝐴 is the specimen cross-sectional
area [cm2]
The correlation of the initial current and conductivity relationship in Equation 2.8 was
confirmed with tests done at a number of concrete ages by Feldman et al. (1999, 1994). Other
researchers such as Nokken et al. (2008) have also used this relationship. Typical results of the
CCT are shown in Figure 2.17, exhibiting the versatility of the test. It is evident that the test
varies quite drastically with binder type and water/binder ratio. On the one hand, high w/b ratio
results in high CCT values. On the other hand, higher quality cement with fly ash or slag has
much lower CCT values than PC.
Figure 2.17: Typical test results for CCT, in relation to w/b ratio and binder type
(Ballim et al., 2009)

LITERATURE REVIEW 31
2.3.4 Reasons for CCT specifications and assumptions
The ideal thickness was selected from tests that examined the change in conductivity with
specimen thickness. The conductivity increased with thickness when measured at the same age,
for thicknesses of up to 20 mm. However, the specimen thickness had no effect on the
conductivity for specimens thicker than 25 mm as these were prone to imperfect saturation
(Streicher and Alexander, 1999). In addition, the aggregates had greater influence on the
conductivity results in thinner specimens than the thicker ones (Streicher and Alexander, 1999).
This observation necessitated the use of specimens with a minimum thickness of 25 mm to
ensure the repeatability and reproducibility of results for tests performed in different labs.
The temperature at which the specimens are oven dried and tested is an important
consideration. For instance, conductivity increases with increasing temperature, hence the
requirement of a prescribed standard test temperature of 25 ℃ (Streicher and Alexander, 1999).
The reason for this value is that it is close to room temperature and easily attainable in any
laboratory. Furthermore, drying of the samples at 50 ℃ rather than 100 ℃ prevents drying
damage occurring and dilution of the chloride by any leftover moisture (Streicher and
Alexander, 1995).
In addition, the conductivity of the concrete pore solution is taken to be that of the 5 M, NaCl
solution used to saturate the sample. The specification of NaCl was selected for its high ionic
strength, as with most diffusion and migration tests. Saturation was essential to ensure that the
primary transport mechanism is electrical conduction of the chloride ion and not diffusion.
Streicher (1997) made the decision to use a concentration of 5 M based on experimental work.
The effect other ions in the concrete pores have on the conductivity of varying concentrations
of the NaCl solution was investigated. Results showed that irrespective of the concentration of
other ions in the solution, conductivity of the pore solution remains closest to that of the NaCl
solution. In fact, at concentrations higher than 5 M, other ions had virtually no effect on the
conductivity of the pore solution (Alexander et al., 1999b). The diffusibility ratio also remained
constant at 5 M NaCl and higher, regardless of the increase in concentration of other ions.
Therefore, the assumption that the conductivity of the concrete pore solution mirrors that of
the saturating solution of 5 M NaCl is valid.
2.3.5 Evaluation of CCT and comparison with other rapid chloride tests
The chloride conductivity test is sensitive to the exposure environment, water/binder ratio,
cement type, age and curing regime (Alexander et al., 1999b). Thus, it meets the requirements
for a standard durability test. However, inadequate saturation of high strength concrete and
heat damage caused by the drying process have been highlighted as major causes for concern
(Mackechnie and Alexander, 2000b). The developers of the CCT have addressed the imperfect
LITERATURE REVIEW 32
saturation. They advise testing specimens with varying thickness. When thicker specimens
result in low conductivity, this is a sign of ineffective saturation and such concrete should not
be used for the test (Streicher and Alexander, 1999). Nonetheless, it is unclear how to consider
this under normal chloride conductivity testing circumstances.
Another challenge is the 7-day oven drying procedure. This may induce drying cracks into the
concrete thereby distorting the actual diffusion coefficient of the concrete specimen (Liu and
Beaudoin, 2000). The rationale is that heating introduces significant changes in the pore
structure and therefore the conductivity increases (Atkinson and Nickerson, 1984). A similar
problem is associated with the Rapid Chloride Permeability Test (RCPT), which includes a 6-
hour application of 60 V (ASTM, 2012). Consequently, it has been found that not only does
the RCPT change the resistivity properties of the measured concrete but it also instigates
changes in the pore structure (Feldman et al., 1994).
Even though the CCT is meant for new structures, researchers sometimes use it to characterise
concrete specimens from older structures. However, older structures may have surface
treatments, carbonation and exposure to marine salts all of which distort the CCT. The test also
cannot be conducted on concrete with either steel reinforcement or aggregate sizes exceeding
26.5 mm (Alexander, 2009).
Issues identified with the CCT procedure include the pre-conditioning phase, which takes 7
days. This is rather lengthy compared to the RCPT pre-conditioning which takes about a day
(Liu and Beaudoin, 2000). Nevertheless, unlike the CCT, there is no criterion for concretes
with admixtures in the RCPT. Apparently, this important consideration of concrete materials
was not implemented into the test method (Liu and Beaudoin, 2000; ASTM, 2012).
Another study comparing the RCPT and the CCT conducted in Australia by Sharfuddin et al.
( 2008) concluded that the latter was a better test than the former in terms of ease of use and
rapidness. In addition, whereas confidence in the use of the CCT is on the rise (Beushausen
and Alexander, 2008) the RCPT is being replaced with the surface resistivity test in certain
areas (Kessler et al., 2008). Reasons for this change include results that have shown that the
surface resistivity test is less costly, non-destructive and easier to implement than the RCPT
(Riding et al., 2008).
The reproducibility and repeatability of the CCT was confirmed in an extensive study on the
South African DI tests (Stanish et al., 2006). The study tested ten mixtures in ten different labs
resulting in a repeatability of 9.1% and reproducibility of 21.1 %. Despite this, it is worth noting
that the researchers recommended improved clarity of specifications for the test procedure.
This came out of results from some laboratories that had to be discarded because the test was

LITERATURE REVIEW 33
not performed in a satisfactory manner. Perhaps because of this recommendation, the previous
procedural manual was revised (Alexander, 2009).
The CCT showed good results compared with other tests measuring rapid chloride ingress and
diffusion into concrete around the world (Beushausen and Alexander, 2008; Mackechnie and
Alexander, 2000b). In particular, there was a good correlation with the RCPT as well as the
NT Build across six concrete mixes. This correlation is depicted in the figures below with test
results of CCT increasing with increasing Coulombs and diffusion coefficient.
Figure 2.18: Correlation between CCT & ASTM C1202 test results
(Beushausen and Alexander, 2008)
Figure 2.19: Correlation between CCT & NT Build 443 test results
(Beushausen and Alexander, 2008)
NT
Bu
ild
Dif
fusi
on
co
effi
cien
t 1
0-1
2(m
2/s
)

LITERATURE REVIEW 34
The linear relationship was based on test results of six different concrete mixes (1-6) suggesting
its wide-ranging validity. The correlation with the NT Build 443 is predictable, considering
that both the tests have been found suitable for the prediction of long-term chloride levels in
concrete (Mackechnie and Alexander, 2000b). However, the relationship with the RCPT is less
obvious considering the various issues that have been raised about it.
2.3.6 The use of CCT for performance-based specifications
Prior to the inception of the performance-based approach, it was assumed that concrete strength
measurements were adequate to ensure the durability of concrete via the prescriptive approach.
However, with the advent of other cementitious materials and the growing number of structures
not reaching their service life it became clear that strength did not always equal durability (Rear
et al., 2010).
Performance-based specifications provide a more flexible means to assess the potential
durability of reinforced concrete at an early age than prescriptive-based specifications
(Alexander et al., 2011). Rather than w/b ratios and binder content, performance-based
specifications are more robust and classified based on actual concrete cover quality or
durability test results. Performance-based specifications are available for both the CCT and
surface concrete resistivity due to their relationship with chloride ion diffusion in concrete,
which is a durability indicator.
2.3.6.1 CCT specifications
In earlier work, Alexander et al. (1999b) recommended Table 2.3 (see below) for durability
classification of reinforced concrete using CCT results. The durability class Excellent referred
to the best quality concrete while Very poor is associated with poor quality concrete.
Table 2.3: Durability classification using CCT values
(Alexander et al., 1999b)
Durability class CCT (mS/cm)
Excellent < 0.75
Good 0.75 - 1.50
Poor 1.50 - 2.50
Very poor > 2.50
However, this did not consider other factors such as binder type and exposure environment,
which also have an effect on the durability of a RC structure. It is evident that a more
comprehensive method of durability classification that included these factors and the required
service life was necessary.
Consequently, a more comprehensive CCT durability classification system was developed
depending on the project level, required quality, as-built quality and material potential. It
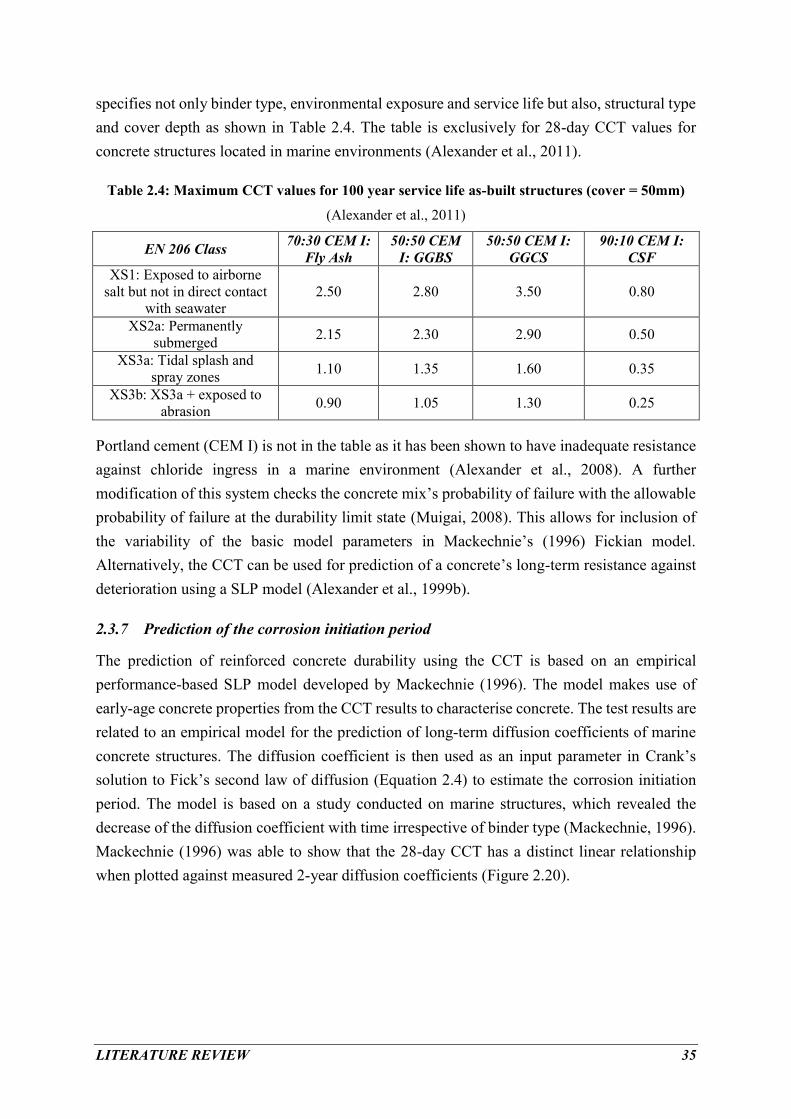
LITERATURE REVIEW 35
specifies not only binder type, environmental exposure and service life but also, structural type
and cover depth as shown in Table 2.4. The table is exclusively for 28-day CCT values for
concrete structures located in marine environments (Alexander et al., 2011).
Table 2.4: Maximum CCT values for 100 year service life as-built structures (cover = 50mm)
(Alexander et al., 2011)
EN 206 Class 70:30 CEM I:
Fly Ash 50:50 CEM
I: GGBS 50:50 CEM I:
GGCS 90:10 CEM I:
CSF XS1: Exposed to airborne
salt but not in direct contact
with seawater 2.50 2.80 3.50 0.80
XS2a: Permanently
submerged 2.15 2.30 2.90 0.50
XS3a: Tidal splash and
spray zones 1.10 1.35 1.60 0.35
XS3b: XS3a + exposed to
abrasion 0.90 1.05 1.30 0.25
Portland cement (CEM I) is not in the table as it has been shown to have inadequate resistance
against chloride ingress in a marine environment (Alexander et al., 2008). A further
modification of this system checks the concrete mix’s probability of failure with the allowable
probability of failure at the durability limit state (Muigai, 2008). This allows for inclusion of
the variability of the basic model parameters in Mackechnie’s (1996) Fickian model.
Alternatively, the CCT can be used for prediction of a concrete’s long-term resistance against
deterioration using a SLP model (Alexander et al., 1999b).
2.3.7 Prediction of the corrosion initiation period
The prediction of reinforced concrete durability using the CCT is based on an empirical
performance-based SLP model developed by Mackechnie (1996). The model makes use of
early-age concrete properties from the CCT results to characterise concrete. The test results are
related to an empirical model for the prediction of long-term diffusion coefficients of marine
concrete structures. The diffusion coefficient is then used as an input parameter in Crank’s
solution to Fick’s second law of diffusion (Equation 2.4) to estimate the corrosion initiation
period. The model is based on a study conducted on marine structures, which revealed the
decrease of the diffusion coefficient with time irrespective of binder type (Mackechnie, 1996).
Mackechnie (1996) was able to show that the 28-day CCT has a distinct linear relationship
when plotted against measured 2-year diffusion coefficients (Figure 2.20).
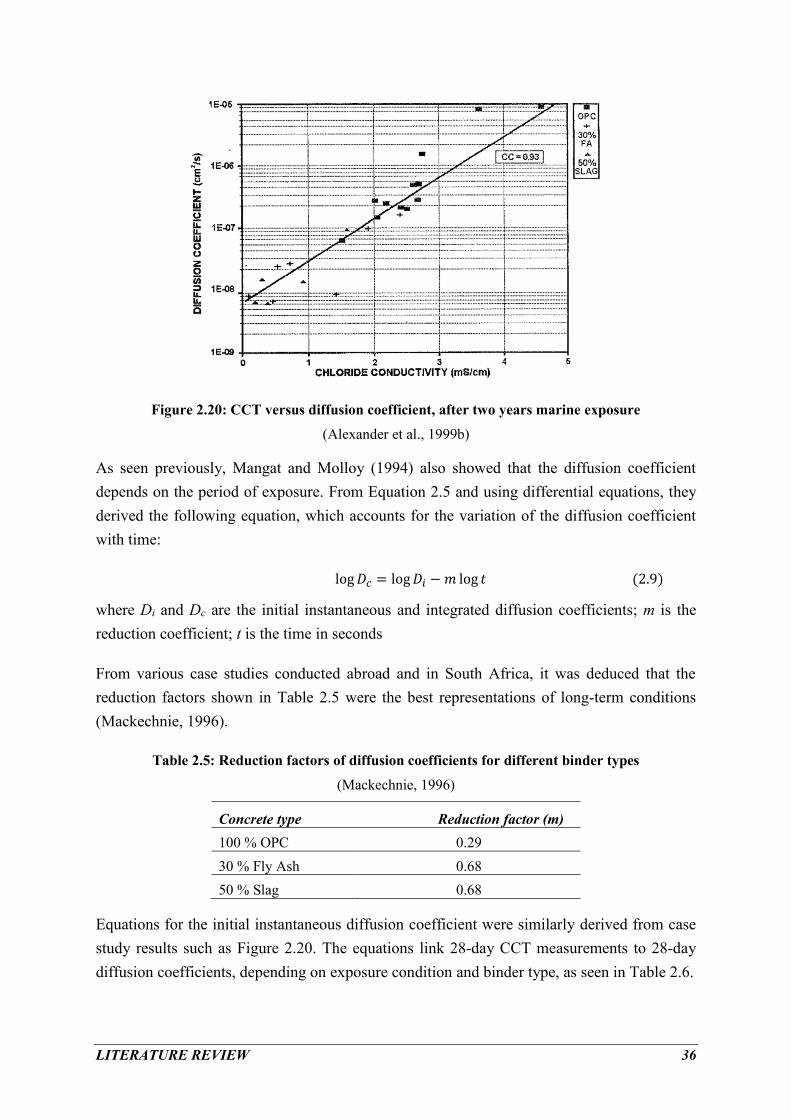
LITERATURE REVIEW 36
Figure 2.20: CCT versus diffusion coefficient, after two years marine exposure
(Alexander et al., 1999b)
As seen previously, Mangat and Molloy (1994) also showed that the diffusion coefficient
depends on the period of exposure. From Equation 2.5 and using differential equations, they
derived the following equation, which accounts for the variation of the diffusion coefficient
with time:
log 𝐷𝑐 = log 𝐷𝑖 − 𝑚 log 𝑡 (2.9)
where Di and Dc are the initial instantaneous and integrated diffusion coefficients; m is the
reduction coefficient; t is the time in seconds
From various case studies conducted abroad and in South Africa, it was deduced that the
reduction factors shown in Table 2.5 were the best representations of long-term conditions
(Mackechnie, 1996).
Table 2.5: Reduction factors of diffusion coefficients for different binder types
(Mackechnie, 1996)
Concrete type Reduction factor (m)
100 % OPC 0.29
30 % Fly Ash 0.68
50 % Slag 0.68
Equations for the initial instantaneous diffusion coefficient were similarly derived from case
study results such as Figure 2.20. The equations link 28-day CCT measurements to 28-day
diffusion coefficients, depending on exposure condition and binder type, as seen in Table 2.6.

LITERATURE REVIEW 37
Table 2.6: Equations for Initial instantaneous Diffusion coefficients Dc from 28-day CCT results
(Mackechnie, 1996)
Diffusion coefficients (Dc) (cm2/s)
Exposure OPC 50% SLAG 30% FA
Extreme 2.8 x 10⁻⁹(2.7181.6CCI) 5.2 x 10⁻⁹(2.7181.2CCI) 6.0 x 10⁻⁹(2.7181.3CCI)
Very severe 3.6 x 10⁻⁹(2.7181.1CCI) 5.5 x 10⁻⁹(2.7180.9CCI) 6.8 x 10⁻⁹(2.7180.95CCI)
Severe 4.0 x 10⁻⁹(2.7180.9CCI) 5.0 x 10⁻⁹(2.7180.75CCI) 6.0 x 10⁻⁹(2.7180.75CCI)
*where CCI is the 28-day chloride conductivity
The 28-day diffusion coefficients are in turn used to determine the 2-year diffusion coefficients
as follows. Based on his studies, Mackechnie (1996) took the time t in Equation 2.9 as 2 years
so that the second term became:
m log t = m log (2 x 365 x 24 x 60 x 60) = 7.7998m (2.9a)
log 𝐷𝑖 = log 𝐷𝑐 + 7.7998𝑚 (2.10)
where Di and Dc are the 2-year and 28-day diffusion coefficients; m is the reduction coefficient,
t is the time in seconds
From Equation 2.10 and the equations in Table 2.6, one can get the 2-year diffusion coefficient
for a concrete structure in any marine exposure category. The 2-year diffusion coefficient is
used as an intermediate parameter for the calculation of the long-term diffusion coefficient.
Once the two-year diffusion coefficient is known, it then becomes the initial instantaneous
value in Equation 2.9. Taking the inverse logarithm of Equation 2.9 and the 2-year diffusion
coefficient from Equation 2.10, the long-term diffusion coefficient at any age x is calculated as
follows:
𝐷𝑥 = 10𝑙𝑜𝑔𝐷𝑖 − 𝑚[log(𝑥×365×24×60×60)] (2.11)
where Dx is the diffusion coefficient at design age x (years); Di is the integrated diffusion
coefficients; m is the reduction factor
The diffusion coefficient obtained from Equation 2.11 is then used as an input parameter in
service life prediction (SLP) models such as Equation 2.4. Mackechnie summarised this
procedure in two nomograms introduced below.

LITERATURE REVIEW 38
Figure 2.21: Prediction of fifty-year diffusion coefficient for marine concrete
(Mackechnie, 2001)
The nomogram in Figure 2.21 is a simplification of the model and can be used to determine the
desired long-term diffusion coefficient as described above. The binder type lines in Figure 2.21
represent the different rates at which the 28-day chloride conductivity increases with time.
Cement extenders such as fly ash and slag have better resistance than 100% Portland cement
and so usually have lower values of modified chloride conductivity. The modified chloride
conductivity is the intermediate step, which accounts for the long-term changes in the concrete
due to chloride binding and continued hydration (Mackechnie, 2001; Alexander et al., 2012).
The lower graph in Figure 2.21 represents the increase in diffusion coefficient with the
modified chloride conductivity coefficient as seen in the diffusibility equation. The graph
differs with marine exposure condition since concrete in a severe environment would have to
be more resistant to chloride ingress i.e. have a lower diffusion coefficient, than one in better
conditions.
Once the 28-day CCT result is determined as described previously, the value can be located in
Figure 2.21. Thereafter, a line is drawn parallel to the x-axis until it meets the binder type line
(1). The next line (2) is from the respective binder type line, to the exposure condition line.
Lastly, line 3 is drawn from the exposure line to the y-axis to obtain the two-year diffusion
coefficient. The diffusion coefficient can be used on its own right to compare the penetration
resistance of chloride ions in concrete specimens or as an input in SLP models.
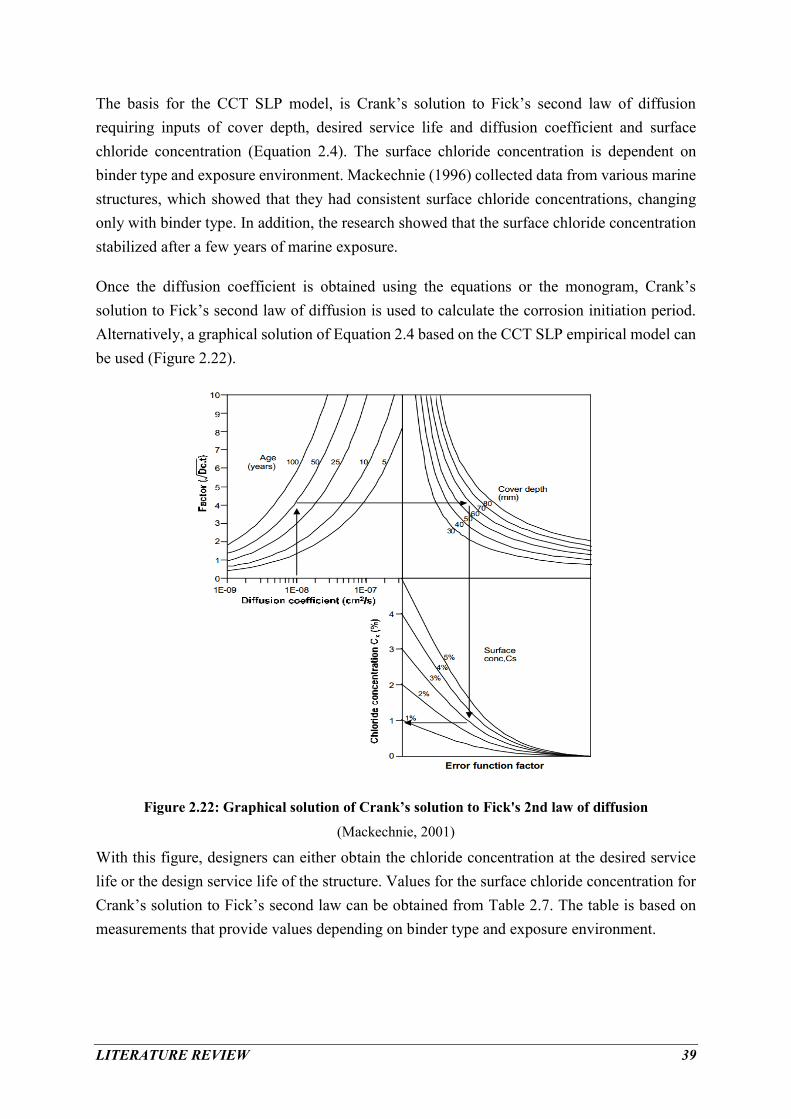
LITERATURE REVIEW 39
The basis for the CCT SLP model, is Crank’s solution to Fick’s second law of diffusion
requiring inputs of cover depth, desired service life and diffusion coefficient and surface
chloride concentration (Equation 2.4). The surface chloride concentration is dependent on
binder type and exposure environment. Mackechnie (1996) collected data from various marine
structures, which showed that they had consistent surface chloride concentrations, changing
only with binder type. In addition, the research showed that the surface chloride concentration
stabilized after a few years of marine exposure.
Once the diffusion coefficient is obtained using the equations or the monogram, Crank’s
solution to Fick’s second law of diffusion is used to calculate the corrosion initiation period.
Alternatively, a graphical solution of Equation 2.4 based on the CCT SLP empirical model can
be used (Figure 2.22).
Figure 2.22: Graphical solution of Crank’s solution to Fick's 2nd law of diffusion
(Mackechnie, 2001)
With this figure, designers can either obtain the chloride concentration at the desired service
life or the design service life of the structure. Values for the surface chloride concentration for
Crank’s solution to Fick’s second law can be obtained from Table 2.7. The table is based on
measurements that provide values depending on binder type and exposure environment.
LITERATURE REVIEW 40
Table 2.7: Surface chloride concentrations (% by mass of binder)
(Mackechnie, 2001)
Concrete type Tidal/splash zone Spray zone
100 % PC 3.0 – 4.0 1.5 – 2.0
10% SF 2.5 – 3.0 1.3 – 1.5
30% FA 4.5 – 5.0 2.3 – 2.5
50% SL 5.0 – 6.0 2.5 – 3.0
The chloride concentration (Cx) obtained from Figure 2.22 can then be compared to the chloride
threshold level, taken as occurring between 0.4 – 0.5% by mass of cement. The designer can
then make a decision on whether or not the proposed structure will be durable enough to last
as long as the desired service life (Mackechnie, 2001). This will depend on how close the
calculated value is to the chloride threshold level. However, it is worth noting the variability in
the literature on the chloride threshold level as seen earlier. Definitions as well as accepted
values vary and authors differ even in how they define it (Glass and Buenfeld, 1997; Oh et al.,
2003).
Alternatively, the diffusion coefficient and can be obtained using a spreadsheet developed at
the University of Cape Town with the exposure environment, binder type, and 28-day CCT
result as inputs. Other input parameters such as cover depth can be decided by the designer and
input into Crank’s solution to Fick’s second law of diffusion to obtain the service life or
corrosion initiation period of the structure.
2.3.8 Prediction of the corrosion propagation period
The corrosion propagation phase can also be modelled for purposes of service life prediction.
However, many concerns regarding modelling of corrosion propagation have been highlighted
by Otieno et al. (2011c). These include overestimation or underestimation of corrosion rate
because of users selecting models based on input parameters at their disposal. Additionally, the
corrosion propagation models are usually deficient in describing the assumptions they are
based on. Moreover, the SLP of chloride-induced corrosion is usually focussed on the corrosion
initiation period. The reason for this is that steel passivation quickly leads to pitting corrosion
and significant loss in the rebar cross-section (Bertolini, 2008). Consequently, determining the
corrosion initiation is more important than knowing the corrosion propagation period. It is for
these reasons that this study was limited to corrosion initiation phase.
LITERATURE REVIEW 41
2.4 PART 3: SURFACE CONCRETE RESISTIVITY
Resistivity is a measure of the susceptibility of a material to the flow of ions or an electric
current. A high resistivity implies that the material make-up and connectivity is not conducive
for the flow of ions. In concrete, this means the composite materials that make up the
microstructure and the interconnection of the pores highly influence the resistivity. Both
corrosion and resistivity are electrochemical in nature. Therefore, resistivity reveals the
capacity of the concrete to allow corrosion to occur, but does not indicate whether corrosion is
taking place (Broomfield, 2007).
According to Polder (2001), the concrete electrical resistivity measurements of a structure
exposed to chlorides are used:
To estimate the risk of corrosion if depassivation of the steel rebars has occurred.
To identify the most permeable parts of the structure for further investigation or
rehabilitation.
To locate spots most severely exposed to water and aggressive species.
For the design of cathodic protection systems and other treatments.
The list above provides a starting point of the fundamentals on how the measured surface
concrete resistivity is related to the properties of the RC structure. Nevertheless, in this study,
the focus is on surface concrete resistivity and its use for design purposes and quality
conformity of new structures. For this reason, the section that follows focusses on the concrete
resistivity test methods on concrete specimens in the laboratory.
2.4.1 Surface concrete resistivity test methods
Most concrete resistivity tests require the application of a current and measuring the resulting
voltage. For the most part, the tests are conducted with alternating current. The use of an
alternating current as opposed to a direct current was identified and has been advised for many
years (McCarter et al., 1981; Gowers and Millard, 1999). The scientific reasoning for this was
the need to prevent the polarization phenomenon that occurs on the electrode-concrete interface
when a direct current is used. The resistivity (𝜌) equation is as follows:
𝜌 = 𝑘𝑉 ∕ 𝐼 (2.12 )
where ρ is the resistivity; I is the alternating current [A]; V is the potential difference [V]; k is
a geometrical constant
Test methods for measurement of concrete resistivity include the Wenner probe, Two Electrode
Method (TEM) and Multi-ring electrode method discussed subsequently.
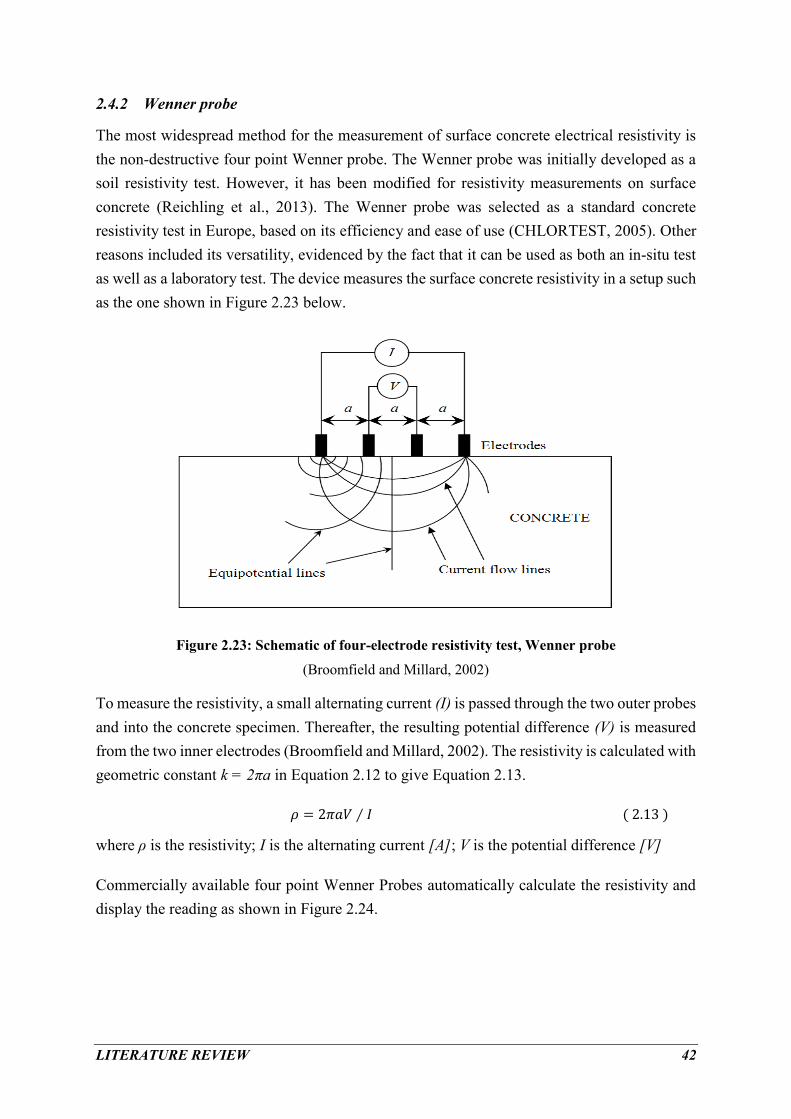
LITERATURE REVIEW 42
2.4.2 Wenner probe
The most widespread method for the measurement of surface concrete electrical resistivity is
the non-destructive four point Wenner probe. The Wenner probe was initially developed as a
soil resistivity test. However, it has been modified for resistivity measurements on surface
concrete (Reichling et al., 2013). The Wenner probe was selected as a standard concrete
resistivity test in Europe, based on its efficiency and ease of use (CHLORTEST, 2005). Other
reasons included its versatility, evidenced by the fact that it can be used as both an in-situ test
as well as a laboratory test. The device measures the surface concrete resistivity in a setup such
as the one shown in Figure 2.23 below.
Figure 2.23: Schematic of four-electrode resistivity test, Wenner probe
(Broomfield and Millard, 2002)
To measure the resistivity, a small alternating current (I) is passed through the two outer probes
and into the concrete specimen. Thereafter, the resulting potential difference (V) is measured
from the two inner electrodes (Broomfield and Millard, 2002). The resistivity is calculated with
geometric constant k = 2πa in Equation 2.12 to give Equation 2.13.
𝜌 = 2𝜋𝑎𝑉 ∕ 𝐼 ( 2.13 )
where ρ is the resistivity; I is the alternating current [A]; V is the potential difference [V]
Commercially available four point Wenner Probes automatically calculate the resistivity and
display the reading as shown in Figure 2.24.
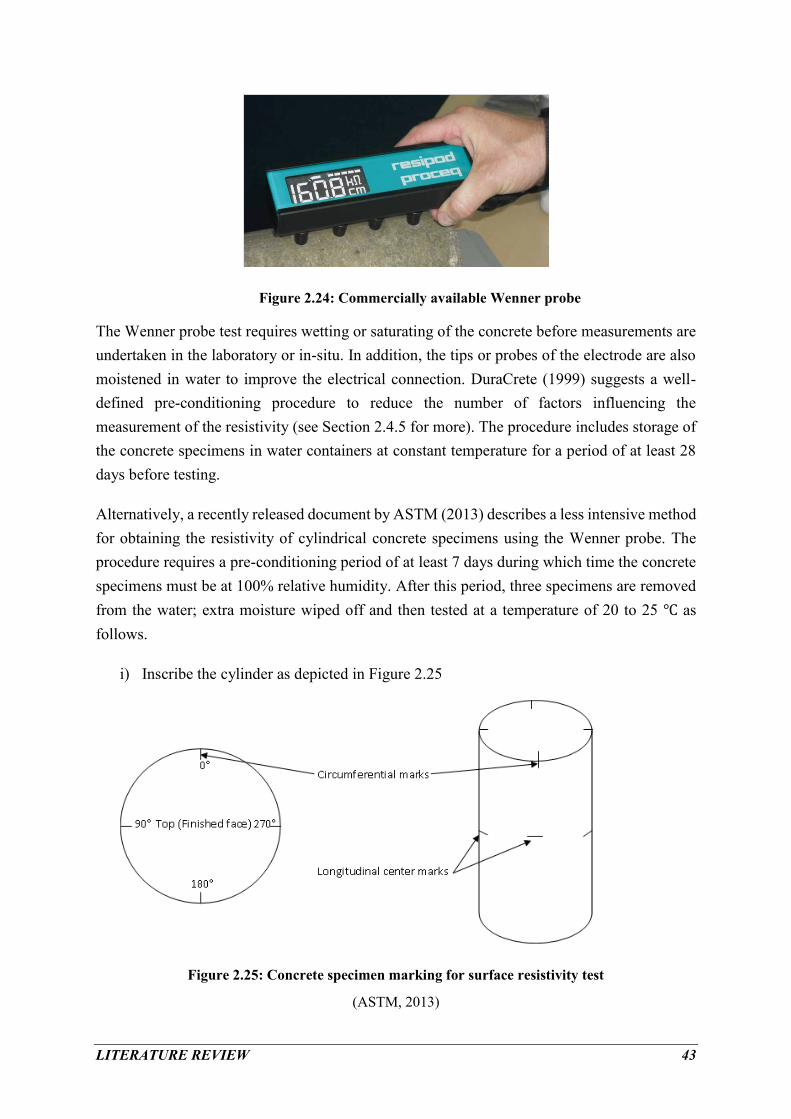
LITERATURE REVIEW 43
Figure 2.24: Commercially available Wenner probe
The Wenner probe test requires wetting or saturating of the concrete before measurements are
undertaken in the laboratory or in-situ. In addition, the tips or probes of the electrode are also
moistened in water to improve the electrical connection. DuraCrete (1999) suggests a well-
defined pre-conditioning procedure to reduce the number of factors influencing the
measurement of the resistivity (see Section 2.4.5 for more). The procedure includes storage of
the concrete specimens in water containers at constant temperature for a period of at least 28
days before testing.
Alternatively, a recently released document by ASTM (2013) describes a less intensive method
for obtaining the resistivity of cylindrical concrete specimens using the Wenner probe. The
procedure requires a pre-conditioning period of at least 7 days during which time the concrete
specimens must be at 100% relative humidity. After this period, three specimens are removed
from the water; extra moisture wiped off and then tested at a temperature of 20 to 25 ℃ as
follows.
i) Inscribe the cylinder as depicted in Figure 2.25
Figure 2.25: Concrete specimen marking for surface resistivity test
(ASTM, 2013)
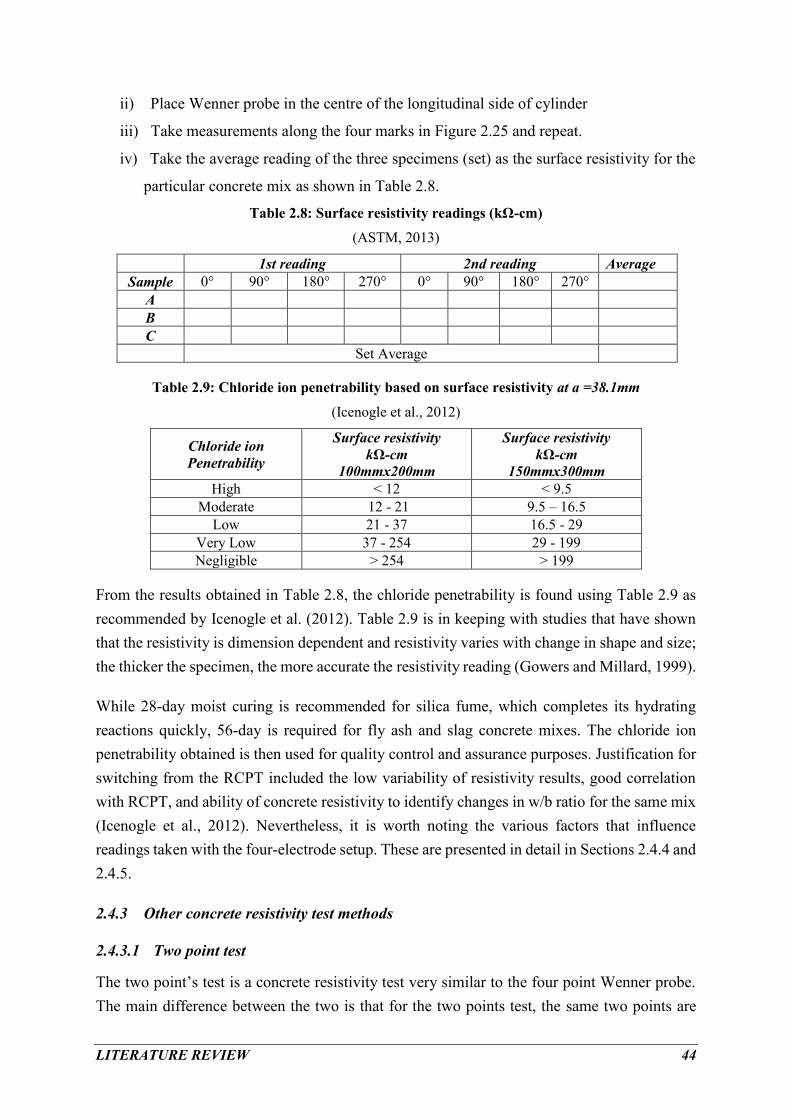
LITERATURE REVIEW 44
ii) Place Wenner probe in the centre of the longitudinal side of cylinder
iii) Take measurements along the four marks in Figure 2.25 and repeat.
iv) Take the average reading of the three specimens (set) as the surface resistivity for the
particular concrete mix as shown in Table 2.8.
Table 2.8: Surface resistivity readings (kΩ-cm)
(ASTM, 2013)
1st reading 2nd reading Average
Sample 0° 90° 180° 270° 0° 90° 180° 270°
A
B
C Set Average
Table 2.9: Chloride ion penetrability based on surface resistivity at a =38.1mm
(Icenogle et al., 2012)
Chloride ion
Penetrability
Surface resistivity kΩ-cm
100mmx200mm
Surface resistivity kΩ-cm
150mmx300mm High < 12 < 9.5
Moderate 12 - 21 9.5 – 16.5 Low 21 - 37 16.5 - 29
Very Low 37 - 254 29 - 199 Negligible > 254 > 199
From the results obtained in Table 2.8, the chloride penetrability is found using Table 2.9 as
recommended by Icenogle et al. (2012). Table 2.9 is in keeping with studies that have shown
that the resistivity is dimension dependent and resistivity varies with change in shape and size;
the thicker the specimen, the more accurate the resistivity reading (Gowers and Millard, 1999).
While 28-day moist curing is recommended for silica fume, which completes its hydrating
reactions quickly, 56-day is required for fly ash and slag concrete mixes. The chloride ion
penetrability obtained is then used for quality control and assurance purposes. Justification for
switching from the RCPT included the low variability of resistivity results, good correlation
with RCPT, and ability of concrete resistivity to identify changes in w/b ratio for the same mix
(Icenogle et al., 2012). Nevertheless, it is worth noting the various factors that influence
readings taken with the four-electrode setup. These are presented in detail in Sections 2.4.4 and
2.4.5.
2.4.3 Other concrete resistivity test methods
2.4.3.1 Two point test
The two point’s test is a concrete resistivity test very similar to the four point Wenner probe.
The main difference between the two is that for the two points test, the same two points are
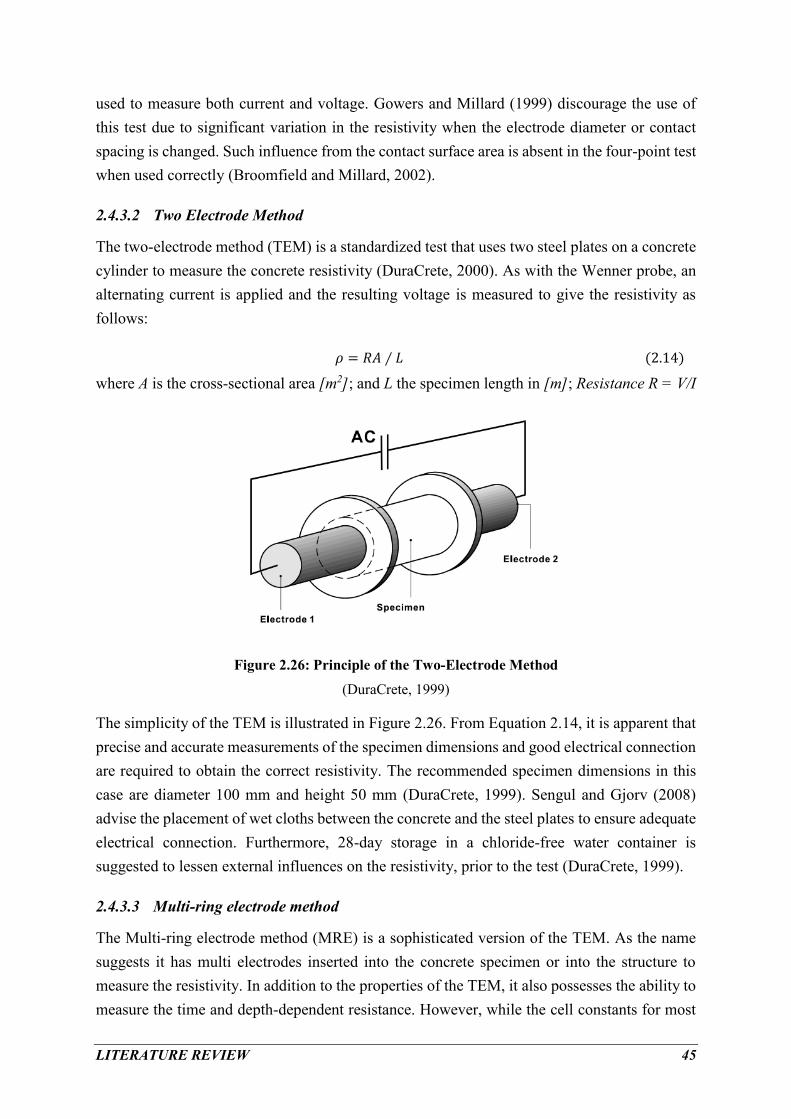
LITERATURE REVIEW 45
used to measure both current and voltage. Gowers and Millard (1999) discourage the use of
this test due to significant variation in the resistivity when the electrode diameter or contact
spacing is changed. Such influence from the contact surface area is absent in the four-point test
when used correctly (Broomfield and Millard, 2002).
2.4.3.2 Two Electrode Method
The two-electrode method (TEM) is a standardized test that uses two steel plates on a concrete
cylinder to measure the concrete resistivity (DuraCrete, 2000). As with the Wenner probe, an
alternating current is applied and the resulting voltage is measured to give the resistivity as
follows:
𝜌 = 𝑅𝐴 ∕ 𝐿 (2.14)
where A is the cross-sectional area [m2]; and L the specimen length in [m]; Resistance R = V/I
Figure 2.26: Principle of the Two-Electrode Method
(DuraCrete, 1999)
The simplicity of the TEM is illustrated in Figure 2.26. From Equation 2.14, it is apparent that
precise and accurate measurements of the specimen dimensions and good electrical connection
are required to obtain the correct resistivity. The recommended specimen dimensions in this
case are diameter 100 mm and height 50 mm (DuraCrete, 1999). Sengul and Gjorv (2008)
advise the placement of wet cloths between the concrete and the steel plates to ensure adequate
electrical connection. Furthermore, 28-day storage in a chloride-free water container is
suggested to lessen external influences on the resistivity, prior to the test (DuraCrete, 1999).
2.4.3.3 Multi-ring electrode method
The Multi-ring electrode method (MRE) is a sophisticated version of the TEM. As the name
suggests it has multi electrodes inserted into the concrete specimen or into the structure to
measure the resistivity. In addition to the properties of the TEM, it also possesses the ability to
measure the time and depth-dependent resistance. However, while the cell constants for most

LITERATURE REVIEW 46
resistivity tests are determined through geometry, the one for the MRE has to be derived
experimentally. The reason for this is that the geometrical conditions are usually difficult to
determine (Büteführ et al., 2006). Moreover, the device has to be embedded into the concrete.
This procedure is performed either before construction or after the structure has been built
when used for in-situ placement (Weydert and Gehlen, 1999; DuraCrete, 1999).
2.4.3.4 Comparison of test methods
A comparison of the TEM and the Wenner probe is shown in Figure 2.27.
Figure 2.27: Interrelation of the TEM with the Wenner probe
(DuraCrete, 2000)
Compared to the TEM, the Wenner probe overestimates electrical resistivity by up to 1.5 times.
Nevertheless, this ratio can be calculated, as it is constant provided the probe spacing and
specimen type are not changing.
2.4.4 Factors influencing measurement of concrete electrical resistivity
Factors in the concrete and its environment tend to lead to variability in the test results of
concrete electrical resistivity. These include the water/binder ratio, binder type and specimen
shape at certain thicknesses. However, other concrete parameters such as aggregates have a
low influence on the variability of resistivity results, provided a set of readings is taken over
the specimen and an average reading recorded (Morris et al., 1996). Various factors and their
influence on concrete resistivity are discussed in detail forthwith.

LITERATURE REVIEW 47
2.4.4.1 Water/binder ratio
McCarter et al. (1981) showed that the resistivity is dependent on the material mix proportions
and the water/binder ratios of the concrete. These tests were carried out over a period of 4
months, which is an adequate period for the assessment of the long-term properties of concrete.
According to their results, low water/binder ratios had higher resistivity than those with high
water/binder ratios. The reason for this is that the degree of interconnectedness of the pores
decreases as the water/binder ratio decreases (Addis, 2008). This trend was evident regardless
of the mix type. Moreover, the resistivity of each mix increased slowly during the first 8 hours
but increased rapidly after that and up to 24 hours. However, the increase in the longer term
was minimal, with changes in resistivity no more than 0.1 kΩ-cm for each mix (McCarter et
al., 1981). The levelling off in the long-term is possibly due to continued hydration in concrete
after casting as the pore water is used up, thereby increasing the concrete electrical resistivity.
As with most concrete properties, this consequence stabilizes and levels off after 28 days. This
was confirmed by experiments carried out by several other researchers (Silva et al., 2006;
Ferreira and Jalali, 2006; McCarter et al., 1981).
2.4.4.2 Binder type
It is generally agreed that the binder type and content has substantial influence on the concrete
resistivity (Hornbostel et al., 2013; Pacheco et al., 2012). In fact, a sensitivity analysis by
Pacheco et al. (2012) showed that binder type has greater influence on concrete resistivity than
cover depth or w/b ratio (Figure 2.28). As the number of influencing parameters were changed,
the range of resistivity was greater for binder type than for both cover depth and w/b ratio.
Figure 2.28: Concrete resistivity sensitivity analysis
(Pacheco et al., 2012)
A study on concrete resistivity and binder type by Cabrera and Ghoddoussi (1994) showed that
the PC concrete resistivity had a maximum increase of 50% after a year. Conversely, when Fly
Parameter 1 2 3 4
Cement type CEM I CEM II CEM III CEM IV
w/b ratio 0.4 0.45 0.55 -
cover depth 50 10 - -

LITERATURE REVIEW 48
Ash was added to the mix, the long-term increase in concrete resistivity was seven times more
than that measured at 28 days (Cabrera and Ghoddoussi, 1994). Polder & Peelen (2002) and
Smith et al. (2004) investigated the short-term (14 days) and long-term (52 weeks)
characteristics of concrete with respect to concrete resistivity and supplementary cementitious
materials. Increasing the percentage of silica fume showed a large initial increase in resistivity
which tapered off and matched that of 100 % PC in the long-term.
In the same way, slag increased in resistivity initially and continuously increased as the
concrete matured (Smith et al., 2004). The initial increase for fly ash was less than that for slag.
However, the long-term increase in resistivity for fly ash was greater than that for both Slag
and 100 % PC (Polder and Peelen, 2002; Smith et al., 2004). While ternary mixes with different
combinations of slag, silica fume and fly ash had the highest resistivity, their use in practice
would be too costly (Smith et al., 2004). It is important to note that high resistivity
measurements were more prone to error due to the greater standard deviation and percentages
of error. This was attributed to moisture, temperature and the closeness of the resistivity of
measurement from the edge of the structure or specimen (Smith et al., 2004).
2.4.4.3 Specimen shape
Research by Gowers and Millard (1999) showed that the influence of concrete specimen
geometry on resistivity measurements was minimal. This was true if the thickness and height
of the specimen in question exceeded the probe spacing in the Wenner probe. This is based on
a study which showed (Figure 2.29) that for any specimen for which the geometry and probe
spacing ratio b/a exceeds two, the measured resistivity is nearly equal to the true resistivity
(Gowers and Millard, 1999).
Figure 2.29: Effect of concrete section dimensions on resistivity measurement
(Gowers and Millard, 1999)

LITERATURE REVIEW 49
Figure 2.30: Wenner probe placement for cubic specimens
(DuraCrete, 1999)
Other research has shown that cylindrical specimens of the same concrete mix result in higher
values than their cubic counterparts by up to about 30 % (Silva et al., 2006; Ferreira and Jalali,
2006). The European community uses concrete cubes for resistivity measurements, while
cylinders are used in the United States of America (USA). The cylinder allows a spherical
spread for the current flow. A spherical spread is also achieved when a cubic specimen is used,
so long as the measurement is taken away from the edge. The recommended placement of the
Wenner probe for cubic specimens is shown in Figure 2.30.
2.4.5 Challenges of site measurement of concrete resistivity
The concrete electrical resistivity test methods described above can only be used effectively if
the factors that influence concrete resistivity are taken into consideration. This allows for better
understanding, evaluation and interpretation of the results obtained from the test methods.
According to Büteführ et al. (2006) the major environmental factors influencing the electrolytic
resistivity of concrete include moisture gradients, carbonation, chloride contamination and
temperature gradients. The moisture content of the concrete in particular has been highlighted
as a major influence on the resistivity of the concrete. As an indication of the complexity of the
interdependency of these factors, it is worth noting that the moisture content is dependent on
the relative humidity of the ambient air (Osterminski et al., 2006; Weydert and Gehlen, 1999).
The presence of parameters that affect the flow of ions such as sulphates and steel
reinforcements also affect resistivity. These factors are investigated subsequently.

LITERATURE REVIEW 50
2.4.5.1 Moisture, sulphates and chlorides
Saleem et al. (1996) conducted tests to identify the effect of changes in moisture content and
concentrations of sulphates and chlorides on concrete resistivity. Once cured, specimens with
different moisture contents were dried and weighed. Thereafter, they were saturated, weighed
and measured for concrete resistivity using a Nilsson 400 soil resistance meter, similar to the
TEM. The results revealed that the electrical resistivity reduces exponentially as the moisture
content is increased (Saleem et al., 1996).
Figure 2.31: Variation of concrete electrical resistivity with moisture content and salts
(Saleem et al., 1996)
Similar results were found by Cabrera and Ghoddoussi (1994), with the resistivity decreasing
rapidly at low moisture contents (1.5 – 2.5%) but levelling off at higher moisture contents.
These trends were consistent even with increased chloride and sulphate concentrations in the
concrete specimens (Cabrera and Ghoddoussi, 1994; Saleem et al., 1996).
Similarly, as seen in Figure 2.31, when the chloride content increased the electrical resistivity
also decreased (Saleem et al., 1996; Cabrera and Ghoddoussi, 1994). This can be attributed to
the increase in chloride ions facilitating conductivity. Specimens contaminated with sulphates
and varying levels of chlorides showed a decrease in resistivity as the moisture content was
increased. Moreover, the resistivity decreased further when a higher level of sulphate was used
(Saleem et al., 1996). In the same way, specimens contaminated with chlorides and varied
levels of sulphates exhibited a decrease in resistivity with increasing chloride and sulphate
content. However, addition of sulphate at levels of chloride from 19.2 kg/m3 had little effect
on the resistivity; it remained consistently low at about 3kΩ-cm, regardless of the moisture
content (Saleem et al., 1996).
When sulphates react with the hydrated products, destruction of the hardened cement paste
occurs thereby reducing the resistivity as this allows the movement of ions (Addis, 2008). In

LITERATURE REVIEW 51
addition, sulphates stop the formation of Friedel’s salts caused by the reaction of chlorides with
aluminates. Rather the cement “prefer” to react with the sulphates so that there are more free
chlorides and hence a decrease in resistivity (Thomas et al., 2012; Luo et al., 2003).
Other researchers have shown that when specimens are exposed to wet cycle periods of 1 and
2 weeks, they have better electrical connection and therefore lower concrete resistivity values.
Conversely, when exposed to dry cycle periods, the electrical connectivity is lost and the
concrete resistivity is high (Smith et al., 2004). Therefore, the concrete electrical resistivity is
highly dependent on the moisture content. However, results from Saleem et al. (1996) show
that this is less evident when the concrete has high salt concentrations.
These results are also true when specimens are left exposed to the environment and the concrete
constituents changed. For instance, exposure environments high in sulphates and chlorides will
lead to a decrease in electrical resistivity. Moreover, concrete resistivity measured during the
rainy season is likely to be lower than in dry seasons, other conditions being constant. This is
because high pore saturation makes the flow of ions easier and consequently the resistivity is
less. An increased number of pores and a higher water cement ratio also decrease the resistivity
(Polder and Peelen, 2002).
The resistivity also decreases with increasing porosity, depending on the degree of saturation;
the higher the degree of saturation, the lower the resistivity (Cabrera and Ghoddoussi, 1994).
2.4.5.2 Temperature
Just as in most electrochemical processes, the external and internal temperatures affect the
concrete resistivity. The reason for this trend is the influence temperature has on the kinetic
energy of the ions; higher temperatures energise the ions. To this end, Ferreira and Jalali (2006)
carried out experiments where the temperature of the concrete was controlled by immersing
the concrete specimens in stabilized temperature water baths. Afterwards, the samples were
removed and the electrical resistivity was measured. The results revealed that the effect of
temperature is the same as that described for moisture, with the resistivity decreasing as the
temperature increased (Silva et al., 2006).
Another temperature evaluation experiment was conducted on covered specimen, to prevent
evaporation after casting (Manera et al., 2008). Specimens were exposed to different
temperatures for 15 days and their resistivity measured and showed the same trend. In yet
another attempt at classifying the temperature – resistivity relationship Riding et al. (2008)
modified the RCPT to a five-minute resistivity test. The resistivity was measured after 91 days
of moist curing after being placed in water at temperatures of 23, 38 and 60 ℃ to give the trend
shown in Figure 2.32.

LITERATURE REVIEW 52
Figure 2.32: Electrical resistivity as a function of temperature
(Riding et al., 2008)
A similar experiment involving temperature versus concrete electrical resistivity also showed
a linear inverse relationship between the two (Gowers and Millard, 1999). The researchers
suggest adjusting resistivity measurements not taken at ambient temperature by +1kΩ-cm per
3 ℃ fall in temperature. However, it is worth noting that these results (Gowers and Millard,
1999) are limited to temperatures between 8 and 20 ℃. Alternatively, McCarter et al. (1981)
suggested a more comprehensive method of accounting for measurements at different
temperatures by means of the Arrhenius equation:
𝜌𝑒(𝑇) = 𝜌0 ⋅ 𝑒𝐴⋅(
1
𝑇−
1
𝑇0) (2.15)
where 𝜌𝑒(𝑇) and 𝜌0 in [Ω-m] are the resistivities at ambient temperature T and measured
temperature 𝑇0 in [K] and A is the activation energy in [K].
The Arrhenius equation was proven experimentally to be an accurate presentation of the
relationship between concrete resistivity and temperature using an activation energy of 3270 K
(Osterminski et al., 2006). Prior to this, DuraCrete (1999) had also advocated for the use of the
Arrhenius equation during concrete resistivity measurements.
2.4.5.3 Steel reinforcement
The presence of steel reinforcement influences the measurement of concrete resistivity because
steel is a good electrical conductor. Therefore, when measuring the resistivity in-situ,
researchers have found that it is necessary to use a cover meter to determine the position of the
reinforcement. Thereafter, care must be taken to take the electrical resistivity measurement
away from the reinforcement when using the Wenner probe (Sengul and Gjorv, 2009). If the
reinforcement cannot be avoided, measurements must be carried out perpendicular to the
reinforcement rather than parallel to avoid the effect (Broomfield and Millard, 2002). This is

LITERATURE REVIEW 53
especially important for shallow covers, less than 30 mm (Weydert and Gehlen, 1999).
However, if the probe spacing (see Figure 2.23) is much larger than the concrete cover,
distortion of the measured concrete resistivity is inevitable. The recommended probe spacing
is at most two-thirds the cover depth (Gowers and Millard, 1999). Moreover, it is recommended
that readings be obtained at several points on the surface concrete to give a more accurate
representation of the concrete resistivity (Weydert and Gehlen, 1999; Polder, 2001; Sirieix et
al., 2003).
2.4.5.4 Chloride ingress and carbonation
A surface layer present on a concrete specimen interferes with the measured resistivity. This is
problematic especially when a Wenner probe is used due to its requirement of closeness to the
surface during measurement (Weydert and Gehlen, 1999). Gowers and Millard (1999) carried
out various studies to determine the effect of chloride ingress and carbonation on the
measurement of the concrete electrical resistivity. They concluded that a surface layer with a
low resistivity has a considerably higher impact on the true resistivity than a higher resistivity
surface layer.
For instance, chloride ingress creates a lower resistivity surface layer on concrete structures or
specimen. However, its effect on the resistivity was eliminated when the electrode contact
spacing was greater than eight times the surface layer thickness (Gowers and Millard, 1999).
Likewise, carbonation creates a surface layer on concrete. The carbonation layer interferes with
resistivity measurement such that the reading is a combination of the concrete and the
carbonation layer (Weydert and Gehlen, 1999). Unlike chloride ingress, carbonation creates a
high resistivity surface layer when the surface concrete is dry but a lower resistivity surface
layer when it is wetted. However, the consequence of wetting carbonated concrete is difficult
to predict.
Nevertheless, knowledge of the thickness and resistivity of the carbonated surface layer can be
used to limit the effect. This can be achieved by using electrode spacing greater than 8 times
the layer thickness just as with chloride ingress (Gowers and Millard, 1999). In cases where
the carbonation surface layer exceeds the cover size, the researchers recommend taking the
resistivity reading as it is. In effect, if it is thicker than the cover size, resistivity of the
carbonation layer will be the same as that of the concrete. Their results revealed that this
assumption is valid provided the electrode spacing is set no more than the carbonation layer
(Gowers and Millard, 1999).
This presents a problem in cases where the Wenner probe is used because the commercially
available version has fixed probe spacing. The carbonation effect is small enough to be ignored
after 28 days of immersion in water in the laboratory but this cannot be applied to in-situ
measurements (DuraCrete, 1999). To garner a measure of control, considerable wetting of the

LITERATURE REVIEW 54
surface of the concrete is advised when there is suspicion of layer effects. It is worth noting
that this is not a problem when a Multi Ring Electrode is the instrument of choice (Weydert
and Gehlen, 1999).
Concrete electrical resistivity is a reflection of the ionic strength of the pore solution and the
microstructure of the concrete. As seen previously, both these properties also affect concrete
durability and the corrosion rate. Therefore, electrical resistivity provides an assessment of the
concrete quality and prediction of performance. The following sections describe the procedures
for use of concrete resistivity for quality control and service life prediction.
2.4.6 Concrete electrical resistivity and quality control
The use of concrete resistivity in quality control is based on its relationship with the diffusion
coefficient. It has been shown that measurements of concrete electrical resistivity have a good
correlation with diffusion (Ferreira and Jalali, 2006; Kessler et al., 2008). In mathematical
terms the correlations is a simplification of the Nernst-Einstein equation (2.6), given a certain
type of concrete, constant moisture and temperature (Sengul and Gjorv, 2008):
𝐷 =𝑘
𝜌 (2.16)
where k is a constant; ρ is the concrete resistivity; D is the diffusion coefficient
The above simplification of the Nernst-Einstein equation shows that the product of the
diffusivity and the resistivity is a constant value ‘k’. Empirical evidence has supported this
simplification (Sengul and Gjorv, 2008; Polder, 2005; Ferreira and Jalali, 2006). For instance,
Polder (1995) carried out experiments on a number of concrete mixes in the marine
environment. These experiments revealed a correlation between the measured concrete
resistivity and the chloride diffusion coefficient. The study was undertaken for a period of 18
months and separate tests on the mixes were conducted to establish the resistivity and the
diffusion coefficient. Results showed that:
i) The diffusion coefficients for the mixes decreased in the same order as that of the
increase in resistivity.
ii) The product of the resistivity and the effective diffusion coefficient was similar across
the five mixes.
While the concrete tested initially was relatively young, subsequent testing of concrete samples
that had been submerged in the sea for 16 years revealed the same trends (Polder, 1995). This
suggests that empirical evidence agrees with Equation 2.16 and it is possible to use it for
determining the diffusion coefficient provided the electrical resistivity and the constant ‘k’ is
known.
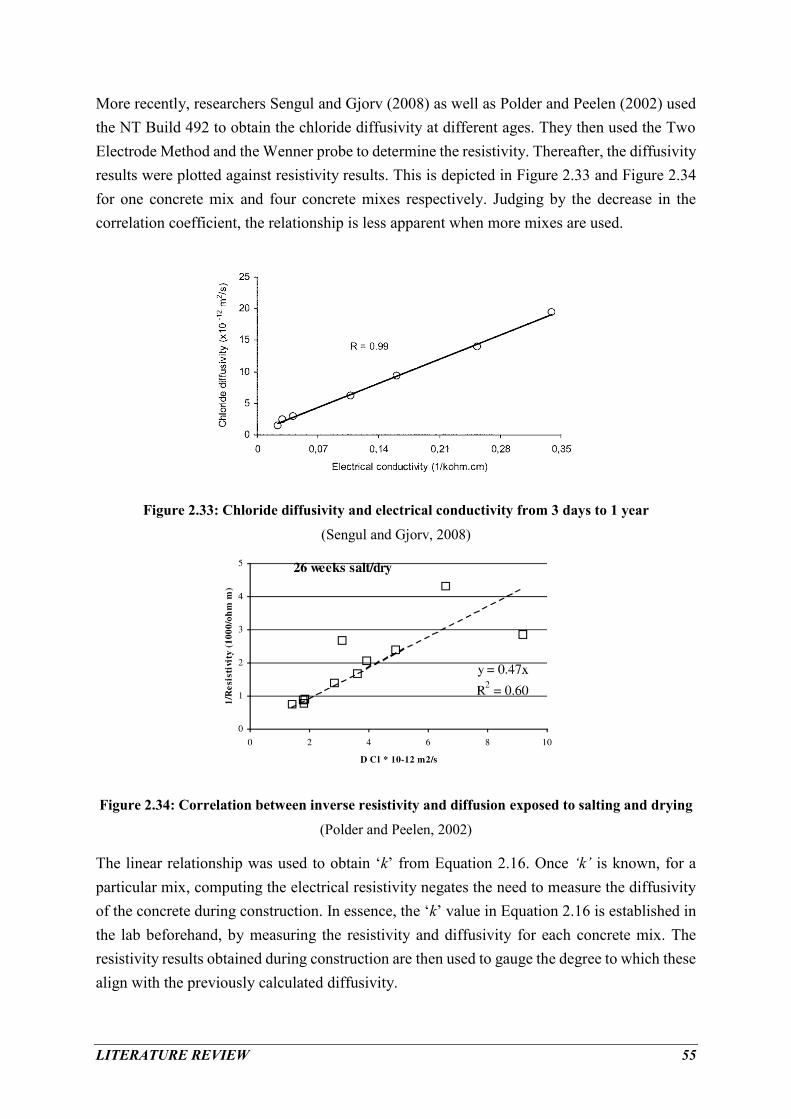
LITERATURE REVIEW 55
More recently, researchers Sengul and Gjorv (2008) as well as Polder and Peelen (2002) used
the NT Build 492 to obtain the chloride diffusivity at different ages. They then used the Two
Electrode Method and the Wenner probe to determine the resistivity. Thereafter, the diffusivity
results were plotted against resistivity results. This is depicted in Figure 2.33 and Figure 2.34
for one concrete mix and four concrete mixes respectively. Judging by the decrease in the
correlation coefficient, the relationship is less apparent when more mixes are used.
Figure 2.33: Chloride diffusivity and electrical conductivity from 3 days to 1 year
(Sengul and Gjorv, 2008)
Figure 2.34: Correlation between inverse resistivity and diffusion exposed to salting and drying
(Polder and Peelen, 2002)
The linear relationship was used to obtain ‘k’ from Equation 2.16. Once ‘k’ is known, for a
particular mix, computing the electrical resistivity negates the need to measure the diffusivity
of the concrete during construction. In essence, the ‘k’ value in Equation 2.16 is established in
the lab beforehand, by measuring the resistivity and diffusivity for each concrete mix. The
resistivity results obtained during construction are then used to gauge the degree to which these
align with the previously calculated diffusivity.

LITERATURE REVIEW 56
The research was the basis for the creation of a performance-based approach. A similar
approach was successfully implemented during the Great Heart Tunnel project. Specimen
results for TEM concrete resistivity during the construction phase (28-day testing) showed
good correlation with validation results using rapid chloride migration tests conducted one to
three years later (Rooij et al., 2007).
Alternatively, Silva et al. (2006) have proposed the following approach. They suggest the use
of early age (3-day and 7-day) concrete resistivity to predict 28-day concrete resistivity, thereby
linking resistivity to long-term durability. Their research showed that values for the electrical
resistivity measured after two months matched well with predicted values. The predicted values
were obtained using a hyperbolic equation converted to a straight-line equation (2.17).
𝑡
𝜌= 𝑎 ⋅ 𝑡 + 𝑏 (2.17)
where t is the time in days; 𝜌 is the resistivity and a and b are constants.
A graph of t/ρ versus time (t) is plotted to obtain the constants a and b. The 7-day data curve
was closer to the predicted curve than the 3-day data curve. However, before the predictions
are considered valid, the researchers recommend establishing whether the concrete mix in
question has a good correlation with the electrical resistivity. A possible method of conducting
this test is by using the procedures described above of plotting resistivity and diffusivity values
to obtain ‘k’.
2.4.7 Prediction of the corrosion initiation period
Andrade and Andrea (2010) have shown that electrical resistivity measurements can be used
for service life prediction by employing a series of equations. The approach they use is similar
to the South African CCT service life model in its use of the cover depth, the exposure class
and a durability test result. However, it does not include Fick’s second law of diffusion for the
estimation of the corrosion initiation period. Instead, the following procedure is followed to
come up with the equation for service life prediction.
Firstly, to take into account the long-term effect of chloride binding and the aggressiveness of
the environment, they replace the constant k in Equation 2.16 with constant factors K and r, so
that it becomes:
𝐷 =𝐾
𝜌.𝑟 (2.18 )
where K is a measure of the severity of exposure to the environment; reaction factor r is
dependent on the chloride binding capabilities of the cement; ρ is the concrete resistivity; D is
the diffusion coefficient

LITERATURE REVIEW 57
Experiments on real structures in environments similar with the exposure classification of the
Eurocode and the Spanish multi-regime test were used to establish K and r respectively. The
multi-regime test method makes use of a version of a migration cell with an anolyte and a
catholyte as seen in the RCPT (see Section 2.2.7.2). The value of r is the ratio between steady
state and non-steady test diffusion coefficients, which can both be calculated from the multi-
regime test. The reaction factor also represents the retardation of the chloride profile through
the concrete caused by chloride binding.
Both factors K and r can be obtained from studies conducted by Andrade and Andrea (2010)
which negates their calculation for every concrete mix or cement. The values for these factors
are listed in Table 2.10 and Table 2.11. However, it is worth noting that Table 2.10 are
preliminary values and studies are ongoing to establish the most appropriate values for a wider
range of cements (Andrade et al., 2014).
Table 2.10: Recommended values for reaction factors
Table 2.11: K values for marine exposure classifications
(Andrade and Andrea, 2010)
Exposure class K XS1 (d > 500m distance to the coastline) 5000 XS1 (d < 500m distance to the coastline) 10000
XS2 17000 XS3 25000
Resistivity changes with age due to continued hydration of the concrete. This necessitated the
inclusion of the aging factor q in the 28-day resistivity result 𝜌0 as shown in Equation 2.19.
The factor q is also dependent on the cement type and can be determined by plotting the inverse
of electrical resistivity with the log of time in days. The value of q is the slope of the resulting
curve.
𝜌𝑡 = 𝜌0 (𝑡
𝑡0)
𝑞 (2.19 )
where t is the period for which the aging factor is calculated and to is the time at first
measurement of the resistivity 𝜌0, q is the aging factor
Note that the time-dependent resistivity equation is the inverse of the time-dependent diffusion
coefficient (see Equation 2.5) since resistivity increases with time.
Based on Andrade and Andrea (2010) Based on Andrade et al. (2014) Cement r Cement r CEM I (42.5 R) 1.9 CEM I (42.5R) 1.5 - 2
CEM I + silica fume 1.5 CEM II + Pozzolans + silica fume 1.5 - 4 CEM IIA 3 CEM IIA and III 3 - 5

LITERATURE REVIEW 58
To determine the diffusion coefficient with a position in time, Einstein’s equation for Brownian
motion is used (Equation 2.20).
𝑥 = √𝐷𝑇 (2.20 )
where x is the cover depth [cm] and T is the diffusion period [years].
Combining Equations 2.18 – 2.20 yields the following equation for the corrosion initiation
period:
𝑇 =𝑥2⋅𝜌0(
𝑡
𝑡0)
𝑞
𝐾⋅ 𝑟 (2.21 )
In summary, the following are required to predict the time to corrosion initiation of a concrete
specimen:
The surface resistivity result after 28 days of moist curing
exposure class (K)
service life (T), cover (x)
binder type (r)
aging factor (q)
2.4.8 Concrete resistivity and diffusion coefficients
There are two approaches for the calculation of diffusion coefficients based on concrete
resistivity. The first approach to calculate the diffusion coefficient using resistivity is based on
Archie’s law (Archie, 1942) shown in Equation 2.22.
𝐹 =𝐷
𝐷𝑜=
𝜌0
𝜌= 𝜑−𝑐 ( 2.22 )
where F is the formation factor (or diffusibility – see Equation 2.7); 𝜑 is the porosity limited
to between 0.05 – 0.40; c is a constant characteristic of the type of porous medium; 𝜌0 is the
effective resistivity of the saturated medium and 𝜌 is the resistivity of the pore solution; D is
the diffusion coefficient of the saturated medium; Do is the diffusion coefficient of the pore
solution
The approach was derived from the oil industry where it has been validated and is used in
geology (McDuff and Ellis, 1979). The principles and values for the constants are well known
when applied to rocks but different values for the factors had to be determined for concrete.
Tumidajski et al. (1996) found that the equation was valid for cementitious systems provided
they were well hydrated. When the porosity 𝜑 and constant (c) are known then the diffusion
coefficient of the saturated concrete can be determined. The use of this approach requires prior

LITERATURE REVIEW 59
knowledge of c and 𝜑. However, it has been found that values for c and 𝜑 vary widely between
different concrete types (Tumidajski et al., 1996; Oh and Jang, 2004; Nokken and Hooton,
2007). This means that in addition to obtaining the resistivity and diffusion coefficient of the
pore solution, values for c and 𝜑 have to be found for each concrete type.
The second approach that can be used to calculate the diffusion coefficient using resistivity is
similar to the one above. Although it also makes use of the diffusibility equation (2.7) as shown
in Equation 2.23, less parameters are needed to establish the diffusion coefficient as explained
below.
𝐷𝜌 = 𝐷0
𝜎0×
1
𝜌=
𝐵
𝜌 ( 2.23 )
where Dρ is the effective chloride diffusion coefficient; Do is the free diffusion coefficient of
the chlorides in the pore solution and 𝜎0 is the conductivity of the pore solution; 𝜌 is the
electrical resistivity of the water saturated material.
Baroghel-Bouny et al. (2009) argue that the diffusion coefficient for chloride ions and
conductivity of the concrete pore solution are constants dependent on the ionic concentration
of the pore solution. The former can be found in chemistry textbooks while the latter is the
subject of studies by various authors such as Rajabipour and Weiss (2006) who created a
contraption for this purpose. Snyder et al. (2003) introduced the electrochemical equation
summing up products of the valence, concentration and conductivity of each ionic species to
get 𝜎0. Alternatively, the pore solution expression method can also be used which requires the
squeezing out of the concrete pore solution and using chemistry analysis to determine its
conductivity. More details on this and other methods can be found in a study by Buckley et al.
(2007).
Alkaline solutions comparable to cementitious materials were found to have pore conductivity
of 11.87 (Ω-1 m-1). A value of 2.03 (10-9) m2/s was selected for the diffusion coefficient of
chlorides ions in a 1M solution at 25 °C, as reported by Lide (2005). The value for pore solution
conductivity is based on studies by Rajabipour and Weiss (2006) who used the Snyder et al.
(2003) method to obtain the conductivity. It is worth noting that researchers have also shown
that addition of slag and fly ash does not affect the pore solution conductivity (Nokken and
Hooton, 2007). From these values, Baroghel-Bouny et al. (2009) established the following
equation for the determination of an effective diffusion coefficient using resistivity
measurements for blended cement concrete:
𝐷𝜌 = 171
𝜌 ( 2.24 )
where 𝐷𝜌 is the effective chloride diffusion coefficient in the porous material in 10-12 m2/s,
when 𝜌 is the electrical resistivity of the water saturated material in Ω-m

LITERATURE REVIEW 60
Note the similarity between Equation 2.16 and Equation 2.24.
The pore solution conductivity for plain PC or CEM I concrete is highly dependent on the w/c
ratio and so the constant was found quite different from other binder types. Consequently,
Baroghel-Bouny et al. (2009) proposed the following categories for CEM I concretes:
For w/c = 0.45 – 0.55:
𝐷𝜌 = 207
𝜌 ( 2.25 )
For w/c = 0.60 – 0.70:
𝐷𝜌 = 303
𝜌 ( 2.26 )
For w/c ≥ 0.80:
𝐷𝜌 = 406
𝜌 ( 2.27 )
In the first category, the pore solution conductivity was equal to 9.8 (Ω-1 m-1), second category
6.7 (Ω-1 m-1) and the third category 5.0 (Ω-1 m-1). Baroghel-Bouny et al. (2009) found that
diffusion coefficients based on these equations were linked with diffusion coefficients
calculated from non-steady state migration tests by the porosity.
𝐷𝜌 = 𝜑𝐷𝑛𝑠𝑠 ( 2.28 )
where 𝐷𝜌 is the effective chloride diffusion coefficient in 10-12 m2/s; 𝜑 is the porosity of the
concrete; 𝐷𝑛𝑠𝑠 diffusion coefficients calculated from non-steady state migration tests
2.5 SUMMARY OF LITERATURE REVIEW
A number of durability tests currently exist for the determination of the rate at which chloride
ions are transported through concrete. These are normally diffusion-based because this is the
primary method for the transportation of chloride ions through concrete. Some of the tests are
long-term such as the pure diffusion 90-day salt ponding test that allows the chloride ions to
diffuse naturally through the concrete. Quicker tests are necessary to lessen the waiting period
before owners and designers are informed of the quality of the concrete to be used for
construction.
For this reason, other tests incorporate migration or the application of an electric field to speed
up the movement of chloride ions, which drastically reduces the testing period. Migration test
results are usually related to diffusion using relationships such as the Nernst-Einstein equation
or the diffusibility equation. The equations also have test parameters such as voltage or current
as input parameters and the diffusion coefficient as the output. The diffusion coefficient is then

LITERATURE REVIEW 61
used as an input parameter in Fick’s 2nd law of diffusion during the service life design process.
Alternatively, it can be used as a quality control parameter during construction.
The most commonly used short-term chloride diffusion test is the rapid chloride penetrability
test (RCPT), a migration test that takes 6 hours. However, its theoretical basis and relationship
with chloride diffusion continues to be disputed. In addition, the high voltage applied during
testing has been shown to cause damage to the concrete microstructure. Moreover, the RCPT
is not suitable for high performance concrete. In DuraCrete, the rapid chloride migration test
is used which gives results within 6 to 96 hours but requires a complex setup.
An alternative to the RCPT is the chloride conductivity test (CCT), which is part of the South
African Durability Index approach. With the application of an electric field through the
concrete, the CCT can be conducted rapidly (up to 20 samples per hour) to characterise the
quality of concrete. It also has a good correlation with long-term diffusion tests. In addition,
testing in multiple labs revealed good reproducibility and repeatability. Even though a lower
voltage than that of the RCPT is used, research has shown that concrete samples may suffer
microstructural damage during the pre-conditioning process that involves oven heating. The
CCT is used for quality control during construction and for corrosion initiation prediction
during the design process. The CCT service life prediction (SLP) model is based on Fick’s
second law of diffusion with a time-dependent diffusion coefficient requiring input of the 28-
day CCT result.
Another test that has recently been gaining prominence in durability design and quality control
of reinforced concrete is the surface concrete resistivity test. Resistivity is a measure of the
ability of concrete to resist penetration of deleterious species such as chloride ions. There are
a number of test methods used to measure surface resistivity in concrete. Most of them can be
conducted within minutes as they usually involve the application of an electric field to a
concrete specimen. The two-electrode method and the four-point Wenner array probe are the
most user-friendly, the easiest to use and quickest there is.
One limitation with measuring concrete resistivity either on site or in the laboratory is the
variation in results with changes in testing conditions. Some of these changes include
temperature, presence of steel reinforcement, surface layers, salts and moisture. However, if
the influence of the changes on the surface concrete resistivity is known, the correct resistivity
can be determined using equations that account for these influences (Gowers and Millard,
1999; Sirieix et al., 2003).
Surface concrete resistivity is used as an input parameter for service life design of RC structures
as well as to obtain the diffusion coefficient and for quality control purposes during
construction. Resistivity results are used for construction quality control in two ways. Either

LITERATURE REVIEW 62
resistivity is related to chloride ion penetrability as is done with RCPT results, or researchers
use its inverse proportionality with the chloride diffusion coefficient. The 28-day resistivity is
used as in input variable to predict the corrosion initiation period based on a model by Andrade.
The resistivity diffusion coefficient is obtained from equations by Baroghel-Bouny et al.
(2009), also based on its inverse proportionality with resistivity. The equations depend on
binder type and water binder ratio.
With the implementation of surface concrete resistivity test standards in Europe (Rooij et al.,
2007) and North America (Kessler et al., 2008) for quality control and service life prediction,
surface concrete resistivity is worth investigating. The literature review did not reveal any
attempts to compare the surface concrete resistivity with the CCT, as is the focus of this study.
From the literature review, it can be deduced that the CCT and surface concrete resistivity can
be compared as follows:
Using SLP models for prediction of corrosion initiation periods and diffusion
coefficients.
These will be explored further in the chapter that follows.

METHODOLOGY
63
3 METHODOLOGY OF RESEARCH
3.1 Introduction
The purpose of this chapter is to describe the methodology used in this study to compare surface
concrete resistivity and the CCT. Background research was carried out in the previous chapter
in the form of a literature review as a guide to the study. Scientific method was used in this
study to compare the CCT and surface concrete resistivity and ascertain a relationship between
the two as summarized in Figure 3.1.
Figure 3.1: Summary of the research methodology
This chapter describes Otieno’s (2014) test results, service life prediction (SLP) models and
the statistical tests used in the next chapter to compare CCT and surface concrete resistivity.
Results for both CCT and surface concrete resistivity were available from an on-going study
RESEARCH AIMS
The aim of this research is to investigate the relationship between the surface concrete
resistivity and chloride conductivity tests and their use in service life prediction
BACKGROUND RESEARCH AND SOURCE OF DATA
A literature review was conducted to gain a thorough understanding on how to compare and
contrast the CC and resistivity. Data consisting of CC and resistivity results – Table 3.1, from
measurements of concrete samples in a previous study by Otieno (2014) was used.
PROCEDURE
The following four models were used to compare and contrast the CC and resistivity
Model by: Input Output
1 Mackechnie
(1996)
28-day CC - Corrosion initiation periods
- Diffusion coefficients
2 Andrade (2004) 80-day surface concrete resistivity - Corrosion initiation periods
3 Baroghel-Bouny
et al. (2009)
Surface concrete resistivity every two
weeks from 80 days to 526 days
- Diffusion coefficients
EXPECTED OUTCOME
- A better understanding of surface concrete resistivity and its use in service life prediction
- An equation linking surface concrete resistivity and CC

METHODOLOGY
64
being carried out by Otieno (2014). For resistivity, models by Andrade (2004) and Baroghel-
Bouny et al. (2009) were used to calculate the corrosion initiation period and diffusion
coefficient respectively. For CCT, the service life prediction (SLP) model by Mackechnie was
used.
3.2 Data used in the study
The data used in this study is from a project conducted by Otieno (2014) on the effect of cover
depth, concrete quality and crack width on corrosion rate. It involved exposing reinforced
concrete (RC) beam specimens (120 x 130 x 375 mm) to both field and laboratory
environments. Measurements included corrosion rate, half-cell potential surface resistivity and
concrete quality following the South African Durability Index tests. In this study, only the CCT
and resistivity test results from uncracked specimens will be used, as the focus is to compare
and contrast the two. Otieno’s (2014) project investigated five concrete mixes as illustrated in
Table 3.1.
Table 3.1: Concrete mixes for Otieno's study
Binder composition 100 % PC 50/50 PC/GGBS 70/30 PC/FA
w/b ratio 0.40 0.40 0.55 0.40 0.55
Material(kg/m3) Mix label PC-40 SL-40 SL-55 FA-40 FA-55
PC (CEM I 42.5N) 500 231 168 324 236
GGBS - 231 168 - -
FA - - - 139 101
Fine aggregate: Klipheuwel sand (2
mm max.) 529 749 855 749 855
Coarse aggregate: Granite
(13 mm max.) 960 1040 1040 1040 1040
Water 200 185 185 185 185
Superplasticizer (SP) (litres/m3) 2.1a (0.4) b 1.8 (0.4) 0.3 (0.1) 0.4 (0.1) -
28-day compressive strength (MPa) 58 (3.0) 48 (2.0) 35 (0.9) 51 (0.9) 29 (1.9)
a: Percentage of SP by mass of total binder
b: Standard deviation
The mix design for the project consisted of three binder types GGBS, FA and PC with a high
(0.55) and low (0.40) w/b ratio. Otieno (2014) accounted for other factors such as the exposure
conditions by conducting the resistivity measurements in varied environments i.e. field and
laboratory (Figure 3.2). Field specimens were placed along the Cape Town harbour two weeks
before the first measurement, which was conducted 80 days after casting. Laboratory
specimens were kept at a constant temperature of 25 °C. They were also exposed to three-day

METHODOLOGY
65
cyclic wetting with 5% NaCl solution to induce accelerated corrosion. This was followed by
four days of air-drying.
The four-point Wenner probe was used to measure surface resistivity at a probe spacing of 50
mm. Surface concrete resistivity measurements for both field and laboratory environments
were carried out every two weeks for 1.7 years. The CCTs were carried out at 28 and 90 days.
The results from the tests were used as input parameters for the comparison of CCT and surface
concrete resistivity as described in the sections that follow.
3.3 Procedures and models used for data analysis
3.3.1 Prediction of corrosion initiation period using CCT
The 28-day CCT is used in a service life prediction model (SLP) for the determination of the
corrosion initiation period. The CCT SLP model entails using Equation 3.1 or Crank’s solution
to Fick’s second law of diffusion, shown below.
𝑡 = 𝑥2
4𝐷[𝑒𝑟𝑓−1(1− 𝐶𝑥𝐶𝑠
)]2 ( 3.1 )
where t is the corrosion initiation period [years]; x is the cover depth [cm]; D is the diffusion
coefficient [cm2/year]; Cs refers to the surface chloride concentration [%]; Cx refers to the
chloride concentration at the cover depth [%], erf-1 is the inverse error function
In calculation of the corrosion initiation period, the chloride concentration at the cover depth
is the chloride threshold level. The chloride threshold level at the cover depth is taken as 0.4%
in the CCT SLP model (Mackechnie, 2001). The other values required for Equation 3.1 were
obtained as follows.
Figure 3.2: Laboratory and field concrete specimens from Otieno's study
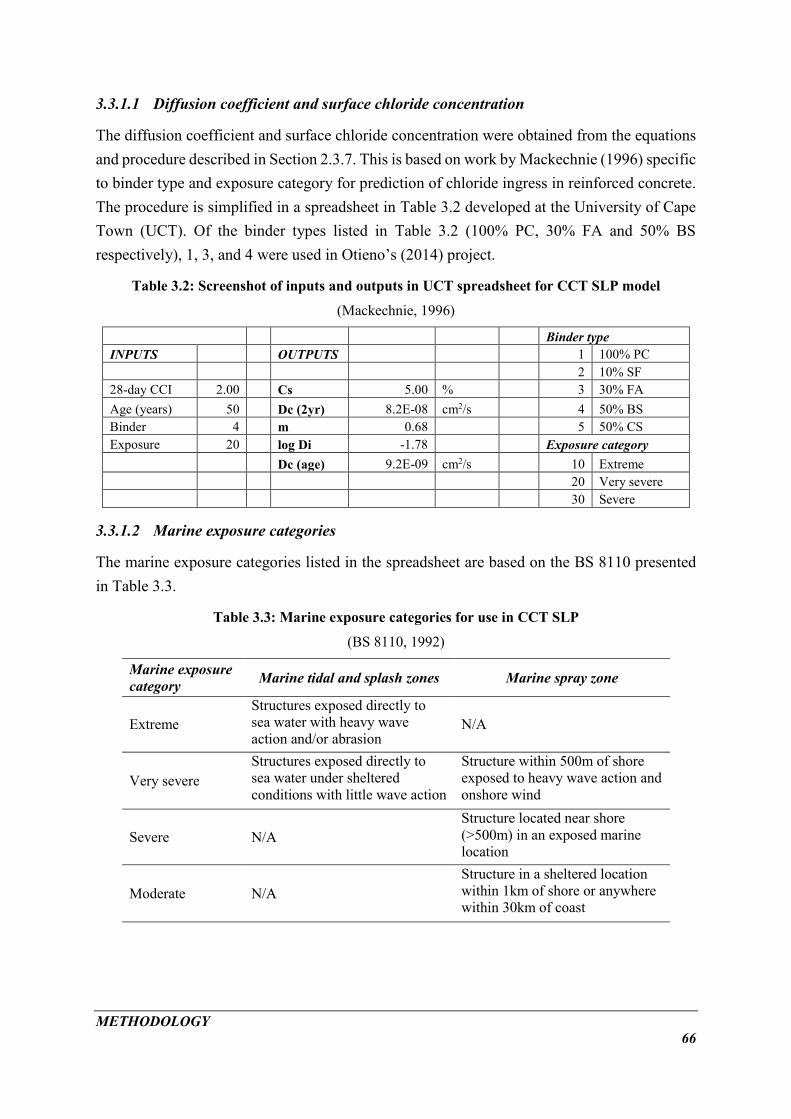
METHODOLOGY
66
3.3.1.1 Diffusion coefficient and surface chloride concentration
The diffusion coefficient and surface chloride concentration were obtained from the equations
and procedure described in Section 2.3.7. This is based on work by Mackechnie (1996) specific
to binder type and exposure category for prediction of chloride ingress in reinforced concrete.
The procedure is simplified in a spreadsheet in Table 3.2 developed at the University of Cape
Town (UCT). Of the binder types listed in Table 3.2 (100% PC, 30% FA and 50% BS
respectively), 1, 3, and 4 were used in Otieno’s (2014) project.
Table 3.2: Screenshot of inputs and outputs in UCT spreadsheet for CCT SLP model
(Mackechnie, 1996)
Binder type
INPUTS OUTPUTS 1 100% PC
2 10% SF
28-day CCI 2.00 Cs 5.00 % 3 30% FA
Age (years) 50 Dc (2yr) 8.2E-08 cm2/s 4 50% BS
Binder 4 m 0.68 5 50% CS
Exposure 20 log Di -1.78 Exposure category
Dc (age) 9.2E-09 cm2/s 10 Extreme
20 Very severe
30 Severe
3.3.1.2 Marine exposure categories
The marine exposure categories listed in the spreadsheet are based on the BS 8110 presented
in Table 3.3.
Table 3.3: Marine exposure categories for use in CCT SLP
(BS 8110, 1992)
Marine exposure
category Marine tidal and splash zones Marine spray zone
Extreme
Structures exposed directly to
sea water with heavy wave
action and/or abrasion N/A
Very severe
Structures exposed directly to
sea water under sheltered
conditions with little wave action
Structure within 500m of shore
exposed to heavy wave action and
onshore wind
Severe N/A
Structure located near shore
(>500m) in an exposed marine
location
Moderate N/A
Structure in a sheltered location
within 1km of shore or anywhere
within 30km of coast

METHODOLOGY
67
3.3.1.3 Cover depth
Cover depths were obtained using the South African concrete design code SANS 10100-2
(1992). The cover depth depends on the exposure environment and the type of concrete as
shown in Table 3.4.
Table 3.4: Minimum cover for normal-density and low-density concrete
(SANS 10100-2, 1992)
Concrete
Minimum cover (mm)
Conditions of exposure
Mild Moderate Severe Very severe Extreme
Normal-density 20 30 40 50 60
Low-density 20 40 50 60 70
Normal-density concrete was used so the results and the effect of changes in cover depth
between 20 mm and 60 mm was investigated.
3.3.2 Prediction of corrosion initiation period using surface concrete resistivity
The corrosion initiation period was also calculated using Andrade’s SLP model with a surface
concrete resistivity value as an input parameter. This calculation was carried out to assess the
degree to which the model’s results (corrosion initiation period) agreed with that of the CCT
SLP model.
The surface concrete resistivity SLP model used is based on Andrade’s work. The reason for
this is that the model in question was the only one found in the literature. Although the model
includes a corrosion propagation period due to the issues discussed in Section 2.3.8, only the
corrosion initiation period was calculated. Equation 3.2 (Equation 2.21 repeated below for
convenience) was used for the calculation of the corrosion initiation period using Andrade’s
resistivity-based SLP method.
𝑇 =𝑥2⋅𝜌0(
𝑡
𝑡0)
𝑞
𝐾⋅ 𝑟 ( 3.2 )
where T is the corrosion initiation period [years]; q [-] is the aging factor; to is the time [years]
at first measurement of the resistivity; t is the time [years] of the final measurement of
resistivity 𝜌0[Ω-cm]; x is the cover depth [cm]; r is the reaction factor [-]; K is the exposure
classification factor [cm3Ω/year]
Because of the guidelines in Table 3.4, the cover depths investigated for the input parameters
were between 20 mm and 60 mm. Otieno’s (2014) first surface concrete resistivity
measurements were carried out at t0 of 80 days while the last measurement t was at 626 days.
The reaction factor (r) is a measure of the chloride binding abilities of a particular concrete.

METHODOLOGY
68
Values chosen for r were 1.5 for CEM I, 3 for the slag concretes and 3.5 for the fly ash concretes
based on Table 2.10 and a study showing that the reaction factors are higher for fly ash than
for slag concretes (Andrade et al. 2014). The values for the exposure classification and aging
factors used in Equation 3.2 are described subsequently.
3.3.2.1 Environmental classification factor (K)
Table 3.5 (Table 2.11 repeated here for convenience) lists the environmental classification
factors for the resistivity-based corrosion initiation SLP model.
Table 3.5: K values following EN 206 exposure classifications
(Andrade and Andrea, 2010)
Exposure class (EN 206) K(cm3Ω/year)
XS1 (d > 500m distance to the coastline 5000 XS1 (d < 500m distance to the coastline 10000 XS2 17000 XS3 25000
The exposure categories for CCT SLP model are based on BS 8110 whereas the exposure
classes for Andrade’s resistivity-based model are on EN206 (2002). The exposure categories
needed to reflect Cape Town marine environments where the tests were carried out for a valid
comparison between the two models. However, there was no way to determine how one
exposure classification was related to the other. Therefore, the following reasoning was used
to establish a relationship between the two.
The K values increase with the severity of the marine environment. As shown in Table 3.3, the
extreme and very severe categories are separated by “tidal and splash” zones whereas the very
severe and extreme categories are separated by “spray” zone. Studies have shown that the
former zone is prone to drying and wetting and lowers the durability more than the latter
(Ferreira, 2004). For these reasons, estimated values of K were selected to match the marine
exposure categories of the CCT SLP model as follows. XS3 has been described as being in the
tidal, splash and spray marine zones, similar to the very severe exposure category.
Consequently, the XS3 value of K from Table 3.5 is 25000 and this was taken as being
equivalent to the very severe classification. The extreme classification factor was selected
assuming a 30% increase from very severe as shown in Table 3.6.
Table 3.6: k values based on BS 8110 marine exposure categories
Marine exposure category (BS 8110) K (cm3Ω/year) Severe 17000 Very severe 25000 Extreme 32500

METHODOLOGY
69
3.3.2.2 Aging factor (q)
The aging factor for concrete resistivity is similar to the reduction factor in the CCT SLP model.
Both account for the improvement of concrete microstructure with time and link short-term
results to long-term values. The value for the resistivity-aging factor was calculated as
proposed by Andrade with t0 and t equivalent to 80 and 626 days respectively, as discussed
previously. Thereafter, the inverse values of all resistivity measurements were plotted against
the corresponding measurement age on a log-log graph (Andrade and Andrea, 2010). The
resulting exponent from the best-fit line was taken as the aging factor. The procedure is shown
in Figure 3.3, where the aging factor is the index of the equation = 0.824, was repeated for each
of the five mixes.
Figure 3.3: Example of calculation of concrete resistivity aging factor
3.3.3 Prediction of diffusion coefficients using surface concrete resistivity
As with the corrosion initiation period, the diffusion coefficient provides a means of
comparison of not only the predicted durability but also the change in concrete properties with
time. Therefore, this study compared the diffusion coefficient calculated using the CCT result
with that of the surface concrete resistivity. The diffusion coefficient for the CCT SLP model
is incorporated in the calculation of the corrosion initiation period. However, Andrade’s surface
resistivity SLP is not associated with a diffusion coefficient. Nevertheless, as was seen in the
literature review, Baroghel-Bouny et al. (2009) produced a model for calculation of the
diffusion coefficient with surface resistivity. The model is based on the diffusibility equation
and calculations involved are Equations 2.24 to 2.27 (Baroghel-Bouny et al., 2009).
y = 0.2543x-0.824
0.001
0.01
10 100 1000
1/r
esis
tiv
ity
(Ω
-m)-
1
Time (days)
SL-40

RESULTS AND DISCUSSION 70
4 RESULTS AND DISCUSSION
4.1 Introduction
In this chapter, the results from the work carried out are presented and discussed. The objectives
of this chapter were to:
i) Compare the surface concrete resistivity and CCT focussing on service life prediction
(SLP) models for corrosion initiation periods and diffusion coefficients
ii) Find a relationship between surface concrete resistivity and the CCT.
To meet these objectives, firstly, the test results for surface concrete resistivity and CCT are
presented. Secondly, the results for the corrosion initiation periods from the surface concrete
resistivity and the CCT models are compared and contrasted. Thereafter, diffusion coefficients
from the surface concrete resistivity and the CCT models are compared to identify a
relationship between the two. This includes an analysis of how their ratio changes with time.
4.2 Comparison of concrete resistivity and CCT results
Surface concrete resistivity and CCT results from a study by Otieno (2014), were compared in
terms of how they are influenced by age, binder type and w/b ratio. Surface concrete resistivity
measurements from both the field and laboratory were taken at two-week intervals, with the
first measurement occurring 80 days after casting. In comparison to resistivity, CCT
measurements were only carried out in the laboratory at 28 and 90 days after casting. The
graphs for each of the tests and exposure environments are presented in Figure 4.1, Figure 4.2
and Figure 4.3.
Figure 4.1: Influence of w/b ratio, binder type and age on resistivity for field specimens
0
20
40
60
80
100
120
140
80 130 180 230 280 330 380 430 480 530 580 630 680
Fie
ld
surf
ace
con
cret
e es
isti
vit
y
(kΩ
-cm
)
Time after casting (days)
FA-40
SL-40
SL-55
FA-55
PC-40
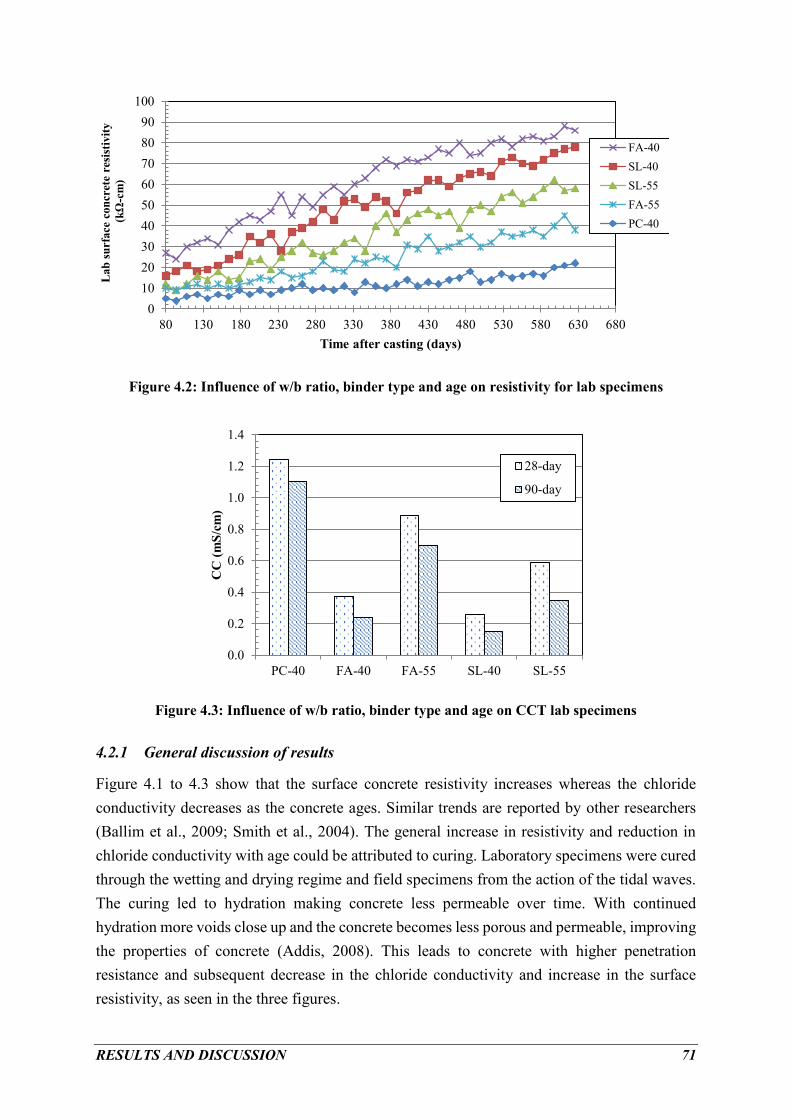
RESULTS AND DISCUSSION 71
Figure 4.2: Influence of w/b ratio, binder type and age on resistivity for lab specimens
Figure 4.3: Influence of w/b ratio, binder type and age on CCT lab specimens
4.2.1 General discussion of results
Figure 4.1 to 4.3 show that the surface concrete resistivity increases whereas the chloride
conductivity decreases as the concrete ages. Similar trends are reported by other researchers
(Ballim et al., 2009; Smith et al., 2004). The general increase in resistivity and reduction in
chloride conductivity with age could be attributed to curing. Laboratory specimens were cured
through the wetting and drying regime and field specimens from the action of the tidal waves.
The curing led to hydration making concrete less permeable over time. With continued
hydration more voids close up and the concrete becomes less porous and permeable, improving
the properties of concrete (Addis, 2008). This leads to concrete with higher penetration
resistance and subsequent decrease in the chloride conductivity and increase in the surface
resistivity, as seen in the three figures.
0
10
20
30
40
50
60
70
80
90
100
80 130 180 230 280 330 380 430 480 530 580 630 680
Lab
su
rface
con
cret
e re
sist
ivit
y
(kΩ
-cm
)
Time after casting (days)
FA-40
SL-40
SL-55
FA-55
PC-40
0.0
0.2
0.4
0.6
0.8
1.0
1.2
1.4
PC-40 FA-40 FA-55 SL-40 SL-55
CC
(m
S/c
m)
28-day
90-day

RESULTS AND DISCUSSION 72
4.2.2 The influence of exposure environment on surface concrete resistivity
Figure 4.1 shows that the rate at which the field resistivity increases is higher after 350 days.
In contrast, there is less change in the rate at which the lab resistivity increases after the same
period (Figure 4.2). Furthermore, the field resistivity values are considerably higher than the
lab resistivity (Figure 4.2). In addition, while the field resistivity evidently increases with time,
some earlier measurements were higher than later measurements. For instance, for SL-40, the
200th day and the 300th day measurements fluctuate between 30 and 62 kΩ-cm. In contrast,
the laboratory measurements only vary between 25 and 48 kΩ-cm. The lab resistivity
measurements are more consistent and almost follow a smooth curve.
The higher field resistivity results are due to two factors. Firstly, although both sets of
specimens were exposed to chlorides, the laboratory specimens were exposed to a higher
concentration of chlorides than found in seawater. Therefore, the laboratory concrete
specimens had increased chloride content in the pore solution. The higher chloride content
resulted in lower concrete resistivity readings for laboratory specimens.
Secondly, the field specimens had higher but inconsistent resistivity than laboratory specimens
due to the temperature. Laboratory specimens were kept at a fixed temperature of 25 oC while
the field specimens’ temperature fluctuated with changes in weather. The temperature where
the field specimens were placed can go as low as 7 oC and as high as 27 oC (South African
Weather Service - Cape Town, 2010). The low temperatures led to high concrete resistivity
readings while high temperatures led to low readings.
Because of the inconsistency of the field resistivity readings, the values used for the prediction
of durability in this study were the laboratory resistivity readings. Laboratory resistivity
readings are also better to compare with the CCT, which is also laboratory based.
4.2.3 The influence of binder type and w/b ratio on surface concrete resistivity and CCT
The results show that CCT is influenced by age, binder type and w/b ratio. For instance, PC-
40 had the highest chloride conductivity followed by SL-55, FA-55, SL-40 and FA-40. Low
chloride conductivity signifies good quality concrete due to its direct proportionality with
diffusivity, as seen in the simplified Nernst-Einstein equation. Therefore, from these results,
FA-40 and SL-40 had the best quality concrete, in terms of diffusivity. The reason for this is
that cement extenders such as fly ash and slag make the concrete microstructure denser (Addis,
2008).
In addition, CCT results are low at a lower w/b ratio, for the binary blends. This can be expected
as lower w/b ratios are synonymous with good quality concrete (Mehta and Monteiro, 2006;
Addis, 2008). This is due to the increased hydration and densification of the concrete and
consequent reduction in the diffusivity of the microstructure. The chloride conductivity of the

RESULTS AND DISCUSSION 73
slag concrete is lower than that of the fly ash concrete at the same w/b ratio (Figure 4.3). These
results are in line with the literature, which shows that at the same w/b ratio, slag has lower
chloride conductivity than fly ash (Ballim et al., 2009; Mackechnie, 1996).
Table 4.1 and 4.2 compare the effect of changing the w/b ratio and binder type on the chloride
conductivity of the concrete. It is evident that for blended cement concrete, changing the w/b
ratio has a greater influence on the chloride conductivity than changing the binder type.
Table 4.1: Influence of change in w/b ratio on chloride conductivity
w/b ratio (28-day chloride
conductivity in mS/cm)
Binder type 0.4 0.55 % change
GGBS 0.26 0.59 56
FA 0.37 0.89 58
Table 4.2: Influence of change in binder type on chloride conductivity
Binder type (28-day chloride
conductivity in mS/cm)
w/b ratio GGBS FA % change
0.4 0.26 0.37 30
0.55 0.59 0.89 34
The binder type and w/b ratio are also highly influential in the determination of the surface
concrete resistivity. PC-40 had the lowest surface concrete resistivity for both field and
laboratory results. FA-40 had the highest surface concrete resistivity followed by SL-40, even
though FA-55 had lower resistivity than SL-55. This indicated that at low w/b ratio, addition
of fly ash led to much less interconnectedness of the pores than addition of slag. However, at
high w/b ratio, the fly ash concrete pores are more interconnected than the slag concrete pores.
The concrete mixes with higher w/b ratios had more moisture in the pore solution and therefore
lower resistivity values.
Table 4.3 and 4.3 compare the effect of changing the w/b ratio and binder type on the surface
concrete resistivity.
Table 4.3: Influence of change in w/b ratio on surface concrete resistivity
w/b ratio (avg of 570 to 612 day
resistivity in kΩcm)
Binder type 0.4 0.55 % change
GGBS 73.3 57.8 21
FA 83.8 39.5 53

RESULTS AND DISCUSSION 74
Table 4.4: Influence of change in binder type on surface concrete resistivity
Binder type (avg of 570 to 612 day
resistivity in kΩcm) w/b ratio GGBS FA % change
0.4 73.3 83.8 13 0.55 57.8 39.5 32
It is evident that change in w/b ratio has a greater effect on the resistivity for fly ash than GGBS
concrete. Moreover, changing the binder type is more effective in influencing the resistivity at
high than low w/b ratio.
For the blended cement concrete, the following can be surmised:
w/b ratio has a greater influence on chloride conductivity than binder type
changing the w/b ratio for GGBS concrete is more effective than changing it for FA
concrete in influencing the surface concrete resistivity
changing the binder type has a greater influence on surface concrete resistivity at a high
w/b ratio than a low one
4.3 Input variables and calculations of corrosion initiation periods
The CCT SLP is an empirical model that is being used in the South African construction
industry for the prediction of chloride-induced corrosion initiation (Mackechnie, 1996).
Andrade’s (2004) surface concrete resistivity SLP model is also an empirical model but its use
is so far restricted to Europe. This section presents the input variables and equations for the
corrosion initiation period (CIP) as calculated using the resistivity model and those of the CCT
SLP model.
4.3.1 CCT model: corrosion initiation period calculations and input variables
The CCT SLP corrosion initiation period was calculated, using Excel,for each mix and
exposure category using Crank’s solution to Fick’s second law of diffusion as follows:
𝑡 = 𝑥2
4𝐷[𝑒𝑟𝑓−1(1−𝐶𝑥𝐶𝑠
)]2 ( 4.1)
where t is the corrosion initiation period [years]; x is the cover depth [cm]; D is the diffusion
coefficient [cm2/year]; Cs refers to the surface chloride concentration [%]; Cx refers to the
chloride concentration at the cover depth [%], erf-1 is the inverse error function
Values for the 28-day CCT, from Otieno’s results, were input into the equations described in
Section 2.3.7 to obtain the diffusion coefficient. These two variables are dependent on exposure
conditions and binder type. The chloride threshold level was assumed to be 0.4% for all five

RESULTS AND DISCUSSION 75
mixes and cover depths 20, 30, 40, 50 and 60 mm were used. For extreme exposure category,
the values used for input into Equation 4.1, are presented in Table 4.5.
Table 4.5: CCT SLP model: CIP (t) Input parameters - Extreme exposure
CONCRETE MIX
Variable PC-40 SL-40 SL-55 FA-40 FA-55 28-day CCI (mS/cm) 1.24 0.26 0.59 0.37 0.89 D50 (10-8 cm2/s) 0.800 0.0796 0.118 0.109 0.210 D50 (cm2/yr) 0.252 0.0251 0.0373 0.0343 0.0674 Cs (%) 3 5 5 4.5 4.5 Cx (%) 0.4 0.4 0.4 0.4 0.4
4.3.2 Surface concrete resistivity model: CIP input variables
The CIP’s for surface concrete resistivity was calculated, using Excel, from the laboratory
results for each concrete mix using the following equation:
𝑇 =𝑥2⋅𝜌0(
𝑡
𝑡0)
𝑞
𝑘⋅ 𝑟 ( 4.2)
where T is the period [years] for which the aging factor q [-] is calculated; to is the time [years]
at first measurement of the resistivity; t is the time [years] of the final measurement of
resistivity 𝜌0[Ω-cm]; x is the cover depth [cm]; r is the reaction factor [-]; k is the exposure
classification factor [cm3Ω/year]
The 80-day resistivity for laboratory specimens was used as the first measurement and 626-day
resistivity as the final measurement. The reaction factor was taken as 1.9 for PC-40, 3 for slag
and 3.5 for fly ash concrete as recommended by Andrade (see Table 2.10). Similar to the CCT
model, the CIP for surface concrete resistivity was calculated for cover depths 20, 30, 40, 50
and 60 mm. The values used for surface concrete resistivity CIP calculations, extreme exposure
type are presented in Table 4.6.
Table 4.6: Resistivity model: CIP (T) Input parameters - Extreme exposure
CONCRETE MIX
Variable PC-40 SL-40 SL-55 FA-40 FA-55
reaction factor (r) 1.5 3 3 3.5 3.5
aging factor (q) 0.689 0.824 0.909 0.635 0.81
t (yrs) at 626 days 1.715 1.715 1.715 1.715 1.715
exposure class k (cm3Ω/year) 32500 32500 32500 32500 32500
80-day lab resistivity ρ (Ω.cm) 5000 16000 12000 27000 10000
t0 (yrs) at 80 days 0.219 0.219 0.219 0.219 0.219
The aging factor (q) was the exponent in the resulting best-fit line obtained by plotting the log-
inverse of resistivity over log-time. The figures used are presented below.

RESULTS AND DISCUSSION 76
Figure 4.4: Lab surface concrete resistivity aging factors (indices)
4.4 Comparison of SLP models for corrosion initiation periods
According to Alexander et al. (2012) and Bertolini (2008) the chloride-induced corrosion
initiation period (CIP) depends on the following:
thickness and quality of concrete cover
penetration resistance of the cover zone
chloride threshold value
Although Bertolini (2008) concedes that adequate quality control during construction is also
important, corrosion initiation can still only be controlled by knowing and designing for the
CIP before construction. The chloride threshold level is taken as occurring at 0.4% for all
binder types and w/b ratios in the CCT model and is not used in Andrade’s resistivity model.
y = 0.2543x-0.824
0.001
0.01
50 500
1/r
esi
stiv
ity
(Ωm
)-1
Time (days)
SL-40y = 0.5817x-0.909
0.001
0.01
0.1
50 500
1/r
esi
stiv
ity
(Ωm
)-1
Time (days)
SL-55
y = 0.0661x-0.635
0.001
0.01
50 500
1/r
esi
stiv
ity
(Ωm
)-1
Time (days)
FA-40
y = 0.4808x-0.81
0.001
0.01
0.1
50 5001
/re
sist
ivit
y (Ω
m)-
1
Time (days)
FA-55
y = 0.4848x-0.689
0.001
0.01
0.1
50 500
1/r
esi
stiv
ity
(Ωm
)-1
Time (days)
PC-40

RESULTS AND DISCUSSION 77
For this reason, this section will compare the CCT and lab surface concrete resistivity service
life prediction (SLP) models based on the first two factors.
4.4.1 The influence of thickness and quality of concrete cover on the CIP
As can be expected, results from the two service life prediction models show that the CIP
increases with increase in cover depth for all binder types (Figure 4.5).
Figure 4.5: Influence of cover depth on CIP for extreme exposure category
0
50
100
150
200
250
300
20 30 40 50 60
Co
rro
sio
n in
itia
tio
n p
eri
od
(y
rs)
cover depth (mm)
SL-40Resistivity
CCT
0
50
100
150
200
250
20 30 40 50 60
Co
rro
sio
n in
itia
tio
n p
eri
od
(y
rs)
cover depth (mm)
SL-55ResistivityCCT
0
100
200
300
400
20 30 40 50 60
Co
rro
sio
n in
itia
tio
n p
eri
od
(yr
s)
cover depth (mm)
FA-40ResistivityCCT
0
50
100
150
200
20 30 40 50 60
Co
rro
sio
n in
itia
tio
n p
eri
od
(yr
s)
cover depth (mm)
FA-55Resistivity
CCT
0
10
20
30
40
20 30 40 50 60
Co
rro
sio
n in
itia
tio
n p
eri
od
(y
rs)
cover depth (mm)
PC-40Resistivity
CCT

RESULTS AND DISCUSSION 78
Generally, both CIP’s for the surface concrete resistivity and CCT models increase with cover
depth and predict that the larger the distance to the steel rebars the longer it will take deleterious
materials to reach them. However, it is clear that the surface concrete resistivity model
consistently gives higher corrosion initiation periods than the CCT model. Regardless of this,
the difference is also dependent on the w/b ratio and binder type. For instance, the two models
overlap for concretes PC-40 and SL-40.
The CIP curves for the two models diverge as cover depth increases for all binder types, with
an almost imperceptible difference at 20 mm cover. A cover depth of 20 mm would evidently
be inadequate irrespective of which SLP model or binder type is used because it would give a
service life of less than 50 years. The reason for this is that with a low cover, the chloride ions
take less time to reach the steel reinforcement. Even blended cement concretes with 20 mm
cover depth would have corrosion initiating at an unacceptable service life of less than 50 years.
The service lives from the two models at a cover depth of 40 mm, are shown in Figure 4.6.
Figure 4.6: Comparison of CIP for extreme exposure at 40mm cover
Figure 4.6 makes it clear that the values for the resistivity model for FA-40 and FA-55 are more
than twice as high as the CCT model. In addition, while the highest service life for the CCT
model is from the SL-40 concrete, the highest service life for the resistivity model is FA-40.
However, the service life for both models decreases with an increase in w/b ratio. Moreover,
the lowest service life after PC-40 is FA-55 for both models. Additionally, from low to high
w/b ratio, the slag concretes have a 33% and 11% difference between service lives, but for fly
ash, the service life is reduced by 53% and 51 % for the resistivity and CCT models
respectively. This is in agreement with the above suggestion that slag is less sensitive to
changes in w/b ratio than fly ash.
PC-40 SL-40 SL-55 FA-40 FA-55
Resistivity model 15 129 115 172 91
CCT model 14 104 70 81 41
0
20
40
60
80
100
120
140
160
180
Co
rro
sio
n i
nit
iati
on
per
iod
(y
ears
)
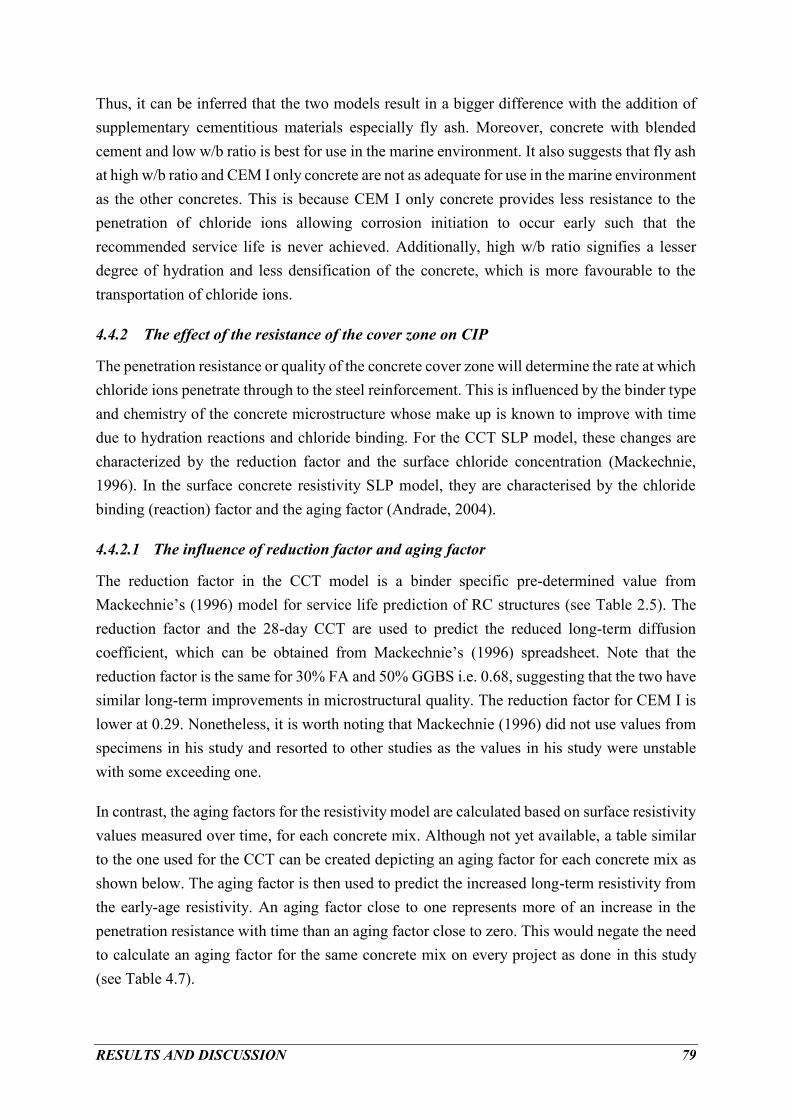
RESULTS AND DISCUSSION 79
Thus, it can be inferred that the two models result in a bigger difference with the addition of
supplementary cementitious materials especially fly ash. Moreover, concrete with blended
cement and low w/b ratio is best for use in the marine environment. It also suggests that fly ash
at high w/b ratio and CEM I only concrete are not as adequate for use in the marine environment
as the other concretes. This is because CEM I only concrete provides less resistance to the
penetration of chloride ions allowing corrosion initiation to occur early such that the
recommended service life is never achieved. Additionally, high w/b ratio signifies a lesser
degree of hydration and less densification of the concrete, which is more favourable to the
transportation of chloride ions.
4.4.2 The effect of the resistance of the cover zone on CIP
The penetration resistance or quality of the concrete cover zone will determine the rate at which
chloride ions penetrate through to the steel reinforcement. This is influenced by the binder type
and chemistry of the concrete microstructure whose make up is known to improve with time
due to hydration reactions and chloride binding. For the CCT SLP model, these changes are
characterized by the reduction factor and the surface chloride concentration (Mackechnie,
1996). In the surface concrete resistivity SLP model, they are characterised by the chloride
binding (reaction) factor and the aging factor (Andrade, 2004).
4.4.2.1 The influence of reduction factor and aging factor
The reduction factor in the CCT model is a binder specific pre-determined value from
Mackechnie’s (1996) model for service life prediction of RC structures (see Table 2.5). The
reduction factor and the 28-day CCT are used to predict the reduced long-term diffusion
coefficient, which can be obtained from Mackechnie’s (1996) spreadsheet. Note that the
reduction factor is the same for 30% FA and 50% GGBS i.e. 0.68, suggesting that the two have
similar long-term improvements in microstructural quality. The reduction factor for CEM I is
lower at 0.29. Nonetheless, it is worth noting that Mackechnie (1996) did not use values from
specimens in his study and resorted to other studies as the values in his study were unstable
with some exceeding one.
In contrast, the aging factors for the resistivity model are calculated based on surface resistivity
values measured over time, for each concrete mix. Although not yet available, a table similar
to the one used for the CCT can be created depicting an aging factor for each concrete mix as
shown below. The aging factor is then used to predict the increased long-term resistivity from
the early-age resistivity. An aging factor close to one represents more of an increase in the
penetration resistance with time than an aging factor close to zero. This would negate the need
to calculate an aging factor for the same concrete mix on every project as done in this study
(see Table 4.7).

RESULTS AND DISCUSSION 80
Table 4.7: Calculated aging factors from resistivity measurements
Concrete mix Aging factor
FA-40 0.635
PC-40 0.689
FA-55 0.810
SL-40 0.824
SL-55 0.909
The calculated values in Table 4.7 are similar with research showing that aging factors range
between 0.7 and 1.2 for concrete with supplementary cementitious materials; with aging factors
for GGBS being higher than those for fly ash (Thomas and Bamforth, 1999). The results
suggest that there is more improvement in the impenetrability of the microstructure of GGBS
than for FA and CEM I cement concretes.
4.4.2.2 The influence of surface chloride concentration and reaction factors
The surface chloride concentration depends on curing as well as binder type and content. In the
CCT, the recommended surface chloride concentration based on marine exposure
investigations and case studies are given in Table 2.7. Blended cement concrete with GGBS
(5.0%) and FA (4.5%) have higher surface chloride concentrations than binders having only
CEM I (3.0%). However, the quoted values are for the extreme exposure environments, less
severe exposure environments have lower values.
The surface chloride concentration is similar to the chloride binding (reaction) factor in the
resistivity model. The reaction factor introduces a complex variable which is chemistry as well
as time dependent and therefore specific to binder type and content. Andrade’s values for this
are 1.9 for CEM I and 1.5 for CEM I with small additions of silica fume and CEM II of 3.0
(Andrade et al., 2009; Andrade, 2004). However, since the numbers are based on the measured
reactivity and chloride binding capabilities from the Multi-regime migration test, it is difficult
to predict what numbers these would be for GGBS and FA as used in the current study.
4.5 Diffusion coefficients calculations and results
The chloride diffusion coefficient is commonly used as an input parameter in service life
prediction (SLP) models for RC structures. It represents the rate at which chloride ions are
likely to proceed through the concrete. The diffusion coefficient is usually input into SLP
models based on Crank’s solution to Fick’s second law of diffusion such as the CCT model.
Alternatively, the diffusibility equation is used as with the resistivity procedure by Baroghel-
Bouny et al. (2011). Diffusion coefficients were calculated for both the surface resistivity and
CCT SLP methods for the duration of the measurements (80 to 626 days).
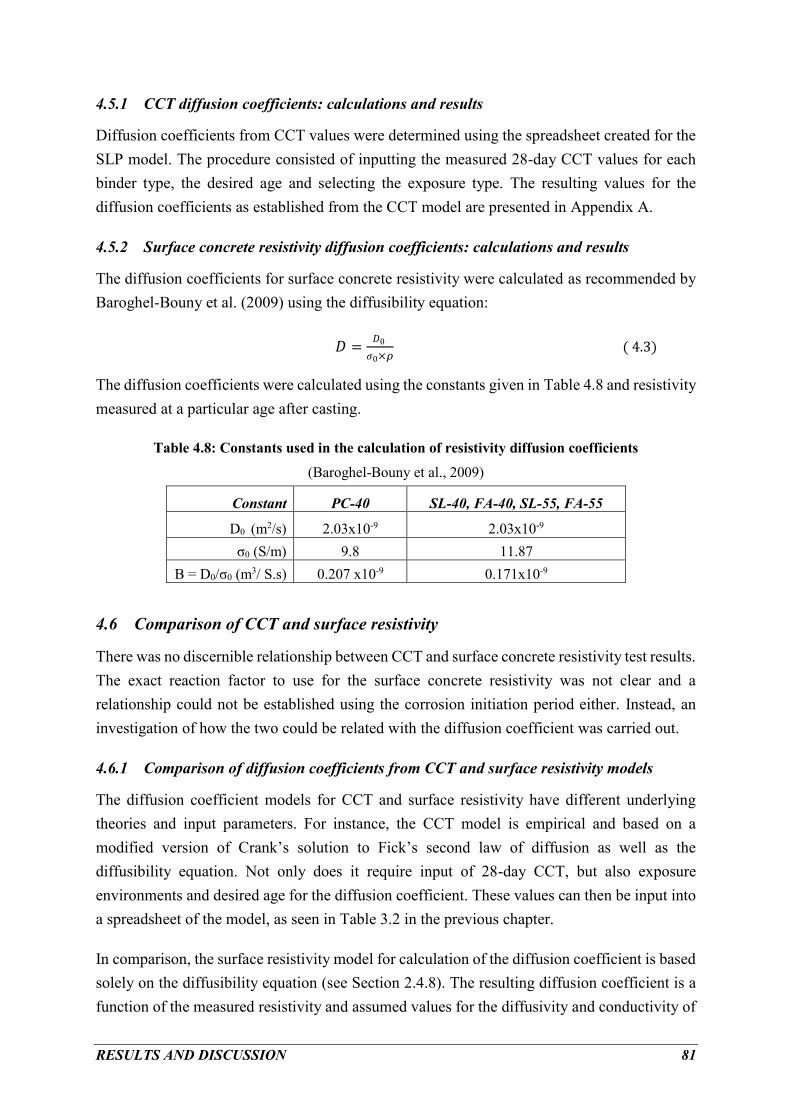
RESULTS AND DISCUSSION 81
4.5.1 CCT diffusion coefficients: calculations and results
Diffusion coefficients from CCT values were determined using the spreadsheet created for the
SLP model. The procedure consisted of inputting the measured 28-day CCT values for each
binder type, the desired age and selecting the exposure type. The resulting values for the
diffusion coefficients as established from the CCT model are presented in Appendix A.
4.5.2 Surface concrete resistivity diffusion coefficients: calculations and results
The diffusion coefficients for surface concrete resistivity were calculated as recommended by
Baroghel-Bouny et al. (2009) using the diffusibility equation:
𝐷 =𝐷0
𝜎0×𝜌 ( 4.3)
The diffusion coefficients were calculated using the constants given in Table 4.8 and resistivity
measured at a particular age after casting.
Table 4.8: Constants used in the calculation of resistivity diffusion coefficients
(Baroghel-Bouny et al., 2009)
Constant PC-40 SL-40, FA-40, SL-55, FA-55
D0 (m2/s) 2.03x10⁻⁹ 2.03x10⁻⁹
σ0 (S/m) 9.8 11.87
B = D0/σ0 (m3/ S.s) 0.207 x10⁻⁹ 0.171x10⁻⁹
4.6 Comparison of CCT and surface resistivity
There was no discernible relationship between CCT and surface concrete resistivity test results.
The exact reaction factor to use for the surface concrete resistivity was not clear and a
relationship could not be established using the corrosion initiation period either. Instead, an
investigation of how the two could be related with the diffusion coefficient was carried out.
4.6.1 Comparison of diffusion coefficients from CCT and surface resistivity models
The diffusion coefficient models for CCT and surface resistivity have different underlying
theories and input parameters. For instance, the CCT model is empirical and based on a
modified version of Crank’s solution to Fick’s second law of diffusion as well as the
diffusibility equation. Not only does it require input of 28-day CCT, but also exposure
environments and desired age for the diffusion coefficient. These values can then be input into
a spreadsheet of the model, as seen in Table 3.2 in the previous chapter.
In comparison, the surface resistivity model for calculation of the diffusion coefficient is based
solely on the diffusibility equation (see Section 2.4.8). The resulting diffusion coefficient is a
function of the measured resistivity and assumed values for the diffusivity and conductivity of
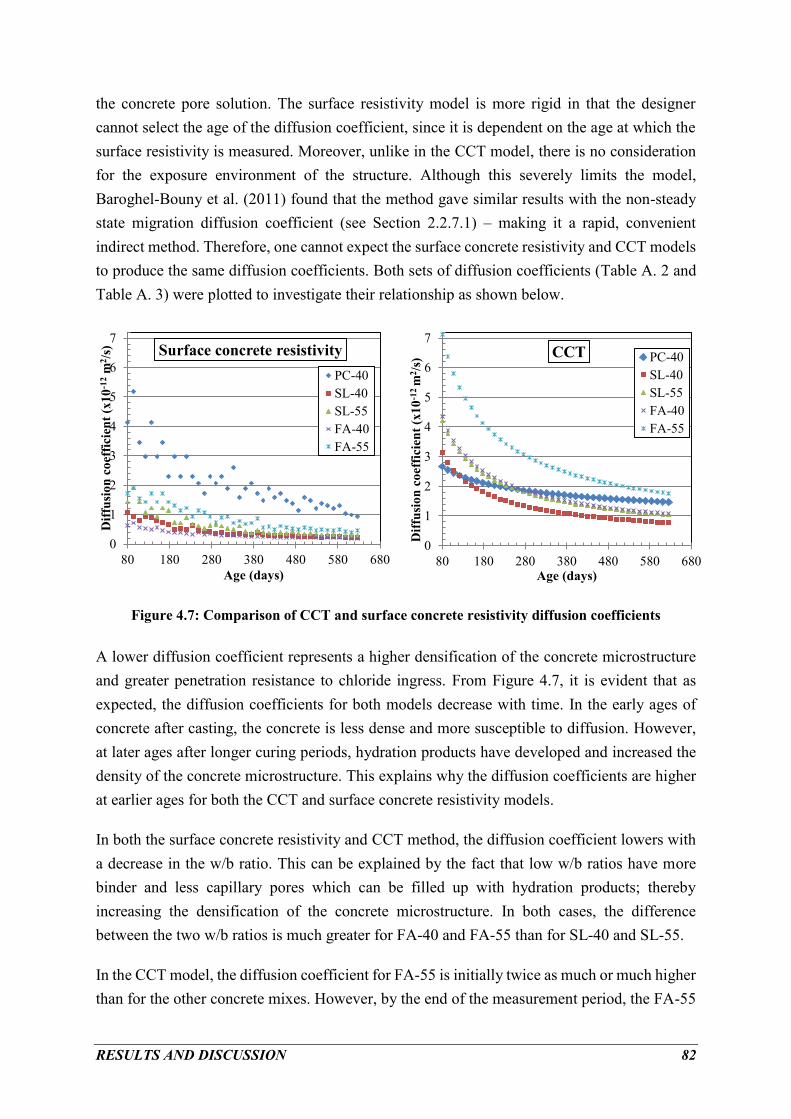
RESULTS AND DISCUSSION 82
the concrete pore solution. The surface resistivity model is more rigid in that the designer
cannot select the age of the diffusion coefficient, since it is dependent on the age at which the
surface resistivity is measured. Moreover, unlike in the CCT model, there is no consideration
for the exposure environment of the structure. Although this severely limits the model,
Baroghel-Bouny et al. (2011) found that the method gave similar results with the non-steady
state migration diffusion coefficient (see Section 2.2.7.1) – making it a rapid, convenient
indirect method. Therefore, one cannot expect the surface concrete resistivity and CCT models
to produce the same diffusion coefficients. Both sets of diffusion coefficients (Table A. 2 and
Table A. 3) were plotted to investigate their relationship as shown below.
Figure 4.7: Comparison of CCT and surface concrete resistivity diffusion coefficients
A lower diffusion coefficient represents a higher densification of the concrete microstructure
and greater penetration resistance to chloride ingress. From Figure 4.7, it is evident that as
expected, the diffusion coefficients for both models decrease with time. In the early ages of
concrete after casting, the concrete is less dense and more susceptible to diffusion. However,
at later ages after longer curing periods, hydration products have developed and increased the
density of the concrete microstructure. This explains why the diffusion coefficients are higher
at earlier ages for both the CCT and surface concrete resistivity models.
In both the surface concrete resistivity and CCT method, the diffusion coefficient lowers with
a decrease in the w/b ratio. This can be explained by the fact that low w/b ratios have more
binder and less capillary pores which can be filled up with hydration products; thereby
increasing the densification of the concrete microstructure. In both cases, the difference
between the two w/b ratios is much greater for FA-40 and FA-55 than for SL-40 and SL-55.
In the CCT model, the diffusion coefficient for FA-55 is initially twice as much or much higher
than for the other concrete mixes. However, by the end of the measurement period, the FA-55
0
1
2
3
4
5
6
7
80 180 280 380 480 580 680
Dif
fusi
on
co
effi
cien
t (x
10
-12 m
2/s
)
Age (days)
CCT PC-40
SL-40
SL-55
FA-40
FA-55
0
1
2
3
4
5
6
7
80 180 280 380 480 580 680
Dif
fusi
on
co
effi
cien
t (x
10
-12
m2/s
)
Age (days)
Surface concrete resistivity
PC-40
SL-40
SL-55
FA-40
FA-55

RESULTS AND DISCUSSION 83
diffusion coefficient has reduced drastically to within 0.8 x 10⁻¹² m2/s of the other concrete
mixes. For PC-40, initially, the diffusion coefficient is the lowest among the five concrete
mixes. Nonetheless, over time the diffusion coefficients for the other concrete mixes decrease
at a higher rate than it does and it seems even FA-55 will eventually have a lower diffusion
coefficient than PC-40. This is because as the concrete ages, the chloride binding ability of fly
ash and slag concrete in combination with the fine filler effect supersedes the PC-40
microstructural density, which is only dependent on hydration reactions to improve.
In contrast, in the surface concrete resistivity model, it is evident initially and until the end of
the measurements that the PC-40 diffusion coefficient remains higher than the other concrete
mixes. The fly ash and slag concrete have almost overlapping diffusion coefficients curves at
the end of the measurement period. This is similar to the CCT method and indicates that in the
long-term there is little difference in the densification of the microstructure between slag and
fly ash concrete. Slag and fly ash have lower diffusion coefficients than PC-40 because the
penetration resistance against chloride ingress improves with the addition of cement extenders.
4.6.2 Ratio of diffusion coefficients for CCT and surface concrete resistivity
The ratio of the two diffusion coefficients over time was plotted to investigate the relationship
between surface concrete resistivity and chloride conductivity. The results obtained are
summarised in Figure 4.8.
Figure 4.8: Effect of age on ratio of diffusion coefficients
In general, the ratio of the diffusion coefficients for CCT and resistivity (Dσ /Dρ) is constant
with time. The average values for the ratios for each mix are available in Appendix A.
0
1
2
3
4
5
6
7
8
80 130 180 230 280 330 380 430 480 530 580 630
Ra
tio
of
dif
fusi
on
co
effi
cien
ts
Age (days)
PC-40 SL-40 SL-55 FA-40 FA-55

RESULTS AND DISCUSSION 84
PC-40 has an average ratio of 0.97, suggesting that without the influence of cement extenders,
the diffusion coefficient calculated with the CCT is almost equal to that calculated with surface
resistivity. In contrast, for FA-40 the ratio Dσ /Dρ is equal to 5.84. The other three mixes SL-40,
SL-55 and FA-55 have average ratios of 3.24, 3.14 and 3.62 respectively. The diffusion
coefficient ratios for slag do not differ much with change in w/b ratio, in contrast with fly ash
whose ratio is higher at the lower w/b ratio. At a 0.55 w/b ratio, the slag and fly ash have almost
the same average value for the Dσ /Dρ of 3.14 and 3.62 respectively. However, at 0.40 w/b ratio
the average Dσ /Dρ value for the fly ash (5.84) is nearly twice as high as that for the slag (3.25).
The result suggests that the two models for calculating the diffusion coefficients are related by
a constant specific to binder type. Therefore, despite its limitations, the surface concrete
resistivity model for diffusion coefficient can be used by relating it to the CCT diffusion
coefficient.
4.6.3 Relationship between surface concrete resistivity and CCT diffusion coefficient
Surface concrete resistivity measurements were plotted against the corresponding diffusion
coefficient, calculated using the CCT SLP model to investigate a trend. Note that a similar
graph of CCT values with the diffusion coefficient from the surface concrete resistivity SLP
model could not be plotted. This is because CCT measurements were only carried out at two
ages and two points would not provide enough information to observe a trend. Plotting the
surface concrete resistivity results with the CCT SLP model diffusion coefficient revealed the
following trends.
Figure 4.9: Relationship between resistivity and CCT diffusion coefficient – All mixes
0
10
20
30
40
50
60
70
80
90
100
0 1 2 3 4 5 6 7 8
Res
isti
vit
y (
kΩ
-cm
)
Diffusion coefficient (x 10-12 m2/s)
PC-40
SL-40
SL-55
FA-40
FA-55

RESULTS AND DISCUSSION 85
Figure 4.9 shows the surface concrete resistivity and CCT diffusion coefficient relationship for
all five concrete mixes. The figure indicates that the CCT diffusion coefficient reduces with an
increase in resistivity, regardless of the binder type. This is consistent with the simplified
Nernst-Einstein equation and work by various researchers. Other researchers present the
resistivity-diffusion coefficient as the conductivity-diffusion coefficient so that a linear
relationship is observed rather than a hyperbolic curve (Sengul and Gjorv, 2008; Polder and
Peelen, 2002). The relationship is intuitive since concrete with a high penetration resistance
against chloride ingress must also have a low diffusion coefficient as they both represent an
increased density in the concrete microstructure.
The steep curve for SL-40 and FA-40 shows that surface concrete resistivity increases faster
than the decrease in chloride diffusion. In contrast, chloride diffusion decreases faster than
surface concrete resistivity increases for SL-55 and FA-55. The much higher resistivity and
lower diffusion coefficients for the FA-40 concrete mix than for the others is an indication of
its superior refinement of the pore structure. This could be caused by its low w/b ratio as well
as smaller particles, which provide the “fine filler” effect. Note that the grouping of the concrete
mix curves in Figure 4.9 is similar to that in Figure 4.8 i.e. 1) PC-40; 2) SL-40, SL-55 and FA-
55; 3) FA-40.
4.6.4 The relationship between CCT diffusion coefficient and surface concrete resistivity
The results and analysis suggest that the ratio of the resistivity and CCT diffusion coefficients
is a constant dependent on the binder type.
𝐷𝜎 𝐷𝜌⁄ = 𝑘 ( 4.4 )
where 𝐷𝜎 is the diffusion coefficient calculated from the CCT SLP model; 𝐷𝜌 is the diffusion
coefficient calculated from the resistivity model by Baroghel-Bouny et al. (2011); k is a
constant
From the diffusibility equation, 𝐷𝜌 = 𝐵
𝜌, substituting this into Equation 4.4 gives the following
equation:
𝐷𝜎 =𝐵
𝜌× 𝑘 ( 4.5 )
where B is a known constant depending on w/b ratio and binder type; ρ is the resistivity in Ω-
m; k is a constant
The values for B taken from the Baroghel-Bouny et al. (2011) equations were calculated for
blended cements and CEM I only concrete (see Table 4.8). The constant k values have been
found in this study from the ratio of diffusion coefficients. Three distinct patterns were

RESULTS AND DISCUSSION 86
observed of the ratios i.e. i) PC-40 ii) SL-40, SL-55 and FA-55 and iii) FA-40. Consequently,
the following three equations can be inferred:
For PC-40:
𝐷 =201
𝜌 ( 4.6 )
For SL-40, SL-55 and FA-55:
𝐷 =571
𝜌 ( 4.7)
For FA-40:
𝐷 =1000
𝜌 ( 4.8 )
where 𝐷 is the diffusion coefficient [10-12 m2/s] calculated from the CCT SLP model; ρ is the
resistivity in Ω-m
The equations provide a means to link surface concrete resistivity measurements to the CCT
SLP model. This implies that, resistivity measured at any age can be used to calculate the
corresponding CCT SLP model diffusion coefficient. Once the diffusion coefficient is
obtained, its value can be input into the CCT SLP model to obtain the remaining service life of
a RC structure as described in Section 2.3.7.
4.7 Summary
Surface concrete resistivity and CCT were compared in terms of test results, diffusion
coefficients and corrosion initiation periods. The results from both tests were obtained from a
study by Otieno (2014) on cracked and uncracked concrete specimens. Only the uncracked
concrete test results were used in this study. A model by Mackechnie (1996) in the form of a
spreadsheet was used to obtain the diffusion coefficient from CCT results. The diffusion
coefficient from this process was used as one of the input parameters for the determination of
the corrosion initiation period. A model by Baroghel-Bouny et al. (2009) was used to calculate
the diffusion coefficient from resistivity results. A model by Andrade (2004) was used as the
basis for the calculation of the corrosion initiation period from resistivity results. All
calculations were carried out in Excel.

CONCLUSIONS AND RECOMMENDATIONS 87
5 CONCLUSIONS AND RECOMMENDATIONS
5.1 Introduction
The motivation for this study was research showing that surface concrete resistivity is
increasingly being used as a rapid means to predict concrete durability. An investigation was
carried out on the use of surface concrete resistivity in the durability design of reinforced
concrete (RC) structures and its relationship with the chloride conductivity test (CCT).
The literature revealed two models for prediction of durability during design requiring surface
concrete resistivity as an input parameter. These were Andrade’s model for service life
prediction (SLP) and Baroghel-Bouny et al. (2009)’s model for calculation of diffusion
coefficients. The two models were compared to the SLP model requiring input of the chloride
conductivity test (CCT) results as used in the South African Durability Index. The CCT SLP
model is used to determine both the corrosion initiation period and diffusion coefficient. The
following conclusions and recommendations can be drawn from the analysis.
5.2 Comparison of test results
The surface concrete resistivity was found to be highly sensitive to exposure environment. For
the use of surface concrete resistivity results in the design of reinforced concrete structures, it
is better to measure resistivity in laboratory-controlled conditions. Laboratory-controlled
conditions will reduce the influence of changing factors in the field such as temperature,
moisture and chloride penetration on surface concrete resistivity.
For blended cement concrete, increasing the w/b ratio has a greater influence on chloride
conductivity than changing the binder type. Increasing the w/b ratio has twice the influence on
the surface concrete resistivity of fly ash concrete than slag concrete. Use of a different binder
type is more effective at high w/b ratio than low w/b ratio in influencing the surface concrete
resistivity.
5.3 Comparison of corrosion initiation periods
The CCT model and surface concrete resistivity models give similar corrosion initiation
periods for CEM I only concrete and slag concrete at 0.40 w/b ratio. For slag concrete at 0.55
w/b ratio and fly ash at 0.40 and 0.55 w/b ratio, the CCT model gives more conservative (lower)
corrosion initiation period (CIP) values than the surface concrete resistivity model. The CIP’s
for fly ash concretes were almost twice as high for surface concrete resistivity than for the CCT
model. For both the CCT and surface concrete resistivity CIP models, the use of cement
extenders and low w/b ratios greatly improved the penetration resistance and corrosion
initiation period.

CONCLUSIONS AND RECOMMENDATIONS 88
For both models, Portland cement concretes required an impractical cover depth of more than
60 mm to achieve a service life of 50 years. Consequently, Portland cement concretes can be
ruled out for use in marine environments. In both models, the use of supplementary
cementitious materials resulted in a higher increase in the CIP than using a larger cover depth.
Therefore, at high cover depth, the chemistry of the concrete cover zone is more important in
the resulting corrosion initiation period than the distance to the rebars.
5.4 Comparison of diffusion coefficients
The chloride diffusion coefficients as calculated from the surface concrete resistivity model
give lower values for blended cement concrete than the ones calculated from the CCT model.
However, the ratio of the two models’ diffusion coefficients is constant with time for each
binder type. The average ratio of the CCT and resistivity diffusion coefficients is close to one,
at 0.97, for CEM I concrete. It can be concluded that the short-term diffusion coefficients for
CEM I concrete are the same for the resistivity and CCT model. Therefore, values from one
model can be compared with values from the other model.
The diffusion coefficient from the CCT model reduces with an increase in the surface concrete
resistivity forming a hyperbolic function, which confirms the simplified Nernst-Einstein
equation. Three equations relating the two were found 1) slag at high and low w/b ratios as
well as fly ash for high w/b ratios 2) fly ash concrete at low w/b ratios 3) CEM I only concrete
The equations found can be used as a means to ascertain the CCT diffusion coefficient from a
surface concrete resistivity result. Thereafter, the CCT model can be used to obtain the service
life of a structure.
5.5 Recommendations
The surface concrete resistivity test is intuitive, easy to use and relatively cheap for the
determination of the durability of concrete. Considering the correlation that has been
found with other more established tests, it is recommended that it be used in cases where
these tests (e.g. CCT) are not feasible.
The diffusion coefficient data was limited to a period of two years. Further study is
necessary to ascertain long-term surface concrete resistivity diffusion coefficients for
use in SLP models.
The data used in this study was comprehensive but second hand and it was collected for
an entirely different purpose. Further study should be carried out specifically within
this area of study so that the recommended pre-conditioning and measuring procedure
for surface concrete resistivity can be carried out. This will provide a stronger basis for
the comparison of the CCT and surface concrete resistivity.

CONCLUSIONS AND RECOMMENDATIONS 89
Andrade’s surface concrete resistivity model for SLP can be used for the calculation of
CIP’s for CEM I only concrete and slag at low w/b ratios. These can be compared with
other RC structures with CIP’s calculated from the CCT SLP model.
REFERENCES 90
6 REFERENCES
AASHTO Standard T259, 1980. Standard Method of Test for Resistance of Concrete to Chloride Ion
Penetration. Washington D. C.: American Association of State Highway and Transportation Officials.
Addis, B., 2008. Fundamentals of concrete. Midrand: Cement & Concrete Institute, p.58.
Ahmad, S., 2003. Reinforcement corrosion in concrete structures, its monitoring and service life
prediction––a review. Cement and Concrete Composites, 25(4-5), pp.459–471.
Alexander, M.G., 2009. Durability Index Testing Procedure Manual. Cape Town.
Alexander, M.G., Ballim, Y. and Mackechnie, J.R., 1999a. Concrete durability index testing manual -
Monograph 4. Cape Town: Department of Civil Engineering, University of Cape Town, pp.1–33.
Alexander, M.G., Ballim, Y. and Stanish, K., 2008. A framework for use of durability indexes in
performance-based design and specifications for reinforced concrete structures. Materials and
Structures, 41(5), pp.921–936.
Alexander, M.G., Beushausen, H. and Otieno, M., 2012. Corrosion of steel in reinforced concrete:
Influence of binder type, water/binder ratio, cover and cracking. Monograph 9. Cape Town:
University of Cape Town.
Alexander, M.G., Santhanam, M. and Ballim, Y., 2011. Durability design and specification for
concrete structures––the way forward. International Journal of Advances in Engineering Sciences and
Applied Mathematics, 2(3), pp.95–105.
Alexander, M.G., Streicher, P.E. and Mackechnie, J.R., 1999b. Rapid chloride conductivity testing of
concrete - Monograph 3. Cape Town: Department of Civil Engineering, University of Cape Town,
pp.1–35.
Alonso, C., Andrade, C. and Gonzalez, J.A., 1988. Relation between resistivity and corrosion rate of
reinforcements in carbonated mortar made with several cement types. Cement and Concrete
Research, 18(5), pp.687–698.
Ampadu, K.O., Torii, K. and Kawamura, M., 1999. Beneficial effect of fly ash on chloride diffusivity
of hardened cement paste. Cement and Concrete Research, 29(4), pp.585–590.
Andrade, C., 1993. Calculation of chloride diffusion coefficients in concrete from ionic migration
measurements. Cement and Concrete Research, 23, pp.724–742.
Andrade, C., 2004. Calculation of initiation and propagation periods of service life of reinforcements
by using the electrical resistivity. In: International Symposium: Advances in Concrete through Science
and Engineering. Evanston: Northwestern University, pp.1–8.
Andrade, C. and Andrea, R.D., 2010. Electrical resistivity as microstructural parameter for the
modelling of service life of reinforced concrete structures. In: K. van Breguel, G. Ye and Y. Yuan,
eds., 2nd International Symposium on Service Life Design for Infrastructure. Delft: RILEM, pp.379–
388.
REFERENCES 91
Andrade, C., Andrea, R.D., Castillo, A. and Castellote, M., 2009. The Use of Electrical Resistivity as
NDT Method for the Specification of the durability of Reinforced Concrete. In: Non-Destructive
Testing in Civil Engineering. Nantes.
Andrade, C., Andrea, R.D., Rebolledo, N., 2014. Chloride ion penetration in concrete: The reaction
factor in the electrical resistivity model. Cement and Concrete Composites, 47, pp.41–46.
Angst, U., Elsener, B., Larsen, C.K. and Vennesland, Ø., 2009. Critical chloride content in reinforced
concrete — A review. Cement and Concrete Research, 39(12), pp.1122–1138.
Anon, 2010. South African Weather Service - Cape Town. [online] World Weather Information
Service. Available at: <http://www.worldweather.org/035/c00138.htm> [Accessed 10 Dec. 2013].
Archie, G., 1942. The electrical resistivity log as an aid in determining some reservoir characteristics.
Transactions of AIME Journal, 146(99), pp.54–62.
Arya, C. and Xu, Y., 1995. Effect of cement type on chloride binding and corrosion of steel in
concrete. Cement and Concrete Research, 25(4), pp.893–902.
ASTM Standard C1556, 2011. Test Method for Determining the Apparent Chloride Diffusion
Coefficient of Cementitious Mixtures by Bulk Diffusion. West Conshohocken, PA: ASTM
International.
ASTM Standard C1202, 2012. Test Method for electrical indication of concrete’s ability to resist
chloride ion penetration. West Conshohocken, PA: ASTM International.
ASTM Standard W., 2013. Test Method for Measuring the Surface Resistivity of Hardened Concrete
Using the Wenner Four-Electrode Method. West Conshohocken, PA: ASTM International.
Atkinson, A. and Nickerson, A., 1984. The diffusion of ions through water-saturated cement. Journal
of materials science, 19, pp.3068–3078.
Ballim, Y., Alexander, M.G. and Beushausen, H., 2009. Durability of concrete. In: G. Owens, ed.,
Fulton’s concrete technology, 9th ed. Midrand: Cement & Concrete Institute, pp.155–188.
Baroghel-Bouny, V., Kinomura, K., Thiery, M. and Moscardelli, S., 2011. Easy assessment of
durability indicators for service life prediction or quality control of concretes with high volumes of
supplementary cementitious materials. Cement and Concrete Composites, 33(8), pp.832–847.
Baroghel-Bouny, V., Nguyen, T.Q. and Dangla, P., 2009. Assessment & prediction of RC structure
service life by means of durability indicators & physical/chemical models. Cement and Concrete
Composites, 31, pp.522–534.
Bertolini, L., 2008. Steel corrosion and service life of reinforced concrete structures. Structure and
Infrastructure Engineering, 4(2), pp.123–137.
Bertolini, L., Lollini, F. and Redaelli, E., 2011. Comparison of resistance to chloride penetration of
different types of concrete through migration and ponding tests. In: C. Andrade and G. Mancini, eds.,
Modelling of Corroding Concrete Structures RILEM BOOKSERIES. Madrid: Springer London.
Beushausen, H. and Alexander, M.G., 2008. The South African durability index tests in an
international comparison. The South African Institution Of Civil Engineering, 50(1), pp.25–31.
REFERENCES 92
Bijen, J., 1996. Benefits of slag and fly ash. Construction and Building Materials, 10(5), pp.309–314.
Brace, W.F., Orange, A.S. and Madden, T.R., 1965. The effect of pressure on the electrical resistivity
of water-saturated crystalline rocks. Journal of Geophysical Research, 70(22), pp.5669–5678.
Broomfield, J., 2007. Corrosion of steel in concrete - Understanding, Investigation and Repair. 2nd
ed. London: Taylor & Francis Group.
Broomfield, J. and Millard, S., 2002. Measuring concrete resistivity to assess corrosion rates.
Concrete, 36(2), pp.37–39.
Buckley, L.J., Carter, M. A., Wilson, M. A. and Scantlebury, J.D., 2007. Methods of obtaining pore
solution from cement pastes and mortars for chloride analysis. Cement and Concrete Research,
37(11), pp.1544–1550.
Büteführ, M. et al., 2006. On-site investigations on concrete resistivity – a parameter of durability
calculation of reinforced concrete structures. Materials and Corrosion, 57(12), pp.932–939.
Cabrera, J. and Ghoddoussi, P., 1994. The influence of fly ash on the resistivity and rate of corrosion
of reinforced concrete. In: V. Malhotra, ed., Durability of concrete: Proceedings of the third
CANMET-ACI International Conference. Detroit, Michigan: American Concrete Institute, pp.229–
244.
Caré, S., 2008. Effect of temperature on porosity and on chloride diffusion in cement pastes.
Construction and Building Materials, 22(7), pp.1560–1573.
Castellote, M. et al., 2001. Oxygen and chloride diffusion in cement pastes as a validation of chloride
diffusion coefficients obtained by steady-state migration tests. Cement and Concrete Research, 31(4),
pp.621–625.
Castellote, M. and Andrade, C., 2009. Assessment of the behaviour of concrete in the initiation period
of chloride induced corrosion of rebars. In: M.G. Alexander, ed., Concrete Repair, Rehabilitation and
Retrofitting II. London: Taylor & Francis Group, pp.331–338.
Cerny, R. and Rovnanikova, P., 2002. Transport processes in concrete. London: Spon Press.
CHLORTEST, 2005. Guideline for Practical Use of Methods for Testing the Resistance of Concrete
to Chloride Ingress. Boras.
Cho, S.W. and Chiang, S.C., 2006. Using the chloride migration rate to predict the chloride
penetration resistance of concrete. In: M. Konsta-Gdoutos, ed., Measuring, monitoring and modeling
concrete properties. Springer Netherlands, pp.575–581.
Claisse, P., 2005. Tranport properties of concrete. Concrete International, (January), pp.43–48.
Collepardi, M., Marcialis, A. and Turriziani, R., 1972. Penetration of chloride ions into cement pastes
and concretes. Journal of the American Ceramic Society, 55(10), pp.534–535.
Crank, J., 1979. The mathematics of diffusion. Oxford university press.
DuraCrete, 1998. Modelling of Degradation. In: Probabilistic Performance based durability design of
concrete structures. The European Union - Brite EuRam III, pp.10–38.
REFERENCES 93
DuraCrete, 1999. Compliance Testing for Probabilistic Design Purposes. In: Probabilistic
Performance based durability design of concrete structures. Gouda, Netherlands: The European
Union - Brite EuRam III.
DuraCrete, 2000. General guidelines for durability design and redesign. In: Probabilistic Performance
based durability design of concrete structures. Gouda, Netherlands: The European Union - Brite
EuRam III.
FDOT, 2004. Florida Method of Test For Concrete Resistivity as an Electrical Indicator of its
Permeability. pp.1–4.
Feldman, R., Chan, G., Brousseau, R. and Tumidajski, P.J., 1994. Investigation of the rapid chloride
permeability test. ACI Materials Journal, 91(2), pp.246–255.
Feldman, R., Prudencio, L.R. and Chan, G., 1999. Rapid chloride permeability test on blended cement
and other concretes: correlations between charge, initial current and conductivity. Construction and
Building Materials, 13(3), pp.149–154.
Ferreira, R.M., 2004. Pobability-based durability analysis of concrete structures in marine
environment. PhD Thesis. University of Minho.
Ferreira, R.M. and Jalali, S., 2006. Quality control based on electrical resistivity measurements. In:
ESCS-2006 : European Symposium on Service Life and Serviceability of Concrete Structures :
proceedings. Helsinki, pp.325–332.
Garboczi, E. and Bentz, D., 1992. Computer simulation of the diffusivity of cement-based materials.
Journal of materials science, 27, pp.2083–2092.
Glass, G. and Buenfeld, N.R., 1997. The presentation of the chloride threshold level for corrosion of
steel in concrete. Corrosion Science, 39(5), pp.1001–1013.
Gowers, K.R. and Millard, S., 1999. Measurement of concrete resistivity for assessment of corrosion
severity of steel using Wenner technique. ACI Materials Journal, 96(5), pp.536–541.
Grieve, G., 2009a. Aggregates for concrete. In: G. Owens, ed., Fulton’s concrete technology, 9th ed.
Midrand: Cement & Concrete Institute, pp.25–26.
Grieve, G., 2009b. Cementitious material. In: G. Owens, ed., Fulton’s concrete technology, 9th ed.
Midrand: Cement & Concrete Institute, pp.1–14.
Heiyantuduwa, R., Beushausen, H. and Alexander, M.G., 2006. Prediction models for concrete
durability. Concrete Plant International CPI, 3, pp.80–88.
Hobbs, D.W., 2000. Aggregate influence on chloride ion diffusion into concrete. Cement and
Concrete Research, 29(1999), pp.1995–1998.
Hobbs, D.W. and Matthews, J.D., 1998. Minimum requirements for concrete to resist deterioration
due to chloride-induced corrosion. In: D.W. Hobbs, ed., Minimum requirements for durable concrete:
Carbonation- and chloride-induced corrosion, freeze-thaw attack and chemical attack. Berkshire:
British Cement Association, pp.43–89.
Hornbostel, K., Larsen, C.K. and Geiker, M.R., 2013. Relationship between concrete resistivity and
corrosion rate – a literature review. Cement and Concrete Composites.
REFERENCES 94
Icenogle, P.J. et al., 2012. Evaluation of Surface Resistivity Measurements as an Alternative to the
Rapid Chloride Permeability Test for Quality Assurance and Acceptance.
Johnson, R., Freund, J. and Miller, I., 2011. Probability and Statistics for Engineers. Boston: Prentice
Hall.
Kessler, R. et al., 2008. Surface resistivity as an indicator of concrete chloride penetration resistance.
Florida, pp.1–18.
Kropp, J. and Alexander, M.G., 2007. Transport mechanisms and reference tests. In: R. Torrent and
L.F. Luco, eds., Non-Destructive Evaluation of the Penetrability and thickness of the concrete cover
RILEM TC 189-NEC: State-of-the-Art Report. RILEM Publications SARL.
Lide, D.R. ed., 2005. CRC Handbook of Chemistry and Physics, Internet Version. Boca Raton, FL:
CRC Press, p.940.
Lindvall, A., 1998. Duracrete – probabilistic performance based durability design of concrete
structures. In: 2nd International Symposium in Civil Engineering. Budapest, pp.1–10.
Liu, Z. and Beaudoin, J.J., 2000. The Permeability of Cement Systems to Chloride Ingress and
Related Test Methods. Cement, Concrete and Aggregates, 22(1), pp.16–23.
Lu, X., 1997. Application of the Nernst-Einstein equation to concrete. Cement and Concrete
Research, 27(2), pp.293–302.
Luo, R., Cai, Y., Wang, C. and Huang, X., 2003. Study of chloride binding and diffusion in GGBS
concrete. Cement and Concrete Research, 33(1), pp.1–7.
Mackechnie, J.R., 1996. Predictions of reinforced concrete durability in the marine environment.
Ph.D. Thesis. University of Cape Town, Cape Town, South Africa.
Mackechnie, J.R., 2001. Predictions of reinforced concrete durability in the marine environment -
Monograph 1. Cape Town: Department of Civil Engineering, University of Cape Town.
Mackechnie, J.R. and Alexander, M.G., 1997a. Durability Findings from Case Studies of Marine
Concrete Structures. Cement, Concrete and Aggregates, 19(1), pp.22–25.
Mackechnie, J.R. and Alexander, M.G., 1997b. Exposure of concrete in different marine
environments. Journal of Materials in Cvil Engineering, 9(February), pp.41–44.
Mackechnie, J.R. and Alexander, M.G., 2000a. Practical considerations for rapid chloride
conductivity testing. In: C. Andrade and J. Kropp, eds., 2nd International RILEM Workshop on
Testing and modelling the chloride ingress into concrete. RILEM Publications SARL, pp.451–460.
Mackechnie, J.R. and Alexander, M.G., 2000b. Rapid chloride test comparisons. Concrete
International, 22(5), pp.40–49.
Manera, M., Vennesland, Ø. and Bertolini, L., 2008. Chloride threshold for rebar corrosion in
concrete with addition of silica fume. Corrosion Science, 50(2), pp.554–560.
Mangat, P.S. and Molloy, B.T., 1994. Prediction of long term chloride concentration in concrete.
Materials and Structures, 27(6), pp.338–346.

REFERENCES 95
Marchand, J. and Samson, E., 2009. Predicting the service-life of concrete structures – Limitations of
simplified models. Cement and Concrete Composites, 31(8), pp.515–521.
McCarter, W.J., Ezirim, H. and Emerson, M., 1992. Absorption of water and chloride into concrete.
Magazine of Concrete Research, 44(158), pp.31–37.
McCarter, W.J., Forde, M.C. and Whittington, H.W., 1981. Resistivity characteristics of concrete.
Proceedings of the Institution of Civil Engineers, 71(2), pp.107–117.
McDuff, R.E. and Ellis, R.A., 1979. Determining diffusion coefficients in marine sediments: A
laboratory study of the validity of resistivity techniques. American Journal of Science, 279(Jun),
pp.666–675.
Mehta, P. and Monteiro, P., 2006. Concrete. 3rd ed. McGraw Hill.
Montgomery, D.C. and Runger, G.C., 2003. Applied Statistics and Probability for Engineers Third
Edition. 3rd ed. New York: John Wiley & Sons, Inc.
Morris, W., Moreno, E. and Sagues, A., 1996. Practical evaluation of resistivity of concrete in test
cylinders using a wenner array probe. Cement and Concrete Research, 26(12), pp.1779–1787.
Morris, W., Vico, A., Vazquez, M. and de Sanchez, S., 2002. Corrosion of reinforcing steel evaluated
by means of concrete resistivity measurements. Corrosion Science, 44(1), pp.81–99.
Muigai, R., 2008. Probabilistic modelling for durability design of reinforced concrete structures.
Masters Thesis. University of Cape Town, Cape Town, South Africa.
Muigai, R., Moyo, P. and Alexander, M.G., 2012. Durability design of reinforced concrete structures:
a comparison of the use of durability indexes in the deemed-to-satisfy approach and the full-
probabilistic approach. Materials and Structures, 45(8), pp.1233–1244.
Ngala, V. and Page, C., 1997. Effects of Carbonation on pore structure and Diffusional properties of
hydrated cement pastes. Cement and Concrete Research, 27(7), pp.995–1007.
Nokken, M.R., Boddy, A., Hooton, R.D. and Thomas, M.D.A., 2006. Time dependent diffusion in
concrete—three laboratory studies. Cement and Concrete Research, 36(1), pp.200–207.
Nokken, M.R., Boddy, A., Wu, X. and Hooton, R.D., 2008. Effects of Temperature, Chemical, and
Mineral Admixtures on the electrical conductivity of concrete. Journal of ASTM International, 5(5),
pp.1–9.
Nokken, M.R. and Hooton, R.D., 2007. Using pore parameters to estimate permeability or
conductivity of concrete. Materials and Structures, 41(1), pp.1–16.
NT Build 443, N., 1995. Hardened concrete accelerated chloride penetraton test method.
NT Build 492, N., 1999. Concrete, Mortar and Cement-based repair materials: Chloride Migration
Coefficient from Non-Steady-State Migration Experiments.
Oh, B.H. and Jang, S.Y., 2004. Prediction of diffusivity of concrete based on simple analytic
equations. Cement and Concrete Research, 34(3), pp.463–480.
REFERENCES 96
Oh, B.H., Jang, S.Y. and Shin, Y.S., 2003. Experimental investigation of the threshold chloride
concentration for corrosion initiation in reinforced concrete structures. Magazine of Concrete
Research, 55(2), pp.117–124.
Osterminski, K., Schießl, P., Volkwein, a. and Mayer, T.F., 2006. Modelling reinforcement corrosion
– usability of a factorial approach for modelling resistivity of concrete. Materials and Corrosion,
57(12), pp.926–931.
Otieno, M., 2014. The development of empirical chloride-induced corrosion rate prediction models
for cracked and uncracked steel reinforced concrete structures in the marine tidal zone. Unpublished
PhD Thesis. University of Cape Town, Cape Town, South Africa.
Otieno, M., Beushausen, H. and Alexander, M.G., 2011a. Modelling corrosion propagation in
reinforced concrete structures – A critical review. Cement and Concrete Composites, 33(2), pp.240–
245.
Otieno, M., Beushausen, H. and Alexander, M.G., 2011b. Prediction of corrosion rate in reinforced
concrete structures - a critical review and preliminary results. Materials and Corrosion.
Pacheco, J., Napoles-Morales, O. and Polder, R.B., 2012. Statistical analysis of electrical resistivity as
a tool for estimating cement type of 12-year-old concrete specimens. In: M.G. Alexander, H.
Beushausen, F. Dehn and P. Moyo, eds., Concrete Repair, Rehabilitation and Retrofitting III. Cape
Town: Taylor & Francis Group, pp.701–706.
Pfeifer, D., McDonald, D. and Krauss, D., 1994. The rapid chloride permeability test and its
correlation to the 90-day chloride ponding test. Precast/Prestressed Concrete Institute, 37 -
47(January - February).
Polder, R.B., 1995. Chloride diffusion and resistivity testing of five concrete mixes for marine
environment. In: 1st RILEM workshop on chloride penetration into concrete. Saint-Rémy-lès-
Chevreuse, pp.225–233.
Polder, R.B., 2001. Test methods for on site measurement of resistivity of concrete: Construction and
Building Materials, 15(RILEM TC-154 technical recommendation), pp.125–131.
Polder, R.B., 2005. Durability of marine concrete structures – field investigations and modelling.
HERON, 50(3), pp.133–153.
Polder, R.B., 2009. Critical chloride content for reinforced concrete and its relationship to concrete
resistivity. Materials and Corrosion, 60(8), pp.623–630.
Polder, R.B. and Peelen, W.H., 2002. Characterisation of chloride transport and reinforcement
corrosion in concrete under cyclic wetting and drying by electrical resistivity. Cement and Concrete
Composites, 24(5), pp.427–435.
Polder, R.B., Wegen, G. van der and Breugel, K. Van, 2010. Guideline for service life design of
structural concrete with regard to chloride induced corrosion - the approach in the Netherlands. In: K.
Van Breugel, G. Ye and Y. Yuan, eds., 2nd International Symposium on Service Life Design for
Infrastructure. Delft: RILEM, pp.265–272.
Poulsen, E. and Mejlbro, L., 2006. Diffusion of chloride in concrete. New York: Taylor & Francis
Group.

REFERENCES 97
Prince, W., Pérami, R. and Espagne, M., 1999. Mechanisms involved in the accelerated test of
chloride permeability. Cement and Concrete Research, 29(5), pp.687–694.
Quinn, G. and Keough, M., 2002. Experimental Design and Data Analysis for Biologists. Cambridge:
Cambridge University Press.
Rajabipour, F. and Weiss, J., 2006. Electrical conductivity of drying cement paste. Materials and
Structures, 40(10), pp.1143–1160.
Rear, B.K. et al., 2010. Report on Performance-Based requirements for concrete. Chicago, pp.1 – 42.
Reichling, K. et al., 2013. Full surface inspection methods regarding reinforcement corrosion of
concrete structures. Materials and Corrosion, 64(2), pp.116–127.
Riding, K.A. et al., 2008. Simplified Concrete Resistivity and Rapid Chloride Permeability Test
Method. ACI Materials Journal, July-Augus(105), pp.390–394.
Romer, M., 2005. Recommendation of RILEM TC 189-NEC “Non-destructive evaluation of the
concrete cover”: Comparative test - Part I: Comparative test of “penetrability” methods. Materials
and Structures, 38(284), pp.895–906.
Rooij, M.R. De, Polder, R.B. and Oosten, van H.H., 2007. Validation of service life performance of in
situ concrete by TEM and RCM measurements. HERON, 52(4), pp.225–238.
Saleem, M., Shameem, M., Hussain, S.E. and Maslehuddint, M., 1996. Effect of moisture, chloride
and sulphate contamination on the electrical resistivity of Portland cement concrete. Construction and
Building Materials, 10(3), pp.209–214.
SANS Standard 10100-2, 1992. The structural use of concrete: materials and execution of work.
Pretoria: The South African Bureau of Standards.
Scott, A., 2004. The Influence of Binder Type and Cracking on Reinforcing Steel Corrosion in
Concrete. PhD Thesis. Univeristy of Cape Town.
Sengul, O. and Gjorv, O.E., 2008. Electrical resistivity measurements for quality control during
concrete construction. ACI Materials Journal, 105(6), pp.541–547.
Sengul, O. and Gjorv, O.E., 2009. Effect of embedded steel on electrical resistivity measurements on
concrete structures. ACI Materials Journal, 106(1), pp.11–18.
Sharfuddin A.M., Kayali, O. and Anderson, W., 2008. Chloride penetration in binary and ternary
blended cement concretes as measured by two different rapid methods. Cement and Concrete
Composites, 30(7), pp.576–582.
Shi, X., Xie, N., Fortune, K. and Gong, J., 2012. Durability of steel reinforced concrete in chloride
environments: An overview. Construction and Building Materials, 30, pp.125–138.
Silva, J., Jalali, S. and Ferreira, R.M., 2006. Estimating electrical resistivity based on early age
measurements. In: V. Baroghel-Bouny, C. Andrade, R. Torrent and K.L. Scrivener, eds., International
RILEM Workshop on Performance based evaluation and indicators for concrete durability. Madrid:
RILEM, pp.67–74.

REFERENCES 98
Sirieix, C., Breysse, D. and Frappa, M., 2003. Improvement of electrical resistivity measurement for
non destructive evaluation of concrete structures. In: 2nd RILEM Workshop, Paris. pp.93–102.
Smith, K., Schokker, A. and Tikalsky, P., 2004. Performance of supplementary cementitious materials
in concrete resistivity and corrosion monitoring evaluations. ACI Materials Journal, 101(5), pp.385–
390.
Snyder, K., Feng, X., Keen, B. and Mason, T., 2003. Estimating the electrical conductivity of cement
paste pore solutions from OH−, K+ and Na+ concentrations. Cement and Concrete Research, 33(6),
pp.793–798.
Song, H.-W., Lee, C.-H. and Ann, K.Y., 2008. Factors influencing chloride transport in concrete
structures exposed to marine environments. Cement and Concrete Composites, 30(2), pp.113–121.].
Stanish, K., Alexander, M.G. and Ballim, Y., 2006. Assessing the repeatability and reproducibility
values of South African. Journal Of The South African Institution Of Civil Engineering, 48(2), pp.10–
17.
Stanish, K., Hooton, R.D. and Thomas, M.D.A., 2002. Testing the chloride penetration resistance of
concrete: A literature review. Toronto.
Stanish, K. and Thomas, M., 2003. The use of bulk diffusion tests to establish time-dependent
concrete chloride diffusion coefficients. Cement and Concrete Research, 33(1), pp.55–62.
Streicher, P.E., 1997. The development of a rapid chloride test for concrete, and its use in engineering
practice. University of Cape Town.
Streicher, P.E. and Alexander, M.G., 1995. A chloride conduction test for concrete. Cement and
Concrete Research, 25(6), pp.1284–1294.
Streicher, P.E. and Alexander, M.G., 1999. Towards Standardization of a Rapid Chloride Conduction
Test for Concrete. Cement, Concrete and Aggregates, 21(1), pp.23–30.
Suprenant, B., 1991. Testing for chloride permeability of concrete. Concrete Construction, pp.531–
533.
Thomas, M., 1996. Chloride thresholds in marine concrete. Cement and Concrete Research, 26(4),
pp.513–519.
Thomas, M.D.A. and Bamforth, P.B., 1999. Modelling chloride diffusion in concrete Effect of fly ash
and slag. Cement and Concrete Research, 29, pp.487–495.
Thomas, M.D.A., Hooton, R.D., Scott, A. and Zibara, H., 2012. The effect of supplementary
cementitious materials on chloride binding in hardened cement paste. Cement and Concrete Research,
42, pp.1–7.
Tumidajski, P.J. et al., 1996. On the relationship between porosity and electrical resistivity in
cementitious systems. Cement and Concrete Research, 26(4), pp.539–544.
Tuutti, K., 1980. Service life of structures with regard to corrosion of embedded steel. ACI Special
Publication, 65.
REFERENCES 99
Val, D. V. and Stewart, M.G., 2009. Reliability Assessment of Ageing Reinforced Concrete
Structures—Current Situation and Future Challenges. Structural Engineering International, 19(2),
pp.211–219.
Weydert, R. and Gehlen, C., 1999. Electrolytic resistivity of cover concrete: Relevance, measurement
and interpretation. In: M. Lacasse and D. Vanier, eds., Durability of Building Materials and
Components 8: Service life and durability of materials and components 1. Vancouver: National
Research Council, Canada, pp.409–419.
Whiting, D., 1981. Rapid determination of the chloride permeability of concrete. Skokie, Illinois.
Yuan, Q., Shi, C., Schutter, G. De and Audenaert, K., 2009. Effect of temperature on transport of
chloride ions in concrete. In: M.G. Alexander, H. Beushausen, F. Dehn and P. Moyo, eds., Concrete
Repair, Rehabilitation and Retrofitting II. London: Taylor & Francis Group, pp.345–352.

APPENDIX A: DATA AND RESULTS 100
APPENDIX A: DATA AND RESULTS
The figure below was used to gauge the weather patterns that field concrete specimens were
exposed to.
Figure A. 1: Cape Town temperature and precipitation means
(South African Weather Service - Cape Town, 2010)
All the corrosion initiation periods (CIP’s) calculated from the CCT and surface concrete
resistivity SLP models are presented in the table below.
Table A. 1: CIP’s for resistivity and CCT, extreme exposure at 20 to 60 mm cover depth
Corrosion initiation period (years)
Model Cover
(mm) PC-40 SL-40 SL-55 FA-40 FA-55
Resistivity
20 4 32 29 43 23
30 9 72 65 97 51
40 15 129 115 172 91
50 24 201 180 268 143
60 34 290 259 387 205
CCT
20 4 26 17 20 10
30 8 58 39 45 23
40 14 104 70 81 41
50 22 162 109 126 64
60 32 234 157 181 92

APPENDIX A: DATA AND RESULTS 101
The diffusion coefficients calculated from the chloride conductivity measurements and model
are listed in the table below.
Table A. 2: Diffusion coefficients from CCT model (x10-12 m2/s)
Age (days) PC-40 SL-40 SL-55 FA-40 FA-55
80 2.67 3.13 4.21 4.35 7.12
94 2.55 2.80 3.77 3.90 6.39
108 2.45 2.55 3.43 3.55 5.81
122 2.37 2.35 3.16 3.26 5.35
136 2.29 2.18 2.93 3.03 4.96
150 2.23 2.04 2.74 2.83 4.64
164 2.17 1.92 2.58 2.67 4.37
178 2.12 1.81 2.44 2.52 4.13
192 2.07 1.72 2.32 2.40 3.93
206 2.03 1.64 2.21 2.28 3.74
220 1.99 1.57 2.12 2.19 3.58
234 1.96 1.51 2.03 2.09 3.43
248 1.93 1.45 1.95 2.01 3.30
262 1.90 1.39 1.88 1.94 3.18
276 1.87 1.35 1.81 1.87 3.07
290 1.84 1.30 1.75 1.81 2.97
304 1.82 1.26 1.70 1.75 2.87
318 1.79 1.22 1.65 1.70 2.79
332 1.77 1.19 1.60 1.65 2.71
346 1.75 1.15 1.55 1.61 2.63
360 1.73 1.12 1.51 1.56 2.56
374 1.71 1.10 1.47 1.52 2.50
388 1.69 1.07 1.44 1.49 2.43
402 1.67 1.04 1.40 1.45 2.38
416 1.66 1.02 1.37 1.42 2.32
430 1.64 1.00 1.34 1.38 2.27
444 1.63 0.97 1.31 1.36 2.22
458 1.61 0.95 1.28 1.33 2.17
472 1.60 0.94 1.26 1.30 2.13
486 1.58 0.92 1.23 1.27 2.09
500 1.57 0.90 1.21 1.25 2.05
514 1.56 0.88 1.19 1.23 2.01
528 1.55 0.87 1.17 1.21 1.97
542 1.54 0.85 1.15 1.18 1.94
556 1.52 0.84 1.13 1.16 1.91
570 1.51 0.82 1.11 1.14 1.87
584 1.50 0.81 1.09 1.12 1.84
598 1.49 0.80 1.07 1.11 1.81
612 1.48 0.78 1.05 1.09 1.79
626 1.47 0.77 1.04 1.07 1.76

APPENDIX A: DATA AND RESULTS 102
The diffusion coefficients calculated from the surface concrete resistivity measurements and
model are listed in the table below.
Table A. 3: Diffusion coefficients from resistivity model (x10-12 m2/s)
Age (days) PC-40 SL-40 SL-55 FA-40 FA-55
80 4.15 1.07 1.43 0.63 1.71
94 5.18 0.95 1.90 0.71 1.90
108 3.46 0.82 1.43 0.57 1.56
122 2.96 0.95 1.07 0.53 1.43
136 4.15 0.90 1.22 0.50 1.71
150 2.96 0.82 0.95 0.55 1.43
164 3.46 0.71 1.22 0.45 1.71
178 2.30 0.66 1.14 0.41 1.43
192 2.96 0.49 0.74 0.38 1.32
206 2.30 0.53 0.71 0.40 1.14
220 2.96 0.48 0.90 0.36 1.22
234 2.30 0.61 0.68 0.31 0.95
248 2.07 0.46 0.61 0.38 1.14
262 1.73 0.44 0.53 0.32 1.07
276 2.30 0.41 0.63 0.35 0.95
290 2.07 0.36 0.66 0.31 0.74
304 2.30 0.40 0.61 0.29 0.90
318 1.88 0.33 0.53 0.31 0.95
332 2.59 0.32 0.50 0.29 0.71
346 1.59 0.35 0.61 0.27 0.78
360 1.88 0.32 0.43 0.25 0.68
374 2.07 0.33 0.37 0.24 0.71
388 1.73 0.37 0.46 0.25 0.86
402 1.48 0.31 0.40 0.24 0.55
416 1.88 0.30 0.37 0.24 0.59
430 1.59 0.28 0.36 0.23 0.49
444 1.73 0.28 0.38 0.22 0.61
458 1.48 0.29 0.36 0.23 0.57
472 1.38 0.27 0.44 0.21 0.53
486 1.15 0.26 0.36 0.23 0.49
500 1.59 0.26 0.34 0.23 0.57
514 1.48 0.27 0.36 0.21 0.53
528 1.22 0.24 0.32 0.21 0.46
542 1.38 0.23 0.31 0.22 0.49
556 1.30 0.24 0.34 0.21 0.48
570 1.22 0.25 0.32 0.21 0.45
584 1.30 0.24 0.30 0.21 0.49
598 1.04 0.23 0.28 0.21 0.43
612 0.99 0.22 0.30 0.19 0.38
626 0.94 0.22 0.30 0.20 0.45

APPENDIX A: DATA AND RESULTS 103
The ratio of the diffusion coefficients calculated from the surface concrete resistivity and
chloride conductivity models (from Tables A.3 and A.2) are listed in the table below.
Table A. 4: Ratio of diffusion coefficients
Age (days) PC-40 SL-40 SL-55 FA-40 FA-55
80 0.64 2.92 2.95 6.85 4.16
94 0.49 2.95 1.98 5.46 3.36
108 0.71 3.13 2.41 6.21 3.73
122 0.80 2.47 2.95 6.10 3.75
136 0.55 2.42 2.40 6.02 2.90
150 0.75 2.50 2.88 5.13 3.26
164 0.63 2.69 2.11 5.92 2.55
178 0.92 2.76 2.14 6.19 2.90
192 0.70 3.53 3.12 6.30 2.98
206 0.88 3.07 3.10 5.74 3.28
220 0.67 3.31 2.35 6.00 2.93
234 0.85 2.46 2.96 6.73 3.61
248 0.93 3.13 3.19 5.30 2.89
262 1.10 3.18 3.51 6.12 2.97
276 0.81 3.31 2.86 5.36 3.23
290 0.89 3.65 2.66 5.82 3.99
304 0.79 3.17 2.78 6.05 3.19
318 0.95 3.71 3.08 5.46 2.93
332 0.68 3.68 3.18 5.79 3.80
346 1.10 3.30 2.54 5.91 3.38
360 0.92 3.55 3.54 6.21 3.74
374 0.82 3.33 3.96 6.40 3.50
388 0.98 2.87 3.11 5.99 2.84
402 1.13 3.41 3.52 6.10 4.30
416 0.88 3.39 3.69 5.88 3.93
430 1.03 3.61 3.76 5.91 4.64
444 0.94 3.53 3.45 6.10 3.63
458 1.09 3.29 3.53 5.81 3.81
472 1.16 3.44 2.87 6.08 3.98
486 1.38 3.48 3.46 5.51 4.27
500 0.99 3.47 3.53 5.48 3.59
514 1.05 3.30 3.26 5.73 3.76
528 1.27 3.59 3.68 5.77 4.27
542 1.11 3.63 3.75 5.39 3.96
556 1.18 3.42 3.35 5.57 4.01
570 1.24 3.31 3.49 5.54 4.16
584 1.16 3.40 3.69 5.32 3.77
598 1.44 3.49 3.88 5.37 4.24
612 1.50 3.52 3.51 5.60 4.69
626 1.56 3.52 3.52 5.39 3.90 Average 0.97 3.25 3.14 5.84 3.62 Std. Dev 0.25 0.36 0.52 0.39 0.53
Minimum 0.49 2.42 1.98 5.13 2.55 Maximum 1.56 3.71 3.96 6.73 4.69

APPENDIX A: DATA AND RESULTS 104
The surface concrete resistivity measurements used as input parameters in the corrosion
initiation period and diffusion coefficient models are listed below.
Table A. 5: Surface concrete resistivity (laboratory) results from Otieno (2014)
Mix (kΩcm)
Age
(days) PC-40 SL-40 SL-55 FA-40 FA-55
28/07/2011 80 5 16 12 27 10
11/08/2011 94 4 18 9 24 9
25/08/2011 108 6 21 12 30 11
08/09/2011 122 7 18 16 32 12
22/09/2011 136 5 19 14 34 10
06/10/2011 150 7 21 18 31 12
20/10/2011 164 6 24 14 38 10
03/11/2011 178 9 26 15 42 12
17/11/2011 192 7 35 23 45 13
01/12/2011 206 9 32 24 43 15
15/12/2011 220 7 36 19 47 14
29/12/2011 234 9 28 25 55 18
12/01/2012 248 10 37 28 45 15
26/01/2012 262 12 39 32 54 16
09/02/2012 276 9 42 27 49 18
23/02/2012 290 10 48 26 55 23
08/03/2012 304 9 43 28 59 19
22/03/2012 318 11 52 32 55 18
05/04/2012 332 8 53 34 60 24
19/04/2012 346 13 49 28 63 22
03/05/2012 360 11 54 40 68 25
17/05/2012 374 10 52 46 72 24
31/05/2012 388 12 46 37 69 20
14/06/2012 402 14 56 43 72 31
28/06/2012 416 11 57 46 71 29
12/07/2012 430 13 62 48 73 35
26/07/2012 444 12 62 45 77 28
09/08/2012 458 14 59 47 75 30
23/08/2012 472 15 63 39 80 32
06/09/2012 486 18 65 48 74 35
20/09/2012 500 13 66 50 75 30
04/10/2012 514 14 64 47 80 32
18/10/2012 528 17 71 54 82 37
01/11/2012 542 15 73 56 78 35
15/11/2012 556 16 70 51 82 36
29/11/2012 570 17 69 54 83 38
13/12/2012 584 16 72 58 81 35
27/12/2012 598 20 75 62 83 40
10/01/2013 612 21 77 57 88 45
24/01/2013 626 22 78 58 86 38

APPENDIX B: EBE FACULTY ASSESSMENT OF ETHICS IN RESEARCH PROJECTS 105
APPENDIX B: EBE FACULTY ASSESSMENT OF ETHICS IN RESEARCH
PROJECTS
Name of Principal Researcher/Student: Lombe Mutale Department: Civil Engineering Preferred email address of applicant: [email protected] If a Student: Degree: MSc. Civil Engineering Supervisor: A/Prof. Beushausen If a Research Contract indicate source of funding/sponsorship: N/A Research Project Title: An investigation of the relationship between surface concrete resistivity and chloride conductivity tests Overview of ethics issues in your research project:
Question 1: Is there a possibility that your research could cause harm to a third party (i.e. a person not involved in your project)?
YES NO
Question 2: Is your research making use of human subjects as sources of data? If your answer is YES, please complete Addendum 2.
YES NO
Question 3: Does your research involve the participation of or provision of services to communities? If your answer is YES, please complete Addendum 3.
YES NO
Question 4: If your research is sponsored, is there any potential for conflicts of interest? If your answer is YES, please complete Addendum 4.
YES NO
If you have answered YES to any of the above questions, please append a copy of your research proposal, as well as any interview schedules or questionnaires (Addendum 1) and please complete further addenda as appropriate.
I hereby undertake to carry out my research in such a way that
there is no apparent legal objection to the nature or the method of research; and
the research will not compromise staff or students or the other responsibilities of the University;
the stated objective will be achieved, and the findings will have a high degree of validity;
limitations and alternative interpretations will be considered;
the findings could be subject to peer review and publicly available; and
I will comply with the conventions of copyright and avoid any practice that would constitute plagiarism.
Signed by:
Full name and signature Date
Principal Researcher/Student:
This application is approved by:
Supervisor (if applicable):
HOD (or delegated nominee): Final authority for all assessments with NO to all questions and for all undergraduate research.
Chair : Faculty EIR Committee For applicants other than undergraduate students who have answered YES to any of the above questions.