an introduction to liquid chromatography mass spectrometry · • liquid chromatography-mass...
TRANSCRIPT

An Introduction to Liquid Chromatography Mass Spectrometry
Dr Kersti Karu email: [email protected]
Office number: Room LG11
Recommended Textbook:
“Analytical Chemistry”, G. D. Christian, P. K. Dasgupta, K.A. Schug, Wiley, 7th Edition
“Trace Quantitative Analysis by Mass Spectrometry”, R.K. Boyd, C.Basic, R.A. Bethem, Wiley

Applications
Qualitative and quantitative measurements for many
fields:- clinical, environmental, food, geographical
regions, forensic and etc.

Lecture Overview
• Rate theory of HPLC van Deemter equation
• Principle of LC analysis
– HPLC subclasses
– Stationary phases in HPLC
– LC columns
• Liquid chromatography-mass spectrometry (LC-MS)
– Separation process in reversed-phase liquid chromatography
– Electrospray ionisation (ESI) source
– Taylor cone formation occurs both at the end of the ESI tube and
as the droplets disintegrate to release ions.
– Quadrupole ion trap (QIT) analyser
– Injection of ions into an orthogonal TOF analyser
– Principle of orthogonal TOF analysers with V and W geometries
– Orbitrap analyser
– Tandem mass spectrometry
• LC-MS application sterolomics analysis
• Brief introduction to phytosterol analysis

Principles of LC-MS analysis
• HPLC flow rate 1-2 mL/min, 4.6 mm ID
column, 3-or 5-µm silica-based particles,
5-30 µL injection.
• Capillary LC flow rate 200 µL/min, 1 mm ID
column, 1.5- to 3-µm silica-based particles,
1-5 µL injection
• Nano LC flow rate 200 nL/min, 0.1 mm ID
column, 3-µm silica-based particles, 0.1-2
µL injection
• UHPLC systems (ultra-high-pressure liquid
chromatography) 0.3 - 1 mL/min, 1.5- to 3-
µm silica-based particles capable of
pumping at 15,000 psi.
Basic components of an HPLC system
Principle of separation in HPLC
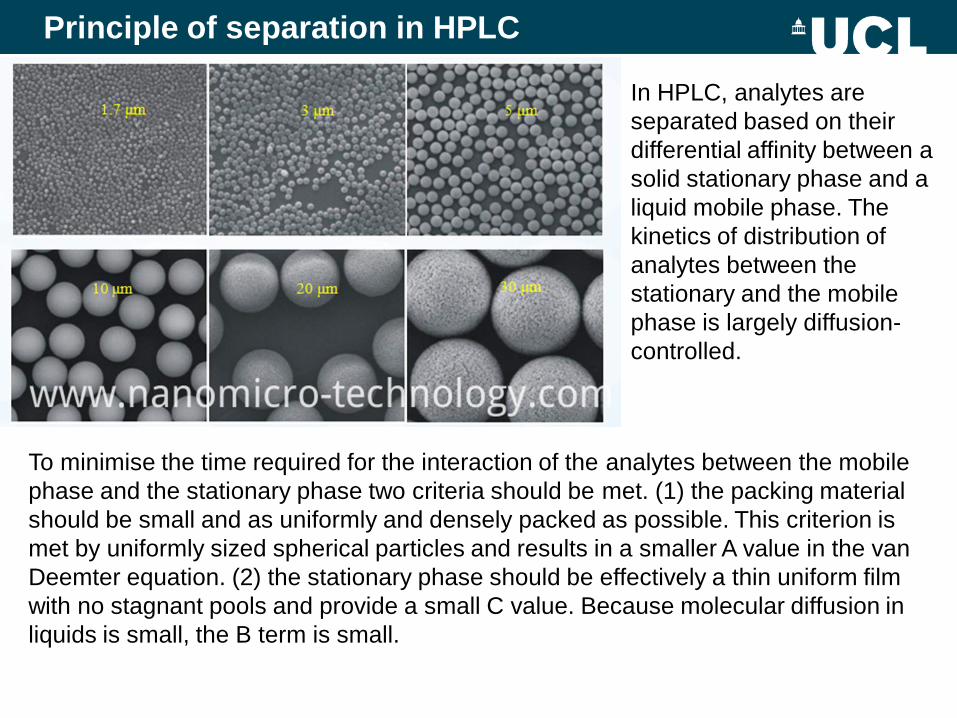
In HPLC, analytes are
separated based on their
differential affinity between a
solid stationary phase and a
liquid mobile phase. The
kinetics of distribution of
analytes between the
stationary and the mobile
phase is largely diffusion-
controlled.
To minimise the time required for the interaction of the analytes between the mobile
phase and the stationary phase two criteria should be met. (1) the packing material
should be small and as uniformly and densely packed as possible. This criterion is
met by uniformly sized spherical particles and results in a smaller A value in the van
Deemter equation. (2) the stationary phase should be effectively a thin uniform film
with no stagnant pools and provide a small C value. Because molecular diffusion in
liquids is small, the B term is small.
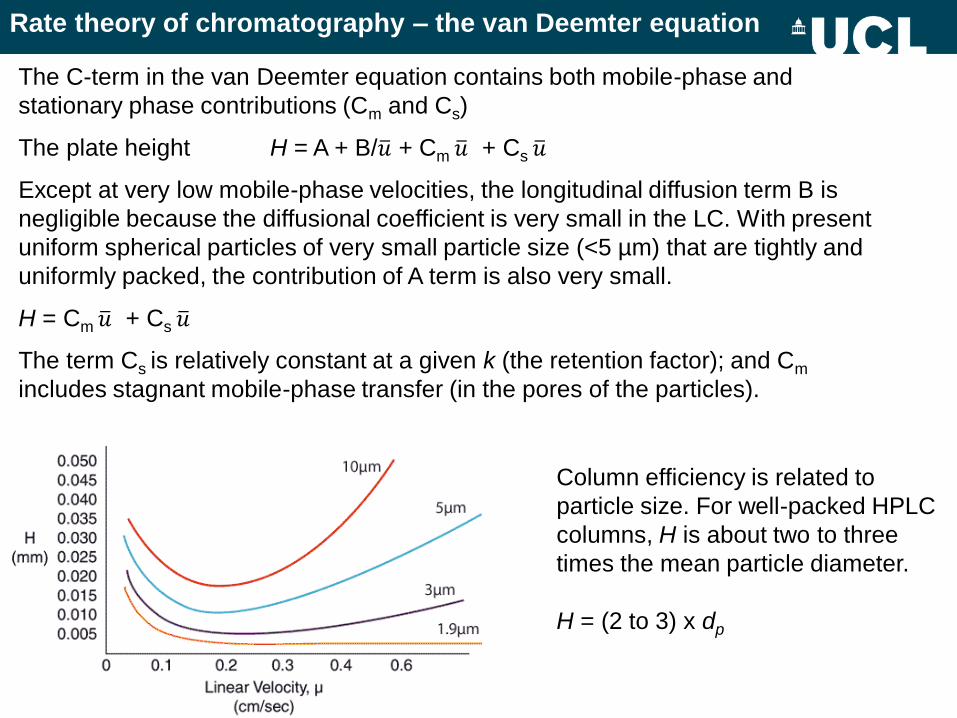
Rate theory of chromatography – the van Deemter equation
The C-term in the van Deemter equation contains both mobile-phase and
stationary phase contributions (Cm and Cs)
The plate height H = A + B/𝑢 + Cm 𝑢 + Cs 𝑢
Except at very low mobile-phase velocities, the longitudinal diffusion term B is
negligible because the diffusional coefficient is very small in the LC. With present
uniform spherical particles of very small particle size (<5 µm) that are tightly and
uniformly packed, the contribution of A term is also very small.
H = Cm 𝑢 + Cs 𝑢
The term Cs is relatively constant at a given k (the retention factor); and Cm
includes stagnant mobile-phase transfer (in the pores of the particles).
Column efficiency is related to
particle size. For well-packed HPLC
columns, H is about two to three
times the mean particle diameter.
H = (2 to 3) x dp
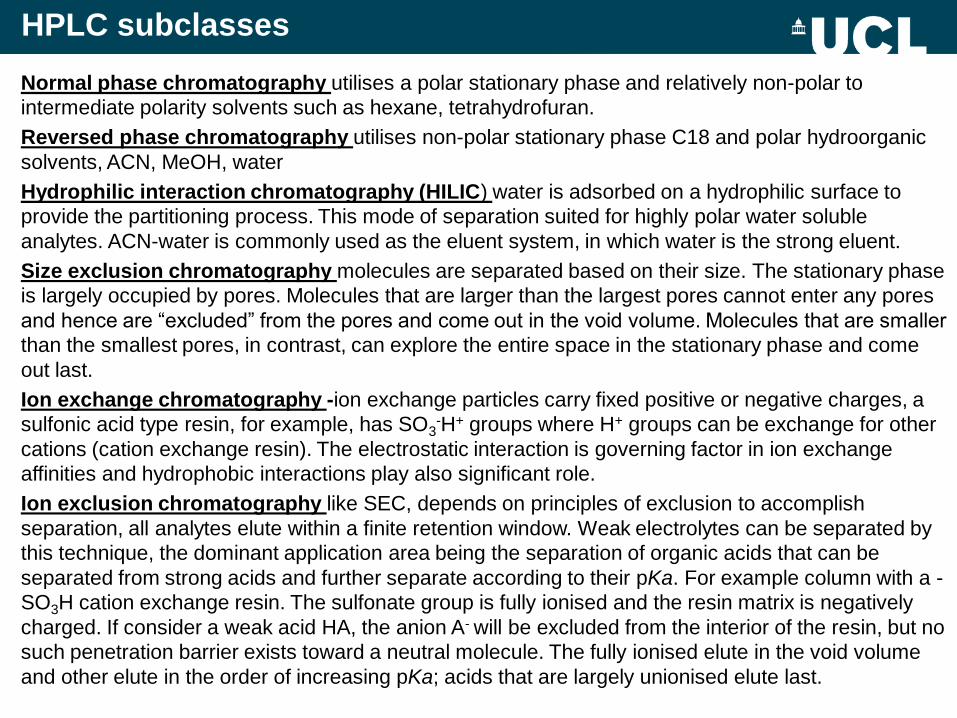
Normal phase chromatography utilises a polar stationary phase and relatively non-polar to
intermediate polarity solvents such as hexane, tetrahydrofuran.
Reversed phase chromatography utilises non-polar stationary phase C18 and polar hydroorganic
solvents, ACN, MeOH, water
Hydrophilic interaction chromatography (HILIC) water is adsorbed on a hydrophilic surface to
provide the partitioning process. This mode of separation suited for highly polar water soluble
analytes. ACN-water is commonly used as the eluent system, in which water is the strong eluent.
Size exclusion chromatography molecules are separated based on their size. The stationary phase
is largely occupied by pores. Molecules that are larger than the largest pores cannot enter any pores
and hence are “excluded” from the pores and come out in the void volume. Molecules that are smaller
than the smallest pores, in contrast, can explore the entire space in the stationary phase and come
out last.
Ion exchange chromatography -ion exchange particles carry fixed positive or negative charges, a
sulfonic acid type resin, for example, has SO3-H+ groups where H+ groups can be exchange for other
cations (cation exchange resin). The electrostatic interaction is governing factor in ion exchange
affinities and hydrophobic interactions play also significant role.
Ion exclusion chromatography like SEC, depends on principles of exclusion to accomplish
separation, all analytes elute within a finite retention window. Weak electrolytes can be separated by
this technique, the dominant application area being the separation of organic acids that can be
separated from strong acids and further separate according to their pKa. For example column with a -
SO3H cation exchange resin. The sulfonate group is fully ionised and the resin matrix is negatively
charged. If consider a weak acid HA, the anion A- will be excluded from the interior of the resin, but no
such penetration barrier exists toward a neutral molecule. The fully ionised elute in the void volume
and other elute in the order of increasing pKa; acids that are largely unionised elute last.
HPLC subclasses
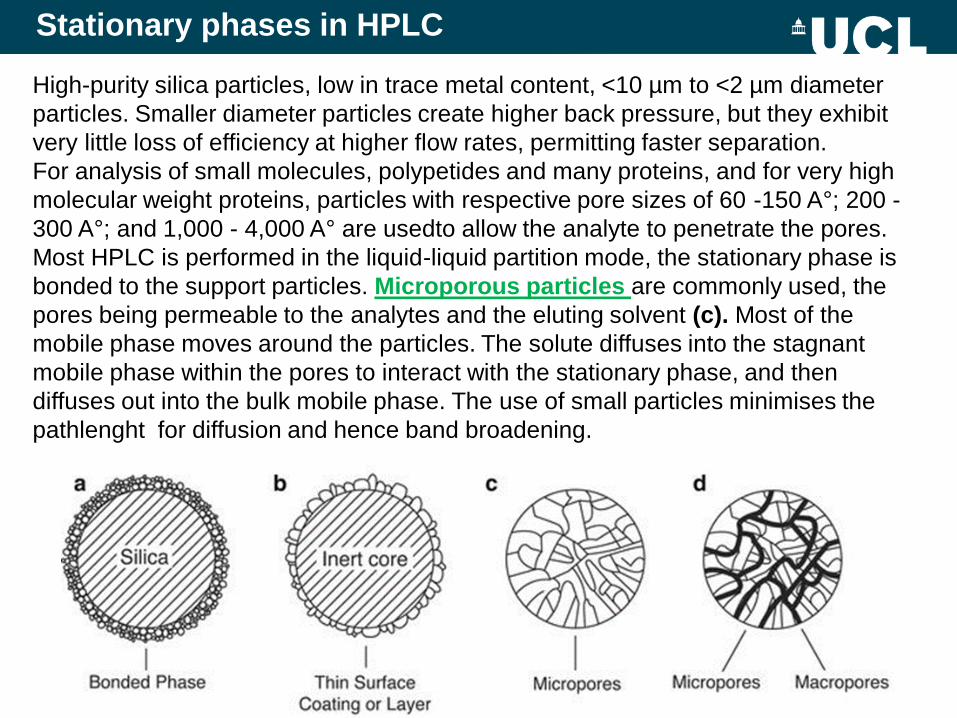
Stationary phases in HPLC
High-purity silica particles, low in trace metal content, <10 µm to <2 µm diameter
particles. Smaller diameter particles create higher back pressure, but they exhibit
very little loss of efficiency at higher flow rates, permitting faster separation.
For analysis of small molecules, polypetides and many proteins, and for very high
molecular weight proteins, particles with respective pore sizes of 60 -150 A°; 200 -
300 A°; and 1,000 - 4,000 A° are usedto allow the analyte to penetrate the pores.
Most HPLC is performed in the liquid-liquid partition mode, the stationary phase is
bonded to the support particles. Microporous particles are commonly used, the
pores being permeable to the analytes and the eluting solvent (c). Most of the
mobile phase moves around the particles. The solute diffuses into the stagnant
mobile phase within the pores to interact with the stationary phase, and then
diffuses out into the bulk mobile phase. The use of small particles minimises the
pathlenght for diffusion and hence band broadening.

• (c) Silica particles have surface silanol groups, SiOH. Silanol groups provide polar
interaction sites. The reaction with monochlorosilane R(CH3)2SiCl, where R
=CH3(CH2)16-CH2- will lead to “C18 silica” stationary phase. The extent to which
silanol groups are functionalised depends on the chain length of the functionalising
agent. The extent of functionalisation is expressed in terms of wt %C (as obtained
by elemental analysis).
• Macroporous-micro/mesoporous structures packings. Pores smaller then
~100A° are referred to as micropores while those larger than ~1000 A° are regarded
as macropores. Pores of intermediate size are mesopores (d). Mostly used for
analysis of large molecules.
• Nonporous packings (b) silica in very small particle size (1.5 µm) as there is no
pores, the pore diffusion and longitudinal diffusion limitations disappear. With very
small particles, the diffusion distance from the mobile to the stationary phase is short;
column efficiency is virtually flow rate independent. However, the pressure needed to
attain a certain flow rate thorough a given column varies inversely as the square of
the particle diameter (the pressure is 1000% higher when the column is packed with
1.5 µm than with 5 µm particles). Nonporous packings have a lower surface area,
limiting how much sample can be injected on column and exhibit lower RT.
• Bonded phases (a) the packing material is composed of an inner fused or non
porous particle core and a porous outer particle shell. Analytes interact with the outer
shell, reducing resistance to mass transfer and providing superior separation
efficiency. Particle size as small as 1.3 µm used.

A monolithic column constitutes of a single solid rod that is
thoroughly permeated by interconnecting pores. As with perfusion
packings, they have a bimodal pore structure. Macropores, which
act as flow-through pores, are about 2 µm in diameter. The silica
skeleton contains mesopores with diameters of about 130 A°. It
can be surface modified with stationary phase like C18. The rod is
shrink-wrapped in a polyetheretherketone (PEEK) plastic holder.
The surface area of the mesopores is about 300 m2/g, and the
total porosity is 80%. The column exhibits a van Deemter curve
close to that for 3.5-µm packed particles, but with a pressure drop
~40% of the packed column run at the same flow rate. Polymeric
monoliths are available in capillary formats from 0.1 to 1 mm in
diameter and up to 250 mm in length.
Stationary phases for hydrophilic interaction chromatography (HILIC) three types
of HILIC phases:- neutral, charged and zwitterionic. The neutral HILIC phase contains
amide or diol functionalities bonded to porous silica. A charged phase exhibits strong
electrostatic interactions and may consist of bare silica or amino, aminoalkyl or
sulfonate functionalities bonded to porous silica. The separation selectivity between
different analytes can be favoured by the electrostatic interactions that are contributing
to the retention with the charged HILIC stationary phases. A zwitterionic bonded phase,
a -O3S(CH2)3-N+(CH3)2CH2- zwitterionic group is the functional entity bonded to a
porous silica support, or a polymeric support for greater pH range.
Monolithic column and HILIC

Sample injection system
LC Columns
Liquid chromatography – mass spectrometry (LC-MS)
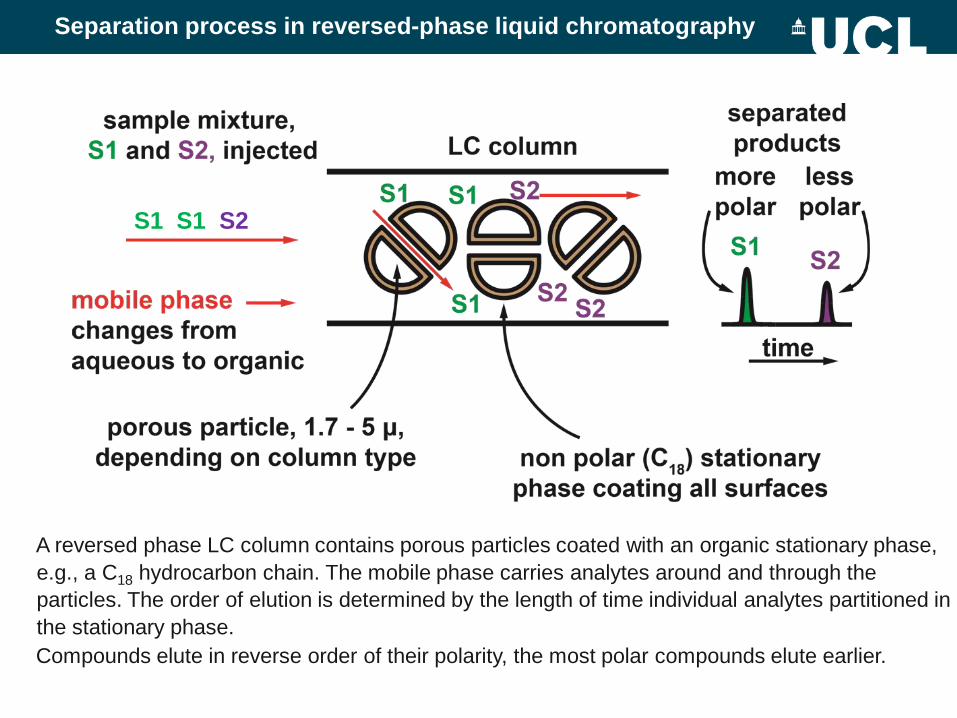
A reversed phase LC column contains porous particles coated with an organic stationary phase,
e.g., a C18 hydrocarbon chain. The mobile phase carries analytes around and through the
particles. The order of elution is determined by the length of time individual analytes partitioned in
the stationary phase.
Compounds elute in reverse order of their polarity, the most polar compounds elute earlier.
S1 S1 S2
Separation process in reversed-phase liquid chromatography

analyser
Electrospray ionisation (ESI) source
Two concentric steel tubes carry the liquid and nebulising gas. After nebulisation, additional gas
is used to dry the droplets. As the droplets shrink the charge density increases to the point at
which the droplets are no longer stable and ions are released from the liquid matrix into the
vapour phase. Ions enter the mass analyser at an angle to reduce the entrainment of neutral
molecules.
At low flow rates, such as in nanospray ESI, spontaneous evaporation is sufficient to eliminate
the need for the drying gas.

Stable nebulisation of the liquid flow occurs when a Taylor cone is established at the
tip of the ESI source.
As the droplets are dried the charge density increases resulting in droplet
disintegration either because of Coulombic forces or by distortion to form a Taylor
cone from which ions are released.
Taylor cone formation occurs both at the end of the ESI tube and as the
droplets disintegrate to release ions.
electrode
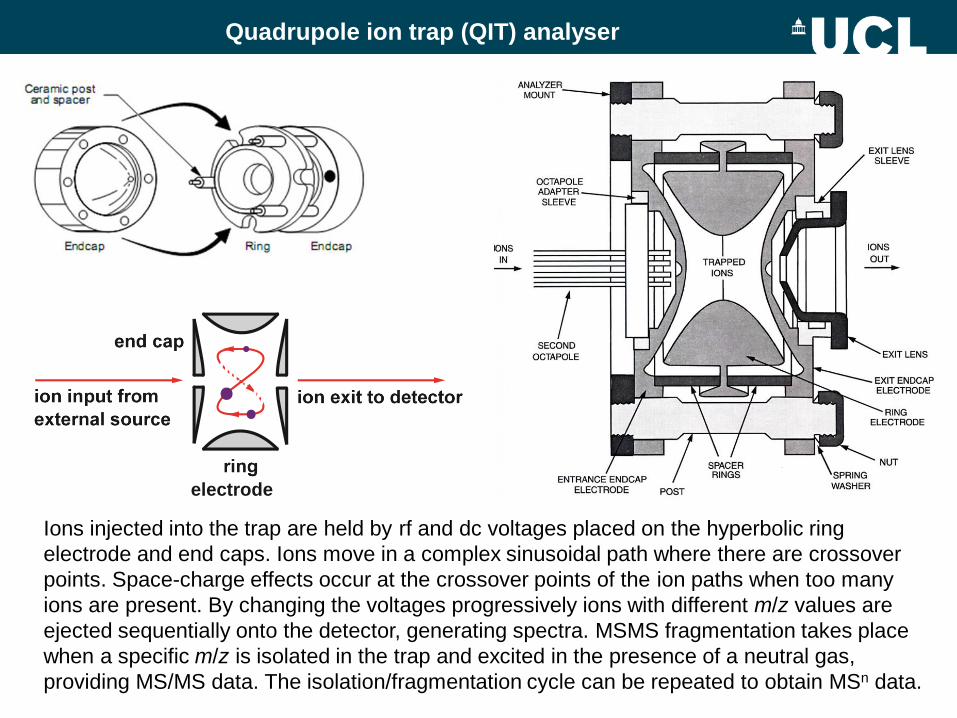
Ions injected into the trap are held by rf and dc voltages placed on the hyperbolic ring
electrode and end caps. Ions move in a complex sinusoidal path where there are crossover
points. Space-charge effects occur at the crossover points of the ion paths when too many
ions are present. By changing the voltages progressively ions with different m/z values are
ejected sequentially onto the detector, generating spectra. MSMS fragmentation takes place
when a specific m/z is isolated in the trap and excited in the presence of a neutral gas,
providing MS/MS data. The isolation/fragmentation cycle can be repeated to obtain MSn data.
Quadrupole ion trap (QIT) analyser

API focusing pusher
ion source region (pulsed voltage) part of ion beam
direction of ions in the analyser is
composed of horizontal and vertical
components imparted by the source
and pusher voltages.
Ions are generated continuously in API sources, thus, the individual packets of ions required in
TOF analysis must be excised from the ion beam, and accelerated orthogonally into the analyser
using a pulsed pusher voltage. Only part of the continuous ion beam can be sampled as the
excised ion packet must traverses the analyser before another set of ions can be introduced. The
duty cycle of the orthogonal injection process limits the sensitivity of orthogonal TOF instruments.
Injection of ions into an orthogonal TOF analyser
The basic principle of TOF analyser:- pulses of ions are accelerated from the ion source into the
analyser tube, and the time for an ion to travel through a field-free region to the detector is
measured. The time-of-flight for the passage of an ion in a TOF analyser is a function of
momentum, and therefore its m/z. The acceleration voltage and (consequently) the kinetic energy
(momentum), is the same for all ions. Thus those with the lowest m/z will travel fastest and arrive at
the detector first, followed by the sequential arrival of ions with successively higher m/z.
API atmospheric
pressure ionisation

secondary
ion mirror
V geometry W geometry
Ion path
pusher
Ions arriving from the source are accelerated orthogonally into the analyser by a
pulsed voltage from the pusher. Ions separate based on their momenta. As they
travel through the analyser the lightest, fastest, ions (lowest m/z) will arrive at the
detector first.
Some horizontal momentum imparted in the source remains so that ions travel at
an angle into and out of the reflectron thus attaining a characteristic ‘V’ trajectory.
Increasing the distance that the ions travel improves mass resolution, e.g., by
using ‘W’ geometry.
Principle of orthogonal TOF analysers with V and W geometries

induced transient ion input is off center
and oscillate along, the
specially shaped inner
electrode creating a
complex ion path.
Ions, typically from ESI and APCI, are collected in a specialised component
called the C-trap and them injected into the orbitrap as high-speed pulses. Ions
are injected at an angle and offset from the centre of the trap. The momentum of
the ions causes them to orbit around, and oscillate along, the central spindle-like
electrode. The lateral oscillation of the ions along the inner electrode induces a
transient (image) current in the split outer electrode. The recorded image current
is interpreted using Fourier transform analysis to provide m/z values and
intensities.
Orbitrap analyzer

API CID
Principle of a QTOF MS/MS instrument
Ions are produced in an atmospheric pressure ionisation (API) source.
The quadrupole can be used in broad bandpass (q) mode, to pass all ions to the
time-of-flight (TOF) analyser, or in narrow band pass (Q) mode to select an ion with a
specific m/z for collision induced dissociation (CID). The CID cell also has a q
function by which the fragments formed are constrained and transferred to the TOF
analyser. CID fragment ions are separated and collected in the TOF analyser.
Quadrupoles as ion guide (q) the rf voltages can be applied to the quadrupole, but
without being combined with a dc field. Under these conditions all ions, e.g. those
emerging from the ion source that enter the q are transmitted, regardless of their m/z
values.

second
(b) ICR cell
superconducting magnet
The LIT-orbitrap combination can be used for both MS and MSn experiments because the LIT has its own
detector. Additional fragmentation at a different collision energy can be undertaken in a second collision cell.
Products from either collision cell are injected, via the C trap, into the orbitrap where transients are collected for
subsequent FT analysis.
In the LIT-ICRMS, ions from the LIT traverse a set of extended optics into the ICR cell located within a
superconducting magnet. A ramped rf voltage pulse is used to coalesce different m/z values and move them
close to the receiver plates where transients are collected for subsequent FT analysis.
Schematic of a hybrid linear ion trap with an orbitrap or ion
cyclotron resonance (ICR) cell as the second analyzer

High resolution improves accurate mass measurement

Cyclopentanoperhydrophenanthrene skeleton
Natural steroids have
two methyls
5α-Cholestane structure with
IUPAC numbering showing four
fused-ring isoprene structure
STEROIDS

Steroids in Brain
• 25% body’s cholesterol is present in brain
• Cholesterol formed de novo
• 1st step of cholesterol metabolism formation of an
oxysterol
HOOH

Lütjohann Acta Neurol Scand 2006 114 33
24S-Hydroxycholesterol
Cholesterol

Oxysterols in brain
(S)
(R)
HO
(R)
(Z)
(S)
OH
ng/mg ng-pg/mg
(S)
(R)
HO
(S)
(Z)
(R)
OH
(S)
(R)
HO
(R)
(Z)
OH
(S)
(R)
HO
(S)
(R)
(Z) OH

• Transport forms of cholesterol
• Oxysterols are ligands for LXR
• Oxysterols implicated in neurodegenerative
disease (AD)
• Oxysterols formed by reaction with O3 or
ROS as a result of inflammation
HOOH
Björkhem et al Curr Opin Lipidol 2002 13 247

Analytical Strategy
• Extraction: 1st C2H5OH, 2nd CH3OH/CH2Cl2
• Separation: Straight phase
• Derivatisation:
• LC-ES-MSn
HOOH
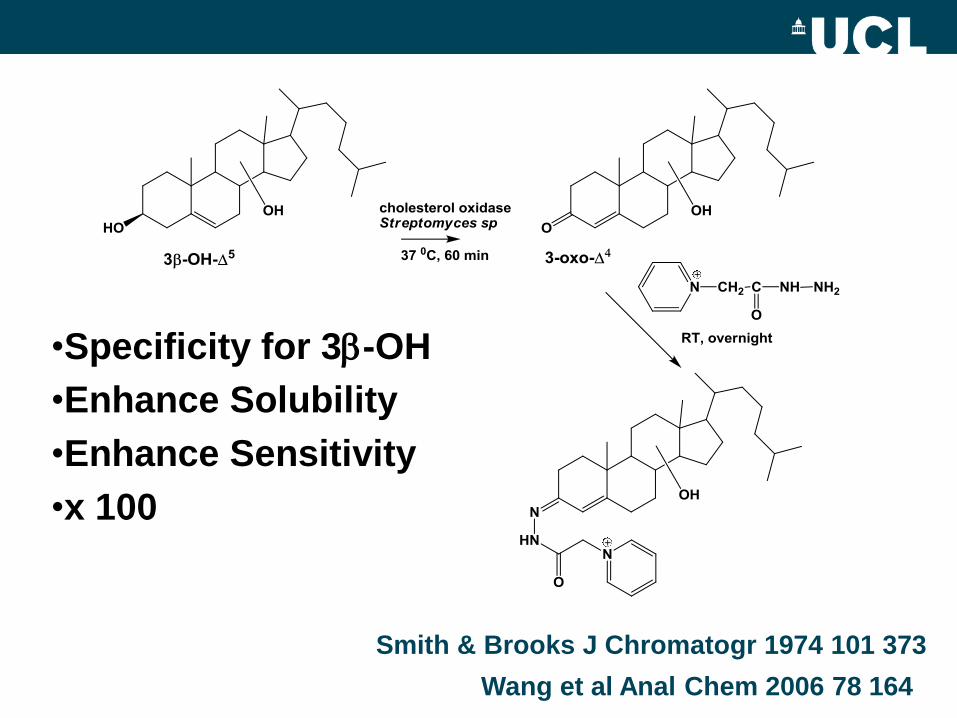
•Specificity for 3b-OH
•Enhance Solubility
•Enhance Sensitivity
•x 100
Wang et al Anal Chem 2006 78 164
Smith & Brooks J Chromatogr 1974 101 373
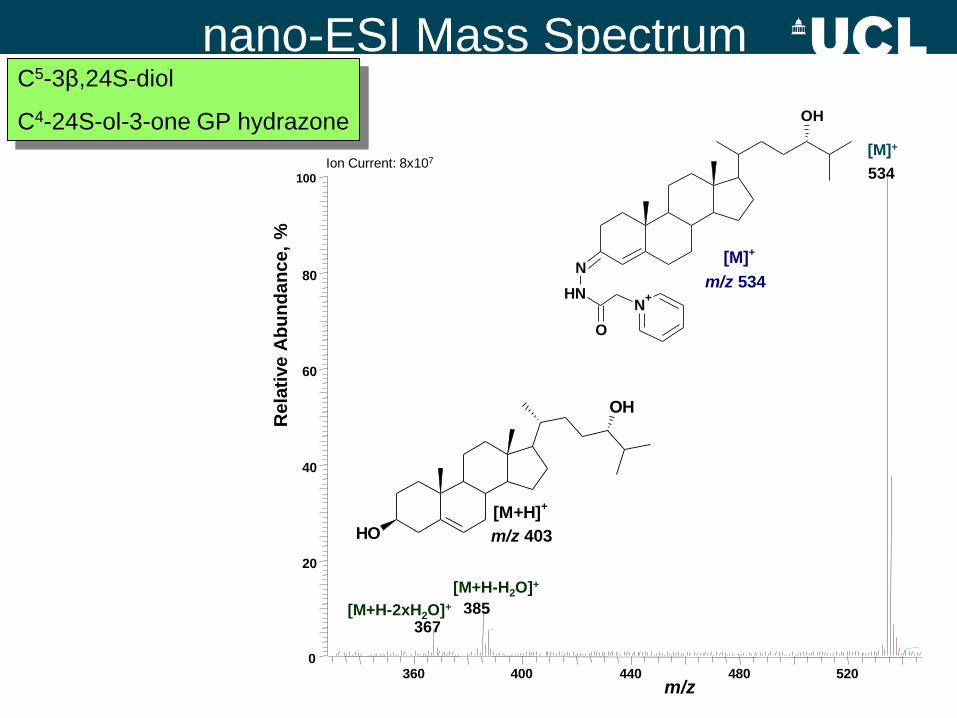
360 400 440 480 520 0
20
40
60
80
100 534
385 367
m/z
Rela
tive A
bu
nd
an
ce,
%
Ion Current: 8x10⁷
OH
OH
[M+H]+
m/z 403
[M]+
[M+H-H2O]+
[M+H-2xH2O]+
nano-ESI Mass Spectrum
C5-3β,24S-diol
C4-24S-ol-3-one GP hydrazone
N
N+NH
O
OH
[M]+
m/z 534
Oxysterols in rat brain
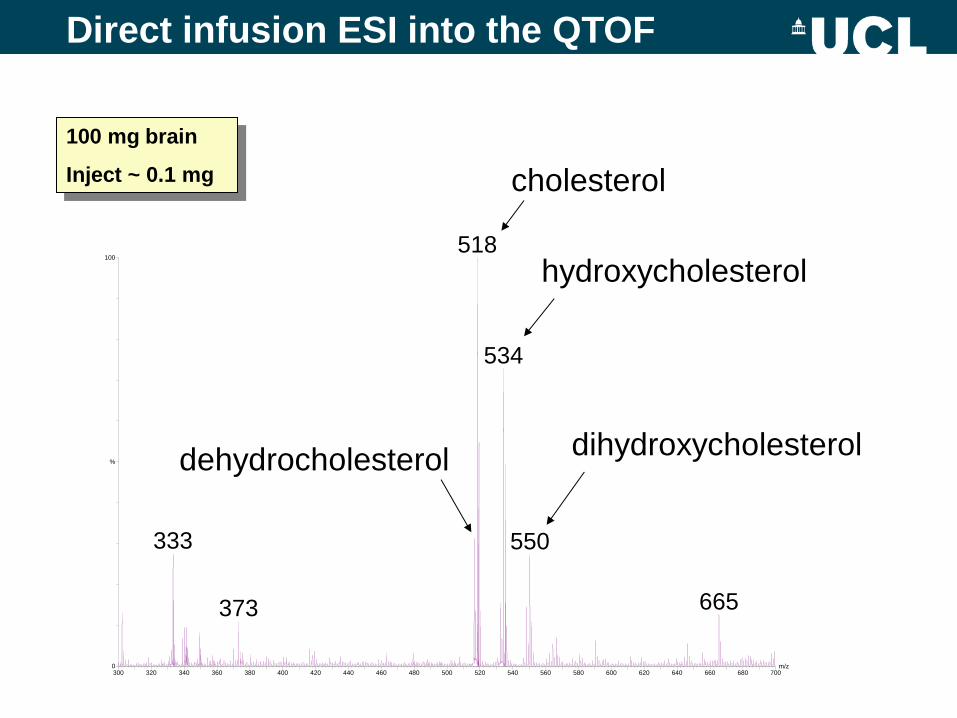
300 320 340 360 380 400 420 440 460 480 500 520 540 560 580 600 620 640 660 680 700m/z0
100
%
518
333
373
534
550
665
100 mg brain
Inject ~ 0.1 mg cholesterol
hydroxycholesterol
dihydroxycholesterol dehydrocholesterol
Direct infusion ESI into the QTOF
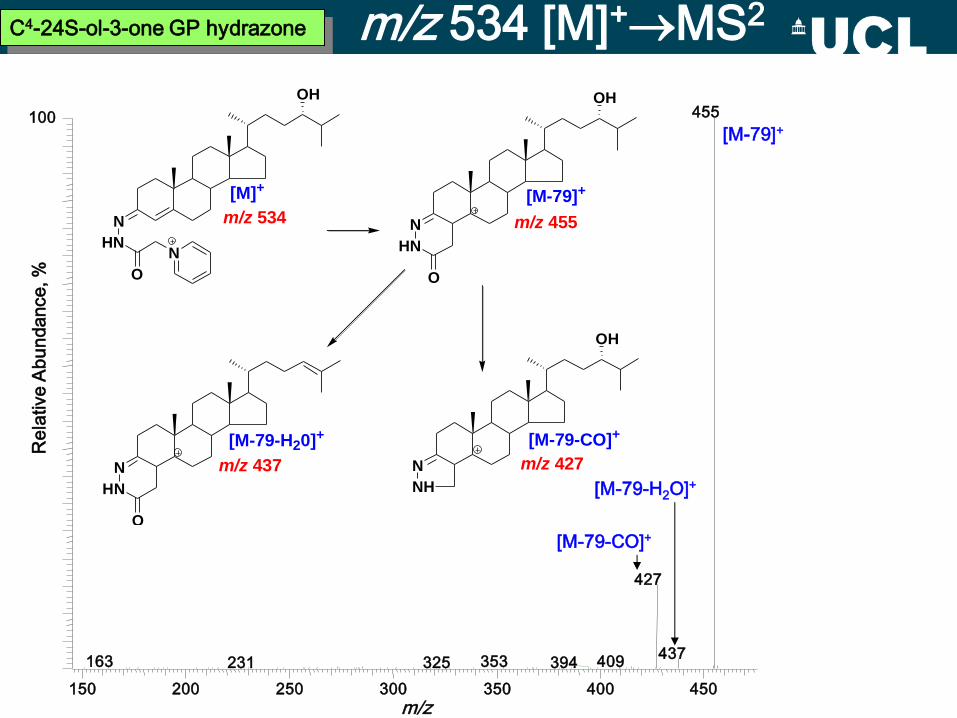
m/z 534 [M]+MS2
[M-79-CO]+
[M-79]+
150 200 250 300 350 400 450
m/z
Re
lative A
bu
ndance, %
455
427
437 409 353 163 394 325 231
100
[M-79-H2O]+
C4-24S-ol-3-one GP hydrazone
[M]+ [M-79]+
N
OH
HNN
O
m/z 534 N
OH
HN
O
m/z 455
[M-79-CO]+
N
OH
NH
m/z 427
[M-79-H20]+
N
HN
O
m/z 437
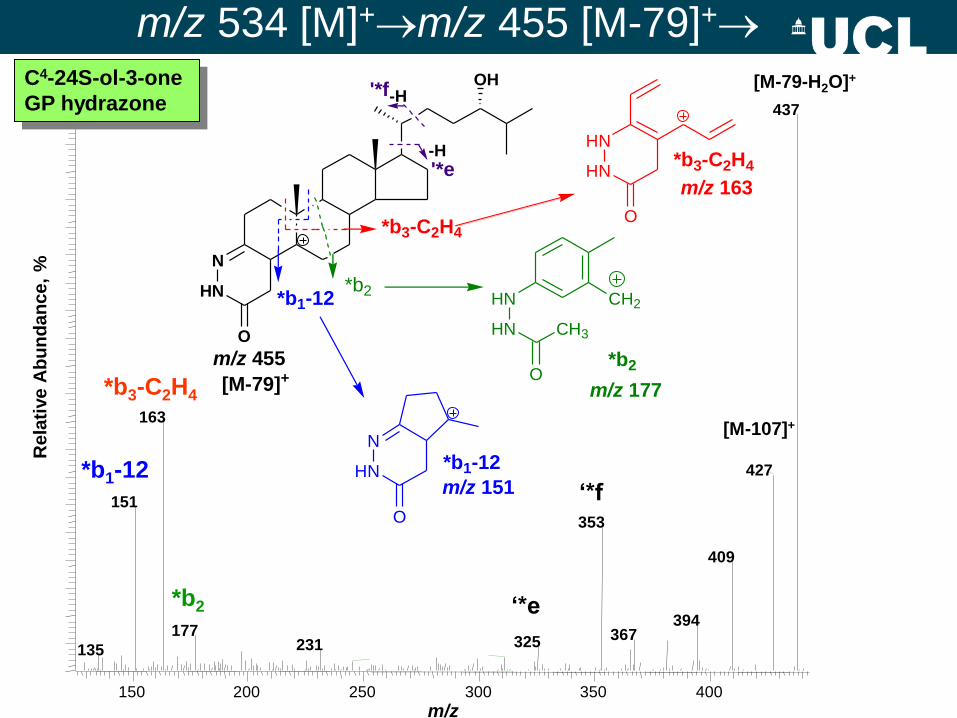
m/z 534 [M]+m/z 455 [M-79]+
MS3
‘*f
‘*e
*b3-C2H4
*b1-12
[M-107]+
*b2
150 200 250 300 350 400
m/z
Rela
tive A
bu
nd
an
ce,
%
437
163
427
151
353
409
394 177 367 325 231 135
[M-79-H2O]+ C4-24S-ol-3-one
GP hydrazone
N
OH
HN
O
m/z 455
-H
'*e
-H'*f
N
HN
O
m/z 151
*b1-12
[M-79]+
*b1-12
*b2HN
HN
CH2
*b2O
CH3
m/z 177
*b3-C2H4
HN
HN
O
m/z 163
*b3-C2H4

Cap-LC Ion Source
Nano-ES Mass Analyser
Ion trap
Detector
Vacuum
Ions
Computer
Ions Signal
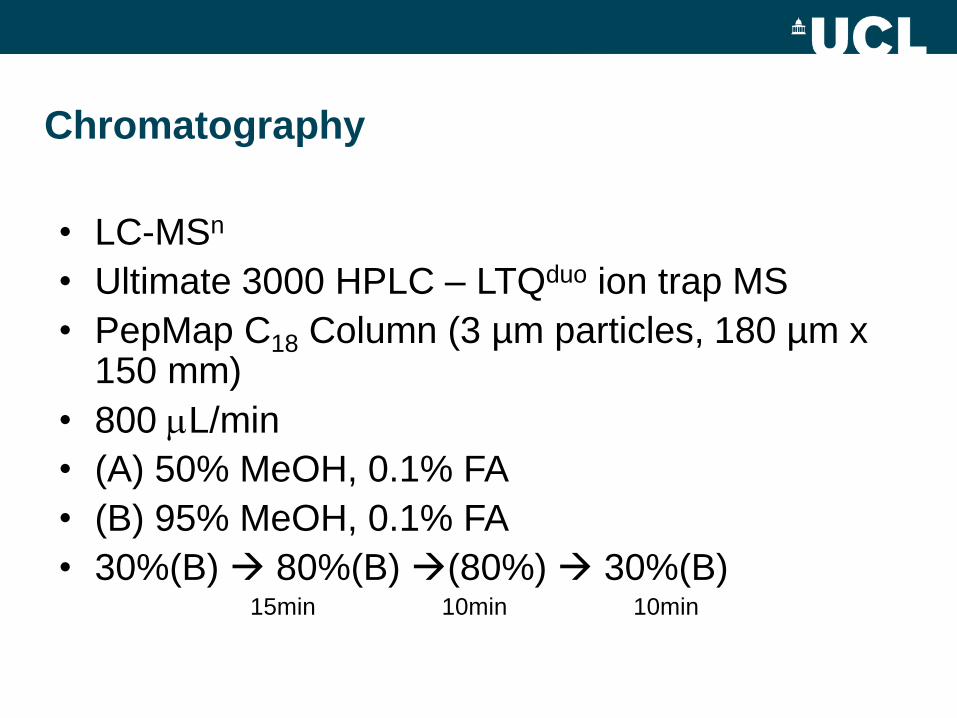
Chromatography
• LC-MSn
• Ultimate 3000 HPLC – LTQduo ion trap MS
• PepMap C18 Column (3 µm particles, 180 µm x 150 mm)
• 800 mL/min
• (A) 50% MeOH, 0.1% FA
• (B) 95% MeOH, 0.1% FA
• 30%(B) 80%(B) (80%) 30%(B) 15min 10min 10min

0 20 40
Time (min)
20
60
100
25.8
22.2
23.1 21.9
19.4
19.6
19.1
18.8
16.5 15.4
11.7
N
NHN
O
C4 -7-one-3-one GP
O
N
NHN
O
C4 -24S-ol-3-one GP
(S)
OH
N
NHN
O
C4 -25-ol-3-one GP
OH
N
NHN
O
CO
OH
BA4 -3-one GP
N
NHN
O
C4 -ol-3-one GP
N
NHN
O
(S)
N
NHN
O
C4 -22S-ol-3-one GP
OH
capLC - MS3
N
N+NH
O
OH
C4 -7ß-ol-3-one GP
N
N+NH
O
OH
OH
C4 -7a,27-diol-3-one GP

Chromatography
• LC-MSn
• Surveyor HPLC – LTQ-Orbitrap
• Hypersil GOLD Column (1.9 mm particles, 50 x 2.1 mm)
• 200 mL/min
• (A) 50% MeOH, 0.1% FA
• (B) 95% MeOH, 0.1% FA
• 20%(B) 80%(B) (80%) 20%(B) 7min 5min 4min
ESI_Unisil2_070206_fr1 03/05/2006 18:23:26
RT: 0.00 - 17.00
0 1 2 3 4 5 6 7 8 9 10 11 12 13 14 15 16 17
Time (min)
0
50
100
0
50
100
0
50
100
0
50
100
0
50
100
0
50
100
0
50
100
0
50
10012.53
12.38
12.91 13.6511.7311.0510.399.18 14.628.197.792.110.48 6.956.12 15.625.17
7.60
6.85 10.239.797.81 10.42
7.35
7.65
7.87 9.48 10.03 10.87 12.38 12.90 14.57
8.88
9.058.488.34 9.23
5.49
6.17 8.996.26 9.377.22 9.96 10.62
5.454.47
5.064.31 5.91 9.20 9.436.45 8.76
10.03
9.23
5.436.15
8.37
6.597.76
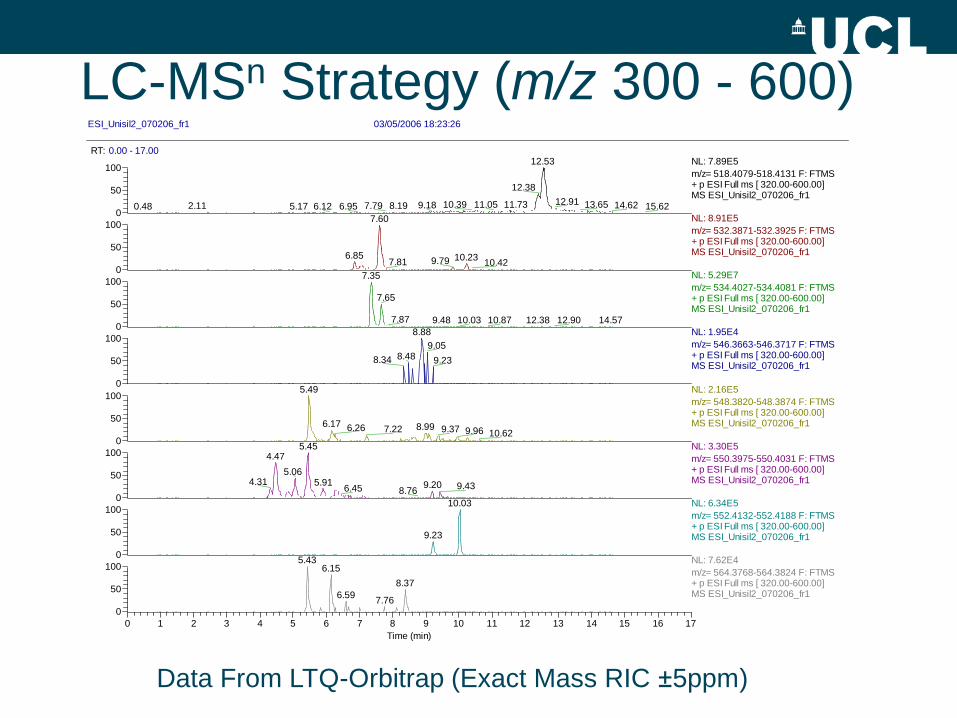
NL: 7.89E5
m/z= 518.4079-518.4131 F: FTMS + p ESI Full ms [ 320.00-600.00] MS ESI_Unisil2_070206_fr1
NL: 8.91E5
m/z= 532.3871-532.3925 F: FTMS + p ESI Full ms [ 320.00-600.00] MS ESI_Unisil2_070206_fr1
NL: 5.29E7
m/z= 534.4027-534.4081 F: FTMS + p ESI Full ms [ 320.00-600.00] MS ESI_Unisil2_070206_fr1
NL: 1.95E4
m/z= 546.3663-546.3717 F: FTMS + p ESI Full ms [ 320.00-600.00] MS ESI_Unisil2_070206_fr1
NL: 2.16E5
m/z= 548.3820-548.3874 F: FTMS + p ESI Full ms [ 320.00-600.00] MS ESI_Unisil2_070206_fr1
NL: 3.30E5
m/z= 550.3975-550.4031 F: FTMS + p ESI Full ms [ 320.00-600.00] MS ESI_Unisil2_070206_fr1
NL: 6.34E5
m/z= 552.4132-552.4188 F: FTMS + p ESI Full ms [ 320.00-600.00] MS ESI_Unisil2_070206_fr1
NL: 7.62E4
m/z= 564.3768-564.3824 F: FTMS + p ESI Full ms [ 320.00-600.00] MS ESI_Unisil2_070206_fr1
Data From LTQ-Orbitrap (Exact Mass RIC ±5ppm)
LC-MSn Strategy (m/z 300 - 600)
RT: 0.00 - 17.00
0 2 4 6 8 10 12 14 16
0
5
10
15
20
25
30
35
40
45
50
55
60
65
70
75
80
85
90
95
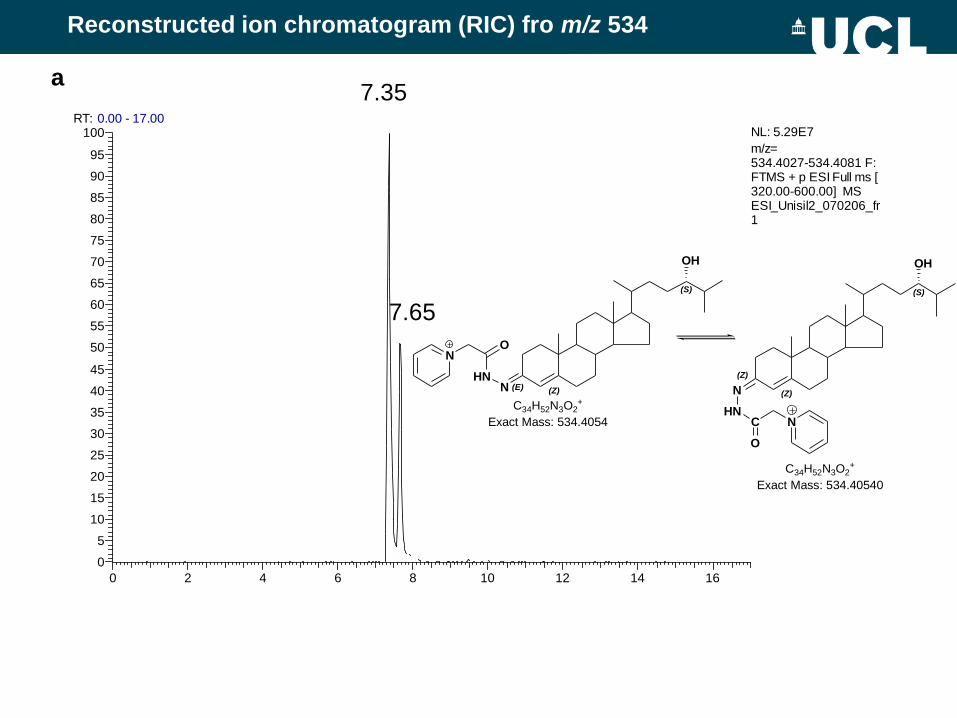
100 NL: 5.29E7
m/z= 534.4027-534.4081 F: FTMS + p ESI Full ms [ 320.00-600.00] MS ESI_Unisil2_070206_fr1
7.35
7.65
a
N (Z)
(Z)
HNC
O
N
N (Z)(E)
C34H52N3O2+
Exact Mass: 534.40540
HN
ON
C34H52N3O2+
Exact Mass: 534.4054
(S)
OH
(S)
OH
Reconstructed ion chromatogram (RIC) fro m/z 534
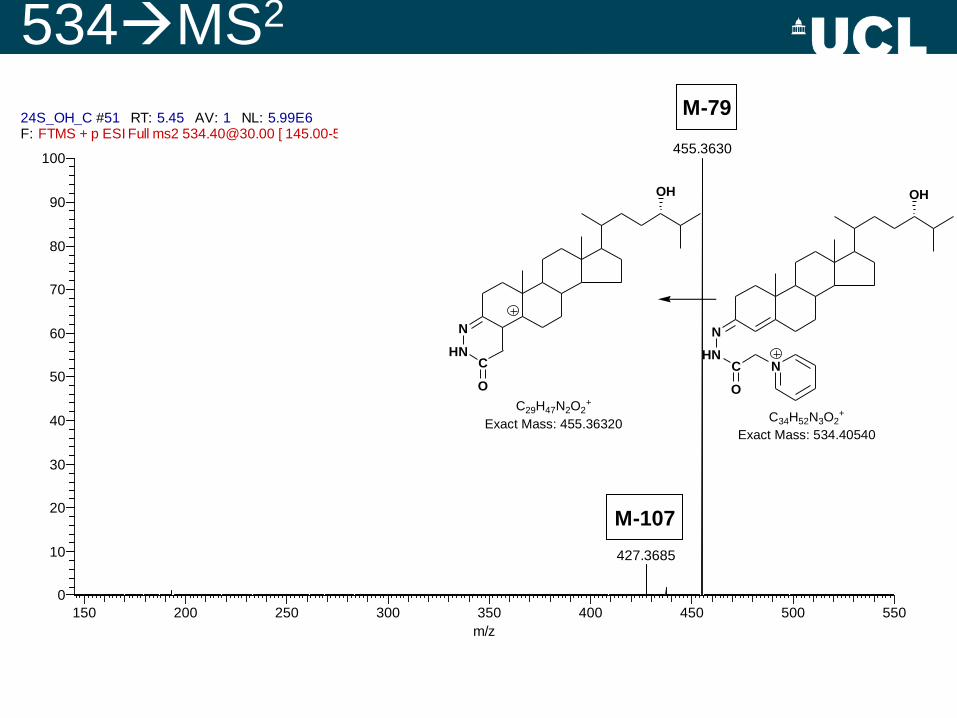
24S_OH_C #51 RT: 5.45 AV: 1 NL: 5.99E6F: FTMS + p ESI Full ms2 [email protected] [ 145.00-550.00]
150 200 250 300 350 400 450 500 550
m/z
0
10
20
30
40
50
60
70
80
90
100
Re
lative
Ab
un
da
nce
455.3630
427.3685
N
HNC
O
N
N
HNC
O
C34H52N3O2+
Exact Mass: 534.40540
C29H47N2O2+
Exact Mass: 455.36320
OHOH
534MS2
M-79
M-107
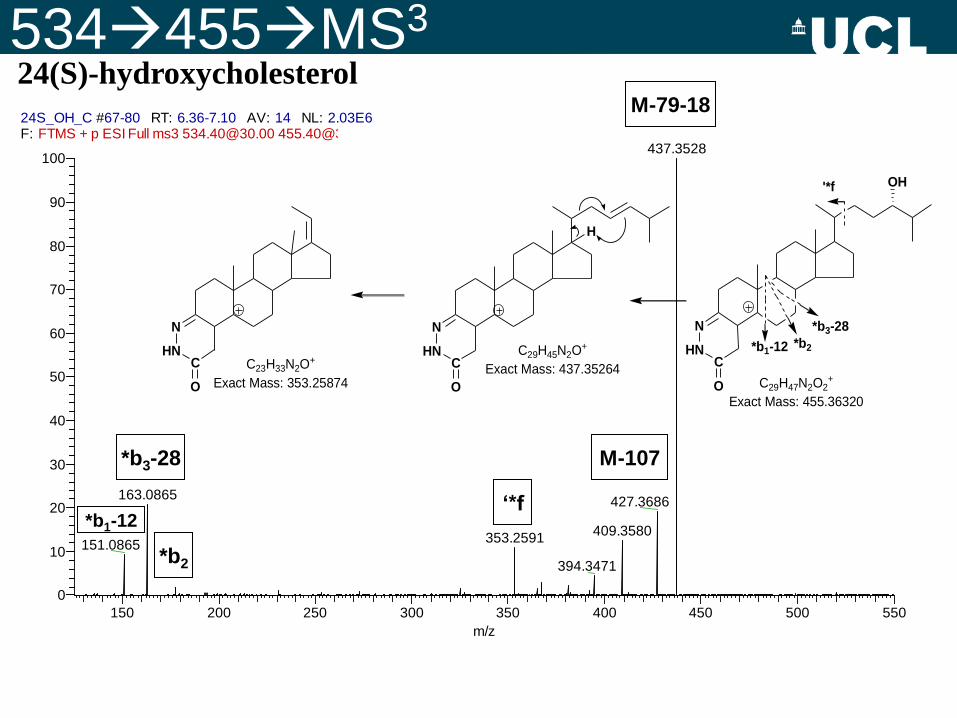
534455MS3
24S_OH_C #67-80 RT: 6.36-7.10 AV: 14 NL: 2.03E6F: FTMS + p ESI Full ms3 [email protected] [email protected] [ 125.00-550.00]
150 200 250 300 350 400 450 500 550
m/z
0
10
20
30
40
50
60
70
80
90
100
Re
lative
Ab
un
da
nce
437.3528
427.3686
409.3580353.2591
163.0865
151.0865
394.3471
193.2107
N
HNC
O C29H47N2O2+
Exact Mass: 455.36320
N
HNC
O
C29H45N2O+
Exact Mass: 437.35264
*b1-12 *b2
*b3-28N
HNC
O
C23H33N2O+
Exact Mass: 353.25874
OH'*f
H
M-79-18
*b1-12
*b3-28
*b2
‘*f
M-107
24(S)-hydroxycholesterol

Lanosterol
HOH
H
H
HOH
H
H
4,4-Dimethylcholesta-8(9),14,24-trien-3b-ol
HOH
H
H
Dihydrolanosterol
CYP51A/
Lanosterol-14--demethylase
(EC 1.14.13.70)
3b-Hydroxysterol 24-reductase/
Desmosterol reductase
(EC:1.3.1.72)
4,4-Dimethylcholesta-8(9),14-dien-3b-ol
HOH
H
H
4,4-Dimethylcholesta-8(9),24-dien-3b-ol
HOH
H
H
4,4-Dimethylcholesta-8(9)-en-3b-ol
HOH
H
H
Sterol C14-reductase/
14-Sterol reductase/
3b-Hydroxysterol-14-reductase
(EC 1.3.1.70)
HOH
H
H
Zymosterol
C-4 Methylsterol oxidase/Methylsterol monoxygenase(EC 1.14.13.72)
C4-Sterol decarboxylase/
Sterol-4-carboxylate 3-dehydrogenase
(decarboxylating)
(EC 1.1.1.170)
HOH
H
H
Cholesta-8(9)-en-3b-ol
HOH
H
H
Cholesta-7,24-dien-3b-ol
3b-Hydroxysterol 8,7-isomerase
(EC 5.3.3.5)
HOH
H
H
Lathosterol/
Cholesta-7-en-3b-ol
HO
H
H
7-DehydrodesmosterolHO
H
H
7-Dehydrocholesterol
Lathosterol 5-desaturase/Sterol-C5-desaturase(EC 1.14.21.6)
HO
H
H
Desmosterol HO
H
H
Cholesterol
Sterol 7-reductase/
3b-Hydroxysterol 7-reductase
(EC 1.3.1.21)
(EC 1.14.13.70)
(EC:1.3.1.72)
(EC:1.3.1.72)
(EC:1.3.1.72)
(EC:1.3.1.72)
(EC:1.3.1.72)
(EC:1.3.1.72)
(EC 1.3.1.70)
(EC 1.14.13.72)
(EC 1.1.1.170)
(EC 5.3.3.5)
(EC 1.14.21.6)
(EC 1.3.1.21)
2,3-Oxidosqualene
O
Squalene Epoxidase(EC 1.14.99.7)
Squalene
Squalene Epoxidase(EC 1.14.99.7)
2,3:22,23-DioxidosqualeneO
O
24S,25-EpoxylanosterolHO
H
H
H
O
(EC 1.14.13.70)
HOH
H
H
Lanosterol synthase/OSC/2,3-Epoxysqualene-Lanosterol Cyclase(EC 5.4.99.7)
(EC 5.4.99.7)
O
(EC 1.3.1.70)
HOH
H
H
O
(EC 1.14.13.72)
(EC 1.1.1.170)
HOH
H
H
O
(EC 5.3.3.5)
HOH
H
H
O
(EC 1.14.21.6)
HO
H
H
O
(EC 1.3.1.21)
HO
H
H
24S,25-Epoxycholesterol
O
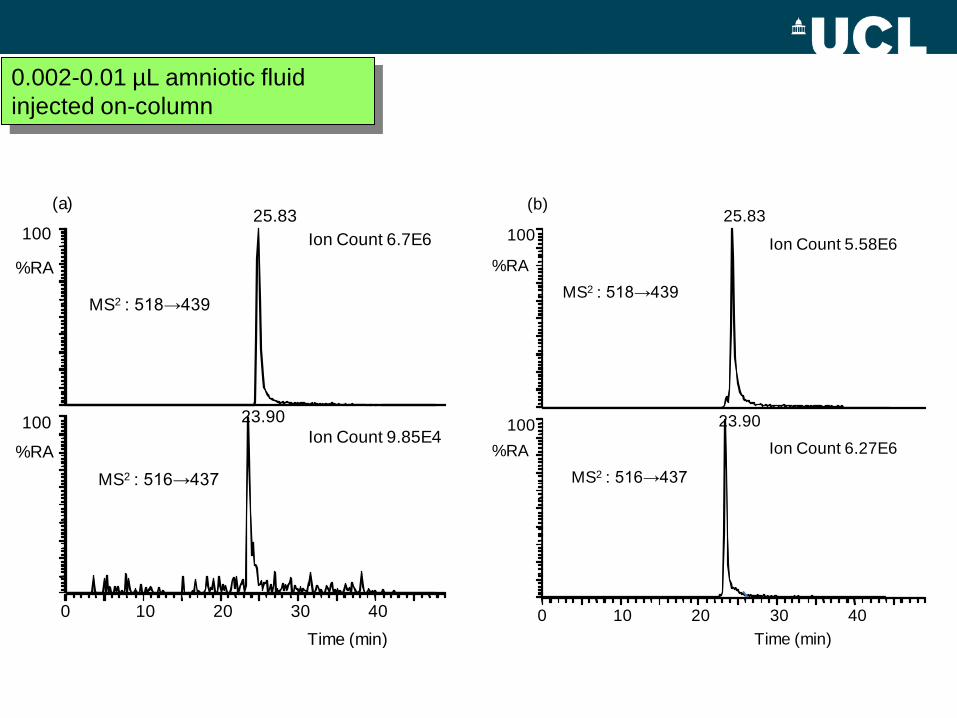
The prenatal diagnosis of Smith-Lemli-Opitz syndrome from amniotic fluid

Sterol analysis for the prenatal diagnosis of
Smith-Lemli-Opitz syndrome
0 10 20 30 40
Time (min)
100
100
10025.83
24.46
23.90
Cholesterol518→439
7-DHC516→437
Desmosterol516→437
%RA
%RA
%RA
Ion Count 6.7E6
Ion Count 9.85E4
0 10 20 30 40
Time (min)
100
10025.83
23.90
%RA
%RA
MS2 : 518→439
MS2 : 516→437
(a)
Ion Count 5.58E6
Ion Count 6.27E6
0 10 20 30 40
Time (min)
100
10025.83
23.90
MS2 : 518→439
MS2 : 516→437
%RA
%RA
(b)
0.002-0.01 µL amniotic fluid
injected on-column
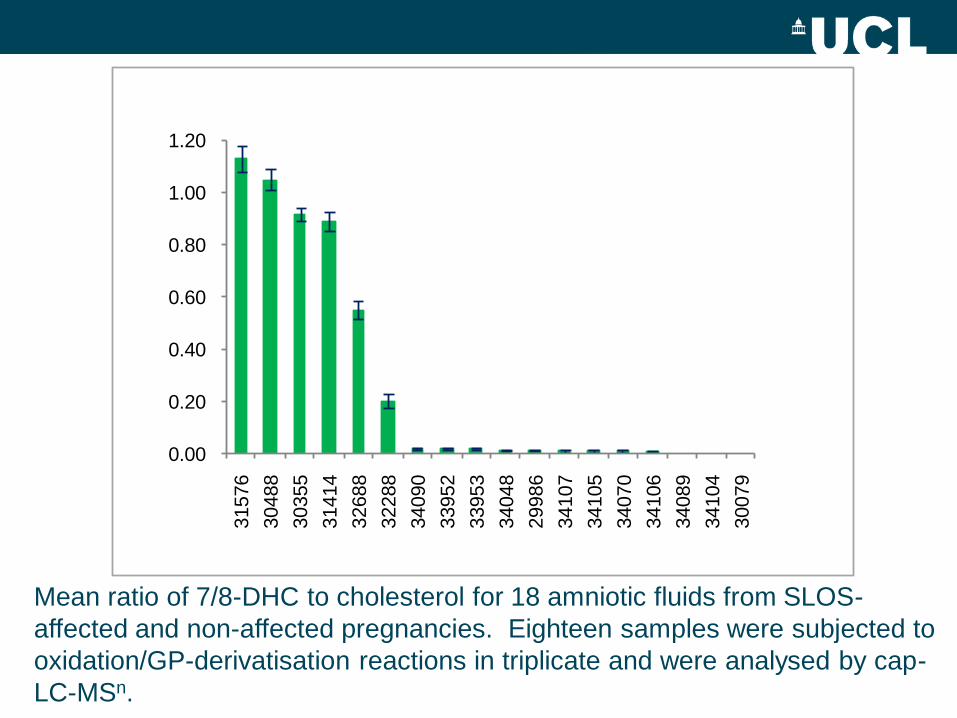
Mean ratio of 7/8-DHC to cholesterol for 18 amniotic fluids from SLOS-
affected and non-affected pregnancies. Eighteen samples were subjected to
oxidation/GP-derivatisation reactions in triplicate and were analysed by cap-
LC-MSn.
0.00
0.20
0.40
0.60
0.80
1.00
1.20
31576
30488
30355
31414
32688
32288
34090
33952
33953
34048
29986
34107
34105
34070
34106
34089
34104
30079

β-sitosterol 5-cholesten-24β-ethyl-3β-ol
Stigmasterol 5,22-cholestadien-24β-ethyl-3β-ol
Campesterol 5-cholesten-24α-methyl-3β-ol
Stigmastanol 5-cholestan-24β-ethyl-3β-ol
Cholesterol 5-cholesten-3β-ol
Phytosterol practical
Analytical Strategy
• Extraction of phytosterols : C2H5OH
• Derivatisation with GP hydrazine
• Direct infusion ESI onto the QTOF
• LC-ES-MSn

Direct infusion of a sample into
the mass spectrometer
LC and Mass Spectrometry
• LC-MS: Separate components of interest, giving sharp peaks (10 s – 1 min) away from the solvent front