an introduction to investec introduction to investec ... • no reliance on wholesale funding •...
TRANSCRIPT

An introduction to Investec
The information in this presentation relates to the year ending 31 Mar 2017, unless otherwise indicated.

Facilitating the creation of wealth and management of wealth
History• Established in 1974• Today, efficient integrated international business platform
employing approximately 9 700 people• Dual listed on the JSE and LSE (a FTSE 250 company)• Total assets of £53.5bn; total equity £4.8bn; total FUM
£150.7bn^
Strategy• Client focused approach • Delivering profitable solutions with distinction and integrity• Not “all things to all people”
– Choose markets where we can compete effectively• Investec distinction: Nimble, flexible, innovative and high
level of service
Culture• Flat and efficient management structure• Strong risk management and financial discipline• Entrepreneurial culture - material employee ownership
^At 31 March 2017.*Before goodwill, acquired intangibles, non-operating items, group costs and after other non-controlling interests. 2
Investec: a distinctive specialist bank and asset manager
0%
10%
20%
30%
40%
50%
60%
70%
80%
90%
100%
2008 2009 2010 2011 2012 2013 2014 2015 2016 2017
SpecialistBanking
Wealth &Investment
AssetManagement
% contribution to operating profit before tax*
0%
10%
20%
30%
40%
50%
60%
70%
80%
90%
100%
2008 2009 2010 2011 2012 2013 2014 2015 2016 2017
UK and Other
Southern Africa
% contribution to operating profit before tax*

South Africa:• Full service Specialist Bank with leading positions in selected areas• Loans: R236bn; Deposits: R303bn• Long term credit loss: 30bps – 40bps• NIM: c2%• ROE post tax: 12.7%
UK:• 17th* largest bank in the UK• Top in UK mid-cap capital markets (FTSE250) • Rapidly growing client base• Building out our private client offering• Loans: £8.6bn Deposits: £11.0bn• Long term credit loss on ongoing book: 30bps – 40bps• NIM: c2%• ROE post-tax (ongoing): 11.5%
Wealth & Investment
Three distinct business activities focused on well defined target clients
One place and digital platform
• Investec Wealth & Investment has been built via the acquisition and integration of businesses and organic growth over a long period of time
• Well established platforms in the UK, South Africa, Switzerland, Ireland and Guernsey
• AUM: £54.8bn
• OM: 25.9% (UK: 23.5% SA:33.8%)
• Ave yield: 72bps (UK: 85bps SA: 47bps)
• Target for ave net inflows: 5% of opening AUM for UK business
Successfully leveraging our One-Place platform: private banking and wealth management
Data as at 31 March 2017. *Source: ‘The Banker’ July 2016 edition, ranked by Tier 1 capital 3
Leading business franchises with sound operating fundamentals
Corporate / Institutional / Government
Provides investment management services
Asset Management
Private client (high net worth / high income) / charities / trusts
Provides a broad range of services:• Lending • Transactional banking• Treasury and trading• Advisory• Investment activities
Specialist BankingProvides investment management services and independent financial planning advice
Wealth & Investment
• Organically built an independent global platform, from an emerging market base
• Independently managed• Competitive investment
performance in chosen specialities• Core investment capabilities in
global equities and fixed income with a growing multi-asset capability
• Stable and experienced leadership • AUM: £95.3bn (60% EM; 40%
global)• OM: 33.1%• Ave yield: 58bps• Ave net inflows (over 5 years): c4%
of opening AUM

4
• Defensive business model: supports a stable recurring income base and earnings through varying market conditions
• Strategic priority: growth in our capital light activities
-
200
400
600
800
1,000
1,200
1,400
2008 2009 2010 2011 2012 2013 2014 2015 2016 2017
£’mn
Third party assets and advisory feesNet interest income, investment income and trading income
Capital light revenues2008: 39% of total2017: 56% of total
Balanced and diversified business model
0%
10%
20%
30%
40%
50%
60%
70%
80%
0
500
1000
1500
2000
2500
2008 2009 2010 2011 2012 2013 2014 2015 2016 2017
£’mn
Trading income Investment incomeOther fees and other operating income Annuity fees and commissionsNet interest income Annuity income* as a % of total income

5
• Senior management “hands-on” culture
• A high level of readily available, high quality liquid assets –representing approx 25% - 35% of our liability base. Balance as at 31 March 2017 was £12.0bn.
• No reliance on wholesale funding
• Healthy capital ratios - always held capital in excess of regulatory requirements and the group intends to perpetuate this philosophy. Target common equity tier 1 ratio of above 10% and total capital ratios of 14%-17%
• Low gearing ratio – approx 10 times; with leverage ratios in excess of 7%
• We had sufficient pre-provision income to support increased impairments during the crisis. Impairments have decreased significantly (sales of non-core businesses; legacy book running off; ongoing book has low credit loss ratios)
Sound risk fundamentals ensuring resilience throughout the crisis
Cash and near cash
Low gearing ratios
Average
13.8 13.0 12.511.3 11.3 11.6
10.39.4 10.2 9.5
5.8 6.2 5.4 4.7 4.5 4.7 4.3 4.3 4.7 4.7
02468
10121416
2008 2009 2010 2011 2012 2013 2014 2015 2016 2017
times
Gearing ratio (assets excluding assurance assets to total equity) Core loans to equity ratio
0.0%
1.0%
2.0%
3.0%
4.0%
5.0%
0
5
10
15
20
25
2008 2009 2010 2011 2012 2013 2014 2015 2016 2017
£’bn
Core loans (LHS)Credit loss ratio (RHS)Net default loans before collateral as a % of net core loans (RHS)
Asset quality
Key operating fundamentals
6
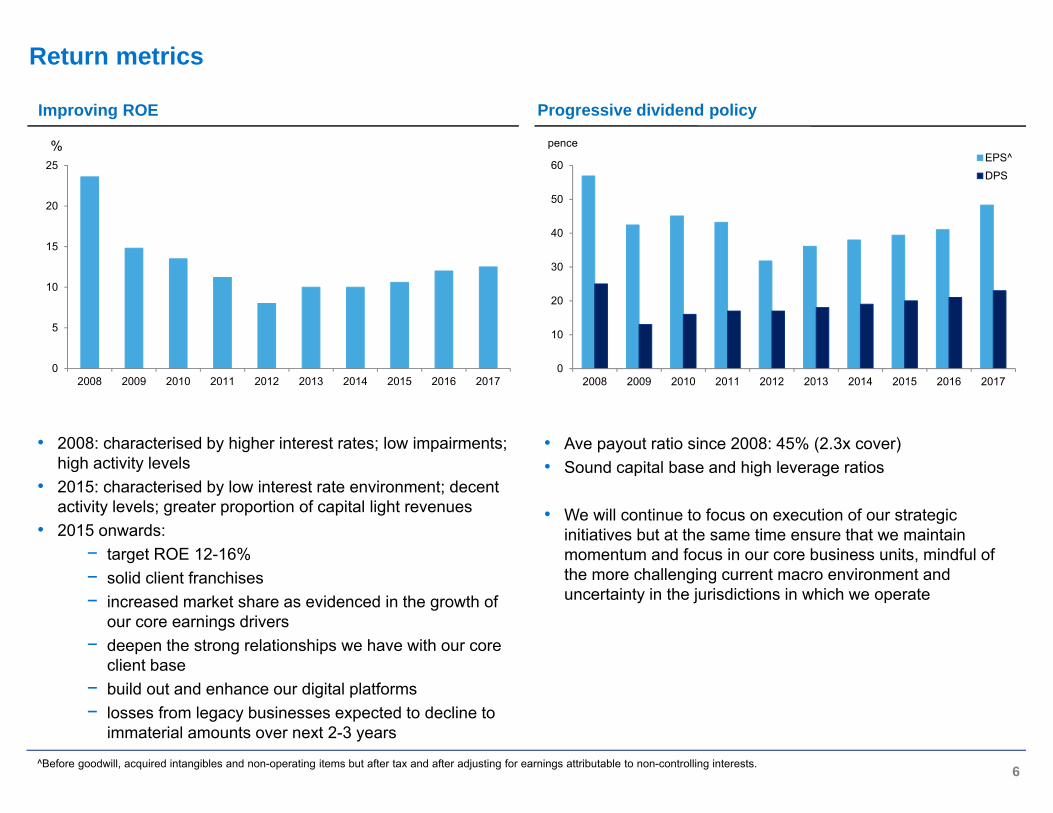
Improving ROE
0
5
10
15
20
25
2008 2009 2010 2011 2012 2013 2014 2015 2016 2017
%
• 2008: characterised by higher interest rates; low impairments; high activity levels
• 2015: characterised by low interest rate environment; decent activity levels; greater proportion of capital light revenues
• 2015 onwards: − target ROE 12-16%− solid client franchises− increased market share as evidenced in the growth of
our core earnings drivers− deepen the strong relationships we have with our core
client base− build out and enhance our digital platforms− losses from legacy businesses expected to decline to
immaterial amounts over next 2-3 years
Progressive dividend policy
0
10
20
30
40
50
60
2008 2009 2010 2011 2012 2013 2014 2015 2016 2017
penceEPS^DPS
^Before goodwill, acquired intangibles and non-operating items but after tax and after adjusting for earnings attributable to non-controlling interests.
• Ave payout ratio since 2008: 45% (2.3x cover)• Sound capital base and high leverage ratios
• We will continue to focus on execution of our strategic initiatives but at the same time ensure that we maintain momentum and focus in our core business units, mindful of the more challenging current macro environment and uncertainty in the jurisdictions in which we operate
Return metrics

Diversified revenue streams with high annuity base
• Balanced business model comprising three distinct business activities; Asset Management, Wealth & Investment and Specialist Banking
• Continued focus on growing our capital light business, currently 56% of income
• High level of annuity revenue*: 72% of total operating income
• Solid net inflows of third party FUM
• Simplification of banking business resulting in a reduction in legacy portfolio and impairments
Sound balance sheet provides support for our growth initiatives
• Never required shareholder or government support
• Low gearing: 9.5x (2008: 13.8x)
• CET1 plc: 11.5%, CET1 Ltd: 9.9%
• Leverage plc: 7.8%, Leverage Ltd: 7.3%, a high ratio vs peers – provides comfort in our CET1 target level
• Surplus cash: £12.0bn - high level of readily available, high quality liquid assets representing c.25% - 35% of our liability base
• Progressive dividend policy
Solid franchise
• Operating in South Africa since 1974 and in the UK since 1992
• Investec plc listed on the LSE in 2002
• Leading player across our businesses and growing our Specialist Bank franchise in the UK
Strong culture
• Stable management - senior management team average tenor of c.15 – 20 years (founders still on our board)
• Strong, entrepreneurial culture balanced with a strong risk awareness
• Employee ownership – long-standing philosophy
* Where annuity income is net interest income and annuity fees 7
In summary

Appendix – further information on our businesses

• Organically built an independent global platform from an emerging market base
• Independently managed entity within the Investec group • Competitive investment performance in chosen specialities• Global approach to: investing –client base –operations platform • Institutional and advisor focus• Unique and clearly understood culture • Stable and experienced leadership • Committed to investing for a sustainable future
Asset Management: Global specialist investment manager
Value proposition
Core investment capabilities• Equity• Fixed Income• Multi-Asset• Alternatives
Client base• Our client group is
organised across five geographically defined units (United Kingdom, Africa, Americas, Asia Pacific and Europe) serving our global client base
Business profile
9
Recognition
26-year growth storyThird party FUM have grown from £41.8mn in 1991 to £95.3bnin 26 years
European Pensions:Emerging Markets
Manager of the Year2015
Professional PensionsInvestment Awards:Multi Asset Manager
of the Year2015
3 core areas of activity
-
20
40
60
80
100
120
140
160
180
- 10 20 30 40 50 60 70 80 90
100
1992
1993
1994
1995
1996
1997
1998
1999
2000
2001
2002
2003
2004
2005
2006
2007
2008
2009
2010
2011
2012
2013
2014
2015
2016
2017
£’mn£’bn
AUM (LHS)
Net profit before tax and non-controlling interests (RHS)

41
28
20
47
Mar-17
Equities
Fixed income
Multi-asset
Alternatives
Third party funds onadvisory platform
• Fees earned on FUM• Performance fees historically c.10% -
15% of revenue• Average fees 55bps to 65bps• Average net inflows/(outflows):
• Year to Mar 13: £4.1bn• Year to Mar 14: £2.6bn• Year to Mar 15: £3.1bn• Year to Mar 16: £3.2bn• Year to Mar 17: £(0.6)bn
Key income drivers (besides market levels)
10
0
10
20
30
40
50
60
70
80
90
100
-
20
40
60
80
100
120
140
160
180
200
2008 2009 2010 2011 2012 2013 2014 2015 2016 2017
%£’mn
Ordinary shareholders' equityROE post-tax
• Number of employees: 1 550• Cost to income: 66.9%• ROE post-tax: 73.9%• Pre-tax profit: £164.8mn• % contribution to group profit: 27.5%
Current positioning
0
10
20
30
40
2008 2009 2010 2011 2012 2013 2014 2015 2016 2017
%
Operating margin
Net inflows as a % of opening AUM
Average income^ as a % of AUM
Shareholders’ equity and ROE
AUM by asset class
(%)
^The average income yield on funds under management represents the total operating income for the period as a percentage of the average of opening and closing funds under management. This calculation does not take into account the impact of market movements throughout the period on funds under management or the timing of acquisitions and disposals during the respective periods.
Asset Management: Key income drivers and performance statistics
-5
0
5
10
15
20
2008 2009 2010 2011 2012 2013 2014 2015 2016 2017
%
0
0.2
0.4
0.6
0.8
1
2008 2009 2010 2011 2012 2013 2014 2015 2016 2017
%
3 core areas of activity

• Investec Wealth & Investment has been built via the acquisition and integration of businesses and organic growth over a long period of time
• Well established platforms in the UK, South Africa, Switzerland, Republic of Ireland and Guernsey
• The business currently has four distinct channels: direct, intermediaries, charities and international, and is well progressed with the development of its online capabilities to form a fifth ‘digital’ distribution channel
• Strategy to internationalise within jurisdictions where the group already has an established business
• Focus is on organic growth in our key markets and enhancing our range of services for the benefit of our clients
Value proposition
Services offered• Portfolio management• Stockbroking• Alternative investments• Investment advisory services• Electronic trading services• Retirement and succession
planning
Client base• HNW• Professional individuals• Charities• Pension funds• Trusts
Business profile
11
Recognition
Wealth & Investment: Building an international platform
-
10
20
30
40
50
60
2004 2005 2006 2007 2008 2009 2010 2011 2012 2013 2014 2015 2016 2017
£’bn
Discretionary and annuity Non-discretionary
Best Private Bank and Wealth Manager, South Africa
(For 5 years in a row)
Winner of DefaqtoGold Discretionary Fund Manager service award 2016
3 core areas of activity
Funds under management of £54.8bn

• Investment management fees earned on FUM (largely equity mandates)
• Commissions earned for execution• UK: Largely discretionary FUM with
average fees 80bps to 90bps• SA: largely non-discretionary
portfolio/model, but discretionary and other annuity assets are growing
Key income drivers (besides market levels)
12
• Number of employees: 1 600• Cost to income: 74.1%• ROE post-tax: 29.1% • Pre-tax profit*: £93.2mn• % contribution to group profit: 15.6%
Current positioning
Operating margin
Net inflows as a % of opening AUM
Average income^ as a % of AUM
^The average income yield on funds under management represents the total operating income for the period as a percentage of the average of opening and closing funds under management. This calculation does not take into account the impact of market movements throughout the period on funds under management or the timing of acquisitions and disposals during the respective periods.
0102030405060708090
-
50
100
150
200
250
300
350
2008 2009 2010 2011 2012 2013 2014 2015 2016 2017
%£’mn
Ordinary shareholders' equityROE post-tax
Shareholders’ equity and ROE
Wealth & Investment: Key income drivers and performance statistics
0
10
20
30
40
2011 2012 2013 2014 2015 2016 2017
%
Group UK SA
0
0.2
0.4
0.6
0.8
1
2011 2012 2013 2014 2015 2016 2017
%
Group UK SA
-6
-4
-2
0
2
4
6
8
2011 2012 2013 2014 2015 2016 2017
%
*
3 core areas of activity

Corporate and Institutional Banking
13
Business profile
Value proposition
• High quality specialist banking solution to corporate and private clients with leading positions in selected areas• Provide high touch personalised service – ability to execute quickly• Ability to leverage international, cross-border platforms• Well positioned to capture opportunities between the developed and emerging world – internationally mobile• Strong ability to originate, manufacture and distribute• Balanced business model with good business depth and breadth
Specialist Banking
3 core areas of activity
• Principal investments
• Property investment fund management
Investment activities• Treasury and trading services• Specialised lending, funds and debt capital markets• Institutional research sales and trading• Advisory
Corporate and Institutional Banking activities• Transactional banking and foreign
exchange• Lending • Deposits• Investments
Private Banking activities
Best Service from an Asset Based Finance Provider (Business Moneyfacts)
Best current account for high earners
Corporate / Institutional / Government clients High net worth and high income private clients

0
100
200
300
400
500
2008 2009 2010 2011 2012 2013 2014 2015 2016 2017
£’mn
• Net interest: levels of loans; surplus cash; deposits
• Fees and commissions: levels of private and corporate client activity
• Investment income: realised and unrealised returns earned on our investment; fixed income and property trading portfolios
• Customer flow trading income: level of client activity
Key income drivers (besides market, economic and rate levels)
14
• Number of employees: 5 879• Cost to income: 60.6%• ROE post-tax: 10.5% • Pre-tax profit: £389.8mn• % contribution to group profit: 65.0%
Current positioning
Specialist Banking: Key income drivers and performance statistics
Net interest income Net fees and commissions
CostsInvestment, associate and trading income
Impairments
0
100
200
300
400
500
2008 2009 2010 2011 2012 2013 2014 2015 2016 2017
£’mn
These trends are for the global Specialist Banking business and include the legacy business in the UK
0
0.5
1
1.5
2
2.5
3
0
200
400
600
800
2008 2009 2010 2011 2012 2013 2014 2015 2016 2017
%£’mn
Net interest income Ave net margin %
0
200
400
600
800
1000
2008 2009 2010 2011 2012 2013 2014 2015 2016 2017
£’mn
0
100
200
300
400
2008 2009 2010 2011 2012 2013 2014 2015 2016 2017
£’mn
3 core areas of activity
Debt repurchases

0.0%
1.0%
2.0%
3.0%
4.0%
5.0%
0
5
10
15
20
25
2008 2009 2010 2011 2012 2013 2014 2015 2016 2017
£’bn
Core loans (LHS)
Credit loss ratio (RHS)
Net default loans before collateral as a % of core loans (RHS)
-5
0
5
10
15
2008 2009 2010 2011 2012 2013 2014 2015 2016 2017
15
Specialist Banking: Key income drivers and performance statistics
0
5
10
15
20
25
-
500
1,000
1,500
2,000
2,500
3,000
3,500
2008 2009 2010 2011 2012 2013 2014 2015 2016 2017
%£’mn
Ordinary shareholders' equity ROE post-tax
Cost to income ratio
Growth in core loans Shareholders’ equity and ROE
Growth in RWA
% stable currency
n/a
Asset quality
RWA in FY15 impacted by the sale of group assets
0
10
20
30
40
50
60
70
2008 2009 2010 2011 2012 2013 2014 2015 2016 2017
%
0
10
20
30
40
2008 2009 2010 2011 2012 2013 2014 2015 2016 2017
% stable currency
3 core areas of activity
These trends are for the global Specialist Banking business and include the legacy business in the UK

16
Shareholders’ equity and ROEAsset quality
0.0%
0.5%
1.0%
0
1
2
3
4
5
6
7
8
9
2011 2012 2013 2014 2015 2016 2017
£’bn
Core loans (LHS)
Credit loss ratio (RHS)
Costs
UK ongoing Specialist Banking: Key income drivers and performance statistics in Pounds
Cost to income ratio
0102030405060708090
2011 2012 2013 2014 2015 2016 2017
%
Revenue
0
2
4
6
8
10
12
14
16
18
0.0
0.5
1.0
1.5
2.0
2011 2012 2013 2014 2015 2016 2017
%£’bn
Ordinary shareholders' equity
ROE post-tax
0
10
20
30
40
50
60
70
80
0
2
4
6
8
10
12
2011 2012 2013 2014 2015 2016 2017
£’bn
Net core loans and advances
Customer deposits (accounts)
Loans as a % of customer deposits
Loans and deposits
%
0
100
200
300
400
500
600
700
800
2011 2012 2013 2014 2015 2016 2017
£’mn
0
100
200
300
400
500
600
2011 2012 2013 2014 2015 2016 2017
£’mn
3 core areas of activity
17
0
4
8
12
16
20
0
5
10
15
20
25
30
35
2010 2011 2012 2013 2014 2015 2016 2017
%R’bn
Ordinary shareholders' equity
ROE post-tax
Shareholders’ equity and ROEAsset quality
0%
1%
2%
3%
4%
5%
0
50
100
150
200
250
2010 2011 2012 2013 2014 2015 2016 2017
R’bn
Core loans (LHS)
Credit loss ratio (RHS)
Net default loans before collateral as a % of core loans (RHS)
Costs
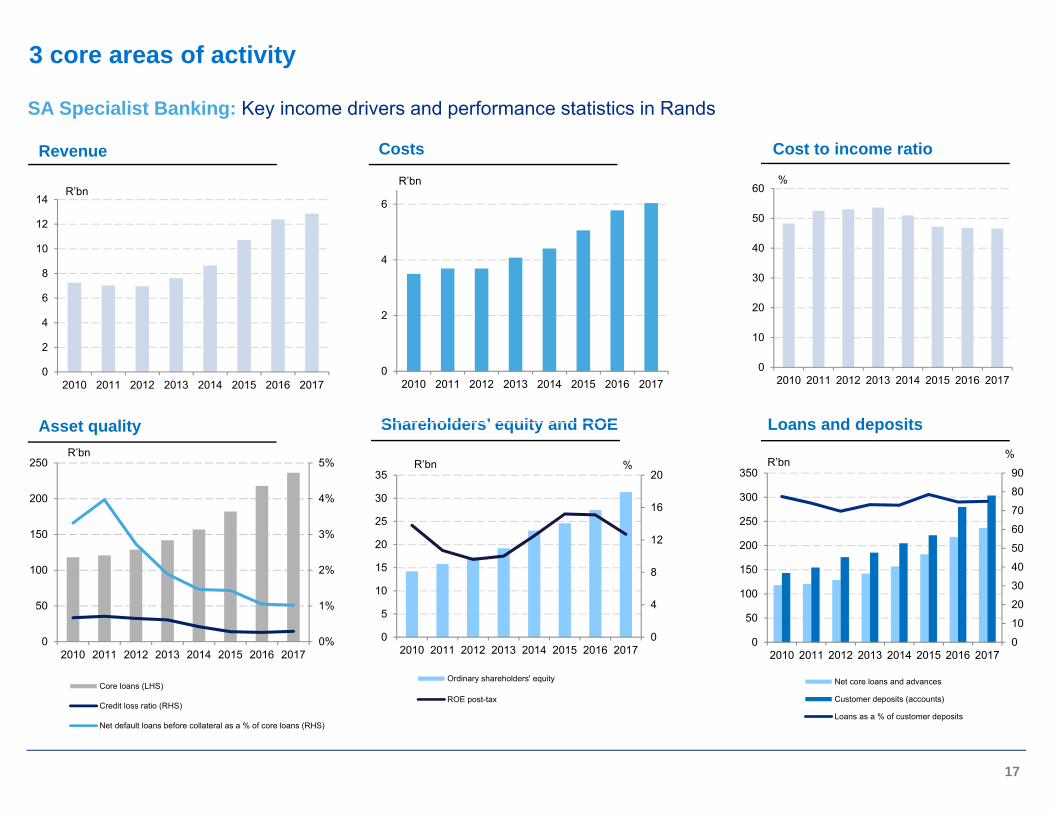
SA Specialist Banking: Key income drivers and performance statistics in Rands
Cost to income ratio
0
10
20
30
40
50
60
2010 2011 2012 2013 2014 2015 2016 2017
%
Revenue
0
2
4
6
8
10
12
14
2010 2011 2012 2013 2014 2015 2016 2017
R’bn
0
2
4
6
2010 2011 2012 2013 2014 2015 2016 2017
R’bn
0
10
20
30
40
50
60
70
80
90
0
50
100
150
200
250
300
350
2010 2011 2012 2013 2014 2015 2016 2017
R’bn
Net core loans and advances
Customer deposits (accounts)
Loans as a % of customer deposits
Loans and deposits%
3 core areas of activity
18
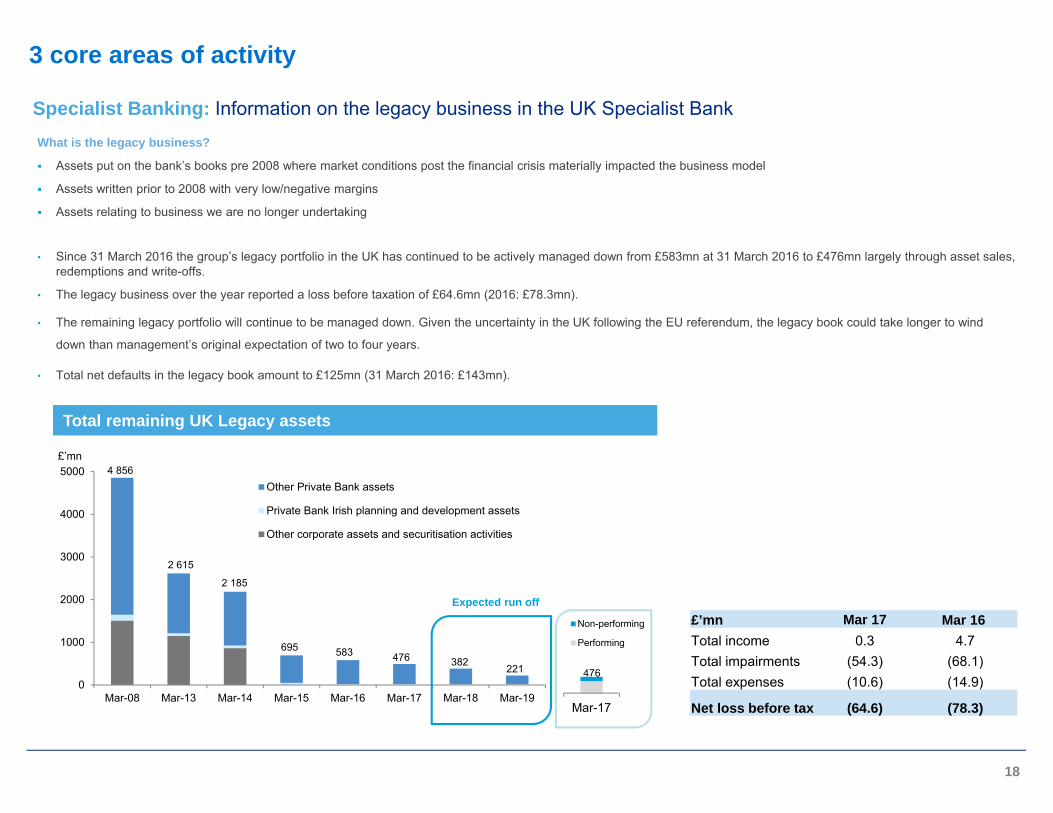
Specialist Banking: Information on the legacy business in the UK Specialist BankWhat is the legacy business?
Assets put on the bank’s books pre 2008 where market conditions post the financial crisis materially impacted the business model
Assets written prior to 2008 with very low/negative margins
Assets relating to business we are no longer undertaking
• Since 31 March 2016 the group’s legacy portfolio in the UK has continued to be actively managed down from £583mn at 31 March 2016 to £476mn largely through asset sales, redemptions and write-offs.
• The legacy business over the year reported a loss before taxation of £64.6mn (2016: £78.3mn).
• The remaining legacy portfolio will continue to be managed down. Given the uncertainty in the UK following the EU referendum, the legacy book could take longer to wind
down than management’s original expectation of two to four years.
• Total net defaults in the legacy book amount to £125mn (31 March 2016: £143mn).
3 core areas of activity
Total remaining UK Legacy assets Total remaining UK Legacy assets
0
1000
2000
3000
4000
5000
Mar-08 Mar-13 Mar-14 Mar-15 Mar-16 Mar-17 Mar-18 Mar-19
£’mn
Other Private Bank assets
Private Bank Irish planning and development assets
Other corporate assets and securitisation activities
Expected run off
2 615
2 185
695 583 476 382
4 856
221
Mar-17
Non-performing
Performing
476
£’mn Mar 17 Mar 16Total income 0.3 4.7Total impairments (54.3) (68.1)Total expenses (10.6) (14.9)
Net loss before tax (64.6) (78.3)

Appendix – further information on our strategic positioning
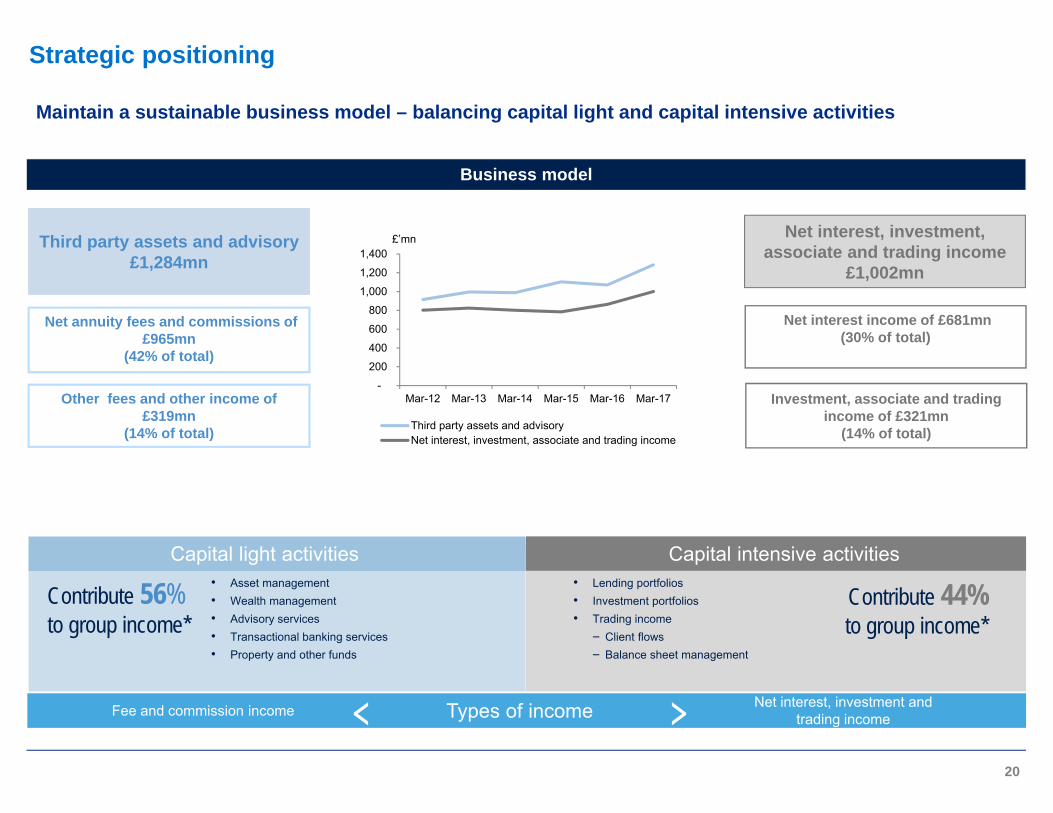
Types of income Net interest, investment and trading incomeFee and commission income < >
Net annuity fees and commissions of £965mn
(42% of total)
Other fees and other income of £319mn
(14% of total)
Net interest income of £681mn(30% of total)
Investment, associate and trading income of £321mn
(14% of total)
Net interest, investment, associate and trading income
£1,002mn
Third party assets and advisory£1,284mn
Business model
Capital light activities Capital intensive activities
Contribute 56% to group income*
Contribute 44% to group income*
• Asset management• Wealth management• Advisory services• Transactional banking services• Property and other funds
• Lending portfolios• Investment portfolios• Trading income
‒ Client flows‒ Balance sheet management
Maintain a sustainable business model – balancing capital light and capital intensive activities
20
Strategic positioning
-
200
400
600
800
1,000
1,200
1,400
Mar-12 Mar-13 Mar-14 Mar-15 Mar-16 Mar-17
£’mn
Third party assets and advisoryNet interest, investment, associate and trading income

2016 2017
2016 2017
£639 mn
£(718) mn
£61 mn
£861 mn
£(1 308) mn
Africa
Americas
Europe
Asia Pacific
Including United
Kingdom
Including Middle East
£1 457 mn
2016 2017
£1 393 mn
£229 mn
2016 2017
Asset Management
21
• Continue to focus on clients, people and long-term growth• Investment performance• Grow in the Advisor channel• Focus on our large markets, especially North America• Continue to scale Multi-asset and Global Equities• Continue to nurture a limited number of long-term growth initiatives• Invest in, motivate and lead our people
*AUM as at 31 March 2017, based on location of stock. South Africa is included within Emerging Markets on an asset exposure basis.
Strategic positioning
AUM Exposure by Asset Exposure*
Emerging Markets
59%
Developed Markets
41%
Net Flows by Region (FY2017 and FY2016)
Wealth & Investment
22
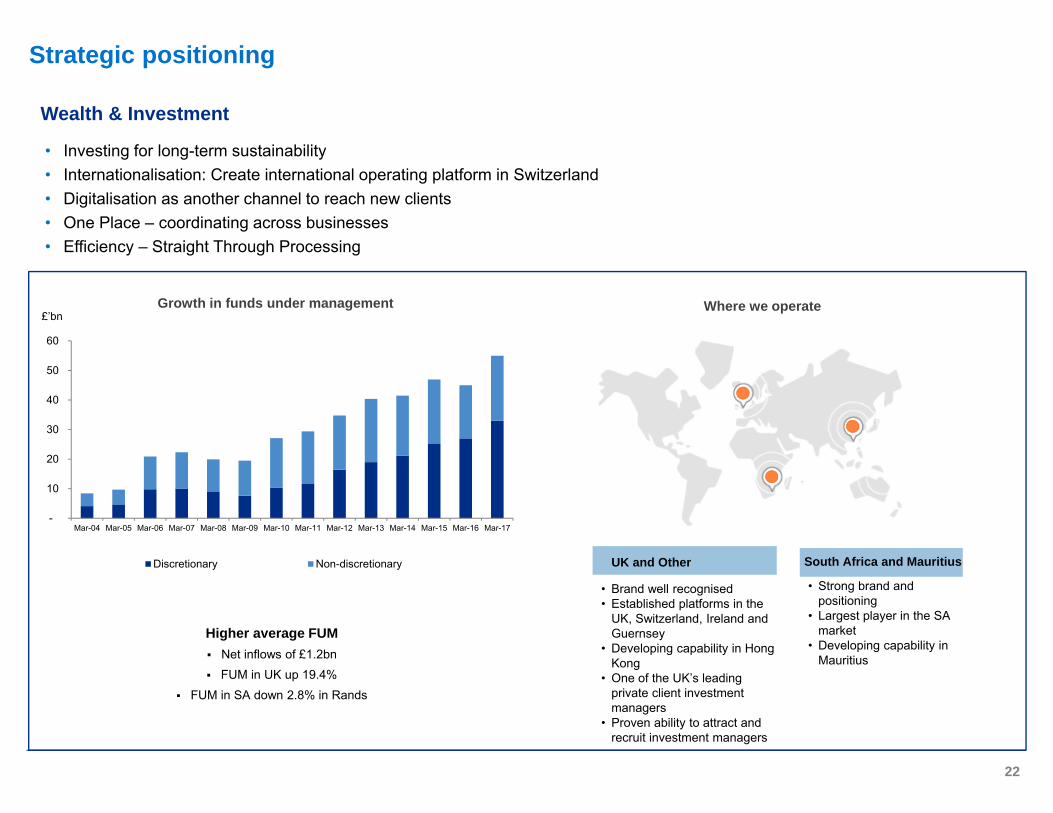
• Investing for long-term sustainability• Internationalisation: Create international operating platform in Switzerland• Digitalisation as another channel to reach new clients• One Place – coordinating across businesses• Efficiency – Straight Through Processing
• Brand well recognised• Established platforms in the
UK, Switzerland, Ireland and Guernsey
• Developing capability in Hong Kong
• One of the UK’s leading private client investment managers
• Proven ability to attract and recruit investment managers
UK and Other South Africa and Mauritius
• Strong brand and positioning
• Largest player in the SA market
• Developing capability in Mauritius
Strategic positioning
Higher average FUM Net inflows of £1.2bn FUM in UK up 19.4%
FUM in SA down 2.8% in Rands
-
10
20
30
40
50
60
Mar-04 Mar-05 Mar-06 Mar-07 Mar-08 Mar-09 Mar-10 Mar-11 Mar-12 Mar-13 Mar-14 Mar-15 Mar-16 Mar-17
£’bn
Discretionary Non-discretionary
Growth in funds under management Where we operate

-50
50
150
250
350
450
550
650
750
850
Mar-11 Mar-12 Mar-13 Mar-14 Mar-15 Mar-16 Mar-17
Otheroperatingincome
Customer flowtrading income
Investmentincome
Net fees
Net interestincome
£'mn
Specialist Banking UK and Other – Positioning of the Ongoing (ex legacy) business
23
Strategic positioning
Franchise value• Domestically relevant and
internationally networked
• Built a solid HNW franchise
• Very strong in mid-cap with a full service offering
• Good corporate finance business
• Strong corporate treasury business
• Sound niches in specialisations:o Fund finance
o Asset finance
o Aircraft finance
o Power and infrastructure finance
Analysis of income
Generating average income of £584mn per year over past 7 years
Avg value since 2011
£28mn
£78mn
£88mn
£188mn
£201mn

Specialist Banking UK & Other Ongoing (ex legacy) business – Strategic Priorities
25
Build a domestically relevant Private Bank— Shifting from product based model to client
centric model focusing on HNW and active entrepreneurs
— Building the processes, products and people
Broaden client base by building franchise while deepening client relationship— Deeper and broader into small and mid
corporate market
— Incrementally add new products and services
Improve coordination across business units and geographies
Focus on reducing and managing costs
Net profit (before tax) ROE (post tax)
Strategic positioning
11.4% 11.5%
0%
4%
8%
12%
16%
20%
0
40
80
120
160
200
Mar-12 Mar-13 Mar-14 Mar-15 Mar-16 Mar-17
£'mn
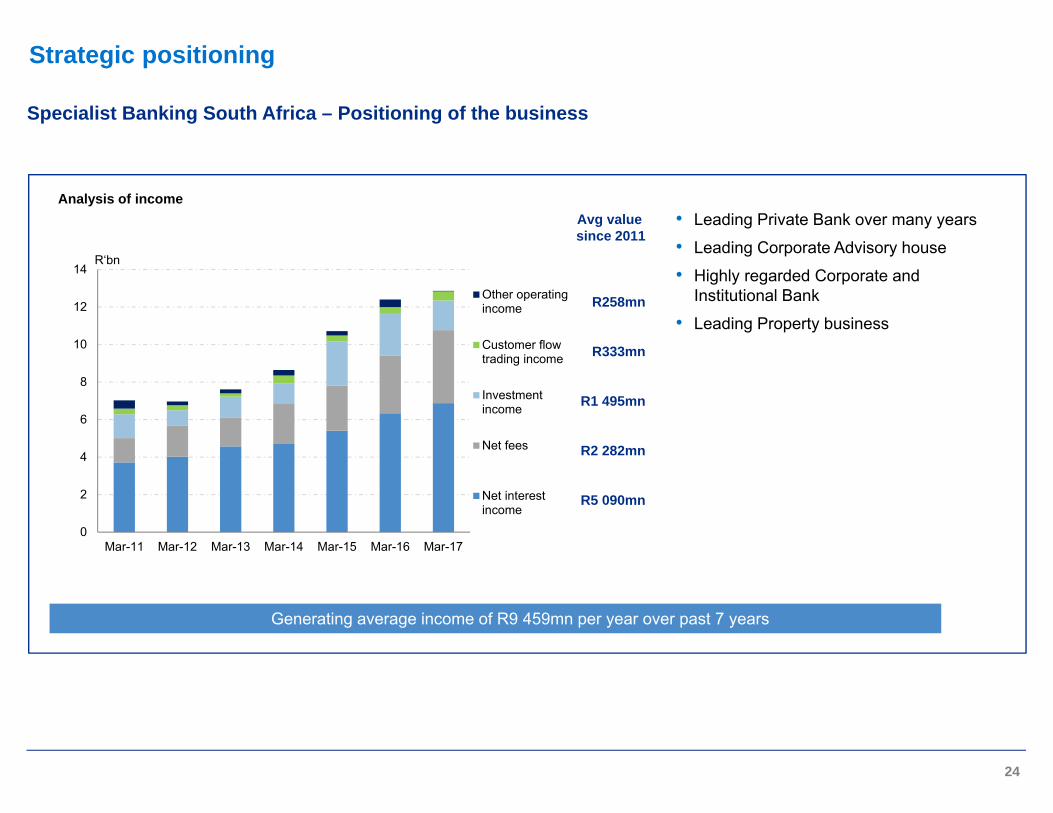
Specialist Banking South Africa – Positioning of the business
24
Strategic positioning
0
2
4
6
8
10
12
14
Mar-11 Mar-12 Mar-13 Mar-14 Mar-15 Mar-16 Mar-17
Other operatingincome
Customer flowtrading income
Investmentincome
Net fees
Net interestincome
R‘bn
Franchise value• Leading Private Bank over many years
• Leading Corporate Advisory house
• Highly regarded Corporate and Institutional Bank
• Leading Property business
Avg value since 2011
R258mn
R333mn
R1 495mn
R2 282mn
R5 090mn
Analysis of income
Generating average income of R9 459mn per year over past 7 years
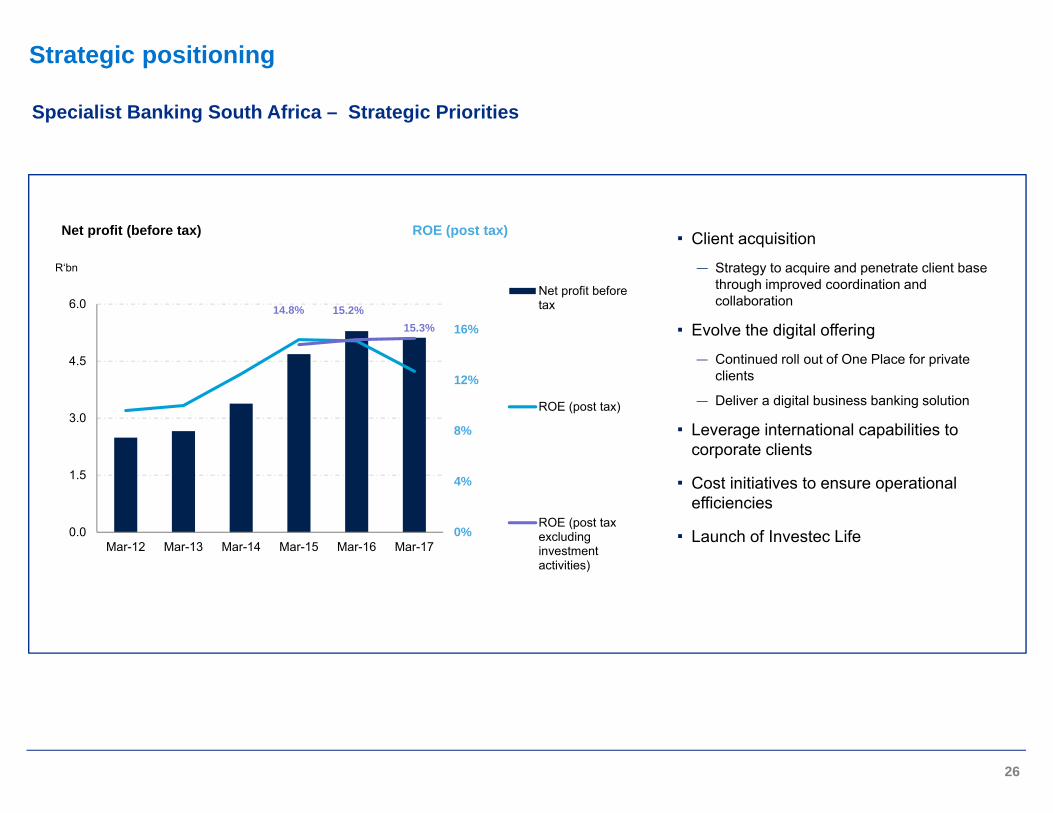
Specialist Banking South Africa – Strategic Priorities
26
Client acquisition — Strategy to acquire and penetrate client base
through improved coordination and collaboration
Evolve the digital offering— Continued roll out of One Place for private
clients
— Deliver a digital business banking solution
Leverage international capabilities to corporate clients
Cost initiatives to ensure operational efficiencies
Launch of Investec Life
Net profit (before tax) ROE (post tax)
Strategic positioning
14.8% 15.2%15.3%
0%
4%
8%
12%
16%
0.0
1.5
3.0
4.5
6.0
Mar-12 Mar-13 Mar-14 Mar-15 Mar-16 Mar-17
Net profit beforetax
ROE (post tax)
ROE (post taxexcludinginvestmentactivities)
R‘bn

In summary – focused on growth and shareholder return
28
• Over the past few years we have been through a significant transition as a firm, realigning our business model and at the same time positioning our organisation for the next phase of growth
• We have appointed many new leaders, at both a global level and a business unit level, to enable us to successfully shift the organisation. They have settled into their roles and are motivated to build their businesses and drive growth
• Our businesses are focused on improving the quality of earnings and leveraging our unique client profile to provide the best and most integrated client experience
• We have spent time with staff perpetuating our culture and entrenching our values and remain committed to engaging with all our stakeholders, investing in our people and our communities and driving returns for our shareholders
• Strong coordination across business and geography is key to our future success as an organisation
Strategic positioning

Appendix – financial analysis and track record

29*Where annuity income is net interest income and annuity fees.
We have a solid base of recurring income
Average since 2008 of 68%
0%
10%
20%
30%
40%
50%
60%
70%
80%
0
500
1000
1500
2000
2500
2008 2009 2010 2011 2012 2013 2014 2015 2016 2017
£’mn
Net interest income Annuity fees and commissions Other fees and other operating income
Investment and associate income Trading income Annuity income* as a % of total income

0%
20%
40%
60%
80%
100%
120%
-
5
10
15
20
25
30
35
2008 2009 2010 2011 2012 2013 2014 2015 2016 2017
£’bn
Customer deposits (LHS)
Core loans and advances to customers (LHS)
Core loans (excluding own originated securitised assets) to customer deposits(RHS)
Deposits: an increase of 21.1% to £29.1bn (an increase of 5.5% on a currency neutral basis)Core loans: an increase of 25.3% to £22.7bn (an increase of 7.6% on a currency neutral basis)
-
20
40
60
80
100
120
140
160
2008 2009 2010 2011 2012 2013 2014 2015 2016 2017
£’bn
Asset Management Wealth & Investment Other
AUM have increased by 23.9% to £150.7bn since 31 March 2016 (an increase of 14.8% on a currency neutral basis)
30
CAGR since 2008 - customer deposits 10%
Third party assets under management^ Core loans and advances and deposits^
CAGR since 2008 of 12.4% CAGR since 2008 - loans 6%
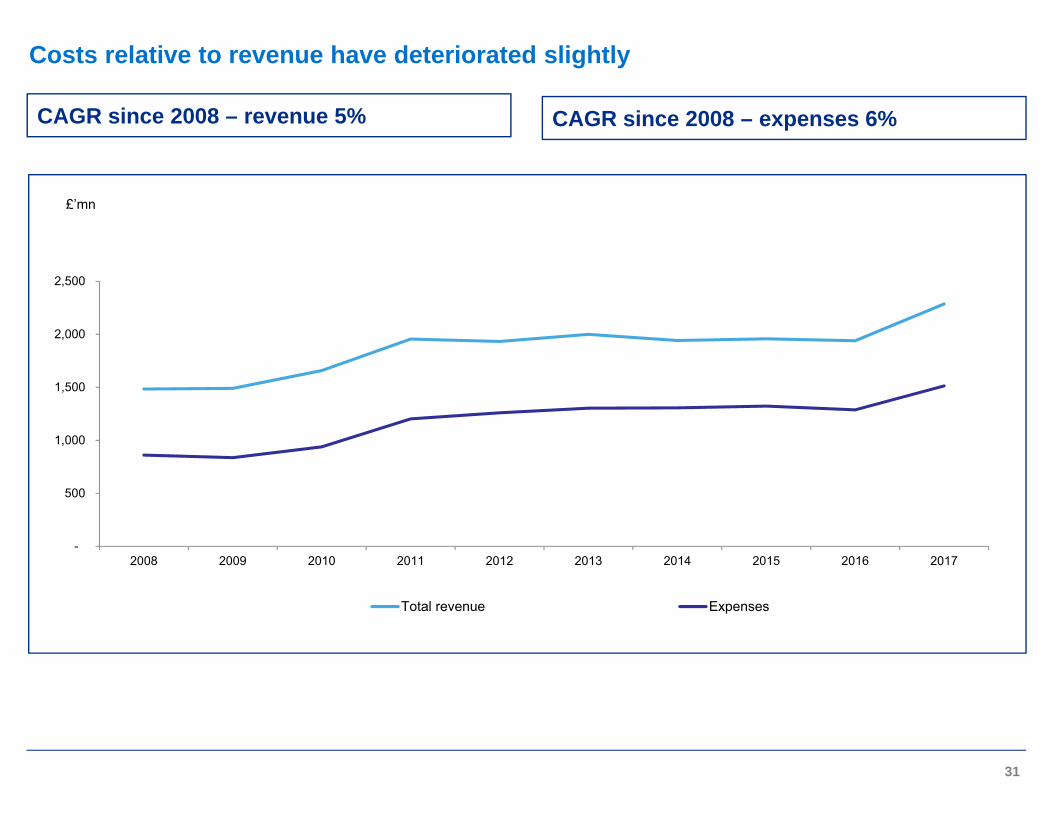
Driven by strong growth in assets under management and loans and deposits
31
-
500
1,000
1,500
2,000
2,500
2008 2009 2010 2011 2012 2013 2014 2015 2016 2017
£’mn
Total revenue Expenses
CAGR since 2008 – revenue 5% CAGR since 2008 – expenses 6%
Costs relative to revenue have deteriorated slightly
-
100
200
300
400
500
600
700
800
2008 2009 2010 2011 2012 2013 2014 2015 2016 2017
£’mn
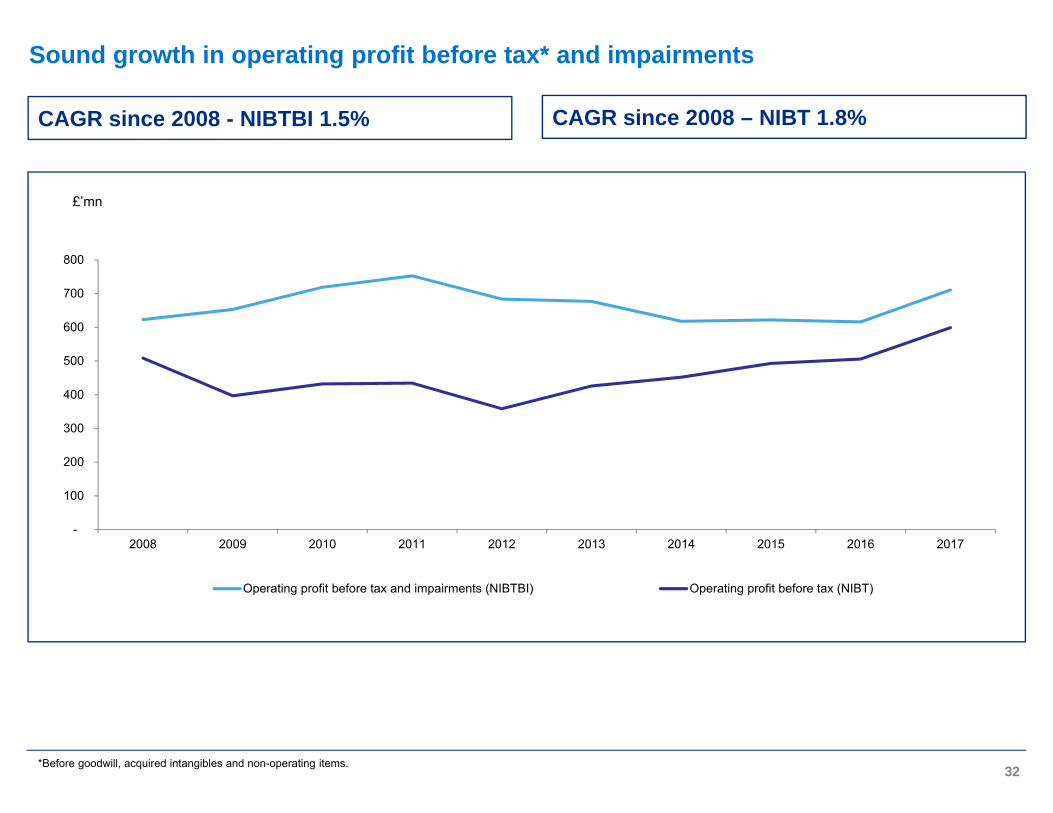
Operating profit before tax and impairments (NIBTBI) Operating profit before tax (NIBT)
CAGR since 2008 - NIBTBI 1.5% CAGR since 2008 – NIBT 1.8%
*Before goodwill, acquired intangibles and non-operating items. 32
Sound growth in operating profit before tax* and impairments

^Before goodwill, acquired intangibles and non-operating items and IAM non-controlling interests. 33
Wealth & InvestmentAsset Management Specialist Banking
-
20
40
60
80
100
120
140
160
180
2008 2009 2010 2011 2012 2013 2014 2015 2016 2017
£’mn Operating profit before tax^
-
10
20
30
40
50
60
70
80
90
100
2008 2009 2010 2011 2012 2013 2014 2015 2016 2017
£’mn Operating profit before tax^
-
50
100
150
200
250
300
350
400
450
500
2010 2011 2012 2013 2014 2015 2016 2017
£’mnOperating profit before tax^
Total Specialist Bank (including legacy)Ongoing business (excluding legacy)
Specialist Banking held back by elevated impairments in the legacy business and relatively lower activity levels, although these drivers are improving

Capital resources CAGR since 2008 of 7% Average 10-year gearing ratio of 11.3x
Total shareholders’ equity and capital resources
34
Strong growth in capital and low gearing
-
1,000
2,000
3,000
4,000
5,000
6,000
7,000
2008 2009 2010 2011 2012 2013 2014 2015 2016 2017
£’mn
Total shareholders’ equity (including preference shares and non-controlling interests)
Total capital resources (including subordinated liabilities)
0
2
4
6
8
10
12
14
16
2008 2009 2010 2011 2012 2013 2014 2015 2016 2017
times
Gearing ratio (assets excluding assurance assets to total equity)
Core loans to equity ratio

-
500
1,000
1,500
2,000
2,500
3,000
3,500
4,000
-
100
200
300
400
500
600
2008 2009 2010 2011 2012 2013 2014 2015 2016 2017
£’mnpence
Net tangible asset value (excluding goodwill) (£'mn) (RHS) Net tangible asset value per share (excluding goodwill) (pence) (LHS)
Share price (pence) (LHS)
35
NTAV per share 6%NTAV 11%
Overall CAGR since 2008

Appendix – financial objectives and track recordRisk fundamentals

• Focused strategy: our clients are our business• Maintain the Investec distinctiveness• Deliver on our financial targets through the cycle:
Target in £ Year to 31 Mar 2017
Year to 31 Mar 2016
ROE:12% - 16% over a
rolling 5 year period**
12.5% 11.5%
Cost to income ratio: <65% 66.3% 66.4%
Dividend cover: 1.7 – 3.5 times on adjusted EPS* 2.1 2.0
Capital adequacy ratio: 14% - 17%Core Tier 1:>10%
plc: 15.1%Ltd: 14.1%
plc: 15.1%Ltd: 14.0%
*Before goodwill, acquired intangibles and non-operating items but after tax and after adjusting for earnings attributable to non-controlling interests.**As revised in Mar 2012. 37
Financial and strategic objectives

*Where ROE is post-tax return on adjusted shareholder’s equity including goodwill and compulsorily convertible debentures.^Divisional ROE’s are disclosed pre-tax - for the purpose of this exercise we have applied the group’s effective tax rate of 18.5% to each division.**As revised in Mar 2012.
Target: ROE*: 12% - 16% over a rolling 5 year period
Asset Management 73.9%
Wealth & Investment 29.1%
Specialist Banking 10.5%
Post tax ROE by business^ (at 31 Mar 2017)
38
0
5
10
15
20
25
2008 2009 2010 2011 2012 2013 2014 2015 2016 2017
%
Financial and strategic objectives**

0
10
20
30
40
50
60
70
80
2008 2009 2010 2011 2012 2013 2014 2015 2016 2017
%
Target: Cost to income ratio: <65%
Asset Management 66.9%
Wealth & Investment 74.1%
Specialist Banking 60.6%
Cost to income by business (at 31 Mar 2017)
target
39
Financial and strategic objectives

Target: Dividend cover of between 1.7 and 3.5 times on adjusted EPS
40
0
10
20
30
40
50
60
2008 2009 2010 2011 2012 2013 2014 2015 2016 2017
pence
EPS^ DPS
^Before goodwill, acquired intangibles and non-operating items but after tax and after adjusting for earnings attributable to non-controlling interests.
Financial and strategic objectives

0
1000
2000
3000
4000
5000
6000
0
5
10
15
20
2008 2009 2010 2011 2012 2013 2014 2015 2016 2017
£’mn%
Total shareholders' equity (RHS)Investec Limited capital adequacy ratio (LHS)Investec plc capital adequacy ratio (LHS)
Capital adequacy target: 14%-17% Core Tier 1 target: >10%
• As we are on the StandardisedApproach in terms of Basel our RWA represent a large portion of our total assets. As a result we inherently hold more capital than our peers who are on the Advanced Approach
• We have continued to grow our capital base throughout the crisis without recourse to government and shareholders. Our total shareholders’ equity has grown by 118% since 2008 to £4.8bn at 31 March 2017 (CAGR of 9% per year)
• Basel III: has had a moderate impact on our ratios
• We have high leverage ratios
41
Financial and strategic objectives

Summary of capital adequacy and leverage ratios
42
As at 31 March 2017 Investec Limited Investec Bank Limited Investec plc Investec Bank plc
Common equity tier 1 (as reported) 9.9% 10.8% 11.3% 12.5%
Common equity tier 1 (fully loaded *) 9.9% 10.8% 11.3% 12.5%
Tier 1 (as reported) 10.7% 11.1% 11.5% 12.5%
Total capital adequacy ratio (as reported) 14.1% 15.4% 15.1% 16.9%
Leverage ratio - permanent capital 7.8% 7.7% 7.8% 8.2%
Leverage ratio – current 7.3% 7.6% 7.8% 8.2%
Leverage ratio - fully loaded* 6.8% 7.4% 7.7% 8.2%
* “Fully loaded” is based on Basel III requirements as fully phased in by 2022.
Financial and strategic objectives

Regulatory leverage ratios - peer group comparisons
Total assets Gearing
• Our core loans and advances have grown moderately over the past few years with the biggest increase in assets representing an increase in our cash and near cash balances.
• We have maintained low gearing ratios with total gearing at 9.5x and an average of c.11.3x since 2008.
• We have high leverage ratios
43
Risk fundamentals: low gearing ratios
Source: as disclosed in financial statements as at May 2017
13.813.0 12.5
11.3 11.3 11.610.3
9.410.2
9.5
5.8 6.25.4
4.7 4.5 4.7 4.3 4.3 4.7 4.7
-
2.0
4.0
6.0
8.0
10.0
12.0
14.0
16.0
2008 2009 2010 2011 2012 2013 2014 2015 2016 2017
times
Total gearing ratio Core loans to equity ratio
-
10,000
20,000
30,000
40,000
50,000
60,000
2008 2009 2010 2011 2012 2013 2014 2015 2016 2017
£’mn
Net core loans and advances Cash and near cash balances Other assets
7.5
4.6
10.3
2.6
4.14.9 5.1
4.1
5.7
0.0
2.0
4.0
6.0
8.0
10.0
12.0
Inve
stec
plc
Bar
clay
s pl
c
Clo
seB
roth
ers
Gro
up
Co-
oper
ativ
eB
ank
plc
HS
BC
Ban
kpl
c
Lloy
dsB
anki
ngG
roup
plc
RB
S G
roup
plc
San
tand
erU
K G
roup
Hol
ding
s pl
c
Sta
ndar
dC
harte
red
plc
%

Cash and near cash balances
Total loans and depositsTotal deposits – increase in retail deposits and reduced reliance on wholesale deposits
• We have a solid customer deposit franchise and are not reliant on wholesale market funding.
• Customer deposits have grown by 140% since 2008 to £29.1bn at 31 March 2017
• We maintain a high level of readily available, high quality liquid assets – representing approx 25% - 35% of our liability base. These balances have increased by 139% since 2008 to £12.0bn at 31 March 2017 (10% CAGR)
• Advances as a percentage of customer deposits is at 76.2%
44
Risk fundamentals: surplus liquidity
Average
0%
20%
40%
60%
80%
100%
120%
-
5,000
10,000
15,000
20,000
25,000
30,000
35,000
2008 2009 2010 2011 2012 2013 2014 2015 2016 2017
£’mn
Net core loans and advances (LHS)Customer accounts (deposits) (LHS)Loans as a % of customer deposits (RHS)
-
5,000
10,000
15,000
20,000
25,000
30,000
35,000
2008 2009 2010 2011 2012 2013 2014 2015 2016 2017
£’mn
Bank deposits Customer accounts (deposits)
Since 2009 £‘bnAve 10.2Min 7.8Max 14.2March 2017 12.0

13%
1%1%
1% 3%1%
21%
16%
9%
3%
5%
15%
5%2%
4%0.3%
Commercial property investment
Commercial property development
Commercial vacant land and planning
Residential investment
Residential property development
Residential vacant land and planning
HNW and private client - mortgages (home loans)
HNW and specialised lending
Acquisition finance
Asset based lending
Fund finance
Other corporate, institutional, govt. loans
Small ticket asset finance
Large ticket asset finance
Project finance
Resource finance and commodities
Risk fundamentals: analysis of our core loan portfolio and counterparty exposures
• Credit and counterparty exposures are to a select target market:• Private Bank lends to high net worth and high income clients
• Corporate and Institutional Banking transacts primarily with mid to large sized corporates, public sector bodies and institutions
• Credit and counterparty exposures are to a select target market• We typically originate loans with the intent of holding these assets to maturity, and thereby developing a ‘hands-on’ and long-
standing relationship with our clients
• The majority of the bank’s credit and counterparty exposures reside within its principal operating geographies, namely South Africa and the UK
45
3 types of lending:
Lending collateralised by property
(19% of total loan portfolio)
High Net Worth (HNW) and
other private client
(38% of total loan portfolio)
Corporate and other
(43% of total loan portfolio)
Gross core loans as at 31 March 2017: £22.9bnLegend – reads clockwise
0
50
100
150
200
250
300
350
Mar-12 Mar-13 Mar-14 Mar-15 Mar-16 Mar-17
£’mn
Legacy andSales*
South Africa
UK and Other
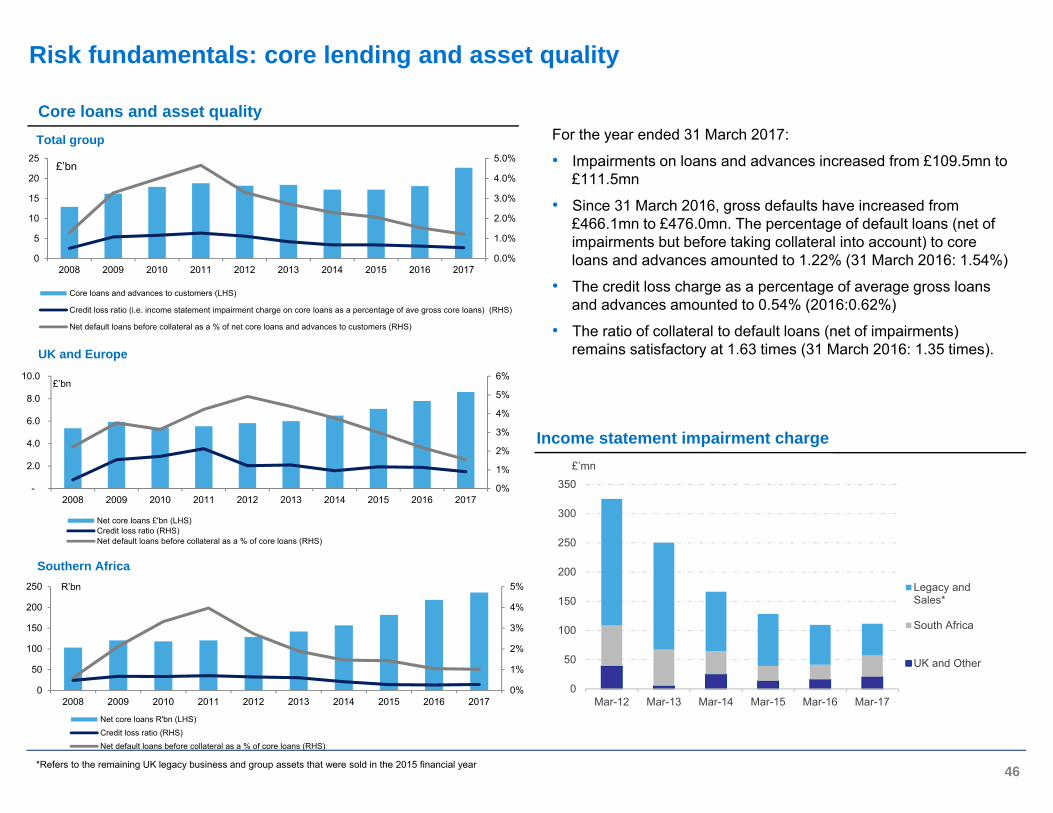
Core loans and asset qualityFor the year ended 31 March 2017:
• Impairments on loans and advances increased from £109.5mn to £111.5mn
• Since 31 March 2016, gross defaults have increased from £466.1mn to £476.0mn. The percentage of default loans (net of impairments but before taking collateral into account) to core loans and advances amounted to 1.22% (31 March 2016: 1.54%)
• The credit loss charge as a percentage of average gross loans and advances amounted to 0.54% (2016:0.62%)
• The ratio of collateral to default loans (net of impairments) remains satisfactory at 1.63 times (31 March 2016: 1.35 times).
0.0%
1.0%
2.0%
3.0%
4.0%
5.0%
0
5
10
15
20
25
2008 2009 2010 2011 2012 2013 2014 2015 2016 2017
£’bn
Core loans and advances to customers (LHS)
Credit loss ratio (i.e. income statement impairment charge on core loans as a percentage of ave gross core loans) (RHS)
Net default loans before collateral as a % of net core loans and advances to customers (RHS)
46
0%
1%
2%
3%
4%
5%
6%
-
2.0
4.0
6.0
8.0
10.0
2008 2009 2010 2011 2012 2013 2014 2015 2016 2017
£’bn
Net core loans £'bn (LHS)Credit loss ratio (RHS)Net default loans before collateral as a % of core loans (RHS)
0%
1%
2%
3%
4%
5%
0
50
100
150
200
250
2008 2009 2010 2011 2012 2013 2014 2015 2016 2017
R’bn
Net core loans R'bn (LHS)Credit loss ratio (RHS)Net default loans before collateral as a % of core loans (RHS)
Southern Africa
UK and Europe
Total group
Income statement impairment charge
Risk fundamentals: core lending and asset quality
*Refers to the remaining UK legacy business and group assets that were sold in the 2015 financial year
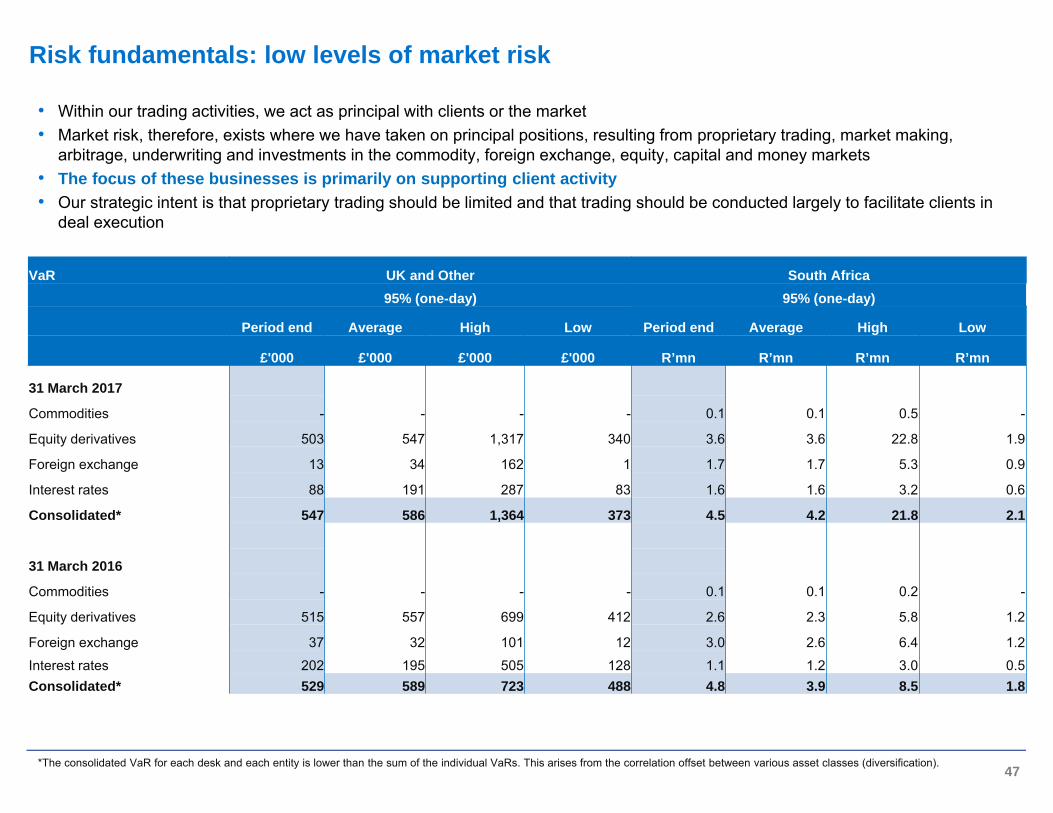
• Within our trading activities, we act as principal with clients or the market• Market risk, therefore, exists where we have taken on principal positions, resulting from proprietary trading, market making,
arbitrage, underwriting and investments in the commodity, foreign exchange, equity, capital and money markets• The focus of these businesses is primarily on supporting client activity• Our strategic intent is that proprietary trading should be limited and that trading should be conducted largely to facilitate clients in
deal execution
47
VaR UK and Other South Africa95% (one-day) 95% (one-day)
Period end Average High Low Period end Average High Low
£'000 £'000 £'000 £'000 R’mn R’mn R’mn R’mn
31 March 2017
Commodities - - - - 0.1 0.1 0.5 -
Equity derivatives 503 547 1,317 340 3.6 3.6 22.8 1.9
Foreign exchange 13 34 162 1 1.7 1.7 5.3 0.9
Interest rates 88 191 287 83 1.6 1.6 3.2 0.6
Consolidated* 547 586 1,364 373 4.5 4.2 21.8 2.1
31 March 2016
Commodities - - - - 0.1 0.1 0.2 -
Equity derivatives 515 557 699 412 2.6 2.3 5.8 1.2
Foreign exchange 37 32 101 12 3.0 2.6 6.4 1.2
Interest rates 202 195 505 128 1.1 1.2 3.0 0.5Consolidated* 529 589 723 488 4.8 3.9 8.5 1.8
*The consolidated VaR for each desk and each entity is lower than the sum of the individual VaRs. This arises from the correlation offset between various asset classes (diversification).
Risk fundamentals: low levels of market risk

Appendix – other information

Investec group - mission statement and values
• Distinctive offering
• Leverage resources
• Break china for the client
• Outstanding talent - empowered, enabled, inspired
• Meritocracy
• Passion, energy, stamina, tenacity
• Entrepreneurial spirit
“We strive to be a distinctive specialist bank and asset manager driven by commitment to our core philosophies and values.”
• Moral strength
• Risk consciousness
• Highest ethical standards
• Respect for others
• Embrace diversity
• Open, honest dialogue
• Unselfish contribution to colleagues, clients, society
Distinctive Performance Dedicated Partnership
Cast-iron IntegrityClient Focus
49

• Since inception we have expanded through a combination of organic growth and strategic acquisitions
• The internationalisation of Investec is based on the following strategy:
• Following our customer base
• Gaining domestic competence and critical mass in the chosen geographies
• Facilitating cross-border transactions and flow
• Our strategy for the past 20 years has been to build a diversified portfolio of businesses and geographies to support clients (institutional, corporate and private individuals) through varying markets and economic cycles
• In order to create a meaningful and balanced portfolio we need proper foundations in place which gain traction over time
• Historically, we have made two types of acquisitions:
• Platform – entry into new market or business activity
• Critical mass enhancing – adding to existing capability
• Focus on organic growth – with select bolt-on / strategic acquisitions
1980s – 1990sDevelop SA business
1992Entered UK market
2002London listing
2003Empowerment deal
2003 - 2009
JSE listingBuilt a strong base from which to internationalise
International drive to boost capability and enhance critical mass
Established Dual Listed Companies structure – primary listings in JHB and London
Empowerment partners acquired a 25.1% stake in Investec Limited
Building a resilient business
2010
Well positioned to capture opportunities
50
History of significant events: introduction
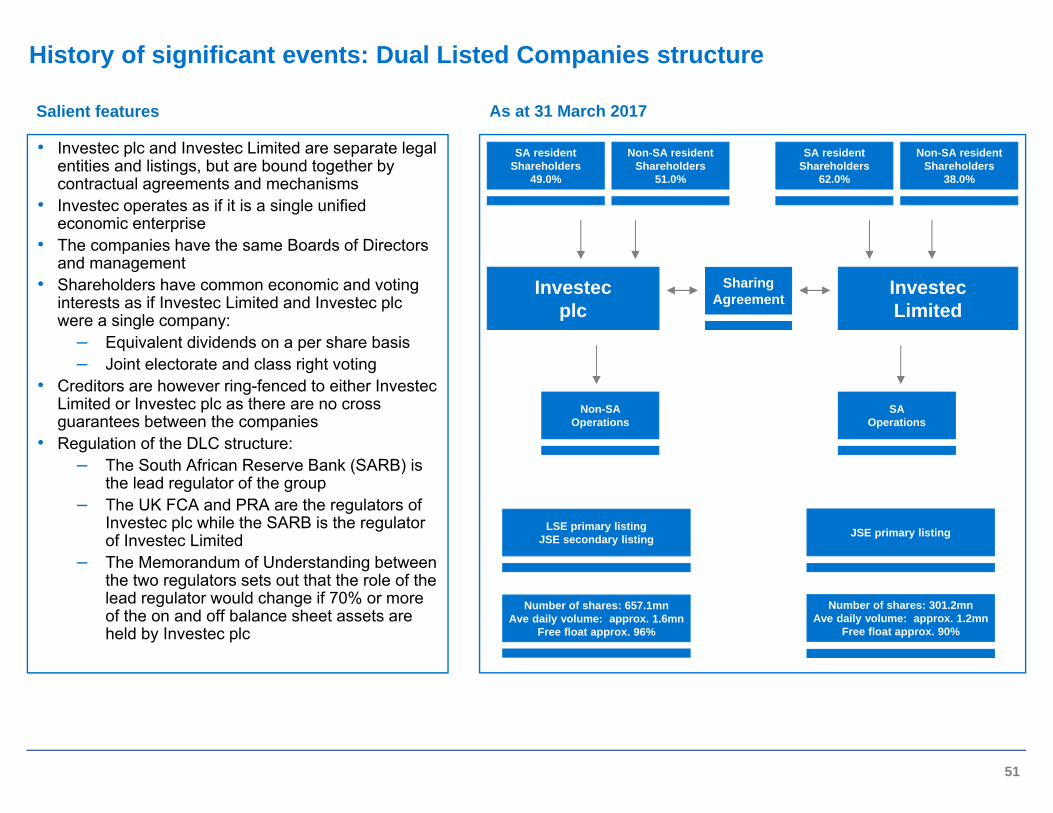
• Investec plc and Investec Limited are separate legal entities and listings, but are bound together by contractual agreements and mechanisms
• Investec operates as if it is a single unified economic enterprise
• The companies have the same Boards of Directors and management
• Shareholders have common economic and voting interests as if Investec Limited and Investec plc were a single company:
– Equivalent dividends on a per share basis– Joint electorate and class right voting
• Creditors are however ring-fenced to either Investec Limited or Investec plc as there are no cross guarantees between the companies
• Regulation of the DLC structure:– The South African Reserve Bank (SARB) is
the lead regulator of the group– The UK FCA and PRA are the regulators of
Investec plc while the SARB is the regulator of Investec Limited
– The Memorandum of Understanding between the two regulators sets out that the role of the lead regulator would change if 70% or more of the on and off balance sheet assets are held by Investec plc
SA residentShareholders
49.0%
Investecplc
As at 31 March 2017
Non-SA residentShareholders
51.0%
SA residentShareholders
62.0%
Non-SA residentShareholders
38.0%
InvestecLimited
SharingAgreement
Non-SAOperations
SAOperations
LSE primary listingJSE secondary listing JSE primary listing
Number of shares: 657.1mnAve daily volume: approx. 1.6mn
Free float approx. 96%
Number of shares: 301.2mnAve daily volume: approx. 1.2mn
Free float approx. 90%
Salient features
51
History of significant events: Dual Listed Companies structure

• Investec’s strategic goals and objectives are motivated by the desire to develop an efficient and integrated business on an international scale through the active pursuit of clearly established core competencies in the group’s principal business areas
Investec – group operating structure
WEALTH & INVESTMENT
• Portfolio management
• Stockbroking
• Alternative investments
• Investment advisory services
• Electronic trading services
• Retirement portfolios
• Southern Africa
• UK and Europe
INVESTMENT ACTIVITIES
• Principal investments
• Property investment fund management
• Australia
• Hong Kong
• Southern Africa
• UK and Europe
• USA
GROUP SERVICES AND OTHER ACTIVITIES- Central Services - Central Funding
• Transactional banking and foreign exchange
• Lending
• Deposits
• Investments
• Southern Africa
• UK and Europe
PRIVATE BANKING
ACTIVITIES
CORPORATE ANDINSTITUTIONAL
BANKINGACTIVITIES
• Treasury and trading services
• Specialised lending, funds and debt capital markets
• Institutional research, sales and trading
• Advisory
• Australia
• Hong Kong
• India
• Southern Africa
• UK and Europe
• USA
ASSET MANAGEMENT
• Equities
• Fixed income
• Multi Asset
• Alternatives
• Africa
• Americas
• Asia Pacific
• Europe
• UK
Asset management and wealth management Specialist banking
52

53
We have invested in our Brand
…our Communities
… and the Planet
…our People

54
Sale of businesses• During FY15 the group sold a number of businesses namely, Investec Bank (Australia) Limited, Kensington Group plc
and Start Mortgage Holdings Limited.
Impact of these sales on our operational performance• The sales of these businesses had a significant effect on the comparability of our financial statutory position and results, particularly in financial
year 2015 and 2016• In order to present a more meaningful view of our performance, additional management information is presented on our ongoing businesses.
The additional information presented on an ongoing basis excludes items, that in management’s view, could distort the comparison of performance between periods (for both current and historical information). Based on this principle, the following items are excluded from underlying statutory profit (for both current and historical information where applicable) to derive ongoing operating profit:
– The results of the businesses sold as mentioned above– The remaining legacy business in the UK (as set out in earlier slides).
• All information is presented on a statutory basis unless otherwise indicated.
Investec Equity Partners• In South Africa a new investment vehicle, Investec Equity Partners (IEP), was created on 11 January 2016 in which Investec holds a 45% stake
alongside other strategic investors who hold the remaining 55%.• Investec Principal Investments transferred certain portfolio investments to the value of R7.6 billion to IEP. In exchange Investec received R2.5
billion in cash and 45% of the shares of IEP (R5.1 billion), reflected as an associate on the balance sheet.• Since the date of the transaction Investec has applied the equity accounting method to account for its investment in the new vehicle as
opposed to the fair value accounting method previously applied to the underlying investments held.
Financial: understanding our FY 2017 results

*Before goodwill, acquired intangibles, non-operating items, taxation and after other non-controlling interests.^Before goodwill, acquired intangibles, non-operating items and after non-controlling interests.
Investec group consolidated results
Statutory Year to
31 March 2017
Statutory Year to
31 March 2016 % changeIncome statement
Adjusted earnings attributable to ordinary shareholders before goodwill, acquired intangibles and non-operating items (£'000) 434,504 359,732 20.8%Operating profit* (£'000) 599,121 505,593 18.5%Balance sheetTotal capital resources (including subordinated liabilities) (£'million) 6,221 4,994 24.4%Total shareholders' equity (including preference shares and non-controlling interests (£'million) 4,809 3,859 24.6%Total assets (£'million) 53,535 45,352 18.0%Net core loans and advances to customers (including own originated securitised assets) (£'million) 22,707 18,119 25.3%Cash and near cash balances (£'million) 12,038 10,962 9.8%Customer accounts (deposits) (£'million) 29,109 24,044 21.1%Third party assets under management (£'million) 150,735 121,683 23.9%Capital adequacy ratio: Investec plc 15.1% 15.1%Capital adequacy tier 1 ratio: Investec plc 11.5% 10.7%Capital adequacy ratio: Investec Limited 14.1% 14.0%Capital adequacy tier 1 ratio: Investec Limited 10.7% 10.7%
Credit loss ratio (core income statement impairment charge as a % of average gross core loans and advances) 0.54% 0.62%Defaults (net of impairments and before collateral) as a % of net core loans and advances to customers 1.22% 1.54%Gearing ratio (assets excluding assurance assets to total equity) 9.5x 10.2xCore loans to equity ratio 4.7x 4.7xLoans and advances to customers as a % of customer deposits 76.2% 73.6%Selected ratios and other informationAdjusted earnings per share^ (pence) 48.3 41.3 16.9%Net tangible asset value per share (pence) 377.0 294.3 28.1%Dividends per share (pence) 23.0 21.0 9.5%Cost to income ratio 66.3% 66.4%Return on average adjusted shareholders' equity (post tax) 12.5% 11.5%Return to average adjusted tangible shareholders' equity (post tax) 14.5% 13.7%Return on risk-weighted assets 1.45% 1.34%Recurring income as a % of operating income 72.0% 71.7%Weighted number of ordinary shares in issues (million) 900.4 870.5 3.4%Total number of shares in issue (million) 958.3 908.8 5.4%Closing share price (pence) 544 513 6.0%Market capitalisation (£'million) 5,213 4,662 11.8%Number of employees in the group (including temps and contractors) 9,716 8,966 8.40%Closing ZAR: £ exchange rate 16.77 21.13 20.6%Average ZAR: £ exchange rate 18.42 20.72 11.1%
Summary year end results – salient financial features

59
£'000 Year to
31 March 2017 Year to
31 Mar 2016Interest income 2,230,765 1,705,640Interest expense (1,550,870) (1,131,871)Net interest income 679,895 573,769
Fee and commission income 1,429,588 1,188,012Fee and commission expense (158,064) (126,387)Investment income 136,203 170,408Share of post taxation operating profit of associates 18,890 1,811*Trading income arising from- customer flow 158,001 110,227- balance sheet management and other trading activities 8,218 11,377Other operating income 13,483 12,090Total operating income before impairment losses on loans and advances 2,286,214 1,939,496
Impairment losses on loans and advances (111,454) (109,516)Operating income 2,174,760 1,829,980
Operating costs (1513,231) (1,287,021)Depreciation on operating leased assets (2,169) (2,165)Operating profit before goodwill and acquired intangibles 659,360 540,794
Impairment of goodwill (4,749) (1,577)Amortisation of acquired intangibles (17,197) (16,248)Operating profit 637,414 522,969
Net loss on disposal of subsidiaries - (4,778)Profit before taxation 637,414 518,191
Taxation on operating profit before goodwill and acquired intangibles (118,488) (103,202)Taxation on acquired intangibles and acquisition/disposal/integration of subsidiaries 4,070 5,197Profit after taxation 522,996 420,186
Profit attributable to Asset Management non-controlling interests (20,291) (16,529)(Profit)/loss attributable to other non-controlling interests (60,239) (35,201)Earnings attributable to shareholders 442,466 368,456.
*Share of post taxation operating profit of associates shown separately from other operating income.
Financial: statutory income statement

60
£'000 Year to
31 March 2017Year to
31 March 2016 % change
Net interest income 680,539 571,929 19.0%Net fee and commission income 1,271,591 1,058,340 20.1%Investment income 135,631 169,915 (20.2%)Share of post taxation operating profit of associates 18,890 1,811 >100%Trading income arising from- customer flow 158,006 110,879 42.5%- balance sheet management and other trading activities 8,078 11,617 (30.5%)Other operating income 13,158 10,279 28.0%Total operating income before impairment losses on loans and advances 2,285,893 1,934,770 18.1%
Impairment losses on loans and advances (57,149) (41,368) 38.1%Operating income 2,228,744 1,893,402 17.7%
Operating costs (1,502,623) (1,272,108) 18.1%Depreciation on operating leased assets (2,169) (2,165) 0.2%Operating profit before goodwill, acquired intangibles and non-operating items 723,952 619,129 16.9%
Profit attributable to other non-controlling interests (60,239) (35,201) 71.1%Profit attributable to Asset Management non-controlling interests (20,291) (16,529) 22.8%Operating profit before taxation 643,422 567,399 13.4%
Taxation (130,438) (118,151) 10.4%Preference dividends accrued (25,838) (26,130) (1.1%)Adjusted attributable earnings to ordinary shareholders 487,146 423,118 15.1%
Number of weighted average shares (million) 900.4 870.5
Adjusted EPS 54.1 48.6 11.3%Cost to income ratio 65.8% 65.8%
*Share of post taxation operating profit of associates shown separately from other operating income.
Financial: ongoing income statement

61
Removal of**:
For the year ended 31 March 2017 (£'000)STATUTORY AS
DISCLOSED UK LEGACY BUSINESS ONGOING BUSINESS
Net interest income 679,895 (644) 680,539Net fee and commission income 1,271,524 (67) 1,271,591Investment income 136,203 572 135,631Share of post taxation operating profit of associates 18,890 - 18,890Trading income arising from- customer flow 158,001 (5) 158,006- balance sheet management and other trading activities 8,218 140 8,078Other operating income 13,483 325 13,158Total operating income before impairment losses on loans and advances 2,286,214 321 2,285,893
Impairment losses on loans and advances (111,454) (54,305) (57,149)Operating income/(loss) 2,174,760 (53,984) 2,228,744
Operating costs (1,515,400) (10,608) (1,504,792)Operating profit/(loss) before goodwill, acquired intangibles and non-operating items 659,360 (64,592) 723,952
Profit attributable to other non-controlling interests (60,239) - (60,239)Profit attributable to Asset Management non-controlling interests (20,291) - (20,291)Operating profit before taxation 578,830 (64,592) 643,422
Taxation (118,488) 11,950 (130,438)Preference dividends (25,838) - (25,838)Adjusted attributable earnings to ordinary shareholders 434,504 (52,642) 487,146
Number of weighted average shares (million) 900.4 900.4
Adjusted EPS 48.3 54.1Cost to income ratio 66.3% 65.8%
*Applying the group’s effective taxation rate of 18.5%.**The remaining legacy business in the UK.
Financial: income statement: reconciliation from statutory to ongoing

62
£'000 31 March 2017 31 March 2016Assets Cash and balances at central banks 3,351,702 3,007,269Loans and advances to banks 3,191,041 2,498,585Non-sovereign and non-bank cash placements 536,259 466,573Reverse repurchase agreements and cash collateral on securities borrowed 2,358,970 2,497,125Sovereign debt securities 3,804,627 3,208,862Bank debt securities 639,189 896,855Other debt securities 1,115,558 949,950Derivative financial instruments 1,185,848 1,580,949Securities arising from trading activities 1,376,668 1,119,074Investment portfolio 835,899 660,795Loans and advances to customers 22,189,975 17,681,572Own originated loans and advances to customers securitised 517,162 437,243Other loans and advances 355,248 321,617Other securitised assets 148,964 160,295Property and equipment 105,939 90,888Investment properties 1,128,930 938,879Goodwill and intangible assets 510,840 516,319Combined other assets, excluding assurance assets 2,453,883 2,471,895
45,806,702 39,504,745Liabilities Deposits by banks 2,736,066 2,397,403Derivative financial instruments 1,296,206 1,582,847Other trading liabilities 978,911 957,418Repurchase agreements and cash collateral on securities lent 690,615 971,646Customer accounts (deposits) 29,109,428 24,044,281Debt securities in issue 2,386,180 2,299,751Liabilities arising on securitisation of own originated loans and advances 90,125 85,650Liabilities arising on securitisation of other assets 128,838 120,851Subordinated liabilities 1,402,638 1,134,883Combined other liabilities, excluding assurance liabilities 2,179,066 2,050,708
40,998,073 35,645,438Equity Shareholders' equity excluding non-controlling interests 4,131,093 3,360,287Non-controlling interests - Perpetual preferred securities issued by subsidiaries 91,492 72,615- Non-controlling interests in partially held subsidiaries 553,246 400,374
4,808,629 3,859,307
Financial: summarised balance sheet (excluding assurance assets)

63
For the year ended 31 March 2017
£'000 UK & Other Southern Africa Total group % change % of totalAsset Management 91,262 73,562 164,824 22.3% 27.5%Wealth & Investment 65,190 28,053 93,243 8.8% 15.6%Specialist Banking 104,604 285,226 389,830 17.8% 65.1%
261,056 386,841 647,987 17.5% 108.2%Group costs (36,163) (12,613) (48,776) 6.5% -8.1%Total group 224,893 374,228 599,121 18.5% 100.0%Other non-controlling interest - equity 60,239Operating profit 659,360% change 23.0% 16.0% 18.5%% of total 37.5% 62.5% 100%
For the year ended 31 March 2016
£'000 UK & Other Southern Africa Total group % of totalAsset Management 76,853 57,930 134,783 26.7%Wealth & Investment 63,127 22,608 85,735 17.0%Specialist Banking 78,043 252,837 330,880 65.4%
218,023 333,375 551,398 109.1%Group costs (35,160) (10,645) (45,805) (9.1%)Total group 182,863 322,730 505,593 100.0%Other non-controlling interest - equity 35,201Operating profit 540,794
% of total 36.2% 63.8% 100.0%
Financial: operating profit before goodwill, acquired intangibles, non-operating items, taxation and after other non-controlling interests – statutory basis
64
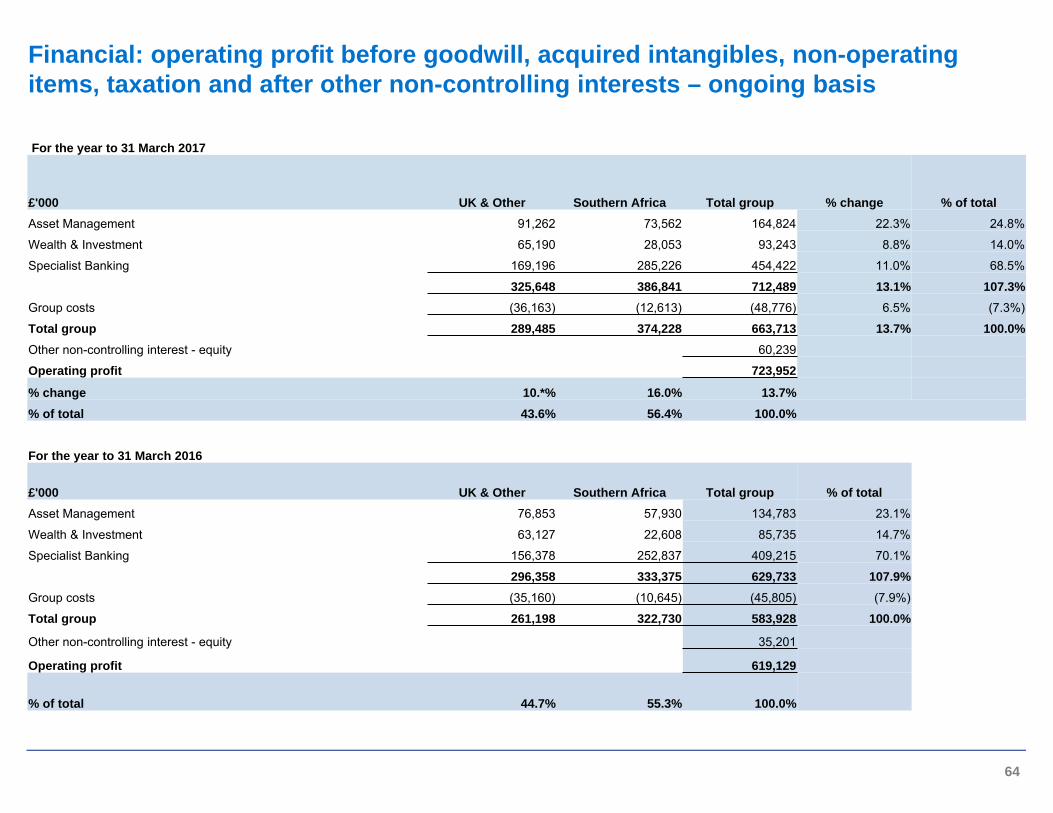
For the year to 31 March 2017
£'000 UK & Other Southern Africa Total group % change % of totalAsset Management 91,262 73,562 164,824 22.3% 24.8%
Wealth & Investment 65,190 28,053 93,243 8.8% 14.0%
Specialist Banking 169,196 285,226 454,422 11.0% 68.5%
325,648 386,841 712,489 13.1% 107.3%Group costs (36,163) (12,613) (48,776) 6.5% (7.3%)
Total group 289,485 374,228 663,713 13.7% 100.0%Other non-controlling interest - equity 60,239
Operating profit 723,952
% change 10.*% 16.0% 13.7%% of total 43.6% 56.4% 100.0%
For the year to 31 March 2016
£'000 UK & Other Southern Africa Total group % of totalAsset Management 76,853 57,930 134,783 23.1%
Wealth & Investment 63,127 22,608 85,735 14.7%
Specialist Banking 156,378 252,837 409,215 70.1%
296,358 333,375 629,733 107.9%Group costs (35,160) (10,645) (45,805) (7.9%)
Total group 261,198 322,730 583,928 100.0%
Other non-controlling interest - equity 35,201
Operating profit 619,129
% of total 44.7% 55.3% 100.0%
Financial: operating profit before goodwill, acquired intangibles, non-operating items, taxation and after other non-controlling interests – ongoing basis
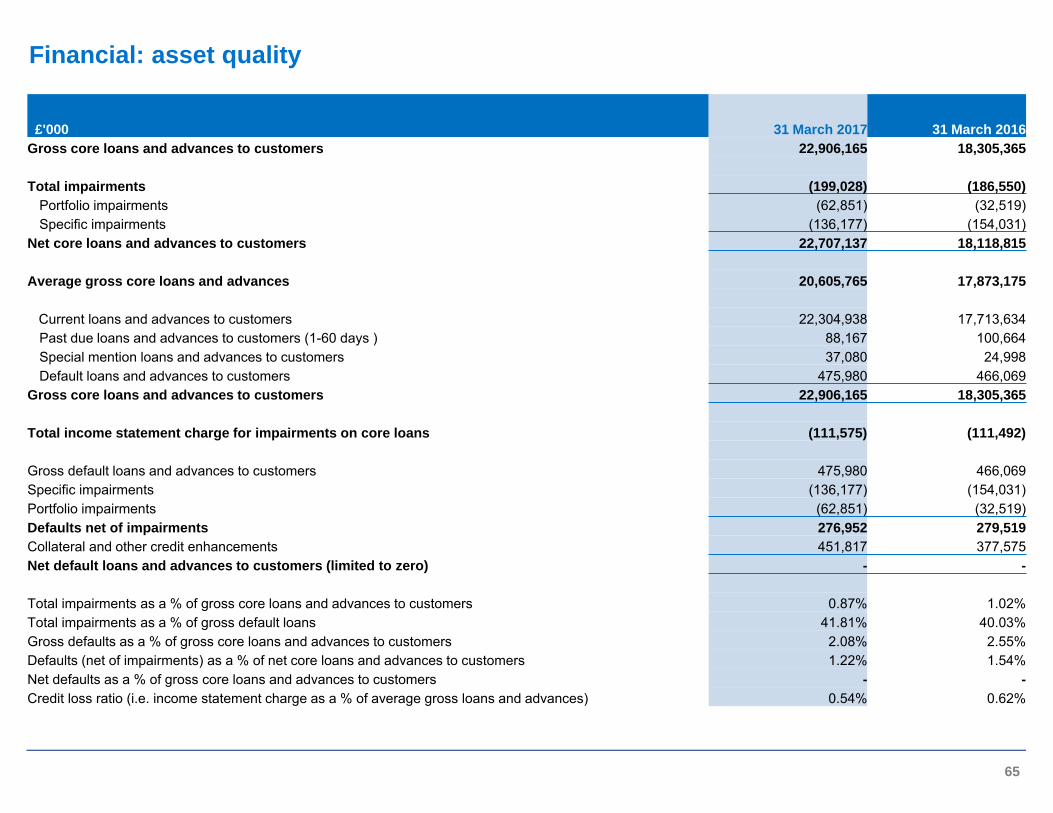
£'000 31 March 2017 31 March 2016Gross core loans and advances to customers 22,906,165 18,305,365
Total impairments (199,028) (186,550)Portfolio impairments (62,851) (32,519)Specific impairments (136,177) (154,031)
Net core loans and advances to customers 22,707,137 18,118,815
Average gross core loans and advances 20,605,765 17,873,175
Current loans and advances to customers 22,304,938 17,713,634Past due loans and advances to customers (1-60 days ) 88,167 100,664Special mention loans and advances to customers 37,080 24,998Default loans and advances to customers 475,980 466,069
Gross core loans and advances to customers 22,906,165 18,305,365
Total income statement charge for impairments on core loans (111,575) (111,492)
Gross default loans and advances to customers 475,980 466,069Specific impairments (136,177) (154,031)Portfolio impairments (62,851) (32,519)Defaults net of impairments 276,952 279,519Collateral and other credit enhancements 451,817 377,575Net default loans and advances to customers (limited to zero) - -
Total impairments as a % of gross core loans and advances to customers 0.87% 1.02%Total impairments as a % of gross default loans 41.81% 40.03%Gross defaults as a % of gross core loans and advances to customers 2.08% 2.55%Defaults (net of impairments) as a % of net core loans and advances to customers 1.22% 1.54%Net defaults as a % of gross core loans and advances to customers - -Credit loss ratio (i.e. income statement charge as a % of average gross loans and advances) 0.54% 0.62%
65
Financial: asset quality

• For further information please refer to the investor relations website: www.investec.com/about-investec/investor-relations.html
• Or contact the investor relations team:– Telephone
• UK: +44 (0) 207 597 5546• SA: +27 (0)11 286 7070
– Fax: +27 11 (0) 291 1597– E-mail: [email protected]
Contact details
63
IMPORTANT NOTICETHE INFORMATION, STATEMENTS AND OPINIONS CONTAINED IN THIS DOCUMENT DO NOT CONSTITUTE A PUBLIC OFFER UNDER ANYAPPLICABLE LEGISLATION OR AN OFFER TO SELL OR SOLICITATION OF ANY OFFER TO BUY ANY SECURITIES OR FINANCIALINSTRUMENTS OR ANY ADVICE OR RECOMMENDATION WITH RESPECT TO SUCH SECURITIES OR OTHER FINANCIAL INSTRUMENTS.
FORWARD-LOOKING STATEMENTSTHIS DOCUMENT CONTAINS CERTAIN FORWARD-LOOKING STATEMENTS WITHIN THE MEANING OF SECTION 21e OF THE USSECURITIES EXCHANGE ACT OF 1934, AS AMENDED, AND SECTION 27a OF THE US SECURITIES ACT OF 1933, AS AMENDED, WITHRESPECT TO CERTAIN OF THE GROUP’S’s PLANS AND ITS CURRENT GOALS AND EXPECTATIONS RELATING TO ITS FUTURE FINANCIALCONDITION AND PERFORMANCE. INVESTEC CAUTIONS READERS THAT NO FORWARD-LOOKING STATEMENT IS A GUARANTEE OFFUTURE PERFORMANCE AND THAT ACTUAL RESULTS COULD DIFFER MATERIALLY FROM THOSE CONTAINED IN THE FORWARD-LOOKING STATEMENTS. THESE FORWARD-LOOKING STATEMENTS CAN BE IDENTIFIED BY THE FACT THAT THEY DO NOT RELATEONLY TO HISTORICAL OR CURRENT FACTS. FORWARD-LOOKING STATEMENTS SOMETIMES USE WORDS SUCH AS “may”, “will”, “seek”,“continue”, “aim”, “anticipate”, “target”, “expect”, “estimate”, “intend”, “plan”, “goal”, “believe” OR OTHER WORDS OF SIMILAR MEANING.EXAMPLES OF FORWARD-LOOKING STATEMENTS INCLUDE, AMONG OTHERS, STATEMENTS REGARDING THE GROUP’S FUTUREFINANCIAL POSITION, INCOME GROWTH, ASSETS, IMPAIRMENT CHARGES, BUSINESS STRATEGY, CAPITAL RATIOS, LEVERAGE,PAYMENT OF DIVIDENDS, PROJECTED LEVELS OF GROWTH IN THE BANKING AND FINANCIAL MARKETS, PROJECTED COSTS,ESTIMATES OF CAPITAL EXPENDITURES AND PLANS AND OBJECTIVES FOR FUTURE OPERATIONS AND OTHER STATEMENTS THAT ARENOT HISTORICAL FACT. BY THEIR NATURE, FORWARD-LOOKING STATEMENTS INVOLVE RISK AND UNCERTAINTY BECAUSE THEYRELATE TO FUTURE EVENTS AND CIRCUMSTANCES, INCLUDING, BUT NOT LIMITED TO, UK DOMESTIC, EUROZONE AND GLOBALECONOMIC AND BUSINESS CONDITIONS, THE EFFECTS OF CONTINUED VOLATILITY IN CREDIT MARKETS, MARKET RELATED RISKSSUCH AS CHANGES IN INTEREST RATES AND EXCHANGE RATES, EFFECTS OF CHANGES IN VALUATION OF CREDIT MARKETEXPOSURES, CHANGES IN VALUATION OF ISSUED NOTES, THE POLICIES AND ACTIONS OF GOVERNMENTAL AND REGULATORYAUTHORITIES (INCLUDING REQUIREMENTS REGARDING CAPITAL AND GROUP STRUCTURES AND THE POTENTIAL FOR ONE OR MORECOUNTRIES EXITING THE EURO), CHANGES IN LEGISLATION, THE FURTHER DEVELOPMENT OF STANDARDS AND INTERPRETATIONSUNDER IFRS APPLICABLE TO PAST, CURRENT AND FUTURE PERIODS, EVOLVING PRACTICES WITH REGARD TO THE INTERPRETATIONAND APPLICATION OF STANDARDS UNDER IFRS, THE OUTCOME OF CURRENT AND FUTURE LITIGATION, THE SUCCESS OF FUTUREACQUISITIONS AND OTHER STRATEGIC TRANSACTIONS AND THE IMPACT OF COMPETITION – A NUMBER OF SUCH FACTORS BEINGBEYOND THE GROUP’S CONTROL. AS A RESULT, THE GROUP’S ACTUAL FUTURE RESULTS MAY DIFFER MATERIALLY FROM THEPLANS, GOALS, AND EXPECTATIONS SET FORTH IN THE GROUP’S FORWARD-LOOKING STATEMENTS.
67
Legal disclaimer