an introduction to fuel cells and related transport …ecpower.utk.edu/publications/docs/an...
TRANSCRIPT

1
An Introduction to Fuel Cells and Related Transport Phenomena
Matthew M. Mench, Chao-Yang Wang and Stefan T. Thynell
Electrochemical Engine Center
Department of Mechanical and Nuclear Engineering
The Pennsylvania State University
University Park, PA, USA
In recent years, the development and commercialization of fuel cell systems for primary or
auxiliary power for stationary, portable, and automotive systems has rapidly accelerated. In this
paper, a basic introduction to fuel cell system components, operation, and related transport
phenomena is presented. The advantages and limitations, state of development, and technical
issues for three types of systems that are the subject of a majority of contemporary fuel cell
research is given. Specifically, the hydrogen-fed polymer electrolyte membrane fuel cell (H2
PEMFC), the direct methanol fuel cell (DMFC), and the solid oxide fuel cell (SOFC) are
described.
Keywords: fuel cells, direct methanol, hydrogen, solid oxide, polymer electrolyte membrane,
transport phenomena
INTRODUCTION
In 1839, William Grove conducted the first known demonstration of the fuel cell. It operated
with separate platinum electrodes in oxygen and hydrogen submerged in a dilute sulfuric acid

2
electrolyte solution, essentially reversing a water electrolysis reaction. High temperature solid
oxide fuel cells (SOFC) began with Nernst’s 1899 discovery of the still-used yttria-stabilized
zirconia solid-state ionic conductor (Nernst, [1899]), although little additional practical
development occurred until the 1960’s. Low temperature polymer electrolyte membrane (PEM)
fuel cells were first developed by General Electric in the 1960’s for NASA’s Gemini space
program. Both PEM and solid oxide fuel cell systems made slow progress until recently. Fueled
by technology advances allowing greatly enhanced performance, continuing environmental
concern, and a need to develop future power systems that are independent of petroleum fuel
stock, interest in all types of fuel cell systems for stationary, automotive, and portable power
applications is now very high. In all of these applications, there is a need for reduced system
cost, high reliability, and acceptable performance. While the performance of many systems has
made the greatest strides, there is still much work to be done.
The fuel cell is a unique and fascinating system. For optimal performance and design,
accurate system modeling for prediction of performance as a function of the myriad of possible
operating conditions and transients is needed, but such modeling requires an understanding of all
relevant phenomena. Although the fundamentals of operation are couched in basic
electrochemistry, advances in all areas are made in such a rapid fashion that it is nearly
impossible for one researcher to be fully cognizant of all aspects of the state of the art. In order
to make strides in the three primary needs of high performance, low cost, and high reliability,
one must possess a basic understanding of the principles of electrochemistry, materials and
manufacturing, and heat and mass transfer. Because of this highly interdisciplinary nature of
fuel cell systems, many successful research programs are built around a team approach involving
investigators from complementary disciplines.
3
The future of power generation will almost certainly include fuel cell systems. The purpose
of this article is to provide an overview of the advantages, limitations, and technical challenges
of contemporary hydrogen polymer electrolyte membrane, direct methanol, and solid oxide fuel
cell technology, with emphasis on critical transport phenomena occurring in these systems.
The basic advantages common to all fuel cell systems are as follows:
1) Potential for a high operating efficiency (up to 50-70%), that is not a strong function of
system size.
2) Zero or near-zero greenhouse emissions, with level of pollution reduction depending on
the particular fuel cell system and fuel option.
3) No moving parts, except pumps or compressors, thus providing stealthy, vibration-free,
and highly reliable operation.
4) A highly scaleable design.
5) Multiple choices of potential fuel feedstocks, from renewable ethanol to biomass
hydrogen production.
6) A nearly instantaneous recharge capability compared to batteries.
Before successful market penetration can occur, however, the following limitations common
to all fuel cell systems must be overcome:
1) Alternative materials and construction methods must be developed to reduce fuel cell
system cost to be competitive with the automotive combustion engine (presently priced at
about $20/kW), and stationary power systems (presently priced up to $1,000/kW). The
cost of the catalyst no longer dominates the price of most fuel cell systems.
Manufacturing and mass production technology is now a key component to the
commercial viability of fuel cell systems.

4
2) Fuel storage and delivery technology must be advanced if pure hydrogen is to be used.
3) Fuel reformation technology must be advanced if a hydrocarbon fuel is to be used for
hydrogen production.
4) Transformation from laboratory to practical systems must occur, with reliable lifetime
performance. Due to catalyst degradation and electrolyte poisoning, the performance of
every fuel cell gradually decreases over time. For an automotive system, the desired time
to retain rated performance is about 4000+ hours (equivalent to 100,000 miles at 25 mph),
and 40,000+ hours for stationary power systems.
Fuel Cell Efficiency
Because a fuel cell directly converts chemical energy into electrical energy, the maximum
theoretical efficiency is not bound by the Carnot cycle, and can be shown as in Hamann et al.
[1998]:
ηmax = 1 - T∆S/∆H (1)
Values calculated from Eq. (1) range from 60-90%. As an example, a hydrogen fuel cell with
water vapor as product has a maximum possible operating efficiency of 80% at an operating
temperature of 100 oC, and 60% at 1000oC. In practice, however, higher temperature operation
results in reduced activation polarization, and the difference in actual operating efficiency with
temperature is less significant. In practice, a 100 kW system operated by Dutch and Danish
utilities has already demonstrated an operating efficiency of 46% (LHV) over more than 3700
hours of operation, according to Yamamoto [2000]. Combined fuel cell/bottoming cycle and
cogeneration plants promise operational efficiencies as high as 80%, with very low pollution.
Another major advantage of fuel cells compared to heat engines is that efficiency is not a
major function of device size, so that high efficiency power for portable electronics can be

5
realized, whereas small scale heat engines can only reach system efficiencies of 10-15%. While
advanced automotive direct injection heat engine efficiencies can achieve 28%, with little hope
of significant future gains, future fuel cell systems can realistically achieve nearly 40%.
Basic Fuel Cell Operation
Figure 1 shows a generalized schematic of a fuel cell. The drawing is not to scale because it
represents a generalized fuel cell system. Electrochemical reactions for the anode and cathode
are shown for a hydrogen-fed polymer electrolyte membrane fuel cell (H2 PEMFC), a direct
methanol fuel cell (DMFC), and a solid oxide fuel cell (SOFC). Liquid or gas-phase fuel and
oxidizer streams enter through flow channels, separated by the electrolyte/electrode assembly.
Reactants are transported by diffusion and/or convection to the catalyzed electrode surfaces,
where electrochemical reactions take place. In PEM fuel cells (these include H2 and DMFC),
transport to the electrode takes place through an electrically conductive carbon paper or carbon
cloth backing layer, which covers the electrolyte on both sides. These backing layers (typical
porosity 0.3-0.8) serve the dual purpose of transporting reactants and products to and from the
electrode and electrons to and from the bipolar plates to the reaction site. An electrochemical
oxidation reaction at the anode produces electrons that flow through the bipolar plate/cell
interconnect to the external circuit, while the ions pass through the electrolyte to the opposing
electrode. The electrons return from the external circuit to participate in the electrochemical
reduction reaction at the cathode.
Performance Characterization
The single cell combination shown in Figure 1 provides a voltage dependent on operating
conditions such as temperature, applied load and fuel/oxidant flow rates. Figure 2 is an
illustration of a polarization curve for a fuel cell. The polarization curve, which represents the

6
cell voltage behavior against operating current density, is the standard measure of performance
for fuel cell systems. Due to losses resulting from undesired species crossover from one
electrode through the electrolyte and internal currents, the actual open circuit voltage is below
the theoretical value. Besides this, there are three major classifications of losses that result in a
drop from the open circuit voltage: 1) activation polarization, 2) ohmic polarization, and 3)
concentration polarization. The operating voltage of a fuel cell can be represented as the
departure from ideal voltage caused by these polarizations:
Vcell = E -ηa,a- ηa,c -ηr -ηm,a- ηm,c (2)
where E is the open circuit potential of the cell, and ηa, ηr, and ηm represent activation, ohmic
(resistive) and mass concentration polarization. Activation and concentration polarization occurs
at both anode and cathode locations, while the resistive polarization represents ohmic losses
throughout the fuel cell.
Activation polarization, which dominates losses at low current density, is the voltage
overpotential required to overcome the activation energy of the electrochemical reaction on the
catalytic surface, and is thus heuristically similar to the activation energy of purely chemical
reactions. Activation polarization is a measure of the catalyst effectiveness at a given
temperature, and is thus primarily a material science and electrode manufacturing issue. This
type of overpotential can be represented by the Tafel equation at each electrode, as described by
Bard and Faulkner [1980]:
coao i
i
ni
i
n
+
=+ ln
F.
RTln
F.
RT ca,aa, (3)
where α is the charge transfer coefficient and can be different between anode and cathode, and
represents the portion of the electrical energy applied that is used to change the rate of

7
electrochemical reaction. In this case, n is the number of exchange electrons per mole of
reactant, and F is Faraday’s constant. A detailed list of all other symbols used can be found in
the Nomenclature. The exchange current density, io, represents the activity of the electrode for a
particular reaction at equilibrium. In hydrogen PEM fuel cells, the anode io for hydrogen
oxidation is so high, relative to the cathode io for oxygen reduction, that the anode contribution to
this polarization is often neglected. On the contrary, direct methanol fuel cells suffer significant
activation polarization losses at both electrodes. For SOFCs, the operating temperatures are so
high that there are very low activation polarization losses. It appears from Eq. (3) that activation
polarization should increase linearly with temperature. However, io is a function of the kinetic
rate constant of reaction which is commonly modeled with an Arrhenius form, and thus io is an
exponentially increasing function of temperature (Bard and Faulkner [1980]). Therefore, the net
effect of increasing temperature is to decrease activation polarization. Accordingly, an effect of
an increase in temperature would be to decrease the voltage drop within the activation
polarization region shown in Fig. 2.
At increased current densities, a primarily linear region is evident on the polarization curve.
In this region, reduction in voltage is dominated by internal ohmic losses (ηr) through the fuel
cell that can be represented as:
( )∑= kr r i (4)
where each rk value is the area-specific resistance of individual cell components, including the
ionic resistance of the electrolyte, and the electric resistance of bipolar plates, cell interconnects,
contact resistance between mating parts and any other cell components through which electrons
flow. With proper cell design, ohmic polarization is typically dominated by electrolyte
conductivity. Electrolyte conductivity is primarily a function of water content and temperature
in PEM fuel cells, and operating temperature in SOFCs, thus water transport is an especially

8
important issue in PEM fuel cell design. Even a slight reduction in ohmic losses through
advanced materials, thinner electrolytes, or optimal temperature/water distribution can
significantly improve fuel cell performance and power density.
At very high current densities, mass transport limitation of fuel or oxidizer to the
corresponding electrode causes a sharp decline in the output voltage. This is referred to as
concentration polarization. This region of the polarization curve is solely a mass transport
related phenomenon, and creative means of facilitating species transport to the electrode surface
can result in greatly improved performance at high current density and fuel utilization conditions.
The Damköler number (Da) is a dimensionless parameter that is the ratio of the characteristic
electrochemical reaction rate to the rate of mass transport to the reaction surface. In the limiting
case of infinite kinetics (high Damköler number), one can derive an expression for ηm based on
the Tafel expression as:
−−=li
in
1lnF
RTm (5)
where i l is the limiting current density, and represents the maximum current produced when the
surface concentration of reactant is reduced to zero at the reaction site. In reality, however, the
assumption of a completely mass-transfer limiting case is rarely valid because there is a
concentration dependence in the activation kinetics of reaction that affects activation polarization
as well. In addition, the Tafel expression is not appropriate near equilibrium conditions and
another function must be used. Near equilibrium and in cases of mixed kinetic/mass transfer
limitation, a Butler-Volmer expression can be applied to express the resulting current density
with a concentration dependence of the reactants (see, for example Um et al. [2000a]), although
no explicit expression for ηm can be written.

9
The appropriate mass flow rate of reactants is determined by several factors relating to
several requirements such as the minimum requirement for electrochemical reaction, maintaining
proper water balance and thermal management. In various situations, water management
concerns may dictate the need for increased flow rate, for example. However, the minimum flow
requirements for all fuel cells are determined by the requirements of the electrochemical
reaction. An expression for the molar flow rate of species required for electrochemical reaction
can be shown as:
F
Areactant n
in = (6)
where i and A represent the current density and total electrode area, respectively. The
stoichiometric ratio for an electrode reaction is defined as the ratio of reactant provided to that
needed for the electrochemical reaction of interest. For example, consider a H2 PEMFC stack
with 20 plates, an active area of 100 cm2 per plate, operating at a current density of 1 A/cm2.
This gives a total active area of 2000 cm2. For the anode reaction, n is 2, and one can easily
determine the minimum required flow rate of hydrogen from Eq. (6). If this minimum rate is
doubled, then the anode stoichiometric ratio, ξa, is 2. On the cathode side, n is 4 (see Fig. 1) and
the required molar oxygen flow rate is simply half of the hydrogen molar flow rate. Since air
instead of pure oxygen is typically used, the resulting value must be converted into an air flow
rate. Considering Eq. (6), useful expressions can be developed for the required mass flow rates
as a function of fuel cell electrical power and operating conditions. For example, for the DMFC
cathode and anode, it can be shown that:
ccell
stack
V
Pm ξ4
air 10 x 56.3 −= and acell
stack
MolV
Pm ξ3-
onfuelsoluti 10 x 71.1= (7)

10
where Pstack is the fuel cell stack electrical power output, Vcell is the operating cell voltage, Mol is
the fuel solution molarity, and other terms can be found in the Nomenclature section. These
useful expressions can be used to approximate the flow requirements for any sized system. For
example, a 2 kW DMFC stack operating at an average of 0.4 V per plate and a stoichiometry of 3
will require approximately 5.34 g/s of air. Similar expressions can be written for other fuel cell
systems.
Description of Materials
Table 1 lists species and component materials commonly used in fuel cell systems, as well as
some other general information. The electrolyte functions to transport ions created by reaction at
one electrode to the other. In PEM fuel cell systems, the proton is transported through the
electrolyte, whereas in SOFC systems, the O2- ion is transferred. The electrolyte can be a solid
ionic conductive polymer (PEM fuel cells), liquid acid or base (alkaline and phosphoric acid) or
ceramic material, such as yttria-stabilized zirconia (SOFC). It is always desirable to reduce
electrolyte thickness to reduce internal ohmic losses. However, the electrolyte must also be
relatively impermeable to fuel and oxidizer to minimize reactant crossover, stable in oxidizing
and reducing environments over time, and maintain structural integrity at operating conditions.
Permeability of the electrolyte to the reactants results in mixed potentials at the electrodes,
reducing performance, and possibly degrading the catalyst. The requirements for the electrode
include low activation losses, long-term stability, and acceptable ionic/electronic conductivity.
In low temperature PEMFC systems, the catalyst material most frequently used is platinum, or
platinum/ruthenium, while high temperature SOFC systems (with greatly reduced activation
polarization) utilize much cheaper catalyst materials such as nickel.

11
The bipolar plate/cell interconnect must satisfy several requirements: impermeability to
reactants, chemical stability in oxidizing and reducing environments, high electrical
conductivity, and the ability to be produced as thin, low cost, and light weight components. In
contrast to PEM fuel cells, the connection between the anode and cathode between cells in a
SOFC stack is commonly referred to as the interconnect, rather than the bipolar plate. This is
because the inter-cell electrical connection and flow field are not necessarily the same
component, depending on the particular SOFC design. In the case of the higher-temperature
SOFC system, the interconnect material must also have similar thermal expansion coefficients as
other cell components to avoid excessive local stress distributions during cell operation and
manufacture. Many different materials have been used for bipolar plate/cell interconnect
material. Laboratory and prototype materials have primarily focused on satisfying the basic
physical property requirements to permit high-performance testing. PEM fuel cells have
generally utilized expensive, individually machined graphite or even gold-plated stainless steel
flowfields for prototype and small-scale laboratory engines, although future mass production
bipolar plates are likely to utilize an injection molding process of polymer doped with a
conducting phase.
Description of a Fuel Cell Stack
A single cell can be made to achieve whatever current and power is required, simply by
scaling up the size of the active electrode area. However, the output voltage of a single H2
PEMFC, DMFC, or SOFC is less than 1 V for realistic operating conditions. Therefore, for most
applications and for compact design, a fuel cell stack of several individual cells connected in
series is used. Figure 3 shows the 1 kW, 20 cell H2 PEMFC stack at the Penn State
Electrochemical Engine Center (ECEC). Other components necessary for fuel cell system

12
operation are shown, such as compressors for reactant species flow, an electronic control system,
and a fuel storage and delivery system (in this case compressed hydrogen). For the H2 PEM fuel
cell, separate humidification and cooling systems are also needed to ensure proper membrane
content and adequate removal of waste heat, so that system temperature remains below Nafion®
perfluorinated membrane material limits of around 120 oC. A battery is used to power pumps
during the start-up transient. For the DMFC, a liquid pump is required to deliver anode flow. In
a SOFC, a pre-heating system is needed to raise cell temperatures during cold start-ups. This is
typically accomplished with a combustion chamber that burns fuel and oxidizer gases. In all
commercial fuel cells, provision must be made for effluent recovery. Fuel utilization efficiency
is not 100% due to concentration polarization limitation on performance, so that unused
hydrogen in the case of SOFC and H2 PEMFC, or liquid and vapor-phase methanol in the case of
DMFC, must be actively recycled, utilized, or converted prior to exhaust to the environment.
Potential schemes include the use of condensers, recyclers, secondary burners, or catalytic
converters.
Hydrogen Fuel Storage
Presently, the problem of hydrogen storage and delivery is a roadblock to mass
commercialization of fuel cells for automotive and stationary applications. Hydrogen storage
and delivery on a mass scale is a long-term issue. While now nearly universally accepted, the
future conversion to a “hydrogen economy” will be extremely costly and will take decades to
complete. Prior to this, it is likely that local hydrogen generation plants will be built in select
locations such as California, where initial demand and government subsidy would be high.
There are several possibilities for hydrogen storage in the immediate future, including utilization

13
of compressed hydrogen, liquefied hydrogen, storage in a metal hydride, and storage in a
hydrocarbon until release through a reformation process.
Compressed hydrogen is considered by many as the best future on-board storage technology
for portable and automotive applications. In the past, 24.8 MPa (3600 psig) metal tanks have
been used, although higher pressure, 34 MPa (5000 psig) light-weight polycarbonate tanks are
now in use. Several prototype vehicles utilize compressed hydrogen. This method has the
drawbacks of difficult market acceptance, safety, and low energy storage density of 31 g/L at 34
MPa.
Liquefied hydrogen has a higher storage density of 71 g/L, and has been the storage and
delivery method of choice for large industrial-scale quantities. However, the liquefaction
process is highly energy intensive, there is a health concern with consumers handling a cryogenic
fluid, and fuel evaporation rates can be as high as 1-2% per day, even with heavy insulation.
Besides the high relative cost, a major problem with this form of storage is that hydrogen venting
of hydrogen gas will necessarily occur, causing safety concerns. While acceptable for
demonstration purposes, liquefied hydrogen is not a likely future storage technology for portable
or automotive applications.
Another potential storage medium is metal hydrides. Hydrogen can bond with certain metal
compounds as a metal hydride, releasing hydrogen when heated. Conventional hydride
technology allows 1-2 weight percent of H2 stored in the metal. For a 600 km drive, a 460-920
kg fuel system would be required with conventional hydrides, an impractical weight for
automotive applications. Some small devices can benefit from the convenience of hydride use,
such as computers or cell phones. If higher storage percentages can be reached in operating
systems, hydride technology could become the dominant mechanism of hydrogen storage.

14
Before this becomes a viable solution, however, it must be demonstrated that problems with
refueling time, product cycle life, cost, and sensitivity to impurities have been overcome.
Hydrogen can also be produced in large quantities at relatively high efficiency by
hydrocarbon reformation. The three main types of reformation are steam reforming, partial
oxidative reforming (POX) and autothermal reformation. In all three schemes, operation is at a
low enough temperature so that nitrous oxide (NOx) formation is negligible. Endothermic steam
reforming is a mature, effective, and relatively inexpensive technology for light hydrocarbons.
Steam reformation utilizes the water-gas shift reaction and a catalytic bed to convert a
hydrocarbon, CO and steam to CO2 and H2. H2 conversion efficiencies of steam reforming are
around 80%.
High temperature (~800-1300 oC) POX reformation occurs via partial combustion of
hydrocarbons to form hydrogen and carbon monoxide. Several companies are actively studying
compact POX reformers with advanced catalysts for reduced temperature operation. Advantages
of this process are that it is exothermic and responsive to varying loads, can handle heavier
hydrocarbons, and does not require a catalyst bed or a source of steam. However, since the
output has a high fraction of CO and low H2 conversion efficiencies of ~50%, additional
tailoring (via water-gas-shift reaction) is needed for use in PEM systems intolerant of CO.
Without additional tailoring, however, POX reformation is well suited for the CO-tolerant high
temperature SOFC systems.
Autothermal reforming essentially combines aspects of both POX and steam reforming,
utilizing the exothermic heat release of combustion to balance the endothermic steam
reformation process. Fuel and oxidant with steam is provided to the fuel processor, which
consists of a combustor and a catalytic bed. The advantage of this system is that it is more
15
responsive to unsteady load than steam reformation, and has higher hydrogen conversion
efficiency than POX reformation.
The temperature at which a particular fuel is reformed has a tremendous impact on its
potential use in different fuel cell systems. For example, one reason methanol is an attractive
option for PEM fuel cells is that it reforms at around 200-300oC, just above the operating
temperature of the fuel cell. Alternatively, an automotive PEM fuel cell utilizing hydrogen
reformed from gasoline is less attractive, because the high (~800oC) reformation temperature of
gasoline necessitates a large heat exchanger to dump thermal energy from the reformer, reducing
efficiency. Alternatively, the obvious thermal matching between gasoline or diesel fuel
reformation and SOFC operating temperature makes this choice of fuels attractive in SOFC
applications.
Although reformation technology is receiving intense interest, it is believed that ultimately
hydrocarbon reformation for hydrogen production will not provide a permanent energy solution.
Instead, hydrogen production from solar, nuclear, biomass, or other renewable sources will be
used. In the near term, however, hydrocarbon reformation represents a viable conduit between
the present petroleum and a future hydrogen-based fuel economy. In the near term, unless other
technologies such as metal hydrides or nanotube hydrogen storage have real breakthroughs, it is
expected that reformed hydrocarbons will play a major role in future fuel cell systems.
THE HYDROGEN PEM FUEL CELL
The hydrogen polymer electrolyte membrane fuel cell (H2 PEMFC) has received the most
attention in recent years, primarily because of its relatively high performance, rapidly advancing
technology, and system simplicity. The H2 PEMFC is fueled either by pure hydrogen, or from a
diluted hydrogen mixture generated from a hydrocarbon reformation process. Incredible

16
progress has been made in H2 PEMFC technology since the early 1990’s. Perhaps the most
advanced H2 PEMFC full-size stack design has a power density of 1.3 kW/L (Budd [2000]).
However, improvements are made so rapidly that future increases in power density are expected.
Though first developed in the 1960’s for the U.S. Gemini Space Program, H2 PEMFCs were
soon replaced by alkaline fuel cells during the Apollo and subsequent space programs due to
water management difficulties (Larminie and Dicks [2000]). As a testament to the increased
performance and reliability of PEMFC systems, NASA is committed to using H2 PEM fuel cells
in future shuttle applications (Warshay and Prokopius [1990]).
H2 PEMFC Performance
Modern H2 PEM fuel cells operate at 60-100oC. The anode and cathode catalyst is typically
~2 nm sized platinum powder supported on significantly larger size carbon particles with a
platinum loading of ~ 0.2 mg/cm2. This represents a major breakthrough in required catalyst
loading from the 28 mg/cm2 of the original 1960’s H2 PEMFC. As a result, the catalyst is no
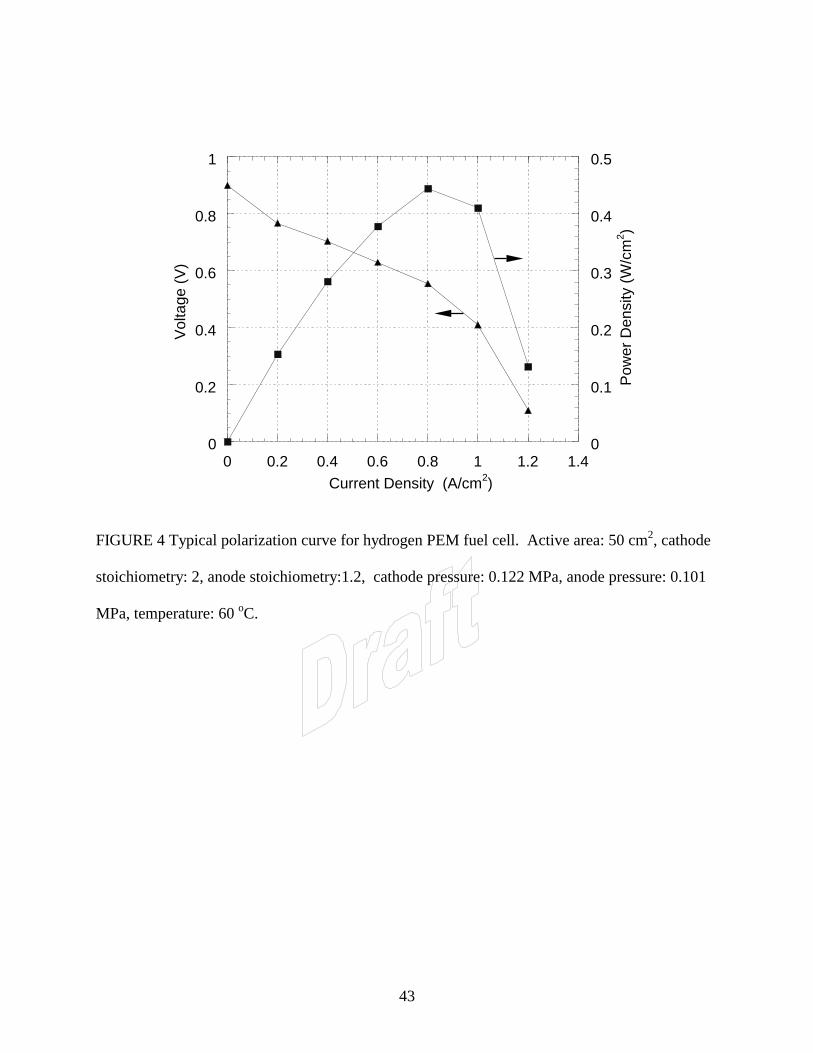
longer the dominating factor in fuel cell cost. A typical performance curve for a H2 PEMFC is
shown in Fig. 4. Most stacks operate around 0.6 V per cell, in order to maintain a balance
between system power density and efficiency losses leading to cooling requirements. There is
always a desire to operate at higher voltages, because of increased efficiency and reduced flow
requirements. However, power density typically peaks below 0.6 V, so there is a size tradeoff
for high voltage operation. Although power density can be higher, operation at lower voltage
results in increased waste heat that needs to be removed from the cell to prevent PEM
dehydration and overheating. In addition, according to Eq. (7), operation at reduced voltage
requires additional flow of anode and cathode species, and increased associated parasitic
pumping losses. Anode and cathode stoichiometry requirements are low, with typical values of 2

17
or less for the cathode and even lower values for the anode. Although older designs utilized
humidified anode and cathode flows, modern designs require only a humidified anode flow to
maintain a proper water balance in the PEM.
Technical Issues of the H2 PEMFC
Active research areas for the H2 PEMFC include: 1) increasing PEM CO tolerance, 2)
optimizing thermal and water management, 3) design of the membrane electrode assembly
(MEA), 4) optimizing flowfield design, and 5) reducing component cost. If reformed
hydrocarbons are used as fuel, perhaps the greatest potential area for advance is in CO tolerance.
Carbon monoxide gas has an affinity for platinum, thereby blocking site access to hydrogen and
reducing performance. Although performance can be regained after poisoning if CO is removed
from the fuel stream, H2 PEMFC output is greatly degraded with CO contamination in the fuel
stream at levels as low as 10 ppm (Springer et al. [2001]). Addition of CO scrubbing equipment
to reformation systems to achieve this low level of contamination greatly increases fuel cell
system cost, size and complexity. Depending on the size of the system, the CO scrubber can
even be larger than the fuel cell stack itself. Another technique for possible CO removal from
fuel streams, in levels up to around 1000 ppm, is bleeding a small percentage of air or oxygen in
with the fuel flow to promote oxidation of the CO (Stumper et al. [1998]). However, careful
control of the oxygen must be maintained to prevent loss of performance from hydrogen
oxidation with excess oxygen.
Identification of catalysts capable of withstanding high levels of CO, while maintaining low
activation polarization for hydrogen oxidation would greatly benefit H2 PEMFC development.
Attempts are also being made to develop electrolyte materials capable of withstanding higher
temperatures. This would permit decreased catalyst loading, reduced cooling system
18
requirements, reduced activation polarization, and higher CO tolerance in the fuel stream due to
decreased CO sticking coefficient.
In the H2 PEMFC, thermal management is also a major issue. The energy that is released by
electrochemical reaction is split between electrical and thermal components. The waste heat rate
can be as much as 60% or more of the output and is roughly equal to the current density (i)
multiplied by the departure from actual open circuit voltage:
Pwaste = niA(Voc-Vcell) (8)
where n is the number of cells in series in the stack, Vcell is the cell operating voltage and Voc is
the theoretical open circuit voltage and can be calculated from basic thermodynamic data, e.g.
Newman [1991]. Waste heat must be properly managed with cooling channels in the stack,
which take up space and require parasitic pumping losses. The choice of coolant is based on the
necessary properties of high specific heat, non-conductive, non-corrosive, sufficient
boiling/freezing points for operation in all environments, and low viscosity. As an
approximation, the required mass flow rate of coolant for a desired maximum coolant
temperature rise, can be written as:
)A(waste cellocp VVniPTCm −==∆ (9)
This assumes all of the waste heat is removed by the coolant flow. Note that smaller systems can
be air cooled, while larger systems must use a liquid coolant, with higher specific heat.
Laboratory systems typically use deionized water, although practical systems exposed to the
environment must use a lower freezing point solution. Equation (9) is valid for all fuel cell
systems.
Water management and humidification is another major issue in H2 PEMFC performance.
Depending on operating conditions, a membrane can have a highly non-homogeneous water (and

19
therefore ionic conductivity) distribution. The membrane beneath a long channel may be dried
by hot inlet flow, ideally saturated near the middle of the cell, and experiencing flooding near the
exit. It is difficult in practice to maintain an ideal water distribution throughout the length of the
cell. Advanced modeling of two-phase flow and transport in PEM fuel cells has been treated by
Wang et al. [2001].
Water transport through the electrolyte occurs by diffusion, electro-osmotic drag, and
hydraulic permeation resulting from a pressure difference across the anode and cathode.
Diffusion through the electrolyte can be represented with Fick’s law, and appropriate expressions
relating to diffusion coefficients for Nafion® can be found in several references, e.g. Motupally
et al. [2000]. Electro-osmotic drag of water through Nafion® membranes has been recently
studied by Ren and Gottesfeld [2001]. A water drag coefficient (λdrag) of 1-5 H2O/H+ was shown
for a fully hydrated Nafion® 117 membrane. The drag coefficient was shown to be a nearly
linearly increasing function of temperature from 20-120oC. Hydraulic permeation of water
through the membrane is typically small for H2 PEMFCs due to the low pressure differences
between the two sides. At the cathode surface, the oxygen reduction reaction shown in Fig. 1
will result in water production proportional to the current density. Considering the cathodic
water reduction reaction, and combining the different forms of water transport through the
membrane, the molar water transport and creation at the cathode can be shown as:
( ) Pl
aK
F
i
x
CDj drag
acOH ∆−++
∆∆
−= − 5.0A
2 λ (10)
At a typical operating temperature of 70oC, λdrag was determined by Ren and Gottesfeld [2001] to
be around 3, or 86% of the current-dependent transport. Since the reduction and electro-osmotic
drag result in water transport and generation at the cathode surface, the flux of water by diffusion
can be either from or to the anode surface, depending on flow and humidity conditions.

20
Membrane performance suffers without sufficient water, because PEM ionic conductivity is
directly related to the degree of water content and temperature, as correlated by Springer et al.
[1991]. Alternatively, excessive water at the cathode can cause flooding i.e., liquid water
accumulation at the cathode surface that prevents oxygen access to the reaction sites. Flooding is
most likely near the cathode exit under high current density, high humidification, low
temperature, and low flow rate conditions. However, in most H2 PEMFC systems, drying is
more of a concern than flooding, and an external humidifier is needed. The maximum mass flow
rate of water that can be removed from the fuel cell by gas flow can be shown by letting the exit
relative humidity, φ, go to 1 in the following expression:
−
=φ
φ
satg
satgothersremovedOH PP
Pnn
,
,,2 (11)
where othersn is the molar flow rate of all other species in the flow besides water vapor, and P is
the total pressure. Note that the consumption of oxygen at the cathode will result in a decrease in
othersn along the flow path that can be non-negligible, depending on stoichiometry and species.
For air with a stoichiometry of 2, the total oxygen consumed would be around 10% of the total
flow, reducing the molar flow rate of water vapor capable of being removed by the incoming
flow by this percentage. Clearly, flow stoichiometry and temperature dominate the water
removal process, considering saturation vapor pressure varies in a nearly exponential way with
temperature. The inlet relative humidity also should affect the ability of the flow to remove
water, however this effect is typically quite small. This is a result of the vast difference between
typical ambient temperature and operating temperature Pg,sat values. For example, even fully
saturated inlet flow drawn from an ambient air source at 20oC (Pg,sat = 2.338 kPa) contains only
5% of the water required for saturation in a fuel cell operating at 80 oC (Pg,sat = 47.39 kPa).

21
Flowfield Design in H2 PEM Fuel Cells
In PEM fuel cells, flow conditions are typically laminar, with Re numbers on the order of
100-1000. In general, the flowfield should be designed to minimize pressure drop (reducing
parasitic pump requirements), while providing adequate and evenly distributed mass transfer
through the carbon diffusion layer to the catalyst surface for reaction. Reduction in performance
of scale-up versions of laboratory fuel cells is common, and is mainly a result of non-
homogeneous species distribution. In H2 PEM fuel cells, the reaction is typically limited by the
cathode kinetics. There is typically a nearly negligible anode activation polarization unless the
inlet flow of hydrogen is greatly diluted. As described by Gottesfeld [1997], at a current density
of 1 A/cm2, a 0.4 –0.5 V voltage loss is required to overcome cathode activation polarization
losses, while a loss of only 20-30 mV results at the hydrogen anode for the same current density.
Since air is generally used as the oxidizer, significant cathode concentration polarization can also
exist without adequate flow rates and properly designed flow fields. Three basic channel
configurations of 1) serpentine, 2) parallel, and 3) interdigitated flow have been used in PEM
fuel cells, although some small-scale fuel cells do not use a flow field and rely on diffusion
processes from the environment.
Figure 5 (a) illustrates a continuous serpentine path flow field. The flow path is continuous
from start to finish. An advantage of the serpentine flow path is that any obstruction in the path,
such as a water droplet, will not block all activity downstream of the obstruction. In an
obstructed serpentine channel, the reactant gas is forced to bypass the channel by flowing under
the current collecting rib, through the porous backing layer, and emerges in an adjacent channel.
The bypass flow can then diffuse back toward the location of the obstruction, so that the net
effect of the obstruction will be an increased pressure drop, but no loss of active area.

22
Conversely, in a parallel configuration, as shown in Fig. 5 (b), an obstruction in one channel
results in flow redistribution among the remaining channels and a dead zone downstream of the
blockage. This dead zone will become deprived of reactant, and hence be inactive.
The disadvantages of serpentine flow include a higher pressure drop than parallel flow, and
the fact that reactant is depleted through the length of the channel, so that adequate species must
be provided to avoid excessive concentration polarization losses. Parallel flow channels require
less mass flow per channel for an equivalent stoichiometry and provide more uniform species
distribution and reduced pressure drop. Since the hydrogen reaction is typically not rate limiting,
and water blockage in the humidified anode can occur, a serpentine arrangement is typically used
for the anode in smaller PEM fuel cells. As the active area of cells gets very large, however,
often a combined parallel/serpentine arrangement is utilized.
A third type of flowfield design, referred to as interdigitated, can be traced back to work by
Ledjeff et al. [1993], and Wilson et al. [1995]. In the interdigitated design, the ends of the
flowfield channels are blocked, so that flow is forced through the porous backing layer under the
current collecting rib and into the adjacent channel, as shown in Fig. 6. This type of flow field
has the major advantage of transporting flow directly to the catalyst reaction surface by forced
convection, rather than solely by diffusion, as in the conventional design. This can reduce
concentration polarization at high power load conditions, where the reactant species is being
quickly consumed. Performance of an H2 PEMFC with an interdigitated cathode has recently
been modeled and is discussed by Um and Wang [2000b]. Another benefit of this design is
enhanced water removal from flooded catalyst sites, and increased usage of active area located
under current collecting ribs, depending on backing layer porosity and species diffusivity. The
main drawback of this design is the increased pressure drop and possible wear on the electrode.

23
In the cathode, concentration polarization losses occur readily, water accumulation that can
lead to flooding can occur, and some unused active area below rib shoulders can exist.
Therefore, the interdigitated flowfield design is ideally suited for the cathode in an H2 PEMFC
when operated under low stoichiometric ratio or high current density conditions.
Reactant Bypass
In serpentine flow paths, the flow can result in a relatively high pressure drop. In addition,
reactant consumption can lead to additional pressure drop. If not designed properly, some flow
channels with a high local pressure may be adjacent to channels with low pressure. In this case,
resultant pressure mismatch can lead to reactant bypass, a phenomenon of undesired reactant
penetration through the backing layer, underneath a current collecting rib, and into another flow
channel. This is similar conceptually to interdigitated flow, only no intentional channel blockage
exists, and bypass is not desired. This can lead to drastically reduced performance for a diluted
fuel or oxidizer flow stream, as active area downstream of the bypass location will be starved of
reactant. This type of phenomenon has been modeled using the computational fluid dynamics
model of Um and Wang [2000b]. The predicted streamtraces of a test case with a serpentine
path with a 180o turn are shown in Fig. 7, and show significant hydrogen bypass underneath the
current collecting rib, for the conditions chosen.
The fraction of flow that is bypassed under the backing layer is controlled by the ratio of the
pressure drop of the flow through the channel to the pressure drop through the backing layer. If
the pressure drop through the backing layer to the bypass emergence point is low, relative to the
pressure drop through the channel to the same bypass emergence point, significant bypass can
occur.
24
Assuming laminar flow, the pressure drop though the channel a distance L from the bypass
location to the bypass emergence point can be derived from laminar flow theory (White [1999]):
2h
path flow d32LV
P =∆ (12)
where V is the channel bulk flow velocity. An estimate of the pressure drop through the porous
backing layer can be estimated with Darcy’s law (Vafai and Hadim [2000]):
û6
Uû3
avgBacking ⋅
⋅= (13)
where ρ is the density of the fluid, Uave is the bulk average velocity through the porous medium,
∆S is the porous medium thickness in the direction of flow (equivalent to the current collecting
rib shoulder width), and κ is the permeability of the backing layer. The backing layer
permeability is a highly non-linear function of porosity, and can be shown by the Kozeny-
Carman relation (Vafai and Hadim [2000]):
( )2
2s
3
01180
d0
−= (14)
where ε is the porosity of the porous medium and ds is the diameter of the theoretical spherical
particles the medium is modeled to consist of. A dimensionless parameter termed the bypass
ratio (BPR) can be defined as the ratio of pressure drop through the channel to the backing layer:
û6Ud
32LV BPR
ave2h
= (15)
Obviously, the channel bulk flow velocity and the average bypass velocity, Uave will be
related, but the basic physics can be understood with this relationship. If BPR is much greater
than unity, significant bypass should occur, if BPR is much less than unity, significant bypass
can be avoided. However, this concept has yet to be verified experimentally. It is interesting to

25
note that in Eq. (15), channel pressure, flow viscosity, and temperature should have little or no
effect, while the hydraulic diameter, channel length, current collecting rib thickness, and backing
layer permeability are the key physical parameters. Hydraulic diameter dh and κ dominate as a
result of their non-linear relationship to BPR. Therefore, backing layer compression to reduce
effective porosity under by current collecting ribs is also a major factor in avoidance of reactant
bypass.
THE DIRECT METHANOL FUEL CELL
The liquid-fed direct methanol fuel cell (DMFC) has received enormous interest recently
because DMFC systems require less ancillary equipment and are therefore much more simplified
compared to an H2 PEMFC. Note that fuel cells that utilize reformed methanol are referred to as
indirect methanol fuel cells. Some direct methanol fuel cells also utilize fuel heated above the
methanol solution boiling point of ~95oC at 1 atm; these are referred to as vapor-fed direct
methanol fuel cells. Because of system simplicity, a majority of methanol fuel cell research has
been focused on liquid-fed DMFC development. Figure 8 shows a 50 cm2 active area, highly
instrumented, transparent DMFC designed and built by the Penn State Electrochemical Engine
Center. While both H2 PEMFC and DMFC utilize polymer electrolyte membranes, and both
transfer hydrogen protons through the electrolyte, the DMFC feeds a solution of methanol and
water (typically 0.5-2 molar) to the anode, where it is internally reformed by the catalyst. The
additional complexities of the low temperature internal reformation prevent the DMFC from
obtaining the same level of fuel cell power density as the H2 PEMFC under the same conditions.
For the DMFC, both anode and cathode activation polarizations are significant and are the same
order of magnitude. However, reduced performance compared to the H2 PEMFC is tolerable in
light of other advantages of the DMFC, namely:

26
1) Because the anode flow is mostly liquid, there is no need for a separate cooling or
humidification subsystem, as in the H2 PEMFC.
2) Liquid fuel used in the anode results in lower parasitic pumping requirements compared
to gas flow. In fact, several designs operate without any external parasitic losses, relying
on natural forces such as capillary action, buoyancy, and diffusion to deliver reactants.
3) The highly dense liquid fuel stored at ambient pressure eliminates problems associated
with reformation or on-board hydrogen storage.
As a result of the great reduction in system components and complexity, the DMFC total
system power density may eventually be greater than that of the H2 PEMFC. The lack of
ancillary equipment makes the DMFC design ideal for portable electronics presently using
batteries. In many such systems, there is a need to dissipate heat from electronics that can be
facilitated by pre-heating the methanol solution, thus enhancing performance of the fuel cell at
the same time.
Besides relatively low anodic activity, other disadvantages of the DMFC are related to use of
methanol. Methanol is toxic; can spread rapidly into ground water; has a colorless flame; and is
more corrosive than gasoline. In addition, it would be financially difficult to fuel providers for
an intermediate switch to a methanol economy, only to be replaced by a hydrogen economy
shortly thereafter. As a result of these potential drawbacks, there is a great debate in the fuel
community over the future use of methanol for fuel cells.
DMFC Performance
It is very difficult to compare performance from different research groups, due to the fact that
operating conditions and material properties are so different. Temperatures run from 50 to
nearly 100oC, cathode pressures go from nearly ambient to 5 atmospheres of air or oxygen

27
(anode is generally at ambient pressure unless temperatures above boiling are used), catalyst
loading and membrane assembly technique are also greatly varied. Several polarization curves
generated at the Penn State Electrochemical Engine Center representing typical performance are
shown in Fig. 9. Other designs, using different stoichiometries and temperatures have achieved
very different results. Much greater performance has been achieved in higher temperature,
pressure, and pure oxygen environments useful for niche applications, e.g. Baldauf and Preidel
[1999]. Relatively poor performance is tolerated in smaller systems for portable electronics.
The catalyst loading has a large effect on performance. Due to the fact that Pt-Ru is used as the
anode catalyst to limit CO poisoning, a carbon-supported catalyst layer is typically too thick, and
can result in unacceptable ohmic losses. It should be noted that catalyst application technology
is highly varied and rapidly evolving, so that some groups have utilized a carbon supported
loading (e.g. Aricò et al. [1999]) or different techniques as well.
Technical Issues of the DMFC
Although the DMFC is quite promising, four main technical issues affecting performance
remain, including: 1) water management, 2) methanol crossover, 3) managing two-phase
transport in the anode, and 4) high activation polarization losses and catalyst loading. While
significant progress has been made by various groups to determine alternative catalysts,
additional work is needed.
Although external humidification is typically not needed in the DMFC due to the liquid
anode solution, prevention of cathode flooding is critical to ensure adequate performance.
Flooding is more of a concern for DMFCs than H2 PEM fuel cells. This is because, in addition
to the terms shown in Eq. (10) for the H2 PEMFC, there is water production at the cathode via
methanol oxidation resulting from methanol crossover according to:

28
O2HCOO2
3OHCH 2223 +→+ (16)
Therefore, 2 moles of water will be produced for every mole of methanol that crosses over to the
cathode, as discussed in the following paragraph. In addition, due to the liquid solution in the
anode, the direction of diffusion will always be from the anode to the cathode, until flooding
occurs at the electrode. In this case, there is no water activity gradient, and diffusion through the
electrolyte ceases. To prevent flooding, cathode airflow must be adequate to remove water at the
rate that it arrives and is produced at the cathode surface. Therefore, typical cathode
stoichiometries are significantly greater than that needed to supply adequate oxidant to the
reaction site.
Another critical issue in the DMFC is methanol crossover from the anode to cathode. This is
a result of diffusion, electro-osmotic drag, and hydraulic permeation from pressure gradients.
Therefore, an expression for the methanol crossover through the membrane can be written
similar to Eq. (10), with different transport properties. When crossover occurs, the mixed
potential, caused by the anodic reaction on the cathode electrode, reduces cell output and the true
stoichiometry of the cathode flow by consumption of oxygen outside the desired reduction
reaction.
Methanol diffusion through PEMs has been studied extensively (e. g. Ren et al. [2000],
Cruickshank and Scott [1998], and Tricoli et al. [2000]). Methanol diffusion rate estimations
vary between groups, but in general are on the order of 10-7 to 10-6 cm2/s for Nafion® under
typical DMFC operating conditions. Electro-osmotic drag of methanol through Nafion® has
also been studied extensively by various groups, with a measured drag coefficient about an order
of magnitude less than that of water. Because of the hydraulic permeation effect, cathode
pressures in the DMFC are typically higher than anode pressures. As cathode pressure is

29
increased, the resulting increase in voltage output that is not predicted from the Nernst
relationship (see, e.g. Newman [1991]) is attributable to reduced crossover by hydraulic
permeation effects. This effect has been modeled by Cruickshank and Scott [1998]. Of the three
modes of methanol crossover, diffusion is dominant under normal conditions, especially at
higher temperatures. This is because the methanol that crosses over to the cathode is electro-
oxidized with oxygen. Since the driving potential for oxidation is so high at the cathode, the
methanol that crosses over is almost instantly and completely converted, which sets up a
sustained maximum activity gradient in methanol concentration across the electrolyte. Because
of the nearly complete conversion to CO2, crossover has been measured experimentally by
determination of the CO2 concentration in the cathode effluent.
In order to prevent crossover and greatly enhance DMFC performance, use of an electrolyte
that effectively retards methanol crossover would prevent mixed potential losses and allow
higher concentrations of fuel mixtures, thus reducing parasitic pumping loss and fuel storage
requirements. In order to limit the dominant mode of diffusion crossover, the most common
PEM used for DMFC application is Nafion® 117 (thickness of 178 µm), more than three times
as thick as the Nafion® 112, typically used in the H2 PEMFC. The increased thickness reduces
crossover, but results in increased ohmic losses. Ongoing efforts are focused on the elimination
or reduction of crossover by replacement of the Nafion® with alternative materials, or through
flow field modification.
Several other transport-related issues are important to DMFC performance. The anode side
is a two-phase system primarily consisting of methanol solution and product CO2. The methanol
must diffuse to the catalyst, while the reaction-generated CO2 must diffuse outward from the
catalyst. At high current densities, CO2 can become a large volume fraction (>90%) in the anode

30
flowfield. CO2 removal from the catalyst sites is critical to ensure availability of adequate
surface area for methanol oxidation. Anode backing layers are typically partially coated in
Teflon® to aid in CO2 removal. In addition to CO2 transport from the catalyst surface to the
backing layer, CO2 removal from the anode exit manifold is critical. Gas slugs can form that are
larger than exit manifold openings, resulting in a significant pressure drop at this location
(Argyropoulos et al. [1999]). As a result of the higher required anode pressure, increased
methanol crossover to the cathode will occur, reducing performance. Thus, it is critical to ensure
optimal CO2 removal, both from the backing layer and from the flow channels.
Mench et al. [2001] examined gas bubble growth and ejection from the backing layer/flow
channel interface region with video microscopy and observed discrete bubbles on the order of
0.1 to 0.5 mm evolving from various locations within the backing layer. Figure 10 shows several
images of various bubbles attached to the anode backing layer. An increase in the current
density immediately increased the frequency of bubble creation, but did not alter bubble size.
CO2 bubble removal from the anode backing layer was observed to occur by two mechanisms:
1) flow-induced removal and 2) large gas bubble coalescence. In addition, it was found that
attached bubbles grew to larger sizes (1-5 mm) near the current collecting rib-backing layer
interface, as a result of increased surface tension area. Therefore, the area with the greatest
potential for methanol ‘starvation’ by CO2 blockage appears to be the region near the ribs, where
CO2 bubbles tend to be removed less easily.
Another transport issue is methanol vapor removal from anode effluent. On the anode side,
gas slugs consisting mostly of CO2 will also contain methanol vapor, which must be separated by
filtering or condensation before release of the CO2 to the environment.

31
THE SOLID OXIDE FUEL CELL
The solid oxide fuel cell (SOFC) represents a very different system from the PEM fuel cell.
The solid-state, high-temperature (600-1000oC) SOFC system eliminates many of the technical
challenges of the PEM fuel cell, although different limitations arise. In general, a SOFC system
is well suited for applications where a high operating temperature and a longer startup transient
are not a limitation, or high amounts of CO impurities are present. The main advantages of the
SOFC system include:
1) Tolerance to CO, because it is oxidized as a fuel, eliminating one of the main drawbacks
of the PEM fuel cell.
2) High operating temperature greatly reduces activation polarization and eliminates the
need for expensive catalysts.
3) Potential for internal reformation of hydrocarbons.
4) Potential for high hybrid system efficiencies (~70%) utilizing a bottoming cycle or
cogeneration, as described by Singhal [2000].
5) Tolerance to a variety of fuel stocks.
6) High-quality waste heat generated is ideal for a cogeneration system.
Technical Issues of the SOFC
Although problems of CO poisoning and precious metal loading are eliminated with the
SOFC, unique limitations exist. Many difficulties with SOFC technology deal with
manufacturing issues beyond the scope of this paper. For more details, an excellent text for
SOFC systems was written by Minh and Takahashi [1995]. The high operating temperature of
the SOFC requires a long startup duration, since commonly used electrolyte conductivity is very
low until around 800oC is reached (Larminie and Dicks [2000]). This is a serious limitation for
32
SOFC use as a main propulsion system in automotive applications. Doshi et al. [1999] have
shown feasibility of low temperature SOFC operation at 500 oC using doped ceria (CeO2)
ceramic electrolytes. Lower temperature operation would allow use of cheaper metallic
compounds for cell interconnects, reduced start-up time, increased reliability and reduced
manufacturing costs. One of the major challenges in SOFC system design is the component
materials, such as the cell interconnect and electrodes. Materials are needed that 1) satisfy the
basic electrical and permeation requirements, and 2) have matched thermal expansion properties
of other components, to avoid internal stress concentrations and damage during both
manufacture and operation.
Despite the technical challenges, the SOFC system is a good potential match for many
applications, including auxiliary power for automotive applications, and stationary cogeneration
plants. As a result of the potential, continued development of various types of SOFC technology
is expected.
Performance and Materials
There are several major differences between the SOFC and PEM fuel cell systems. First, the
operating temperature of the SOFC is 600-1000 oC, compared to only 90oC for PEM fuel cells.
This high temperature is required to ensure adequate ionic conductivity (of O2-) in the solid-
phase ceramic electrolyte. In addition, high temperatures reduce activation polarization so much
that cell losses are typically dominated by internal cell ohmic resistance through the electrolyte,
electrodes, and cell interconnects. SOFC open circuit cell voltages of around 1 V are typical,
and operating current densities can vary greatly depending on design. While the theoretical
maximum efficiency of the SOFC is less than the H2 PEMFC because of increased temperature,
decreased activation polarization is extremely low, and operating efficiencies as high as 60%

33
have already been attained for a 220 kW cogeneration system described by Service [2000].
Another major difference between PEM and solid oxide fuel cells are the materials. In the SOFC
system, a ceramic such as yttria (Y2O3) stabilized zirconia (ZrO2) is used as the electrolyte. In
contrast to PEM fuel cells, O2- ions are passed from the cathode to anode instead of H+ ions from
anode to cathode. Other cell components such as interconnects and bipolar plates are typically
doped ceramic, cermet, or metallic compounds.
SOFC Design Concepts
To date, there are essentially four different basic designs for the SOFC system: the planar,
seal-less tubular, monolithic, and segmented cell-in-series design. The planar configuration
looks geometrically similar to the PEMFC systems described previously. The electrolyte (~ 25 -
250 µm thick) is formed by methods such as tape casting into a sheet, onto which electrodes (25-
100 µm) are coated. Other methods are being actively researched to produce thin electrolyte
layers by techniques such as chemical vapor deposition, sputtering, vapor jet deposition, and tape
casting. The flow channel structure is used as support for the electrolyte, and a stacking
arrangement, similar to that described for PEM fuel cells is used. Although this design is simple
to manufacture and model, one of the major problems with it is difficulty sealing the flow fields
at the edges of the fuel cell. Compressive, glass, cermet, and glass-ceramic seals have been used.
Sealing is still a key issue in planar SOFC design, because it is difficult to maintain system
integrity over the large thermal variation and reducing/oxidizing environment.
The second design, and probably the most advanced, is the seal-less tubular concept
pioneered by Westinghouse (now Siemens-Westinghouse) in 1980. A schematic of the general
design concept is shown in Fig. 11. Air is injected axially down the center of the fuel cell, which
provides preheating of the air to operation temperatures before exposure to the cathode. The

34
oxidizer is provided at adequate flow rates to ensure negligible concentration polarization at the
cathode exit, to maintain desired cell temperature, and to provide adequate oxidizer for effluent
combustion with unused fuel. In many SOFC designs, a combustor is utilized to burn fuel and
oxidizer effluent, providing a source of heat for cogeneration during normal operation, and
enabling a more rapid start-up transient time. In addition, the combustor effectively eliminates
unwanted hydrogen or CO, which is especially high during start-up when fuel cell performance
is low. Anode-side hydrogen or CO fuel can be provided externally as in other fuel cells, or
internally, by anode-side reformation using recycled water vapor product from the anode
reaction and the water-gas-shift reaction. The major advantage of this design is that the difficult
high-temperature seals needed for other SOFC designs are eliminated. Tubular designs have
been tested in 100 kW atmospheric pressure and 250 kW pressurized demonstration systems
with little performance degradation with time (less than 0.1% per 1000 hour) and efficiencies of
46 and 57% (LHV), respectively (Singhal [2000]).
One drawback of this type of tubular design is the more complex and limited range of cell
fabrication methods (Singhal [2000]). Another drawback is high internal ohmic losses relative to
the planar design, due to the in-plane path that electrons must travel along the electrodes to and
from the cell interconnect. This design can also experience significant losses due to limited
oxygen transport through the porous (~35% porosity) structural support tube used to provide
rigidity to the assembly.
The monolithic and segmented cell-in-series designs are less developed, although
demonstration units have been constructed and operated. A schematic of the monolithic cell
design is shown in Fig. 12. In the early 1980s, the corrugated monolithic design was developed,
based on the advantage of high power density compared to other designs. Both co-flow and

35
crossflow designs have been built and tested in small demonstration units. The high power
density of the monolithic design is a result of the high active area exposed per volume and the
short ionic paths through the electrolyte, electrodes and interconnects. The primary disadvantage
of the monolithic SOFC design, preventing its continued development, is the complex
manufacturing process required to build the corrugated system.
The segmented-cell-in-series design has been successfully built and demonstrated in two
configurations: the bell-and-spigot and the banded configuration shown schematically in Figure
13. The bell-and-spigot configuration uses stacked segments with increased electrolyte thickness
for support. Ohmic losses are high because electron motion is along the plane of the electrodes
in both designs, requiring short individual segment lengths (~1-2 cm). The banded configuration
avoids some of the high ohmic losses of the bell-and-spigot configuration with a thinner
electrolyte, but suffers increased mass transport losses associated with the porous support
structure used. The main advantage of the segmented cell design is a higher operating efficiency
than larger-area single electrode configurations. That is, each cell in series with small active area
can produce a higher output in series than the equivalent total active area in a planar design,
because individual cells with favorable conditions can achieve a higher voltage when segmented,
that is not possible with a non-segmented design, where concentration polarization or local cold
spots reduce the entire active area voltage.
The primary disadvantages of the segmented cell designs include the necessity for many
high-temperature gas tight seals, relatively high internal ohmic losses, and requirement for
manufacture of many segments for adequate power output. As a result of these disadvantages,
the majority of SOFC research is now focused on the seal-less and planar design concepts.

36
CONCLUDING REMARKS
The recent interest in various fuel cell systems including portable electronics, automotive and
stationary power has resulted in increased understanding of the relevant mechanisms controlling
performance, but each system has unique barriers which must be overcome. Future performance
enhancements, environmental regulations and incentives, and increased conventional energy
costs should provide ample financial impetus for continued research. In general, future fuel cell
research will result in reduction in manufacturing and component cost, increased system
longevity, and enhanced system modeling for use as a design optimization tool. In addition, high
performance and longevity must be demonstrated in real world systems, as the transition from
laboratory steady state operation to commercial product is made. The main goals specific to H2
PEM fuel cell research include finding membrane-electrode assemblies with increased CO
tolerance, better performance in dry conditions, and reduced catalyst loading. The major goals
of DMFC research now include development of membrane electrode assemblies with enhanced
anodic performance, reduced catalyst loading, optimized water management, and decreased
methanol crossover. Finally, future SOFC research will likely result in performance increases
through reduced internal component resistance and novel design, lower operating temperatures,
and ease of manufacturing.

37
NOMENCLATURE
a constant modifying hydraulic permeability
A Area term, cm2
C molar concentration, mol/cm3
Cp specific heat, J/mole K
dh channel hydraulic diameter, cm
D Diffusion coefficient, cm2/s
E open circuit potential
F Faraday constant, charge on one mole of electrons, 96,487 As/mole electrons
g gravitational constant, 9.81 m/s2
H enthalpy, kJ/kg
i current density, A/cm2
io exchange current density, A/cm2
i l mass limited current density, A/cm2
j flux term, mol/s
K hydraulic permeability, cm2
l thickness of electrolyte, cm
L flow channel length, cm
Mol solution molarity, moles/liter
n electrons per mole oxidized or reduced
P pressure, Pa
r area specific resistance, 2/cmΩ

38
R gas constant, 8.314 J/mol⋅K
S entropy, kJ/kg⋅K, or current collecting rib width, cm
T temperature, K
U reactant crossover bulk velocity, cm/s
V potential, V, or bulk channel velocity, cm/s
Greek letters
α charge transfer coefficient
ε backing layer porosity
φ relative humidity, unitless
η fuel cell electrical energy conversion efficiency, or polarization
κ backing layer gas-phase permeability, cm2
λdrag electro-osmotic drag coefficient, mol/mol H+ transferred through electrolyte
µ viscosity, g/cm⋅s
ξ stoichiometric flow ratio
Subscripts
a activation or anode
air air
ave average
backing backing layer
c cathode
cell fuel cell
g, sat at saturation conditions

39
m mass transport
max maximum
oc open circuit
others all other components in flow
r resistive
st fuel cell stack
w waste

40
FIGURE 1 Generalized schematic of a single fuel cell.
Electrode/catalyst layer
Anode Reaction: H2 PEM: H2 Æ 2H+ + 2e-
DMFC: CH3OH + H2O Æ CO2+ 6H+ + 6e-
SOFC: H2 + O2- Æ H2O+2e- ; CO + O2- ÆCO2 + 2e-
Cathode Reaction: H2 PEM: O2 + 4e- +4H+ Æ 2H2O
DMFC: 6H+ + 6e- + 3/2O2 Æ 6H2O
SOFC: 1/2O2 + 2e- Æ 2O2-
Bipolar plate / interconnect to adjacent cell
Diffusion layer
(PEM fuel cell)
Electrolyte Flow channel

41
FIGURE 2 Generalized polarization curve for a fuel cell showing regions dominated by various
types of losses.
Reversible Cell Potential
Activation Polarization Dominated Region
Ohmic Polarization Dominated Region
Concentration Polarization Dominated Region
Actual Open Circuit Potential V
olta
ge
Current density

42
FIGURE 3 The 1 kW, 20 cell H2 PEMFC stack at the Penn State Electrochemical Engine Center.
DC/AC inverter
Control system
Starter battery
Humidification/cooling system
Fuel cell stack
Compressors
43
0
0.2
0.4
0.6
0.8
1
0
0.1
0.2
0.3
0.4
0.5
0 0.2 0.4 0.6 0.8 1 1.2 1.4
Vol
tage
(V
)
Pow
er D
ensi
ty (
W/c
m2 )
Current Density (A/cm2)
FIGURE 4 Typical polarization curve for hydrogen PEM fuel cell. Active area: 50 cm2, cathode
stoichiometry: 2, anode stoichiometry:1.2, cathode pressure: 0.122 MPa, anode pressure: 0.101
MPa, temperature: 60 oC.

44
(a) (b)
FIGURE 5 Schematic of (a) serpentine, and (b) parallel flow field design.
Flow in
Flow out
Flow in Flow out

45
FIGURE 7 Simulated streamtraces of unintentional hydrogen bypass in the anode channel of a
hydrogen PEM fuel cell with 180o turn in a serpentine flow channel.
Current collecting rib
Flow channel
180o turn
Reactant bypass streamlines
Flow channel
Flow inlet
Flow exit

46
(a) top view (b) side view
FIGURE 6 Schematic of the interdigitated flow field design used in PEM fuel cells.
Flow in
Flow out
Gas diffusion layer
Catalyst layer
Flow forced under ribs
Flow field channel shoulder

47
FIGURE 8 A 50cm2, highly instrumented, transparent direct methanol fuel cell (DMFC) at the
Penn State Electrochemical Engine Center.

48
0.0
0.1
0.2
0.3
0.4
0.5
0.6
0.7
0.8
0.0 0.1 0.2 0.3 0.4 0.5 0.6
Current density (A/cm 2)
Vol
tage
(V
)
0.00
0.01
0.02
0.03
0.04
0.05
0.06
0.07
0.08
0.09
0.10
Pow
er (
Wat
ts/c
m2 )
60 C
70 C
80 C
FIGURE 9 Several DMFC polarization curves taken at the Penn State Electrochemical Engine
Center, showing typical performance. Active area: 50 cm2, fuel solution molarity: 1.0 M,
cathode pressure: 0.205 MPa, anode pressure: 0.101 MPa, cathode flow rate: 2100 mL/min,
anode flow rate: 14 mL/min, catalyst loading: 4 mg/cm2.

49
0.5 mm
(a)
(b) (c)
FIGURE 10 Pictures of anode-side CO2 bubbles (a) emergence from the backing layer with
small-size (b) emergence from the backing layer with larger-size and (c) large sized
accumulation attached to a current collecting rib.

50
FIGURE 11 Schematic of seal-less tubular SOFC design from Minh and Takahashi [1995].

51
FIGURE 12 Schematic of the monolithic SOFC design from Minh and Takahashi [1995].

52
(a) (b)
FIGURE 13 Schematic of the segmented cell-in-series design: (a) banded and (b) bell-and-spigot
configuration (from Minh and Takahashi [1995]).

53
Table 1. Fuel cell system basic data.
Fuel Cell System
H2 PEMFC DMFC PEM SOFC
Fuel H2 CH3OH and H2O CO, H2 Oxidizer O2 O2 O2
Most common electrolyte
Perflourosulfonic acid membrane (e.g. Nafion® by DuPont)
Perflourosulfonic acid membrane (e.g. Nafion® by DuPont)
Yttria stabilized zirconia (YSZ)
Electrolyte thickness ~ 50-175 µm ~ 50-175 µm ~ 25-250 µm
Ion transferred H+ H+ O2- Most common anode catalyst
Carbon supported Pt or Pt/Ru
Unsupported Pt/Ru Nickel/YSZ
Anode catalyst layer thickness ~ 10 – 30 µm ~ 10 – 30 µm ~ 25-150 µm
Most common cathode catalyst
Carbon supported Pt Carbon supported Pt Sr-doped LaMnO3
Cathode catalyst layer thickness ~ 10 – 30 µm ~ 10 – 30 µm ~ 25-150 µm
Bipolar plate/ interconnect
material
Graphite, titanium, stainless steel, and doped polymers
Graphite, titanium, stainless steel, and doped polymers
Doped LaCrO3, YCrO3 , Iconel alloys
Operating temperature
60-100 oC 60-100 oC 600-100 oC
Operating pressure (atm)
1-3 1 (anode) 1-3
(cathode) 1*
Major contaminants
CO < 100 ppm, sulfur, dust
CO < 100 ppm, sulfur, dust
< 100 ppm sulfur
Maximum fuel cell efficiency
~ 80% ~ 80% ~ 62%
Primary applications
Stationary, portable, and vehicular
Portable electronics or as an APU
Stationary and distributed power, or
as an APU * Combined systems with gas turbines are operated with increased operating pressure

54
REFERENCES
Argyropoulos, P., Scott, K., and Taama, W. M., (1999) Carbon Dioxide Evolution in Direct
Methanol Fuel Cells, Electrochimica Acta, Vol. 44, pp. 3575-3584.
Aricò, A. S., Shukla, A. K., El-Khatib, K. M., Cretì, P., and Antonucci, V. (1999) Effect of
Carbon-supported and Unsupported Pt-Ru Anodes on the Performance of Solid-polymer-
electrolyte Direct Methanol Fuel Cells, Journal of Applied Electrochemistry, Vol. 29, pp. 671-
676.
Baldauf, M., and Preidel, W. (1999) Status of the Development of a Direct Methanol Fuel Cell,
Journal of Power Sources, Vol. 84, pp. 161-166.
Bard, A. J., and Faulkner, L. R. (1980) Electrochemical Methods, John Wiley and Sons, New
York, New York, pp. 101.
Budd, G. (2000) Fuel Cell Advances and Challenges Faced in their Implementation within the
Transportation Industry, Proc. 17th Int’l Electric Vehicle Symposium and Exhibition.
Cruickshank, J., and Scott, K. (1998) The Degree and Effect of Methanol Crossover in the Direct
Methanol Fuel Cell, Journal of Power Sources, Vol. 70, pp. 40-47.

55
Doshi, R., Richards, V. L., Carter, J. D., Wang, X., and Krumpelt, M. (1999) Development of
Solid Oxide Fuel Cells that Operate at 500oC, Journal of the Electrochemical Society, Vol. 146,
pp. 1273-1278.
Gottesfeld, S. (1997) Polymer Electrolyte Fuel Cells, Advances in Electrochemical Science and
Engineering, C. Tobias, Editor, Col. 5, pp. 197-203.
Hamann, C., Hamnett, A., and Vielstich, W. (1998) Electrochemistry, Wiley-VCH, New York,
New York.
Larminie, J., and Dicks, A. (2000) Fuel Cell Systems Explained, John Wiley and Sons, New
York, New York.
Ledjeff, K., Heinzel, A., Mahlendorf, F., and Peinecke, V. (1993) Die Reversible Membran-
Brennstoffzelle, Electrochemische Energiegewinnung, Dechema Monographien, Vol. 128,
pp.103.
Mench, M. M. Boslet, S. Thynell, S. Scott, J. and Wang, C.Y. (2001) Experimental Study of a
Direct Methanol Fuel Cell, in Proc. of the symposium on direct methanol fuel cells, the 199th
Electrochemical Society Proceedings Series, Princeton, NJ, 2001.
Minh, N., and Takahashi, T. (1995) Science and Technology of Ceramic Fuel Cells, Elsevier
Press, New York, New York.

56
Motupally, S., Becker, A. J., and Weidner, J. W. (2000) Diffusion of Water in Nafion 115
Membranes, Journal of the Electrochemical Society, Vol. 147, No. 9, pp. 3171-3177.
Nernst, W. (1899) Über die elektrolytische Leitung fester Körper bei sehr hohen Temperaturen,
Z. Elektrochem., No. 6. pp. 41-43.
Newman, J. (1991) Electrochemical Systems, Prentice-Hall, New York, New York.
Ren, X., and Gottesfeld, S. (2001) Electro-osmotic Drag of Water in Poly(perfluorosulfonic acid)
Membranes, Journal of the Electrochemical Society, Vol. 148, No. 1, pp. A87-A93.
Ren, X., Springer, T. E., Zawodzinski, T. A., and Gottesfeld, S. (2000) Methanol Transport
through Nafion Membranes, Journal of the Electrochemical Society, Vol. 147, No. 2, pp. 466-
474.
Service, R. F. (2000) New Tigers in the Fuel Cell Tank, Science, Vol. 288, pp. 1955-1957.
Singhal, S. C., (2000) Science and Technology of Solid-Oxide Fuel Cells, MRS Bulletin, March
pp. 16-21.

57
Springer, T. E., Rockward, T., Zawodzinski, T. A., and Gottesfeld, S. (2001) Model for Polymer
Electrolyte Fuel Cell Operation on Reformate Feed, Journal of the Electrochemical Society, Vol.
148, No. 1, pp. A11-A23.
Springer, T. E., Zawodzinski, T. A., and Gottesfeld, S. (1991) Polymer Electrolyte Fuel Cell
Model, Journal of the Electrochemical Society, Vol. 138, No. 1, pp. 2334.
Stumper, J., Campbell, S. A., Wilkinson, D. P., Johnson, M. C., and Davis, M. (1998) IN-situ
methods for Determination of Current Density Distributions in PEM Fuel Cells, Electrochimica
Acta, Vol; 43, No. 24, pp. 3773-3783.
Tricoli, V., Carretta, N., Bartolozzi, M. (2000) A Comparative Investigation of Proton and
Methanol Transport in Fluorinated Ionomeric Membranes, Journal of Electrochemical Society,
Vol.147, No. 4, pp 1286-1290.
Um, S., Wang, C. Y., and Chen, K. S. (2000a) Computational Fluid Dynamics Modeling of
Proton Exchange Membrane Fuel Cells, Journal of Electrochemical Society, Vol.147, pp 4485-
4493.
Um, S., and Wang, C. Y. (2000b) Three Dimensional Analysis of Transport and Reaction in
Proton Exchange Membrane Fuel Cells, in Proc. of the ASME Heat Transfer Division.

58
Wang, Z. H., Wang, C. Y., and Chen, K. S. (2001) Two Phase Flow and Transport in the Air
Cathode of Proton Exchange Membrane Fuel Cells, Journal of Power Sources, Vol. 94 (1), pp.
40-50.
Warshay M., and Prokopius, P. R. (1990) The Fuel Cell in Space: Yesterday, Today and
Tomorrow, Journal of Power Sources, Vol. 29, No.1 and 2, pp. 193-200.
White, F. M. (1999) Fluid Mechanics, 4th Edition, WCB/McGraw Hill, New York, New York.
Wilson, M.S., Springer, T.E., Davey, J. and Gottesfeld, S. (1995) Alternative
Flow-Field and Backing Concepts for Polymer Electrolyte Membrane Fuel Cells,
Electrochemical Soc. Proc. Ed. S. Gottesfeld, G. Halpert and A. Landgrebe,
Vol. 95-23, pp.115-126.
Wood, D. L., Yi, J. S., and Nguyen, T.V. (1998) Effect of Direct Liquid Water Injection and
Interdigitated Flow Field on the Performance of Proton Exchange Membrane Fuel Cells,
Electrochemica Acta, Vol. 43, No. 24, pp. 3795-3809.
Vafai, K. (Ed.) and Hadim, H. A. (Assoc. Ed.) (2000) Handbook of Porous Media, Marcel
Dekker, New York, New York.
Yamamoto, O., (2000) Solid Oxide Fuel Cells: Fundamental Aspects and Prospects,
Electrochemica Acta , Vol. 45, pp. 2423-2435.