an intro to reliability
TRANSCRIPT

AN INTRO TO RELIABILITY
By Bijli VM

QUALITY & RELIABILITY
QUALITY
•Conformance to specifications•Fitness for intended use (Juran)•Meeting or exceeding customer expectations (Deming)•Conformity to standards set by industry or organisation that must align with customer needs
2
RELIABILITY

QUALITY & RELIABILITY
GARVINS 8 DIMENSIONS OF [PRODUCT]
QUALITY
◦ PERFORMANCE
◦ FEATURES
◦ RELIABILITY
◦ CONFORMANCE
◦ DURABILITY
◦ SERVICEABILITY
◦ AESTHETICS
◦ PERCEIVED QUALITY
3

QUALITY & RELIABILITY
RELIABILITY IS A SUBSET OF
QUALITY
OR
RELIABILITY IS A TOOL TO
ENSURE ‘QUALITY’4

Understand the different similar
looking terminologies

What is Reliability?
What is Reliability? (Simplest
defn) It is the guarantee that the product will
work over its designed life

What do you understand by
reliability?
For my mobile phone
I want a reliability of x%
95%
For a period of y (hrs/ days/ cycles)
2 yrs
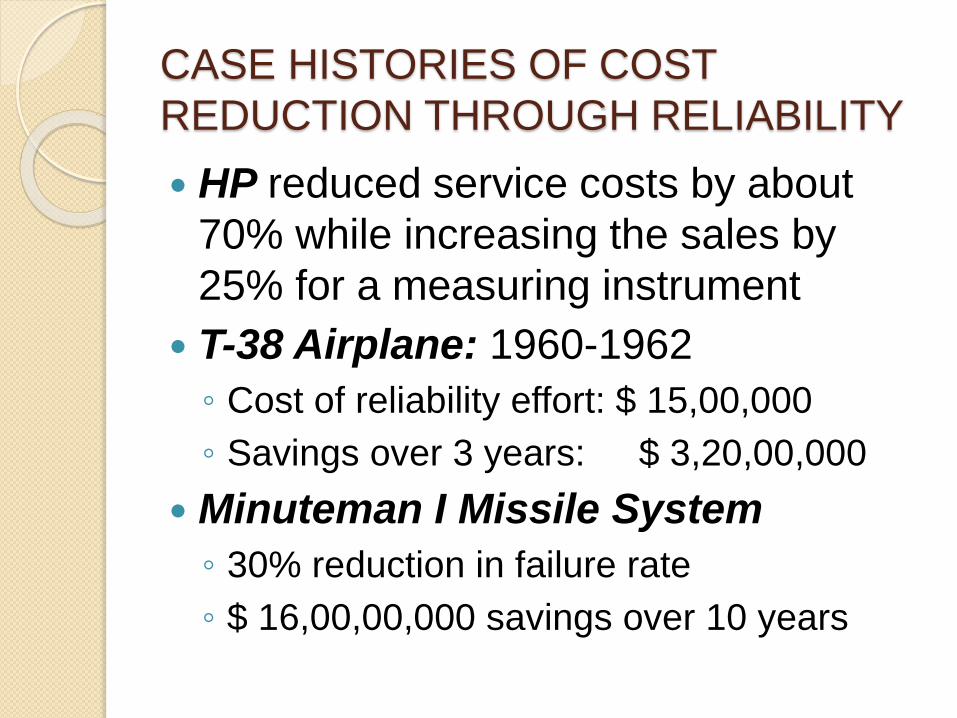
CASE HISTORIES OF COST
REDUCTION THROUGH RELIABILITY
HP reduced service costs by about
70% while increasing the sales by
25% for a measuring instrument
T-38 Airplane: 1960-1962
◦ Cost of reliability effort: $ 15,00,000
◦ Savings over 3 years: $ 3,20,00,000
Minuteman I Missile System
◦ 30% reduction in failure rate
◦ $ 16,00,00,000 savings over 10 years

CASE HISTORIES OF COST
REDUCTION THROUGH RELIABILITY
Texas Instruments
◦ $ 8 million spent
Reliability of 800 types of semiconductors
improved from one failure in 2,500 hrs to > one
failure in 25,000 hrs

Significance of Reliability
No. of components
in series
100
250
500
1,000
10,000
100,000
Individual Component reliability
99.999%
Equipment Reliability
99.90%
99.75%
99.50%
99.01%
90.48%
36.79%
99.99%
99.01%
97.53%
95.12%
90.48%
36.79%
0.01%

Significance of Reliability
Farm Tractor
Model Year
1935
1960
1970
1980
1990
No. of Critical
Components
1200
2250
2400
2600
2900
Tractor
Reliability Per
Year (av.
component
reliability is
99.99%)
88.70%
79.90%
78.70%
77.10%
74.80%
No. of tractors
failing per year
per 1,000
tractors
113
201
213
229
252

Cost Escalation of Products
Re 1 Concept Phase
Rs 10 Design Phase
Rs 100 Development Phase
Rs 1,000 Manufacturing Phase
Rs 10,000 Support Phase

OPTIMUM RELIABILITY (trade
off)

Reliability answers questions
like What is the probability of my radar
encountering a failure during my
exercise sortie of 50 days?
Which are the most critical spares I
need to stock as OBS/ B&D for my
sonar?
What is the expected life of my FCS?
Reliability answers questions
like How much will the average life time
increase, if I add redundancy to my SDN server?
How many missiles should I have to ensure destruction of the target?
What is the probability of my car not breaking down during the first 10,000kms or 3 years which ever is lowest
How is Reliability beneficial? (for
engineers) Predict PRODUCT/ PROCESS failures
Understand why failures occur
Improves the product/ process in an objective way
Creates optimised Test Plans
Predicts spare parts requirement
Plan maintenance activities and schedules
Risk based decision making with spare consumption data
Good engineering practice

How is Reliability beneficial? (for
managers) Lowers manufacturing costs ◦ Less overtime, rework, downtime, audits &
inspection
Lowers life cycle costs◦ Warranty costs, product recalls, customer
dissatisfaction
Ensures product/ process capability
Produces evidence for dependability claims
Insight into contractual compliance
Risk based decision making Good management practice
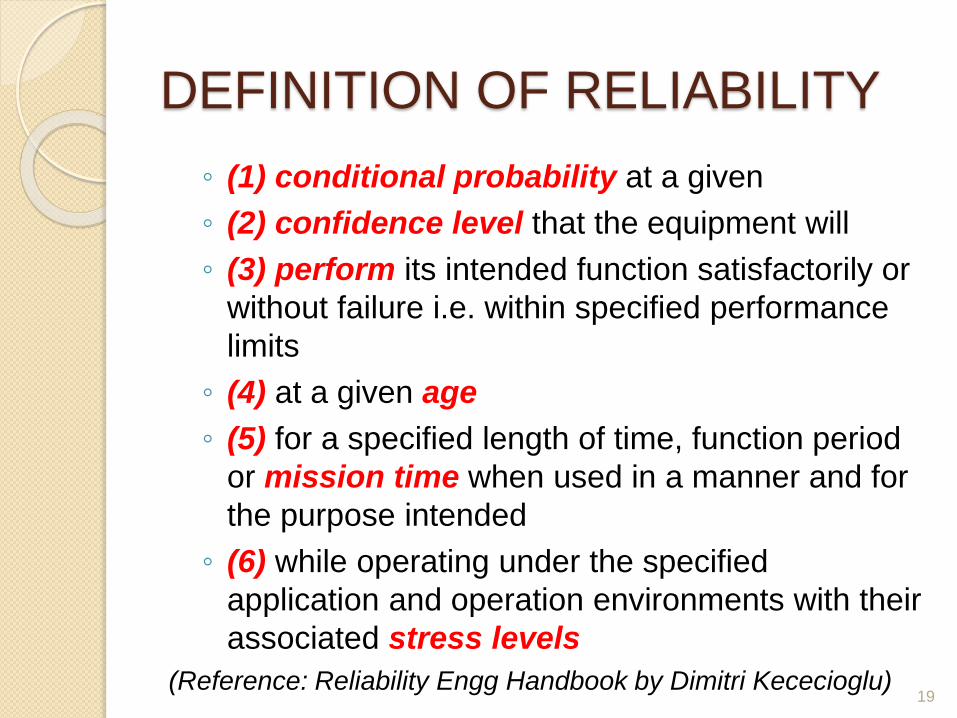
DEFINITION OF RELIABILITY
◦ (1) conditional probability at a given
◦ (2) confidence level that the equipment will
◦ (3) perform its intended function satisfactorily or
without failure i.e. within specified performance
limits
◦ (4) at a given age
◦ (5) for a specified length of time, function period
or mission time when used in a manner and for
the purpose intended
◦ (6) while operating under the specified
application and operation environments with their
associated stress levels
(Reference: Reliability Engg Handbook by Dimitri Kececioglu)19

Reliability is usually represented in a
graph vs time

RELIABILITY ENGG
DEFINITION Provides the theoretical and practical tools
whereby the probability and capability of parts, components, equipment, products, subsystems, and systems to perform their required functions without failure for desired periods in specified environments, i.e. their desired optimised reliability, can be specified, predicted, designed in, tested, demonstrated, packaged, transported, stored, installed and started up, and their performance monitored and fed back to all concerned organisations, and any needed corrective actions taken, the results of these actions being followed through to see if the units reliability has improved, and similarly for their desired and optimisedmaintainability, availability and safety and quality levels at desired confidence levels and at competitive prices
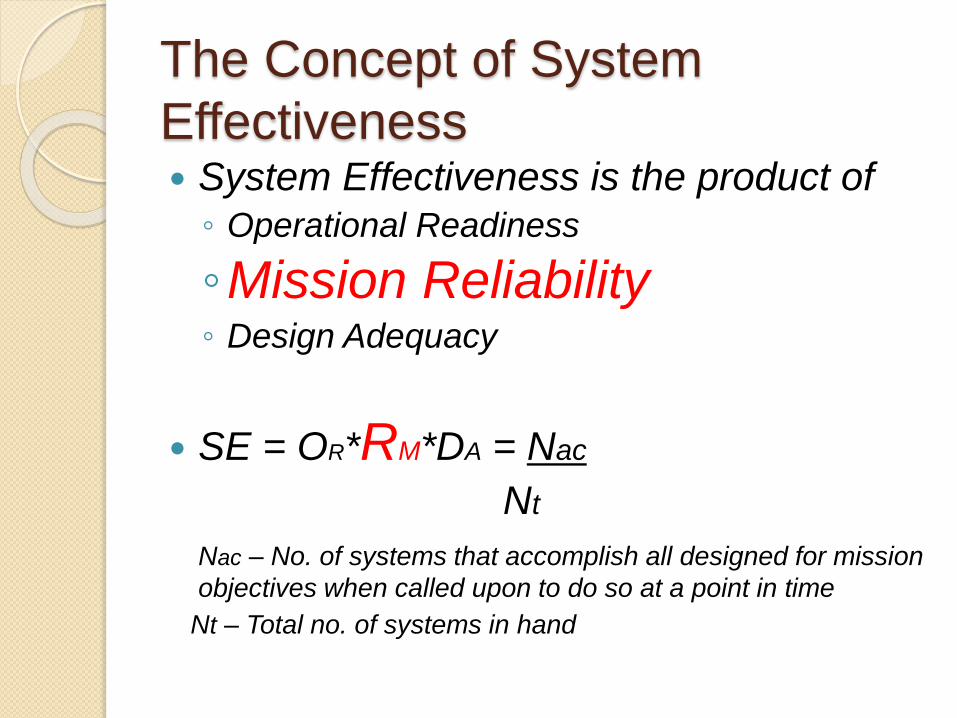
The Concept of System
Effectiveness System Effectiveness is the product of ◦ Operational Readiness
◦Mission Reliability ◦ Design Adequacy
SE = OR*RM*DA = Nac
Nt
Nac – No. of systems that accomplish all designed for mission
objectives when called upon to do so at a point in time
Nt – Total no. of systems in hand

System Effectiveness
What should be the total no. of missiles on hand when Nac = 100 such missiles are required to destroy a target given that ◦ OR = 0.98
◦ RM = 0.95
◦ DA = 0.90 Nt = ? SE = Nac/ Nt = OR*RM*DA=0.98*0.95*0.90=0.8379
0.8379= Nac/ Nt = 100/ Nt
Therefore Nt = 100/0.8379
i.e. 119 missiles


THANK YOU ALLThank You Mr Dimitri Kececioglu