an intragroup study of similarities and differences in the ...differences in the prediction of gre®...
TRANSCRIPT

RESEARCHMEMORANDUM
April 2002RM-02-02
An Intragroup Study of Similarities andDifferences in the Prediction of GRE®
General Test Scores
Paul W. HollandKarla HoffmanMartha J. Thompson
Statistics & Research Division Princeton, NJ 08541

An Intragroup Study of Similarities and Differences
in the Prediction of GRE® General Test Scores
Paul W. Holland, Karla Hoffman, and Martha J. Thompson
Educational Testing Service, Princeton, NJ
April 2002

Research Memoranda provide preliminary and limiteddissemination of ETS research prior to publication. They areavailable without charge from:
Research Publications OfficeMail Stop 10-REducational Testing ServicePrinceton, NJ 08541

i
Abstract
We analyze the data for approximately 1 million Graduate Record Examination (GRE®) tests
taken from 1995 to 1999 to study the relationships between several items in the GRE
Background Information Questions (BIQ) and GRE scores within 18 combinations of gender and
race/ethnicity categories. The study is intragroup in the sense that we use the BIQ variables to
predict GRE scores within each of these groups rather than comparing the GRE scores across
these groups. We find that undergraduate major, reasons for taking the GRE, undergraduate
GPA, and education level at the time of test taking to be consistently important predictors across
all of the groups we studied. Other factors that were important but less consistently important
across all groups were graduate major, full-time or part-time graduate study, parent’s education,
and English language proficiency. Age-at-testing and years-since-the-undergraduate-degree had
no significant relationship with GRE scores for any of the groups. The groups varied somewhat
in the degree to which GRE scores were predictable from these background variables, with the
multiple regression R-squares ranging from about 17% to 37%. There was considerable
consistency across the groups, with several interesting exceptions, in the BIQ categories of the
test takers who would be predicted from the regression models to have the highest scores on the
GRE.
Key words: education level, gender, multiple regression, parents’ education, race and ethnicity
groups, undergraduate major

1
Introduction
This study examines 4 years worth of data from the Graduate Record Examination
(GRE®) to measure the association between GRE General Test scores and several variables from
the GRE Background Information Questions (BIQ). All of our analyses of these relationships are
made within each of 18 subgroups of test takers defined by gender and race/ethnicity. Thus, ours
is an intragroup analysis of GRE test performance rather than the more usual intergroup
comparison of test scores. We used 4 years worth of data to insure sufficient sample sizes in each
of these subgroups of test takers to make our analyses reasonably stable. We shall refer to the 18
subgroups formed by the combinations of gender and race/ethnicity as “the groups” throughout
this report.
The Basic Sample
We use the data files called the “GRE Research Database Extracts” from 1995–96 to
1998–99. These files contain GRE scores and the data from the Background Information
Questions from the GRE registration form. We included any record with these characteristics:
U.S. citizen, reported gender, reported GRE-V (Verbal), -Q (Quantitative), and -A (Analytical)
score between 200 and 800, and neither General Test “Irregularity” nor disability indicated on
the record. These selection criteria, which were discussed with staff at Educational Testing
Service (ETS) who were familiar with the GRE program, are the result of several iterations of
possible restrictions on the basic sample for the study. We chose these criteria primarily because
the resulting sample is fairly easy to describe and is directly relevant to the questions we are
going to address. We excluded non-U.S. citizens because the race/ethnicity categories in the BIQ
are designed for U.S. citizens and are not always relevant to international GRE test takers. We
excluded test takers reporting disabilities to simplify the interpretation of the resulting scores and
because this is a very small subpopulation of the GRE General Test population. Subsequent
analysts may wish to apply our methods to these other interesting subpopulations.
These selection criteria resulted in a sample size of 986,785 for the 4 years of data. Thus
we have a data set of nearly 1 million GRE tests taken. This should be distinguished from test
takers because we did not eliminate those who took the test more than once over these 4 years.
This is standard practice for the reports of GRE test volumes and related statistical reports.
2
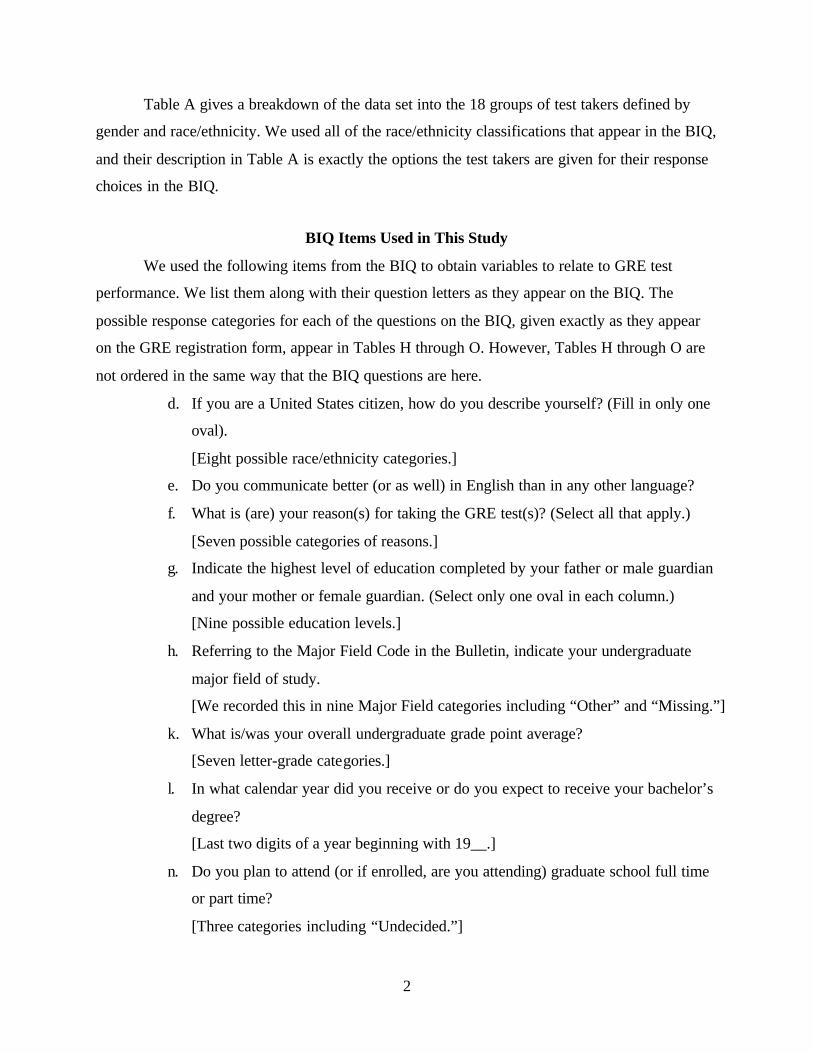
Table A gives a breakdown of the data set into the 18 groups of test takers defined by
gender and race/ethnicity. We used all of the race/ethnicity classifications that appear in the BIQ,
and their description in Table A is exactly the options the test takers are given for their response
choices in the BIQ.
BIQ Items Used in This Study
We used the following items from the BIQ to obtain variables to relate to GRE test
performance. We list them along with their question letters as they appear on the BIQ. The
possible response categories for each of the questions on the BIQ, given exactly as they appear
on the GRE registration form, appear in Tables H through O. However, Tables H through O are
not ordered in the same way that the BIQ questions are here.
d. If you are a United States citizen, how do you describe yourself? (Fill in only one
oval).
[Eight possible race/ethnicity categories.]
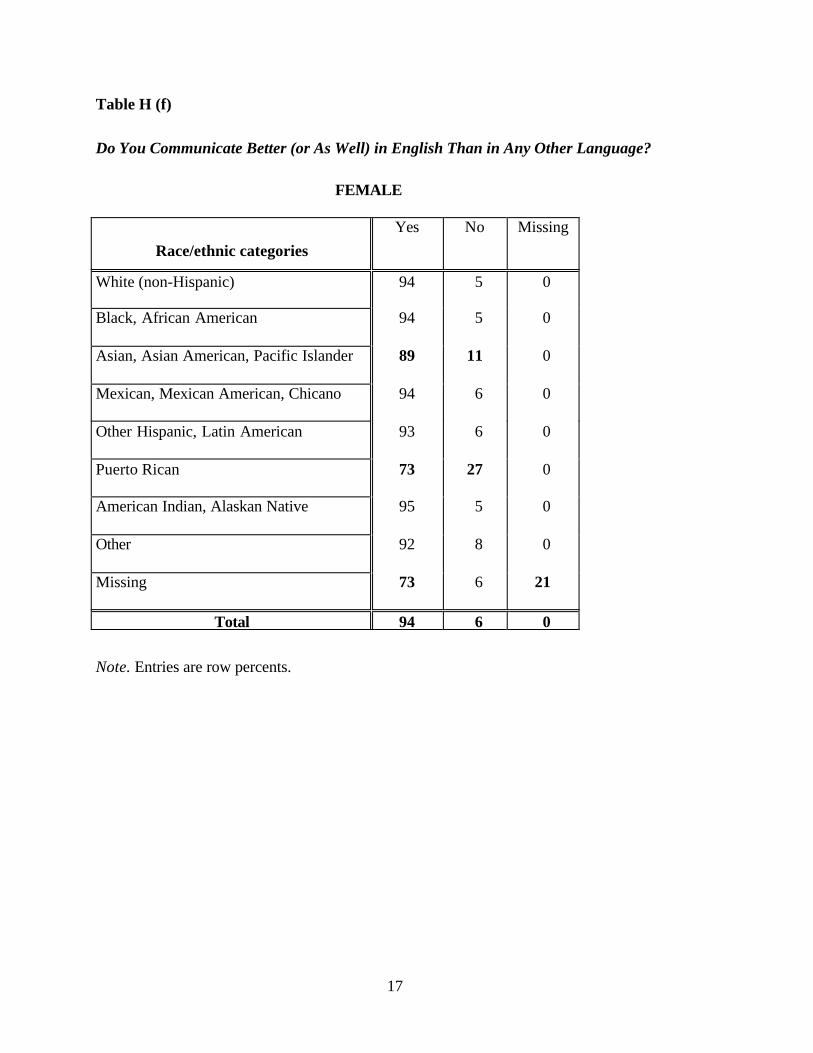
e. Do you communicate better (or as well) in English than in any other language?
f. What is (are) your reason(s) for taking the GRE test(s)? (Select all that apply.)
[Seven possible categories of reasons.]
g. Indicate the highest level of education completed by your father or male guardian
and your mother or female guardian. (Select only one oval in each column.)
[Nine possible education levels.]
h. Referring to the Major Field Code in the Bulletin, indicate your undergraduate
major field of study.
[We recorded this in nine Major Field categories including “Other” and “Missing.”]
k. What is/was your overall undergraduate grade point average?
[Seven letter-grade categories.]
l. In what calendar year did you receive or do you expect to receive your bachelor’s
degree?
[Last two digits of a year beginning with 19__.]
n. Do you plan to attend (or if enrolled, are you attending) graduate school full time
or part time?
[Three categories including “Undecided.”]

Table A
Gender by Ethnicity, for 1995–1999 GRE Tests Takers
Race/ethnicity
Gender
White(non-
Hispanic)
Black,African
American
Asian,Asian
American,PacificIslander
Mexican,Mexican
American,Chicano
OtherHispanic,
LatinAmerican
PuertoRican
AmericanIndian,AlaskanNative Other Missing
Totalcolumnpercent
Female 491,961 60,097 28,232 13,119 13,320 6,287 3,615 14,129 6,927 637,687
Percent 49.85 6.09 2.86 1.33 1.35 0.64 0.37 1.43 0.70 64.62
Row pct 77.15 9.42 4.43 2.06 2.09 0.99 0.57 2.22 1.09
Col pct 64.51 72.39 60.58 63.65 66.07 61.69 62.99 56.73 53.51
Male 270,651 22,922 18,367 7,493 6,841 3,904 2,124 10,778 6,018 349,098
Percent 27.43 2.32 1.86 0.76 0.69 0.40 0.22 1.09 0.61 35.38
Row pct 77.53 6.57 5.26 2.15 1.96 1.12 0.61 3.09 1.72
Col pct 35.49 27.61 39.42 36.35 33.93 38.31 37.01 43.27 46.49
Total 762,612 83,019 46,599 20,612 20,161 10,191 5,739 24,907 12,945 986,785
Row pct 77.28 8.41 4.72 2.09 2.04 1.03 0.58 2.52 1.31 100.00
Note. Actually “tests taken” by U.S. citizens with a reported gender, all three GRE General Test scores, no reported GRE GeneralTest irregularities, and no reported disabilities.
3

4
In addition to these BIQ items, we also made a preliminary examination of four other
BIQ items. These asked (1) if the test taker’s graduate enrollment depended on financial aid, (2)
if he or she had published a book, (3) how many hours he or she spent on community service,
and (4) any important honors he or she had received. We do not include these variables in our
analysis because the data collection design used by the GRE asked only these four questions on
the registration forms for 1995–96 and 1997–98, and they are, therefore, available in only half of
our sample. We give summary distributions of these variables for that half of our sample by
race/ethnicity categories in Tables B through E. These interesting variables could be
incorporated into an analysis modeled after ours, but they are not considered further here.
At the suggestion of several GRE staff, we also use Question l, above, and the test taker’s
year of birth to compute two additional variables related to the test taker’s age. Because the year
in which the test was taken is known, we can obtain both the “age at testing” and the “years since
undergraduate degree” for each test taker. These variables were examined closely because the
gridding of both the birth year and of the year of the bachelor’s degree was not always accurate.
We eliminated cases where the two computed age-variables were either implausibly high or low.
While we found some interesting differences in these age variables among the 18 groups we are
examining, they turned out to bear little relationship to GRE test performance. They did not enter
our stepwise regression analyses, reported later, for any of the 18 groups we studied.
Tables F and G show how these two age variables are distributed for the 18 groups in this
study. Of those reporting a race/ethnicity category, African American male and female test takers
are the oldest on average, while Mexican American men and Other Hispanic women are the
youngest on average. The female examinees tend to be younger than the males in every
race/ethnic category except for White examinees. Furthermore, African American men and
women have been out of undergraduate school longer than the other examinees, while Mexican
American and White males and Other Hispanic females have been out for the shortest time on
average. Female examinees tend to have been out of undergraduate school less time than the
males in every ethnic category except for White test takers. All of these comparisons must be
tempered with the realization that within each of the 18 groups there is considerable variation in
these two age-related variables, as indicated by the standard deviations shown in parentheses in
each cell of the two tables.

5
Table B
Is Your Enrollment or Continuing Attendance in Graduate School Dependent Upon YourReceiving Financial Aid?
Race/ethnic categories Yes No Not sure Missing
White (non-Hispanic) 38 30 26 6
Black, African American 56 21 18 5
Asian, Asian American,Pacific Islander
37 26 27 9
Mexican, Mexican American,Chicano
49 25 21 5
Other Hispanic, LatinAmerican
43 28 23 6
Puerto Rican 56 17 22 5
American Indian, AlaskanNative
51 22 22 5
Other 43 20 26 11
Missing 33 15 21 31
Total 40 28 25 7
Note. Entries are row percents.

6
Table C
Have You Ever Written a Book or an Article That Appeared in a Professional Journal orOther National Publication?
Race/ethnic categories Yes No Missing
White (non-Hispanic) 7 84 10
Black, African American 6 84 9
Asian, Asian American, PacificIslander
7 81 12
Mexican, Mexican American,Chicano
5 86 8
Other Hispanic, LatinAmerican
7 84 9
Puerto Rican 8 85 7
American Indian, AlaskanNative
11 79 9
Other 11 74 15
Missing 8 54 38
Total 7 83 10
Note. Entries are row percents.

7
Table D
How Many Hours Per Week Did You Spend in Community Service Activities This Past Year?
Note. Entries are percents at or above the indicated hours per week for those responding to thequestion. The percent reporting 0 hours is given separately. The value for Missing is the percentnot responding to the question.
Race/ethniccategories
More than20 hours
More than10 hours
More than5 hours
More than0 hours
0 hours Missing
White (non-Hispanic)
11 16 29 76 24 8
Black, AfricanAmerican
20 28 47 87 13 7
Asian, AsianAmerican, PacificIslander
12 19 34 76 24 12
Mexican, MexicanAmerican, Chicano
16 24 40 81 19 6
Other Hispanic,Latin American
14 22 37 78 22 8
Puerto Rican 15 23 39 78 22 7
American Indian,Alaskan Native
17 24 39 83 17 7
Other 16 23 38 79 21 14
Missing 15 21 35 81 19 37
Total 12 17 32 77 23 9

Table E
In Which of the Following Areas Have You Received an Important Honor, Award, Prize, or Other Recognition?
Race/ethniccategories
Academica
(8)Communityserviceb(3)
Studentgov/org (1)
Athleticc (7) Artisticd (5) Literarye
(4)None of
the above(9)
Professionalf
(2)Scientificg
(6)
White (non-Hispanic)
39 23 19 21 15 12 10 9 7
Black,AfricanAmerican
29 35 24 14 10 10 13 10 6
Asian, AsianAmerican,PacificIslander
32 24 20 12 13 11 12 7 8
Mexican,MexicanAmerican,Chicano
28 27 22 14 11 9 14 9 5
OtherHispanic,LatinAmerican
32 25 20 14 12 10 13 9 5
(Table continues)
8

Table E (continued)
Race/ethniccategories
Academica
(8)Communityserviceb (3)
Studentgov/org (1)
Athleticc (7) Artisticd (5) Literarye
(4)None of
the above(9)
Professionalf
(2)Scientificg
(6)
Puerto Rican 33 24 24 12 12 11 13 10 11
AmericanIndian,AlaskanNative
35 31 25 22 16 15 11 14 8
Other 33 27 22 16 18 18 11 11 7
Missing 28 20 17 13 14 14 7 9 7
Total 37 24 20 19 14 12 11 9 7
aMembership in a national academic honor society (e.g., Phi Beta Kappa, Sigma Xi)bElection or appointment to a community service unit, activity or groupcA letter in athleticsdA high rating in a music contest; a part in a play, opera or show; or an award in an art competitioneEditing the college paper, yearbook, or literary magazine or having a poem, story, or article publishedfAn award or prize for field work or publication of a scholarly article or bookgAn award or recognition in a science competition
9

10
Table F
Means and (Standard Deviations) of Age at Testing by Gender and GRE Ethnic Categories
Race/ethnic categories Male Female Meandifference,M minus F
White (non-Hispanic) 26.5 (7.2) 26.6 (7.2) -0.1
Black, African American 28.7 (7.8) 27.3 (7.7) 1.4
Asian, Asian American, PacificIslander
26.5 (7.4) 25.5 (6.5) 1.0
26.1 (7.3) 25.3 (6.8) 0.8Mexican American, Chicano
26.6 (7.5) 24.7 (6.3) 1.9Other Hispanic, Latin American
26.4 (7.4) 25.7 (7.0) 0.7Puerto Rican
26.5 (7.3) 26.1 (6.7) 0.4American Indian, Alaskan Native
27.7 (7.8) 26.3 (6.7) 1.4Other
29.2 (8.0) 26.7 (7.1) 2.5Missing

11
Table G
Means and (Standard Deviations) of Years Since Undergraduate Degree by Gender and GREEthnic Categories
Race/ethnic categories Male Female Meandifference,M minus F
2.6 (5.6) 2.7 (5.7) -0.1White (non-Hispanic)
Black, African American 4.3 (6.3) 3.1 (6.0) 1.2
Asian, Asian American, PacificIslander
2.8 (5.6) 1.9 (5.0) 0.9
Mexican American, Chicano 2.6 (5.5) 1.5 (5.1) 1.1
Other Hispanic 2.9 (5.8) 1.1 (4.5) 1.8
Puerto Rican 3.0 (5.8) 1.6 (5.1) 1.4
American Indian, Alaskan Native 3.0 (5.9) 2.3 (5.2) 0.7
Other 3.7 (6.2) 2.4 (5.4) 1.3
Missing 4.6 (6.5) 2.3 (5.6) 2.3

12
Variables Used To Predict GRE Test Performance Within Each Group
Based on the data in the BIQ, we constructed a series of categorical variables that will
play the role of “independent variables” or predictors in our analyses. We summarize them here.
Each variable has a name (in bold), a short name (in parentheses), and category labels (listed
below the name).
English Best Language (Eng Best)
Yes
No
Missing
Reasons for taking the GRE General test (Gen Rea)
(More than one of these categories, below, could be selected by a test taker. We treated
each of these categories as a single variable that could be either checked or not. There is no
missing data for this variable due to this convention.)
Admission to graduate school
Fellowship/scholarship application requirement
Undergraduate program exit requirement
External degree program
Practice
Graduate department requirement
Other
Father’s Education Level (Fathers Ed Lev)
Missing
Grade school or less
Some high school

13
High school diploma or equivalent
Business or trade school
Some college
Associate degree
Bachelor’s degree
Some graduate or professional school
Graduate or professional degree
Mother’s Education Level (Mothers Ed Lev)
Same categories as Fathers Ed Lev
Family Education Level (Family Ed Lev)
This was computed as the larger of Mothers Ed Lev and Fathers Ed Lev, using the
ordering of the possible responses indicated above.
Undergraduate Major Field (Ugrad Maj)
Life Science
Social Science
Humanities/Art
Education
Physical Sciences
Engineering
Business
Other Fields
Undecided or Missing
Intended Graduate Major Field (Grad Maj)

14
Same categories as Ugrad Maj.
Undergraduate Grade Point Average (GPA)
D or lower
C-
C
B-
B
A-
A
Missing
Full Time Graduate Enrollment (Full Time)
Full Time
Part Time
Undecided
Missing
Education Level at Registration (Ed Lev)
Sophomore
Junior
Senior
Unenrolled college graduate
First year graduate student
Second year graduate student
Unenrolled Masters graduate
Other
Missing

15
Tables H through O give the distributions of all of these variables in our sample broken
down by the 18 groups. Table numbers that include an (m) refer to males, while those with an (f)
refer to females. These tables of distributions are not our primary interest, but they were created
in the process of our analysis and we include them here for completeness. We have put those
entries in each table that stand out as substantially different from those in the rest of the table in
boldface. We operationalized “substantial” as differing by five or more percentage points from
the percentage in the row labeled “Total.” Thus, we do not put percents in boldface that are only
four or fewer percentage points from the overall average for the sample.
Method of Analysis
Our interest in this study is the prediction or association of GRE General Test Scores, V,
Q, and A, with the background variables available from the BIQ. We did this analysis in each of
the 18 groups defined by gender and race/ethnicity. This allows us to see how the 18 subgroups
are similar or different in how the BIQ variables predict or are associated with GRE scores.
In our analyses, the GRE General test scores, V, Q, and A, are used separately as
dependent variables in multiple regression analyses. The predictors for these regression analyses
are sets of 0/1 dummy or categorical variables corresponding to the several BIQ variables
described above. These categorical variables are displayed in Tables H through O. This
approach, using dummy variables, allows us to avoid making arbitrary ordering or scaling
assumptions for the levels or categories of the BIQ variables. In a few cases (e.g., GPA) it might
make sense to reduce the categorical variable to an integer-valued variable. Because most of the
BIQ variables do not have a natural order, however, we decided to treat them all in the same
way. This approach also allows us to see nonlinear relationships for predicting GRE scores for
the few ordered BIQ variables, such as GPA and parents’ education.
We had a large number of independent or predictor variables, three different dependent
variables, and 18 subpopulations on which to do each analysis. To make this systematic, we used
the same stepwise regression procedure to select the variables for inclusion in our prediction
equations. This was done “groupwise” in the sense that all of the 0/1 categorical variables for a
given BIQ variable were either brought in or left out of the equation as a group. Thus, we did not
treat them as a huge undifferentiated system of dummy variables to be stepped through
separately as the process proceeded. We used the SAS procedure PROC REG to do this with the

16
Table H (m)
Do You Communicate Better (or As Well) in English Than in Any Other Language?
MALE
Race/ethnic categories Yes No Missing
White (non-Hispanic) 95 4 0
Black, African American 94 5 0
Asian, Asian American, Pacific Islander 88 12 0
Mexican, Mexican American, Chicano 94 6 0
Other Hispanic, Latin American 92 7 0
Puerto Rican 71 28 0
American Indian, Alaskan Native 94 5 0
Other 92 7 0
Missing 76 4 20
Total 94 5 1
Note. Entries are row percents.
17
Table H (f)
Do You Communicate Better (or As Well) in English Than in Any Other Language?
FEMALE
Race/ethnic categoriesYes No Missing
White (non-Hispanic) 94 5 0
Black, African American 94 5 0
Asian, Asian American, Pacific Islander 89 11 0
Mexican, Mexican American, Chicano 94 6 0
Other Hispanic, Latin American 93 6 0
Puerto Rican 73 27 0
American Indian, Alaskan Native 95 5 0
Other 92 8 0
Missing 73 6 21
Total 94 6 0
Note. Entries are row percents.

Table I (m)
What Is (Are) Your Reason(s) for Taking the GRE Test(s)? (Select All That Apply.)
MALE
Race/ethnic categories
Admissionto graduate
school(1)
Graduatedepartmentrequirement
(6)
Fellowship/scholarshipapplicationrequirement
(2)
Practice(5)
Other(7)
Undergraduateprogram exitrequirement
(3)
Externaldegree
program(4)
White (non-Hispanic) 93 20 15 4 3 2 1
Black, African American 86 31 22 5 4 7 1
Asian, Asian American, PacificIslander
94 21 18 6 3 1 1
Mexican, Mexican American,Chicano
90 29 18 4 3 2 1
Other Hispanic, LatinAmerican
90 25 18 4 3 1 1
Puerto Rican 92 25 23 4 3 2 1
American Indian, AlaskanNative
89 28 19 5 4 2 1
Other 91 21 19 6 8 2 1
Missing 78 16 18 5 4 1 1
Total 92 21 16 4 3 3 1
Note. Entries are the percents of examinees selecting each reason. Reasons are ordered by decreasing percent selecting them in thetotal sample.
18

Table I (f)
What Is (Are) Your Reason(s) for Taking the GRE Test(s)? (Select All That Apply.)
FEMALE
Race/ethnic categories
Admissionto graduate
school(1)
Graduatedepartmentrequirement
(6)
Fellowship/scholarshipapplicationrequirement
(2)
Practice(5)
Other(7)
Undergraduateprogram exitrequirement
(3)
Externaldegree
program(4)
White (non-Hispanic) 93 22 12 5 2 1 1
Black, African American 86 32 21 5 3 6 1
Asian, Asian American,Pacific Islander
94 23 16 6 3 1 1
Mexican, MexicanAmerican, Chicano
90 31 15 4 3 1 1
Other Hispanic, LatinAmerican
90 28 14 5 3 1 1
Puerto Rican 92 26 20 4 3 1 1
American Indian, AlaskanNative
89 28 17 4 4 1 1
Other 91 24 18 6 5 1 1
Missing 78 18 16 5 4 1 1
Total 92 23 13 5 3 2 1
Note. Entries are the percents of examinees selecting each reason. Reasons are ordered by decreasing percent selecting them in thetotal sample.
19

Table J (m)
Undergraduate Major Field of Study
MALE
Race/ethnic categoriesLife
ScienceSocial
ScienceHumanities/
ArtOtherfields
Education PhysicalScience
Engineering Business Undecidedor missing
White (non-Hispanic) 18 18 17 8 6 10 11 4 8
Black, African American 13 25 11 10 7 8 9 7 10
Asian, Asian American,Pacific Islander
22 15 7 6 2 11 26 2 9
Mexican, MexicanAmerican, Chicano
15 24 16 9 7 7 12 5 7
Other Hispanic, LatinAmerican
16 23 15 9 5 7 14 4 8
Puerto Rican 20 18 10 7 4 8 20 4 9
American Indian, AlaskanNative
21 24 14 8 7 7 8 3 8
Other 14 21 21 8 3 9 9 3 13
Missing 11 15 15 6 2 10 10 2 29
Total 18 19 16 8 5 10 12 4 9
Note. Entries are the percents of examinees selecting the undergraduate major. Majors are ordered by decreasing percent selectingthem in the total sample.
20
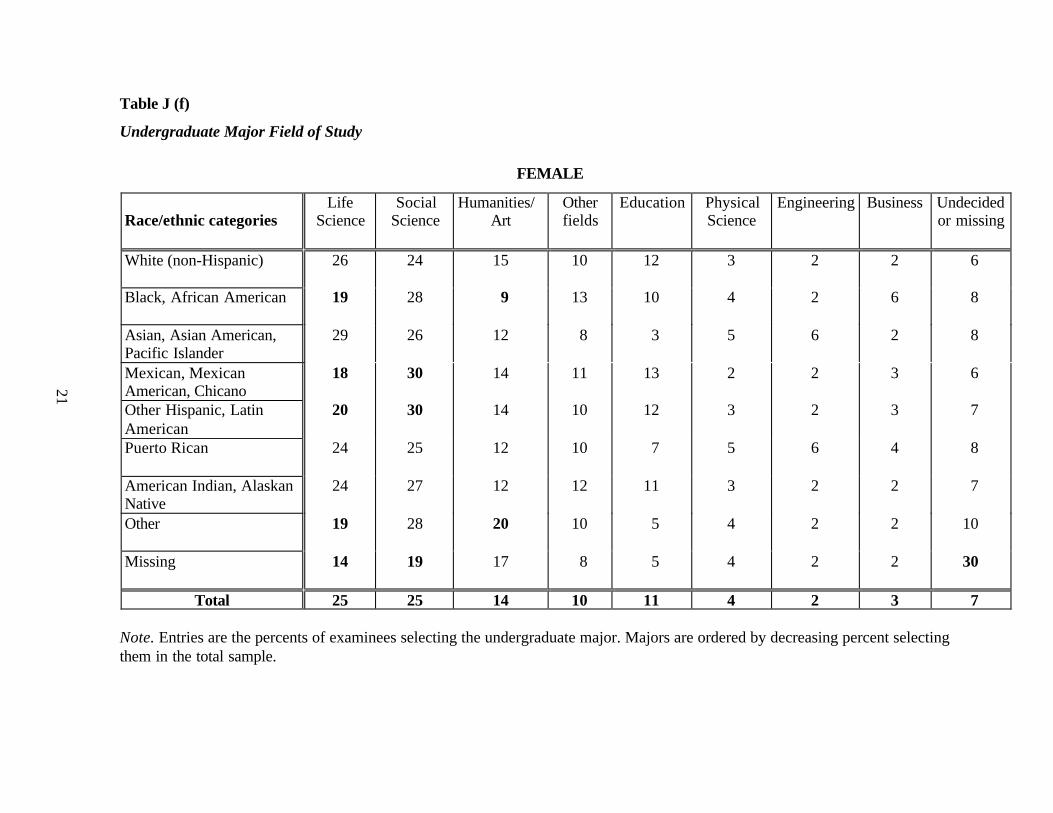
Table J (f)
Undergraduate Major Field of Study
FEMALE
Race/ethnic categoriesLife
ScienceSocial
ScienceHumanities/
ArtOtherfields
Education PhysicalScience
Engineering Business Undecidedor missing
White (non-Hispanic) 26 24 15 10 12 3 2 2 6
Black, African American 19 28 9 13 10 4 2 6 8
Asian, Asian American,Pacific Islander
29 26 12 8 3 5 6 2 8
Mexican, MexicanAmerican, Chicano
18 30 14 11 13 2 2 3 6
Other Hispanic, LatinAmerican
20 30 14 10 12 3 2 3 7
Puerto Rican 24 25 12 10 7 5 6 4 8
American Indian, AlaskanNative
24 27 12 12 11 3 2 2 7
Other 19 28 20 10 5 4 2 2 10
Missing 14 19 17 8 5 4 2 2 30
Total 25 25 14 10 11 4 2 3 7
Note. Entries are the percents of examinees selecting the undergraduate major. Majors are ordered by decreasing percent selectingthem in the total sample.
21

Table K (m)
Field in Which You Plan To Do Your Graduate Work. If You Are Undecided, Use 0000.
MALE
Race/ethnic categoriesLife
ScienceSocial
ScienceHumanities/
ArtOtherfields
Education PhysicalScience
Engineering Business Undecidedor missing
White (non-Hispanic) 18 14 12 17 10 10 10 2 8
Black, African American 12 18 7 19 15 7 8 4 10
Asian, Asian American,Pacific Islander
21 10 5 15 4 12 22 2 9
Mexican, MexicanAmerican, Chicano
15 17 11 16 15 6 11 2 7
Other Hispanic, LatinAmerican
17 18 10 16 9 7 12 2 8
Puerto Rican 20 15 8 16 6 9 18 2 7
American Indian, AlaskanNative
22 19 10 15 11 7 7 2 8
Other 14 16 14 17 7 8 8 1 13
Missing 10 12 11 15 5 9 8 1 30
Total 18 14 11 17 10 9 10 2 9
Note. Entries are the percents of examinees selecting the major field. The graduate major fields are ordered to agree with the orderof the undergraduate major fields.
22

Table K (f)
Field in Which You Plan To Do Your Graduate Work. If You Are Undecided, Use 0000.
FEMALE
Race/ethnic categoriesLife
ScienceSocial
ScienceHumanities/
ArtOtherfields
Education PhysicalScience
Engineering Business Undecidedor missing
White (non-Hispanic) 28 19 17 17 8 3 1 1 7
Black, African American 20 21 19 20 5 3 2 2 8
Asian, Asian American,Pacific Islander
31 19 16 9 6 4 5 1 8
Mexican, MexicanAmerican, Chicano
19 19 20 22 8 2 2 1 7
Other Hispanic, LatinAmerican
22 18 21 18 8 2 2 1 7
Puerto Rican 25 20 19 12 7 4 5 2 6
American Indian,Alaskan Native
25 19 20 16 7 2 2 1 7
Other 20 21 20 11 12 3 2 1 11
Missing 13 19 13 9 10 3 1 1 31
Total 26 19 17 17 8 3 2 1 7
Note. Entries are the percents of examinees selecting the major field. The graduate major fields are ordered to agree with the orderof the undergraduate major fields.
23

24
Table L (m)
Do You Plan To Attend (or if Enrolled, Are You Attending) Graduate School Full Time orPart Time?
MALE
Race/ethnic categoriesFull time Part time Undecided Missing
White (non-Hispanic) 70 16 10 4
Black, African American 66 20 10 4
Asian, Asian American, PacificIslander
74 12 9 6
Mexican, Mexican American,Chicano
68 21 7 3
Other Hispanic, Latin American 71 18 8 4
Puerto Rican 74 15 8 3
American Indian, Alaskan Native 76 15 7 3
Other 70 10 11 9
Missing 58 8 9 25
Total 70 16 10 5
Note. Entries are row percents.

25
Table L (f)
Do You Plan To Attend (or if Enrolled, Are You Attending) Graduate School Full Time orPart Time?
FEMALE
Race/ethnic categoriesFull time Part time Undecided Missing
White (non-Hispanic) 65 20 12 3
Black, African American 64 22 10 3
Asian, Asian American, PacificIslander
76 9 10 5
Mexican, Mexican American,Chicano
65 24 8 2
Other Hispanic, Latin American 67 21 9 3
Puerto Rican 72 16 10 2
American Indian, Alaskan Native 73 15 9 3
Other 70 12 12 7
Missing 53 9 12 25
Total 65 19 12 4
Note. Entries are row percents.

Table M (m)
Current Educational Status
MALE
Race/ethnic categories
Senior Unenrolledcollege
graduate
UnenrolledMastersgraduate
First yeargraduatestudent
Other Junior Second yeargraduatestudent
Sophomore Missing
White (non-Hispanic) 41 31 8 8 5 3 3 0 0
Black, African American 37 26 10 12 7 2 5 0 0
Asian, Asian American,Pacific Islander
43 32 7 5 6 4 3 0 0
Mexican, MexicanAmerican, Chicano
37 27 8 16 5 2 4 0 0
Other Hispanic, LatinAmerican
37 30 10 11 6 2 4 0 1
Puerto Rican 43 23 11 8 8 2 4 0 0
American Indian, AlaskanNative
40 27 10 11 7 2 3 0 0
Other 38 33 8 7 8 2 4 0 0
Missing 40 31 8 6 7 4 3 0 2
Total 41 31 9 8 5 3 3 0 0
Note. Entries are the percents of examinees selecting each level of educational status. Levels are ordered by decreasing percentselecting them in the total sample.
26

Table M (f)
Current Educational Status
FEMALE
Race/ethnic categories
Senior Unenrolledcollege
graduate
UnenrolledMastersgraduate
First yeargraduatestudent
Other Junior Second yeargraduatestudent
Sophomore Missing
White (non-Hispanic) 40 31 9 8 5 4 2 0 0
Black, African American 37 27 11 12 7 2 4 0 0
Asian, Asian American,Pacific Islander
41 35 6 4 6 5 2 0 0
Mexican, MexicanAmerican, Chicano
36 29 8 16 5 2 3 0 0
Other Hispanic, LatinAmerican
35 29 11 12 6 3 3 0 1
Puerto Rican 43 26 12 6 8 3 2 0 0
American Indian, AlaskanNative
38 27 10 11 7 3 4 0 0
Other 38 33 8 7 8 3 3 0 1
Missing 37 33 9 7 6 4 2 0 2
Total 39 31 9 9 6 4 2 0 0
Note. Entries are the percents of examinees selecting each level of educational status. Levels are ordered by decreasing percentselecting them in the total sample.
27

Table N (m)
What Is/Was Your Overall Undergraduate Grade Point Average?
MALE
Race/ethnic categoriesA A- B B- C C- D
or belowMissing
White (non-Hispanic) 13 26 33 15 7 0 0 6
Black, African American 4 11 31 24 22 1 0 6
Asian, Asian American, PacificIslander
9 22 37 16 7 0 0 8
Mexican, Mexican American,Chicano
6 18 36 20 14 1 0 5
Other Hispanic, Latin American 9 20 36 19 9 1 0 6
Puerto Rican 12 16 45 15 7 0 0 5
American Indian, Alaskan Native 9 21 34 18 13 1 0 5
Other 10 25 33 14 6 0 0 11
Missing 13 23 21 8 3 0 0 32
Total 12 24 33 16 8 0 0 6
Note. Entries are percents at the UGPA level indicated.
28

Table N (f)
What Is/Was Your Overall Undergraduate Grade Point Average?
FEMALE
Race/ethnic categoriesA A- B B- C C- D or
belowMissing
White (non-Hispanic) 15 27 35 12 5 0 0 5
Black, African American 6 11 35 22 19 1 0 5
Asian, Asian American, PacificIslander
8 23 39 15 6 0 0 8
Mexican, Mexican American,Chicano
7 17 38 19 13 1 0 4
Other Hispanic, Latin American 11 21 39 15 8 0 0 5
Puerto Rican 16 18 42 14 6 0 0 4
American Indian, Alaskan Native 10 20 37 17 10 1 0 5
Other 11 26 35 12 6 0 0 9
Missing 11 22 23 7 3 0 0 34
Total 14 25 36 13 7 0 0 6
Note. Entries are percents at the UGPA level indicated.
29

Table O - F (m)
Indicate the Highest Level of Education Completed by Your Father or Male Guardian (Select Only One Oval in Each Column)
MALE
Race/ethniccategories
Graduate/prof.
degree
BA/BS HS dip. orequiv.
Somecollege
Somegrad/prof
school
Bus/tradeschool
Somehigh
school
Associatedegree
Gradeschool or
less
Missing
White (non-Hispanic)
28 20 17 11 5 4 4 4 2 4
Black, AfricanAmerican
14 11 25 12 3 5 10 4 9 6
Asian, AsianAmerican, PacificIslander
32 20 11 8 6 3 6 4 5 6
Mexican, MexicanAmerican, Chicano
12 9 19 10 3 3 10 5 26 4
Other Hispanic,Latin American
23 14 16 11 5 5 8 4 10 4
Puerto Rican 19 20 19 9 4 4 7 4 10 4
American Indian,Alaskan Native
16 14 22 14 4 5 8 5 8 3
Other 31 16 13 9 6 4 4 4 4 9
Missing 23 12 7 6 8 3 3 5 2 32
Total 27 19 17 11 5 4 4 4 3 5
Note. Father’s education levels are ordered by decreasing percent selecting them in the total sample.
30

Table O - F (f)
Indicate the Highest Level of Education Completed by Your Father or Male Guardian (Select Only One Oval in Each Column)
FEMALE
Race/ethniccategories
Graduate/prof.
degree
BA/BS HS dip. orequiv.
Somecollege
Somegrad./prof.
school
Bus./tradeschool
Somehigh
school
Associatedegree
Gradeschool or
less
Missing
White (non-Hispanic)
26 20 18 13 5 5 4 4 2 3
Black, AfricanAmerican
12 11 25 13 3 6 9 4 9 7
Asian, AsianAmerican, PacificIslander
32 21 11 9 6 4 5 4 4 5
Mexican, MexicanAmerican, Chicano
11 10 18 12 3 4 9 5 25 3
Other Hispanic,Latin American
21 13 15 11 4 6 8 5 12 4
Puerto Rican 17 18 20 11 3 4 8 5 9 4
American Indian,Alaskan Native
16 14 22 14 4 6 8 4 8 4
Other 31 15 13 11 6 5 5 4 5 7
Missing 20 11 8 6 9 4 4 5 2 31
Total 25 18 18 12 5 5 5 4 4 4
Note. Father’s education levels are ordered by decreasing percent selecting them in the total sample.
31

Table O – M (m)
Indicate the Highest Level of Education Completed by Your Mother or Female Guardian (Select Only One Oval in EachColumn)
MALE
Race/ethniccategories
Graduate/prof.
degree
BA/BS HS dip. orequiv.
Somecollege
Somegrad./prof.
school
Bus./tradeschool
Somehigh
school
Associatedegree
Gradeschool or
less
Missing
White (non-Hispanic)
24 19 16 14 7 5 6 3 1 4
Black, AfricanAmerican
25 12 14 13 7 5 4 9 6 5
Asian, AsianAmerican, PacificIslander
17 24 16 8 6 3 5 7 8 6
Mexican, MexicanAmerican, Chicano
24 8 7 11 5 4 2 11 24 3
Other Hispanic,Latin American
24 13 13 12 7 6 4 8 9 4
Puerto Rican 21 21 13 9 8 4 4 7 9 4
American Indian,Alaskan Native
27 14 12 14 8 5 5 7 5 3
Other 17 17 20 12 6 4 6 4 4 9
Missing 10 14 14 8 7 4 7 4 1 32
Total 23 19 16 13 7 5 6 4 3 5
Note. Mother’s education levels are ordered to agree with the order of the father’s education levels.
32

Table O – M (f)
Indicate the Highest Level of Education Completed by Your Mother or Female Guardian (Select Only One Oval in EachColumn)
FEMALE
Race/ethniccategories
Graduate/prof.
degree
BA/BS HS dip. orequiv.
Somecollege
Somegrad./prof.
school
Bus./tradeschool
Somehigh
school
Associatedegree
Gradeschool or
less
Missing
White (non-Hispanic)
23 19 16 15 8 7 6 3 1 3
Black, AfricanAmerican
22 12 14 16 7 7 4 8 4 4
Asian, AsianAmerican, PacificIslander
15 25 17 9 6 4 6 6 7 5
Mexican, MexicanAmerican, Chicano
23 8 7 13 5 5 3 9 24 3
Other Hispanic,Latin American
20 12 12 15 7 7 4 8 10 3
Puerto Rican 20 20 14 11 9 5 3 7 8 3
American Indian,Alaskan Native
23 13 13 17 8 6 4 7 6 4
Other 17 17 19 13 7 5 7 5 4 7
Missing 10 12 14 8 7 4 9 4 2 31
Total 22 18 16 14 7 7 6 4 3 4
Note. Mother’s education levels are ordered to agree with the order of the father’s education levels.
33

Table O – P (m)
Highest Level of Parents’ Education
MALE
Race/ethniccategories
Graduate/prof.
degree
BA/BS HS dip. orequiv.
Somecollege
Somegrad./prof.
school
Bus./tradeschool
Somehigh
school
Associatedegree
Gradeschool or
less
Missing
White (non-Hispanic)
34 20 13 11 7 6 4 2 1 3
Black, AfricanAmerican
21 14 21 13 5 7 5 7 4 4
Asian, AsianAmerican, PacificIslander
35 21 10 7 7 4 2 5 4 5
Mexican, MexicanAmerican, Chicano
14 10 19 12 4 6 4 9 18 3
Other Hispanic,Latin American
27 15 15 11 5 6 5 6 6 3
Puerto Rican 25 22 17 8 5 6 3 5 6 3
American Indian,Alaskan Native
22 16 19 14 6 7 4 5 4 3
Other 37 16 10 9 7 5 3 3 2 9
Missing 26 12 6 5 10 5 2 2 1 31
Total 32 19 14 11 7 5 4 2 2 4
Note. Parent’s education is computed as the highest of mother’s and father’s reported education level. Education levels are orderedby decreasing percent in the total sample.
34
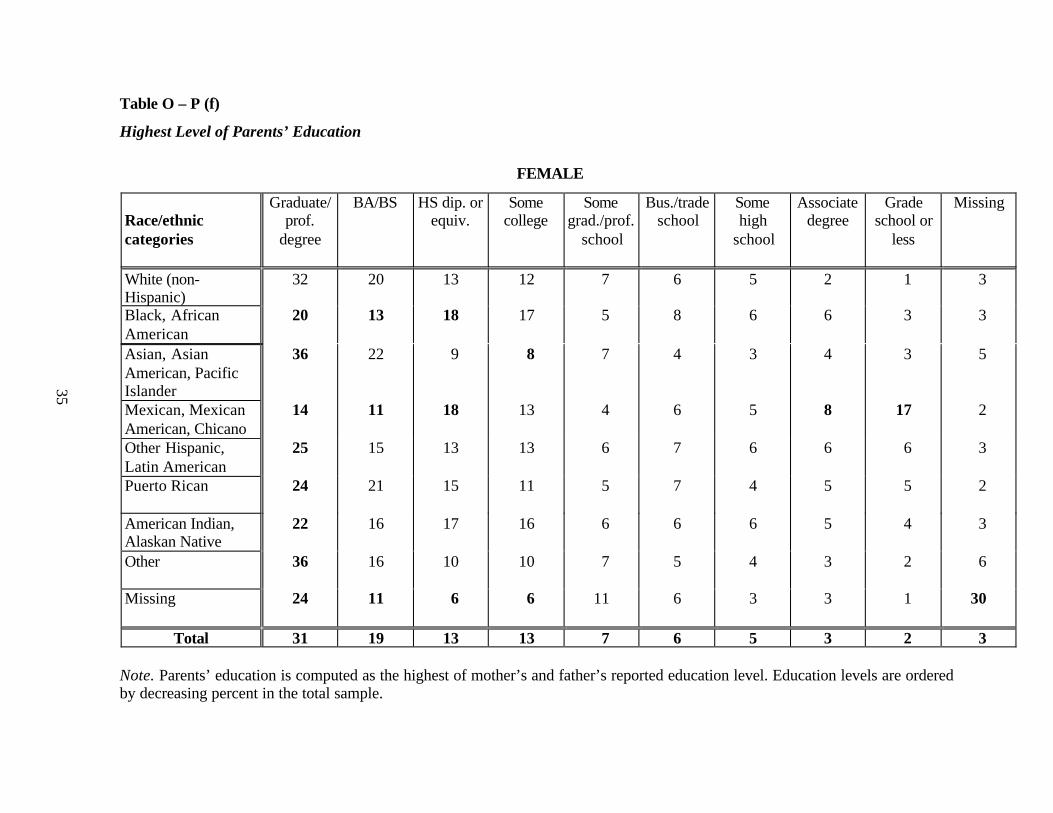
Table O – P (f)
Highest Level of Parents’ Education
FEMALE
Race/ethniccategories
Graduate/prof.
degree
BA/BS HS dip. orequiv.
Somecollege
Somegrad./prof.
school
Bus./tradeschool
Somehigh
school
Associatedegree
Gradeschool or
less
Missing
White (non-Hispanic)
32 20 13 12 7 6 5 2 1 3
Black, AfricanAmerican
20 13 18 17 5 8 6 6 3 3
Asian, AsianAmerican, PacificIslander
36 22 9 8 7 4 3 4 3 5
Mexican, MexicanAmerican, Chicano
14 11 18 13 4 6 5 8 17 2
Other Hispanic,Latin American
25 15 13 13 6 7 6 6 6 3
Puerto Rican 24 21 15 11 5 7 4 5 5 2
American Indian,Alaskan Native
22 16 17 16 6 6 6 5 4 3
Other 36 16 10 10 7 5 4 3 2 6
Missing 24 11 6 6 11 6 3 3 1 30
Total 31 19 13 13 7 6 5 3 2 3
Note. Parents’ education is computed as the highest of mother’s and father’s reported education level. Education levels are orderedby decreasing percent in the total sample.
35

36
GROUP and FORWARD options, and we set our forward stepwise inclusion condition so that
the next included BIQ variable had to be significant (as a group of dummy variables using the
proper F-test) at the .01 level. If none were, the stepwise procedure stopped. We then reviewed
the results of each regression analysis and eliminated variables that were entered towards the end
of the stepwise procedure and that did not increase the R-square by more than .01. We did this to
eliminate variables that met the statistical criterion due to the large sample sizes in the groups we
were studying. Our interest is not in statistically significant associations but in associations that
are substantial in size as well. We use the criterion of adding at least 1% to the R-square as our
standard for “substantial.”
Tables P and Q summarize the results of the stepwise regressions in general terms. Table
P shows the step at which each variable was brought into the equation, while Table Q shows the
R-square for the regression after that variable was included into the equation. (The maximum
values of the R-squares in Table Q are given again in Table 11 below.) The BIQ variables in
Tables P and Q are ordered by how often they were included in a regression model across all 54
( = 18 groups times three dependent variables) regression analyses. As mentioned earlier, neither
of the two age-related variables ever entered the regression analyses, and so they are not included
in Tables P or Q. While we indicate “the order of entry” into the stepwise regression model in
Table P, we do not wish to emphasize it as a measure of the variables “importance” for the
prediction of GRE test scores. Order of entry is, at best, a crude measure of the relative
association between the BIQ variables and the scores. We regard the important fact as whether or
not a variable did contribute some additional predictive information for test performance in
addition to the others predictors and thereby did enter the equation.
Table P shows that four variables show consistent and important associations with GRE
test scores. These are all associated with the examinees’ undergraduate education and are
undergraduate major, reasons for taking the general test, undergraduate GPA, and education
level at registration. These variables show up in the equations predicting every GRE score for
every group with the exception of “Ed Lev” for male “American Indian, Alaskan Natives.” The
other BIQ variables are important for some but not all of the groups. For example, English Best
Language is not often an important predictor, but for Puerto Rican males and females it is, and it
is the first variable stepped into the equation for the Verbal test.

Table P (m)
Order of Entry for Each Variable That the Step-wise Procedure Entered into the Prediction of Each GRE Score for EachGroup
MALE
Verbal
Race/ethnic categoriesUgrad
MajGenRea
GPA Ed Lev GradMaj
FullTime
FamilyEd Lev
FatherEd Lev
MotherEd Lev
EngBest
White (non-Hispanic) 1 3 5 4 2 6 7
Black, African Americanb 4 1 2 5 7 6 3
Asian, Asian American, PacificIslander
3 4 1 7 8 2 5 6
Mexican, Mexican American,Chicano
4 3 2 5 6 1 8 7
Other Hispanic, Latin American 3 4 1 5 7 8 2 6
Puerto Rican 2 5 4 7 6 3 1
American Indian, Alaskan Native 2 5 1 4 6 3
Other 3 4 1 5 6 2 a 9 8 7
Missing 2 5 1 3 7 8 4 9 6
aCases where Family Ed Lev entered early but was eliminated later due to lack of statistically significant (.005) coefficients whenother parental education variables were entered.bCases where Family Ed Lev was prevented from entering in order to simplify the interpretation of the role of parental educationin the resulting equation.
37

Table P (m)
Order of Entry for Each Variable That the Stepwise Procedure Entered into the Prediction of Each GRE Score for EachGroup
MALE
Quantitative
Race/ethnic categoriesUgrad
MajGenRea
GPA Ed Lev GradMaj
FullTime
FamilyEd Lev
FatherEd Lev
MotherEd Lev
EngBest
White (non-Hispanic) 1 3 6 5 2 4 7
Black, African American 1 2 4 5 6 3
Asian, Asian American, PacificIslander
1 4 2 5 7 6 9 3 8
Mexican, Mexican American,Chicano
1 3 4 5 6 7 2
Other Hispanic, Latin American 1 4 3 5 7 6 2
Puerto Rican 1 4 3 5 7 2 8 6
American Indian, Alaskan Native 1 4 2 5 6 3
Other 1 4 3 5 6 2 7
Missing 1 4 2 5 7 3 9 8 6
38

Table P (m)
Order of Entry for Each Variable That the Stepwise Procedure Entered into the Prediction of Each GRE Score for EachGroup
MALE
Analytical
Race/ethnic categoriesUgrad
MajGenRea
GPA Ed Lev GradMaj
FullTime
FamilyEd Lev
FatherEd Lev
MotherEd Lev
EngBest
White (non-Hispanic) 1 3 6 5 2 4 7 8
Black, African Americanb 3 1 4 5 8 7 6 2
Asian, Asian American, PacificIslander
5 4 1 3 6 2 7 8
Mexican, Mexican American,Chicano
3 2 4 5 6 1a 8 7
Other Hispanic, Latin American 4 5 3 2 6 1 7 8
Puerto Rican 2 5 3 6 1 4
American Indian, Alaskan Native 3 4 2 6 5 1
Otherb 4 3 2 5 7 8 1 6
Missing 2 4 1 5 6 3 9 8 7
aCases where Family Ed Lev entered early but was eliminated later due to lack of statistically significant (.005) coefficients whenother parental education variables were entered.bCases where Family Ed Lev was prevented from entering in order to simplify the interpretation of the role of parental educationin the resulting equation.
39

Table P (f)
Order of Entry for Each Variable That the Step-wise Procedure Entered into the Prediction of Each GRE Score for EachGroup
FEMALE
Verbal
Race/ethnic categoriesUgrad
MajGenRea
GPA Ed Lev GradMaj
FullTime
FamilyEd Lev
FatherEd Lev
MotherEd Lev
EngBest
White (non-Hispanic) 1 3 6 4 2 5 7 8
Black, African American 1 2 3 5 6 4 7
Asian, Asian American, PacificIslander
4 1 2 5 8 7 10 3 6 9
Mexican, Mexican American,Chicano
3 4 2 5 7 6 1
Other Hispanic, Latin American 3 4 2 5 6 1 8 7
Puerto Rican 2 6 3 5 4 7 1
American Indian, Alaskan Native 1 4 2 5 6 3
Other 3 4 1 5 6 7 2 8
Missing 2 4 1 5 7 3 8 6
40

Table P (f)
Order of Entry for Each Variable That the Stepwise Procedure Entered into the Prediction of Each GRE Score for EachGroup
FEMALE
Quantitative
Race/ethnic categoriesUgrad
MajGenRea
GPA Ed Lev GradMaj
FullTime
FamilyEd Lev
FatherEd Lev
MotherEd Lev
EngBest
White (non-Hispanic) 1 3 6 5 2 4 7
Black, African American 1 2 3 5 6 7 4
Asian, Asian American, PacificIslander
1 4 2 6 7 5 3 9 8
Mexican, Mexican American,Chicano
1 5 3 4 7 6 2
Other Hispanic, Latin Americana 1 5 3 4 8 6 2 7
Puerto Rican 1 6 4 2 8 7 3 9 5
American Indian, Alaskan Native 1 4 3 5 2
Other 1 4 3 5 7 6 2 8
Missing 1 5 2 3 9 6 8 4 7
aCases where Family Ed Lev was prevented from entering in order to simplify the interpretation of the role of parental education inthe resulting equation.
41

Table P (f)
Order of Entry for Each Variable That the Stepwise Procedure Entered into the Prediction of Each GRE Score for EachGroup
FEMALE
Analytical
Race/ethnic categoriesUgrad
MajGenRea
GPA Ed Lev GradMaj
FullTime
FamilyEd Lev
FatherEd Lev
MotherEd Lev
EngBest
White (non-Hispanic) 1 3 6 5 2 4 7 8
Black, African American 1 2 3 5 8 7 4 6 9
Asian, Asian American, PacificIslander
5 1 2 4 6 3 7
Mexican, Mexican American,Chicano
3 5 4 2 8 7 6 1
Other Hispanic, Latin American 4 5 3 2 6 1a 8 7
Puerto Rican 5 6 4 1 7 3 8 2
American Indian, Alaskan Native 2 5 3 4 1
Otherb 4 3 2 5 8 7 1 6
Missing 4 5 1 2 6 3
aCases where Family Ed Lev entered early but was eliminated later due to lack of statistically significant (.005) coefficients whenother parental education variables were entered.bCases where Family Ed Lev was prevented from entering in order to simplify the interpretation of the role of parental educationin the resulting equation.
42
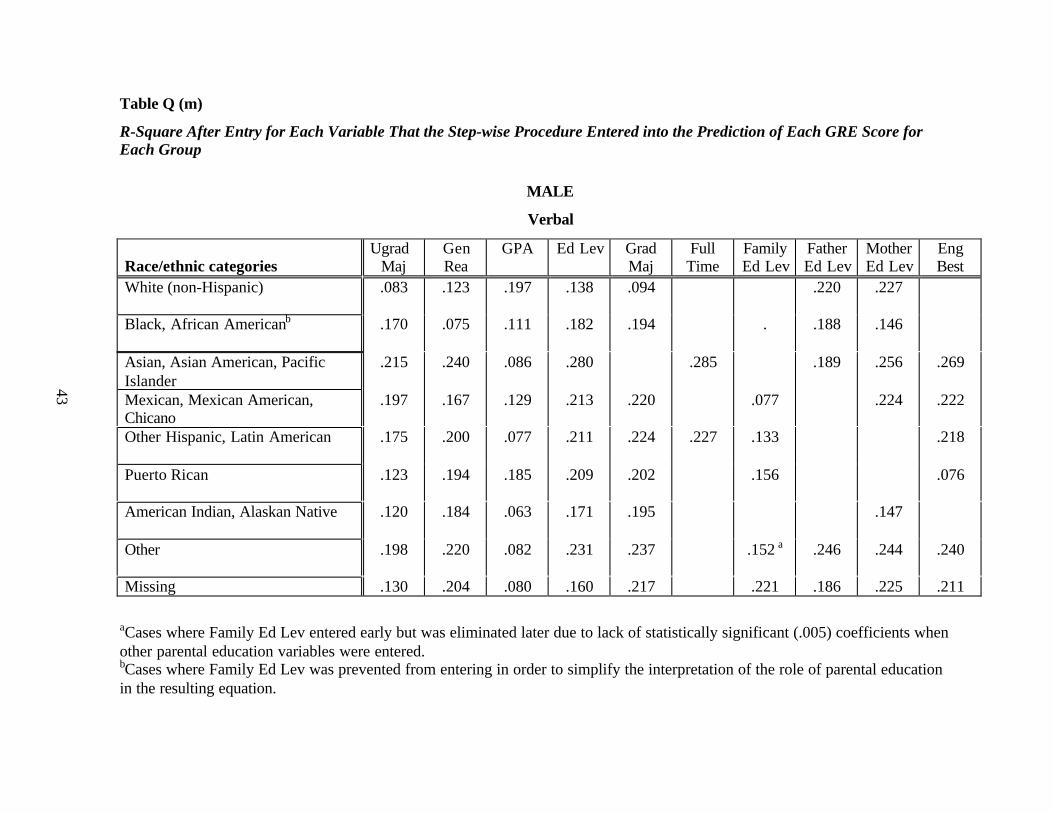
Table Q (m)
R-Square After Entry for Each Variable That the Step-wise Procedure Entered into the Prediction of Each GRE Score forEach Group
MALE
Verbal
Race/ethnic categoriesUgrad
MajGenRea
GPA Ed Lev GradMaj
FullTime
FamilyEd Lev
FatherEd Lev
MotherEd Lev
EngBest
White (non-Hispanic) .083 .123 .197 .138 .094 .220 .227
Black, African Americanb .170 .075 .111 .182 .194 . .188 .146
Asian, Asian American, PacificIslander
.215 .240 .086 .280 .285 .189 .256 .269
Mexican, Mexican American,Chicano
.197 .167 .129 .213 .220 .077 .224 .222
Other Hispanic, Latin American .175 .200 .077 .211 .224 .227 .133 .218
Puerto Rican .123 .194 .185 .209 .202 .156 .076
American Indian, Alaskan Native .120 .184 .063 .171 .195 .147
Other .198 .220 .082 .231 .237 .152 a .246 .244 .240
Missing .130 .204 .080 .160 .217 .221 .186 .225 .211
aCases where Family Ed Lev entered early but was eliminated later due to lack of statistically significant (.005) coefficients whenother parental education variables were entered.bCases where Family Ed Lev was prevented from entering in order to simplify the interpretation of the role of parental educationin the resulting equation.
43

Table Q (m)
R-Square After Entry for Each Variable That the Stepwise Procedure Entered into the Prediction of Each GRE Score for EachGroup
MALE
Quantitative
Race/ethnic categoriesUgrad
MajGenRea
GPA Ed Lev GradMaj
FullTime
FamilyEd Lev
FatherEd Lev
MotherEd Lev
EngBest
White (non-Hispanic) .193 .238 .299 .253 .204 .246 .322
Black, African American .192 .254 .310 .321 .328 .284
Asian, Asian American, PacificIslander
.168 .320 .249 .333 .341 .337 .347 .297 .344
Mexican, Mexican American,Chicano
.224 .311 .338 .353 .360 .365 .273
Other Hispanic, Latin American .170 .298 .268 .316 .329 .323 .226
Puerto Rican .215 .309 .290 .318 .330 .254 .335 .324
American Indian, Alaskan Native .160 .289 .217 .308 .315 .264
Other .153 .288 .259 .296 .302 .210 .306
Missing .160 .265 .213 .279 .289 .243 .297 .293 .284
44

Table Q (m)
R-Square After Entry for Each Variable That the Stepwise Procedure Entered into the Prediction of Each GRE Score for EachGroup
MALE
Analytical
Race/ethnic categoriesUgrad
MajGenRea
GPA Ed Lev GradMaj
FullTime
FamilyEd Lev
FatherEd Lev
MotherEd Lev
EngBest
White (non-Hispanic) .059 .102 .161 .124 .068 .114 .182 .188
Black, African Americanb .163 .085 .186 .201 .215 .211 .208 .132
Asian, Asian American, PacificIslander
.245 .234 .089 .211 .254 .177 .263 .265
Mexican, Mexican American,Chicano
.180 .145 .206 .223 .228 .096a .235 .232
Other Hispanic, Latin American .182 .201 .156 .119 .209 .072 .214 .216
Puerto Rican .095 .165 .128 .178 .055 .148
American Indian, Alaskan Native .159 .182 .119 .197 .189 .071
Otherb .196 .167 .128 .209 .221 .224 .075 .217
Missing .129 .185 .086 .202 .207 .161 .217 .213 .209
aCases where Family Ed Lev entered early but was eliminated later due to lack of statistically significant (.005) coefficients whenother parental education variables were entered.bCases where Family Ed Lev was prevented from entering in order to simplify the interpretation of the role of parental educationin the resulting equation.
45

Table Q (f)
R-Squares After Entry for Each Variable That the Stepwise Procedure Entered into the Prediction of Each GRE Score forEach Group
FEMALE
Verbal
Race/ethnic categoriesUgrad
MajGenRea
GPA Ed Lev GradMaj
FullTime
FamilyEd Lev
FatherEd Lev
MotherEd Lev
EngBest
White (non-Hispanic) .089 .118 .201 .135 .098 .138 .222 .226
Black, African American .048 .102 .137 .175 .182 .163 .188
Asian, Asian American, PacificIslander
.217 .051 .123 .230 .250 .247 .255 .188 .240 .253
Mexican, Mexican American,Chicano
.188 .212 .140 .228 .235 .233 .081
Other Hispanic, Latin American .195 .219 .140 .236 .240 .080 .245 .243
Puerto Rican .100 .174 .129 .164 .152 .181 .068
American Indian, Alaskan Native .075 .172 .133 .183 .191 .157
Other .224 .254 .118 .266 .270 .272 .181 .275
Missing .178 .239 .106 .252 .260 .215 .264 .255
46
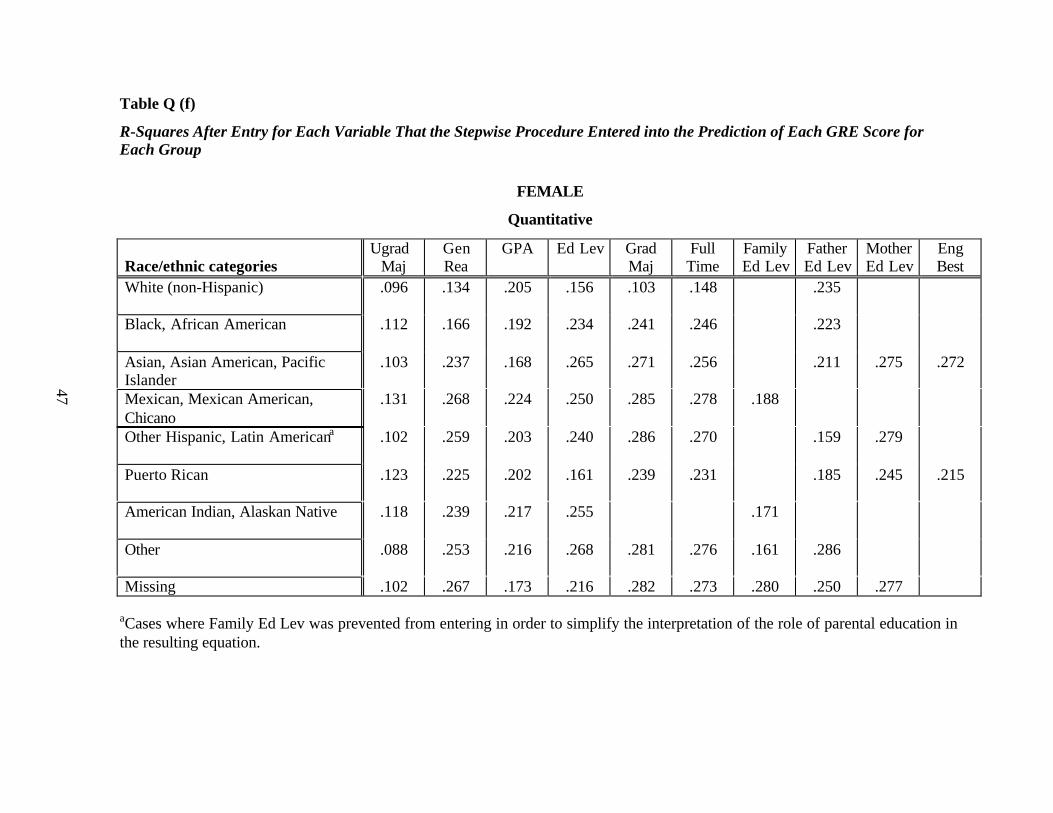
Table Q (f)
R-Squares After Entry for Each Variable That the Stepwise Procedure Entered into the Prediction of Each GRE Score forEach Group
FEMALE
Quantitative
Race/ethnic categoriesUgrad
MajGenRea
GPA Ed Lev GradMaj
FullTime
FamilyEd Lev
FatherEd Lev
MotherEd Lev
EngBest
White (non-Hispanic) .096 .134 .205 .156 .103 .148 .235
Black, African American .112 .166 .192 .234 .241 .246 .223
Asian, Asian American, PacificIslander
.103 .237 .168 .265 .271 .256 .211 .275 .272
Mexican, Mexican American,Chicano
.131 .268 .224 .250 .285 .278 .188
Other Hispanic, Latin Americana .102 .259 .203 .240 .286 .270 .159 .279
Puerto Rican .123 .225 .202 .161 .239 .231 .185 .245 .215
American Indian, Alaskan Native .118 .239 .217 .255 .171
Other .088 .253 .216 .268 .281 .276 .161 .286
Missing .102 .267 .173 .216 .282 .273 .280 .250 .277
aCases where Family Ed Lev was prevented from entering in order to simplify the interpretation of the role of parental education inthe resulting equation.
47

Table Q (f)
R-Squares After Entry for Each Variable That the Stepwise Procedure Entered into the Prediction of Each GRE Score forEach Group
FEMALE
Analytical
Race/ethnic categoriesUgrad
MajGenRea
GPA Ed Lev GradMaj
FullTime
FamilyEd Lev
FatherEd Lev
MotherEd Lev
EngBest
White (non-Hispanic) .048 .082 .143 .106 .054 .097 .169 .176
Black, African American .048 .100 .122 .166 .184 .180 .156 .174 .184
Asian, Asian American, PacificIslander
.198 .053 .105 .184 .211 .162 .218
Mexican, Mexican American,Chicano
.191 .235 .220 .158 .258 .254 .246 .106
Other Hispanic, Latin American .191 .209 .162 .131 .218 .080a .226 .223
Puerto Rican .144 .154 .124 .044 .161 .102 .166 .071
American Indian, Alaskan Native .122 .179 .152 .169 .072
Otherb .210 .186 .138 .228 .246 .244 .080 .238
Missing .223 .244 .091 .152 .249 .198
aCases where Family Ed Lev entered early but was eliminated later due to lack of statistically significant (.005) coefficients whenother parental education variables were entered.bCases where Family Ed Lev was prevented from entering in order to simplify the interpretation of the role of parental educationin the resulting equation.
48

49
After we had done the original analyses, we realized that the variable called Family Ed
Lev (i.e., the maximum of Mothers Ed Lev and Fathers Ed Lev), had, in eight cases, entered
early in the stepwise procedure. Then later, after both Mothers Ed Lev and Father Ed Lev had
also entered, the coefficients for Family Ed Lev were reduced to small and even statistically
insignificant values. To deal with this, we reanalyzed these few cases in the following way. First,
we redid the stepwise regression for these eight cases, but this time we allowed backward
elimination to occur. In three of these cases, Family Ed Lev was eliminated from the equation
due to nonsignificant coefficients (p > .005) while no other variables were eliminated. In the
other five cases, backward elimination did not change the results, so we redid the stepwise
regression but did not allow Family Ed Lev to be brought into the equation. This resulted in very
small differences in overall results, so we replaced the values in the tables and figures with these
new results. Footnotes to Tables P and Q indicate the groups where these special analyses apply.
One of these cases did result in differences worth mentioning here, African American males on
the Analytical test. In this case, the largest value of R-square fell from .265 to .215 (whereas the
change in R-square was no more than .002 in all the other cases). In addition, both Fathers Ed
Lev and Mothers Ed Lev entered the equation. This suggests a possible interaction between
Mothers Ed Lev and Fathers Ed Lev that Family Ed Lev picks up but the additive combination of
Mothers Ed Lev and Fathers Ed Lev does not. We did not explore this idea further because it
only applied to the prediction of one test score, but it may be worth clarifying in later analyses.
From the way that the various BIQ variables predict GRE scores, our overall impression
is that those variables closer to undergraduate education are the most consistent and important
predictors of GRE performance, and those BIQ variables related the background of the
examinees are less consistently related to GRE performance but are important for some groups.
The influence of background is specific to groups and tests, sometimes strongly so, but not
consistently across groups and tests.
Results of the Analyses
The many tables given so far are included in the report to answer various ancillary
questions that readers may ask about our sample and the predictor variables. For this reason, we
have labeled them with letters to distinguish them from the tables and figures that summarize the
regression results of primary interest to us. The main tables are numbered rather than lettered and
50
each has several accompanying similarly numbered figures that convey the same information as
the tables but often more clearly. Our numbered tables give the regression coefficients for each
of the 0/1 dummy variables associated with each BIQ categorical variable. These regression
coefficients are all “net” of the other variables included in the final prediction equation, which
can be read in the corresponding rows of Tables P(m) and P(f). We have ordered the sequence of
tables to correspond to the BIQ variables that have the most consistent overall relationship to
GRE test performance. This is the same ordering of the columns in Tables P and Q. Thus, for
example, Tables 1a through 1f are all concerned with the BIQ variable, undergraduate major. In
this data set, it is the single most consistently important predictor of GRE test performance. The
order of the categories of undergraduate major was chosen so that the effects would be
monotonic for the White females on the Verbal test. This is an arbitrary choice, but we did it to
give some reference ordering to all categories for the variables that had no “natural order” for
their categories. We chose White females as our reference group because from Table A we see
that this group comprises almost half of our total sample, and is far larger than any other. The
choice of Verbal score was also arbitrary, but we had to make a choice and the Verbal score is
widely used by many graduate programs. We use this convention for ordering categories
throughout the numbered tables and figures in this report. Thus, any variation from a monotonic
trend in the effects is due to a difference from the trend in the effects for that predictor variable
for the White females on the Verbal test.
The regression coefficients or “effects” given in Table 1a and plotted in Figure 1a are
interpreted as differences in average GRE scores between the specified undergraduate major and
the reference category, which in this case is Engineering. These “effects” are all net of the other
BIQ variables included in our final choice of stepwise regression model for each combination of
group and GRE test score. Hence, for example, White males in the Humanities averaged 17.7
points higher than similar White males in Engineering on the GRE Verbal test, but they averaged
111.2 points less than similar White males in Engineering on the Quantitative test. Here
“similar” means similar in the values of the other BIQ variables. This notion of “similarity" is
what we mean by calling these effects “net of the other BIQ variables,” (i.e., those variables that
are in the first row of Table P(m)). The reference category is indicated in the titles of each table
or graph, and this category has a column consisting of 0.0 in each table. Table 2 is an exception

51
because more than one reason for taking the GRE could be checked off, so these effects are all
relative to not checking off the specific reason.
The difference between the average scores of a category and any other category of
undergraduate major is obtained by subtracting the effects for the two categories. For example,
White males in the Humanities averaged 17.7 – (-12.0) = 29.7 points higher than White males in
the Social Sciences on the Verbal Test. We do not address detailed issues of the statistical
significance of the many millions of such differences that can be computed using Tables 1 to 10
of this report. Because of the F-test criterion that we used for including such variables in our
analysis, however, we are assured that at least one contrast or linear combination of the effects
for every BIQ variable reported here is statistically significant. The significance levels achieved
in most of these analyses are much smaller than .01. We think the important findings of this
report are the general trends in the effects rather than pairwise differences between the
categories. These trends are easier to visualize using the figures than through close examination
of the tables.
Figure 1a corresponds to Table 1a and displays the most important aspects of the
estimated regression coefficients or effects. In Figure 1a we have suppressed the data from those
whose undergraduate major was missing on the registration form as well as the two
race/ethnicity categories of “Other” and “Missing.” We suppressed these values because they are
the least interpretable in Table 1a, and the graph was cluttered enough without including them.
We followed this convention throughout the graphs associated with each table. Of course, the
corresponding table includes the information that is suppressed in its graph. All of the graphs
were made using a spreadsheet program, Microsoft Excel for Windows.
Figure 1a shows that there is considerable agreement in the overall pattern of effects
across the ethnic groups for males with slight exceptions for both Asian and Puerto Rican males.
An important feature of Figures 1–10 needs to be mentioned. From Table P, we can see
that some of the predictors did not enter the stepwise regression for some groups or GRE scores.
In these cases, while the legends of the figures will list all of the groups, the figure itself will
only contain information for those groups for which the variable did enter the stepwise analyses.
Many regression analyses give rise to Tables and Figures 1–10. As a whole, these
analyses are hard to comprehend—and probably the effort to do so is ill advised. For this reason,
we include two further summary tables that contain some useful overall information about them.

Table 1a
Net Effects, Relative to Engineering, for Undergraduate Major for Predicting Each GRE Score for Each Group
MALE
Verbal
Race/ethnic categories Humanities Engineering Phy Sci Social Sci Life Sci Business Other Education Missing
White (non-Hispanic) 17.7 0.0 0.6 -12.0 -21.8 -31.6 -28.2 -57.5 -14.3
Black, African American 6.1 0.0 -13.7 -15.3 -20.9 -25.3 -16.7 -42.2 -24.6
Asian, Asian American, PacificIslander
62.3 0.0 17.4 20.4 7.9 -5.2 -3.8 -30.0 2.4
Mexican, Mexican American,Chicano
7.1 0.0 5.9 -4.4 -7.4 -18.0 -13.3 -44.3 -17.5
Other Hispanic, Latin American 14.2 0.0 7.0 -13.0 -16.2 -18.7 -29.4 -56.7 -15.0
Puerto Rican 30.6 0.0 -6.5 -12.0 -0.5 -40.9 10.5 -50.2 -28.6
American Indian, AlaskanNative
32.8 0.0 0.9 -5.3 -6.3 -10.4 -27.0 -30.7 -20.4
Other 26.3 0.0 15.3 -5.5 -3.0 -38.9 -15.9 -53.4 -8.3
Missing 22.7 0.0 8.8 -7.4 -15.3 -38.8 -18.3 -57.5 -25.6
52

Table 1b
Net Effects, Relative to Engineering, for Undergraduate Major for Predicting Each GRE Score for Each Group
MALE
Quantitative
Race/ethnic categories Humanities Engineering Phy Sci Social Sci Life Sci Business Other Education Missing
White (non-Hispanic) -111.2 0.0 -29.2 -108.2 -86.9 -91.9 -120.9 -131.5 -76.9
Black, African American -114.7 0.0 -27.1 -116.0 -96.7 -99.0 -119.7 -127.3 -100.5
Asian, Asian American, PacificIslander
-86.9 0.0 -20.4 -89.8 -54.8 -81.8 -103.0 -138.1 -57.6
Mexican, Mexican American,Chicano
-119.9 0.0 -11.3 -119.9 -86.4 -98.0 -120.5 -138.7 -101.0
Other Hispanic, Latin American -114.9 0.0 -18.0 -106.8 -77.9 -88.9 -112.8 -128.1 -87.9
Puerto Rican -108.3 0.0 -52.5 -127.4 -98.6 -127.6 -120.9 -166.6 -102.0
American Indian, AlaskanNative
-80.8 0.0 -46.3 -83.4 -61.5 -69.7 -126.1 -100.7 -98.2
Other -101.3 0.0 -19.2 -100.5 -68.8 -101.3 -109.6 -141.3 -85.6
Missing -94.6 0.0 -18.7 -98.0 -70.6 -107.6 -103.5 -131.6 -89.9
53

Table 1c
Net Effects, Relative to Engineering, for Undergraduate Major for Predicting Each GRE Score for Each Group
MALE
Analytical
54
Race/ethnic categories Humanities Engineering Phy Sci Social Sci Life Sci Business Other Education Missing
White (non-Hispanic) -39.1 0.0 -12.8 -46.6 -40.7 -44.8 -56.8 -71.0 -39.6
Black, African American -38.8 0.0 -17.6 -42.6 -39.1 -38.7 -46.6 -60.4 -49.4
Asian, Asian American, PacificIslander
-17.9 0.0 3.2 -32.6 -22.3 -36.9 -50.4 -69.1 -30.1
Mexican, Mexican American,Chicano
-40.2 0.0 -1.7 -48.3 -35.6 -43.9 -56.1 -74.8 -64.8
Other Hispanic, Latin American -29.7 0.0 17.0 -42.6 -29.3 -32.8 -46.5 -71.6 -40.3
Puerto Rican -8.9 0.0 -12.0 -25.9 -34.0 -42.8 -38.4 -78.7 -55.2
American Indian, AlaskanNative
-21.7 0.0 -29.5 -36.1 -24.9 -44.3 -67.1 -58.0 -55.4
Other -25.0 0.0 4.0 -36.9 -20.6 -55.1 -39.4 -74.1 -45.3
Missing -30.2 0.0 10.7 -37.5 -34.1 -57.9 -45.2 -89.2 -46.3

Table 1d
Net Effects, Relative to Engineering, for Undergraduate Major for Predicting Each GRE Score for Each Group
FEMALE
Verbal
Race/ethnic categories Humanities Engineering Phy Sci Social Sci Life Sci Business Other Education Missing
White (non-Hispanic) 7.4 0.0 -12.8 -30.5 -34.0 -40.0 -45.1 -64.5 -32.1
Black, African American -0.8 0.0 -29.7 -26.1 -31.3 -38.5 -35.3 -51.0 -38.8
Asian, Asian American, PacificIslander
25.9 0.0 -7.7 -6.4 -7.4 -24.7 -21.5 -47.1 -22.0
Mexican, Mexican American,Chicano
0.0 0.0 -10.2 -29.4 -25.2 -29.7 -32.1 -53.6 -41.6
Other Hispanic, Latin American 15.6 0.0 5.2 -13.0 -18.7 -11.9 -27.9 -55.0 -36.9
Puerto Rican 49.8 0.0 10.2 22.5 6.7 9.1 7.9 -7.2 3.5
American Indian, AlaskanNative
-3.3 0.0 -30.6 -37.3 -36.6 -34.5 -49.9 -72.8 -57.1
Other 11.6 0.0 -5.8 -22.5 -24.0 -40.3 -28.7 -61.7 -31.2
Missing 16.5 0.0 2.5 -14.6 -21.0 -70.0 -30.0 -63.9 -35.7
55

Table 1e
Net Effects, Relative to Engineering, for Undergraduate Major for Predicting Each GRE Score for Each Group
FEMALE
Quantitative
56
Race/ethnic categories Humanities Engineering Phy Sci Social Sci Life Sci Business Other Education Missing
White (non-Hispanic) -128.5 0.0 -40.3 -130.0 -117.2 -109.0 -147.3 -148.2 -118.0
Black, African American -116.0 0.0 -44.0 -118.4 -108.2 -111.0 -133.6 -132.6 -115.1
Asian, Asian American, PacificIslander
-103.7 0.0 -38.4 -105.6 -83.2 -93.0 -117.8 -144.8 -93.2
Mexican, Mexican American,Chicano
-139.4 0.0 -36.7 -138.2 -116.8 -113.5 -148.7 -156.9 -140.6
Other Hispanic, Latin American -109.6 0.0 -37.1 -111.0 -91.8 -88.7 -130.3 -131.8 -114.0
Puerto Rican -116.3 0.0 -58.2 -117.1 -100.5 -92.2 -127.9 -132.5 -100.2
American Indian, AlaskanNative
-169.5 0.0 -42.3 -160.5 -146.8 -142.3 -187.2 -184.7 -178.0
Other -119.6 0.0 -40.8 -126.4 -101.0 -109.7 -138.5 -155.8 -126.7
Missing -140.5 0.0 -42.2 -142.2 -111.8 -182.6 -153.7 -174.4 -152.2

Table 1f
Net Effects, Relative to Engineering, for Undergraduate Major for Predicting Each GRE Score for Each Group
FEMALE
Analytical
57
Race/ethnic categories Humanities Engineering Phy Sci Social Sci Life Sci Business Other Education Missing
White (non-Hispanic) -59.5 0.0 -24.9 -66.1 -65.1 -60.8 -81.2 -90.7 -70.1
Black, African American -46.2 0.0 -28.8 -51.1 -55.0 -55.1 -64.2 -73.3 -64.6
Asian, Asian American, PacificIslander
-41.2 0.0 -17.6 -49.9 -48.8 -52.4 -60.3 -83.9 -60.6
Mexican, Mexican American,Chicano
-86.9 0.0 -41.3 -88.5 -83.5 -85.5 -97.4 -114.4 -102.0
Other Hispanic, Latin American -67.5 0.0 -22.6 -70.3 -66.5 -66.8 -89.5 -100.9 -95.3
Puerto Rican -46.7 0.0 -43.6 -47.4 -56.0 -48.1 -67.6 -76.6 -57.9
American Indian, AlaskanNative
-44.0 0.0 -25.6 -63.5 -62.6 -62.8 -94.7 -106.4 -94.8
Other -46.8 0.0 -23.0 -60.2 -53.1 -63.6 -67.4 -94.5 -72.3
Missing -32.6 0.0 -0.2 -49.0 -42.5 -107.7 -64.7 -85.6 -68.1

58
Figure 1a: Net Effects, Relative to Engineering, for Undergraduate Major for Predicting Each GRE Score for Each Group
Males, Verbal
-200.0
-180.0
-160.0
-140.0
-120.0
-100.0
-80.0
-60.0
-40.0
-20.0
0.0
20.0
40.0
60.0
80.0
humanit eng physci socsci lifesci busin other educa
Undergraduate Major
GR
E-V
Po
ints
White (non-Hispanic) Black or African AmericanAsian, Asian American, or Pacific Islander Mexican, Mexican American, Chicano
Other Hispanic or Latin American Puerto RicanAmerican Indian or Alaskan Native

59
Figure 1b: Net Effects, Relative to Engineering, for Undergraduate Major for Predicting Each GRE Score for Each Group
Males, Quantitative
-200.0
-180.0
-160.0
-140.0
-120.0
-100.0
-80.0
-60.0
-40.0
-20.0
0.0
20.0
40.0
60.0
80.0
humanit eng physci socsci lifesci busin other educa
Undergraduate Major
GR
E-Q
Poi
nts
White (non-Hispanic) Black or African American
Asian, Asian American, or Pacific Islander Mexican, Mexican American, ChicanoOther Hispanic or Latin American Puerto Rican
American Indian or Alaskan Native

60
Figure 1c: Net Effects, Relative to Engineering, for Undergraduate Major for Predicting Each GRE Score for Each Group
Male, Analytical
-200.0
-180.0
-160.0
-140.0
-120.0
-100.0
-80.0
-60.0
-40.0
-20.0
0.0
20.0
40.0
60.0
80.0
humanit eng physci socsci lifesci busin other educa
Undergraduate Major
GR
E-A
Po
ints
White (non-Hispanic) Black or African AmericanAsian, Asian American, or Pacific Islander Mexican, Mexican American, ChicanoOther Hispanic or Latin American Puerto Rican
American Indian or Alaskan Native

61
Figure 1d: Net Effects, Relative to Engineering, for Undergraduate Major for Predicting Each GRE Score for Each Group
Females, Verbal
-200.0
-180.0
-160.0
-140.0
-120.0
-100.0
-80.0
-60.0
-40.0
-20.0
0.0
20.0
40.0
60.0
80.0
humanit eng physci socsci lifesci busin other educa
Undergraduate Major
GR
E-V
Po
ints
White (non-Hispanic) Black or African American
Asian, Asian American, or Pacific Islander Mexican, Mexican American, Chicano
Other Hispanic or Latin American Puerto Rican
American Indian or Alaskan Native

62
Figure 1e: Net Effects, Relative to Engineering, for Undergraduate Major for Predicting Each GRE Score for Each Group
Female, Quantitative
-200.0
-180.0
-160.0
-140.0
-120.0
-100.0
-80.0
-60.0
-40.0
-20.0
0.0
20.0
40.0
60.0
80.0
humanit eng physci socsci lifesci busin other educa
Undergraduate Major
GR
E-Q
Poi
nts
White (non-Hispanic) Black or African American
Asian, Asian American, or Pacific Islander Mexican, Mexican American, Chicano
Other Hispanic or Latin American Puerto Rican
American Indian or Alaskan Native

63
Figure 1f: Net Effects, Relative to Engineering, for Undergraduate Major for Predicting Each GRE Score for Each Group
Female, Analytical
-200.0
-180.0
-160.0
-140.0
-120.0
-100.0
-80.0
-60.0
-40.0
-20.0
0.0
20.0
40.0
60.0
80.0
humanit eng physci socsci lifesci busin other educa
Undergraduate Major
GR
E-A
Po
ints
White (non-Hispanic) Black or African American
Asian, Asian American, or Pacific Islander Mexican, Mexican American, Chicano
Other Hispanic or Latin American Puerto Rican
American Indian or Alaskan Native

Table 2a
Net Effects of General Reasons for Taking the GRE, for Predicting Each GRE Score for Each Group
MALE
Race/ethnic categories Fellowship Admission Practice Other Externaldegree
Graduatedept.
requirement
Undergradexit
requirementWhite (non-Hispanic) 25.0 9.4 0.0 0.7 -15.1 -22.1 -33.9
Black, African American 17.7 12.1 7.5 -4.9 -6.0 -20.6 -49.3
Asian, Asian American, PacificIslander
25.0 3.9 1.3 0.0 -20.4 -31.8 -82.7
Mexican, Mexican American,Chicano
24.2 6.9 7.3 6.7 -6.5 -26.0 -44.0
Other Hispanic, Latin American 23.0 15.2 4.4 -3.2 -21.6 -21.3 -50.0
Puerto Rican 10.8 2.0 17.1 8.7 -5.4 -17.7 -32.7
American Indian, AlaskanNative
20.5 9.2 0.3 -11.4 -11.3 -12.4 -36.1
Other 17.5 22.7 -0.1 6.6 -31.9 -24.5 -45.1
Missing 14.1 5.0 -4.5 3.7 -40.1 -28.7 -77.5
Verbal
64

Table 2b
Net Effects of General Reasons for Taking the GRE, for Predicting Each GRE Score for Each Group
MALE
Quantitative
65
Race/ethnic categories Fellowship Admission Practice Other Externaldegree
Graduatedept.
requirement
Undergradexit
requirementWhite (non-Hispanic) 24.1 12.7 -0.2 1.7 -11.4 -24.8 -61.0
Black, African American 25.9 19.5 11.4 0.5 -14.2 -24.2 -69.8
Asian, Asian American, PacificIslander
11.8 10.8 -1.6 -4.5 -26.0 -26.1 -118.3
Mexican, Mexican American,Chicano
26.6 11.3 4.0 -6.8 12.3 -27.5 -66.0
Other Hispanic, Latin American 24.9 11.4 6.3 1.4 -7.2 -29.0 -83.9
Puerto Rican 19.2 14.9 14.1 26.3 -6.5 -20.7 -85.8
American Indian, AlaskanNative
27.2 20.8 2.7 0.2 4.5 -25.3 -44.4
Other 17.5 26.1 5.6 4.1 -30.0 -30.8 -77.1
Missing 15.4 4.6 -0.2 5.6 8.8 -32.8 -113.8

Table 2c
Net Effects of General Reasons for Taking the GRE, for Predicting Each GRE Score for Each Group
MALE
Analytical
66
Race/ethnic categories Fellowship Admission Practice Other Externaldegree
Graduatedept.
requirement
Undergradexit
requirementWhite (non-Hispanic) 24.7 14.1 -4.3 5.9 -15.3 -25.5 -46.9
Black, African American 24.4 12.7 8.9 -0.6 -14.5 -23.7 -58.7
Asian, Asian American, PacificIslander
18.2 8.2 -3.9 1.5 -28.2 -36.3 -105.7
Mexican, Mexican American,Chicano
23.3 10.5 4.3 -14.6 2.9 -28.9 -50.0
Other Hispanic, Latin American 23.2 13.9 1.7 -6.1 -22.4 -26.8 -80.7
Puerto Rican 16.6 3.9 24.4 17.3 -11.2 -24.5 -72.4
American Indian, AlaskanNative
23.7 23.3 6.6 -7.3 32.4 -26.5 -27.6
Other 13.0 34.0 6.8 7.9 -24.9 -32.5 -60.4
Missing 11.2 7.4 -0.3 7.8 -40.9 -36.9 -92.9

Table 2d
Net Effects of General Reasons for Taking the GRE, for Predicting Each GRE Score for Each Group
FEMALE
Verbal
67
Race/ethnic categories Fellowship Admission Practice Other Externaldegree
Graduatedept.
requirement
Undergradexit
requirementWhite (non-Hispanic) 26.4 4.5 -0.9 -1.6 -11.5 -17.4 -21.7
Black, African American 20.2 11.2 0.5 -4.1 -13.2 -14.7 -45.4
Asian, Asian American, PacificIslander
25.5 9.6 -3.2 -3.3 -11.5 -32.6 -47.8
Mexican, Mexican American,Chicano
26.4 6.9 1.5 -0.7 0.4 -16.2 -32.4
Other Hispanic, Latin American 26.3 9.9 8.4 3.3 -3.0 -18.3 -42.2
Puerto Rican 19.4 -2.5 12.8 -2.2 -42.1 -10.4 -28.2
American Indian, AlaskanNative
28.4 1.7 -3.5 2.0 -18.8 -13.4 -35.7
Other 29.0 20.3 4.6 -8.0 -13.4 -26.7 -56.2
Missing 27.5 5.4 -2.2 11.7 -13.1 -29.5 -91.6

Table 2e
Net Effects of General Reasons for Taking the GRE, for Predicting Each GRE Score for Each Group
FEMALE
Quantitative
68
Race/ethnic categories Fellowship Admission Practice Other Externaldegree
Graduatedept.
requirement
Undergradexit
requirementWhite (non-Hispanic) 26.0 5.7 -4.7 0.8 0.0 -26.2 -41.4
Black, African American 21.6 16.8 0.2 0.2 -8.7 -17.7 -50.6
Asian, Asian American, PacificIslander
22.1 5.1 -7.5 -2.0 -8.3 -34.4 -71.6
Mexican, Mexican American,Chicano
24.0 12.5 -6.0 -2.3 -1.8 -19.4 -49.3
Other Hispanic, Latin American 23.5 8.5 7.0 -4.7 3.0 -25.8 -57.5
Puerto Rican 21.0 4.5 8.5 0.3 -26.8 -16.1 -29.1
American Indian, AlaskanNative
24.9 3.9 -11.9 7.5 -24.6 -22.1 -69.5
Other 20.5 20.4 -5.4 -0.6 -4.6 -35.4 -72.7
Missing 21.0 11.8 -3.6 8.4 -9.2 -32.8 -84.5

Table 2f
Net Effects of General Reasons for Taking the GRE, for Predicting Each GRE Score for Each Group
FEMALE
Analytical
69
Race/ethnic categories Fellowship Admission Practice Other Externaldegree
Graduatedept.
requirement
Undergradexit
requirementWhite (non-Hispanic) 25.2 7.5 -5.3 2.3 -9.3 -25.3 -33.3
Black, African American 20.7 14.4 -2.5 -1.8 -15.9 -19.1 -49.3
Asian, Asian American, PacificIslander
22.1 11.3 -3.8 -0.9 -14.2 -40.2 -59.8
Mexican, Mexican American,Chicano
23.9 10.9 -7.4 -9.3 6.1 -19.4 -37.0
Other Hispanic, Latin American 22.1 17.9 6.9 -1.4 10.2 -28.0 -43.3
Puerto Rican 16.2 -2.1 7.6 -4.7 -48.5 -20.4 -29.9
American Indian, Alaskan Native 21.2 4.5 -4.4 8.9 -21.3 -21.3 -51.5
Other 22.0 25.8 -4.2 -6.1 -5.0 -35.8 -76.9
Missing 22.9 15.7 -4.8 11.4 -11.1 -35.4 -98.7

70
Figure 2a: Net Effects of General Reasons for Taking the GRE,for Predicting Each GRE Score for Each Group
Male, Verbal
-140.0
-120.0
-100.0
-80.0
-60.0
-40.0
-20.0
0.0
20.0
40.0
fellowship admission practice other ext deg grad reg ug exit
General Reasons
GR
E-V
Po
ints
White (non-Hispanic) Black or African AmericanAsian, Asian American, or Pacific Islander Mexican, Mexican American, ChicanoOther Hispanic or Latin American Puerto RicanAmerican Indian or Alaskan Native

71
Figure 2b: Net Effects of General Reasons for Taking the GRE,for Predicting Each GRE Score for Each Group
Males, Quantitative
-140.0
-120.0
-100.0
-80.0
-60.0
-40.0
-20.0
0.0
20.0
40.0
fellowship admission practice other ext deg grad reg ug exit
General Reasons
GR
E-Q
Po
ints
White (non-Hispanic) Black or African American
Asian, Asian American, or Pacific Islander Mexican, Mexican American, ChicanoOther Hispanic or Latin American Puerto Rican
American Indian or Alaskan Native
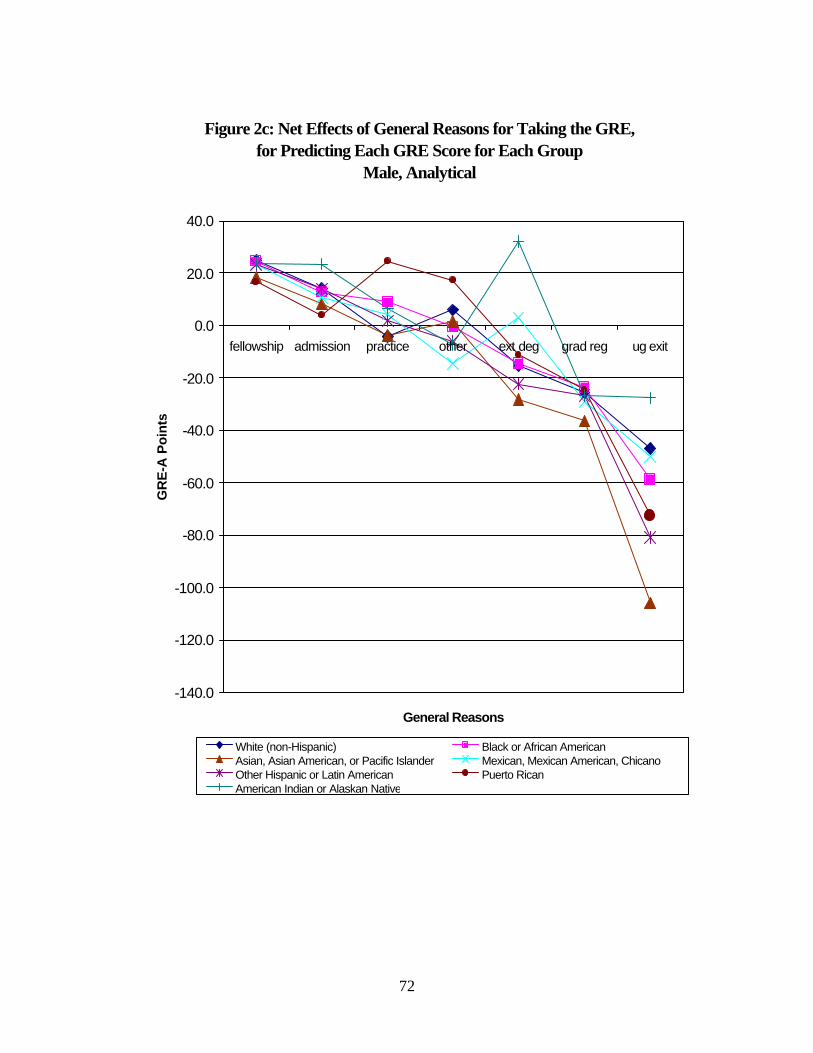
72
Figure 2c: Net Effects of General Reasons for Taking the GRE,for Predicting Each GRE Score for Each Group
Male, Analytical
-140.0
-120.0
-100.0
-80.0
-60.0
-40.0
-20.0
0.0
20.0
40.0
fellowship admission practice other ext deg grad reg ug exit
General Reasons
GR
E-A
Poi
nts
White (non-Hispanic) Black or African AmericanAsian, Asian American, or Pacific Islander Mexican, Mexican American, ChicanoOther Hispanic or Latin American Puerto RicanAmerican Indian or Alaskan Native

73
Figure 2d: Net Effects of General Reasons for Taking the GRE, for Predicting Each GRE Score for Each Group
Females, Verbal
-140.0
-120.0
-100.0
-80.0
-60.0
-40.0
-20.0
0.0
20.0
40.0
fellowship admission practice other ext deg grad req ug exit
General Reasons
GR
E-V
Po
ints
White (non-Hispanic) Black or African American
Asian, Asian American, or Pacific Islander Mexican, Mexican American, Chicano
Other Hispanic or Latin American Puerto Rican
American Indian or Alaskan Native

74
Figure 2e: Net Effects of General Reasons for Taking the GRE, for Predicting Each GRE Score for Each Group
Female, Quantitative
-140.0
-120.0
-100.0
-80.0
-60.0
-40.0
-20.0
0.0
20.0
40.0
fellowship admission practice other ext deg grad req ug exit
General Reasons
GR
E-Q
Po
ints
White (non-Hispanic) Black or African American
Asian, Asian American, or Pacific Islander Mexican, Mexican American, Chicano
Other Hispanic or Latin American Puerto Rican
American Indian or Alaskan Native

75
Figure 2f: Net Effects of General Reasons for Taking the GRE, for Predicting Each GRE Score for Each Group
Female, Analytical
-140.0
-120.0
-100.0
-80.0
-60.0
-40.0
-20.0
0.0
20.0
40.0
fellowship admission practice other ext deg grad req ug exit
General Reasons
GR
E-A
Po
ints
White (non-Hispanic) Black or African AmericanAsian, Asian American, or Pacific Islander Mexican, Mexican American, ChicanoOther Hispanic or Latin American Puerto RicanAmerican Indian or Alaskan Native

Table 3a
Net Effects, Relative to a Grade of B, for Undergraduate GPA for Predicting Each GRE Score for Each Group
MALE
Verbal
76
Race/ethnic categories C B- B A- A D or lower C- Missing
White (non-Hispanic) -30.0 -17.7 0.0 31.9 54.4 -22.1 -24.0 29.7
Black, African American -26.4 -13.0 0.0 27.9 36.9 42.0 -19.6 9.2
Asian, Asian American,Pacific Islander
-42.6 -27.7 0.0 32.7 59.5 13.1 -8.8 20.6
Mexican, Mexican American,Chicano
-27.4 -19.8 0.0 24.4 42.2 -63.5 -28.4 15.2
Other Hispanic, LatinAmerican
-28.6 -22.5 0.0 35.5 48.9 -59.2 -36.7 16.6
Puerto Rican 0.2 6.9 0.0 41.8 36.1 136.2 7.0 30.2
American Indian, AlaskanNative
-23.3 -12.8 0.0 37.7 47.8 75.9 -51.9 17.9
Other -32.9 -21.0 0.0 37.0 60.9 31.2 -1.6 39.6
Missing -43.3 -34.4 0.0 35.7 57.3 -62.1 20.6
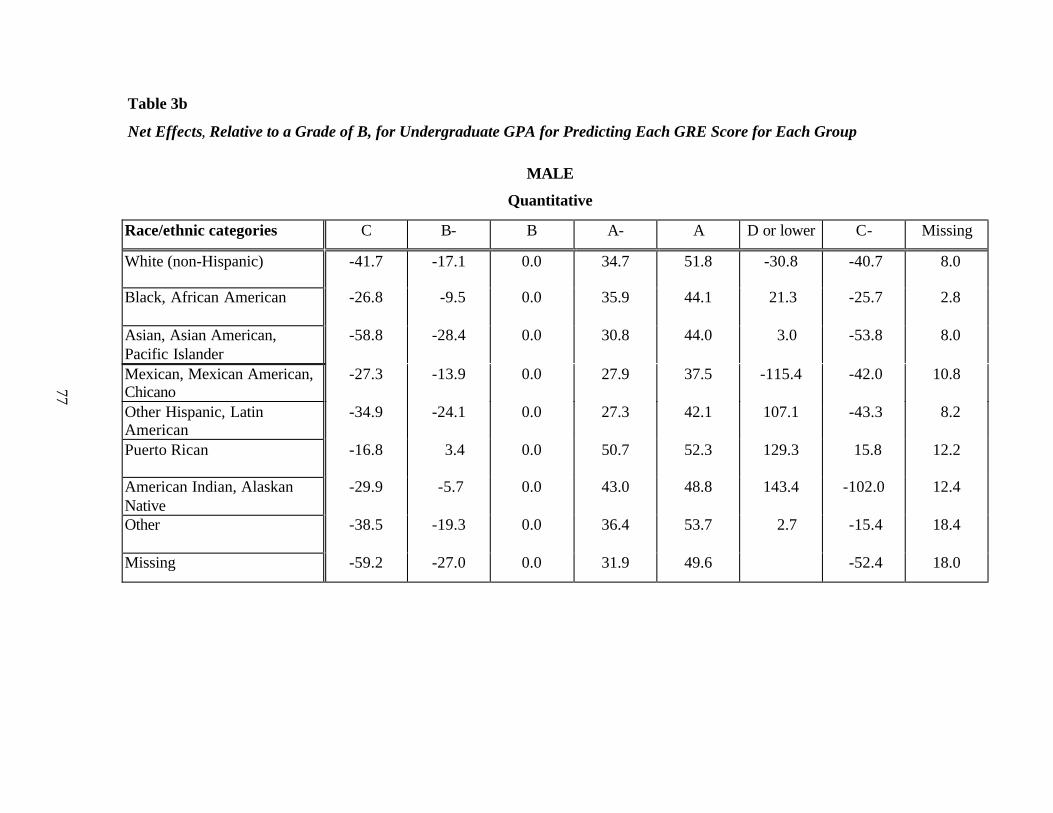
Table 3b
Net Effects, Relative to a Grade of B, for Undergraduate GPA for Predicting Each GRE Score for Each Group
MALE
Quantitative
Race/ethnic categories C B- B A- A D or lower C- Missing
White (non-Hispanic) -41.7 -17.1 0.0 34.7 51.8 -30.8 -40.7 8.0
Black, African American -26.8 -9.5 0.0 35.9 44.1 21.3 -25.7 2.8
Asian, Asian American,Pacific Islander
-58.8 -28.4 0.0 30.8 44.0 3.0 -53.8 8.0
Mexican, Mexican American,Chicano
-27.3 -13.9 0.0 27.9 37.5 -115.4 -42.0 10.8
Other Hispanic, LatinAmerican
-34.9 -24.1 0.0 27.3 42.1 107.1 -43.3 8.2
Puerto Rican -16.8 3.4 0.0 50.7 52.3 129.3 15.8 12.2
American Indian, AlaskanNative
-29.9 -5.7 0.0 43.0 48.8 143.4 -102.0 12.4
Other -38.5 -19.3 0.0 36.4 53.7 2.7 -15.4 18.4
Missing -59.2 -27.0 0.0 31.9 49.6 -52.4 18.0
77

Table 3c
Net Effects, Relative to a Grade of B, for Undergraduate GPA for Predicting Each GRE Score for Each Group
MALE
Analytical
Race/ethnic categories C B- B A- A D or lower C- Missing
White (non-Hispanic) -36.9 -14.7 0.0 31.1 47.1 -28.7 -38.1 6.0
Black, African American -19.9 -4.8 0.0 29.5 40.2 22.8 -9.9 1.6
Asian, Asian American,Pacific Islander
-55.4 -27.2 0.0 33.7 54.4 -29.9 -45.2 9.2
Mexican, Mexican American,Chicano
-24.5 -14.4 0.0 24.4 35.2 -160.4 -34.9 17.8
Other Hispanic, LatinAmerican
-28.0 -16.5 0.0 31.0 48.4 60.5 -43.6 5.0
Puerto Rican -6.5 7.6 0.0 50.9 45.7 122.4 1.9 10.2
American Indian, AlaskanNative
-30.6 -6.6 0.0 33.3 46.1 85.8 -85.1 10.6
Other -38.5 -18.8 0.0 36.8 47.9 -51.5 -9.6 20.6
Missing -56.4 -29.9 0.0 29.3 52.0 -55.9 6.2
78

Table 3d
Net Effects, Relative to a Grade of B, for Undergraduate GPA for Predicting Each GRE Score for Each Group
FEMALE
Verbal
Race/ethnic categories C B- B A- A D or lower C- Missing
White (non-Hispanic) -31.7 -18.6 0.0 35.2 51.4 -13.1 -32.6 28.4
Black, African American -23.8 -9.1 0.0 26.9 32.2 -10.4 -19.2 13.2
Asian, Asian American,Pacific Islander
-46.0 -28.6 0.0 34.9 49.2 -15.9 -46.1 16.5
Mexican, Mexican American,Chicano
-32.2 -16.6 0.0 26.7 44.3 -84.5 -31.2 8.2
Other Hispanic, LatinAmerican
-36.2 -23.5 0.0 34.2 44.5 -29.1 -49.1 15.5
Puerto Rican -11.0 -6.8 0.0 32.6 26.2 -106.2 -34.6 7.2
American Indian, AlaskanNative
-33.1 -15.2 0.0 31.9 38.4 -29.2 13.1
Other -47.9 -30.3 0.0 44.8 62.2 -25.9 34.0
Missing -61.8 -32.4 0.0 43.6 60.7 -80.6 40.2
79

Table 3e
Net Effects, Relative to a Grade of B, for Undergraduate GPA for Predicting Each GRE Score for Each Group
FEMALE
Quantitative
Race/ethnic categories C B- B A- A D or lower C- Missing
White (non-Hispanic) -38.6 -17.5 0.0 35.2 49.9 -45.3 -37.6 11.6
Black, African American -19.8 -3.6 0.0 28.4 35.2 -34.2 -12.5 6.1
Asian, Asian American,Pacific Islander
-48.1 -24.8 0.0 35.9 41.0 -44.9 -62.4 13.6
Mexican, Mexican American,Chicano
-25.7 -9.3 0.0 23.9 41.9 -44.5 -47.9 9.2
Other Hispanic, LatinAmerican
-38.7 -19.8 0.0 28.4 40.3 52.4 -30.3 4.9
Puerto Rican -9.8 -2.8 0.0 25.2 35.1 -10.8 -4.2 8.2
American Indian, AlaskanNative
-31.9 -12.9 0.0 32.3 43.6 -34.3 28.1
Other -45.4 -20.1 0.0 36.3 50.3 -17.8 20.4
Missing -60.5 -35.1 0.0 39.0 54.5 -24.6 17.9
80

Table 3f
Net Effects, Relative to a Grade of B, for Undergraduate GPA for Predicting Each GRE Score for Each Group
FEMALE
Analytical
Race/ethnic categories C B- B A- A D or lower C- Missing
White (non-Hispanic) -34.6 -15.8 0.0 32.4 44.1 -37.5 -40.6 8.7
Black, African American -19.5 -6.0 0.0 27.0 31.6 19.1 -11.9 5.8
Asian, Asian American,Pacific Islander
-46.0 -25.1 0.0 34.6 42.5 23.0 -59.3 8.1
Mexican, Mexican American,Chicano
-30.8 -10.1 0.0 23.6 35.0 -72.8 -32.7 4.4
Other Hispanic, LatinAmerican
-40.7 -20.1 0.0 27.7 36.0 -24.5 -49.7 1.3
Puerto Rican -8.1 -2.2 0.0 32.5 30.7 -164.0 -12.2 -12.7
American Indian, AlaskanNative
-34.1 -15.1 0.0 27.7 27.6 -32.4 8.6
Other -48.5 -25.8 0.0 37.3 47.6 -41.1 21.9
Missing -68.2 -35.0 0.0 37.8 49.1 -61.5 19.7
81

82
Figure 3a: Net Effects, Relative to a Grade of B, for Undergraduate GPA for Predicting Each GRE Score for Each Group
Males, Verbal
-80.0
-60.0
-40.0
-20.0
0.0
20.0
40.0
60.0
C B- B A- A
Undergraduate GPA
GR
E-V
Po
ints
White (non-Hispanic) Black or African American
Asian, Asian American, or Pacific Islander Mexican, Mexican American, Chicano
Other Hispanic or Latin American Puerto Rican
American Indian or Alaskan Native

83
Figure 3b: Net Effects, Relative to a Grade of B, for Undergraduate GPA for Predicting Each GRE Score for Each Group
Males, Quantitative
-80.0
-60.0
-40.0
-20.0
0.0
20.0
40.0
60.0
C B- B A- A
Undergraduate GPA
GR
E-Q
Po
ints
White (non-Hispanic) Black or African American
Asian, Asian American, or Pacific Islander Mexican, Mexican American, Chicano
Other Hispanic or Latin American Puerto Rican
American Indian or Alaskan Native

84
Figure 3c: Net Effects, Relative to a Grade of B, for Undergraduate GPA for Predicting Each GRE Score for Each Group
Male, Analytical
-80.0
-60.0
-40.0
-20.0
0.0
20.0
40.0
60.0
C B- B A- A
Undergraduate GPA
GR
E-A
Poi
nts
White (non-Hispanic) Black or African American
Asian, Asian American, or Pacific Islander Mexican, Mexican American, Chicano
Other Hispanic or Latin American Puerto Rican
American Indian or Alaskan Native

85
Figure 3d: Net Effects, Relative to a Grade of B, for Undergraduate GPA for Predicting Each GRE Score for Each Group
Females, Verbal
-80.0
-60.0
-40.0
-20.0
0.0
20.0
40.0
60.0
C B- B A- A
Undergraduate GPA
GR
E-V
Po
ints
White (non-Hispanic) Black or African American
Asian, Asian American, or Pacific Islander Mexican, Mexican American, Chicano
Other Hispanic or Latin American Puerto Rican
American Indian or Alaskan Native
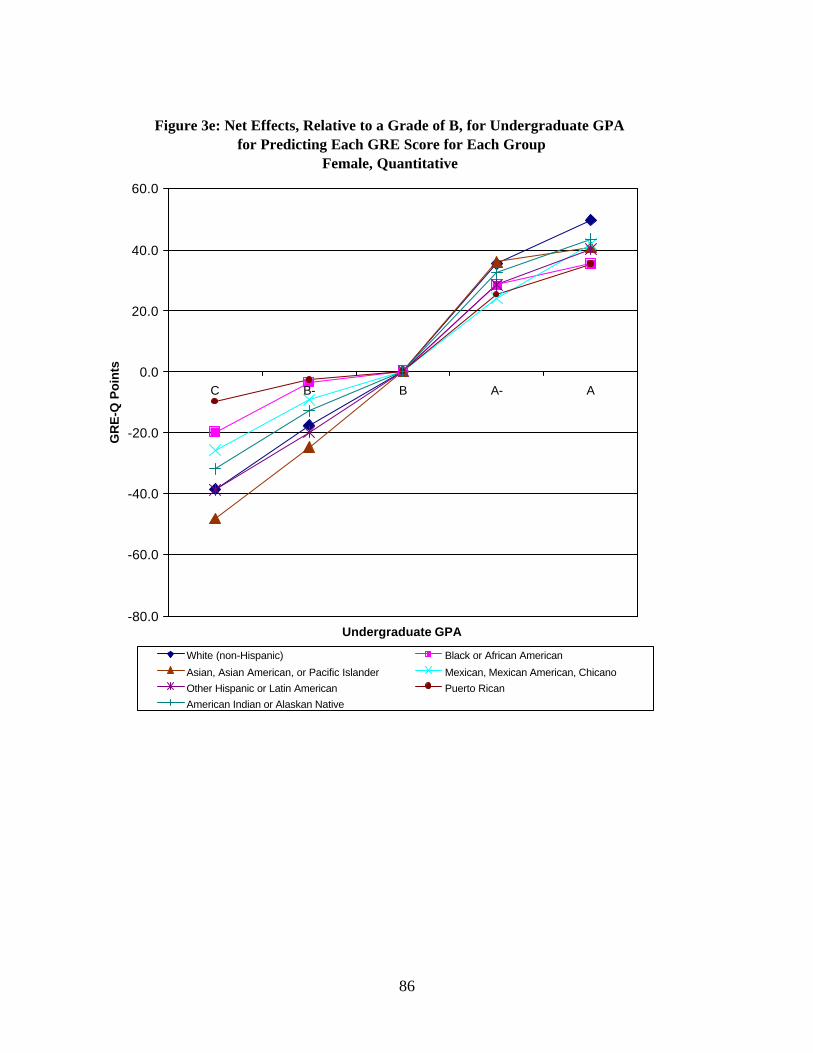
86
Figure 3e: Net Effects, Relative to a Grade of B, for Undergraduate GPA for Predicting Each GRE Score for Each Group
Female, Quantitative
-80.0
-60.0
-40.0
-20.0
0.0
20.0
40.0
60.0
C B- B A- A
Undergraduate GPA
GR
E-Q
Po
ints
White (non-Hispanic) Black or African American
Asian, Asian American, or Pacific Islander Mexican, Mexican American, Chicano
Other Hispanic or Latin American Puerto Rican
American Indian or Alaskan Native

87
Figure 3f: Net Effects, Relative to a Grade of B, for Undergraduate GPA for Predicting Each GRE Score for Each Group
Females, Analytical
-80.0
-60.0
-40.0
-20.0
0.0
20.0
40.0
60.0
C B- B A- A
Undergraduate GPA
GR
E-A
Po
ints
White (non-Hispanic) Black or African American
Asian, Asian American, or Pacific Islander Mexican, Mexican American, Chicano
Other Hispanic or Latin American Puerto Rican
American Indian or Alaskan Native

Table 4a
Net Effects, Relative to Senior, for Education Level at Registration, for Predicting Each GRE Score for Each Group
MALE
Verbal
88
Race/ethnic categories Sophomore Junior Senior First year Secondyear
Collegegraduate
Mastersgraduate
Other Missing
White (non-Hispanic) -30.1 3.9 0.0 3.9 26.5 30.6 42.0 35.6 17.6
Black, African American -11.0 7.1 0.0 -10.5 2.6 19.8 13.9 12.5 -17.5
Asian, Asian American,Pacific Islander
31.1 33.9 0.0 -23.4 -12.2 13.5 -12.4 1.0 -30.8
Mexican, MexicanAmerican, Chicano
38.6 -8.5 0.0 -12.5 5.5 23.9 17.3 18.6 -5.6
Other Hispanic, LatinAmerican
-40.6 0.2 0.0 -14.6 -3.3 19.9 5.9 10.5 -12.5
Puerto Rican 17.9 5.7 0.0 -3.3 5.6 19.5 2.6 11.0 54.6
American Indian, AlaskanNative
-31.6 -1.9 0.0 -4.0 -2.1 26.5 38.6 40.7 6.4
Other -20.8 1.9 0.0 -6.7 11.5 24.4 21.9 20.3 3.3
Missing -117.7 25.3 0.0 -21.8 19.2 34.4 31.8 20.1 20.9

Table 4b
Net Effects, Relative to Senior, for Education Level at Registration, for Predicting Each GRE Score for Each Group
MALE
Quantitative
89
Race/ethnic categories Sophomore Junior Senior First year Secondyear
Collegegraduate
Mastersgraduate
Others Missing
White (non-Hispanic) -15.5 13.9 0.0 -22.5 -10.8 5.4 -9.0 -5.9 -13.7
Black, African American -39.7 16.6 0.0 -32.2 -25.7 4.3 -21.7 -20.3 -31.0
Asian, Asian American,Pacific Islander
20.4 19.8 0.0 -33.8 -16.0 -1.0 -27.2 -17.0 -21.7
Mexican, MexicanAmerican, Chicano
26.5 17.1 0.0 -30.6 -31.3 5.5 -21.5 -7.7 -15.8
Other Hispanic, LatinAmerican
36.7 13.1 0.0 -36.2 -30.0 4.1 -28.8 -21.0 -36.6
Puerto Rican -9.4 21.9 0.0 -20.7 -22.5 2.2 -29.3 -21.8 16.1
American Indian, AlaskanNative
0.0
Other -22.9 26.0 0.0 27.0 -29.0 3.1 -20.3 -15.8 6.7
Missing -16.0 28.6 0.0 -48.0 -31.5 -2.7 -28.8 -23.7 -8.1

Table 4c
Net Effects, Relative to Senior, for Education Level at Registration, for Predicting Each GRE Score for Each Group
MALE
Analytical
90
Race/ethnic categories Sophomore Junior Senior First year Secondyear
Collegegraduate
Mastersgraduate
Others Missing
White (non-Hispanic) -18.5 10.7 0.0 -25.8 -14.2 4.2 -20.8 -19.0 -24.2
Black, African American -19.4 14.6 0.0 -28.8 -21.9 4.9 -25.4 -28.4 -26.8
Asian, Asian American,Pacific Islander
-11.0 24.9 0.0 -39.4 -34.5 -2.7 -46.7 -38.5 -55.4
Mexican, MexicanAmerican, Chicano
39.7 9.0 0.0 -32.0 -25.2 7.0 -21.1 -16.9 -30.3
Other Hispanic, LatinAmerican
17.3 -5.6 0.0 -43.8 -31.2 -0.1 -39.7 -37.3 -47.7
Puerto Rican 35.3 15.4 0.0 -25.2 -18.0 2.1 -33.5 -36.0 -4.6
American Indian, AlaskanNative
0.0
Other -41.8 9.7 0.0 -27.2 -34.5 2.3 -30.4 -31.7 -10.7
Missing -78.5 18.6 0.0 -41.9 -40.3 3.8 -27.5 -29.7 -33.0

Table 4d
Net Effects, Relative to Senior, for Education Level at Registration, for Predicting Each GRE Score for Each Group
FEMALE
Verbal
91
Race/ethnic categories Sophomore Junior Senior First year Secondyear
Collegegraduate
Mastersgraduate
Others Missing
White (non-Hispanic) -6.3 4.3 0.0 10.7 31.0 32.2 39.6 37.5 21.6
Black, African American 7.1 13.0 0.0 -7.2 5.8 19.1 18.4 16.8 3.8
Asian, Asian American,Pacific Islander
10.2 24.3 0.0 -16.5 -8.2 20.2 -5.9 -2.5 2.5
Mexican, MexicanAmerican, Chicano
-36.2 15.6 0.0 -4.6 13.2 25.8 14.9 18.8 3.6
Other Hispanic, LatinAmerican
-4.9 -4.7 0.0 -12.6 13.2 25.5 4.7 11.5 12.1
Puerto Rican 26.8 23.0 0.0 -15.1 3.7 20.7 -1.2 2.3 19.9
American Indian, AlaskanNative
-78.9 16.4 0.0 4.1 21.2 21.2 16.1 25.9 28.9
Other -31.2 9.4 0.0 -5.3 15.9 28.5 22.1 14.6 5.2
Missing 0.8 18.1 0.0 -33.1 4.2 20.5 5.2 -3.7 3.5

Table 4e
Net Effects, Relative to Senior, for Education Level at Registration, for Predicting Each GRE Score for Each Group
FEMALE
Quantitative
92
Race/ethnic categories Sophomore Junior Senior First year Secondyear
Collegegraduate
Mastersgraduate
Others Missing
White (non-Hispanic) 24.4 20.8 0.0 -20.3 -9.0 8.9 -10.3 -3.1 -4.4
Black, African American 4.9 27.3 0.0 -23.3 -13.5 3.0 -14.8 -13.2 -18.1
Asian, Asian American,Pacific Islander
28.1 25.8 0.0 -34.2 -11.2 5.7 -24.8 -10.5 -1.0
Mexican, MexicanAmerican, Chicano
-22.5 30.9 0.0 -24.5 -15.1 9.3 -23.0 -7.1 -13.9
Other Hispanic, LatinAmerican
-5.1 12.7 0.0 -35.4 -24.5 6.1 -29.4 -22.0 -11.6
Puerto Rican 72.1 32.2 0.0 -31.5 -16.3 10.3 -28.5 -22.1 -8.0
American Indian, AlaskanNative
8.3 22.4 0.0 -32.9 -15.8 8.5 -27.8 -16.5 55.1
Other 14.9 29.4 0.0 -25.1 -27.6 10.1 -21.8 -17.1 -14.5
Missing 49.3 32.4 0.0 -57.2 -37.9 -1.6 -47.4 -34.0 -16.2

Table 4f
Net Effects, Relative to Senior, for Education Level at Registration, for Predicting Each GRE Score for Each Group
FEMALE
Analytical
93
Race/ethnic categories Sophomore Junior Senior First year Secondyear
Collegegraduate
Mastersgraduate
Others Missing
White (non-Hispanic) 15.4 12.1 0.0 -20.1 -7.0 10.0 -15.8 -12.3 -18.5
Black, African American 4.2 15.6 0.0 -19.6 -12.0 7.6 -12.0 -15.1 -24.0
Asian, Asian American,Pacific Islander
5.3 19.2 0.0 -35.2 -25.7 4.4 -36.1 -26.2 -23.9
Mexican, MexicanAmerican, Chicano
-10.0 25.5 0.0 -25.3 -7.9 11.5 -26.9 -17.0 -13.0
Other Hispanic, LatinAmerican
9.0 3.1 0.0 -32.6 -19.3 8.5 -29.2 -28.0 -23.6
Puerto Rican 49.6 29.0 0.0 -32.5 -10.9 17.7 -26.7 -21.3 18.3
American Indian, AlaskanNative
8.1 23.3 0.0 -30.2 -10.9 6.8 -33.7 -22.1 31.3
Other 10.1 20.6 0.0 -32.9 -25.1 11.0 -27.8 -33.3 -16.9
Missing 33.0 15.9 0.0 -65.2 -36.5 -6.0 -49.1 -49.2 -30.5
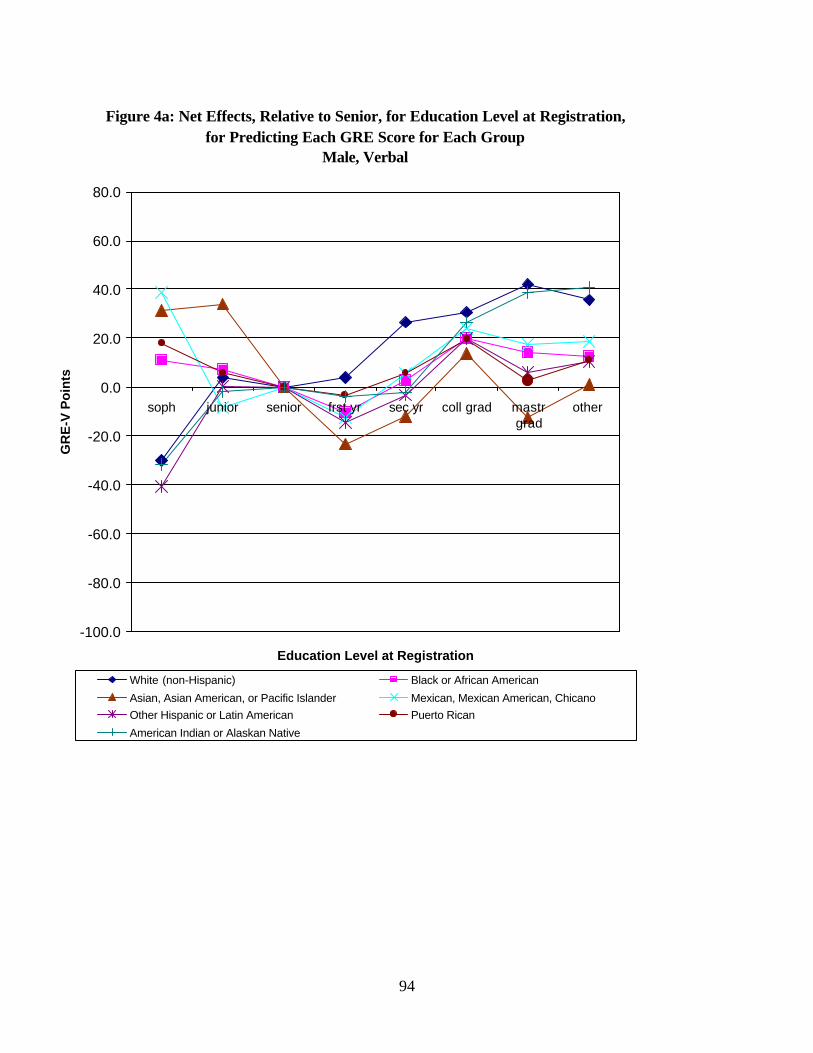
94
Figure 4a: Net Effects, Relative to Senior, for Education Level at Registration, for Predicting Each GRE Score for Each Group
Male, Verbal
-100.0
-80.0
-60.0
-40.0
-20.0
0.0
20.0
40.0
60.0
80.0
soph junior senior frst yr sec yr coll grad mastrgrad
other
Education Level at Registration
GR
E-V
Po
ints
White (non-Hispanic) Black or African American
Asian, Asian American, or Pacific Islander Mexican, Mexican American, ChicanoOther Hispanic or Latin American Puerto Rican
American Indian or Alaskan Native

95
Figure 4b: Net Effects, Relative to Senior, for Education Level at Registration, for Predicting Each GRE Score for Each Group
Males, Quantitative
-100.0
-80.0
-60.0
-40.0
-20.0
0.0
20.0
40.0
60.0
80.0
soph junior senior frst yr sec yr coll grad mastrgrad
other
Education Level at Registration
GR
E-Q
Poi
nts
White (non-Hispanic) Black or African American
Asian, Asian American, or Pacific Islander Mexican, Mexican American, Chicano
Other Hispanic or Latin American Puerto Rican
American Indian or Alaskan Native
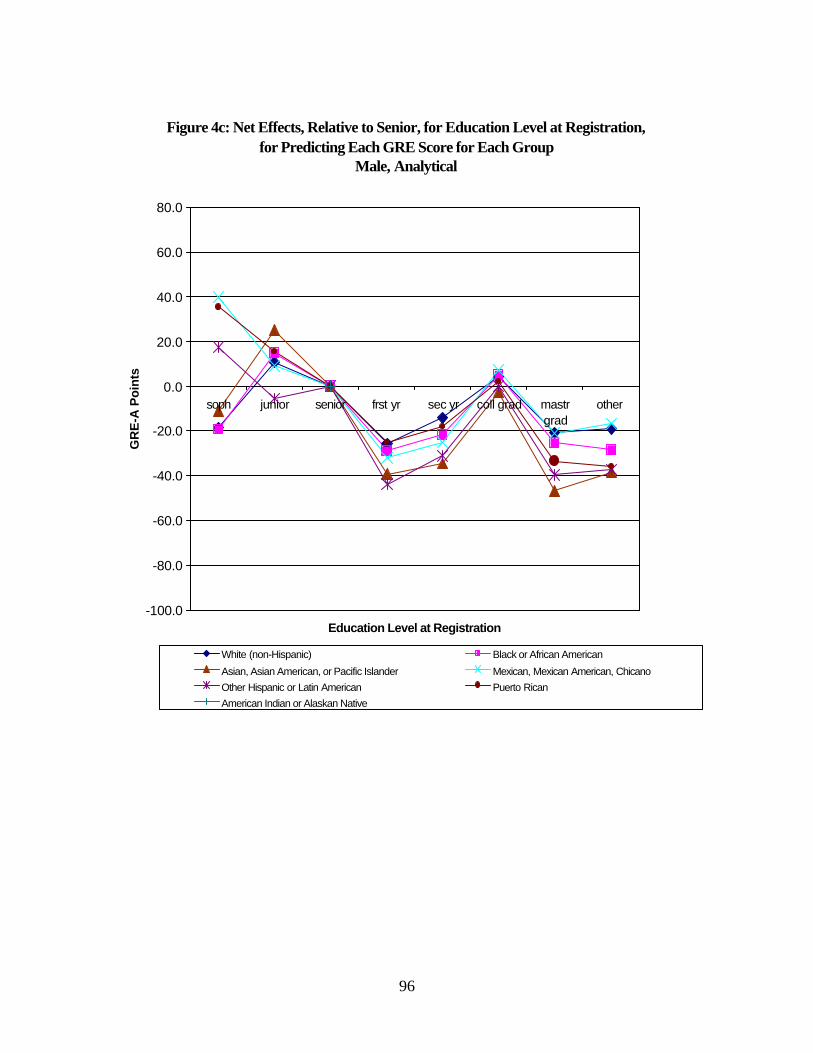
96
Figure 4c: Net Effects, Relative to Senior, for Education Level at Registration, for Predicting Each GRE Score for Each Group
Male, Analytical
-100.0
-80.0
-60.0
-40.0
-20.0
0.0
20.0
40.0
60.0
80.0
soph junior senior frst yr sec yr coll grad mastrgrad
other
Education Level at Registration
GR
E-A
Po
ints
White (non-Hispanic) Black or African American
Asian, Asian American, or Pacific Islander Mexican, Mexican American, Chicano
Other Hispanic or Latin American Puerto Rican
American Indian or Alaskan Native
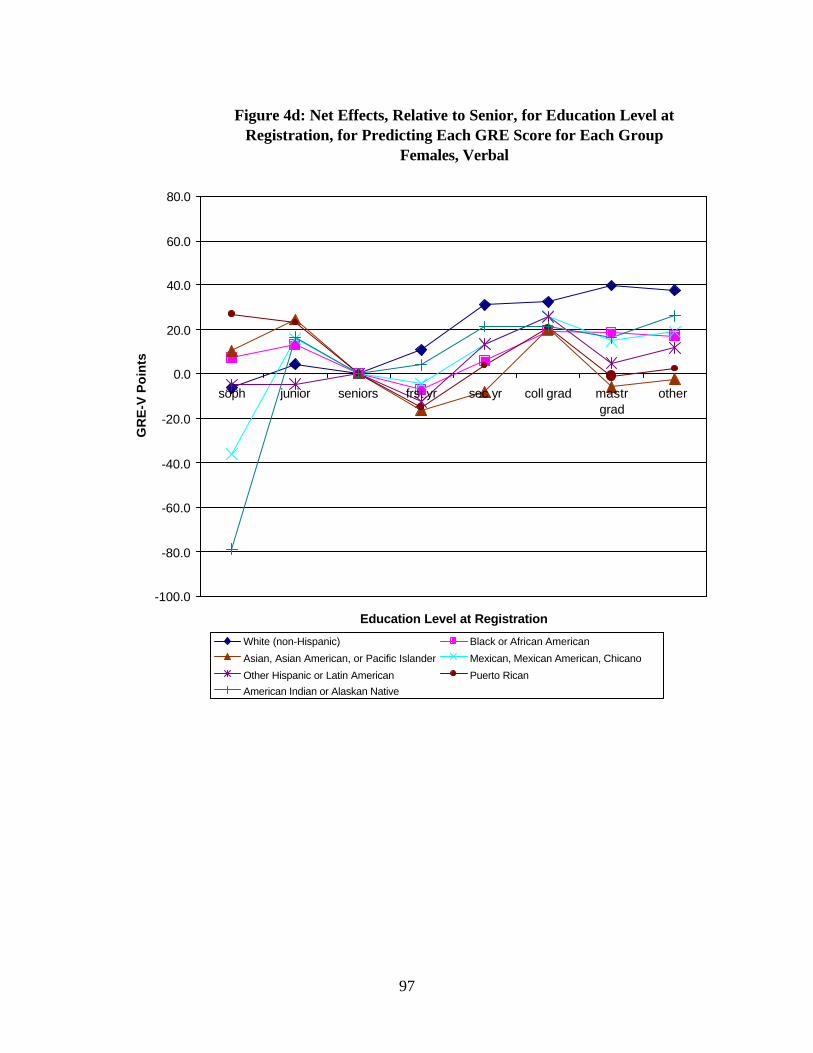
97
Figure 4d: Net Effects, Relative to Senior, for Education Level at Registration, for Predicting Each GRE Score for Each Group
Females, Verbal
-100.0
-80.0
-60.0
-40.0
-20.0
0.0
20.0
40.0
60.0
80.0
soph junior seniors frst yr sec yr coll grad mastrgrad
other
Education Level at Registration
GR
E-V
Po
ints
White (non-Hispanic) Black or African American
Asian, Asian American, or Pacific Islander Mexican, Mexican American, Chicano
Other Hispanic or Latin American Puerto Rican
American Indian or Alaskan Native

98
Figure 4e: Net Effects, Relative to Senior, for Education Level at Registration,for Predicting Each GRE Score for Each Group
Female, Quantitative
-100.0
-80.0
-60.0
-40.0
-20.0
0.0
20.0
40.0
60.0
80.0
soph junior seniors frst yr sec yr coll grad mastrgrad
other
Education Level at Registration
GR
E-Q
Poi
nts
White (non-Hispanic) Black or African American
Asian, Asian American, or Pacific Islander Mexican, Mexican American, Chicano
Other Hispanic or Latin American Puerto Rican
American Indian or Alaskan Native

99
Figure 4f: Net Effects, Relative to Senior, for Education Level at Registration, for Predicting Each GRE Score for Each Group
Female, Analytical
-100.0
-80.0
-60.0
-40.0
-20.0
0.0
20.0
40.0
60.0
80.0
soph junior seniors frst yr sec yr coll grad mastrgrad
other
Education Level at Registration
GR
E-A
Po
ints
White (non-Hispanic) Black or African AmericanAsian, Asian American, or Pacific Islander Mexican, Mexican American, ChicanoOther Hispanic or Latin American Puerto RicanAmerican Indian or Alaskan Native

Table 5a
Net Effects, Relative to Engineering, for Graduate Major, for Predicting Each GRE Score for Each Group
MALE
Verbal
100
Race/ethnic categories Humanities Engineering Phy Sci Social Sci Life Sci Business Other Education Missing
White (non-Hispanic) 31.6 0.0 23.5 17.4 -1.3 -0.2 14.2 -1.7 6.6
Black, African American 26.5 0.0 9.3 9.0 4.6 0.0 -0.6 -2.9 -6.3
Asian, Asian American,Pacific Islander
0.0
Mexican, MexicanAmerican, Chicano
36.3 0.0 17.9 14.8 4.1 1.9 7.2 2.8 -4.1
Other Hispanic, LatinAmerican
50.6 0.0 21.9 24.5 16.1 12.8 20.8 17.9 10.4
Puerto Rican 39.3 0.0 19.8 38.4 3.7 22.1 23.4 27.4 8.5
American Indian, AlaskanNative
15.0 0.0 34.5 9.1 -12.8 3.1 4.2 -19.0 -9.6
Other 30.3 0.0 29.9 16.1 -3.8 2.3 14.9 32.8 9.6
Missing 25.1 0.0 33.8 25.1 8.7 -14.3 18.3 -12.1 12.5

Table 5b
Net Effects, Relative to Engineering, for Graduate Major, for Predicting Each GRE Score for Each Group
MALE
Quantitative
101
Race/ethnic categories Humanities Engineering Phy Sci Social Sci Life Sci Business Other Education Missing
White (non-Hispanic) -34.7 0.0 13.2 -26.4 -22.0 -21.6 -25.8 -25.7 -34.5
Black, African American -32.9 0.0 6.1 -31.4 -16.6 -30.0 -42.6 -35.1 -44.9
Asian, Asian American,Pacific Islander
-30.0 0.0 11.6 -18.4 -15.1 -21.2 -14.9 -19.4 -16.4
Mexican, MexicanAmerican, Chicano
-39.3 0.0 1.7 -39.5 -31.0 -52.2 -47.0 -33.6 -51.7
Other Hispanic, LatinAmerican
-28.9 0.0 13.0 -25.5 -19.0 -15.0 -29.6 -12.7 -38.6
Puerto Rican -32.2 0.0 18.8 -10.2 -9.9 -1.8 -19.4 -8.2 -35.6
American Indian, AlaskanNative
-87.5 0.0 -4.5 -90.0 -74.7 -73.7 -76.9 -75.3 -85.2
Other -30.0 0.0 17.6 -26.7 -18.5 -22.8 -24.4 -34.6 -25.7
Missing -37.9 0.0 11.0 -18.0 -12.7 -9.5 -19.5 -34.8 -24.0

Table 5c
Net Effects, Relative to Engineering, for Graduate Major, for Predicting Each GRE Score for Each Group
MALE
Analytical
102
Race/ethnic categories Humanities Engineering Phy Sci Social Sci Life Sci Business Other Education Missing
White (non-Hispanic) -4.2 0.0 16.5 -6.4 -11.9 -8.1 -9.8 -11.4 -17.2
Black, African American 0.0 0.0 7.0 -5.6 -6.8 -10.3 -19.7 -13.6 -22.1
Asian, Asian American,Pacific Islander
0.0
Mexican, MexicanAmerican, Chicano
0.0
Other Hispanic, LatinAmerican
0.0
Puerto Rican 0.0
American Indian, AlaskanNative
-41.3 0.0 8.0 -43.9 -41.0 -11.6 -37.0 -33.5 -55.6
Other -25.0 0.0 4.0 -36.9 -20.6 -2.3 -12.7 -15.4 -15.7
Missing 0.0

Table 5d
Net Effects, Relative to Engineering, for Graduate Major, for Predicting Each GRE Score for Each Group
FEMALE
Verbal
103
Race/ethnic categories Humanities Engineering Phy Sci Social Sci Life Sci Business Other Education Missing
White (non-Hispanic) 20.8 0.0 20.0 8.3 -7.9 -6.1 6.5 -7.2 -2.9
Black, African American 38.6 0.0 13.0 10.5 8.9 4.8 3.3 0.4 -2.1
Asian, Asian American,Pacific Islander
27.9 0.0 6.2 14.6 -1.9 -10.9 13.4 6.2 2.6
Mexican, MexicanAmerican, Chicano
21.6 0.0 30.2 14.5 2.9 2.7 8.8 7.7 4.3
Other Hispanic, LatinAmerican
0.0
Puerto Rican 0.0
American Indian, AlaskanNative
54.4 0.0 45.2 22.3 11.5 -0.7 19.2 16.5 10.8
Other 21.1 0.0 10.1 4.2 -1.4 -23.4 3.4 -6.7 -6.0
Missing 40.6 0.0 24.2 17.8 10.9 -28.3 17.8 3.7 13.8

Table 5e
Net Effects, Relative to Engineering, for Graduate Major, for Predicting Each GRE Score for Each Group
FEMALE
Quantitative
Race/ethnic categories Humanities Engineering Phy Sci Social Sci Life Sci Business Other Education Missing
White (non-Hispanic) -46.1 0.0 8.0 -36.9 -33.2 -34.8 -37.2 -33.0 -44.0
Black, African American -29.3 0.0 9.3 -31.0 -19.7 -31.0 -37.5 -29.5 -43.4
Asian, Asian American,Pacific Islander
-41.0 0.0 17.9 -35.0 -24.6 -29.8 -26.8 -25.4 -32.1
Mexican, MexicanAmerican, Chicano
-30.9 0.0 41.4 -28.4 -22.9 -30.1 -33.3 -22.5 -41.7
Other Hispanic, LatinAmerican
-69.1 0.0 1.7 -51.1 -44.4 -41.3 -49.8 -46.0 -65.2
Puerto Rican -43.7 0.0 9.7 -33.9 -20.6 -21.8 -32.6 -22.8 -48.8
American Indian, AlaskanNative
0.0
Other -52.8 0.0 -1.9 -38.2 -25.7 -59.2 -41.7 -42.7 -51.2
Missing 0.0
104

Table 5f
Net Effects, Relative to Engineering, for Graduate Major, for Predicting Each GRE Score for Each Group
FEMALE
Analytical
105
Race/ethnic categories Humanities Engineering Phy Sci Social Sci Life Sci Business Other Education Missing
White (non-Hispanic) -16.3 0.0 9.7 -16.9 -21.2 -17.9 -20.0 -18.7 -27.3
Black, African American -4.8 0.0 2.5 -15.6 -12.0 -16.2 -25.1 -21.1 -30.0
Asian, Asian American,Pacific Islander
0.0
Mexican, MexicanAmerican, Chicano
19.2 0.0 55.4 16.7 14.5 -1.0 9.6 16.1 -0.5
Other Hispanic, LatinAmerican
0.0
Puerto Rican 0.0
American Indian, AlaskanNative
0.0
Other -24.3 0.0 0.3 -26.9 -19.0 -49.9 -30.2 -29.4 -37.9
Missing 0.0
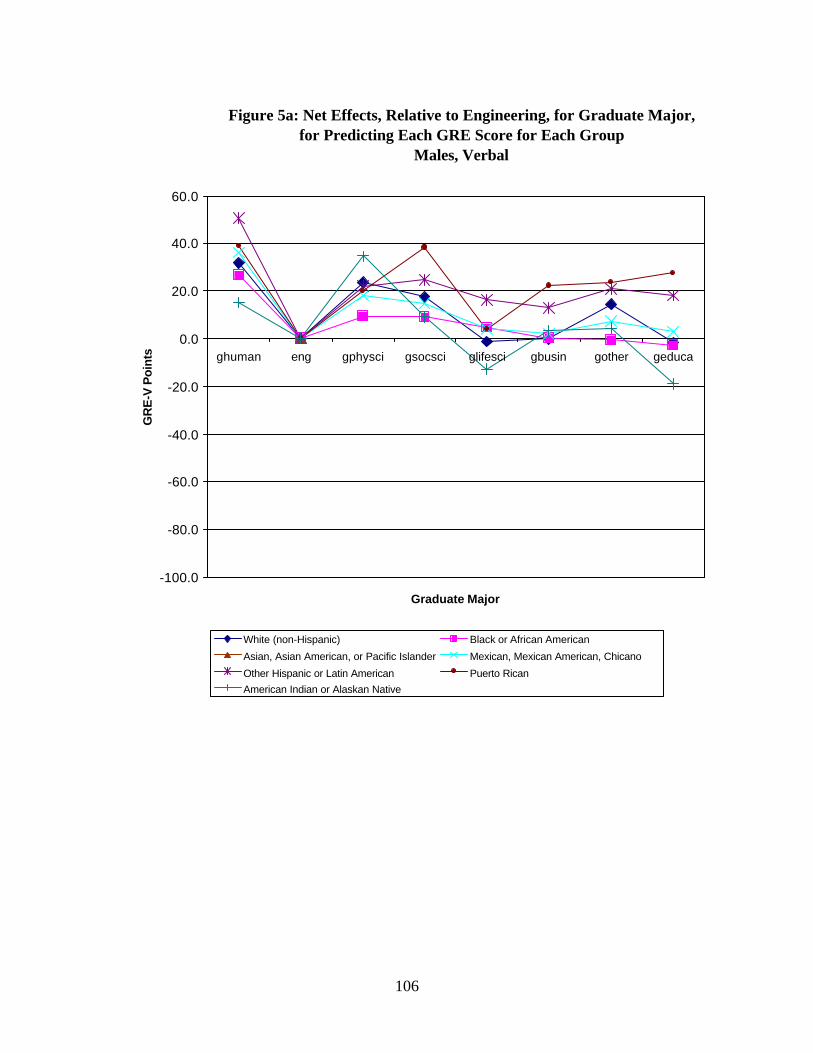
106
Figure 5a: Net Effects, Relative to Engineering, for Graduate Major, for Predicting Each GRE Score for Each Group
Males, Verbal
-100.0
-80.0
-60.0
-40.0
-20.0
0.0
20.0
40.0
60.0
ghuman eng gphysci gsocsci glifesci gbusin gother geduca
Graduate Major
GR
E-V
Poi
nts
White (non-Hispanic) Black or African American
Asian, Asian American, or Pacific Islander Mexican, Mexican American, Chicano
Other Hispanic or Latin American Puerto Rican
American Indian or Alaskan Native

107
Figure 5b: Net Effects, Relative to Engineering, for Graduate Major, for Predicting Each GRE Score for Each Group
Males, Quantitative
-100.0
-80.0
-60.0
-40.0
-20.0
0.0
20.0
40.0
60.0
ghuman eng gphysci gsocsci glifesci gbusin gother geduca
Graduate Major
GR
E-Q
Po
ints
White (non-Hispanic) Black or African American
Asian, Asian American, or Pacific Islander Mexican, Mexican American, Chicano
Other Hispanic or Latin American Puerto Rican
American Indian or Alaskan Native

108
Figure 5c: Net Effects, Relative to Engineering, for Graduate Major, for Predicting Each GRE Score for Each Group
Male, Analytical
-100.0
-80.0
-60.0
-40.0
-20.0
0.0
20.0
40.0
60.0
ghuman eng gphysci gsocsci glifesci gbusin gother geduca
Graduate Major
GR
E-A
Poi
nts
White (non-Hispanic) Black or African American
Asian, Asian American, or Pacific Islander Mexican, Mexican American, Chicano
Other Hispanic or Latin American Puerto Rican
American Indian or Alaskan Native

109
Figure 5d: Net Effects, Relative to Engineering, for Graduate Major, for Predicting Each GRE Score for Each Group
Females, Verbal
-100.0
-80.0
-60.0
-40.0
-20.0
0.0
20.0
40.0
60.0
ghuman eng gphysci gsocscii glifesci gbusin gother geduca
Graduate Major
GR
E-V
Poi
nts
White (non-Hispanic) Black or African American
Asian, Asian American, or Pacific Islander Mexican, Mexican American, Chicano
Other Hispanic or Latin American Puerto Rican
American Indian or Alaskan Native

110
Figure 5e: Net Effects, Relative to Engineering, for Graduate Major, for Predicting Each GRE Score for Each Group
Female, Quantitative
-100.0
-80.0
-60.0
-40.0
-20.0
0.0
20.0
40.0
60.0
ghuman eng gphysci gsocscii glifesci gbusin gother geduca
Graduate Major
GR
E-Q
Po
ints
White (non-Hispanic) Black or African American
Asian, Asian American, or Pacific Islander Mexican, Mexican American, Chicano
Other Hispanic or Latin American Puerto Rican
American Indian or Alaskan Native

111
Figure 5f: Net Effects, Relative to Engineering, for Graduate Major, for Predicting Each GRE Score for Each Group
Females, Analytical
-100.0
-80.0
-60.0
-40.0
-20.0
0.0
20.0
40.0
60.0
ghuman eng gphysci gsocscii glifesci gbusin gother geduca
Graduate Major
GR
E-A
Poi
nts
White (non-Hispanic) Black or African American
Asian, Asian American, or Pacific Islander Mexican, Mexican American, Chicano
Other Hispanic or Latin American Puerto Rican
American Indian or Alaskan Native

112
Table 6a
Net Effects, Relative to Attending Full Time, for Predicting Each GRE Score for Each Group
MALE
Verbal
Race/ethnic categories Part time Full time Undecided Missing
White (non-Hispanic) 0.0
Black, African American 0.0
Asian, Asian American, PacificIslander
-27.5 0.0 3.6 18.7
Mexican, Mexican American,Chicano
0.0
Other Hispanic, Latin American -12.3 0.0 4.6 27.4
Puerto Rican 0.0
American Indian, AlaskanNative
0.0
Other 0.0
Missing 0.0

113
Table 6b
Net Effects, Relative to Attending Full Time, for Predicting Each GRE Score for Each Group
MALE
Quantitative
Race/ethnic categories Part time Full time Undecided Missing
White (non-Hispanic) -15.2 0.0 1.8 7.5
Black, African American 0.0
Asian, Asian American, PacificIslander
-27.1 0.0 -7.2 0.4
Mexican, Mexican American,Chicano
-26.3 0.0 0.8 -8.7
Other Hispanic, Latin American -32.5 0.0 1.4 2.7
Puerto Rican 0.0
American Indian, AlaskanNative
-29.3 0.0 9.8 -43.2
Other 0.0
Missing 0.0
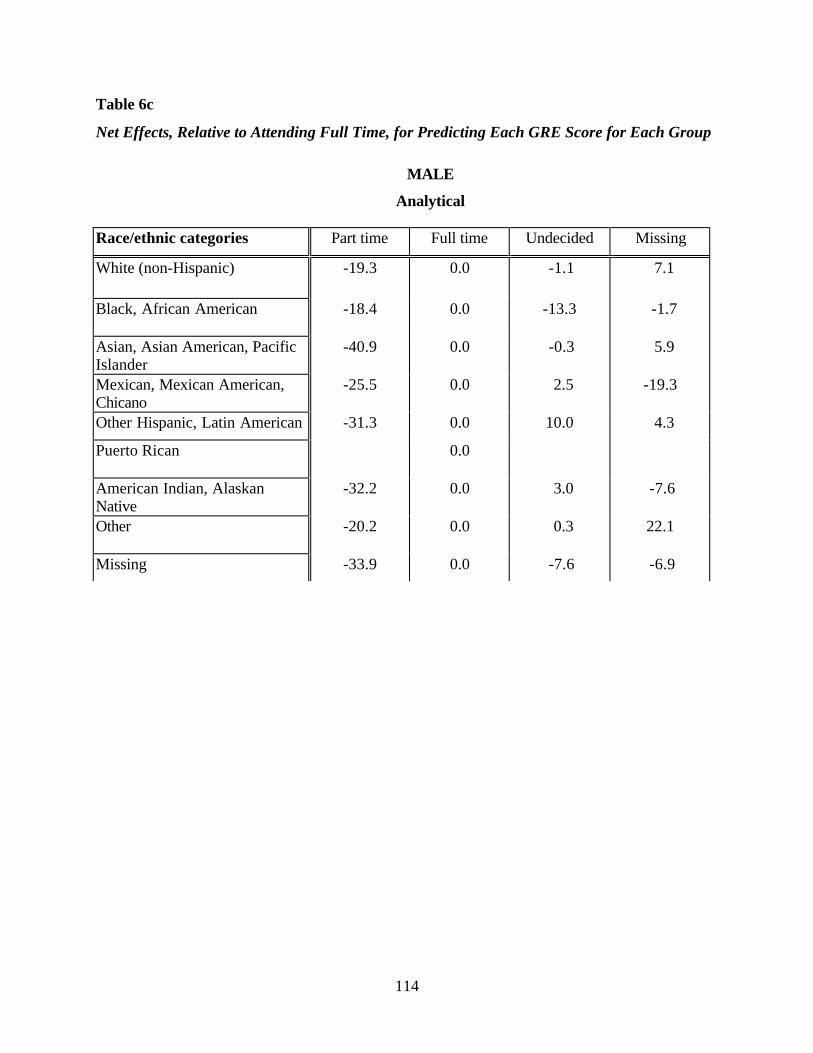
114
Table 6c
Net Effects, Relative to Attending Full Time, for Predicting Each GRE Score for Each Group
MALE
Analytical
Race/ethnic categories Part time Full time Undecided Missing
White (non-Hispanic) -19.3 0.0 -1.1 7.1
Black, African American -18.4 0.0 -13.3 -1.7
Asian, Asian American, PacificIslander
-40.9 0.0 -0.3 5.9
Mexican, Mexican American,Chicano
-25.5 0.0 2.5 -19.3
Other Hispanic, Latin American -31.3 0.0 10.0 4.3
Puerto Rican 0.0
American Indian, AlaskanNative
-32.2 0.0 3.0 -7.6
Other -20.2 0.0 0.3 22.1
Missing -33.9 0.0 -7.6 -6.9

115
Table 6d
Net Effects, Relative to Attending Full Time, for Predicting Each GRE Score for Each Group
FEMALE
Verbal
Race/ethnic categories Part time Full time Undecided Missing
White (non-Hispanic) -5.5 0.0 3.5 14.4
Black, African American 0.0
Asian, Asian American, PacificIslander
-31.6 0.0 1.1 21.4
Mexican, Mexican American,Chicano
-17.9 0.0 0.2 11.3
Other Hispanic, Latin American -17.5 0.0 1.2 7.5
Puerto Rican 0.0
American Indian, AlaskanNative
0.0
Other -12.5 0.0 5.3 23.2
Missing 0.0

116
Table 6e
Net Effects, Relative to Attending Full Time, for Predicting Each GRE Score for Each Group
FEMALE
Quantitative
Race/ethnic categories Part time Full time Undecided Missing
White (non-Hispanic) -22.1 0.0 -0.6 8.3
Black, African American -20.9 0.0 -5.7 -2.3
Asian, Asian American, PacificIslander
-51.2 0.0 -8.9 19.9
Mexican, Mexican American,Chicano
-32.1 0.0 -3.4 -14.9
Other Hispanic, Latin American -33.0 0.0 -9.7 11.9
Puerto Rican -26.4 0.0 -12.1 5.6
American Indian, AlaskanNative
0.0
Other -34.7 0.0 -2.2 19.2
Missing -35.6 0.0 -9.9 -2.6

117
Table 6f
Net Effects, Relative to Attending Full Time, for Predicting Each GRE Score for Each Group
FEMALE
Analytical
Race/ethnic categories Part time Full time Undecided Missing
White (non-Hispanic) -22.3 0.0 -1.3 9.0
Black, African American -22.5 0.0 -8.3 -1.6
Asian, Asian American, PacificIslander
-49.8 0.0 -6.9 17.0
Mexican, Mexican American,Chicano
-30.4 0.0 -8.2 5.7
Other Hispanic, Latin American -32.1 0.0 -7.4 8.0
Puerto Rican -29.8 0.0 -15.3 -1.1
American Indian, AlaskanNative
0.0
Other -31.4 0.0 1.9 22.3
Missing -37.1 0.0 -6.4 -5.9

118
Figure 6a: Net Effects, Relative to Attending Full Time,for Predicting Each GRE Score for Each Group
Males, Verbal
-60.0
-50.0
-40.0
-30.0
-20.0
-10.0
0.0
10.0
20.0
30.0
40.0
part time full time undecided
Attend Full Time
GR
E-V
Po
ints
White (non-Hispanic) Black or African American
Asian, Asian American, or Pacific Islander Mexican, Mexican American, Chicano
Other Hispanic or Latin American Puerto Rican
American Indian or Alaskan Native Other
Missing

119
Figure 6b: Net Effects, Relative to Attending Full Time,for Predicting Each GRE Score for Each Group
Males, Quantitative
-60.0
-50.0
-40.0
-30.0
-20.0
-10.0
0.0
10.0
20.0
30.0
40.0
part full time undecided
Attend Full Time
GR
E-Q
Po
ints
White (non-Hispanic) Black or African American
Asian, Asian American, or Pacific Islander Mexican, Mexican American, Chicano
Other Hispanic or Latin American Puerto Rican
American Indian or Alaskan Native Other
Missing

120
Figure 6c: Net Effects, Relative to Attending Full Time,for Predicting Each GRE Score for Each Group
Males, Analytical
-60.0
-50.0
-40.0
-30.0
-20.0
-10.0
0.0
10.0
20.0
30.0
40.0
part full time undecided
Attend Full Time
GR
E-A
Po
ints
White (non-Hispanic) Black or African American
Asian, Asian American, or Pacific Islander Mexican, Mexican American, Chicano
Other Hispanic or Latin American Puerto Rican
American Indian or Alaskan Native

121
Figure 6d: Net Effects, Relative to Attending Full Time,for Predicting Each GRE Score for Each Group
Females, Verbal
-60.0
-50.0
-40.0
-30.0
-20.0
-10.0
0.0
10.0
20.0
30.0
40.0
part time full time undecided
Attend Full Time
GR
E-V
Po
ints
White (non-Hispanic) Black or African American
Asian, Asian American, or Pacific Islander Mexican, Mexican American, Chicano
Other Hispanic or Latin American Puerto Rican
American Indian or Alaskan Native Other
Missing

122
Figure 6e: Net Effects, Relative to Attending Full Time,for Predicting Each GRE Score for Each Group
Females, Quantitative
-60.0
-50.0
-40.0
-30.0
-20.0
-10.0
0.0
10.0
20.0
30.0
40.0
part time full time undecided
Attend Full Time
GR
E-Q
Po
ints
White (non-Hispanic) Black or African American
Asian, Asian American, or Pacific Islander Mexican, Mexican American, Chicano
Other Hispanic or Latin American Puerto Rican
American Indian or Alaskan Native Other
Missing

123
Figure 6f: Net Effects, Relative to Attending Full Time,for Predicting Each GRE Score for Each Group
Females, Analytical
-60.0
-50.0
-40.0
-30.0
-20.0
-10.0
0.0
10.0
20.0
30.0
40.0
part time full time undecided
Attend Full Time
White (non-Hispanic) Black or African American
Asian, Asian American, or Pacific Islander Mexican, Mexican American, Chicano
Other Hispanic or Latin American Puerto Rican
American Indian or Alaskan Native Other
Missing
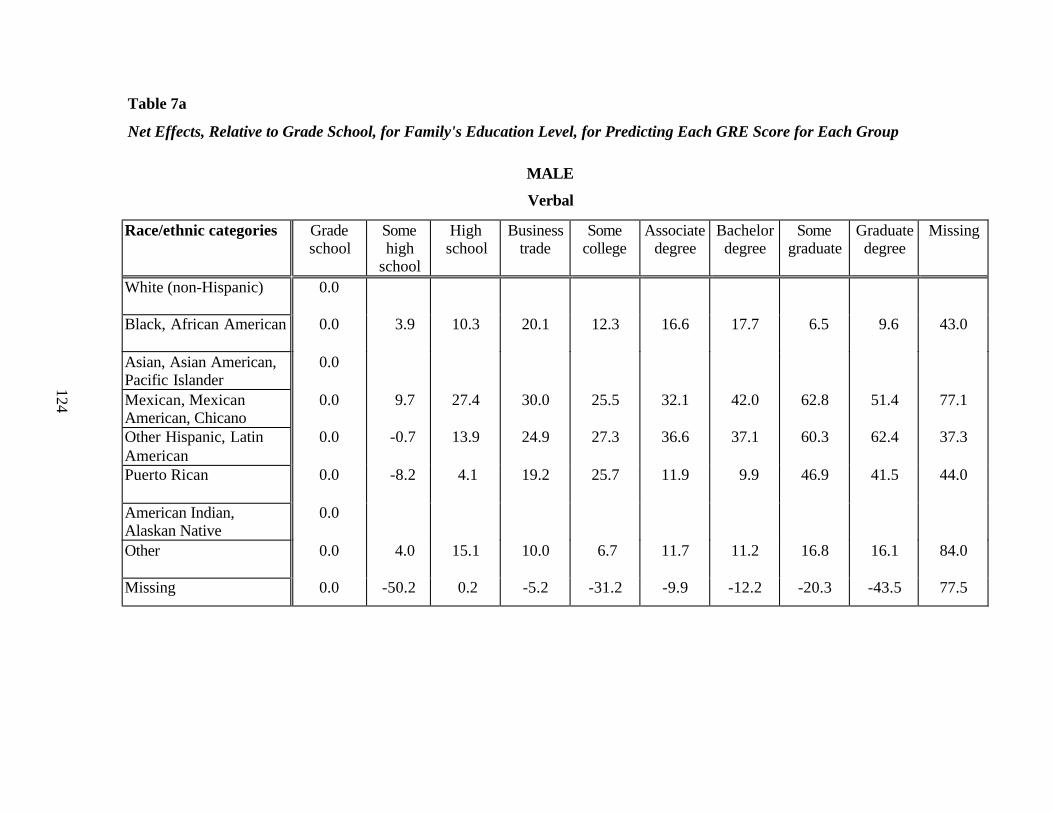
Table 7a
Net Effects, Relative to Grade School, for Family's Education Level, for Predicting Each GRE Score for Each Group
MALE
Verbal
Race/ethnic categories Gradeschool
Somehigh
school
Highschool
Businesstrade
Somecollege
Associatedegree
Bachelordegree
Somegraduate
Graduatedegree
Missing
White (non-Hispanic) 0.0
Black, African American 0.0 3.9 10.3 20.1 12.3 16.6 17.7 6.5 9.6 43.0
Asian, Asian American,Pacific Islander
0.0
Mexican, MexicanAmerican, Chicano
0.0 9.7 27.4 30.0 25.5 32.1 42.0 62.8 51.4 77.1
Other Hispanic, LatinAmerican
0.0 -0.7 13.9 24.9 27.3 36.6 37.1 60.3 62.4 37.3
Puerto Rican 0.0 -8.2 4.1 19.2 25.7 11.9 9.9 46.9 41.5 44.0
American Indian,Alaskan Native
0.0
Other 0.0 4.0 15.1 10.0 6.7 11.7 11.2 16.8 16.1 84.0
Missing 0.0 -50.2 0.2 -5.2 -31.2 -9.9 -12.2 -20.3 -43.5 77.5
124

Table 7b
Net Effects, Relative to Grade School, for Family's Education Level, for Predicting Each GRE Score for Each Group
MALE
Quantitative
Race/ethnic categories Gradeschool
Somehigh
school
Highschool
Businesstrade
Somecollege
Associatedegree
Bachelordegree
Somegraduate
Graduatedegree
Missing
White (non-Hispanic) 0.0
Black, African American 0.0 -0.1 10.0 23.1 31.0 36.6 40.7 57.4 60.1 37.1
Asian, Asian American,Pacific Islander
0.0 12.5 8.0 10.9 17.6 4.5 -18.8 -19.3 -22.2 87.7
Mexican, MexicanAmerican, Chicano
0.0 5.2 26.4 28.6 38.1 38.3 49.6 71.8 66.6 35.1
Other Hispanic, LatinAmerican
0.0 12.6 24.4 33.3 41.4 45.5 56.0 70.9 78.7 57.4
Puerto Rican 0.0 -5.2 25.9 25.2 40.7 43.2 21.9 57.7 41.7 63.3
American Indian,Alaskan Native
0.0 37.2 50.7 68.9 72.3 66.6 92.6 91.8 104.8 96.8
Other 0.0 1.7 19.9 17.6 16.8 21.0 29.1 42.3 49.4 85.2
Missing 0.0 -32.5 -13.6 15.9 -24.5 -14.9 -8.3 -21.9 -27.9 104.6
125

Table 7c
Net Effects, Relative to Grade School, for Family's Education Level, for Predicting Each GRE Score for Each Group
MALE
Analytical
Race/ethnic categories Gradeschool
Somehigh
school
Highschool
Businesstrade
Somecollege
Associatedegree
Bachelordegree
Somegraduate
Graduatedegree
Missing
White (non-Hispanic) 0.0
Black, African American 0.0 -0.4 5.7 15.6 15.3 12.6 11.7 13.7 21.0 40.3
Asian, Asian American,Pacific Islander
0.0
Mexican, MexicanAmerican, Chicano
0.0 1.6 4.3 20.5 -5.5 13.2 6.2 13.5 12.2 68.9
Other Hispanic, LatinAmerican
0.0 8.1 17.1 14.5 29.8 33.4 30.0 52.4 48.3 62.6
Puerto Rican 0.0 12.8 44.6 42.6 75.2 58.6 46.6 85.5 83.5 88.3
American Indian,Alaskan Native
0.0 38.7 60.4 80.9 92.2 88.7 114.9 90.8 118.0 84.0
Other 0.0 30.9 45.7 41.9 22.0 32.6 41.1 35.4 55.2 107.8
Missing 0.0 -57.5 -22.7 -29.8 -49.1 -29.3 -31.2 -35.5 -41.0 92.8
126

Table 7d
Net Effects, Relative to Grade School, for Family's Education Level, for Predicting Each GRE Score for Each Group
FEMALE
Verbal
Race/ethnic categories Gradeschool
Somehigh
school
Highschool
Businesstrade
Somecollege
Associatedegree
Bachelordegree
Somegraduate
Graduatedegree
Missing
White (non-Hispanic) 0.0
Black, African American 0.0
Asian, Asian American,Pacific Islander
0.0 21.0 38.3 35.7 36.5 33.8 28.2 29.7 23.7 85.3
Mexican, MexicanAmerican, Chicano
0.0 13.3 25.4 27.5 32.7 31.3 46.3 66.3 62.1 35.3
Other Hispanic, LatinAmerican
0.0 0.3 16.6 15.8 20.6 19.4 27.9 42.3 46.7 55.7
Puerto Rican 0.0
American Indian,Alaskan Native
0.0 25.2 33.4 39.5 44.4 44.2 44.6 71.8 62.7 59.5
Other 0.0 9.3 23.2 23.2 34.8 32.2 42.0 56.2 60.2 58.5
Missing 0.0
127

Table 7e
Net Effects, Relative to Grade School, for Family's Education Level, for Predicting Each GRE Score for Each Group
FEMALE
Quantitative
Race/ethnic categories Gradeschool
Somehigh
school
Highschool
Businesstrade
Somecollege
Associatedegree
Bachelordegree
Somegraduate
Graduatedegree
Missing
White (non-Hispanic) 0.0
Black, African American 0.0
Asian, Asian American,Pacific Islander
0.0
Mexican, MexicanAmerican, Chicano
0.0 4.0 18.2 24.6 32.7 38.6 48.4 66.8 61.8 38.3
Other Hispanic, LatinAmerican
0.0 -3.8 -1.4 -0.9 -4.7 4.1 2.4 -10.2 1.7 67.3
Puerto Rican 0.0
American Indian,Alaskan Native
0.0 16.0 35.6 38.0 62.6 56.0 67.2 90.0 83.4 41.9
Other 0.0 1.6 12.2 24.8 22.4 25.8 35.3 44.6 41.8 70.2
Missing 0.0 -19.2 -9.7 -4.9 -14.9 -31.1 -20.2 -8.7 -28.2 70.8
128

Table 7f
Net Effects, Relative to Grade School, for Family's Education Level, for Predicting Each GRE Score for Each Group
FEMALE
Analytical
Race/ethnic categories Gradeschool
Somehigh
school
Highschool
Businesstrade
Somecollege
Associatedegree
Bachelordegree
Somegraduate
Graduatedegree
Missing
White (non-Hispanic) 0.0
Black, African American 0.0
Asian, Asian American,Pacific Islander
0.0
Mexican, MexicanAmerican, Chicano
0.0
Other Hispanic, LatinAmerican
0.0 -1.6 4.0 -3.4 -0.5 6.5 -7.1 -0.7 4.0 46.2
Puerto Rican 0.0 4.1 27.1 23.6 43.0 34.8 19.8 47.4 36.4 57.0
American Indian,Alaskan Native
0.0 36 66 73.1 93.3 90 98.9 112.8 115.2 76.3
Other 0.0 6.7 15.5 25.8 10.1 13.9 21.0 10.9 13.7 87.4
Missing 0.0
129

130
Figure 7a: Net Effects, Relative to Grade School, for Family's Education Level, for Predicting Each GRE Score for Each Group
Males, Verbal
-40
-20
0
20
40
60
80
100
120
140
grade sch some hs high sch bus/trade some coll assc deg bach deg some grad grad deg
Family Education Level
GR
E-V
Poi
nts
White (non-Hispanic) Black or African American
Asian, Asian American, or Pacific Islander Mexican, Mexican American, Chicano
Other Hispanic or Latin American Puerto Rican
American Indian or Alaskan Native

131
Figure 7b: Net Effects, Relative to Grade School, for Family's Education Level, for Predicting Each GRE Score for Each Group
Males, Quantitative
-40
-20
0
20
40
60
80
100
120
140
grade sch some hs high sch bus/trade some coll assc deg bach deg some grad grad deg
Family Education Level
GR
E-Q
Poi
nts
White (non-Hispanic) Black or African American
Asian, Asian American, or Pacific Islander Mexican, Mexican American, Chicano
Other Hispanic or Latin American Puerto Rican
American Indian or Alaskan Native
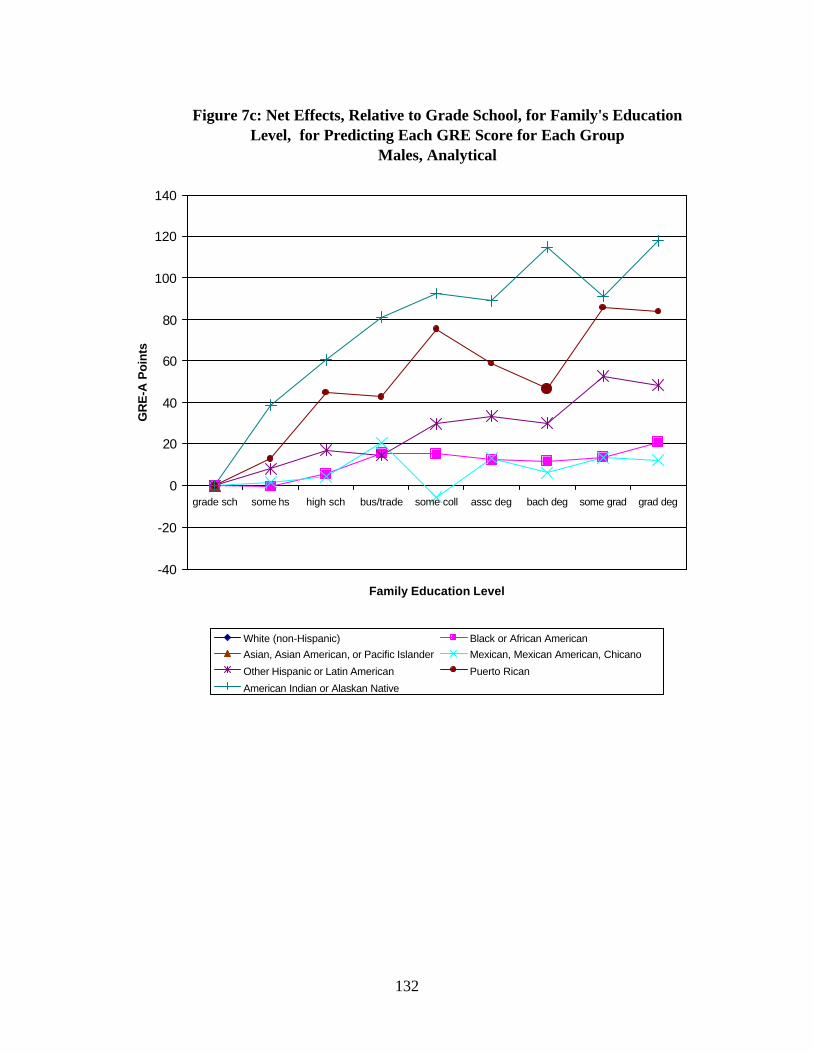
132
Figure 7c: Net Effects, Relative to Grade School, for Family's Education Level, for Predicting Each GRE Score for Each Group
Males, Analytical
-40
-20
0
20
40
60
80
100
120
140
grade sch some hs high sch bus/trade some coll assc deg bach deg some grad grad deg
Family Education Level
GR
E-A
Poi
nts
White (non-Hispanic) Black or African American
Asian, Asian American, or Pacific Islander Mexican, Mexican American, Chicano
Other Hispanic or Latin American Puerto Rican
American Indian or Alaskan Native

133
Figure 7d: Net Effects, Relative to Grade School, for Family's Education Level, for Predicting Each GRE Score for Each Group
Females, Verbal
-40
-20
0
20
40
60
80
100
120
140
grade sch some hs high sch bus/trade some coll assc deg bach deg some grad grad deg
Family Education Level
GR
E-V
Po
ints
White (non-Hispanic) Black or African American
Asian, Asian American, or Pacific Islander Mexican, Mexican American, Chicano
Other Hispanic or Latin American Puerto Rican
American Indian or Alaskan Native

134
Figure 7e: Net Effects, Relative to Grade School, for Family's Education Level, for Predicting Each GRE Score for Each Group
Females, Quantitative
-40
-20
0
20
40
60
80
100
120
140
grade sch some hs high sch bus/trade some coll assc deg bach deg some grad grad deg
Family Education Level
GR
E-Q
Po
ints
White (non-Hispanic) Black or African American
Asian, Asian American, or Pacific Islander Mexican, Mexican American, Chicano
Other Hispanic or Latin American Puerto Rican
American Indian or Alaskan Native

135
Figure 7f: Net Effects, Relative to Grade School, for Family's Education Level, for Predicting Each GRE Score for Each Group
Females, Analytical
-40
-20
0
20
40
60
80
100
120
140
grade sch some hs high sch bus/trade some coll assc deg bach deg some grad grad deg
Family Education Level
GR
E-A
Poi
nts
White (non-Hispanic) Black or African American
Asian, Asian American, or Pacific Islander Mexican, Mexican American, Chicano
Other Hispanic or Latin American Puerto Rican
American Indian or Alaskan Native

Table 8a
Net Effects, Relative to Grade School, for Father's Education Level, for Predicting Each GRE Score for Each Group
MALE
Verbal
Race/ethnic categories Gradeschool
Somehigh
school
Highschool
Businesstrade
Somecollege
Associatedegree
Bachelordegree
Somegraduate
Graduatedegree
Missing
White (non-Hispanic) 0.0 -2.2 -4.3 -3.0 5.4 -0.4 9.4 24.1 22.9 23.8
Black, African American 0.0 1.9 2.1 2.2 12.4 12.0 11.2 28.7 28.6 -6.2
Asian, Asian American,Pacific Islander
0.0 -0.5 6.6 25.2 7.4 22 19.2 46.2 51.9 36.5
Mexican, MexicanAmerican, Chicano
0.0
Other Hispanic, LatinAmerican
0.0
Puerto Rican 0.0
American Indian,Alaskan Native
0.0
Other 0.0 11.1 18.0 20.7 28.5 27.8 38.5 48.9 54.6 45.8
Missing 0.0 20.0 0.3 12.9 26.2 5.2 20.7 47.2 66.2 -31.0
136

Table 8b
Net Effects, Relative to Grade School, for Father's Education Level, for Predicting Each GRE Score for Each Group
MALE
Quantitative
Race/ethnic categories Gradeschool
Somehigh
school
Highschool
Businesstrade
Somecollege
Associatedegree
Bachelordegree
Somegraduate
Graduatedegree
Missing
White (non-Hispanic) 0.0 9.8 21.4 30.0 38.1 36.6 50.0 61.6 66.4 42.7
Black, African American 0.0
Asian, Asian American,Pacific Islander
0.0 1.7 6.2 14.3 6.6 22.8 45.1 56.9 69.7 -10.8
Mexican, MexicanAmerican, Chicano
0.0
Other Hispanic, LatinAmerican
0.0
Puerto Rican 0.0 26.3 6.0 20.0 35.8 1.9 26.5 20.4 38.4 4.4
American Indian,Alaskan Native
0.0
Other 0.0 5.8 14.9 17.9 36.9 30.5 42.2 39.5 44.5 -13.0
Missing 0.0 17.4 19.0 19.1 34.6 24.9 41.8 56.7 67.9 -17.6
137

Table 8c
Net Effects, Relative to Grade School, for Father's Education Level, for Predicting Each GRE Score for Each Group
MALE
Analytical
Race/ethnic categories Gradeschool
Somehigh
school
Highschool
Businesstrade
Somecollege
Associatedegree
Bachelordegree
Somegraduate
Graduatedegree
Missing
White (non-Hispanic) 0.0 7.1 20.6 24.7 33.1 28.1 36.3 43.0 45.5 46.8
Black, African American 0.0 3.8 11.8 11.2 21.5 19.0 23.8 41.1 38.3 17.1
Asian, Asian American,Pacific Islander
0.0 13.9 20.5 33.8 29.5 41.2 37.5 55.2 70.4 66.9
Mexican, MexicanAmerican, Chicano
0.0 7.9 27.7 25.7 32.5 28.4 40.9 64.5 45.8 34.2
Other Hispanic, LatinAmerican
0.0
Puerto Rican 0.0
American Indian,Alaskan Native
0.0
Other 0.0 16.9 32.4 35.7 45.2 45.5 54.8 64.7 67.2 43.3
Missing 0.0 17.1 6.3 30.1 31.7 18.3 33.6 47.8 51.9 -50.8
138

Table 8d
Net Effects, Relative to Grade School, for Father's Education Level, for Predicting Each GRE Score for Each Group
FEMALE
Verbal
Race/ethnic categories Gradeschool
Somehigh
school
Highschool
Businesstrade
Somecollege
Associatedegree
Bachelordegree
Somegraduate
Graduatedegree
Missing
White (non-Hispanic) 0.0 0.0 -2.3 -2.6 4.8 0.0 9.1 23.9 24.7 12.6
Black, African American 0.0 -2.4 -0.6 0.9 10.8 11.1 13.4 26.3 27.3 2.5
Asian, Asian American,Pacific Islander
0.0 -8.3 -16.7 -5.7 -9.7 -1.1 4.0 24.3 36.1 -12.0
Mexican, MexicanAmerican, Chicano
0.0
Other Hispanic, LatinAmerican
0.0
Puerto Rican 0.0 8.5 4.7 21.7 16.2 0.9 10.5 52.6 30.7 4.1
American Indian,Alaskan Native
0.0
Other 0.0
Missing 0.0 13.9 16.3 16.5 35.0 44.0 37.6 69.0 58.5 36.0
139

Table 8e
Net Effects, Relative to Grade School, for Father's Education Level, for Predicting Each GRE Score for Each Group
FEMALE
Quantitative
Race/ethnic categories Gradeschool
Somehigh
school
Highschool
Businesstrade
Somecollege
Associatedegree
Bachelordegree
Somegraduate
Graduatedegree
Missing
White (non-Hispanic) 0.0 12.1 24.0 31.3 39.2 41.0 54.3 65.9 72.0 42.1
Black, African American 0.0 7.0 15.3 24.8 32.7 33.8 40.9 57.8 56.2 23.0
Asian, Asian American,Pacific Islander
0.0 8.6 4.9 14.5 9.1 19.0 26.8 35.1 49.3 17.3
Mexican, MexicanAmerican, Chicano
0.0
Other Hispanic, LatinAmerican
0.0 0.0 12.7 16.3 14.4 15.8 29.8 31.8 40.4 -8.3
Puerto Rican 0.0 7.0 5.4 21.1 27.5 19.6 21.4 40.2 37.3 16.7
American Indian,Alaskan Native
0.0
Other 0.0 5.1 8.6 3.2 23.4 24.8 26.1 29.1 49.1 -19.8
Missing 0.0 26.7 28.8 33.8 51.5 69.5 58.6 75.4 87.0 12.5
140

Table 8f
Net Effects, Relative to Grade School, for Father's Education Level, for Predicting Each GRE Score for Each Group
FEMALE
Analytical
Race/ethnic categories Gradeschool
Somehigh
school
Highschool
Businesstrade
Somecollege
Associatedegree
Bachelordegree
Somegraduate
Graduatedegree
Missing
White (non-Hispanic) 0.0 10.7 22.7 26.5 34.4 32.5 40.5 49.0 51.8 40.1
Black, African American 0.0 4.5 9.2 14.5 24.7 23.0 25.1 36.8 37.8 13.6
Asian, Asian American,Pacific Islander
0.0 11.6 13.0 24.5 22.6 22.7 31.2 43.4 58.7 36.8
Mexican, MexicanAmerican, Chicano
0.0 8.1 17.1 33.2 32.0 26.0 38.5 53.6 44.3 27.4
Other Hispanic, LatinAmerican
0.0 -3.6 14.1 16.8 21.7 17.3 31.5 33.4 37.4 3.9
Puerto Rican 0.0 12.9 -5.7 21.0 12.3 2.5 14.1 23.9 32.5 -6.7
American Indian,Alaskan Native
0.0
Other 0.0 8.5 18.5 12.1 37.0 31.9 41.3 45.8 56.4 27.2
Missing 0.0 31.1 47.5 51.7 72.6 78.2 83.6 98.9 111.6 69.7
141
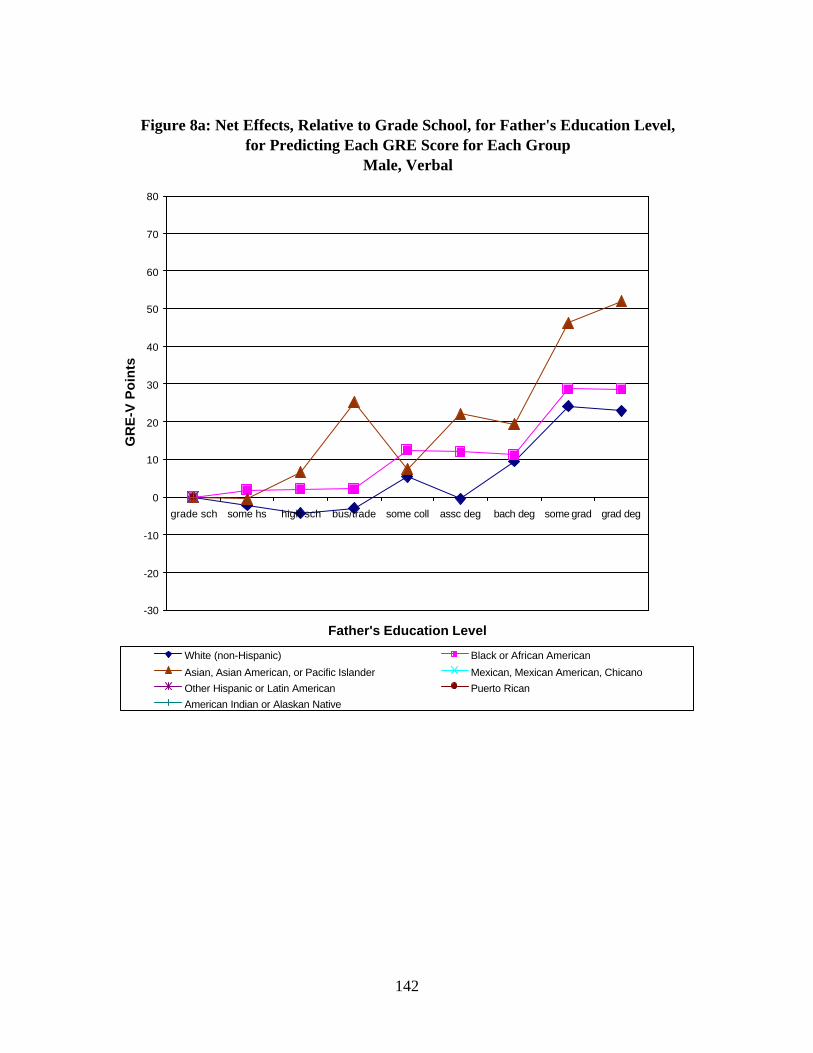
142
Figure 8a: Net Effects, Relative to Grade School, for Father's Education Level, for Predicting Each GRE Score for Each Group
Male, Verbal
-30
-20
-10
0
10
20
30
40
50
60
70
80
grade sch some hs high sch bus/trade some coll assc deg bach deg some grad grad deg
Father's Education Level
GR
E-V
Po
ints
White (non-Hispanic) Black or African American
Asian, Asian American, or Pacific Islander Mexican, Mexican American, Chicano
Other Hispanic or Latin American Puerto Rican
American Indian or Alaskan Native

143
Figure 8b: Net Effects, Relative to Grade School, for Father's Education Level, for Predicting Each GRE Score for Each Group
Males, Quantitative
-30
-20
-10
0
10
20
30
40
50
60
70
80
grade sch some hs high sch bus/trade some coll assc deg bach deg some grad grad deg
Father's Education Level
GR
E-Q
Poi
nts
White (non-Hispanic) Black or African American
Asian, Asian American, or Pacific Islander Mexican, Mexican American, Chicano
Other Hispanic or Latin American Puerto Rican
American Indian or Alaskan Native

144
Figure 8c: Net Effects, Relative to Grade School, for Father's Education Level, for Predicting Each GRE Score for Each Group
Male, Analytical
-30
-20
-10
0
10
20
30
40
50
60
70
80
grade sch some hs high sch bus/trade some coll assc deg bach deg some grad grad deg
Father's Education Level
GR
E-A
Po
ints
White (non-Hispanic) Black or African American
Asian, Asian American, or Pacific Islander Mexican, Mexican American, Chicano
Other Hispanic or Latin American Puerto Rican
American Indian or Alaskan Native

145
Figure 8d: Net Effects, Relative to Grade School, for Father's Education Level, for Predicting Each GRE Score for Each Group
Females, Verbal
-30
-20
-10
0
10
20
30
40
50
60
70
80
grade sch some hs high sch bus/trade some coll assc deg bach deg somegrad
grad deg
Father's Education Level
GR
E-V
Po
ints
White (non-Hispanic) Black or African American
Asian, Asian American, or Pacific Islander Mexican, Mexican American, Chicano
Other Hispanic or Latin American Puerto Rican
American Indian or Alaskan Native

146
Figure 8e: Net Effects, Relative to Grade School, for Father's Education Level, for Predicting Each GRE Score for Each Group
Female, Quantitative
-30
-20
-10
0
10
20
30
40
50
60
70
80
grade sch some hs high sch bus/trade some coll assc deg bach deg some grad grad deg
Father's Education Level
GR
E-Q
Po
ints
White (non-Hispanic) Black or African American
Asian, Asian American, or Pacific Islander Mexican, Mexican American, Chicano
Other Hispanic or Latin American Puerto Rican
American Indian or Alaskan Native

147
Figure 8f: Net Effects, Relative to Grade School, for Father's Education Level, for Predicting Each GRE Score for Each Group
Female, Analytical
-30
-20
-10
0
10
20
30
40
50
60
70
80
grade sch some hs high sch bus/trade some coll assc deg bach deg some grad grad deg
Father's Education Level
GR
E-A
Poi
nts
White (non-Hispanic) Black or African American
Asian, Asian American, or Pacific Islander Mexican, Mexican American, Chicano
Other Hispanic or Latin American Puerto Rican
American Indian or Alaskan Native

Table 9a
Net Effects, Relative to Grade School, for Mother's Education Level, for Predicting Each GRE Score for Each Group
MALE
Verbal
Race/ethnic categories Gradeschool
Somehigh
school
Highschool
Businesstrade
Somecollege
Associatedegree
Bachelordegree
Somegraduate
Graduatedegree
Missing
White (non-Hispanic) 0.0 6.3 9.1 12.5 18.2 13.0 25.3 30.4 36.8 11.0
Black, African American 0.0 4.4 8.6 14.7 19.1 15.8 25.7 35.9 33.2 14.9
Asian, Asian American,Pacific Islander
0.0 8.0 25.2 38.0 36.7 52.1 55.6 58.7 66.4 23.9
Mexican, MexicanAmerican, Chicano
0.0 1.0 5.0 2.8 9.3 11.4 12.9 19.4 23.3 -36.3
Other Hispanic, LatinAmerican
0.0
Puerto Rican 0.0
American Indian,Alaskan Native
0.0 28.3 28.7 61.3 42.0 24.8 40.9 62.7 66.8 35.5
Other 0.0 17.5 34.3 47.6 43.7 39.6 50.0 64.9 65.2 40.5
Missing 0.0 44.9 35.2 43.2 49.6 45.8 56.5 56.6 75.1 16.0
148

Table 9b
Net Effects, Relative to Grade School, for Mother's Education Level, for Predicting Each GRE Score for Each Group
MALE
Quantitative
Race/ethnic categories Gradeschool
Somehigh
school
Highschool
Businesstrade
Somecollege
Associatedegree
Bachelordegree
Somegraduate
Graduatedegree
Missing
White (non-Hispanic) 0.0
Black, African American 0.0
Asian, Asian American,Pacific Islander
0.0 1.2 6.2 5.9 10.1 24.3 30.0 27.4 28.8 -23.6
Mexican, MexicanAmerican, Chicano
0.0
Other Hispanic, LatinAmerican
0.0
Puerto Rican 0.0
American Indian,Alaskan Native
0.0
Other 0.0
Missing 0.0 61.9 56.4 51.7 68.9 67.3 76.5 81.1 87.4 8.0
149

Table 9c
Net Effects, Relative to Grade School, for Mother's Education Level, for Predicting Each GRE Score for Each Group
MALE
Analytical
Race/ethnic categories Gradeschool
Somehigh
school
Highschool
Businesstrade
Somecollege
Associatedegree
Bachelordegree
Somegraduate
Graduatedegree
Missing
White (non-Hispanic) 0.0 13.3 29.7 34.3 43.5 39.0 49.4 52.5 58.6 19.6
Black, African American 0.0 12.7 22.8 33.1 40.5 41.5 43.5 53.3 50.5 3.0
Asian, Asian American,Pacific Islander
0.0 6.0 21.0 32.0 33.6 38.0 49.2 46.0 54.1 1.2
Mexican, MexicanAmerican, Chicano
0.0 3.3 23.9 19.5 38.3 35.3 34.6 47.6 55.5 3.0
Other Hispanic, LatinAmerican
0.0 11.3 26.8 36.9 42.7 45.7 37.1 48.1 54.0 0.8
Puerto Rican 0.0
American Indian,Alaskan Native
0.0
Other 0.0 8.9 36.6 42.8 43.6 43.7 48.4 65.1 64.2 31.8
Missing 0.0 56.6 70.8 70.3 82.0 72.1 94.0 88.9 97.9 32.7
150

Table 9d
Net Effects, Relative to Grade School, for Mother's Education Level, for Predicting Each GRE Score for Each Group
FEMALE
Verbal
Race/ethnic categories Gradeschool
Somehigh
school
Highschool
Businesstrade
Somecollege
Associatedegree
Bachelordegree
Somegraduate
Graduatedegree
Missing
White (non-Hispanic) 0.0 7.1 6.5 9.3 12.7 8.8 20.2 27.1 28.3 10.5
Black, African American 0.0 3.5 7.0 15.2 16.6 15.6 20.0 33.6 26.7 16.0
Asian, Asian American,Pacific Islander
0.0 -3.5 7.3 28.4 16.6 25.1 28.0 38.9 45.8 -2.6
Mexican, MexicanAmerican, Chicano
0.0
Other Hispanic, LatinAmerican
0.0 6.3 7.7 13.5 18.3 11.5 23.8 22.2 23.8 5.1
Puerto Rican 0.0 8 9.3 14.5 25.9 -3.4 7 28.1 16.7 21.6
American Indian,Alaskan Native
0.0
Other 0.0 -3.4 10.7 17.9 17.9 12.8 22.7 33.2 28.6 0.1
Missing 0.0 36.7 25.2 36.5 31.2 37.9 47.4 46.3 54.3 34.1
151
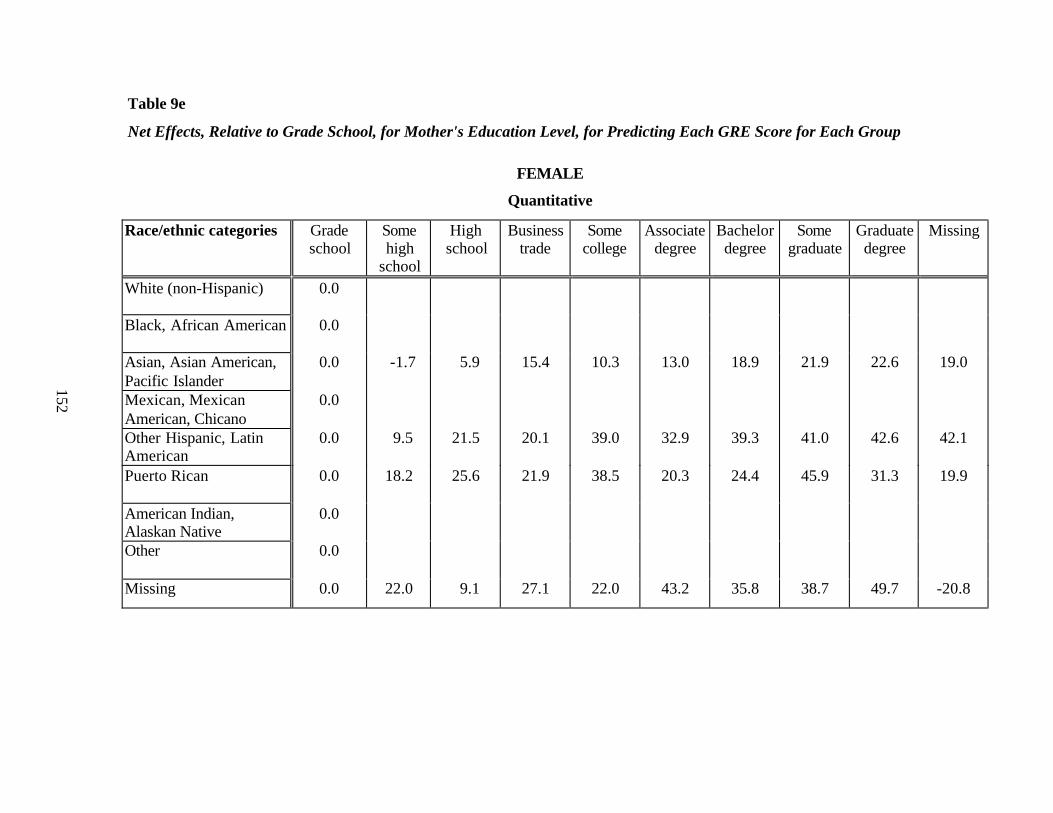
Table 9e
Net Effects, Relative to Grade School, for Mother's Education Level, for Predicting Each GRE Score for Each Group
FEMALE
Quantitative
Race/ethnic categories Gradeschool
Somehigh
school
Highschool
Businesstrade
Somecollege
Associatedegree
Bachelordegree
Somegraduate
Graduatedegree
Missing
White (non-Hispanic) 0.0
Black, African American 0.0
Asian, Asian American,Pacific Islander
0.0 -1.7 5.9 15.4 10.3 13.0 18.9 21.9 22.6 19.0
Mexican, MexicanAmerican, Chicano
0.0
Other Hispanic, LatinAmerican
0.0 9.5 21.5 20.1 39.0 32.9 39.3 41.0 42.6 42.1
Puerto Rican 0.0 18.2 25.6 21.9 38.5 20.3 24.4 45.9 31.3 19.9
American Indian,Alaskan Native
0.0
Other 0.0
Missing 0.0 22.0 9.1 27.1 22.0 43.2 35.8 38.7 49.7 -20.8
152
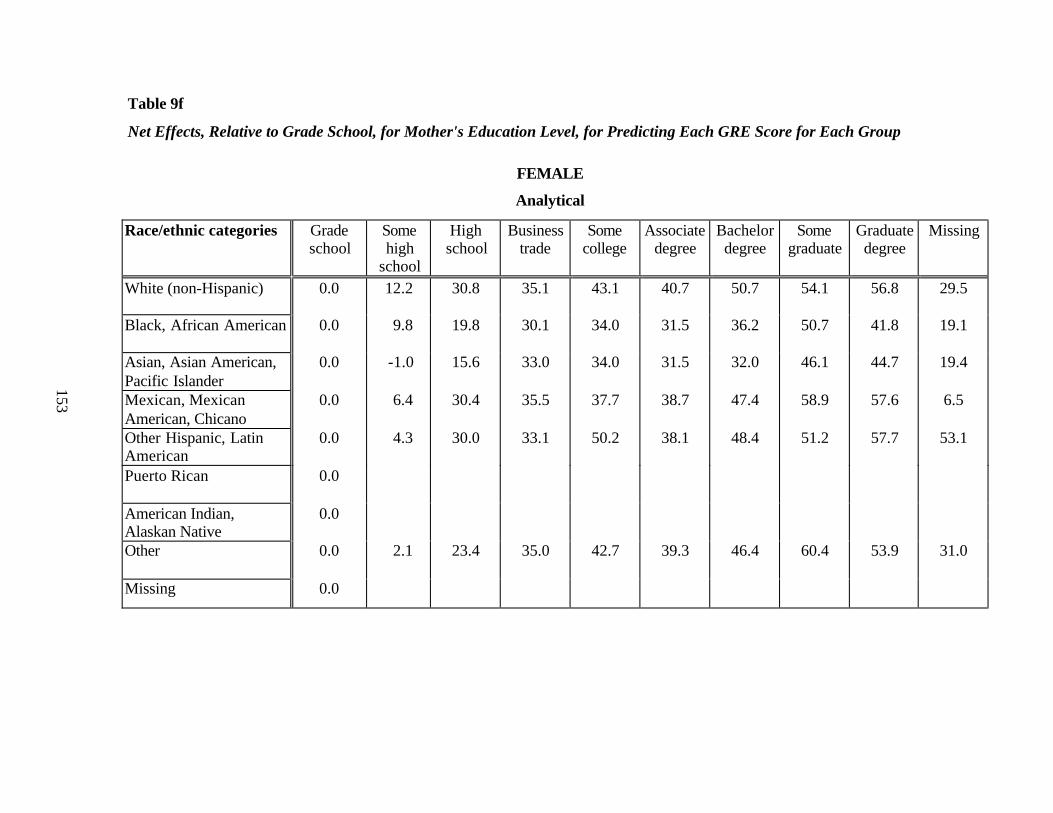
Table 9f
Net Effects, Relative to Grade School, for Mother's Education Level, for Predicting Each GRE Score for Each Group
FEMALE
Analytical
Race/ethnic categories Gradeschool
Somehigh
school
Highschool
Businesstrade
Somecollege
Associatedegree
Bachelordegree
Somegraduate
Graduatedegree
Missing
White (non-Hispanic) 0.0 12.2 30.8 35.1 43.1 40.7 50.7 54.1 56.8 29.5
Black, African American 0.0 9.8 19.8 30.1 34.0 31.5 36.2 50.7 41.8 19.1
Asian, Asian American,Pacific Islander
0.0 -1.0 15.6 33.0 34.0 31.5 32.0 46.1 44.7 19.4
Mexican, MexicanAmerican, Chicano
0.0 6.4 30.4 35.5 37.7 38.7 47.4 58.9 57.6 6.5
Other Hispanic, LatinAmerican
0.0 4.3 30.0 33.1 50.2 38.1 48.4 51.2 57.7 53.1
Puerto Rican 0.0
American Indian,Alaskan Native
0.0
Other 0.0 2.1 23.4 35.0 42.7 39.3 46.4 60.4 53.9 31.0
Missing 0.0
153

154
Figure 9a: Net Effects, Relative to Grade School, for Mother's Education Level, for Predicting Each GRE Score for Each Group
Male, Verbal
-10
0
10
20
30
40
50
60
70
80
grade
sch
some h
s
high s
ch
bus/tr
ade
some c
oll
assc
deg
bach
deg
some g
rad
grad s
ch
Mother's Education Level
GR
E-V
Po
ints
White (non-Hispanic) Black or African American
Asian, Asian American, or Pacific Islander Mexican, Mexican American, Chicano
Other Hispanic or Latin American Puerto Rican
American Indian or Alaskan Native

155
Figure 9b: Net Effects, Relative to Grade School, for Mother's Education Level, for Predicting Each GRE Score for Each Group
Males, Quantitative
-10
0
10
20
30
40
50
60
70
80
grade sch some hs high sch bus/trade some coll assc deg bach deg some grad grad sch
Mother's Education Level
GR
E-Q
Po
ints
White (non-Hispanic) Black or African American
Asian, Asian American, or Pacific Islander Mexican, Mexican American, Chicano
Other Hispanic or Latin American Puerto Rican
American Indian or Alaskan Native

156
Figure 9c: Net Effects, Relative to Grade School, for Mother's Education Level, for Predicting Each GRE Score for Each Group
Male, Analytical
-10
0
10
20
30
40
50
60
70
80
grade sch some hs high sch bus/trade some coll assc deg bach deg somegrad
grad sch
Mother's Education Level
GR
E-A
Po
ints
White (non-Hispanic) Black or African AmericanAsian, Asian American, or Pacific Islander Mexican, Mexican American, Chicano
Other Hispanic or Latin American Puerto RicanAmerican Indian or Alaskan Native

157
Figure 9d: Net Effects, Relative to Grade School, for Mother's Education Level, for Predicting Each GRE Score for Each Group
Females, Verbal
-10
0
10
20
30
40
50
60
70
80
grade sch some hs high sch bus/trade some coll assc deg bach deg some grad grad sch
Mother's Education Level
GR
E-V
Po
ints
White (non-Hispanic) Black or African American
Asian, Asian American, or Pacific Islander Mexican, Mexican American, Chicano
Other Hispanic or Latin American Puerto Rican
American Indian or Alaskan Native

158
Figure 9e: Net Effects, Relative to Grade School, for Mother's Education Level, for Predicting Each GRE Score for Each Group
Female, Quantitative
-10
0
10
20
30
40
50
60
70
80
grade sch some hs high sch bus/trade some coll assc deg bach deg somegrad
grad sch
Mother's Education Level
GR
E-Q
Po
ints
White (non-Hispanic) Black or African American
Asian, Asian American, or Pacific Islander Mexican, Mexican American, ChicanoOther Hispanic or Latin American Puerto RicanAmerican Indian or Alaskan Native

159
Figure 9f: Net Effects, Relative to Grade School, for Mother's Education Level, for Predicting Each GRE Score for Each Group
Female, Analytical
-10
0
10
20
30
40
50
60
70
80
grade sch some hs high sch bus/trade some coll assc deg bach deg some grad grad sch
Mother's Education Level
GR
E-A
Poi
nts
White (non-Hispanic) Black or African American
Asian, Asian American, or Pacific Islander Mexican, Mexican American, Chicano
Other Hispanic or Latin American Puerto Rican
American Indian or Alaskan Native

160
Table 10a
Net Effects, Relative to Grade School Relative to English Not Best Language, for English BestLanguage, for Predicting Each GRE Score for Each Group
MALE
Verbal
Race/ethnic categories English best English notbest
Missing
White (non-Hispanic) 0.0
Black, African American 0.0
Asian, Asian American, PacificIslander
39.3 0.0 0.5
Mexican, Mexican American,Chicano
19.7 0.0 1.2
Other Hispanic, Latin American 36.8 0.0 15.4
Puerto Rican 56.4 0.0 26.1
American Indian, Alaskan Native 0.0
Other 21.9 0.0 -33.3
Missing 21.3 0.0 -11.6

161
Table 10b
Net Effects, Relative to Grade School Relative to English Not Best Language, for English BestLanguage, for Predicting Each GRE Score for Each Group
MALE
Quantitative
Race/ethnic categories English best English notbest
Missing
White (non-Hispanic) 0.0
Black, African American 0.0
Asian, Asian American, PacificIslander
0.0
Mexican, Mexican American,Chicano
0.0
Other Hispanic, Latin American 0.0
Puerto Rican 20.3 0.0 -24.9
American Indian, Alaskan Native 0.0
Other 0.0
Missing 11.7 0.0 -20
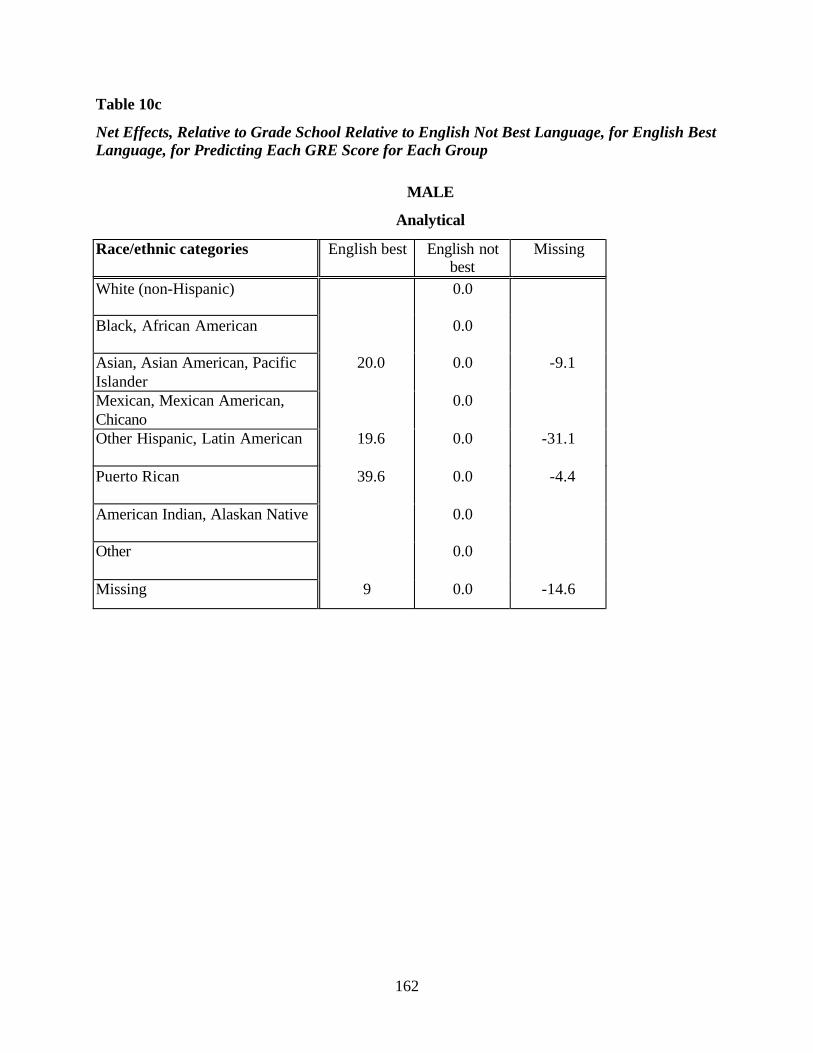
162
Table 10c
Net Effects, Relative to Grade School Relative to English Not Best Language, for English BestLanguage, for Predicting Each GRE Score for Each Group
MALE
Analytical
Race/ethnic categories English best English notbest
Missing
White (non-Hispanic) 0.0
Black, African American 0.0
Asian, Asian American, PacificIslander
20.0 0.0 -9.1
Mexican, Mexican American,Chicano
0.0
Other Hispanic, Latin American 19.6 0.0 -31.1
Puerto Rican 39.6 0.0 -4.4
American Indian, Alaskan Native 0.0
Other 0.0
Missing 9 0.0 -14.6

163
Table 10d
Net Effects, Relative to Grade School Relative to English Not Best Language, for English BestLanguage, for Predicting Each GRE Score for Each Group
FEMALE
Verbal
Race/ethnic categories English best English notbest
Missing
White (non-Hispanic) 0.0
Black, African American 0.0
Asian, Asian American, PacificIslander
19.4 0.0 -18.1
Mexican, Mexican American,Chicano
0.0
Other Hispanic, Latin American 22.6 0.0 14.8
Puerto Rican 56.4 0.0 58.1
American Indian, Alaskan Native 0.0
Other 0.0
Missing 9.2 0.0 -15.8

164
Table 10e
Net Effects, Relative to Grade School Relative to English Not Best Language, for English BestLanguage, for Predicting Each GRE Score for Each Group
FEMALE
Quantitative
Race/ethnic categories English best English notbest
Missing
White (non-Hispanic) 0.0
Black, African American 0.0
Asian, Asian American, PacificIslander
-16.6 0.0 -25.4
Mexican, Mexican American,Chicano
0.0
Other Hispanic, Latin American 0.0
Puerto Rican 30.8 0.0 32.3
American Indian, Alaskan Native 0.0
Other 0.0
Missing 0.0

165
Table 10f
Net Effects, Relative to Grade School Relative to English Not Best Language, for English BestLanguage, for Predicting Each GRE Score for Each Group
FEMALE
Analytical
Race/ethnic categories English best English notbest
Missing
White (non-Hispanic) 0.0
Black, African American -11.6 0.0 -28.6
Asian, Asian American, PacificIslander
0.0
Mexican, Mexican American,Chicano
0.0
Other Hispanic, Latin American 0.0
Puerto Rican 53.6 0.0 28.8
American Indian, Alaskan Native 0.0
Other 0.0
Missing 0.0

166
Figure 10a: Net Effects, Relative to English Not Best Language, for English Best Language, for Predicting Each GRE Score for Each Group
Males, Verbal
-30.0
-20.0
-10.0
0.0
10.0
20.0
30.0
40.0
50.0
60.0
eng best eng not best
English Best
GR
E-V
Poi
nts
White (non-Hispanic) Black or African American
Asian, Asian American, or Pacific Islander Mexican, Mexican American, Chicano
Other Hispanic or Latin American Puerto Rican
American Indian or Alaskan Native

167
Figure 10b: Net Effects, Relative to English Not Best Language, for English Best Language, for Predicting Each GRE Score for Each Group
Males, Quantitative
-30.0
-20.0
-10.0
0.0
10.0
20.0
30.0
40.0
50.0
60.0
ebest eng not best
English Best
GR
E-Q
Poi
nts
White (non-Hispanic) Black or African American
Asian, Asian American, or Pacific Islander Mexican, Mexican American, Chicano
Other Hispanic or Latin American Puerto Rican
American Indian or Alaskan Native

168
Figure 10c: Net Effects, Relative to English Not Best Language, for English Best Language, for Predicting Each GRE Score for Each Group
Males, Analytical
-30.0
-20.0
-10.0
0.0
10.0
20.0
30.0
40.0
50.0
60.0
ebest eng not best
English Best
GR
E-A
Po
ints
White (non-Hispanic) Black or African American
Asian, Asian American, or Pacific Islander Mexican, Mexican American, Chicano
Other Hispanic or Latin American Puerto Rican
American Indian or Alaskan Native

169
Figure 10d: Net Effects, Relative to English Not Best Language, for English Best Language, for Predicting Each GRE Score for Each Group
Females, Verbal
-30.0
-20.0
-10.0
0.0
10.0
20.0
30.0
40.0
50.0
60.0
eng best eng not best
English Best
GR
E-V
Poi
nts
White (non-Hispanic) Black or African American
Asian, Asian American, or Pacific Islander Mexican, Mexican American, Chicano
Other Hispanic or Latin American Puerto Rican
American Indian or Alaskan Native

170
Figure 10e: Net Effects, Relative to English Not Best Language, for English Best Language, for Predicting Each GRE Score for Each Group
Females, Quantitative
-30.0
-20.0
-10.0
0.0
10.0
20.0
30.0
40.0
50.0
60.0
eng best eng not best
English Best
GR
E-Q
Po
ints
White (non-Hispanic) Black or African American
Asian, Asian American, or Pacific Islander Mexican, Mexican American, Chicano
Other Hispanic or Latin American Puerto Rican
American Indian or Alaskan Native

171
Figure 10f: Net Effects, Relative to English Not Best Language, for English Best Language, for Predicting Each GRE Score for Each Group
Females, Analytical
-30.0
-20.0
-10.0
0.0
10.0
20.0
30.0
40.0
50.0
60.0
eng best eng not best
English Best
GR
E-A
Poi
nts
White (non-Hispanic) Black or African American
Asian, Asian American, or Pacific Islander Mexican, Mexican American, Chicano
Other Hispanic or Latin American Puerto Rican
American Indian or Alaskan Native
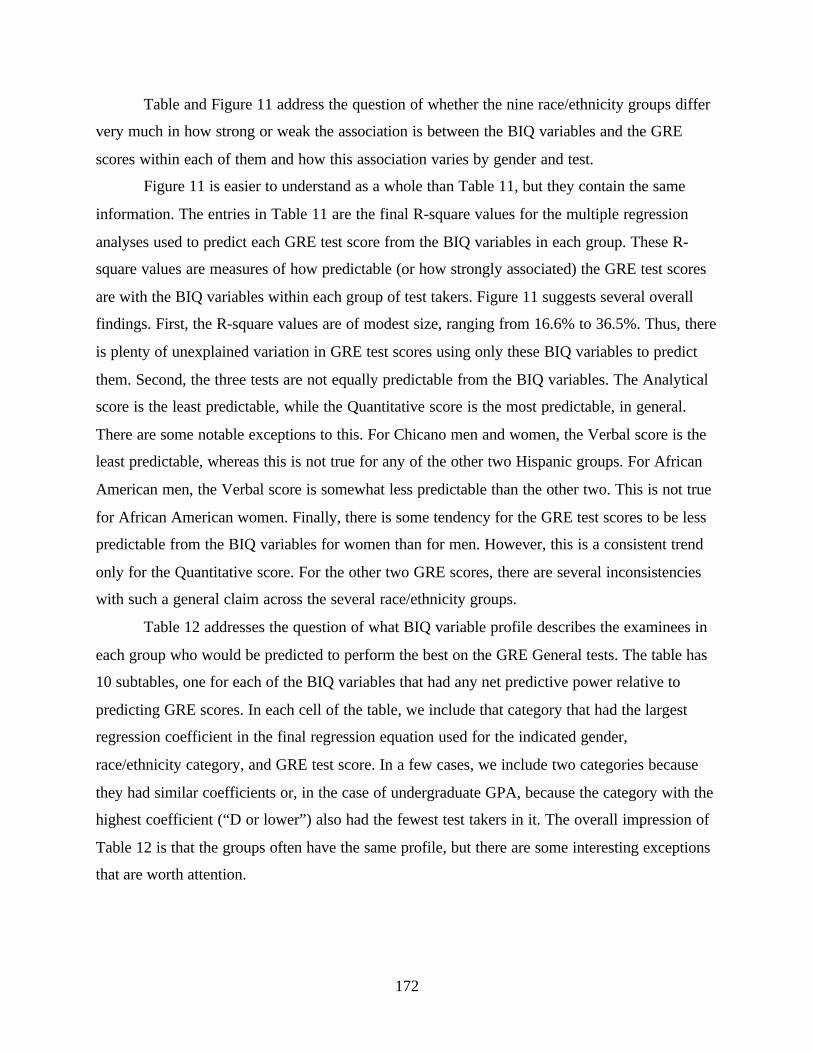
172
Table and Figure 11 address the question of whether the nine race/ethnicity groups differ
very much in how strong or weak the association is between the BIQ variables and the GRE
scores within each of them and how this association varies by gender and test.
Figure 11 is easier to understand as a whole than Table 11, but they contain the same
information. The entries in Table 11 are the final R-square values for the multiple regression
analyses used to predict each GRE test score from the BIQ variables in each group. These R-
square values are measures of how predictable (or how strongly associated) the GRE test scores
are with the BIQ variables within each group of test takers. Figure 11 suggests several overall
findings. First, the R-square values are of modest size, ranging from 16.6% to 36.5%. Thus, there
is plenty of unexplained variation in GRE test scores using only these BIQ variables to predict
them. Second, the three tests are not equally predictable from the BIQ variables. The Analytical
score is the least predictable, while the Quantitative score is the most predictable, in general.
There are some notable exceptions to this. For Chicano men and women, the Verbal score is the
least predictable, whereas this is not true for any of the other two Hispanic groups. For African
American men, the Verbal score is somewhat less predictable than the other two. This is not true
for African American women. Finally, there is some tendency for the GRE test scores to be less
predictable from the BIQ variables for women than for men. However, this is a consistent trend
only for the Quantitative score. For the other two GRE scores, there are several inconsistencies
with such a general claim across the several race/ethnicity groups.
Table 12 addresses the question of what BIQ variable profile describes the examinees in
each group who would be predicted to perform the best on the GRE General tests. The table has
10 subtables, one for each of the BIQ variables that had any net predictive power relative to
predicting GRE scores. In each cell of the table, we include that category that had the largest
regression coefficient in the final regression equation used for the indicated gender,
race/ethnicity category, and GRE test score. In a few cases, we include two categories because
they had similar coefficients or, in the case of undergraduate GPA, because the category with the
highest coefficient (“D or lower”) also had the fewest test takers in it. The overall impression of
Table 12 is that the groups often have the same profile, but there are some interesting exceptions
that are worth attention.

173
Table 11
Maximum Value of R2 for the Multiple Regressions Used to Predict GRE V, Q and A from theBIQ Variables, Within Each Group
Race/ethnic categories Verbal Quantitative Analytical
Male Female Male Female Male Female
White (non-Hispanic) .227 .226 .322 .235 .188 .176
Black, African American .194 .188 .328 .246 .215 .184
Asian, Asian American, PacificIslander
.285 .255 .344 .275 .265 .218
Mexican, Mexican American,Chicano
.224 .235 .365 .285 .234 .258
Other Hispanic, Latin American .227 .245 .329 .285 .216 .225
Puerto Rican .209 .181 .335 .245 .178 .166
American Indian, Alaskan Native .195 .191 .315 .255 .197 .179
Other .245 .275 .306 .286 .224 .246
Missing .225 .264 .297 .282 .217 .249

174
Figure 11: Graphical Display of the Information in Table 11
Male Female
R2 Analytical Verbal Quantitative Analytical Verbal Quantitative.37 c.36.35.34 ap.33 bh.32 wi.31 o.30 m.29 a cho.28 o am.27 a.26 c am i.25 o om h bp.24 c c w.23 o whm h w.22 hmb c a.21 p.20 i bi.19 w bi.18 p wbi p.17 p.16
a = Asian i = American Indian, Alaskan Nativeb = Black, African American m = Missingc = Chicano, Mexican American o = Otherh = Other Hispanic, Latin American p = Puerto Rican
w = White

175
Table 12a
Best Performance Profiles, Undergraduate Major With Largest Net Predicted GRE Score forEach Group
Race/ethnic categories Verbal Quantitative Analytical
Male Female Male Female Male Female
White (non-Hispanic) Human. Human. Phy SciEngin.
Engin. Engin. Engin.
Black, African American Human. Engin.Human.
Phy Sci Engin Engin. Engin.
Asian, Asian American, PacificIslander
Human. Human. Phy Sci Engin Phy Sci Engin.
Mexican, Mexican American,Chicano
Human. Human.Engin.
Phy Sci Engin Engin. Engin.
Other Hispanic, Latin American Human. Human. Phy Sci Engin Phy Sci Engin.
Puerto Rican Human. Human. Phy Sci Engin Engin. Engin.
American Indian, Alaskan Native Human. Engin. Phy SciEngin.
Engin Engin. Engin.

176
Table 12b
Best Performance Profiles, General Reason for Taking the GRE With Largest Net PredictedGRE Score for Each Group
Race/ethnic categories Verbal Quantitative Analytical
Male Female Male Female Male Female
White (non-Hispanic) Fellowship Fellowship Fellowship Fellowship Fellowship Fellowship
Black, African American Fellowship Fellowship Fellowship Fellowship Fellowship Fellowship
Asian, Asian American,Pacific Islander
Fellowship Fellowship Fellowship Fellowship Fellowship Fellowship
Mexican, MexicanAmerican, Chicano
Fellowship Fellowship Fellowship Fellowship Fellowship Fellowship
Other Hispanic, LatinAmerican
Fellowship Fellowship Fellowship Fellowship Fellowship Fellowship
Puerto Rican Practice Fellowship Other Fellowship Practice Fellowship
American Indian, AlaskanNative
Fellowship Fellowship Fellowship Fellowship Ext.Degree
Fellowship

177
Table 12c
Best Performance Profiles, Undergraduate GPA With Largest Net Predicted GRE Score forEach Group
Race/ethnic categories Verbal Quantitative Analytical
Male Female Male Female Male Female
White (non-Hispanic) A A A A A A
Black, African American AD orlower
A A A A A
Asian, Asian American, PacificIslander
A A A A A A
Mexican, Mexican American,Chicano
A A A A A A
Other Hispanic, Latin American A A AD orlower
AD orlower
AD orlower
A
Puerto Rican A-D orlower
A- AD orlower
A A-D orlower
A-
American Indian, Alaskan Native AD orlower
A AD orlower
A AD orlower
A-A

178
Table 12d
Best Performance Profiles, Education Level at Registration With Largest Net Predicted GREScore for Each Group
Race/ethnic categories Verbal Quantitative Analytical
Male Female Male Female Male Female
White (non-Hispanic) MastersGrad
MastersGrad
Junior Sophomore Junior Sophomore
Black, African American CollegeGrad
CollegeGrad
Junior Junior Junior Junior
Asian, Asian American,Pacific Islander
Junior Junior SophomoreJunior
Sophomore Junior Junior
Mexican, MexicanAmerican, Chicano
Sophomore CollegeGrad
Sophomore Junior Sophomore Junior
Other Hispanic, LatinAmerican
CollegeGrad
CollegeGrad
Sophomore Junior Sophomore Sophomore
Puerto Rican CollegeGrad
Sophomore Junior Sophomore Sophomore Sophomore
American Indian, AlaskanNative
MastersGradOther
Other Junior Junior

179
Table 12e
Best Performance Profiles, Graduate Major With Largest Net Predicted GRE Score for EachGroup
Race/ethnic categories Verbal Quantitative Analytical
Male Female Male Female Male Female
White (non-Hispanic) Human. Human.Phy Sci
Phy Sci Phy Sci Phy Sci Phy Sci
Black, African American Human. Human. Phy Sci Phy Sci Phy Sci Phy Sci
Asian, Asian American, PacificIslander
Human. Phy Sci Phy Sci
Mexican, Mexican American,Chicano
Human. Phy Sci Phy SciEngin.
Phy Sci Phy Sci
Other Hispanic, Latin American Human. Phy Sci Phy SciEngin.
Puerto Rican Human.SocialSci.
Phy Sci Phy Sci
American Indian, Alaskan Native Phy Sci Human. Engin. Phy Sci

180
Table 12f
Best Performance Profiles, Attendance Category With Largest Net Predicted GRE Score forEach Group
Race/ethnic categories Verbal Quantitative Analytical
Male Female Male Female Male Female
White (non-Hispanic) Undecided Undecided Full TimeUndecided
Full TimeUndecided
Full Time
Black, African American Full Time Full Time Full Time
Asian, Asian American,Pacific Islander
Undecided Undecided Full Time Full Time Full TimeUndecided
Full Time
Mexican, Mexican American,Chicano
Full TimeUndecided
Full TimeUndecided
Full Time Undecided Full Time
Other Hispanic, LatinAmerican
Undecided Undecided Full TimeUndecided
Full Time Undecided Full Time
Puerto Rican Full Time
American Indian, AlaskanNative
Undecided Full Time Undecided
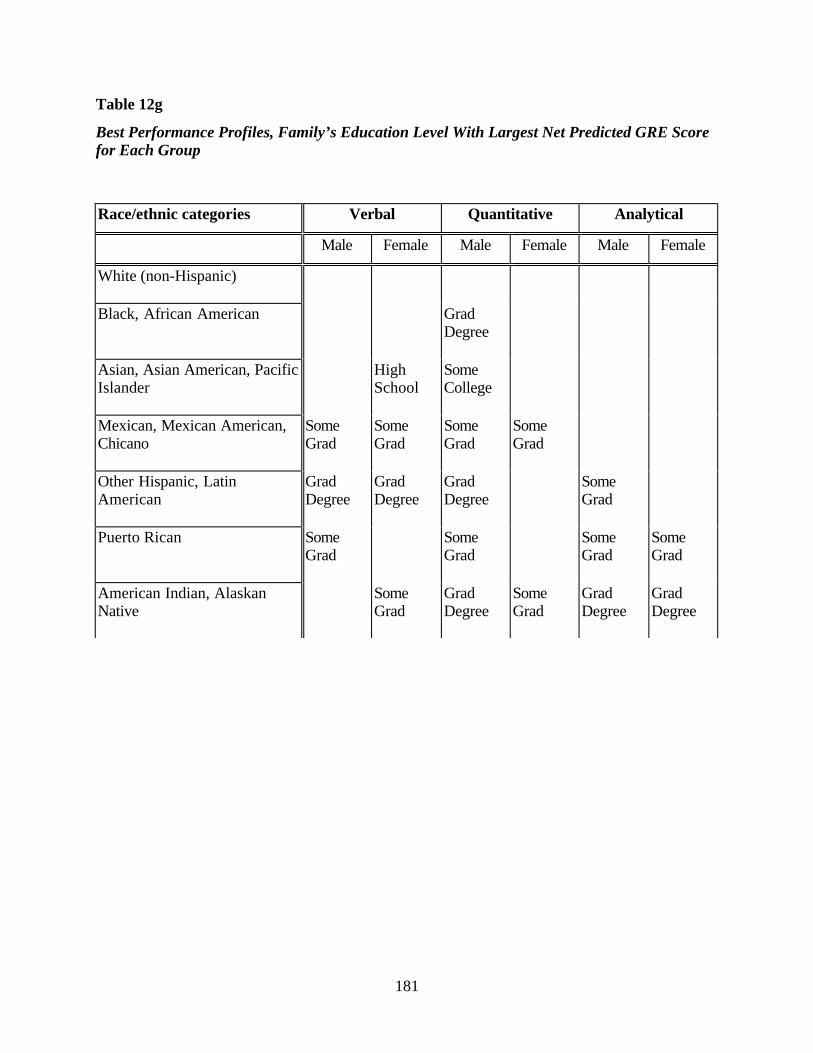
181
Table 12g
Best Performance Profiles, Family’s Education Level With Largest Net Predicted GRE Scorefor Each Group
Race/ethnic categories Verbal Quantitative Analytical
Male Female Male Female Male Female
White (non-Hispanic)
Black, African American GradDegree
Asian, Asian American, PacificIslander
HighSchool
SomeCollege
Mexican, Mexican American,Chicano
SomeGrad
SomeGrad
SomeGrad
SomeGrad
Other Hispanic, LatinAmerican
GradDegree
GradDegree
GradDegree
SomeGrad
Puerto Rican SomeGrad
SomeGrad
SomeGrad
SomeGrad
American Indian, AlaskanNative
SomeGrad
GradDegree
SomeGrad
GradDegree
GradDegree

182
Table 12h
Best Performance Profiles, Father's Education Level With Largest Net Predicted GRE Scorefor Each Group
Race/ethnic categories Verbal Quantitative Analytical
Male Female Male Female Male Female
White (non-Hispanic) SomeGrad
GradDegree
GradDegree
GradDegree
GradDegree
GradDegree
Black, African American SomeGrad
GradDegree
SomeGrad
SomeGrad
GradDegree
Asian, Asian American, PacificIslander
GradDegree
GradDegree
GradDegree
GradDegree
GradDegree
GradDegree
Mexican, Mexican American,Chicano
SomeGrad
SomeGrad
Other Hispanic, LatinAmerican
Graddegree
GradDegree
Puerto Rican SomeGrad
GradDegree
SomeGrad
GradDegree
American Indian, AlaskanNative
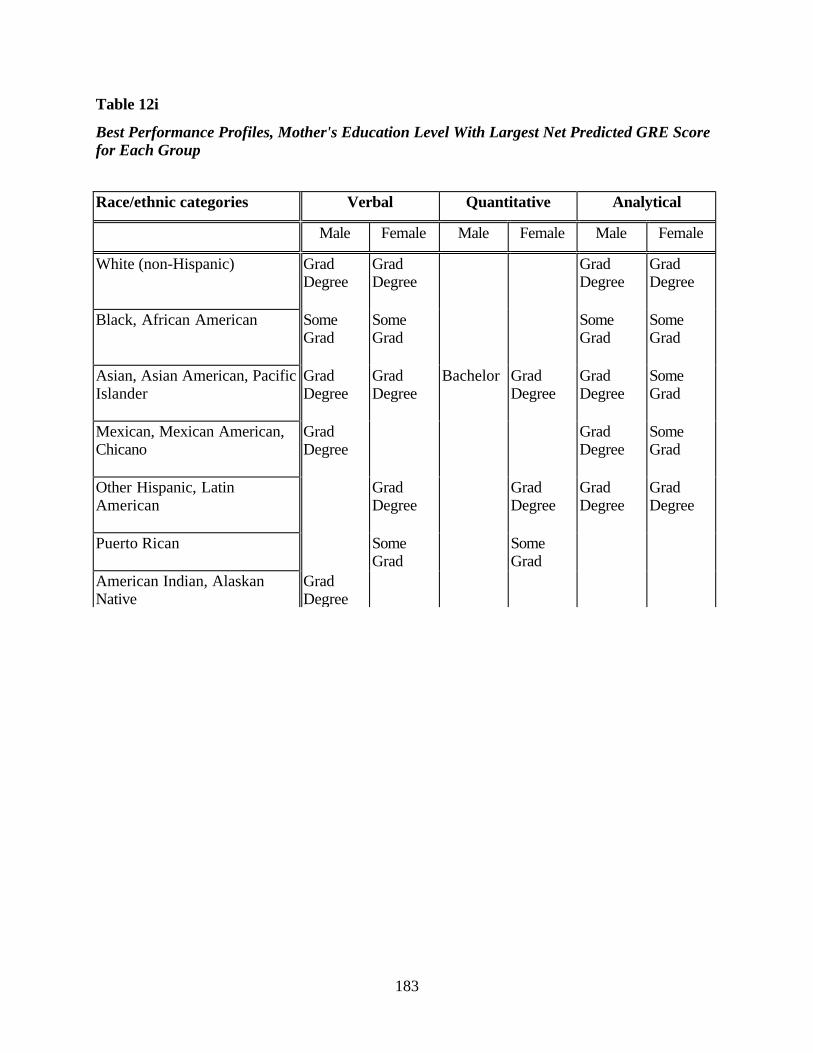
183
Table 12i
Best Performance Profiles, Mother's Education Level With Largest Net Predicted GRE Scorefor Each Group
Race/ethnic categories Verbal Quantitative Analytical
Male Female Male Female Male Female
White (non-Hispanic) GradDegree
GradDegree
GradDegree
GradDegree
Black, African American SomeGrad
SomeGrad
SomeGrad
SomeGrad
Asian, Asian American, PacificIslander
GradDegree
GradDegree
Bachelor GradDegree
GradDegree
SomeGrad
Mexican, Mexican American,Chicano
GradDegree
GradDegree
SomeGrad
Other Hispanic, LatinAmerican
GradDegree
GradDegree
GradDegree
GradDegree
Puerto Rican SomeGrad
SomeGrad
American Indian, AlaskanNative
GradDegree

184
Table 12j
Best Performance Profiles, English Language Proficiency Category With Largest NetPredicted GRE Score for Each Group
Race/ethnic categories Verbal Quantitative Analytical
Male Female Male Female Male Female
White (non-Hispanic)
Black, African American Eng notBest
Asian, Asian American, PacificIslander
EnglishBest
EnglishBest
Eng notBest
EnglishBest
Mexican, Mexican American,Chicano
EnglishBest
Other Hispanic, LatinAmerican
EnglishBest
EnglishBest
EnglishBest
Puerto Rican EnglishBest
EnglishBest
EnglishBest
EnglishBest
EnglishBest
EnglishBest
American Indian, AlaskanNative

185
The undergraduate majors with the highest predicted GRE scores are very similar across
the groups—Humanities for Verbal, Physical Science and Engineering for Quantitative and
Engineering, and Physical Science for Analytical. Interestingly, for three female race/ethnicity
groups, Engineering students also have the highest net average GRE Verbal scores.
In almost all of the groups, those taking the GRE for a fellowship application scored the
highest on average. Puerto Rican and American Indian men provided the only exceptions.
Similarly, high undergraduate GPAs are associated with higher GRE scores for all
groups, but, in several cases, the students with the lowest grades had the highest average GRE
scores. This is due primarily to the small samples of such students (the p-values for these
coefficients ranged from .06 to .37), but it occurs quite often for certain minority male examinees
across all three GRE scores and may be worth examining in more detail.
There is considerable variation in the education level at registration that predicts the
highest GRE scores across the groups and test scores, ranging from Juniors to masters grads,
with younger undergraduates often having the highest net average scores.
The patterns of highest predicted GRE scores for intended graduate majors mirror the
patterns for undergraduate majors in many respects. Overall, graduate major is less predictive of
GRE scores than are the undergraduate majors.
It is interesting that intended full-time attendance in gradate school is not always
associated with the highest test performance. However, part-time students never have the highest
net average test scores.
Higher levels of parental education are usually associated with higher GRE scores;
students with parents who have graduate degrees are often those with the highest net average test
scores.
Finally, while test takers for whom English is the language they spoke the best usually
had the highest predicted scores, there are two exceptions—African American females on the
Analytical score and Asian females on the Quantitative score.
In summary then, Table 12 shows considerable similarity across the groups in the
patterns of the categories of examinees who have the highest predicted GRE scores based on the
BIQ variables we examined, but there are isolated differences across the groups that may be
worthy of further investigation.

186
Suggestions for Further Research With These Data
In at least two areas, it might be useful to continue work with this data set. These
suggestions have come up several times in discussions of this work with various GRE
committees prior to the completion of this report. We mention them here because they seem
worth consideration. One is methodological and the other involves the addition of other data to
the examinee records used in this study.
A Methodological Alternative
It is evident from the many graphs of the regression coefficients (net effects) in this study that,
while there are some exceptions, the trends are very similar across many of the groups in this
study. For convenience of presentation, we have given the results of the analyses in great detail
but in a way that may seem to stress differences between the groups. However, there is evidence
from this work that it might be fruitful to try to simplify the results to emphasize the average
(over groups) trends and to report the trend for only a specific group if it departs substantially
from the average trend.
One way to achieve this is to do a large pooled regression analysis using all of the data
from all of the groups at once. We can do this by creating a set of dummy variables for gender
and race/ethnicity as well as their interactions, 17 in all, and add them to the list of variables used
in the analysis. The analysis would then proceed as we have done, except it would force the
gender and race/ethnicity variables into the equation first and then step in the BIQ variables as
we did here—probably this is where backward elimination should also be used. Then testing for
the interaction of each variable with the list of gender and race/ethnicity dummy variables can
give us information as to how specific groups differ in their net effects for the BIQ variables. The
regression coefficients for the model without the interaction terms would serve as a proper
“average trend” for those displayed in the Figures 1-10. The significant interaction terms would
be indications of where the trend for a particular gender or race/ethnicity category was quite
different from the overall average trend. The result would be graphs like the ones we have
presented here except they would have fewer lines—the overall group average trend and a few
more lines indicating the groups with quite different trends in the net effects from the average
trend.

187
Additional Data
Discussions of these results have indicated that it might be useful to consider adding
additional data to the data set we used in this report. Two types have been suggested—
institutional data for the undergraduate institutions attended by the examinees and SAT and ACT
scores for these GRE test takers. Both types of data involve linking data sets to this one, but, for
various reasons, it should not be assumed that this is easy to do. However, previous researchers
have used both types of data, and the task of making these linkages is not impossible. The data
on the “sending” undergraduate institutions would add a different dimension to the data that we
have. The BIQ data give us a little information about the undergraduate experiences these test
takers have had and some additional information about their background and SES. Adding some
institutional data to the list is an interesting possibility that goes beyond the indicators in the
BIQ.
Data on prior test scores such as the SAT or the ACT would help disentangle the effect of
the selection of undergraduate majors from the verbal and mathematical skills of the students
who make these selections.. Earlier research has suggested that there are fairly strong
correlations between SAT and GRE scores, so we would expect substantial changes in the net
effects of the BIQ variables if these were also the net of SAT or ACT performance. Many
hurdles must be overcome to expand the data set in this manner, but, in our opinion, it is
probably worth an initial investigation to see how feasible such an expansion is. In addition,
linking to SAT or ACT will include substantial data about the test takers beyond test scores
because both testing programs collect substantial information about many characteristics of the
examinees.