an integrated approach to the study of biosignatures in
TRANSCRIPT
An integrated approach to the study of biosignatures
in mineralizing biofilms and microbial mats
Dissertation
Zur Erlangung des akademischen Grades
Doctor rerum naturalium
(Dr. rer. nat.)
Geowissenschaftliches Zentrum der Georg-August-Universität Göttingen
Abteilung Geobiologie
Vorgelegt von:
Diplom-Geologin
Christine Nora Heim
Göttingen 2010

D7 Gutachter:
1. Prof. Dr. Volker Thiel
2. Prof. Dr. Joachim Reitner
Tag der mündlichen Prüfung: 09.07.2010
I
Acknowledgements It’s nearly five years ago since I started this thesis, and with just a rough idea of what was expected
of me - but all in all it was a great experience and I am indebted to all my colleagues, friends and
family who helped me through this phase.
First of all, of course, great thanks to Volker Thiel and Joachim Reitner for giving me the
opportunity to join this project, and for the critical but very constructive discussions. I am grateful
to my working group, Andrea Hagemann, Cornelia Conrad, Juliane Germer, Tim Leefmann and
Martin Blumenberg for nice tea-time chats, assistance in the lab and in the Äspö tunnel. Thank you
Martin for the proofreading. Extra hours in the tunnel were brighter with Nadias Quéric’s
companionship.
I received analytical support from Klaus Simon, Jan Toporski, Erwin Schiffcyk, Bent Hansen,
Nicole Nolte, Brigitte Dietrich, Andreas Kronz, Andreas Reimer, Dorothea Hause-Reitner, Birgit
Röhring, Wolfgang Dröse, Volker Karius and Veit-Enno Hoffman. Thanks to Lothar Laake and his
colleagues from the workshop for the help with all kinds of constructions for the tunnel equipment
and further technical support from Alexander Satmatri and Michael Sosnitza.
The whole work in the Äspö tunnel wouldn’t have been possible without the support from SKB,
special thanks to Mats Ohlsson, Emmeli Johansson, Magnus Kronberg, Teresita Morales,
Carljohan Hardenby, Linda Alakangas, Irene Hultberg and Ann-Sofie Karlson. Thank you Peter
Sjövall and Jukka Lausmaa for the support during my three month stay in Borås, and thanks to
Jakob Malm for the introduction to Swedish traditions (midsommar). I had a great and productive
time with Barbara Zippel and Thomas Neu in Magdeburg.
Thomas Bode was always very helpful in all kinds of computer and software support and to remind
me to have a little break now and then. Thanks also to Sharmishtha Dattagupta and Daniel Jackson
for the recreational work distractions. Katja Milkereit, my best friend, was the special sponsor of
my thesis – thank you for all the supportive phone calls, and high energy and motivation packages.
For the everlasting support and encouragement I am especially indebted to Oliver Hach and
my family. This thesis is dedicated to my parents, Renate and Kurt Heim.
This thesis was accomplished as part of the DFG Research Group FOR 571, subproject 1
“Microbial biomineralization, biogeochemistry and biodiversity of chemolithotrophic
microorganisms in the tunnel of Äspö (Sweden).
II
Preface This doctoral thesis comprises the following papers, book entries and manuscripts: Heim C, Lausmaa J, Sjövall P, Toporski J, Dieing T, Simon K, Hansen B, Kronz A, Reitner J,
Thiel V (2010) Ancient microbial activity recorded in fracture fillings from granitic rocks (Äspö
Hard Rock Laboratory, Sweden). Geobiology, in revision.
Heim C, Simon K, Quéric N-V, Reitner J, Thiel V (2010) Trace and rare earth element
accumulation and fractionation in microbial iron oxyhydroxides. Geochimica et Cosmochimica
Acta, in revision
Heim C (2011) Terrestrial Deep Biosphere. Encyclopedia of Geobiology, Springer, in press.
Heim C (2011) Microbial Biomineralization. Encyclopedia of Geobiology, Springer, in press.
Rodríguez-Martines M, Heim C, Quéric N-V, Reitner J (2011) Frutexites. Encyclopedia of
Geobiology, Springer, in press.
Toporski J, Dieing T, Heim C (2011) Raman microscopy (confocal). Encyclopedia of Geobiology,
Springer, in press.
Heim C, Sjövall P, Lausmaa J, Leefmann T, Thiel V (2009) Spectral characterization of eight
glycerolipids and their detection in natural samples using time-of-flight secondary ion mass
spectrometry. Rapid Communications in Mass Spectrometry, 23, 2741-2753.
Sjövall P, Thiel V, Siljeström S, Heim C, Hode T, Lausmaa J (2008) Organic geochemical
microanalysis by time-of-flight secondary ion mass spectrometry (ToF-SIMS). Geostandards and
Geoanalytical Research, 32, 267-277.
Thiel V, Heim C, Arp G, Hahmann U, Sjövall P, Lausmaa J (2007) Biomarkers at the microscopic
range: ToF-SIMS molecular imaging of Archaea-derived lipids in a microbial mat. Geobiology, 5,
413-421.
III
Table of contents
Chapter 1
Introduction………………………………………………………………………………...…….1
1.1 Microbial life………………………………………………………………………………...1
1.2 Biosignatures…………………………………………………………………………...........2
1.3 Study Site – Äspö Hard Rock Laboratory Sweden....………………………………………10
1.4 Integrated analytical approach – high lateral resolution concept……………………….…..12
1.5 Introduction to the following chapters……………………………………………………...14
References ……………………………………………………………………………………...16
Chapter 2
Biomarkers at the microscopic range: ToF-SIMS molecular imaging
of Archaea-derived lipids in a microbial mat …………………………………………………. 25
2.1 Abstract ……………………………………………………………………………………..25
2.2 Introduction ………………………………………………………………………………...26
2.3 Materials and methods…………………………………………………….………………...27
2.4 Results and discussion………………………………………………………………………28
2.5 Conclusions…………………………………………………………………………………36
Acknowledgements……………………………………………………………………………..37
References………………………………………………………………………………………38
Chapter 3
Organic geochemical microanalysis by time-of-flight secondary ion mass
spectrometry (ToF-SIMS)……………………………………………………………………... 41
3.1 Abstract …………………………………………………………………………………….41
3.2 Introduction ………………………………………………………………………………...41
3.3 Capabilities and limitations of ToF-SIMS …………………………………………………42
3.4 Experimental……………………………………………………………………………..…46
3.5 Results and discussion…………………………………………………………………...…47
IV
3.6 Concluding remarks…………………………………………………………………….…..54
Acknowledgements……………………………………………………………………………..54
References………………………………………………………………………………………55
Chapter 4
Spectral characterization of eight glycerolipids and their detection in natural
sample using time-of-flight secondary ion mass spectrometry.……………………………….. 57
4.1 Abstract …………………………………………………………………………………….57
4.2 Introduction.………………………………………………………………………………...57
4.3 Experimental……………………………. …………………………………………………59
4.4 Results and discussion…………………………………………………………………....…61
4.5 Archaeol in a methanotrophic microbial mat…..……………………………………….…..72
4.6 Diglyceride and phosphatidylglycerol in a Gallionella-dominated microbial mat………....73
4.7 Conclusions…………………………………………………………………………………75
Acknowledgements……………………………………………………………………………..76
References………………………………………………………………………………………77
Chapter 5
Trace and rare earth element accumulation and fractionation in microbial
iron oxyhydroxides.……………………………….. …………………………………………..79
5.1 Abstract……………………………………………………………………………………..79
5.2 Introduction.………………………………………………………………………………...80
5.3 Materials and methods...……..……………………………………………………………..82
5.4 Results.………………………………………………………………………………....…...84
5.5 Discussion...…………………………………...……………………………………….…...91
5.6 Conclusions…………………………………………………………………………………95
Acknowledgements……………………………………………………………………………..95
References………………………………………………………………………………………96
V
Chapter 6
Ancient microbial activity recorded in fracture fillings from granitic
rocks (Äspö Hard Rock Laboratory, Sweden)...……………………………...………………...99
6.1 Abstract……………………………………………………………………………………...99
6.2 Introduction.……………………………………………………………………………….100
6.3 Geological setting of the Äspö site...………………………………………………………101
6.4 Methods…………………..…..……………………………………………………………102
6.5 Results.…………………………………………………………………………………….103
6.6 Discussion……………………………………...……………………………………….….115
6.7 Conclusions………………………………………………………………………...……...118
Acknowledgements……………………………………………………………………………119
References……………………………………………………………………………………..119
Chapter 7
Summary and Conclusions…………………………………………………………………… 127
Appendix:
A Terrestrial Deep Biosphere………………………………………………………...….129
B Microbial Mineralization…………………………………………………………..….141
C Frutexites……………………………………………………………………………...151
D Raman Microscopy…………………………………………………………………....161
CV……………......…………………………………………………………………………….175

Chapter 1 - Introduction
1
1
Introduction
1.1 Microbial life
Since the early Precambrian, microbial life significantly contributes to the global biomass and
drives element cycles in the geo-, hydro-, and atmosphere (Banfield and Nealson, 1997; Ehrlich,
1998; Fenchel and Finlay, 1995; Schieber et al., 2007). Apart from controversies on the
metabolism of the first cellular forms, i.e. heterotrophy vs. autotrophy (Wächtershäuser, 1990; Bult,
1996; Stetter, 1996; Ehrlich, 2002), microbial communities formed by chemolithoautotrophic and
chemoheterotrophic microorganisms may be the most ancient ecosystems on Earth (e.g.
Wächtershäuser, 1988; Teske and Stahl, 2002). Early life on Earth probably developed in the
subsurface, protected from radiation penetrating the forming atmosphere and meteoric impacts
(Trevors, 2002; Russel, 2003; Bailey et al., 2009).
Since the discovery of the first subsurface microorganisms in the 1930s, numerous reports
followed, describing living chemolithoautotrophic and chemoheterotrophic microorganisms being
well adapted to the nutrients and energy sources available at great depth (Lipman, 1931; Lieske,
1932; Bailey et al., 1973; Belyaev et al., 1983; Pedersen, 1993, 1997; Chapelle, 2000).
Continuation of the deep biosphere research led to the detection of novel organisms, metabolic
pathways and adaption mechanisms (e.g. Sahl et al., 2008; Wanger et al., 2008), and growing
knowledge on the Earth’s deep biosphere enabled to retrace fundamental element cycles and to
deduce implications for the early evolution of life (for more details and references, see appendix
A, Heim, 2011, “Terrestrial Deep Biosphere”).
In the deep biosphere, as in any other aquatic environment, microorganisms often occur as
aggregated communities, forming biofilms and microbial mats (Teske and Stahl, 2002). Wherever
water and nutrients are available, any surface is rapidly covered with organic substances, followed
by the colonization with microorganisms (bacteria, archaea, and unicellular eukaryotes), thus
forming the initial stage of a biofilm. With time and under favorable conditions, further microbial
species will consort resulting in a complex and diverse ecosystem at a submillimetre scale.
Biofilms growing in thickness without disturbance can turn into decimeter thick microbial mats
(Characklis and Marshall 1990; Teske and Stahl, 2002; Konhauser, 2007). Examples for recent
microbial mats are shown in figure 1.1. An important characteristic of biofilms and microbial mats
is the excretion of extracellular polymeric substances (EPS; Wingender et al., 1999). In most cases,
EPS serve as protection against desiccation, extreme pH and temperature changes, enhance surface
adhesion and stabilize biofilms and microbial mats (Wolfaardt et al., 1999). EPS is generally
composed of polysaccharides, proteins, nucleic acids, lipids and humic substances (Nielsen et al.,
1997). The amount of EPS can exceed by far the volume of the producing cell.
Chapter 1 - Introduction
2
Knowledge about microbial life in subterranean environments is the key to understand how life
evolved and survived crises such as meteorite impacts, increased volcanic activity, or global
glaciations such as the Late Precambrian Snowball Earth. Any attempt to reconstruct ancient
microbial systems requires, first of all, a comparison with recent analogs and the determination of
potential biosignatures for the microorganisms and metabolic pathways involved. The aim of this
thesis was the study of recent chemolithotrophic and chemoheterotrophic mineralizing microbial
mats in subsurface environments, with a focus on the establishment of biosignatures that can be
related to their source organisms and the application of these biosignatures to the fossil record.
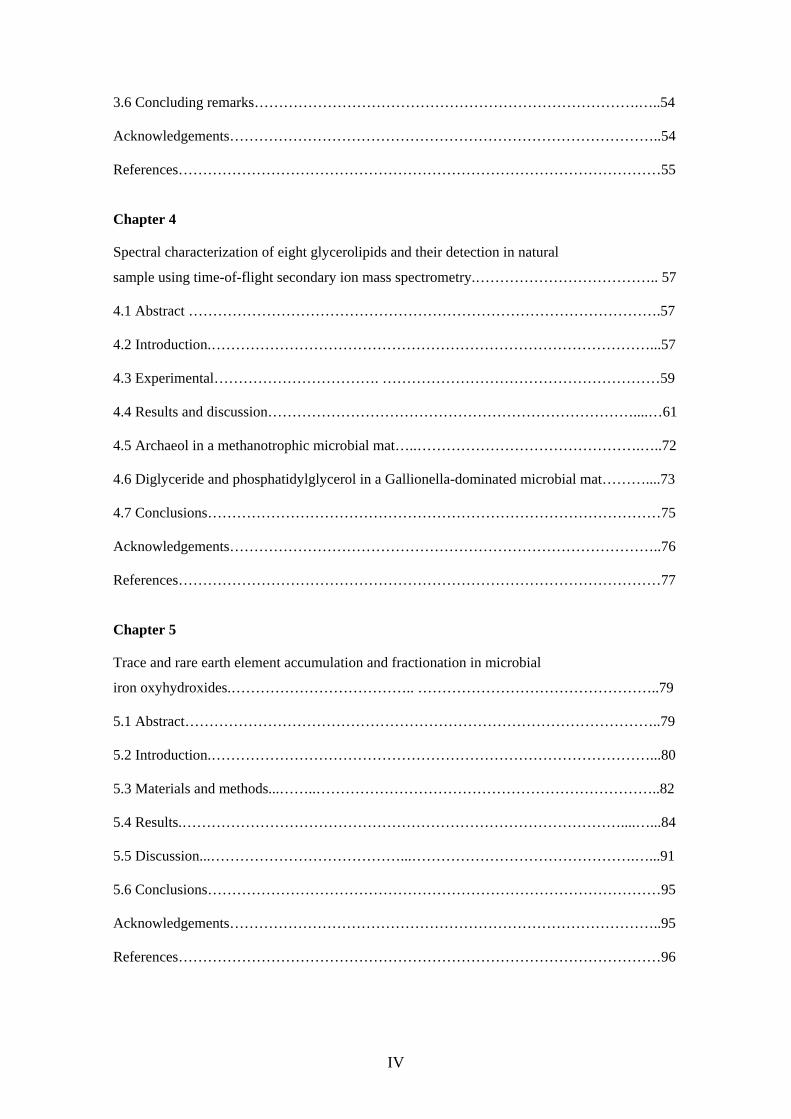
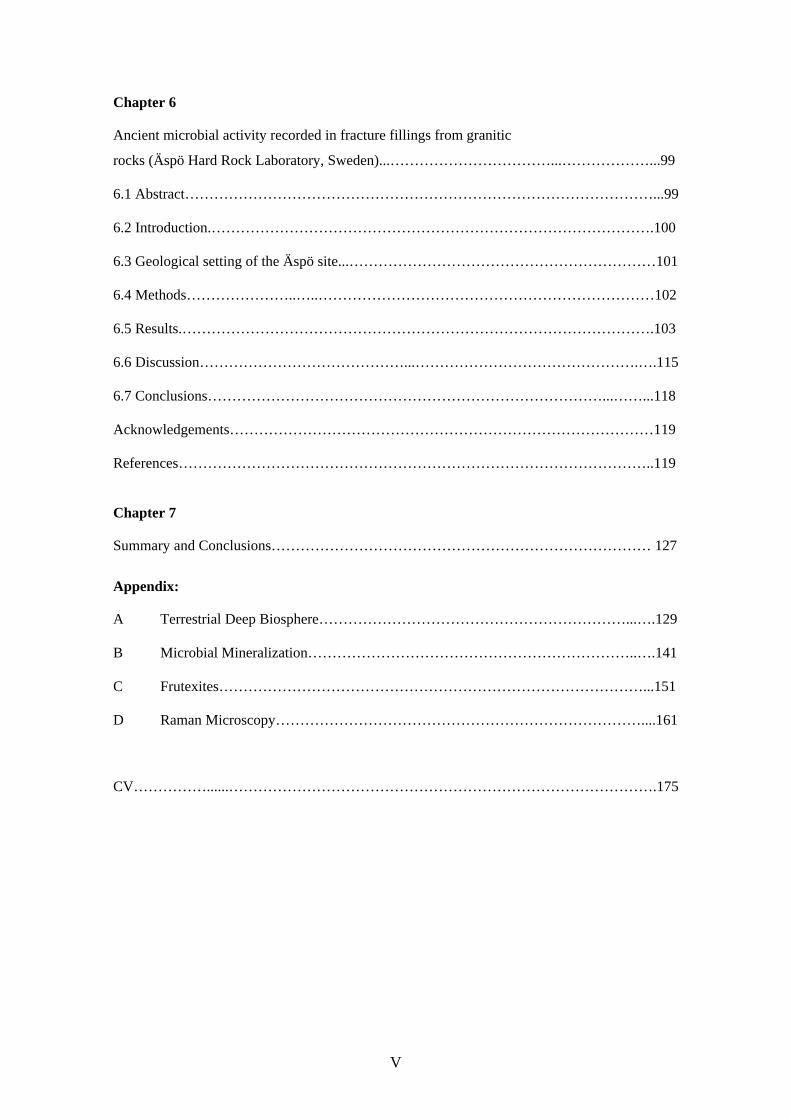
Fig. 1.1. Mineralizing microbial mats formed by (A) iron oxidzing and (B) sulfur oxizing microorganisms,
growing in subsurface aquifers in the Äspö Hard Rock Laboratory at ca. 150m depth.
1.2 Biosignatures
Biosignatures are traces of organisms which provide characteristic information about the organism
itself and about the surrounding environmental conditions. These traces derive from the major
characteristics of all living organisms, i.e. (i) their physical structure, (ii) their chemical
composition (e.g., DNA, membrane lipids), and (iii) their metabolism and resulting interactions
with the environment (Westall and Southam, 2006; Westall, 2008). Whereas these considerations
hold true for all organisms, this thesis will place special emphasis on microbial biosignatures, due
to their importance as drivers of manifold biogeochemical cycles.
Living (micro-) organisms shape their environment by their presence and metabolic activity. This
results in changes of the adjacent physico-chemical environment, leaving traces like biomorphs,
organic molecules, stable isotope and elemental fractionations, biomineral deposits and corrosion
marks.
1.2.1 Morphological biosignatures
Morphological remnants comprise the preservation of the physical structure of microorganisms (as
body fossil), the surrounding colony, biofilm or microbial mat. This may also include traces like
Chapter 1 - Introduction
3
etching or corrosion marks and borings of organisms that have altered the surrounding minerals
(e.g. Banerjee et al., 2006; Staudigel et al., 2008; Cockell et al., 2009).
Soft organic matter without hard shells or supporting framework undergoes rapid degradation after
death. However, the fossilization of organic material is favoured when penetrating fluids cause a
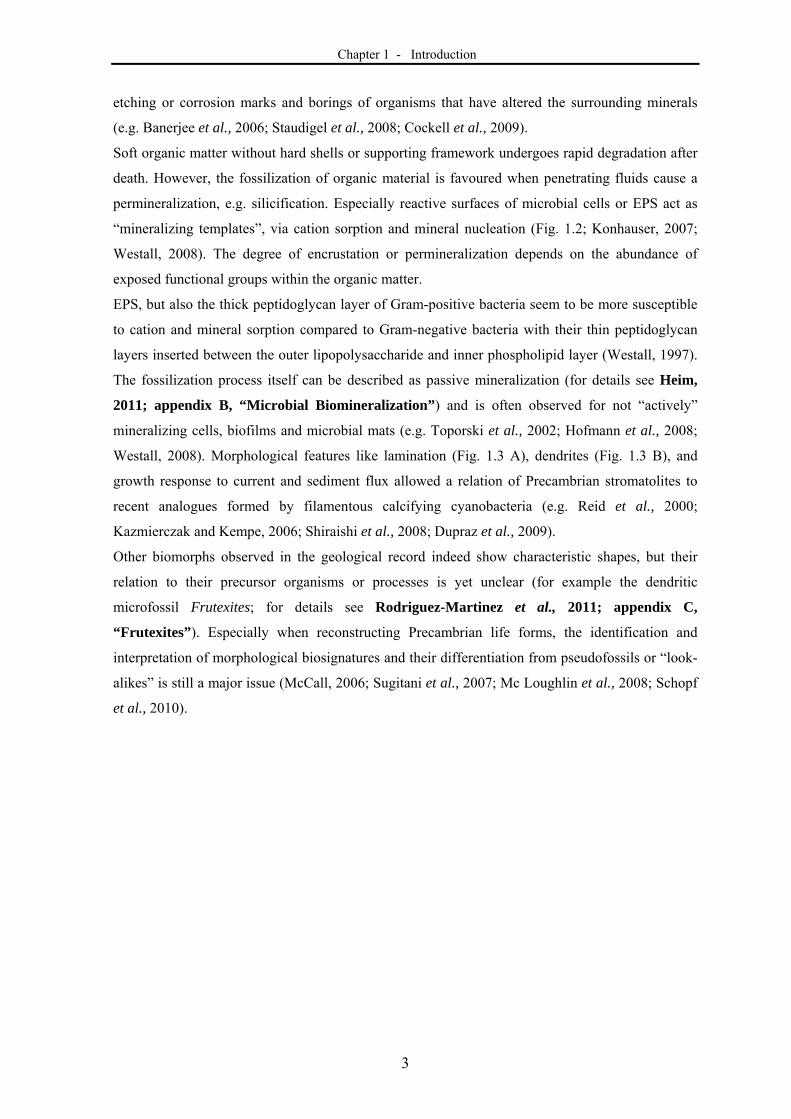
permineralization, e.g. silicification. Especially reactive surfaces of microbial cells or EPS act as
“mineralizing templates”, via cation sorption and mineral nucleation (Fig. 1.2; Konhauser, 2007;
Westall, 2008). The degree of encrustation or permineralization depends on the abundance of
exposed functional groups within the organic matter.
EPS, but also the thick peptidoglycan layer of Gram-positive bacteria seem to be more susceptible
to cation and mineral sorption compared to Gram-negative bacteria with their thin peptidoglycan
layers inserted between the outer lipopolysaccharide and inner phospholipid layer (Westall, 1997).
The fossilization process itself can be described as passive mineralization (for details see Heim,
2011; appendix B, “Microbial Biomineralization”) and is often observed for not “actively”
mineralizing cells, biofilms and microbial mats (e.g. Toporski et al., 2002; Hofmann et al., 2008;
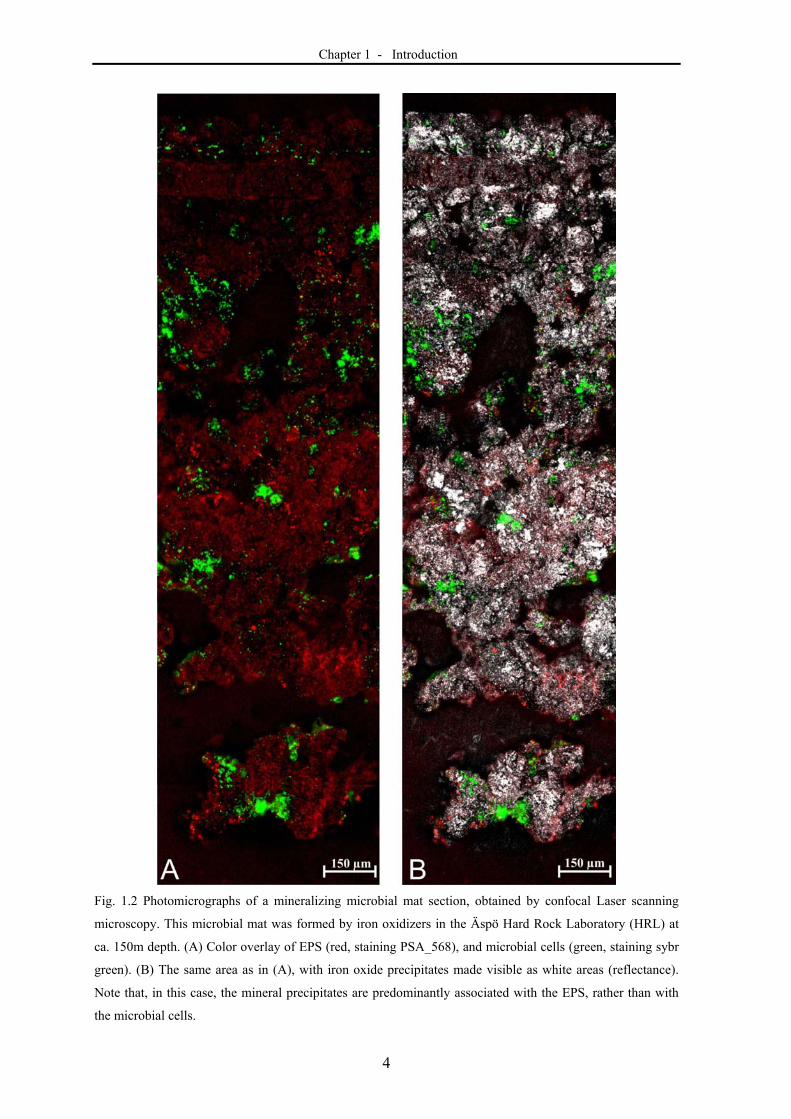
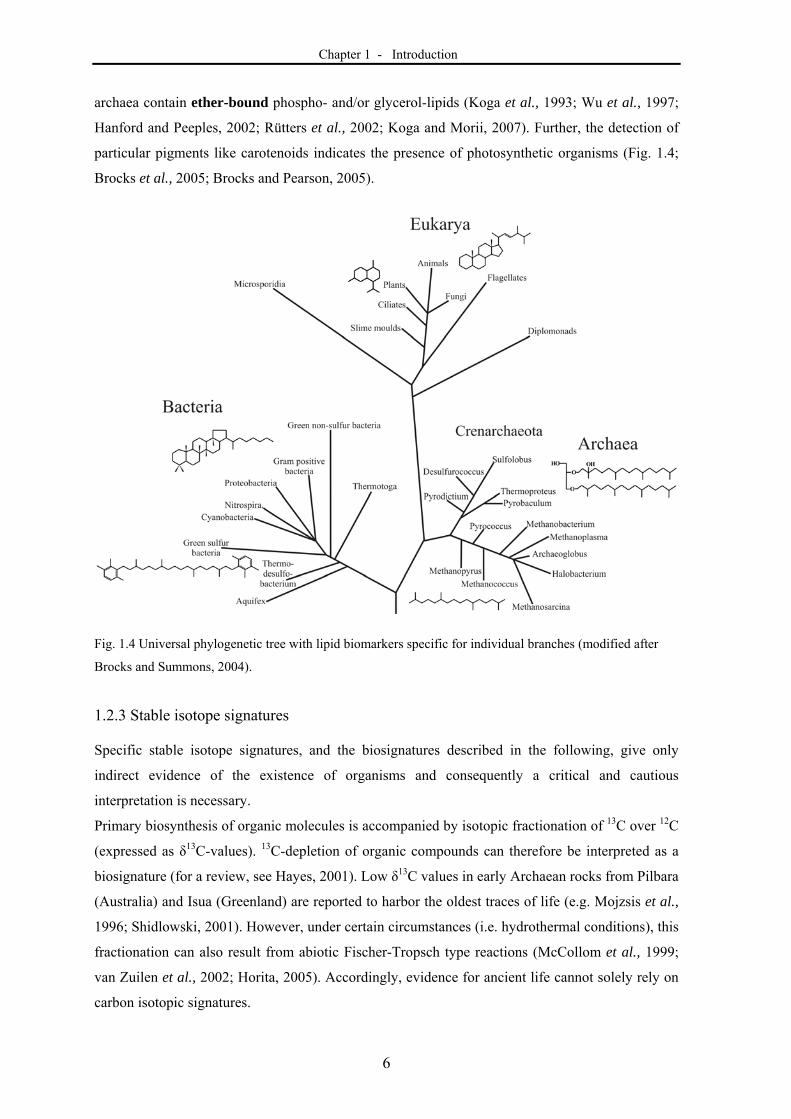
Westall, 2008). Morphological features like lamination (Fig. 1.3 A), dendrites (Fig. 1.3 B), and
growth response to current and sediment flux allowed a relation of Precambrian stromatolites to
recent analogues formed by filamentous calcifying cyanobacteria (e.g. Reid et al., 2000;
Kazmierczak and Kempe, 2006; Shiraishi et al., 2008; Dupraz et al., 2009).
Other biomorphs observed in the geological record indeed show characteristic shapes, but their
relation to their precursor organisms or processes is yet unclear (for example the dendritic
microfossil Frutexites; for details see Rodriguez-Martinez et al., 2011; appendix C,
“Frutexites”). Especially when reconstructing Precambrian life forms, the identification and
interpretation of morphological biosignatures and their differentiation from pseudofossils or “look-
alikes” is still a major issue (McCall, 2006; Sugitani et al., 2007; Mc Loughlin et al., 2008; Schopf
et al., 2010).
Chapter 1 - Introduction
4
Fig. 1.2 Photomicrographs of a mineralizing microbial mat section, obtained by confocal Laser scanning
microscopy. This microbial mat was formed by iron oxidizers in the Äspö Hard Rock Laboratory (HRL) at
ca. 150m depth. (A) Color overlay of EPS (red, staining PSA_568), and microbial cells (green, staining sybr
green). (B) The same area as in (A), with iron oxide precipitates made visible as white areas (reflectance).
Note that, in this case, the mineral precipitates are predominantly associated with the EPS, rather than with
the microbial cells.
Chapter 1 - Introduction
5
Fig. 1.3 Morphological biosignatures derived from recent iron-oxidizing microbial mats growing on a
granodioritic rock surface in the Äspö HRL. (A) Laminated structures using reflected light microscopy and
(B) Frutexites-like, dendritic structures are visible under dark-field reflected light microscopy.
1.2.2 Organic molecular markers / Biomarkers
The term “biomarker” is occasionally used as a synonym for biosignatures, but traditionally,
biomarkers refer to organic molecular markers (especially lipids) and therefore, in order to avoid
misunderstandings, the more specific synonym “molecular biosignatures” has been suggested
(Summons et al., 2008). In contrast to other biosignatures, organic molecules (biomarkers) provide
evidence for a biosynthetic origin (Brocks and Pearson, 2005).
Nucleic acids, amino acids, proteins and carbohydrates are essential and characteristic constituents
of living organisms and are used as biomarkers for recent or potential extraterrestrial life traces
(Kminek, 2000; Botta et al., 2002; Jia et al., 2008; Summons et al., 2008). However, lipids and
pigments are more commonly used as biomarkers since they are more resistant to degradation.
When suffering from diagenesis and catagensis during burial, lipid biomarkers may be altered, e.g.
by defunctionalization and isomerisation. However, the hydrocarbon skeletons can be stable over
billions of years and still bear source specific information (e.g., Brocks and Summons, 2004; Peters
et al., 2004; Brocks and Pearson, 2005). The biomarker pattern extracted from ancient rocks may
thus enable a relation between certain communities of microorganisms and their surrounding
environment. This knowledge, together with an understanding of the potential degradation
pathways helps to reconstruct ancient life forms and environmental conditions (Brocks and
Pearson, 2005; Volkman, 2006; Summons et al., 2008). Due to distinctive biosynthetic pathways
for certain lipids in bacteria, archaea and eukaryotes, some intact lipids, as well as their derived
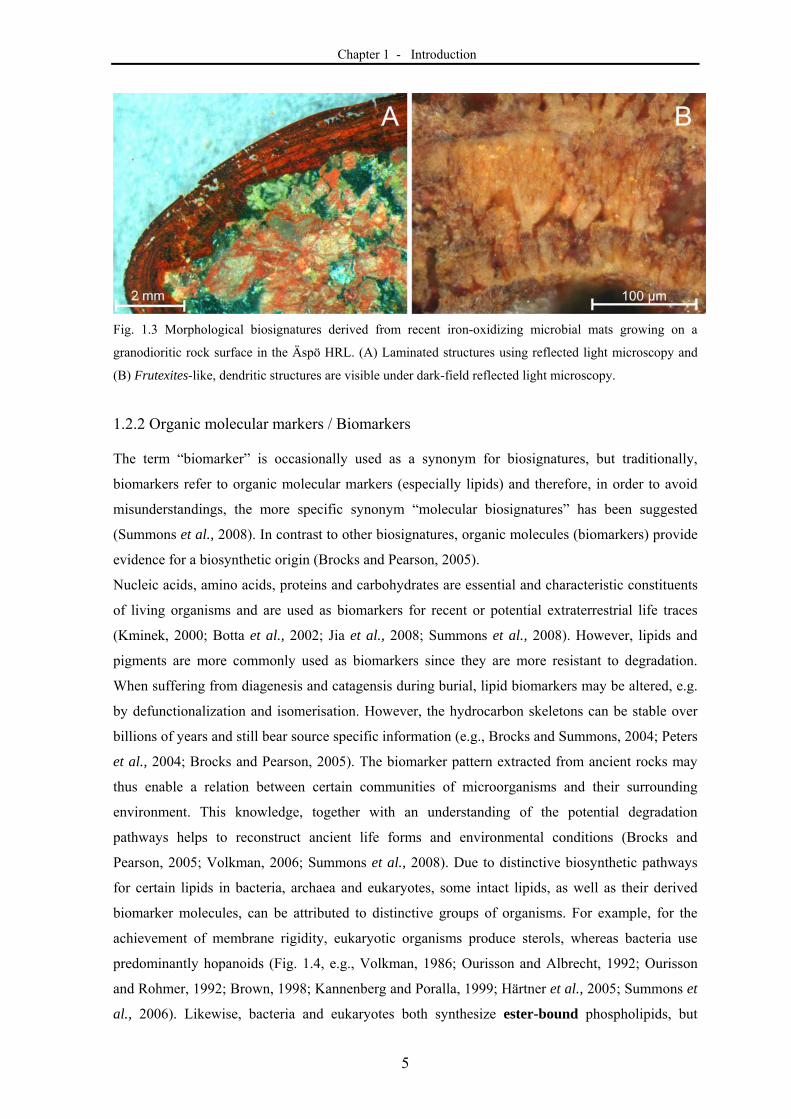
biomarker molecules, can be attributed to distinctive groups of organisms. For example, for the
achievement of membrane rigidity, eukaryotic organisms produce sterols, whereas bacteria use
predominantly hopanoids (Fig. 1.4, e.g., Volkman, 1986; Ourisson and Albrecht, 1992; Ourisson
and Rohmer, 1992; Brown, 1998; Kannenberg and Poralla, 1999; Härtner et al., 2005; Summons et
al., 2006). Likewise, bacteria and eukaryotes both synthesize ester-bound phospholipids, but
Chapter 1 - Introduction
6
archaea contain ether-bound phospho- and/or glycerol-lipids (Koga et al., 1993; Wu et al., 1997;
Hanford and Peeples, 2002; Rütters et al., 2002; Koga and Morii, 2007). Further, the detection of
particular pigments like carotenoids indicates the presence of photosynthetic organisms (Fig. 1.4;
Brocks et al., 2005; Brocks and Pearson, 2005).
Fig. 1.4 Universal phylogenetic tree with lipid biomarkers specific for individual branches (modified after
Brocks and Summons, 2004).
1.2.3 Stable isotope signatures
Specific stable isotope signatures, and the biosignatures described in the following, give only
indirect evidence of the existence of organisms and consequently a critical and cautious
interpretation is necessary.
Primary biosynthesis of organic molecules is accompanied by isotopic fractionation of 13C over 12C
(expressed as δ13C-values). 13C-depletion of organic compounds can therefore be interpreted as a
biosignature (for a review, see Hayes, 2001). Low δ13C values in early Archaean rocks from Pilbara
(Australia) and Isua (Greenland) are reported to harbor the oldest traces of life (e.g. Mojzsis et al.,
1996; Shidlowski, 2001). However, under certain circumstances (i.e. hydrothermal conditions), this
fractionation can also result from abiotic Fischer-Tropsch type reactions (McCollom et al., 1999;
van Zuilen et al., 2002; Horita, 2005). Accordingly, evidence for ancient life cannot solely rely on
carbon isotopic signatures.
Chapter 1 - Introduction
7
Other isotopic systems have been utilized as indicators for early life, namely sulfur (S) isotopes as
indicator for sulphate reduction by sulphate reducing prokaryotes (SRP, Shen and Buik, 2004;
Canfield et al., 2010), and nitrogen (N) isotope fractionation inferring microbial activity
(Beaumont and Robert, 1999; Papineau et al., 2005), and the practicability of iron (Fe) isotopes as
biosignature is investigated (Beard et al., 1999; Icopini et al., 2004). Experiments demonstrated a
biologically induced isotope fractionation for the transition metals molybdenum (Mo), zinc (Zn),
chromium (Cr), nickel (Ni) and mercury (Hg) (Berquist and Blum, 2007; John et al., 2008;
Wasylenki et al., 2007; Sikora et al., 2008; Cameron et al., 2009). Fe and Mo isotopes are also
used as palaeoenvironmental proxies, for the reconstruction of anoxic, or euxinic conditions in
water or respectively sediments (Anbar, 2004; Matthews et al., 2004; Poulson et al., 2006; Siebert
et al., 2006; Dauphas et al., 2007; Fehr et al., 2008).
Alkaline earth elements like Ca and Mg are also examined as potential biosignature to reconstruct
environmental conditions, as for example palaeo sea-temperatures (Nägler et al., 2000; Young and
Galy, 2004)
1.2.4 Biominerals
Frequent products of microbial activity are biominerals, which are formed either under controlled
crystallization conditions or, much more common, as a by-product of metabolic activity or organic
matter-metal interaction (Lowenstamm and Weiner, 1989). Depending on the formation processes,
the minerals show a broad diversity and may differ distinctly from the inorganically formed
equivalents, in shape, size, crystallinity, isotopic and trace element composition (Fig. 1.5;
Konhauser, 1997; Weiner and Dove, 2003; Bazylinski et al., 2007; Haferburg and Kothe, 2007;
Takahashi et al., 2007). In the following, the focus lies on the two major groups of microbially
induced biominerals. For a more detailed overview on biominerals and mineral-forming
microorganisms, see Heim (2011; appendix B, “Microbial Biomineralization”).
Photoautotrophic, chemolithoautotrophic and chemoheterotrophic microorganisms form organic
carbon molecules using light energy (phototrophs), or gain energy through redox reactions with
inorganic and organic substrates such as H2, CO, CO2 (HCO3-), CH4, NH4
+, H2S, SO42-, Mn(II),
Mn(IV), Fe(II), and Fe (III) (Staley, 2002; Konhauser, 2007). These processes may induce the
formation of carbonates, iron minerals or other mineral precipitates. The most abundant
biominerals, both in terms of the quantities produced and their widespread distribution among
different taxa, are calcium carbonate minerals (Lowenstamm and Weiner, 1989; Weiner and Dove,
2003). Carbonate precipitation is commonly observed for photosynthetic microorganisms
(cyanobacteria, algae) and results in the formation of a great variety of microbialites (Arp et al.,
2001; Reid et al., 2000; Burns et al., 2009; stromatolites, thrombolites). CaCO3 deposits can also be
found in aphotic environments, such as recent and ancient methane seeps. Methane-derived CaCO3
Chapter 1 - Introduction
8
precipitates form due to an increase in alkalinity which is caused by the anaerobic oxidation of
methane (AOM) by consortia of methane oxidizing archaea and sulphate reducing bacteria (SRB)
(Lein et al., 2002; Nauhaus et al., 2004; Peckmann and Thiel, 2004; Reitner et al., 2005).
Iron biominerals are of particular geological significance, not only because they comprise
approximately 40% of all minerals formed by organisms (Lowenstamm, 1986; Weiner and Dove,
2003), iron oxidizing microorganisms may have played a central role for the massive deposition of
banded iron formations (BIF) in the Precambrian (Konhauser et al., 2002). The mechanisms of BIF
are widely discussed and scenarios involving abiotic and biotic processes have been proposed (e.g.
Morris, 1983; Bau and Möller, 1993; Krapez et al., 2003; Kappler et al., 2005).
1.2.5 Trace and rare earth elements (TREE) biosignatures
Evidence of microbial activity can be obtained by distinct fractionations and or accumulations of
elements such as iron (Fe), manganese (Mn), magnesium (Mg), cobalt (Co), nickel (Ni), copper
(Cu), zinc (Zn), and molybdenum (Mo) (Silver, 1997; Lovley, 2000). These elements are known to
have biochemical and physiological functions in metabolic pathways, for instance, Cu and Ni are
included in proteins, and Mo is an important trace element necessary for nitrogen fixation (Zerkle,
2006). Negatively charged surfaces of cells, EPS offer extensive surfaces for the biosorption of
metals, whereas elements with a higher positive charge are preferentially sorbed (Texier et al.,
1999; Haferburg and Kothe, 2007). Both, metabolic activity and biomineral precipitation of
chemolithoautotrophic and chemoheterotrophic organisms play an important role in TREE co-
precipitation and fractionation (Ferris et al., 2000; Anderson and Pedersen, 2003; Yoshida et al.,
2004; Haferburg et al., 2007; Takahashi et al., 2007).

Chapter 1 - Introduction
9
Fig. 1.5 Biomineral formation within iron oxidizing microbial mats in the Äspö HRL. (A) Diverse iron oxide
mineral phases using dark-field reflected-light microscopy; SEM images of (B) gypsum co-occurrence with
Gallionella dominated microbial mats, (C) dendritic structures of ironoxides, (D) iron-oxide encrusted
bacteria, (E) phosphate sphere formation.
Chapter 1 - Introduction
10
1.3 Study site – Äspö Hard Rock Laboratory (Sweden)
The Äspö Hard Rock Laboratory (HRL), operated by the Swedish Nuclear Fuel and Waste
Management Company (SKB), is a tunnel drilled beneath the island of Äspö in south-eastern
Sweden, ca. 400km south of Stockholm (Fig. 1.6 A, B) and serves as a testing site for the long-term
storage of nuclear waste. The host rock of the Äspö site belongs to the Precambrian
Transscandinavian Igneous Belt and consists of ~1.8 Ga old granitic to quartz-monzodioritic rocks
(Wahlgren et al., 2006).
The Äspö HRL offers a unique window into the deep terrestrial biosphere, where the growth of
different microbial consortia strongly depends on the flow, oxygen content and the chemical
composition of the fluids available. Diverse chemolithoautotrophic and chemoheterotrophic
microorganisms cover rock-water interfaces along the tunnel, dominated by iron oxidizing,
sulphate reducing and/or sulphite oxidizing microbial mats (e.g. Pedersen, 1993, 1997).
Occasionally, microbial mats of phototrophic microorganisms were observed below artificial light
(tunnel illumination).
The recent subsurface biosphere in the Äspö HRL was used as a model system for the detection
and characterization of microbial biosignatures and their relation to fluid composition and mineral
fabrics within fractures. Vein minerals from 450m depth were sampled from drill cores (SKB core
library) as potential archives for biosignatures, and were investigated to test the applicability of the
results to the fossil record. Furthermore, a flow reactor experiment was designed to mimic
conditions similar to fractures and cavities in the surrounding quartz-monzodioritic host rock.
These reactors enabled the development of pristine microbial mats without contamination (Fig. 1.6
C to E). Only chemically inert materials such as polytetrafluoroethylene (PTFE, Teflon®), PTFE –
fibre glass, fluorinated ethylene propylene (FEP) and special PTFE – foam were used as
construction materials to avoid biological contamination from the surrounding environment and
chemical contamination from glass and plastic ware. The flow reactor systems and connection
tubings were thoroughly sterilized with ethanol (70%, overnight) before underground installation.
A flow reactor set consists of 4 different flow reactors, enabling to provide basic requirements for
different microorganisms: illuminated and aerated (1), illuminated and air-tight (2), dark and
aerated (3) dark and air-tight (4). The flow reactor sets were connected to three chemically
differing aquifers, and were monitored for physicochemical fluctuations and the development of
microbial mats in regular intervals of 2-3 months (Fig. 1.6 F to H).
The microbial mats developing in the dark and air-tight flow reactors of two aquifers were
dominated by Gallionella ferruginea, an auto- and mixotrophic, microaerophilic, iron-oxidizing
bacterium that uses Fe(II) as an electron donor and CO2 or carbohydrates as carbon source
(Hallbeck and Pedersen, 1991; Hallbeck et al., 1993). Because iron oxidizing bacteria have been
hypothesized as crucial players in the processes that formed Archaean and Proterozoic banded iron
Chapter 1 - Introduction
11
formations (BIF) (e.g. Konhauser, 2002; Kappler and Newmann, 2004), G. ferruginea dominated
microbial mats were investigated for potential biosignatures, namely molecular biosignatures, iron
oxide biomineralization phenomena, and TREE accumulation (Heim et al., 2009, chapter 4; Heim
et al., in revision, chapter five).
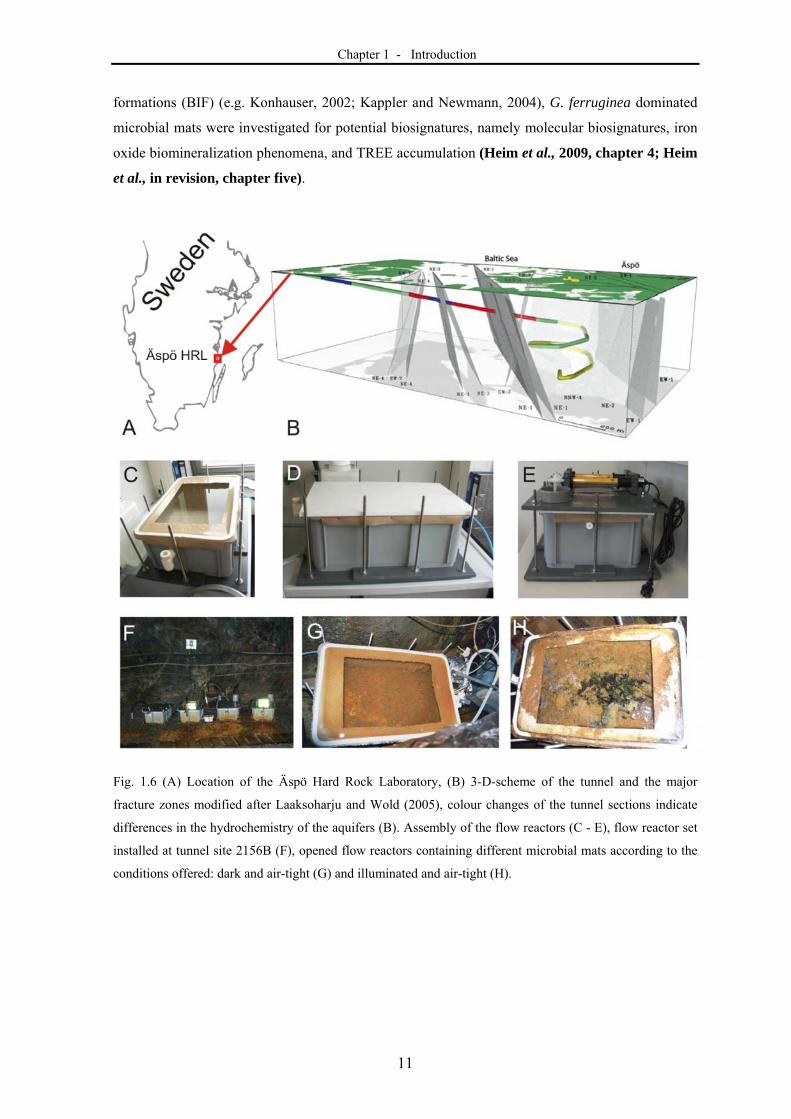
Fig. 1.6 (A) Location of the Äspö Hard Rock Laboratory, (B) 3-D-scheme of the tunnel and the major
fracture zones modified after Laaksoharju and Wold (2005), colour changes of the tunnel sections indicate
differences in the hydrochemistry of the aquifers (B). Assembly of the flow reactors (C - E), flow reactor set
installed at tunnel site 2156B (F), opened flow reactors containing different microbial mats according to the
conditions offered: dark and air-tight (G) and illuminated and air-tight (H).
Chapter 1 - Introduction
12
1.4 Integrated analytical approach – high lateral resolution concept
Biosignatures tested in this study encompassed molecular biosignatures, biomineralization
processes, and TREE accumulation and fractionation. However, the investigation of biomarkers in
complex and inhomogenous environmental materials has to deal with the following difficulties:
I. Recent microbial mats show an enormous biodiversity, and studies continuously report
findings of new chemical and metabolic pathways, genotypic and phenotypic variations
(Teske and Stahl, 2002).
II. Knowledge on lipid compositions in microorganisms is limited (few species are available as
pure cultures, and cultivation has as yet been impossible for most microorganisms).
III. For source specific lipid biomarker analysis, conventional extraction-based techniques such
as GC-MS and LC-MS (coupled gas chromatography-mass spectrometry, coupled liquid
chromatography-mass spectrometry) are limited in their applicability, because these methods
require relatively large sample quantities. Therefore samples are often homogenized,
resulting in the loss of the spatial information within the sample.
IV. Any attempt to combine biosignature analysis with complementary analytical techniques, e.g.
microscopy, requires a non-destructive analytical procedure.
Unlike GC-MS and LC-MS, methods like microscopy and laser ablation inductively coupled mass
spectrometry (LA-ICP-MS) can be conducted using relatively small sample amounts at high lateral
or spatial resolution (µm-range) to investigate fine-scale biomineralization processes and TREE
fractionations and accumulations.
However, for the approach presented here, a non-destructive methodological approach was seeked
that enabled a direct analysis of microbial biomarkers at a scale resolving the typical size range of
microbial consortia. Such miniaturization of the biomarker approach would facilitate a linkage of
molecular biosignature analysis and microscopic techniques which has not been achieved so far.
Particularly two analytical techniques fulfill these requirements, Time-of-Flight-Secondary Ion
Mass Spectrometry (ToF-SIMS, Benninghoven, 1994; Pacholski and Winograd, 1999; Hagenhoff,
2000; Sodhi 2004) and Confocal Raman Microscopy (CRM, Nasdala et al., 2004; Fries and Steele,
2009).
Although the high resolution analyses obtained by ToF-SIMS and CRM contain significantly less
chemical information than provided by conventional biomarker analyses (GC-MS; LC-MS), they
render unique constraints on the structure, chemistry and distribution of organics and associated
minerals at the submicrometer-scale. So far, however, both techniques were predominantly used in
material sciences (Vickerman and Briggs, 2001; Belu et al., 2003; Ibach and Lüth, 2003; Nasdala
et al., 2004) rather than in biomarker studies (e.g. Arouri et al., 2000; Steele et al., 2001; Toproski
and Steele, 2004; Edwards et al., 2005).
Chapter 1 - Introduction
13
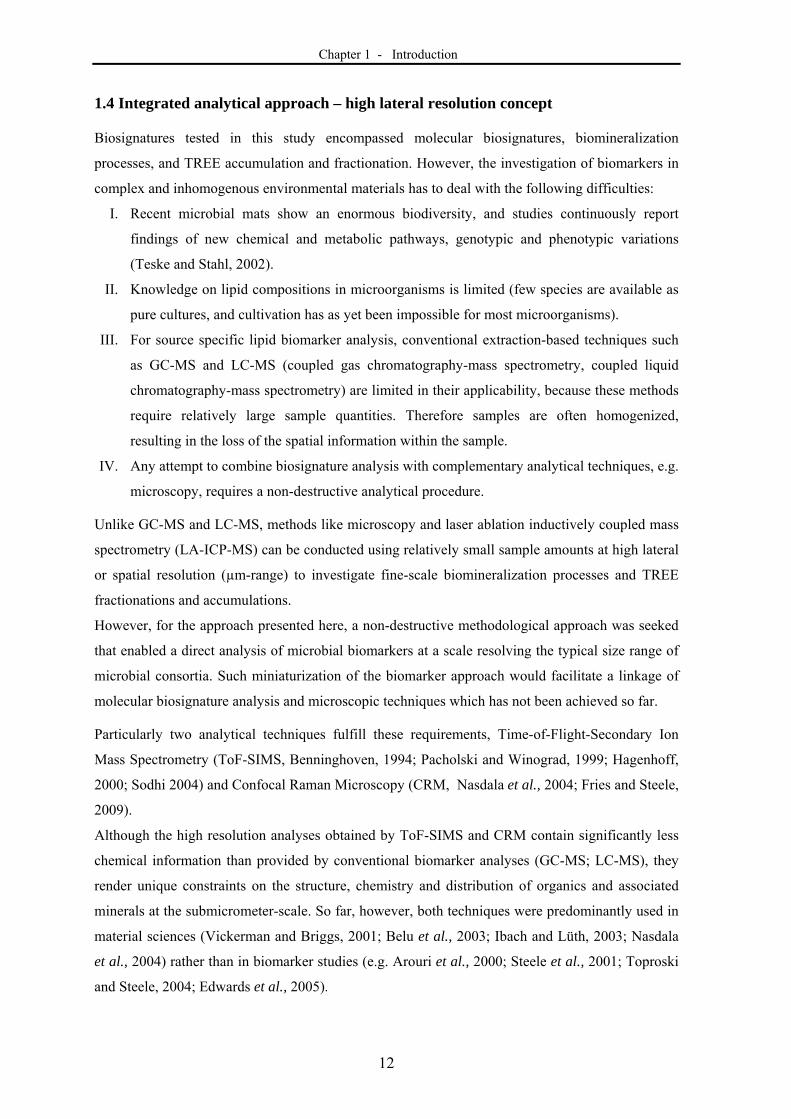
1.4.1 Time-of-Flight secondary ion mass spectrometry (ToF-SIMS)
ToF-SIMS is a surface analysis technique that enables the simultaneous detection of organic and
inorganic ionised molecules on a pre-defined area with µm-resolution (e.g., Vickerman and Briggs,
2001, Arlinghaus et al., 2006). The principle of ToF-SIMS is as follows: A beam of positively
charged ions scans the sample surface in a defined raster pattern. The impact of the primary ions on
the uppermost molecule layers of the sample causes secondary ions that are measured by a time-of-
flight mass spectrometer. Although SIMS was invented as non-imaging technique, the application
and improvement of primary ion guns and secondary analyzers enabled the obtainment of ion
images with high lateral and mass resolution (Hagenhoff, 2000). Recent developments improved
the applicability of ToF-SIMS for the detection and imaging of organic molecules e.g. of lipids in
organic tissue (Kollmer, 2004; Sjovall et al., 2004; Touboul et al., 2004, 2005). Figure 1.7 shows
the ToF-SIMS used in this study and a sketch of the instrument design. A more detailed description
of the ToF-SIMS technique is given in chapters two and three.
Fig. 1.7 (A) ToF-SIMS IV Instrument used in this study at the SP Technical Research Institute of Sweden,
Borås, and (B) scheme of the ToF-SIMS principle, image courtesy of ION-TOF GmbH, Münster).
1.4.2 Confocal Raman Microscopy (CRM)
The theory of Raman spectroscopy is based on the interaction of light of a certain wavelength with
a molecule. This interaction results in elastically (reflected) and, to a small proportion, in
inelastically scattered light, i.e. the energy of the scattered photon is different to the incident
photon. This shift in energy is characteristic for the type of molecule and its coordination to others
and can consequently be used as fingerprint for the respective molecule. Confocal Raman
Microscopy (CRM) merges Raman spectroscopy and confocal microscopy for the visualization of
molecular information over a defined sample area, enabling the characterization of mineral phases
Chapter 1 - Introduction
14
and organic compounds in the vicinity of the respective minerals in geological samples. For a
detailed description of CRM, see Toporski et al., 2011, Appendix D, “Raman Microscopy”.
1.5 Introduction to the following chapters
To test the utility of ToF-SIMS for the laterally resolved detection of lipid biomarkers in
mineralizing microbial systems, pre-characterized calcifying microbial mats from the Black Sea
were used as a model system. These mineralizing microbial mats form reef-like carbonate
structures through AOM (Hinrichs et al., 1999; Boetius et al., 2000; Michaelis et al., 2002) and are
well characterized in terms of microbiology, structure, and lipid biomarker patterns (Thiel et al.,
2001; Lein et al., 2002; Blumenberg et al., 2004; Knittel et al., 2005; Pape et al., 2005; Reitner et
al., 2005; Treude et al., 2005). Considerable efforts were undertaken to develop a contamination-
free preparation protocol for microscopic sections to be analysed with ToF-SIMS. However, ToF-
SIMS enabled a differentiation of biomarker patterns for individual microbial communities within
the microscopic section, which so far has not been possible using conventional biomarker analysis.
Further, the virtually non-destructive sample analysis of ToF-SIMS allowed a subsequent
microscopical investigation of the same sample. The results are described in detail in chapter two
(Biomarkers at the microscopic range: ToF-SIMS molecular imaging of Archaea-derived
lipids in a microbial mat).
A comprehensive overview of the use of ToF-SIMS the capabilities and limitations of this
technique and the potential for geobiological samples, is given in chapter three (Organic
geochemical microanalysis by time-of-flight secondary ion mass spectrometry (ToF-SIMS)).
Despite the promising results obtained in these pilot studies, the lack of reference data of
fragmentation patterns and molecular ions has been hampering an accurate assignment of
molecular structures. To enlarge the spectral data base for biomarker analyses, numerous lipid
standards were analysed and their fragmentation patterns were interpreted. Using these
fundamental data, individual lipids could be identified in microscopic sections from two
mineralizing microbial mats. One of these samples was obtained from the methane seep associated
Black Sea mats (see above) whereas the other was taken from G. ferruginea-dominated iron-
oxidizing microbial mats from the Äspö HRL (chapter four; spectral characterization of eight
glycerolipids and their detection in natural samples using time-of-flight secondary ion mass
spectrometry).
Further biosignatures, namely biomineralization processes and corresponding TREE fractionations
of the iron-oxidizing microbial mats and their implication for the formation of BIF are discussed in
chapter five (Trace and rare earth element accumulation and fractionation in microbial iron
oxyhydroxides). This study showed that TREE are considerably accumulated within microbial
iron oxyhydroxides. The observed REE+Y pattern differs significantly from those in inorganically
Chapter 1 - Introduction
15
precipitated iron oxyhydroxides, indicating a great potential of TREE fractionations as biosignature
for palaeoenvironmental studies.
Finally, an integrated geochemical approach to microbial biosignatures preserved in fracture
fillings is described in chapter six (Ancient microbial activity recorded in fracture fillings from
granitic rocks (Äspö Hard Rock Laboratory, Sweden). This study aimed to examine the
composition and spatial distribution of organic and inorganic molecules in the fracture fillings at
the microscopic range. It was possible to identify different fracture mineral generations and a
putative ancient biofilm that existed during a phase, when the fracture was reactivated and water
conducting.

Chapter 1 - Introduction
16
References: Anbar AD (2004) Iron stable isotopes: beyond biosignatures. Earth and Planetary Science Letters, 217, 223-
236.
Anderson CR, Pedersen K. (2003) In situ growth of Gallionella biofilms and partitioning of lanthanides and
actinides between biological material and ferric oxyhydroxides. Gebiology, 1, 169-178.
Arlinghaus HF, Kriegskotte C, Fartmann M, Wittig A, Sauerwein W, Lipinsky D (2006) Mass spectrometric
characterization of elements and molecules in cell cultures and tissues. Applied Surface Science, 252,
6941-6948.
Arouri KR, Greenwood PF, Walter MR (2000) Biological affinities of neoproterozoic acritarchs from
Australia: microscopic and chemical characterisation. Organic Geochemistry, 31, 75-89.
Arp G, Reimer A, Reitner J (2001) Photosynthesis-induced biofilm calcification and calcium concentrations
in Phaneroroic Oceans. Science, 292, 1701-1704.
Banerjee NR, Furnes H, Muehlenbachs K, Staudigel H, de Wit M (2006) Preservation of ~3.4-3.5 Ga
microbial biomarkers in pillow lavas and hyaloclastites from the Barberton Greenstone Belt, South
Africa. Earth and Planetary Science Letters, 241, 707-722.
Bailey JV, Orphan VJ, Joye SB, Corsetti FA (2009) Chemotrophic microbial mats and their potential for
preservation in the Rock Record. Astrobiology, 9, 843-859.
Bailey N J L, Jobson AM, Rogers MA (1973) Bacterial degradation of crude oil: Comparaison of field and
experimental data. Chemical Geology, 11, 203-221.
Banfield JF, Nealson KH (eds) (1997) Interactions between microbes and minerals. Reviews in Mineralogy
35, Mineralogical Society if America, Washington DC, 448p.
Bau M, Möller P (1993) Rare earth element systematics of the chemically precipitated component in Early
Precambrian iron-formations and the evolution of the terrestrial atmosphere-hydrosphere-lithosphere
system. Geochimica et. Cosmochimica Acta, 57, 2239-2249.
Bazylinski DA, Frankel RB, Konhauser KO (2007) Modes of biomineralization of magnetite by microbes.
Geomicrobiology Journal, 24, 465–475.
Beard BL, Johnson CM, Cox L, Sun H, Nealson KH, Aguilar C (1999) Iron isotope biosignatures. Science,
285, 1889-1892.
Beaumont V, Robert F (1999) Nitrogen isotope ratios of kerogens in Precambrian cherts: a record of the
evolution of atmospheric chemistry? Precambrian Research, 96, 63-82.
Belu AM, Graham DJ, Castner DG (2003) Time-of-flight secondary ion mass spectrometry: techniques and
applications for the characterization of biomaterial surfaces. Biomaterials, 24, 3635-3653.
Belyaev SS, Wolkin R, Kenealy M, DeNiro MJ, Epstein S, Zeikus, JG (1983). Methanogenic bacteria from
the bondyushskoe oil field: General characterization and analysis of stable-carbon isotopic
fractionation. Applied environmental microbiology, 45, 691-697.
Benninghoven A (1994) Chemical Analysis of Inorganic and Organic Surfaces and Thin Films by Static
Time-of-Flight Secondary Ion Mass Spectrometry (ToF-SIMS). Angewandte Chemie International
Edition in English, 33, 1023-1043.
Bergquist BA, Blum JD (2007) Mass-Dependent and -Independent Fractionation of Hg Isotopes by
Photoreduction in Aquatic Systems. Science, 318, 417-420.
Chapter 1 - Introduction
17
Blumenberg M, Seifert R, Reitner J, Pape T, Michaelis W (2004) Membrane lipid patterns typify distinct
anaerobic methanotrophic consortia. Proceedings of the National Academy of Sciences of the United
States of America, 101, 11111-11116.
Boetius A, Ravenschlag K, Schubert CJ, Rickert D, Widdel F, Gieseke A, Amann R, Jørgensen BB, Witte U,
Pfannkuche O (2000) A marine microbial consortium apparently mediating anaerobic oxidation of
methane. Nature, 407, 623-626.
Botta O, Glavin DP, Kminek G, Bada JL (2002) Relative amino acid concentrations as a signature for parent
body processes of carbonaceous chondrites. Origins of Life and Evolution of the Biosphere, 32, 143-
163.
Brocks JJ, Love GD, Summons RE, Knoll AH, Logan GA, Bowden SA (2005) Biomarker evidence for green
and purple sulphur bacteria in a stratified Palaeoproterozoic sea. Nature, 437, 866-870.
Brocks JJ, Pearson A (2005) Building the biomarker tree of life. In Reviews in Mineralogy and
Geochemistry, Vol. 59, 233-258.
Brocks JJ, Summons RE (2004) Sedimentary Hydrocarbons, Biomarkers for early life. In Schlesinger W.H:
(ed), Holland H.D., Turekian K.K (chief eds), Treatise on Geochemistry, Vol 8, Elsevier, 63-115.
Brown GD (1998) The biosynthesis of steroids and triterpenoids. RCS Natural Product Reports, 653- 696.
Bult CJ, White O, Olsen GJ, Zhou L, Fleischmann RD, Sutton GG, Blake JA, FitzGerald LM, Clayton RA,
Gocayne JD, Kerlavage AR, Dougherty BA, Tomb J-F, Adams MD, Reich CI, Overbeek R,
Kirkness EF, Weinstock KG, Merrick JM, Glodek A, Scott JL, Geoghagen NSM, Weidman JF,
Fuhrmann JL, Nguyen D, Utterback TR, Kelley JM, Peterson JD, Sadow PW, Hanna MC,
Cotton MD, Roberts KM, Hurst MA, Kaine BP, Borodovsky M, Klenk H-P, Fraser CM, Smith HO,
Woese CR, Venter JC (1996) Complete genome sequence of the methanogenic archaeon, Methano-
coccus jannaschii, Science, 273, 1058-1073.
Burns BP, Anitori R, Butterworth P, Henneberger R, Goh F, Allen MA, Ibañez-Peral R, Berquist PL,
Walter MR, Neilan BA (2002) Modern analogues and the early history of microbial life. Precambiran
Research, 173, 10-18.
Cameron V, Vance D, Archer C, House CH (2009) A biomarker based on the stable isotopes of nickel.
Proceedings of the National Academy of Sciences, 106, 10944-10948.
Canfield D, Farquhar J, Zerkle AL (2010) High isotope fractionations during sulfate reduction in a low-
sulfate euxinic ocean analog. Geology, 38, 415-418.
Chapelle FH (2000) Ground-water Microbiology and Geochemistry. Wiley-VCH, 496 pages.
Charaklis WG, Marshall KC (eds) (1990) Biofilms. John Wiley and Sons, Inc, New York. 816 p.
Cockell CS, Olsson-Francis K, Herrera A, Meunier A (2009) Alteration textures in terrestrial volcanic glass
and the associated bacterial community. Geobiology, 7, 50-65.
Dauphas N, van Zuilen M, Busigny V, Lepland A, Wadhwa M, Janney PE (2007) Iron isotope, major and
trace element characterization of early Archean supracrustal rocks from SW Greenand: Protolith
identification and metamorphic overprint. Geochimica et Cosmochimica Acta, 71, 4745-4770.
Dupraz C, Reid RP, Braissant O, Decho AW, Norman RS, Visscher PT (2009) Processes of carbonate
precipitation in modern microbial mats. Earth Science Reviews, 96, 141-162.
Chapter 1 - Introduction
18
Edwards HGM, Moody CD, Villar SEJ, Wynn-Williams DD (2005) Raman spectroscopic detection of key
biomarkers of cynaobacteria and lichen symbiosis in extreme Antarctic habitats: Evaluation for Mars
Lander Missions. Icarus, 174, 560-571.
Ehrlich H.L. (2002) Geomicrobiology 4th edn. Marcel Dekker Inc, New York, 800p.
Ehrlich H.L. (1998) Geomicrobiology: its significance for geology. Earth Science Reviews, 45, 45-60.
Fehr MA, Andersson PS, Halenius U, Morth C-M (2008) Iron isotope variations in Holocene sediments of
the Gotland Deep, Baltic Sea. Geochimica et Cosmochimica Acta, 72, 807-826.
Fenchel T, Finleay BJ (1995) Ecology and Evolution in anoxic worlds. Oxford University Press, Oxford,
276p.
Ferris FG, Hallberg RO, Lyvén B, Pedersen K (2000) Retention of strontium, cesium, lead and uranium by
bacterial iron oxides from subterranean environment. Applied Geochemistry, 15, 1035-1042.
Fries M, Steele A (2009) Raman spectroscopy and confocal Raman imaging in mineralogy and petrography.
In Dieing T, Hollricher O, Toporski J (eds) Confocal Raman Microscopy. Springer, Heidelberg, 320p.
Haferburg G, Merten D, Büchel G, Kothe E (2007) Biosorption of metal and salt tolerant microbial isolates
from a former uranium mining aerea. Their impact on changes in rare earth element patterns in acid
mine drainage. Journal of Basic Microbiology, 47, 474-484.
Haferburg G, Kothe E (2007) Microbes and metals: interactions in the environment. Journal of Basic
Microbiology, 47, 453–467.
Hagenhoff B (2000) High resolution surface analysis by TOF-SIMS. Mikrochimica Acta, 132, 259-271.
Hallbeck L, Ståhl F, Pedersen K (1993) Phylogeny and phenotypic characterization of the stalk-formin and
iron oxidizing bacterium Galionella ferruginea. Journal of General Microbiolology, 139, 1531-1535.
Hallbeck L, Pedersen K (1991) Autotrophic and mixothrophic growth of Gallionella ferruginea. Journal of
General Microbiolology, 137, 2657-2661.
Hanford MJ, Peeples TL (2002) Archaeal Tetraether Lipids. Unique structures and applications. Applied
Biochemisty and Biotechnology, 97, 45-62.
Härtner T, Straub KL, Kannenberg E (2005) Occurrence of hopanoids lipids in anaerobic Geobacter species.
FEMS Microbiology Letters, 243, 59-64.
Hayes JM (2001) Fractionation of the isotopes of carbon and hydrogen in biosynthetic processes. In J.W.
Valley, DR. Cole (Eds.), Stable isotope geochemistry. Reviews in Mineralogy and Geochemistry,
Vol. 43 Mineralogical Society of America, Washington D.C., 225-278.
Hinrichs K-U, Hayes JM, Sylva SP, Brewer PG, DeLong EF (1999) Methane-consuming archaebacteria in
marine sediments Nature 398, 802-805.
Hofmann BA, Farmer JD, Von Blanckenburg F, Fallick AE (2008) Subsurface filamentous fabrics: An
evaluation of origins based on morphological and geochemical criteria, with implications for
exopaleontology. Astrobiology, 8, 87- 117.
Horita J (2005) Some perspective on isotope biosignatures for early life. Chemical Geology, 218, 171-186.
Ibach H, Lüth H (2003) Solid State Physics. An Introduction to Principles of Materials Science. Springer,
Berlin, 402p.
Icopini GA, Anbar AD, Ruebush SS, Tien M, Brantley SK (2004) Iron isotope fractionation during microbial
reduction of iron, the importance of adsorption. Geology, 32, 205-208.
Chapter 1 - Introduction
19
Jia G, Dungait JAJ, Bingham EM, Valiranta M, Korhola A, Evershed RP (2008) Neutral monosaccharides as
biomarker proxies for bog-forming plants for application to palaeovegetation reconstruction in
ombrotrophic peat deposits. Organic Geochemistry, 39, 1790-1799.
John S G, Rouxel OJ, Craddock PR, Engwall AM, Boyle EA (2008) Zinc stable isotopes in seafloor
hydrothermal vent fluids and chimneys. Earth and Planetary Science Letters, 269, 17-28.
Kannenberg EL, Poralla K (1999) Hopanoid biosynthesis and function in bacteria. Naturwissenschaften, 86,
168-176.
Kappler A, Straub B, Newman DK (2005) Fe(III) mineral formation and cell incrustation by the nitrate-
dependent Fe(II)-oxidizer strain BoFeN1. Geobiology, 3, 235-245.
Kappler A, Newmann DK (2004) Formation of Fe(III)-minerals by Fe(II)-oxidizing photoautotrophic
bacteria. Geochimica et Cosmochimica Acta, 68, 1217-1226.
Kazmierczak J, Kempe S (2006) Genuine modern analogues of Precambrian stromatolites from cladera lakes
of Niuafo’ou Island, Tonga. Naturwissenschaften, 93, 119-126.
Kminek G, Bada JL, Botta O, Glavin DP, Grunthaner F (2000) MOD: an organic detector for the future
robotic exploration of Mars. Planetary and Space Science, 48, 1087-1091.
Knittel K, Losekann T, Boetius A, Kort R, Amann R (2005) Diversity and Distribution of Methanotrophic
Archaea at Cold Seeps. Applied and Environmental Microbiology, 71, 467-479.
Koga Y, Morii H (2007) Biosynthesis of ether-type polar lipids in archaea and evolutionary considerations.
Microbiology and Molecular Biology Reviews, 71, 97-120.
Koga Y, Nishihara M, Morii H, Akagawa-Matsushita M (1993) Ether polar lipids of methanogenic bacteria:
structures, comparative aspects and biosynthesis. Microbiological Reviews, 57, 164-182.
Kollmer F (2004) Cluster primary ion bombardment of organic materials. Applied Surface Science, 231, 153-
158.
Konhauser K (2007) Introduction to geomicrobiology. Blackwell Publishing, Oxford, 425 p.
Konhauser KO, Hamade T, Raiswell R, Morris RC, Ferris FG, Southam G, Canfield DE (2002) Could
bacteria have formed the Precambrian banded iron formations? Geology, 20, 1079-1082.
Konhauser KO (1997) Bacterial iron biomineralization in nature. FEMS Microbiology Reviews, 20, 315-326.
Krapez B, Barley ME, Pickard AL (2003) Hydrothermal and resedimented origins of the precursor sediments
to banded iron formation: sedimentological evidence from the Early Paleoproterozoic Brockman
Supersequence of Western Australia. Sedimentology, 50, 979-1011.
Laaksoharju M, Wold S (2005) The colloid investigations conducted at the Äspö Hard Rock Laboratory
during 2000-2004. Svensk Kärnbränslehanteriang AB, TR-05-20, 211p.
Lein AY, Ivanov MV, Pimenov NV, Gulin MB (2002) Geochemical characteristics of the carbonate
constructions formed during microbial oxidation of methane under anaerobic conditions.
Microbiology, 71, 78-90.
Lieske R (1932) Über das Vorkommen von Bakterien in Kohlenflözen. Biochemische Zeitschrift, 250, 339-
351.
Lipman CB (1931) Living microorganisms in ancient rocks. Journal of Bacteriology, 22, 183-198.
Lovley DR (2000) Environmental microbe-metal interactions (ed) ASM Press, Washington DC, 395p.
Lowenstamm HA, Weiner S (1989) On Biomineralization. Oxford University Press, New York, 324p.
Chapter 1 - Introduction
20
Matthews A, Morhans-Bell HS, Emmanuel S, Jenkyns H, Erel Y, Halciz L (2004) Controls of iron-isotope
fractionation in organic-rich sediments (Kimmeridge Clay, Upper Jurassic, southern England).
Geochimica et Cosmochimica Acta, 68, 3107-3123.
McCall GJH (2006) The Vendian (Ediacaran) in the geological record: Enigmas in geology’s preclude to the
Cambrian explosion. Earth Science Reviews, 77, 1-229.
McCollom TM, Ritter G, Simmoneit BRT (1999) Lipid synthesis under hydrothermal conditions by Fischer–
Tropsch-type reactions. Origins of Life and Evolution of the Biosphere, 29, 166– 453.
McLoughlin N, Wilson LA, Brasier MD (2008) Growth of synthetic stromatolites and wrinkle structures in
the absence of microbes – implications for the early fossil record. Geobiology, 6, 95-105.
Michaelis W, Seifert R, Nauhaus K, Treude T, Thiel V, Blumenberg M, Knittel K, Gieseke A, Peterknecht K,
Pape T, Boetius A, Amann R, Jørgensen BB, Widdel F, Peckmann J, Pimenov NV, Gulin MB (2002)
Microbial reefs in the Black Sea fueled by anaerobic oxidation of methane. Science, 297, 1013-1015.
Mojzsis SJ, Arrhenius G, McKeegan KD, Harison TM, Nutman AP, Friend CRL (1996) Evidence for life on
Earth before 3800 million years ago. Nature, 384, 55–59.
Morris RC, Horwitz RC (1983) The origin of the iron-formation-rich Hamersley Group of Western Australia
– Deposition on a platform. Precambrian Research, 21, 273-297.
Nägler TF, Eisenhauer A, Müller A, Hemleben C, Kramers J (2000) The δ44Ca-temperature calibration on
fossil and cultured Globigerinoides sacculifer: New tool for reconstruction of past sea surface
temperatures. Geochemistry, Geophysics, Geosystems, 1, 1052.
Nauhaus K, Treude T, Boetius A, Kruger M (2005) Environmental regulation of the anaerobic oxidation of
methane: a comparison of ANME-I and ANME-II communities. Environmental Microbiology, 7, 98-
106.
Nasdala L, Smith DC, Kaindl R, Zieman MA (2004) Raman spectroscopy: Analytical perspectives in
mineralogical research. In Spectroscopic Methods in Mineralogy. Beran A., Libowitzky E., (eds) Emu
Notes in Mineralogy, Vol. 6, 281-343.
Nielsen PH, Jahn A, Palmgren R (1997) Conceptual model for production and composition of exopolymers
in biofilms. Water Science and Technology, 36, 11-19.
Ourisson G, Albrecht P (1992) Hopanoids. 1 Geohopanoids: The most abundant natural products on Earth?
Accounts of Chemical Research, 25, 398-402.
Ourisson G, Rohmer M (1992) Hopanoids. 2 Biohopanoids: a novel class of bacterial lipids. Accounts of
Chemical Research, 25, 403-408.
Pacholski ML, Winograd N (1999) Imaging with mass spectrometry. Chemical Reviews, 99, 2977-3005.
Pape T, Blumenberg M, Seifert R, Egorov VN, Gulin SB, Michaelis W (2005) Lipid geochemistry of
methane-seep-related Black Sea carbonates. Palaeogeography, Palaeoclimatology, Palaeoecology,
227, 31-47.
Papineau D, Mojzsis SJ, Karhu JA, Marty B (2005) Nitrogen isotopic composition of ammoniated
phyllosilicates: case studies from Precambrian metamorphosed sedimentary rocks. Chemical Geology,
216, 37-58.
Peckmann J, Thiel V (2004) Carbon cycling at ancient methane-seeps. Chemical Geology, 205, 443-467.
Pedersen K (1997) Microbial life in deep granitic rock. FEMS Microbiology Reviews, 20, 399-414.
Chapter 1 - Introduction
21
Pedersen K (1993) The deep subterranean biosphere. Earth-Science Reviews, 34, 243-260.
Peters KE, Walters CC, Moldowan JM (2004) The Biomarker Guide: Volume 1: Biomarkers and Isotopes in
the Environments and Human History. Cambridge University Press, Cambridge, 490 p.
Poulson RL, McManus J, Siebert C, Berelson WM (2006) Authigenic molybdenum isotope signatures in
marine sediments. Geology, 34, 617-620.
Reid RP, Visscher PT, Decho AW, Stolz JF, Bebout BM, Dupraz C, Macintyre IG, Paerl HW, Pinckney JL,
Prufert-Bebout L, Steppe TF, Des Marais DJ (2000) The role of microbes in accretion, lamination and
early lithification of modern marine stromatolites. Nature, 406, 989-992.
Reitner J, Peckmann J, Reimer A, Schumann G, Thiel V (2005) Methane-derived carbonate build-ups and
associated microbial communities at cold seeps on the lower Crimean shelf (Black Sea). Facies, 51,
66-79.
Russel MJ (2003) The importance of being alkaline. Science, 302, 580-581.
Rütters H, Sass H, Cypionka H, Rulkötter J (2002) Phospholipid analysis as a tool to study complex
microbial communities in marine sediments. Journal of Microbiological Methods, 48, 149-160.
Sahl JW, Schmidt R, Swanner ED, Mandernack KW, Templeton AS, Kieft TL, Smith RL, Sandford WE,
Callaghan RL, Mitton JB, Spear JR (2008) Subsurface Microbial Diversity in Deep-Granitic Fracture
Water in Colorado. Applied and Environmental Microbiology, 74, 143-152.
Schieber J, Bose P, Eriksson PG, Banerjee S, Sarkar S, Altermann W, Catuneanu O (2007) Atlas of microbial
mat features preserved within the siliciclastic rock record. Elsevier, Amsterdam, 311p.
Schopf JW, Kudryavtsev AB, Sugitani K, Water MR (2010) Precambrian microbe-like pseudofossils: A
promising solution of the problem. Precambrian Research, 179, 191-205.
Shen Y, Buick R (2004) The antiquity of microbial sulfate reduction. Earth Science Reviews, 64, 243-272.
Shidlowski M (2001) Carbon isotopes as biogeochemical recorders of life over 3.8 Ga of Earth history:
evolution of a concept. Precambrian Research, 106, 117– 134.
Shiraishi F, Bissett A, de Beer D, Reimer A, Arp G (2008) Photosynthesis, Respiration and Exopolymer
Calcium-Binding in Biofilm Calcifikation (Westerhöfer and Deinschwanger Creek, Germany).
Geomicrobiology Journal, 25, 83-94.
Siebert C, McManus J, Bice A, Poulson R, Berelson WM, (2006) Molybdenum isotope signatures in
continental margin marine sediments. Earth and Planetary Science Letters, 241, 723-733.
Sikora E R, Johnson TM, Bullen TD (2008) Microbial mass-dependent fractionation of chromium isotopes.
Geochimica et Cosmochimica Acta, 72, 3631-3641.
Silver S (1997) The bacterial view of the periodic table: specific functions for all elements. In Banfield JF,
Nealson KH (eds) Geomicrobiology: Interactions between microbes and minerals. Reviews in
Mineralogy Vol. 35. Mineralogical Society of America, Washington DC, 345-360.
Sjovall P, Lausmaa J, Johansson B, (2004) Mass spectrometric imaging of lipids in brain tissue. Analytical
Chemistry, 76, 4271-4278.
Sodhi RNS, (2004) Time-of-flight secondary ion mass spectrometry (ToF-SIMS): Versatility in chemical and
imaging surface analysis. The Analyst, 129, 483-487.
Staley JT (2002) A microbiological perspective of biodiversity. In Staley JT, Reysenbach AL, Biodiversity of
Microbial Life. Wiley-Liss, New York, 3-23.
Chapter 1 - Introduction
22
Staudigel H, Furnes H, McLoughlin N, Banerjee NR, Connel LB, Templeton A (2008) 3.5. billion years of
glass bioalteration: Volcanic rocks as a basis for microbial life. Earth-Science Reviews, 89, 156-176.
Steele A, Toporski JKW, Avci R, Guidry S, McKay DS (2001) Time of flight secondary ion mass
spectrometry (ToFSIMS) of a number of hopanoids. Organic Geochemistry, 32, 905-911.
Stetter KO (1996) Hyperthermophiles in the history of life. In Bock GR, Gode JA (eds) Evolution of
hydrothermal ecosystems on the Earth (and Mars). Wiley & Sons, Chichester, UK, 1-10.
Sugitani K, Grey K, Allwood A, Nagaoka T, Mimura K, Minami M, Marshall CP, Van Kranendonk MJ,
Walter MR (2007) Diverse microstructure from Archaean chert from the Mount Goldsworthy-Mount
Grant area, Pilbara Craton, Western Australia: Microfossils, dubiofossils, or pseudofossils?
Precambrian Research, 158, 228-262.
Summons RE, Albrecht P, McDonald G, Moldowan JM (2008) Molecular biosignatures. Space Science
Reviews, 135, 133-159.
Summons RE, Bradley AS, Jahnke LL, Waldbauer JR (2006) Steroids, triterpenoids and molecular oxygen.
Philosophical Transactions of the royal society B, 361, 951-968.
Takahashi Y, Hirata T, Shimizu H, Ozaki T, Fortin D, (2007) A rare earth element signature of bacteria in
natural waters. Chemical Geology, 244, 569–583.
Teske A, Stahl DA, (2002) Microbial Mats and Biofilms: Evolution, structure, and function of fixed
microbial communities. In Staley JT, Reysenbach A-L, Biodiversity of Microbial Life. Wiley-Liss,
New York, 49-100.
Texier A-L, Andrès Y, Le Cloirec P (1999) Selective biosorption of Lantanide (La, Eu, Yb) ions by
Pseudomonas aeruginosa. Environmental Science and Technology, 33, 489-495.
Thiel V, Peckmann J, Richnow HH, Luth U, Reitner J, Michaelis W (2001) Molecular signals for anaerobic
methane oxidation in Black Sea seep carbonates and a microbial mat. Marine Chemistry, 73, 97-112.
Touboul D, Halgand F, Brunelle A, Kersting R, Tallarek E, Hagenhoff B, Laprévote O, (2004) Tissue
molecular ion imaging by gold cluster ion bombardment. Analytical Chemistry, 76, 1550-1559.
Touboul D, Kollmer F, Niehuis E, Brunelle A, Laprevote O, (2005) Improvement of biological time-of-
flight-secondary ion mass spectrometry imaging with a bismuth cluster ion source. Journal of the
American Society for Mass Spectrometry, 16, 1608-1618.
Toporski J, Steele A (2004) Characterization of purified biomarker compounds using time of flight-
secondary ion mass spectrometry (ToF-SIMS). Organic Geochemistry, 35, 793-811.
Toporski JKW, Steele A, Westall F, Avci R, Martill DM, McKay DS (2002) Morphologic and spectral
investigation of exceptionally well-preserved bacterial biofilms from the Oligocene Enspel formation,
Germany. Geochimica et Cosmochimica Acta, 66, 1773-1791.
Treude T, Knittel K, Blumenberg M, Seifert R, Boetius A (2005) Subsurface Microbial Methanotrophic Mats
in the Black Sea. Applied and Environmental Microbiology, 71, 6375-6378.
Trevors JT (2002) The subsurface origin of microbial life on Earth. Research in Microbiology, 153, 487-491.
Van Zuilen MA, Lepland A, Arrhenius G (2002) Reassessing the evidence for the earliest traces of life.
Nature, 418, 627-630.
Vickerman JC, Briggs D (2001) ToF-SIMS: Surface analysis by mass spectrometry. IM Publications and
SurfaceSpectra Limited (Charlton, Chichester, West Sussex, UK), 789pp.
Chapter 1 - Introduction
23
Volkman JK (1986) A review of sterol markers for marine and terrigenous organic matter. Organic
Geochemistry, 9, 83-99.
Volkman JK (2006) Lipid markers for marine organic matter. In Hutziger O, The Handbook of environmental
chemistry. Vol 2 part N. Reaction and processes, Springer, Berlin, 27-70.
Wächtershäuser G (1990) Evolution of the first metabolic cycles. Proceedings of the National Academy of
Sciences, 87, 200-204.
Wächtershäuser G (1988) Before Enzymes and Templates: Theory of surface metabolism. Microbiological
Reviews, 52, 452-484.
Wahlgren C-H, Hermanson J, Forssberg O, Curtis P, Triumf C-A, Drake H, Tullborg E-L (2006) Geological
description of rock domains and deformation zones in the Simpevarp and Laxemar subareas.
Preliminary site description Laxemar subarea - version 1.2. Svensk Kärnbränslehanteriang AB, R-05-
69, 265p.
Wanger G, Onstott TC, Southam G (2008) Stars of the terrestrial deep subsurface: Anovel ‘star-shaped’
bacterial morphotype from a South African platinum mine. Geobiology, 6, 325-330.
Wasylenki LE, Anbar AD, Liermann LJ, Mathur R, Gordon GW, Brantley SL (2007) Isotope fractionation
during microbial metal uptake measured by MC-ICP-MS. Journal of Analytical Atomic Spectrometry,
22, 905-910.
Weiner S, Dove PM (2003) An overview of biomineralization processes and the problem of the vital effect.
In Dove PM, De Yoreo JJ, Weiner S (eds.), Biomineralization. Reviews in Mineralogy and
Geochemistry. Washington DC, USA: Mineralogical Society of America and Geochemical Society,
Vol. 54, pp. 1–29.
Westall F (2008) Morphological Biosignatures in early terrestrial and extraterrestrial materials. Space
Science Reviews, 135, 95-114.
Westall F, Southam G, (2006) Early life on Earth. In Benn K, Mareschal JC, Condie K (eds), Archean
Geodynamics and Environments. AGU Geophysical Monographs, 163, 283-304.
Westall F (1997) The influence of cell wall composition on the fossilization of bacteria and the implications
for the search of early life forms. In Cosmovici C, Bower S, Werthimer D (eds), Astronomical and
biochemical origins and the search for life in the Universe. Bologna, Editori Compositrici, 491-504.
Wingender J, Neu TR, Flemming H-C (1999) What are bacterial extracellular polymeric substances? In:
Wingender J, Neu TR, Flemming H-C, (Eds) Microbial extracellular polymeric substances:
characterization, structure, and function. Springer, Berlin, p.1-15.
Wolfaardt GM, Lawrence JR, Korber DR (1999) Function of EPS. In Wingender J, Neu TR, Flemming HC
(eds), Microbial extracellular polymeric substances: characterization, structure, and function.
Springer-Berlag, Berlin, pp. 171-200.
Wu Y, Wang J, Sui S-F (1997) Characterization of Phospholipids by electron impact, field desorption and
liquid secondary ion mass spectrometry. Journal of Mass Spectrometry, 32, 616-625.
Young ED, Galy A (2004) The Isotope Geochemistry and Cosmochemistry of Magnesium. In C. M.
Johnson, B. L. Beard, and F. Albarède (ed.), Geochemistry of Non-Traditional Stable Isotopes.
Washington: Mineralogical Society of America and Geochemical Society, pp. 197-230.
Chapter 1 - Introduction
24
Yoshida T, Ozaki T, Ohnuki T, Francis A (2004) Adsoprtion rate of rare earth elements by γ-Al2O3 and
Pseudomonas fluorescens cells in the presence of deferrioxamine B: implication of siderophores for
the Ce anomaly. Chemical Geology, 212, 239-246.
Zerkle AL, House CH, Cox RP, Canfield DE (2006) Metal limitation of cyanobacterial N2 fixation and
implications for the Precambrian nitrogen cycle. Geobiology, 4, 285–297.
Chapter 2 - Biomarkers at the microscopic range
25
2
Biomarkers at the microscopic range: ToF-SIMS molecular
imaging of Archaea-derived lipids in a microbial mat
Volker Thiel, Christine Heim, Gernot Arp, Uwe Hahmann, Peter Sjövall, and Jukka Lausmaa
Geobiology (2007) 5, 413-421
2.1 Abstract
Time-of-Flight Secondary Ion Mass Spectrometry (ToF-SIMS) with a Bismuth cluster primary ion
source was used for analysing microbial lipid biomarkers in 10 µm thick microscopic cryosections
of methanotrophic microbial mats from the Black Sea. Without further sample preparation,
archaeal isopranyl glycerol di- and tetraether core lipids, together with their intact diglycoside
(gentiobiosyl-) derivatives were simultaneously identified by exact mass determination. Utilizing
the imaging capability of ToF-SIMS, the spatial distributions of these biomarkers were mapped at a
lateral resolution of < 5µm in 500 x 500µm2 areas on the mat sections. Using Bi3+ cluster
projectiles in the burst alignment mode, it was possible to reach a lateral resolution of 1µm on an
area of 233µm x 233µm, thus approaching the typical size of microbial cells. These mappings
showed different 'provenances’ within the sections that are distinguished by individual lipid
fingerprints, namely (A) the diethers archaeol and hydroxyarchaeol co-occurring with glycerol
dialkyl glycerol tetraethers (GDGT), (B) hydroxyarchaeol and dihydroxyarchaeol, and (C) GDGT
and gentiobiosyl-GDGT. Because ToF-SIMS is a virtually non-destructive technique affecting only
the outermost layers of the sample surface (typically 10 - 100nm), it was possible to further
examine the studied areas using conventional microscopy, and associate the individual lipid
patterns with specific morphological traits. This showed that provenance (B) was frequently
associated with irregular, methane-derived CaCO3 crystallites, whereas provenance (C) revealed a
population of fluorescent, filamentous microorganisms showing the morphology of known
methanotrophic ANME-1 archaea. The direct coupling of organic (and inorganic) biomarker
analysis by imaging mass spectrometry with microscopic techniques reveals interesting
perspectives for the in in-situ study of environmental samples, and for the analysis of lipids in
geobiology, microbial ecology, and organic geochemistry. After further developing protocols for
handling different kinds of environmental samples, ToF-SIMS could be used as a tool to attack
many universal problems in these fields, such as the attribution of biological source(s) to particular
biomarkers in question, or the high-resolution tracking of biogeochemical processes in modern and
ancient natural environments.
Chapter 2 - Biomarkers at the microscopic range
26
2.2 Introduction
Time-of-Flight Secondary Ion Mass Spectrometry (ToF-SIMS) is a powerful analysis technique
that simultaneously detects inorganic and organic molecules on solid surfaces (Benninghoven,
1994; Chait and Standing, 1981; see Belu et al., 2003, for a recent review). Positively charged
primary ions are focussed to a beam that is scanned in a raster pattern over the sample surface. As a
result of the impact of these primary ions, charged particles (secondary ions) from the upper few
monolayers of the sample surface are ejected into vacuum. These secondary ions are separated by
their mass in a Time-of-flight (ToF) mass spectrometer. A most advantageous property of ToF-
SIMS is its ability to generate images displaying the intensities of any detected ion in a given area
of interest on the sample surface. Thereby, ToF-SIMS can achieve spatial resolution on a very
small scale (sub-µm, e.g. Hagenhoff, 2000), and at very small quantities (attomole level, e.g. Braun
et al., 1999; Kollmer, 2004), which is not possible with any of the extract-based techniques
routinely used in biomarker studies, namely GC/MS and LC/MS (coupled gas chromato-
graphy/mass spectrometry, coupled liquid chromatography/mass spectrometry). Although the
structural information that can be obtained by ToF-SIMS is limited due to the absence or as yet
sparse definition of mass spectral fragmentation patterns, sound compound identification can be
achieved through the precise mass determination of the molecular species, ideally in combination
with GC/MS and/or LC/MS data. However, the effects of molecular structure of the target
compounds, sample pre-treatment, surface conditions, and molecular environment on the
information generated by ToF-SIMS are still not well understood, and are a matter of intense
current research (e.g., Sostarecz et al., 2004).
After the introduction of new polyatomic cluster ion sources (e.g. Aun+, Bin
+, C60+) the analytical
window of ToF-SIMS has greatly been expanded towards the detection of biological molecules,
and studies have demonstrated the capability to analyse the spatial distribution of lipids in
mammalian tissue, and even in single eukaryotic cells (Fletcher et al., 2007; Nygren et al., 2005;
Ostrowski et al., 2004; Ostrowski et al., 2005; Sjövall et al., 2004; Touboul et al., 2005). Yet, the
potential of ToF-SIMS in geobiological and organic geochemical studies still remains to be
explored, as only few attempts have been made to identify the spectral properties of common
microbial and/or sedimentary biomarkers, namely from purified standards (Steele et al., 2001;
Toporski and Steele, 2004) and geological samples (Toporski et al., 2002; Guidry and Chafetz,
2003; Guidry and Chafetz, 2003).
As an experiment aiming to analyse environmental lipid biosignatures with ToF-SIMS, we used
methanotrophic microbial mats from methane seeps on the euxinic NW’ Black Sea shelf (Michaelis
et al., 2002). These mats are associated with reef-like carbonates that precipitate as a result of the
microbial anaerobic oxidation of methane by sulphate (AOM). Although the precise mechanisms of
AOM are still unclear, phylogenetically distinct methanotrophic archaea of the ANME-1 (Hinrichs
Chapter 2 - Biomarkers at the microscopic range
27
et al., 1999; ANME = anaerobic methane oxidizers) and ANME-2 (Boetius et al., 2000) clusters
and sulphate-reducing bacteria of the Desulfosarcina / Desulfococcus group are commonly
considered as the protagonists, according to the net reaction: CH4 + SO42- → HCO3
- + HS- + H2O.
For further details on the different aspects of the Black Sea microbial reefs, namely their
microbiology, structure and petrography, please refer to Knittel et al. (2005), Lein et al. (2002),
Michaelis et al., (2002), Peckmann et al. (2001), Pimenov and Ivanova (2005), Reitner et al.
(2005), Seifert et al., (2006), Tourova et al.(2002), Treude et al. (2005). Lipid biomarker patterns
from the Black Sea materials have been previously studied using GC/MS (Blumenberg et al., 2004;
Pape et al., 2005; Thiel et al., 2001).
In a recent pilot study we reported the ToF-SIMS spectral characteristics of archaeol/
hydroxyarchaeol and glycerol dialkyl glycerol tetraether lipids (GDGT, structures given in Fig. 2.1)
from solvent extracts of microbial mats, and discussed the principles, possibilities and limitations
of ToF-SIMS for the analysis of such systems (Thiel et al., 2007). These data showed good
agreement with previous GC/MS- and compound specific isotope studies on the Black Sea mats
that characterized these lipids as molecular fingerprints of methanotrophic archaea (Blumenberg et
al., 2004; Pape et al., 2005; Thiel et al., 2001). With the extract data as a reference, the archaeal
biosignature was identified by ToF-SIMS and its distribution imaged directly on the solid surface
of methane-derived carbonate (Thiel et al., 2007). To further explore the utility of ToF-SIMS for
visualizing biomarkers in geobiological samples, we here present a study on the distribution of
lipids in microscopic sections, i.e. at a µm-scale that resolves the typical size range of microbial
colonies in biofilms and microbial mats.
2.3 Materials and methods
Samples were obtained in September 2004 from the NW’ Black Sea shelf using the manned
submersible ‘Jago’ from aboard the German R/V ‘Poseidon’ (see acknowledgement). Carbonate
samples overgrown by microbial mats were taken in the 'GHOSTDABS' seep field (Michaelis et
al., 2002), from a tower-like carbonate structure at 230 m depth. Upon return of the submersible,
the samples were frozen at -20°C until further preparation.
In the laboratory, the surface of the carbonate sample was allowed to thaw. Pin head sized mat
samples showing intense, small scale intertwining of differently coloured mat types (grey, black,
pink) were taken from the carbonate surface, and mounted with tissue glue (Tissue Tek®) on a cork
disc acting as a sample holder. After snap freezing in methyl butane at -150°C for ~30 sec, the
samples where quickly transferred to a Leica CM 3050 S cryo-microtome kept at -20°C. 10 µm
thick serial sections were cut using a 25 cm Leica Profile D standard steel knife, which had been
thoroughly washed with organic solvents. The sections were placed on solvent-rinsed microscope
Chapter 2 - Biomarkers at the microscopic range
28
slides, and stored in a closed glass tray at -20°C until ToF-SIMS analysis. Prior to analysis, the tray
was allowed to warm up to room temperature before opening.
Without further treatment, the slides were inserted into a ToF-SIMS IV instrument (ION-TOF
GmbH, Münster, Germany) equipped with a bismuth liquid metal primary cluster ion source.
Spectra and images of positive and negative ions from the sample surfaces were recorded using 25
keV Bi3+ primary ions and low energy electron flooding for charge compensation. Mass spectra
were recorded with the instrument optimised for maximum mass resolution (so-called 'bunched
mode': m/Δm ~ 3000-6000), at a beam diameter of ~5 µm and a repetition rate of 5 kHz. During
acquisition, the primary ion beam (average pulsed current 0.1 pA) was scanned in a raster pattern
(128x128 pixels) over an analysis area of 500 x 500 µm2. High resolution images (233 x 233 µm2,
256 x 256 pixels) were obtained with the instrument in the so-called 'burst alignment mode', in
which a smaller focus of the primary ion beam is obtained (200-300 nm), however, at the expense
of significantly lower mass resolution (m/Δm ~ 350). The accumulated primary ion dose in all
analyses was kept below the so-called static limit of <1013 ions cm-2, beyond which significant
surface damage by the ion beam starts to occur. Spectra from the total analysis area or from
selected regions of interest, and images for selected ions were extracted from the recorded raw data
files using the instrument software.
Post-measurement microscopic investigations were performed using a Zeiss (Jena, Germany)
Axioplan epifluorescence microscope equipped with a high-pressure mercury arc lamp (Zeiss HBO
50) and differential interference contrast optics (DIC, Nomarski optics). Images were obtained with
a Peltier-cooled VISICAM-color CCD camera (PCO Computer Optics GmbH, Kehlheim,
Germany) attached to the microscope.
2.4 Results and discussion
An overview of the total area spectrum in the m/z 600 to m/z 1800 range obtained in positive ion
mode (i.e., positively charged secondary ions were recorded) from a mat section (BSX6-8) is
shown in Fig. 2.1. From 1316.3 to 1325.3 Da, a prominent cluster of 10 peaks occurred with each
peak separated from each other by 1 Da. Detailed inspection of the exact mass of the detected ions
and comparison of the measured with the theoretical isotope distributions identified these peaks as
sodium cationised ([M+Na]+) acyclic GDGT (GDGT 0, caldarchaeol, C86H172O6), and its mono- to
tetracyclic derivatives (GDGT 1-4, Table 2.1, Fig. 2.1b, see also Thiel et al., 2007).
The spectrum also contained a second peak cluster with a similar pattern at 1640.3 to 1649.4 Da
(Fig. 2.1c), which is in good agreement with the [M+Na]+ ions of gentiobiosyl-caldarchaeol
(C98H192O16) and its mono- to tetracyclic derivatives (referred to as gentiobiosyl-GDGT in the
following). These compounds represent the intact GDGT-based lipids with a disaccharide
headgroup consisting of gentobiose (β-D-Glucopyranosyl-(1-6)-D-glucose) (Koga et al., 1993b);
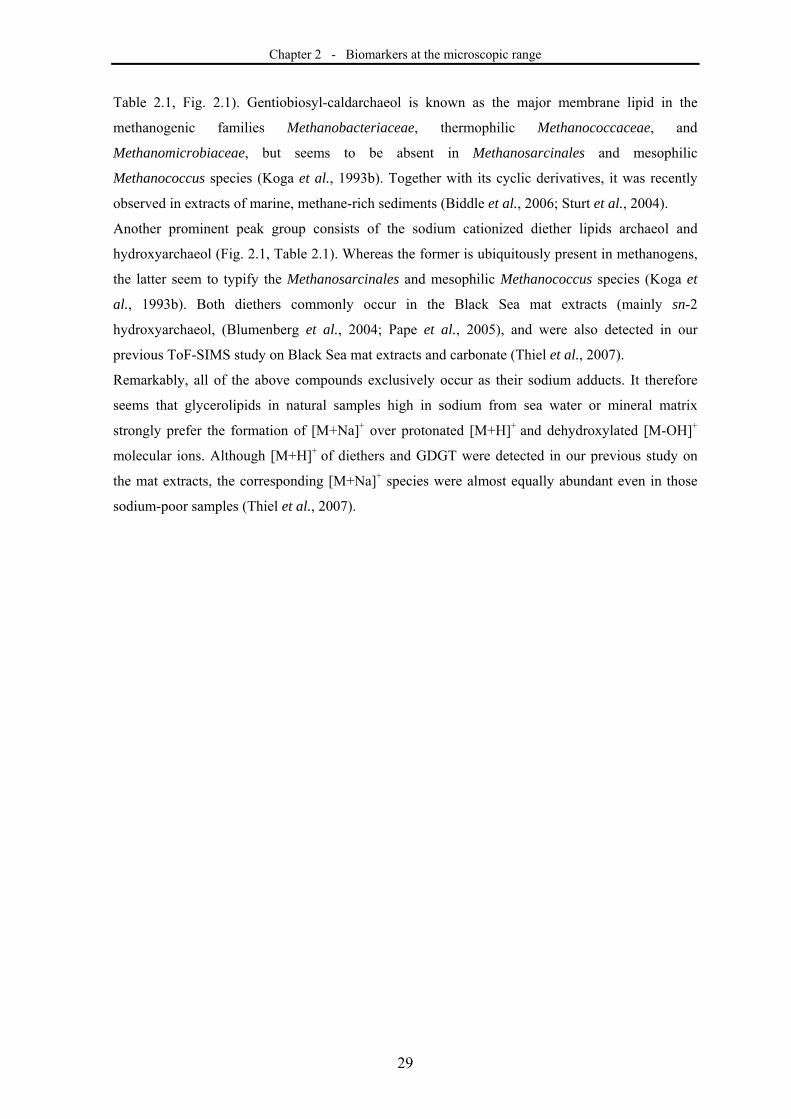
Chapter 2 - Biomarkers at the microscopic range
29
Table 2.1, Fig. 2.1). Gentiobiosyl-caldarchaeol is known as the major membrane lipid in the
methanogenic families Methanobacteriaceae, thermophilic Methanococcaceae, and
Methanomicrobiaceae, but seems to be absent in Methanosarcinales and mesophilic
Methanococcus species (Koga et al., 1993b). Together with its cyclic derivatives, it was recently
observed in extracts of marine, methane-rich sediments (Biddle et al., 2006; Sturt et al., 2004).
Another prominent peak group consists of the sodium cationized diether lipids archaeol and
hydroxyarchaeol (Fig. 2.1, Table 2.1). Whereas the former is ubiquitously present in methanogens,
the latter seem to typify the Methanosarcinales and mesophilic Methanococcus species (Koga et
al., 1993b). Both diethers commonly occur in the Black Sea mat extracts (mainly sn-2
hydroxyarchaeol, (Blumenberg et al., 2004; Pape et al., 2005), and were also detected in our
previous ToF-SIMS study on Black Sea mat extracts and carbonate (Thiel et al., 2007).
Remarkably, all of the above compounds exclusively occur as their sodium adducts. It therefore
seems that glycerolipids in natural samples high in sodium from sea water or mineral matrix
strongly prefer the formation of [M+Na]+ over protonated [M+H]+ and dehydroxylated [M-OH]+
molecular ions. Although [M+H]+ of diethers and GDGT were detected in our previous study on
the mat extracts, the corresponding [M+Na]+ species were almost equally abundant even in those
sodium-poor samples (Thiel et al., 2007).
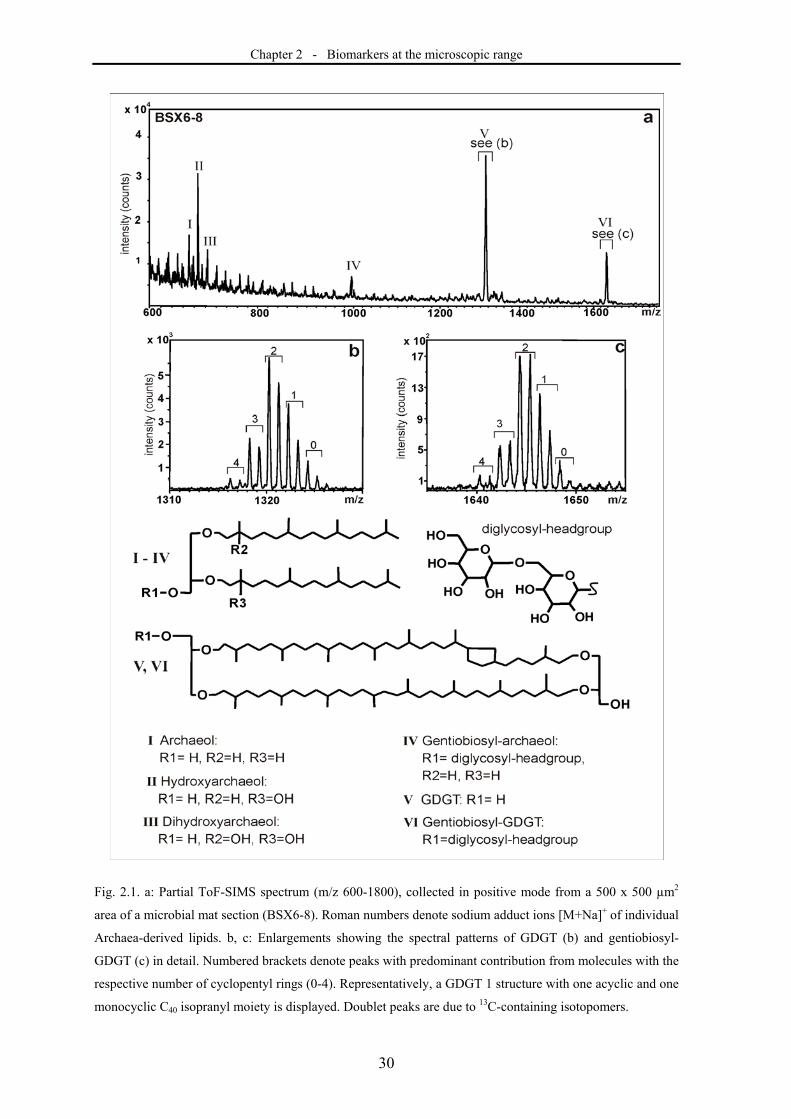
Chapter 2 - Biomarkers at the microscopic range
30
Fig. 2.1. a: Partial ToF-SIMS spectrum (m/z 600-1800), collected in positive mode from a 500 x 500 µm2
area of a microbial mat section (BSX6-8). Roman numbers denote sodium adduct ions [M+Na]+ of individual
Archaea-derived lipids. b, c: Enlargements showing the spectral patterns of GDGT (b) and gentiobiosyl-
GDGT (c) in detail. Numbered brackets denote peaks with predominant contribution from molecules with the
respective number of cyclopentyl rings (0-4). Representatively, a GDGT 1 structure with one acyclic and one
monocyclic C40 isopranyl moiety is displayed. Doublet peaks are due to 13C-containing isotopomers.
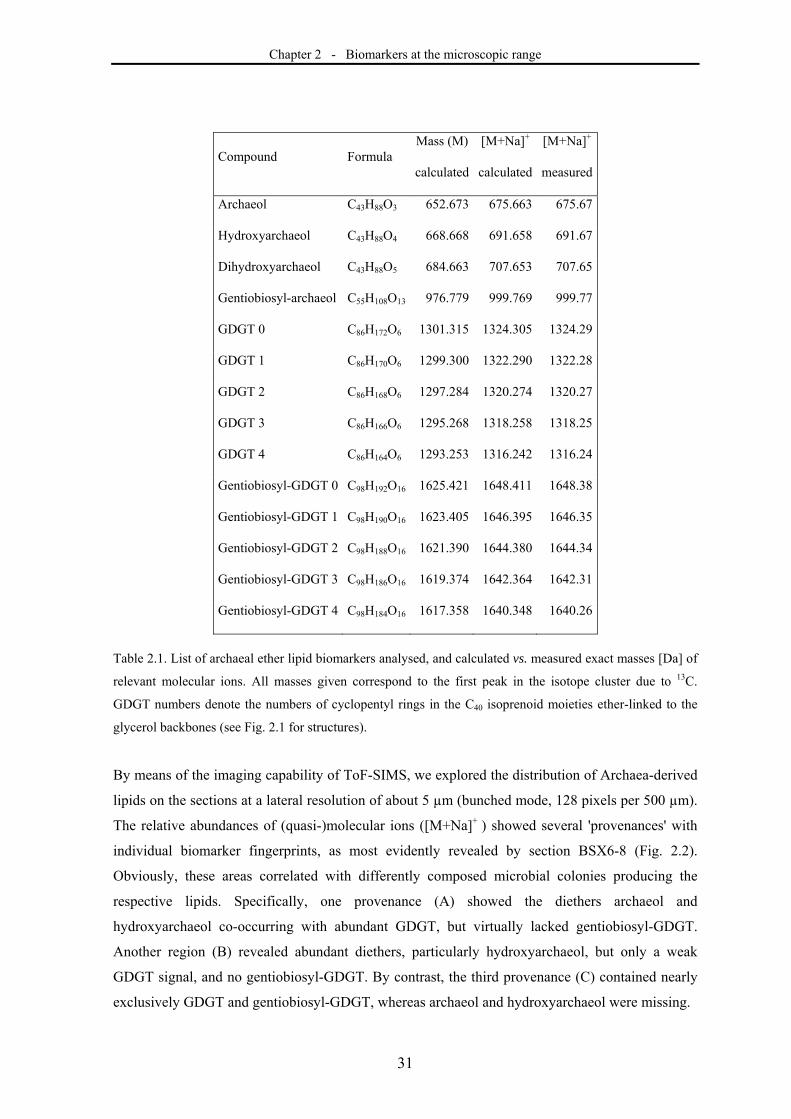
Chapter 2 - Biomarkers at the microscopic range
31
Compound Formula Mass (M)
calculated
[M+Na]+
calculated
[M+Na]+
measured
Archaeol C43H88O3 652.673 675.663 675.67
Hydroxyarchaeol C43H88O4 668.668 691.658 691.67
Dihydroxyarchaeol C43H88O5 684.663 707.653 707.65
Gentiobiosyl-archaeol C55H108O13 976.779 999.769 999.77
GDGT 0 C86H172O6 1301.315 1324.305 1324.29
GDGT 1 C86H170O6 1299.300 1322.290 1322.28
GDGT 2 C86H168O6 1297.284 1320.274 1320.27
GDGT 3 C86H166O6 1295.268 1318.258 1318.25
GDGT 4 C86H164O6 1293.253 1316.242 1316.24
Gentiobiosyl-GDGT 0 C98H192O16 1625.421 1648.411 1648.38
Gentiobiosyl-GDGT 1 C98H190O16 1623.405 1646.395 1646.35
Gentiobiosyl-GDGT 2 C98H188O16 1621.390 1644.380 1644.34
Gentiobiosyl-GDGT 3 C98H186O16 1619.374 1642.364 1642.31
Gentiobiosyl-GDGT 4 C98H184O16 1617.358 1640.348 1640.26
Table 2.1. List of archaeal ether lipid biomarkers analysed, and calculated vs. measured exact masses [Da] of
relevant molecular ions. All masses given correspond to the first peak in the isotope cluster due to 13C.
GDGT numbers denote the numbers of cyclopentyl rings in the C40 isoprenoid moieties ether-linked to the
glycerol backbones (see Fig. 2.1 for structures).
By means of the imaging capability of ToF-SIMS, we explored the distribution of Archaea-derived
lipids on the sections at a lateral resolution of about 5 µm (bunched mode, 128 pixels per 500 µm).
The relative abundances of (quasi-)molecular ions ([M+Na]+ ) showed several 'provenances' with
individual biomarker fingerprints, as most evidently revealed by section BSX6-8 (Fig. 2.2).
Obviously, these areas correlated with differently composed microbial colonies producing the
respective lipids. Specifically, one provenance (A) showed the diethers archaeol and
hydroxyarchaeol co-occurring with abundant GDGT, but virtually lacked gentiobiosyl-GDGT.
Another region (B) revealed abundant diethers, particularly hydroxyarchaeol, but only a weak
GDGT signal, and no gentiobiosyl-GDGT. By contrast, the third provenance (C) contained nearly
exclusively GDGT and gentiobiosyl-GDGT, whereas archaeol and hydroxyarchaeol were missing.
Chapter 2 - Biomarkers at the microscopic range
32
Fig. 2.2. Molecular ion images of the microbial mat sections (area of view: 500 x 500 µm2). The images
reveal cluster-like accumulations of archaeal biomarkers that relate to the distribution of individual microbial
populations. Similar to thermo-images, colours indicate the relative signal yield for selected lipids from
bright orange (= > 6 counts/pixel) to black (= no signal detected). * = (CaO)2H+ ion at 112.96 Da; ** =
sodium adduct ions ([M+Na]+). Areas A, B, and C on section BSX6-8P outline the biomarker provenances
discussed in the text. Control measurements of the blank glass slide surface next to section BSX6-8 and of
the embedding agent show the background signal levels: white, 1 count per pixel; black, no signal detected.
Additional measurements were performed in the burst alignment mode to approach the limits of the
lateral resolution feasible with ToF-SIMS. For the present samples this provided a lateral resolution
of about 1µm (256 pixels per 233 µm), i.e. in the typical size range of microbial cells, and
confirmed the distinctiveness of lipid biomarker traits, even on a very small spatial scale (Fig. 2.3).
For the microbial colony analysed, the data clearly confirmed that the prevailing, diether-producing
archaea are no concomitant source of GDGT. High resolution measurements are, however, time
consuming, and the considerable loss of mass resolution in the burst alignment mode requires
thorough knowledge of the samples lipid inventory in order to avoid misidentifications. Using the
ToF-SIMS instrument software, additional information can be obtained by defining regions of
interest, from which individual mass spectra can be extracted from the raw data.
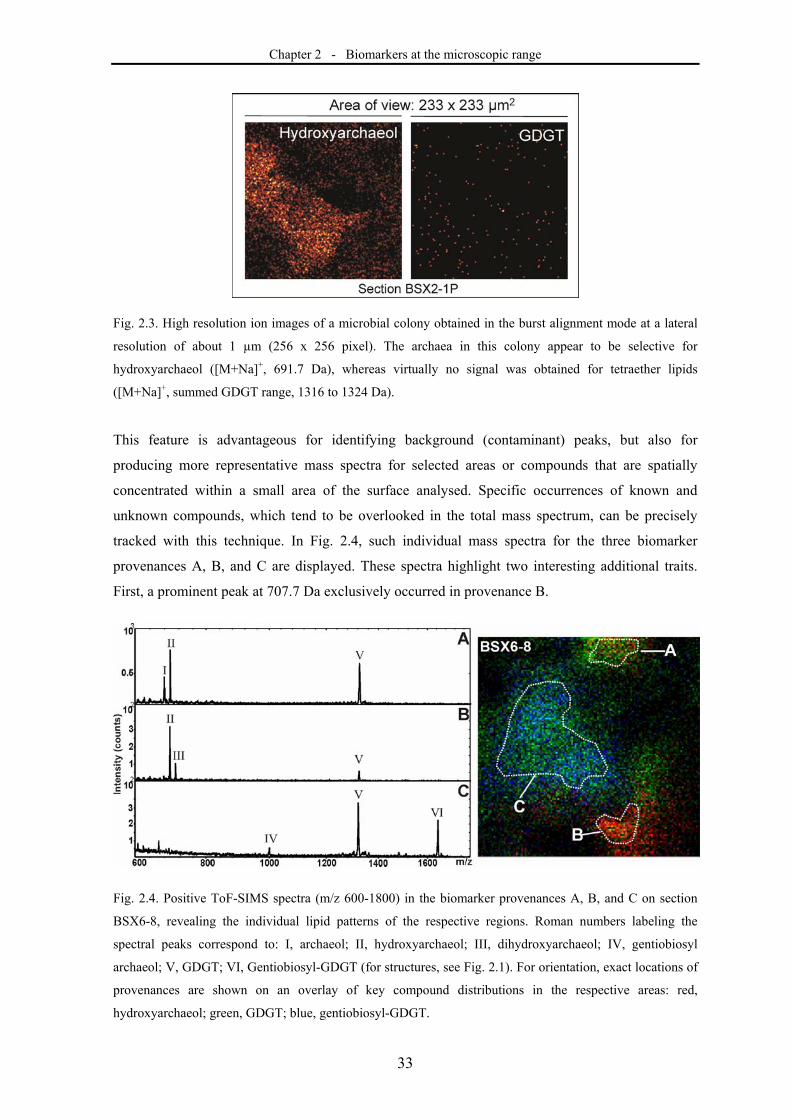
Chapter 2 - Biomarkers at the microscopic range
33
Fig. 2.3. High resolution ion images of a microbial colony obtained in the burst alignment mode at a lateral
resolution of about 1 µm (256 x 256 pixel). The archaea in this colony appear to be selective for
hydroxyarchaeol ([M+Na]+, 691.7 Da), whereas virtually no signal was obtained for tetraether lipids
([M+Na]+, summed GDGT range, 1316 to 1324 Da).
This feature is advantageous for identifying background (contaminant) peaks, but also for
producing more representative mass spectra for selected areas or compounds that are spatially
concentrated within a small area of the surface analysed. Specific occurrences of known and
unknown compounds, which tend to be overlooked in the total mass spectrum, can be precisely
tracked with this technique. In Fig. 2.4, such individual mass spectra for the three biomarker
provenances A, B, and C are displayed. These spectra highlight two interesting additional traits.
First, a prominent peak at 707.7 Da exclusively occurred in provenance B.
Fig. 2.4. Positive ToF-SIMS spectra (m/z 600-1800) in the biomarker provenances A, B, and C on section
BSX6-8, revealing the individual lipid patterns of the respective regions. Roman numbers labeling the
spectral peaks correspond to: I, archaeol; II, hydroxyarchaeol; III, dihydroxyarchaeol; IV, gentiobiosyl
archaeol; V, GDGT; VI, Gentiobiosyl-GDGT (for structures, see Fig. 2.1). For orientation, exact locations of
provenances are shown on an overlay of key compound distributions in the respective areas: red,
hydroxyarchaeol; green, GDGT; blue, gentiobiosyl-GDGT.
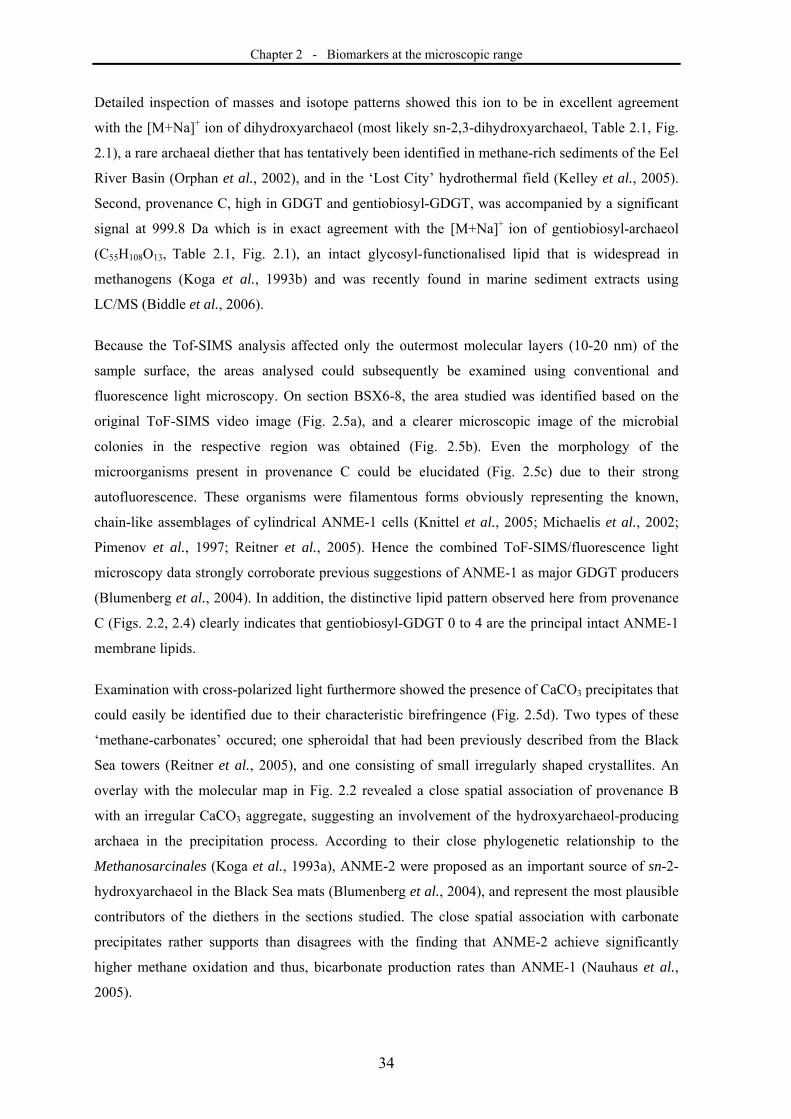
Chapter 2 - Biomarkers at the microscopic range
34
Detailed inspection of masses and isotope patterns showed this ion to be in excellent agreement
with the [M+Na]+ ion of dihydroxyarchaeol (most likely sn-2,3-dihydroxyarchaeol, Table 2.1, Fig.
2.1), a rare archaeal diether that has tentatively been identified in methane-rich sediments of the Eel
River Basin (Orphan et al., 2002), and in the ‘Lost City’ hydrothermal field (Kelley et al., 2005).
Second, provenance C, high in GDGT and gentiobiosyl-GDGT, was accompanied by a significant
signal at 999.8 Da which is in exact agreement with the [M+Na]+ ion of gentiobiosyl-archaeol
(C55H108O13, Table 2.1, Fig. 2.1), an intact glycosyl-functionalised lipid that is widespread in
methanogens (Koga et al., 1993b) and was recently found in marine sediment extracts using
LC/MS (Biddle et al., 2006).
Because the Tof-SIMS analysis affected only the outermost molecular layers (10-20 nm) of the
sample surface, the areas analysed could subsequently be examined using conventional and
fluorescence light microscopy. On section BSX6-8, the area studied was identified based on the
original ToF-SIMS video image (Fig. 2.5a), and a clearer microscopic image of the microbial
colonies in the respective region was obtained (Fig. 2.5b). Even the morphology of the
microorganisms present in provenance C could be elucidated (Fig. 2.5c) due to their strong
autofluorescence. These organisms were filamentous forms obviously representing the known,
chain-like assemblages of cylindrical ANME-1 cells (Knittel et al., 2005; Michaelis et al., 2002;
Pimenov et al., 1997; Reitner et al., 2005). Hence the combined ToF-SIMS/fluorescence light
microscopy data strongly corroborate previous suggestions of ANME-1 as major GDGT producers
(Blumenberg et al., 2004). In addition, the distinctive lipid pattern observed here from provenance
C (Figs. 2.2, 2.4) clearly indicates that gentiobiosyl-GDGT 0 to 4 are the principal intact ANME-1
membrane lipids.
Examination with cross-polarized light furthermore showed the presence of CaCO3 precipitates that
could easily be identified due to their characteristic birefringence (Fig. 2.5d). Two types of these
‘methane-carbonates’ occured; one spheroidal that had been previously described from the Black
Sea towers (Reitner et al., 2005), and one consisting of small irregularly shaped crystallites. An
overlay with the molecular map in Fig. 2.2 revealed a close spatial association of provenance B
with an irregular CaCO3 aggregate, suggesting an involvement of the hydroxyarchaeol-producing
archaea in the precipitation process. According to their close phylogenetic relationship to the
Methanosarcinales (Koga et al., 1993a), ANME-2 were proposed as an important source of sn-2-
hydroxyarchaeol in the Black Sea mats (Blumenberg et al., 2004), and represent the most plausible
contributors of the diethers in the sections studied. The close spatial association with carbonate
precipitates rather supports than disagrees with the finding that ANME-2 achieve significantly
higher methane oxidation and thus, bicarbonate production rates than ANME-1 (Nauhaus et al.,
2005).
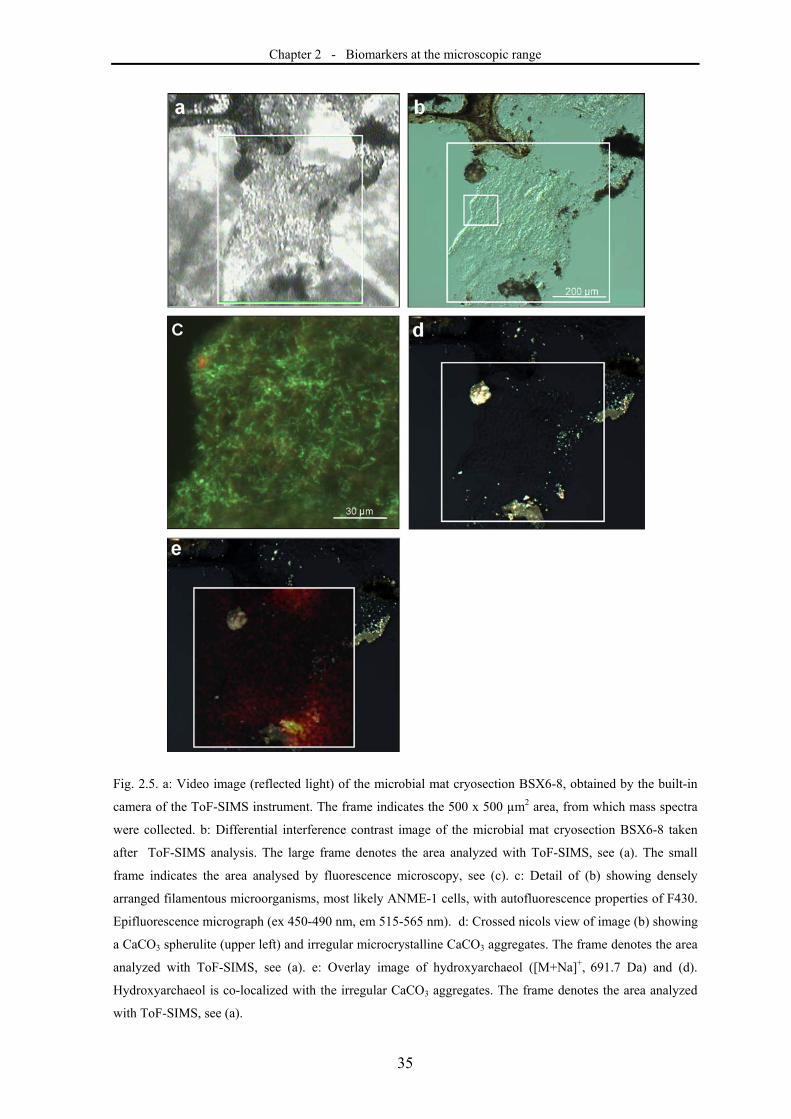
Chapter 2 - Biomarkers at the microscopic range
35
Fig. 2.5. a: Video image (reflected light) of the microbial mat cryosection BSX6-8, obtained by the built-in
camera of the ToF-SIMS instrument. The frame indicates the 500 x 500 µm2 area, from which mass spectra
were collected. b: Differential interference contrast image of the microbial mat cryosection BSX6-8 taken
after ToF-SIMS analysis. The large frame denotes the area analyzed with ToF-SIMS, see (a). The small
frame indicates the area analysed by fluorescence microscopy, see (c). c: Detail of (b) showing densely
arranged filamentous microorganisms, most likely ANME-1 cells, with autofluorescence properties of F430.
Epifluorescence micrograph (ex 450-490 nm, em 515-565 nm). d: Crossed nicols view of image (b) showing
a CaCO3 spherulite (upper left) and irregular microcrystalline CaCO3 aggregates. The frame denotes the area
analyzed with ToF-SIMS, see (a). e: Overlay image of hydroxyarchaeol ([M+Na]+, 691.7 Da) and (d).
Hydroxyarchaeol is co-localized with the irregular CaCO3 aggregates. The frame denotes the area analyzed
with ToF-SIMS, see (a).
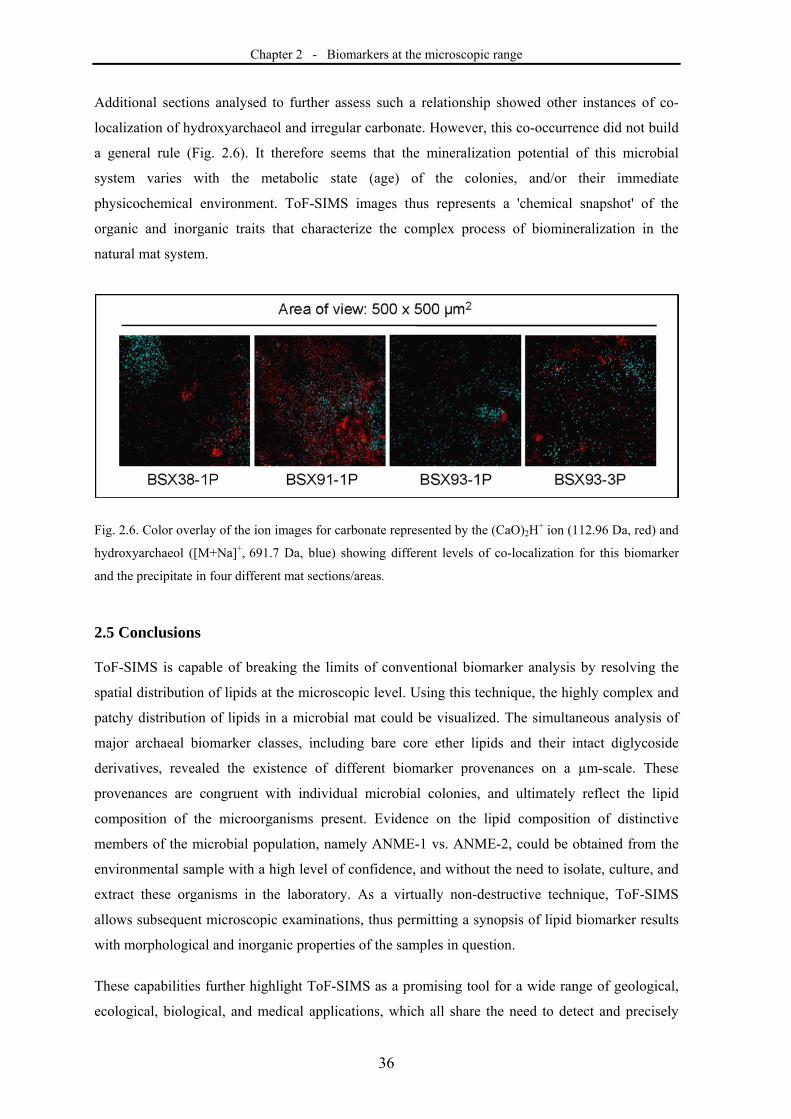
Chapter 2 - Biomarkers at the microscopic range
36
Additional sections analysed to further assess such a relationship showed other instances of co-
localization of hydroxyarchaeol and irregular carbonate. However, this co-occurrence did not build
a general rule (Fig. 2.6). It therefore seems that the mineralization potential of this microbial
system varies with the metabolic state (age) of the colonies, and/or their immediate
physicochemical environment. ToF-SIMS images thus represents a 'chemical snapshot' of the
organic and inorganic traits that characterize the complex process of biomineralization in the
natural mat system.
Fig. 2.6. Color overlay of the ion images for carbonate represented by the (CaO)2H+ ion (112.96 Da, red) and
hydroxyarchaeol ([M+Na]+, 691.7 Da, blue) showing different levels of co-localization for this biomarker
and the precipitate in four different mat sections/areas.
2.5 Conclusions
ToF-SIMS is capable of breaking the limits of conventional biomarker analysis by resolving the
spatial distribution of lipids at the microscopic level. Using this technique, the highly complex and
patchy distribution of lipids in a microbial mat could be visualized. The simultaneous analysis of
major archaeal biomarker classes, including bare core ether lipids and their intact diglycoside
derivatives, revealed the existence of different biomarker provenances on a µm-scale. These
provenances are congruent with individual microbial colonies, and ultimately reflect the lipid
composition of the microorganisms present. Evidence on the lipid composition of distinctive
members of the microbial population, namely ANME-1 vs. ANME-2, could be obtained from the
environmental sample with a high level of confidence, and without the need to isolate, culture, and
extract these organisms in the laboratory. As a virtually non-destructive technique, ToF-SIMS
allows subsequent microscopic examinations, thus permitting a synopsis of lipid biomarker results
with morphological and inorganic properties of the samples in question.
These capabilities further highlight ToF-SIMS as a promising tool for a wide range of geological,
ecological, biological, and medical applications, which all share the need to detect and precisely
Chapter 2 - Biomarkers at the microscopic range
37
localize organic compounds in natural systems. Potential geobiological applications include the
elucidation of microbially assisted mineral precipitation, the analysis of organic compounds in
unculturable microorganisms, and the clear-cut assignment of biomarkers to their biological source.
Acknowledgements
We are grateful to Richard Seifert and Walter Michaelis (IfBM, Institute for Biogeochemistry and
Marine Chemistry, University of Hamburg), who initiated and coordinated the joint project BEBOP
through which the microbial mats studied here were retrieved (Biogeochemistry and Microbiology
of Bioherms Prospering in the Black Sea; R/V Poseidon cruise PO 317/2). We also wish to
acknowledge two anonymous reviewers for their critical feedback on the original manuscript. We
further thank Martin Blumenberg (IfBM) and Jan Toporski (WITec, Ulm) for thoughtful scientific
comments, Christine Flies (University of Göttingen) for on-board sampling and logistic support,
Jakob Malm (SP, Borås) for assistance in the lab and introduction into the ToF-SIMS software,
Joachim Reitner (University of Göttingen) for sub-project coordination and helpful scientific
discussions, Walter Schulz-Schaeffer (University Hospital of Göttingen) for helpful advise
pertaining to sample preparation, and Oliver Stückrad (University of Göttingen) for assisting on-
board sampling. Our study received financial support from the German Research Foundation
(DFG) through grants Th 713/4 and FOR 571, the University of Hamburg (joint project BEBOP,
see above), and the Swedish Governmental Agency for Innovation Systems (VINNOVA). This is
publication No. 14 of the DFG Research Unit FOR 571 'Geobiology of Organo- and Biofilms'.
Chapter 2 - Biomarkers at the microscopic range
38
References
Belu AM, Graham DJ, Castner DG (2003) Time-of-flight secondary ion mass spectrometry: techniques and
applications for the characterization of biomaterial surfaces. Biomaterials, 24, 3635-3653.
Benninghoven A (1994) Chemical Analysis of Inorganic and Organic Surfaces and Thin Films by Static
Time-of-Flight Secondary Ion Mass Spectrometry (ToF-SIMS). Angewandte Chemie International
Edition in English, 33, 1023-1043.
Biddle JF, Lipp JS, Lever MA, Lloyd KG, Sorensen KB, Anderson R, Fredricks HF, Elvert M, Kelly TJ,
Schrag DP, Sogin ML, Brenchley JE, Teske A, House CH, Hinrichs K-U (2006) Heterotrophic
Archaea dominate sedimentary subsurface ecosystems off Peru. Proceedings of the National Academy
of Sciences of the United States of America, 103, 3846-3851.
Blumenberg M, Seifert R, Reitner J, Pape T, Michaelis W (2004) Membrane lipid patterns typify distinct
anaerobic methanotrophic consortia. Proceedings of the National Academy of Sciences of the United
States of America, 101, 11111-11116.
Boetius A, Ravenschlag K, Schubert CJ, Rickert D, Widdel F, Gieseke A, Amann R, Jørgensen BB, Witte U,
Pfannkuche O (2000) A marine microbial consortium apparently mediating anaerobic oxidation of
methane. Nature, 407, 623-626.
Braun RM, Beyder A, Xu J, Wood MC, Ewing AG, Winograd N (1999) Spatially Resolved Detection of
Attomole Quantities of Organic Molecules Localized in Picoliter Vials Using Time-of-Flight
Secondary Ion Mass Spectrometry. Analytical Chemistry, 71, 3318-3324.
Chait BT, Standing KG (1981) A time-of-flight mass spectrometer for measurement of secondary ion mass
spectra. International Journal of Mass Spectrometry and Ion Physics, 40, 185-193.
Fletcher JS, Lockyer NP, Vaidyanathan S, Vickerman JC (2007) ToF-SIMS 3D biomolecular imaging of
Xenopus laevis oocytes using Buckminsterfullerene (C60) primary ions. Analytical Chemistry, 79,
2199-2206
Guidry SA, Chafetz HS (2003) Depositional facies and diagenetic alteration in a relict siliceous hot-spring
accumulation: examples from Yellowstone National Park, U.S.A. Journal of Sedimentary Research,
73, 806-823.
Hagenhoff B (2000) High resolution surface analysis by TOF-SIMS. Mikrochimica Acta, 132, 259-271.
Hinrichs K-U, Hayes JM, Sylva SP, Brewer PG, DeLong EF (1999) Methane-consuming archaebacteria in
marine sediments Nature 398, 802-805.
Kelley DS, Karson JA, Fruh-Green GL, Yoerger DR, Shank TM, Butterfield DA, Hayes JM, Schrenk MO,
Olson EJ, Proskurowski G, Jakuba M, Bradley A, Larson B, Ludwig K, Glickson D, Buckman K,
Bradley AS, Brazelton WJ, Roe K, Elend MJ, Delacour A, Bernasconi SM, Lilley MD, Baross JA,
Summons RE, Sylva SP (2005) A Serpentinite-Hosted Ecosystem: The Lost City Hydrothermal Field.
Science, 307, 1428-1434.
Knittel K, Losekann T, Boetius A, Kort R, Amann R (2005) Diversity and Distribution of Methanotrophic
Archaea at Cold Seeps. Applied and Environmental Microbiology, 71, 467-479.
Koga Y, Akagawa-Matsushita M, Ohga M, Nishihara M (1993a) Taxonomic significance of the distribution
of component parts of polar ether lipids in methanogens. Systematic and Applied Microbiology, 16,
342-351.
Chapter 2 - Biomarkers at the microscopic range
39
Koga Y, Nishihara M, Morii H, Akagawa-Matsushita M (1993b) Ether polar lipids of methanogenic bacteria:
structures, comparative aspects, and biosyntheses. Microbiological Reviews, 57, 164-182.
Kollmer F (2004) Cluster primary ion bombardment of organic materials. Applied Surface Science, 231-232,
153-158.
Lein AY, Ivanov MV, Pimenov NV, Gulin MB (2002) Geochemical characteristics of the carbonate
constructions formed during microbial oxidation of methane under anaerobic conditions.
Microbiology, 71, 78-90.
Michaelis W, Seifert R, Nauhaus K, Treude T, Thiel V, Blumenberg M, Knittel K, Gieseke A, Peterknecht K,
Pape T, Boetius A, Amann R, Jørgensen BB, Widdel F, Peckmann J, Pimenov NV, Gulin MB (2002)
Microbial reefs in the Black Sea fueled by anaerobic oxidation of methane. Science, 297, 1013-1015.
Nauhaus K, Treude T, Boetius A, Kruger M (2005) Environmental regulation of the anaerobic oxidation of
methane: a comparison of ANME-I and ANME-II communities. Environmental Microbiology, 7, 98-
106.
Nygren H, Borner K, Hagenhoff B, Malmberg P, Mansson J-E (2005) Localization of cholesterol
phosphocholine and galactosylceramide in rat cerebellar cortex with imaging TOF-SIMS equipped
with a bismuth cluster ion source. Biochimica et Biophysica Acta (BBA) - Molecular and Cell Biology
of Lipids, 1737, 102-110.
Orphan V, House CH, Hinrichs KU, McKeegan KD, DeLong EF (2002) Multiple archaeal groups mediate
methane oxidation in anoxic cold seep sediments. Proceedings of the National Academy of Sciences of
the United States of America, 99, 7663-7668.
Ostrowski SG, Bell CTV, Winograd N, Ewing AG (2004) Mass spectrometric imaging of highly curved
membranes during Tetrahymena mating. Science, 305, 71-73.
Ostrowski SG, Szakal C, Kozole J, Roddy TP, Xu J, Ewing AG, Winograd N (2005) Secondary Ion MS
Imaging of Lipids in Picoliter Vials with a Buckminsterfullerene Ion Source. Analytical Chemistry, 77,
6190-6196.
Pape T, Blumenberg M, Seifert R, Egorov VN, Gulin SB, Michaelis W (2005) Lipid geochemistry of
methane-seep-related Black Sea carbonates. Palaeogeography, Palaeoclimatology, Palaeoecology,
227, 31-47.
Peckmann J, Reimer A, Luth U, Luth C, Hansen BT, Heinicke C, Hoefs J, Reitner J (2001) Methane-derived
carbonates and authigenic pyrite from the northwestern Black Sea. Marine Geology, 177, 129-150.
Pimenov N, Ivanova AE (2005) Anaerobic methane oxidation and sulfate reduction in bacterial mats on
coral-like carbonate structures in the Black Sea. Microbiology (translated from Mikrobiologiya), 74,
362–370.
Pimenov NV, Rusanov II, Poglazova MN, Mityushina LL, Sorokin DY, Khmelenina VN, Trotsenko YA
(1997) Bacterial mats on coral-like structures at methane seeps in the Black Sea. Microbiology
(Translated from Mikrobiologiya), 66, 354-360.
Reitner J, Peckmann J, Reimer A, Schumann G, Thiel V (2005) Methane-derived carbonate build-ups and
associated microbial communities at cold seeps on the lower Crimean shelf (Black Sea). Facies, 51,
66-79.
Chapter 2 - Biomarkers at the microscopic range
40
Seifert R, Nauhaus K, Blumenberg M, Kruger M, Michaelis W (2006) Methane dynamics in a microbial
community of the Black Sea traced by stable carbon isotopes in vitro. Organic Geochemistry, 37,
1411-1419.
Sjövall P, Lausmaa J, Johansson B (2004) High-resolution mass-spectrometric imaging of lipids in brain
tissue. Analytical Chemistry, 76, 4271-4278.
Sostarecz AG, Cannon DM jr, McQuaw CM, Sun S, Ewing AG, Winograd N (2004) Influence of molecular
environment on the analysis of phospholipids by time-of-flight secondary ion mass spectrometry.
Langmuir, 20), 4926-4932.
Steele A, Toporski JKW, Avci R, Guidry S, McKay DS (2001) Time of flight secondary ion mass
spectrometry (ToFSIMS) of a number of hopanoids. Organic Geochemistry, 32, 905-911.
Sturt HF, Summons RE, Smith K, Elvert M, Hinrichs K-U (2004) Intact polar membrane lipids in
prokaryotes and sediments deciphered by high-performance liquid chromatography/ electrospray
ionization multistage mass spectrometry—new biomarkers for biogeochemistry and microbial
ecology. Rapid Communications in Mass Spectrometry, 18, 617–628.
Thiel V, Peckmann J, Richnow HH, Luth U, Reitner J, Michaelis W (2001) Molecular signals for anaerobic
methane oxidation in Black Sea seep carbonates and a microbial mat. Marine Chemistry, 73, 97-112.
Thiel V, Toporski J, Schumann G, Sjövall P, Lausmaa J (2007) Analysis of archaeal core ether lipids using
Time of Flight - Secondary Ion Mass Spectrometry (ToF-SIMS): Exploring a new prospect for the
study of biomarkers in geobiology. Geobiology, 5, 75-83.
Toporski J, Steele A (2004) Characterization of purified biomarker compounds using time of flight-
secondary ion mass spectrometry (ToF-SIMS). Organic Geochemistry, 35, 793-811.
Toporski J, Steele A, Westall F, Avci R, Martill M, McKay DS (2002) Morphological and spectral
investigation of exceptionally well preserved bacterial biofilms from the Oligocene Enspel formation,
Germany. Geochimica et Cosmochimica Acta, 66, 1773-1791.
Touboul D, Brunelle A, Halgand F, De La Porte S, Laprevote O (2005) Lipid imaging by gold cluster time-
of-flight secondary ion mass spectrometry: application to Duchenne muscular dystrophy. Journal of
Lipid Research, 46, 1388-1395.
Tourova TP, Kolganova TP, Kusnetsov KB, Pimenov N (2002) Phylogenetic diversity of the Archaeal
component of bacterial mats on coral-like structures in zones of methane seeps in the Black Sea.
Microbiology (Translated from Mikrobiologiya), 71, 196-201.
Treude T, Knittel K, Blumenberg M, Seifert R, Boetius A (2005) Subsurface Microbial Methanotrophic Mats
in the Black Sea. Applied and Environmental Microbiology, 71, 6375-6378.
Chapter 3 - Organic geochemical microanalysis
41
3
Organic geochemical microanalysis by time-of-flight
secondary ion mass spectrometry (ToF-SIMS)
Peter Sjövall, Volker Thiel, Sandra Siljeström, Christine Heim, Tomas Hode, Jukka Lausmaa
Geostandards and Geoanalytical Research (2008) 32, 268-277
3.1 Abstract
Time-of-flight secondary ion mass spectrometry (ToF-SIMS) is a powerful method for chemical
analysis of solid surfaces. In this paper, the capabilities and limitations of this technique and the
potential for its use in geochemical research is outlined. Using ToF-SIMS, the chemical
composition of sample structures down to 10 – 100 µm can be determined, without the need for
preselection or labeling of the analysed substances. In addition, the lateral distribution of organic
and inorganic compounds can be mapped in geochemical samples at a resolution in the micrometer
range. The capabilities of the technique in geochemistry are illustrated by two examples. In the first
example, it is shown that ToF-SIMS can be used to detect biomarkers in oil samples, making it a
promising method for the analysis of biomarkers in fluid inclusions. In the second example, a
number of specific lipid biomarkers were identified and mapped on the surface of a microbial mat
cryosection surface. Post-measurement optical microscopy correlated the localisation of the lipids
with the presence of methanotrophic archaea in the microbial mat.
3.2 Introduction
Information about organic molecules in geological samples is not easily accessed at a high
chemical specificity and at a spatial resolution in the micrometer range, primarily because of
limitations in the techniques used for organic analysis. Mass spectrometric methods like GC/MS
and LC/MS provide excellent tools for identifying and quantifying organic substances in geological
samples. However, as these methods require solvent extraction, the spatial origin of the different
substances within the sample cannot be specified. Microscopy can be used to characterise and
identify organic material in geological samples at high spatial resolution but, in this case, the
chemical specificity is limited to optically active or labeled compounds. Time-of-flight secondary
ion mass spectrometry (ToF-SIMS) offers a method that combines the two analytical approaches,
namely mass spectrometric detection, providing chemical specificity, and high spatial resolution
Chapter 3 - Organic geochemical microanalysis
42
(Benninghoven, 1994; Pacholski and Winograd, 1999; Sodhi, 2004). ToF-SIMS has been used for
chemical surface analysis in a number of application areas during the last 10-20 years, including
semiconductor and polymer characterisation (Belu et al., 2003; Vickerman and Briggs, 2001).
Recently, instrument developments have improved the method considerably for organic analysis,
providing new opportunities for analysis of biological materials (Kollmer, 2004; Sjovall et al.,
2004; Touboul et al., 2004; Touboul et al., 2005). Other methods for imaging mass spectrometry
which are presently experiencing intense development include imaging matrix assisted laser
desorption ionisation (MALDI) (Cornett et al., 2007) and desorption electrospray ionisation (DESI)
(Takats et al., 2004).
The objective of the present paper is to provide a brief overview of the capabilities and limitations
of ToF-SIMS as an analysis tool in organic geochemical research. After a general discussion of
ToF-SIMS, the capabilities of the technique are illustrated by two examples from our laboratory,
namely (i) analysis of biomarkers in oils and (ii) analysis of archaeal lipids in microbial mats. In
the first example, the work is aimed at developing a technique for biomarker analysis of single
fluid inclusions in rock samples, utilising the capability of ToF-SIMS to analyse microscopic
sample amounts (Siljeström et al., 2008). In the second example, the lateral distribution of source-
specific archaeal lipids and inorganic components in microbial mats are mapped in order to
examine simultaneously the spatial distribution of specific organisms, their organic inventory and
biomineralisation mechanisms (Thiel et al., 2007a, 2007b).
3.3 Capabilities and limitations of ToF-SIMS
3.3.1 ToF-SIMS technique
ToF-SIMS is based on the SIMS principle, in which a focused beam of high energy ions (primary
ions) bombards the sample surface in a vacuum, causing atoms, molecular fragments and intact
molecules to be ejected from the sample surface. Some of the ejected particles will be ionised
(secondary ions) and these ions are extracted into a mass analyser, where they are separated with
respect to their mass-to-charge ratio. Identification of the secondary ions provides detailed
information about the chemical composition of the sample surface at the specific spot bombarded
by the primary ion beam. By scanning the primary ion beam over a selected area on the sample
surface, ionspecific images are obtained showing the lateral distribution of the different chemical
components on the sample surface. Since only particles originating from the outermost molecular
layers of the sample can be ejected during the SIMS process, the secondary ions provide chemical
information exclusively about the surface region of the sample (1-10 nm). Furthermore, mixing
between different chemical species within the interaction volume (approximately 5 nm diameter) of
Chapter 3 - Organic geochemical microanalysis
43
the primary ion with the surface may occur, giving rise to secondary ions composed of atomic
species from one or several chemical compounds originally located within the interaction volume.
In a ToF-SIMS instrument, the primary ions are applied in short duration pulses and the secondary
ions are analysed in a time-of-flight detector. With this setup, all secondary ions produced from a
specific spot bombarded by a primary ion pulse are detected in parallel and an entire mass spectrum
from each pixel may be stored in the resulting data file. This allows the extraction of selected ion
images and spectra from selected regions of interest or from the total analysis area. Another
important advantage of this setup is that it allows for so called static SIMS conditions, which is a
requirement for obtaining detailed molecular information on the surface chemical composition.
Since the primary ions cause severe fragmentation of the molecules remaining at the collision site
after the collision, the molecular information is gradually lost in the recorded mass spectrum as a
significant fraction of the surface becomes damaged by the primary ions.
In static SIMS, the data acquisition is therefore terminated before the accumulated primary ion
dose density has reached the so called static limit, 1012–1013 ions cm-2, which is the dose density
at which changes in the mass spectrum due to primary ion induced molecular damage typically
start to be significant. The main advantage of static SIMS is thus its capabilitity to provide detailed
molecular information of organic substances up to 10,000 Da. In dynamic SIMS, primary ion dose
densities well beyond the static limit are applied, usually with a continuous primary ion beam,
which means that the analysis is done on a molecularly damaged and continuously eroding surface.
Consequently, the information in dynamic SIMS is restricted to elements, isotopes and small
fragments. However, since one is no longer limited by the static SIMS requirements, the sensitivity
and image resolution can be considerably higher in dynamic SIMS as compared to static SIMS.
A number of important properties of ToF-SIMS and typical values of instrument specifications are
listed in Table 3.1. The stated numbers are typical values for the type of instrument used in our
laboratory (TOF-SIMS IV, manufactured by ION-TOF GmbH, Münster, Germany). The
capabilities of the other types of instruments currently in use are very similar and the table
therefore provides representative values of the present state-of-the- art capabilities of ToF-SIMS.
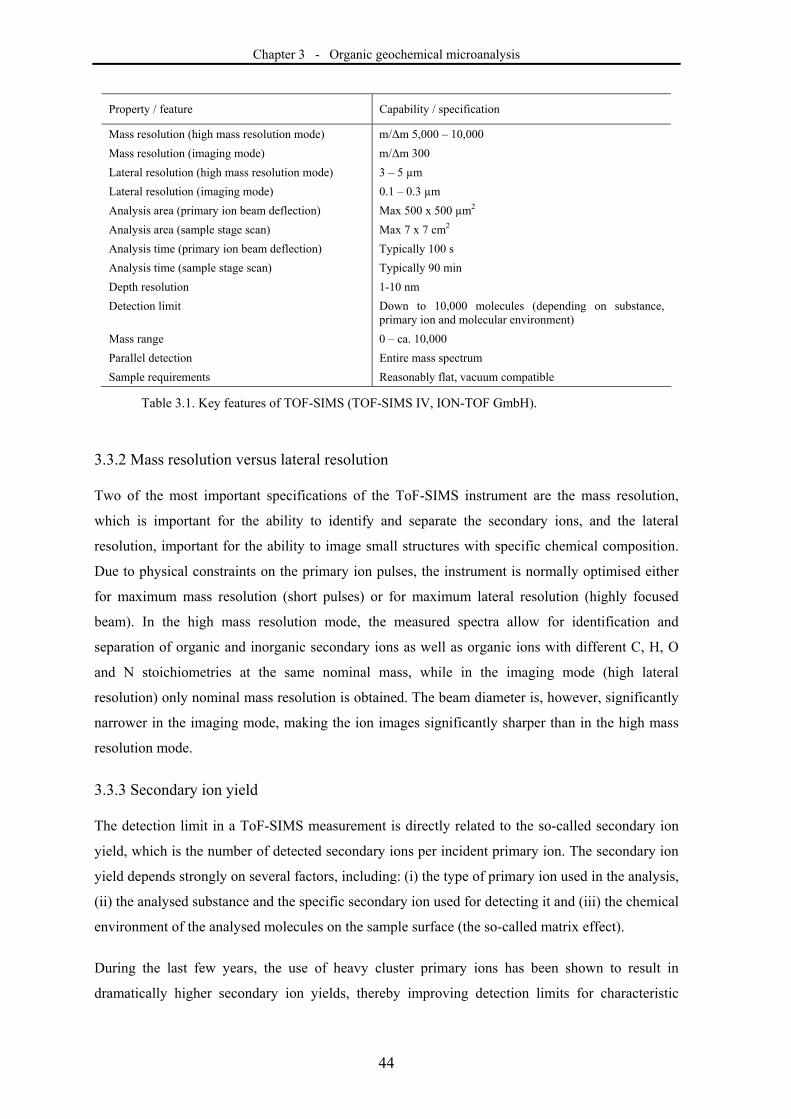
Chapter 3 - Organic geochemical microanalysis
44
Property / feature Capability / specification
Mass resolution (high mass resolution mode) m/Δm 5,000 – 10,000
Mass resolution (imaging mode) m/Δm 300
Lateral resolution (high mass resolution mode) 3 – 5 µm
Lateral resolution (imaging mode) 0.1 – 0.3 µm
Analysis area (primary ion beam deflection) Max 500 x 500 µm2
Analysis area (sample stage scan) Max 7 x 7 cm2
Analysis time (primary ion beam deflection) Typically 100 s
Analysis time (sample stage scan) Typically 90 min
Depth resolution 1-10 nm
Detection limit Down to 10,000 molecules (depending on substance, primary ion and molecular environment)
Mass range 0 – ca. 10,000
Parallel detection Entire mass spectrum
Sample requirements Reasonably flat, vacuum compatible
Table 3.1. Key features of TOF-SIMS (TOF-SIMS IV, ION-TOF GmbH).
3.3.2 Mass resolution versus lateral resolution
Two of the most important specifications of the ToF-SIMS instrument are the mass resolution,
which is important for the ability to identify and separate the secondary ions, and the lateral
resolution, important for the ability to image small structures with specific chemical composition.
Due to physical constraints on the primary ion pulses, the instrument is normally optimised either
for maximum mass resolution (short pulses) or for maximum lateral resolution (highly focused
beam). In the high mass resolution mode, the measured spectra allow for identification and
separation of organic and inorganic secondary ions as well as organic ions with different C, H, O
and N stoichiometries at the same nominal mass, while in the imaging mode (high lateral
resolution) only nominal mass resolution is obtained. The beam diameter is, however, significantly
narrower in the imaging mode, making the ion images significantly sharper than in the high mass
resolution mode.
3.3.3 Secondary ion yield
The detection limit in a ToF-SIMS measurement is directly related to the so-called secondary ion
yield, which is the number of detected secondary ions per incident primary ion. The secondary ion
yield depends strongly on several factors, including: (i) the type of primary ion used in the analysis,
(ii) the analysed substance and the specific secondary ion used for detecting it and (iii) the chemical
environment of the analysed molecules on the sample surface (the so-called matrix effect).
During the last few years, the use of heavy cluster primary ions has been shown to result in
dramatically higher secondary ion yields, thereby improving detection limits for characteristic
Chapter 3 - Organic geochemical microanalysis
45
molecular ions of organic substances as compared to the previously used atomic primary ions.
Among the cluster ion sources, Aun+ and Bin
+ are so-called liquid metal ion guns (LMIG), making
it possible to obtain beams with a narrow focus (down to < 100 nm), while with the C60+
(buckminsterfullerene) cluster sources the ion beam can not easily be focused to a beam diameter
below 1 μm without severe sacrifice in the beam current. The Aun+ and Bin
+ sources thus provide
superior imaging capabilities. A recently discovered advantageous property of using C60+ as
primary ions, however, is that some of the molecular information can be retained in the organic
material also after extensive bombardment by C60+ ions. This makes C60+ a promising sputtering
projectile for ion etching (depth profiling) of organic materials (Wucher et al., 2007). Secondary
ion yields vary over several orders of magnitude between different substances and specific
secondary ions. In favourable cases, the detection limit of large, molecule-specific organic ions can
be in the range of 104 molecules (Kollmer, 2004). This is approximately the number of molecules
contained in a single molecular layer within a surface area of 100 x 100 nm2. However, for other
substances, moleculespecific secondary ions may show a much lower secondary ion yield in the
spectrum, making it necessary to use other, less specific secondary ions to probe the presence of a
particular substance (or type of substance) on the sample surface.
Due to the limited number of molecules present in small areas of a sample surface, the lateral
resolution that can be obtained in the ion images is closely related to the secondary ion yield. In
order to obtain an image with a certain lateral resolution, e.g., 100 nm, the secondary ion yield must
be sufficiently high to provide a significant signal within a surface area of the same length scale,
e.g., 100 x 100 nm2. The ultimate lateral resolution that can be obtained can thus be limited either
by the ion yield of the selected secondary ion or the focal width of the primary ion beam.
3.3.4 Sample preparation
Sample preparation is critical in ToF-SIMS analysis for several reasons. Firstly, the surface
sensitivity of the technique has two important consequences; (i) the material to be analysed must be
exposed on the sample surface and (ii) even very low amounts of contaminants present on the
sample surface may affect the results significantly. Therefore, it is necessary that the sample is
stored and handled under very clean conditions. Preferably, the sample surface should be prepared
(e.g., by cutting or fracture) immediately prior to analysis. Secondly, the sample must be
compatible with vacuum, which means that water-containing samples must be dried (or frozen) and
that the analysis of volatile substances requires cooling. If the lateral distribution is to be
investigated, it is also important to prevent migration of the chemical components during
preparation of the sample. In case of biological materials, such as cells, primitive organisms or
tissues, the vacuum compatibility is particularly critical since most biological structures are stable
only in an aqueous environment. In addition, methods that may cause chemical rearrangements in
Chapter 3 - Organic geochemical microanalysis
46
the sample, such as chemical fixation and the use of embedding media should be avoided or
applied only with great caution. Strategies that have been used typically include plunge freezing for
cryofixation and then either freeze drying at controlled temperatures (Kraft et al., 2006: Prinz et al.,
2007) or freeze fracturing and analysis in the hydrated state (Cannon et al., 2000).
The samples are mounted on specially designed sample holders and inserted into the ToF-SIMS
vacuum chamber via a load lock, allowing the start of analysis within 5 min after initial evacuation
of the load lock. Apart from the requirements of vacuum compatibility and minimising surface
contamination, no additional sample preparation is typically needed. It is important, however, that
the topography of the sample surface is minimised, as surface topography adds contrast to the ion
images and also often deteriorates the mass resolution in the acquired spectra. Furthermore,
charging of insulating sample materials resulting from the primary ion bombardment has to be
compensated for. This is typically achieved by electron flooding of the sample using a low energy
electron source.
3.4 Experimental 3.4.1 Preparation of biomarker reference and oil samples
The following samples were prepared for ToF-SIMS analysis:
1. Reference material of 5β(H),14α(H),17α(H)- cholestane (20R) purchased from Chiron AS,
Norway (further referred to as “cholestane”),
2. Crude oil (Miocene, California, USA),
3. Saturate hydrocarbon fraction separated from the above crude oil.
The cholestane reference sample was dissolved in isooctane at a concentration of 0.1 mg ml-1. In a
laminar air flow chamber, a small droplet (10 μl) was deposited on a ~ 1 cm2 piece of ozone-
cleaned Si wafer and allowed to dry immediately before analysis. The saturate hydrocarbon
fraction was separated from the crude oil by column chromatography over silica gel (Merck silica
gel 60) using three column volumes of pre-distilled n-hexane. The resulting fraction was
concentrated in a stream of nitrogen. Immediately before ToF-SIMS analysis, the saturate
hydrocarbon fraction and unfractionated crude oil samples were deposited on separate Si substrates
by dissolving them in heptane (0.3 mg μl-1) and, for each sample, allowing a 2 μl droplet to dry on
the Si substrate surface.
3.4.2 Preparation of microbial mat cryosections
Microbial mat samples were taken from tower-like carbonate structures forming at methane seeps
on the NW Black Sea shelf (230 m water depth). In anoxic waters, these carbonates are precipitated
Chapter 3 - Organic geochemical microanalysis
47
as a result of the microbial anaerobic oxidation of methane by sulfate, in a concerted mechanism
involving methanotrophic archaea and sulfate-reducing bacteria (see Michaelis et al., 2002 and
Reitner et al., 2005 for details). Pin-head-sized mat samples were cut out from the surface of the
collected carbonate samples and mounted with tissue glue (Tissue Tek®, O.C.T. Compound,
Sakura Finetek B.V., Zouterwoude, The Netherlands) on a cork disk substrate (Thiel et al., 2007a).
The sample was plunge frozen in methyl butane at -150 °C for ~ 30 s and immediately transferred
to a cryomicrotome kept at -20 °C (Leica CM 3050 S, Leica Microsystems, Wetzlar, Germany).
Serial thin sections (10 μm) were cut using a thoroughly solvent-cleaned 300 mm standard steel
knife, placed on solvent-rinsed glass slides and stored in a closed glass tray at -20 °C until ToF-
SIMS analysis. Prior to analysis, the tray was allowed to thaw to room temperature before opening.
The glass slides were then mounted on the ToF-SIMS sample holder and analysed at room
temperature.
3.4.3 Equipment and analysis procedures
ToF-SIMS analyses were carried out in a TOF-SIMS IV instrument (ION-TOF GmbH, Münster,
Germany) equipped with a bismuth cluster primary ion source. Positive and negative ion spectra
were recorded using 25 keV Bi3+ primary ions and electron flooding for charge compensation. The
instrument was optimised for high mass resolution (bunched mode, M/ΔM ~ 3000-6000, where
ΔM is the full width at half maximum of a peak at ion mass m, normally in the m/z 25-40 range) at
a beam diameter of ~ 5 μm, a repetition rate of 5 kHz and a pulsed primary ion current of 0.1-0.2
pA. During analysis, the primary ion beam was scanned in a raster pattern and data were acquired
in 128 x 128 pixels over an analysis area of 500 x 500 μm2 for the microbial mat samples and 200 x
200 μm2 for the oil samples. The analysis time was typically 2-5 min for each spectrum/image
acquisition. The accumulated primary ion dose density was kept below the static limit of 1012 ions
cm-2.
After ToF-SIMS, optical microscopy of the microbial mat cryosections was carried out using a
Zeiss (Jena, Germany) Axioplan epifluorescence microscope equipped with a Peltier-cooled
VISICAM-colour CCD camera (PCO Computer Optics GmbH, Kehlheim, Germany).
3.5 Results and discussion
3.5.1 Biomarkers in oil
The purpose of this study was to investigate whether biomarkers in natural oils could be detected
using ToF-SIMS. This was initially done by recording ToF-SIMS spectra from a pure biomarker
reference sample (cholestane), in order to identify mass fragments that are characteristic of the
biomarker. Subsequently, the oil samples were investigated for the presence of cholestane using the
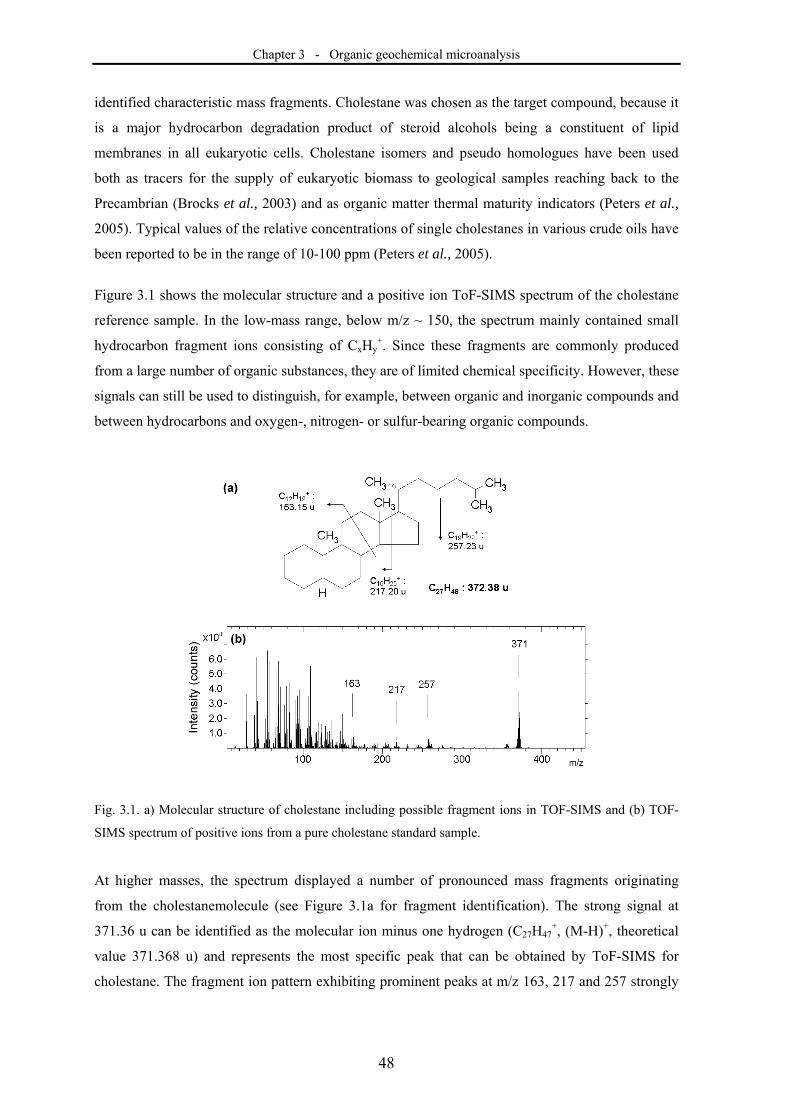
Chapter 3 - Organic geochemical microanalysis
48
identified characteristic mass fragments. Cholestane was chosen as the target compound, because it
is a major hydrocarbon degradation product of steroid alcohols being a constituent of lipid
membranes in all eukaryotic cells. Cholestane isomers and pseudo homologues have been used
both as tracers for the supply of eukaryotic biomass to geological samples reaching back to the
Precambrian (Brocks et al., 2003) and as organic matter thermal maturity indicators (Peters et al.,
2005). Typical values of the relative concentrations of single cholestanes in various crude oils have
been reported to be in the range of 10-100 ppm (Peters et al., 2005).
Figure 3.1 shows the molecular structure and a positive ion ToF-SIMS spectrum of the cholestane
reference sample. In the low-mass range, below m/z ~ 150, the spectrum mainly contained small
hydrocarbon fragment ions consisting of CxHy+. Since these fragments are commonly produced
from a large number of organic substances, they are of limited chemical specificity. However, these
signals can still be used to distinguish, for example, between organic and inorganic compounds and
between hydrocarbons and oxygen-, nitrogen- or sulfur-bearing organic compounds.
Fig. 3.1. a) Molecular structure of cholestane including possible fragment ions in TOF-SIMS and (b) TOF-
SIMS spectrum of positive ions from a pure cholestane standard sample.
At higher masses, the spectrum displayed a number of pronounced mass fragments originating
from the cholestanemolecule (see Figure 3.1a for fragment identification). The strong signal at
371.36 u can be identified as the molecular ion minus one hydrogen (C27H47+, (M-H)+, theoretical
value 371.368 u) and represents the most specific peak that can be obtained by ToF-SIMS for
cholestane. The fragment ion pattern exhibiting prominent peaks at m/z 163, 217 and 257 strongly
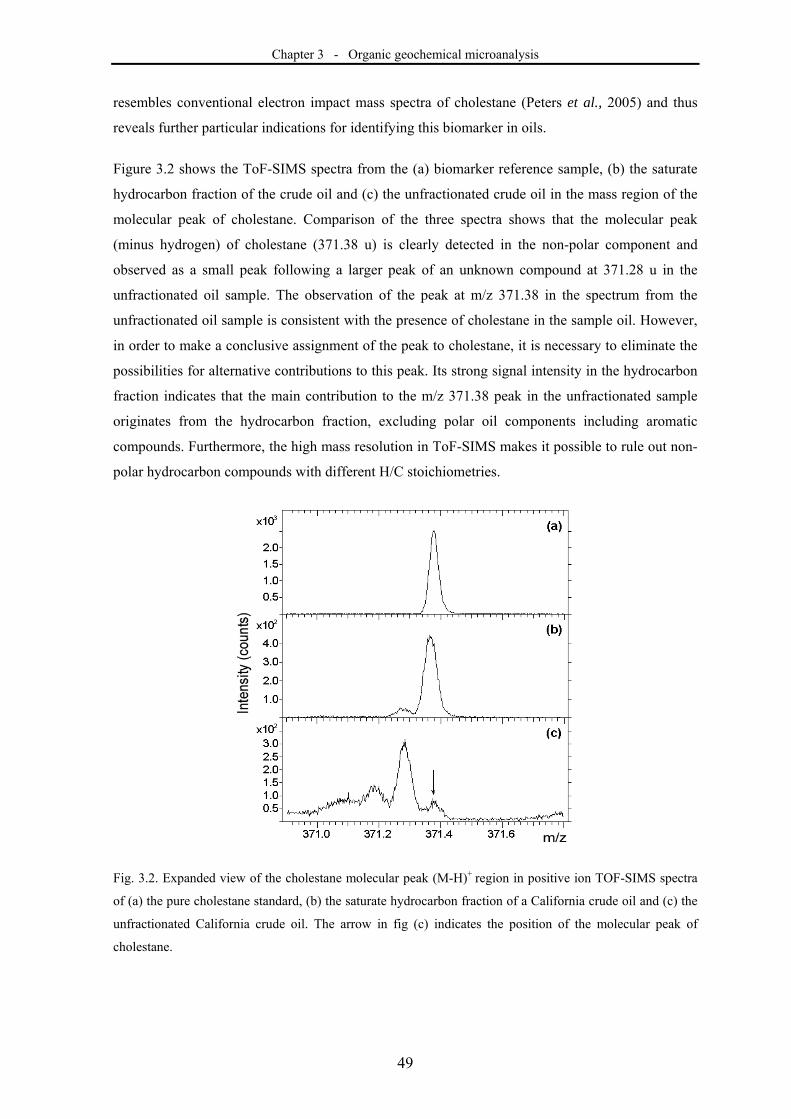
Chapter 3 - Organic geochemical microanalysis
49
resembles conventional electron impact mass spectra of cholestane (Peters et al., 2005) and thus
reveals further particular indications for identifying this biomarker in oils.
Figure 3.2 shows the ToF-SIMS spectra from the (a) biomarker reference sample, (b) the saturate
hydrocarbon fraction of the crude oil and (c) the unfractionated crude oil in the mass region of the
molecular peak of cholestane. Comparison of the three spectra shows that the molecular peak
(minus hydrogen) of cholestane (371.38 u) is clearly detected in the non-polar component and
observed as a small peak following a larger peak of an unknown compound at 371.28 u in the
unfractionated oil sample. The observation of the peak at m/z 371.38 in the spectrum from the
unfractionated oil sample is consistent with the presence of cholestane in the sample oil. However,
in order to make a conclusive assignment of the peak to cholestane, it is necessary to eliminate the
possibilities for alternative contributions to this peak. Its strong signal intensity in the hydrocarbon
fraction indicates that the main contribution to the m/z 371.38 peak in the unfractionated sample
originates from the hydrocarbon fraction, excluding polar oil components including aromatic
compounds. Furthermore, the high mass resolution in ToF-SIMS makes it possible to rule out non-
polar hydrocarbon compounds with different H/C stoichiometries.
Fig. 3.2. Expanded view of the cholestane molecular peak (M-H)+ region in positive ion TOF-SIMS spectra
of (a) the pure cholestane standard, (b) the saturate hydrocarbon fraction of a California crude oil and (c) the
unfractionated California crude oil. The arrow in fig (c) indicates the position of the molecular peak of
cholestane.
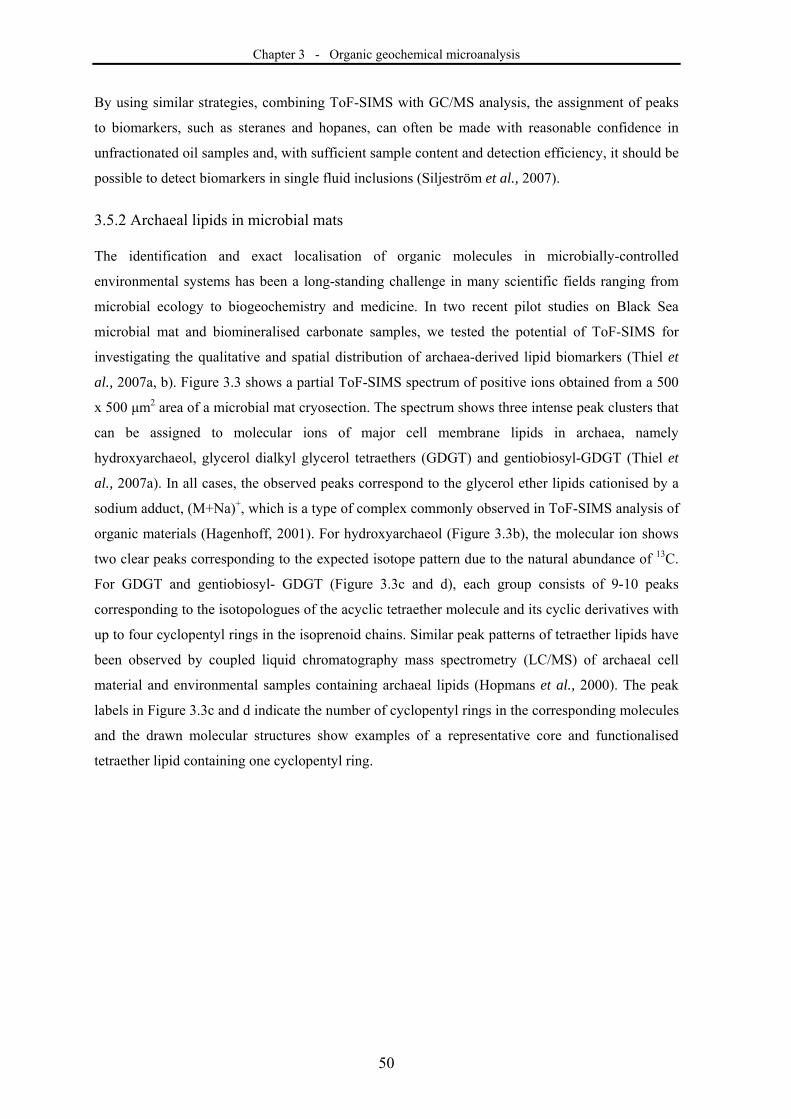
Chapter 3 - Organic geochemical microanalysis
50
By using similar strategies, combining ToF-SIMS with GC/MS analysis, the assignment of peaks
to biomarkers, such as steranes and hopanes, can often be made with reasonable confidence in
unfractionated oil samples and, with sufficient sample content and detection efficiency, it should be
possible to detect biomarkers in single fluid inclusions (Siljeström et al., 2007).
3.5.2 Archaeal lipids in microbial mats
The identification and exact localisation of organic molecules in microbially-controlled
environmental systems has been a long-standing challenge in many scientific fields ranging from
microbial ecology to biogeochemistry and medicine. In two recent pilot studies on Black Sea
microbial mat and biomineralised carbonate samples, we tested the potential of ToF-SIMS for
investigating the qualitative and spatial distribution of archaea-derived lipid biomarkers (Thiel et
al., 2007a, b). Figure 3.3 shows a partial ToF-SIMS spectrum of positive ions obtained from a 500
x 500 μm2 area of a microbial mat cryosection. The spectrum shows three intense peak clusters that
can be assigned to molecular ions of major cell membrane lipids in archaea, namely
hydroxyarchaeol, glycerol dialkyl glycerol tetraethers (GDGT) and gentiobiosyl-GDGT (Thiel et
al., 2007a). In all cases, the observed peaks correspond to the glycerol ether lipids cationised by a
sodium adduct, (M+Na)+, which is a type of complex commonly observed in ToF-SIMS analysis of
organic materials (Hagenhoff, 2001). For hydroxyarchaeol (Figure 3.3b), the molecular ion shows
two clear peaks corresponding to the expected isotope pattern due to the natural abundance of 13C.
For GDGT and gentiobiosyl- GDGT (Figure 3.3c and d), each group consists of 9-10 peaks
corresponding to the isotopologues of the acyclic tetraether molecule and its cyclic derivatives with
up to four cyclopentyl rings in the isoprenoid chains. Similar peak patterns of tetraether lipids have
been observed by coupled liquid chromatography mass spectrometry (LC/MS) of archaeal cell
material and environmental samples containing archaeal lipids (Hopmans et al., 2000). The peak
labels in Figure 3.3c and d indicate the number of cyclopentyl rings in the corresponding molecules
and the drawn molecular structures show examples of a representative core and functionalised
tetraether lipid containing one cyclopentyl ring.
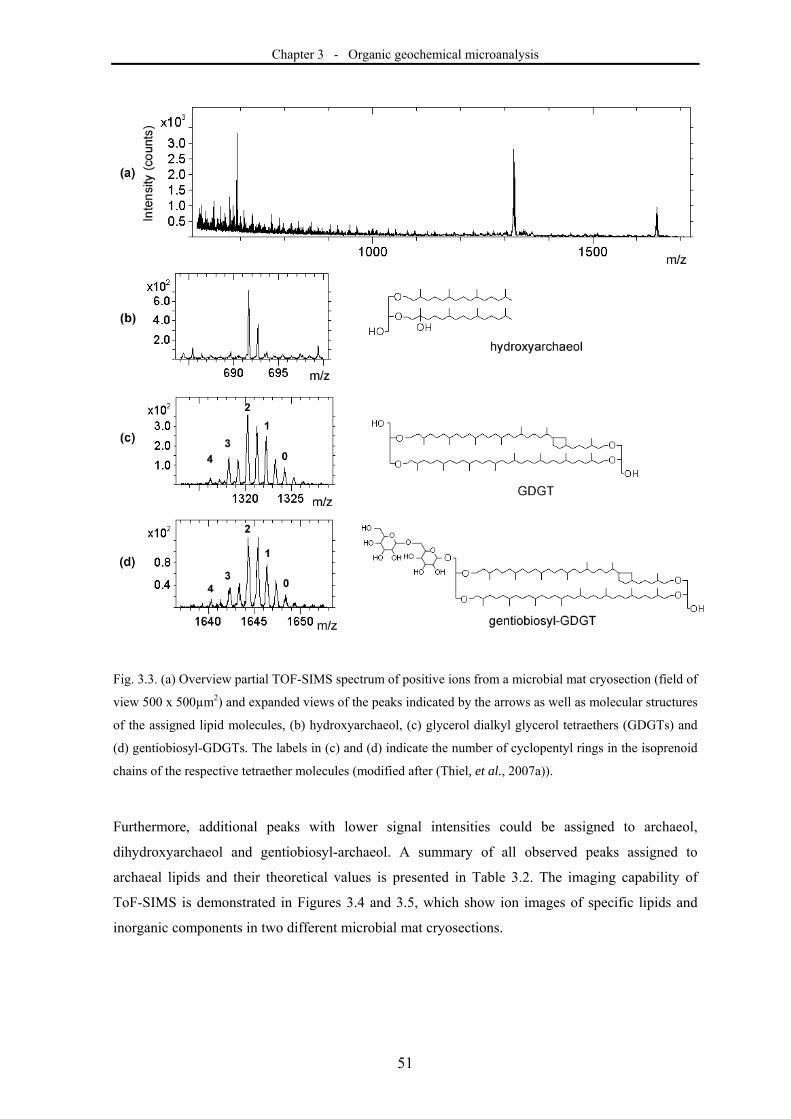
Chapter 3 - Organic geochemical microanalysis
51
Fig. 3.3. (a) Overview partial TOF-SIMS spectrum of positive ions from a microbial mat cryosection (field of
view 500 x 500µm2) and expanded views of the peaks indicated by the arrows as well as molecular structures
of the assigned lipid molecules, (b) hydroxyarchaeol, (c) glycerol dialkyl glycerol tetraethers (GDGTs) and
(d) gentiobiosyl-GDGTs. The labels in (c) and (d) indicate the number of cyclopentyl rings in the isoprenoid
chains of the respective tetraether molecules (modified after (Thiel, et al., 2007a)).
Furthermore, additional peaks with lower signal intensities could be assigned to archaeol,
dihydroxyarchaeol and gentiobiosyl-archaeol. A summary of all observed peaks assigned to
archaeal lipids and their theoretical values is presented in Table 3.2. The imaging capability of
ToF-SIMS is demonstrated in Figures 3.4 and 3.5, which show ion images of specific lipids and
inorganic components in two different microbial mat cryosections.
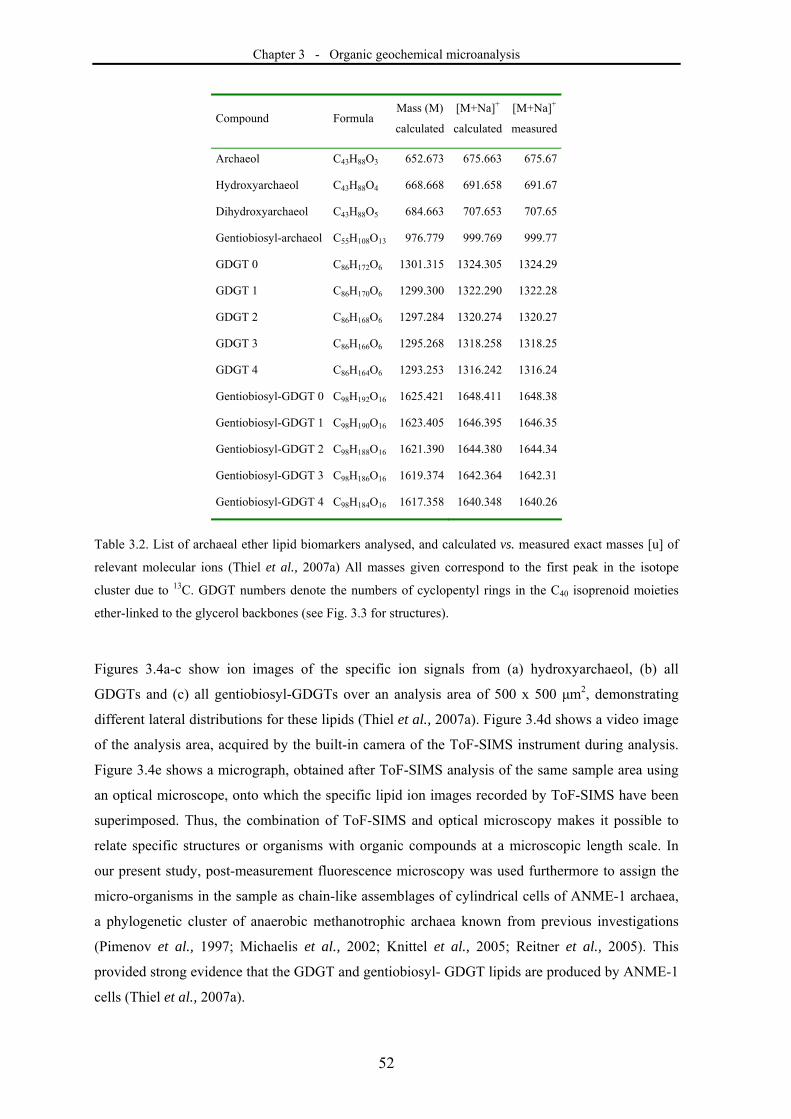
Chapter 3 - Organic geochemical microanalysis
52
Compound Formula Mass (M)
calculated
[M+Na]+
calculated
[M+Na]+
measured
Archaeol C43H88O3 652.673 675.663 675.67
Hydroxyarchaeol C43H88O4 668.668 691.658 691.67
Dihydroxyarchaeol C43H88O5 684.663 707.653 707.65
Gentiobiosyl-archaeol C55H108O13 976.779 999.769 999.77
GDGT 0 C86H172O6 1301.315 1324.305 1324.29
GDGT 1 C86H170O6 1299.300 1322.290 1322.28
GDGT 2 C86H168O6 1297.284 1320.274 1320.27
GDGT 3 C86H166O6 1295.268 1318.258 1318.25
GDGT 4 C86H164O6 1293.253 1316.242 1316.24
Gentiobiosyl-GDGT 0 C98H192O16 1625.421 1648.411 1648.38
Gentiobiosyl-GDGT 1 C98H190O16 1623.405 1646.395 1646.35
Gentiobiosyl-GDGT 2 C98H188O16 1621.390 1644.380 1644.34
Gentiobiosyl-GDGT 3 C98H186O16 1619.374 1642.364 1642.31
Gentiobiosyl-GDGT 4 C98H184O16 1617.358 1640.348 1640.26
Table 3.2. List of archaeal ether lipid biomarkers analysed, and calculated vs. measured exact masses [u] of
relevant molecular ions (Thiel et al., 2007a) All masses given correspond to the first peak in the isotope
cluster due to 13C. GDGT numbers denote the numbers of cyclopentyl rings in the C40 isoprenoid moieties
ether-linked to the glycerol backbones (see Fig. 3.3 for structures).
Figures 3.4a-c show ion images of the specific ion signals from (a) hydroxyarchaeol, (b) all
GDGTs and (c) all gentiobiosyl-GDGTs over an analysis area of 500 x 500 μm2, demonstrating
different lateral distributions for these lipids (Thiel et al., 2007a). Figure 3.4d shows a video image
of the analysis area, acquired by the built-in camera of the ToF-SIMS instrument during analysis.
Figure 3.4e shows a micrograph, obtained after ToF-SIMS analysis of the same sample area using
an optical microscope, onto which the specific lipid ion images recorded by ToF-SIMS have been
superimposed. Thus, the combination of ToF-SIMS and optical microscopy makes it possible to
relate specific structures or organisms with organic compounds at a microscopic length scale. In
our present study, post-measurement fluorescence microscopy was used furthermore to assign the
micro-organisms in the sample as chain-like assemblages of cylindrical cells of ANME-1 archaea,
a phylogenetic cluster of anaerobic methanotrophic archaea known from previous investigations
(Pimenov et al., 1997; Michaelis et al., 2002; Knittel et al., 2005; Reitner et al., 2005). This
provided strong evidence that the GDGT and gentiobiosyl- GDGT lipids are produced by ANME-1
cells (Thiel et al., 2007a).
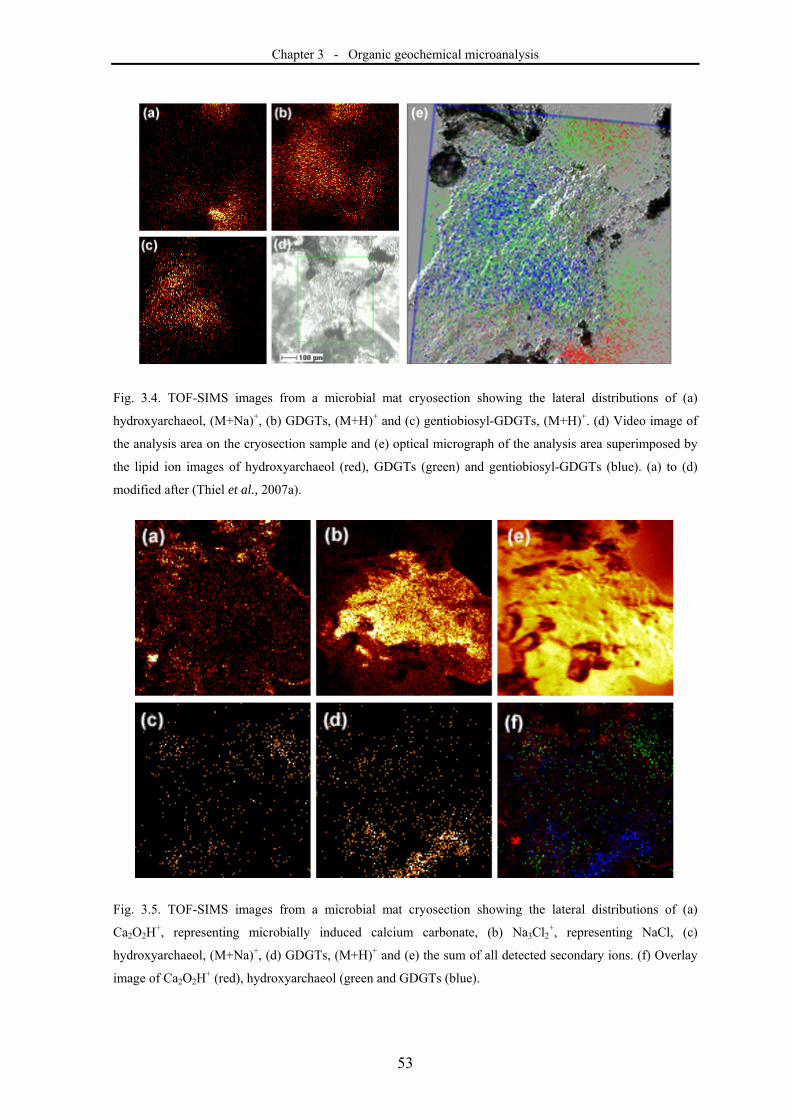
Chapter 3 - Organic geochemical microanalysis
53
Fig. 3.4. TOF-SIMS images from a microbial mat cryosection showing the lateral distributions of (a)
hydroxyarchaeol, (M+Na)+, (b) GDGTs, (M+H)+ and (c) gentiobiosyl-GDGTs, (M+H)+. (d) Video image of
the analysis area on the cryosection sample and (e) optical micrograph of the analysis area superimposed by
the lipid ion images of hydroxyarchaeol (red), GDGTs (green) and gentiobiosyl-GDGTs (blue). (a) to (d)
modified after (Thiel et al., 2007a).
Fig. 3.5. TOF-SIMS images from a microbial mat cryosection showing the lateral distributions of (a)
Ca2O2H+, representing microbially induced calcium carbonate, (b) Na3Cl2
+, representing NaCl, (c)
hydroxyarchaeol, (M+Na)+, (d) GDGTs, (M+H)+ and (e) the sum of all detected secondary ions. (f) Overlay
image of Ca2O2H+ (red), hydroxyarchaeol (green and GDGTs (blue).

Chapter 3 - Organic geochemical microanalysis
54
Figures 3.5a-d show the spatial distributions of (a) Ca2O2H+, representative for the microbially-
induced calcium carbonate precipitate, (b) Na3Cl2+, representative for NaCl, and the molecular ions
of (c) hydroxyarchaeol and (d) all GDGTs. Figure 3.5e shows the lateral distribution of the sum of
all secondary ions detected, providing an indication of the topography of the sample surface. The
relative localisation of calcium carbonate with hydroxyarchaeol and GDGT is shown in the three-
colour overlay image in Figure 3.5f. In this case, there seems to be no correlation in localisation
between calcium carbonate and GDGT. For hydroxyarchaeol, three regions with somewhat
elevated signal intensities (lower left, upper left and upper right, respectively) are located in the
vicinity of regions with elevated calcium carbonate signal levels. However, analysis of additional
samples is required in order to determine whether a spatial correlation between the two compounds
exists.
3.6 Concluding remarks
The strong potential of ToF-SIMS in geochemistry is its ability to provide molecule-specific
detection, identification and microscopic localisation (mapping) of inorganic and organic
compounds without the need for pre-selection or labelling of the compounds of interest. In
comparison with more established techniques such as GC/MS and LC/MS for substance
identification, ToF-SIMS can be used to analyse smaller samples or microscopic areas within a
particular macroscopic sample. Applications where these capabilities are advantageous, and which
our team is presently pursuing, are identification of biomarkers in single oil-bearing fluid
inclusions in ancient rocks, and the identification of specific biomarkers that might be assigned to
particular organisms involved in biomineralisation. Important ingredients and challenges in this
research are the development of appropriate sample preparation protocols, measurement of
reference spectra from pure substances as an aid in spectrum interpretation, and validation of the
ToF-SIMS results against established knowledge and methods.
Acknowledgements
This work received financial support from the Deutsche Forschungsgemeinschaft (DFG, grants Th
713/3, 4, and Research Unit FOR 571 “Geobiology of Organo- and Biofilms”), the University of
Hamburg, the Swedish Research Council (VR, grant 60573901), the Swedish Space Agency (grant
140/06) and the Swedish Governmental Agency for Innovation Systems (VINNOVA). We are
grateful to two anonymous reviewers for their constructive comments that helped to improve the
original manuscript.
Chapter 3 - Organic geochemical microanalysis
55
References
Belu AM, Graham DJ, Castner DG (2003) Time-of-flight secondary ion mass spectrometry: techniques and
applications for the characterization of biomaterial surfaces. Biomaterials, 24, 3635-3653.
Benninghoven A (1994) Chemical Analysis of Inorganic and Organic Surfaces and Thin Films by Static
Time-of-Flight Secondary Ion Mass Spectrometry (ToF-SIMS). Angewandte Chemie International
Edition in English, 33, 1023-1043.
Brocks JJ, Buick R, Logan GA, Summons RE (2003) Composition and syngeneity of molecular fossils from
the 2.78 to 2.45 billion-year-old Mount Bruce Supergroup, Pilbara craton, Western Australia.
Geochimica et Cosmochimica Acta, 67, 4289-4319.
Cannon DM, Pacholski ML, Winograd N, Ewing AG (2000) Molecule specific imaging of freeze-fractured,
frozenhydrated model membrane systems using mass spectrometry. Journal of the American Chemical
Society, 122, 603-610.
Cornett DS, Reyzer ML, Chaurand P, Caprioli RM (2007) Maldi imaging mass spectrometry: Molecular
snapshots of biochemical systems. Nature Methods, 4, 828-833.
Hagenhoff B (2001) Optimisation methods: Cationisation. In: Vickerman JC and Briggs D (eds), ToF-SIMS:
Surface analysis by mass spectrometry. IM Publications and SurfaceSpectra Limited (Charlton,
Chichester, West Sussex, UK), 285-308.
Hopmans EC, Schouten S, Pancost RD, van der Meer MTJ, Damste JSS (2000) Analysis of intact tetraether
lipids in archaeal cell material and sediments by high performance liquid chromatography/atmospheric
pressure chemical ionization mass spectrometry. Rapid Communications in Mass Spectrometry, 14,
585-589.
Knittel K, Losekann T, Boetius A, Kort R, Amann R (2005) Diversity and distribution of methanotrophic
archaea at cold seeps. Applied and Environmental Microbiology, 71, 467-479.
Kollmer F (2004) Cluster primary ion bombardment of organic materials. Applied Surface Science, 231-2,
153-158.
Kraft ML, Weber PK, Longo ML, Hutcheon ID, Boxer SG (2006) Phase separation of lipid membranes
analyzed with high-resolution secondary ion mass spectrometry. Science, 313, 1948-1951.
Michaelis W, Seifert R, Nauhaus K, Treude T, Thiel V, Blumenberg M, Knittel K, Gieseke A, Peterknecht K,
Pape T, Boetius A, Amann R, Jorgensen BB, Widdel F, Peckmann JR, Pimenov NV, Gulin MB
(2002) Microbial reefs in the black sea fueled by anaerobic oxidation of methane. Science, 297, 1013-
1015.
Pacholski ML, Winograd N (1999) Imaging with mass spectrometry. Chemical Reviews, 99, 2977-3005.
Peters K, Walters C, Moldowan M (2005) The biomarker guide. Cambridge University Press (Cambridge,
UK), 1155pp.
Pimenov NV, Rusanov II, Poglazova MN, Mityushina LL, Sorokin DY, Khmelenina VN, Trotsenko YA
(1997) Bacterial mats on coral-like structures at methane seeps in the black sea. Microbiology, 66,
354-360.
Prinz C, Hook F, Malm J, Sjovall P (2007) Structural effects in the analysis of supported lipid bilayers by
time-of-flight secondary ion mass spectrometry. Langmuir, 23, 8035-8041.
Chapter 3 - Organic geochemical microanalysis
56
Reitner J, Reimer A, Schumann G, Thiel V, Peckmann J (2005) Methane-derived carbonate build-ups and
associated microbial communities at cold seeps on the lower Crimean shelf (Black Sea). Facies, 51,
71-84.
Siljeström S, Hode T, Lausmaa J, Toporski J, Thiel V, Sjövall P (2007) Detection of biomarkers in oils using
ToF-SIMS. Geochimica et Cosmochimica Acta, 71, A937.
Sjovall P, Lausmaa J, Johansson B (2004) Mass spectrometric imaging of lipids in brain tissue. Analytical
Chemistry, 76, 4271-4278.
Sodhi RNS (2004) Time-of-flight secondary ion mass spectrometry (ToF-SIMS): Versatility in chemical and
imaging surface analysis. The Analyst, 129, 483-487.
Takats Z, Wiseman JM, Gologan B, Cooks RG (2004) Mass spectrometry sampling under ambient
conditions with desorption electrospray ionization. Science, 306, 471-473.
Thiel V, Heim C, Arp G, Hahmann U, Sjövall P, Lausmaa J (2007a) Biomarkers at the microscopic range:
ToF-SIMS molecular imaging of archaea-derived lipids in a microbial mat. Geobiology, 5, 413-421.
Thiel V, Toporski J, Schumann G, Sjövall P, Lausmaa J (2007b) Analysis of archaeal core ether lipids using
time of flight-secondary ion mass spectrometry (ToF-SIMS): Exploring a new prospect for the study
of biomarkers in geobiology. Geobiology, 5, 75-83.
Touboul D, Halgand F, Brunelle A, Kersting R, Tallarek E, Hagenhoff B, Laprévote O (2004) Tissue
molecular ion imaging by gold cluster ion bombardment. Analytical Chemistry, 76, 1550-1559.
Touboul D, Kollmer F, Niehuis E, Brunelle A, Laprevote O (2005) Improvement of biological time-of-flight-
secondary ion mass spectrometry imaging with a bismuth cluster ion source. Journal of the American
Society for Mass Spectrometry, 16, 1608-1618.
Vickerman JC, Briggs D (2001) ToF-SIMS: Surface analysis by mass spectrometry. IM Publications and
SurfaceSpectra Limited (Charlton, Chichester, West Sussex, UK), 789pp.
Wucher A, Cheng J, Winograd N (2007) Protocols for three-dimensional molecular imaging using mass
spectrometry. Analytical Chemistry, 79, 5529-5539.
Chapter 4 - Glycerolipid reference spectra
57
4
Spectral characterisation of eight glycerolipids and their
detection in natural samples using
Time-of-Flight Secondary Ion Mass Spectrometry (ToF-SIMS)
Christine Heim, Peter Sjövall, Jukka Lausmaa, Tim Leefmann, Volker Thiel
Rapid Communications in Mass Spectrometry (2009) 23, 1-13
4.1 Abstract
In recent years, Time of Flight - Secondary Ion Mass Spectrometry (ToF-SIMS) with cluster ion
sources has opened new perspectives for the analysis of lipid biomarkers in geobiology and organic
geochemistry. However, published ToF-SIMS reference spectra of relevant compounds are still
sparse, and the influence of the chemical environment (matrix) on the ionization of molecules and
their fragmentation is still not well explored. This study presents ToF-SIMS spectra of eight
glycerolipids as common target compounds in biomarker studies, namely ester- and ether-bound
phosphatidylethanolamine, ester- and ether-bound phosphatidylcholine, ester-bound phosphatidyl-
glycerol, ester- and ether-bound diglycerides and archaeol, obtained with a Bi3+ cluster ion source.
For all of these compounds, the spectra obtained in positive and negative analytical modes showed
characteristic fragments that could clearly be assigned to e.g. molecular ions, functional groups and
alkyl chains. By comparison with the reference spectra, it was possible to track some of these lipids
in a pre-characterised organic extract and in cryosections of microbial mats. The results highlight
the potential of ToF-SIMS for the laterally resolved analysis of organic biomarkers in
environmental materials. The identification of the target compounds, however, may be hampered
by matrix effects (e.g. adduct formation) and often require careful consideration of all spectral
features and taking advantage of the molecular imaging capability of ToF-SIMS.
4.2 Introduction
Time of Flight - Secondary Ion Mass Spectrometry (ToF-SIMS) is a surface analysis technique that
allows simultaneous analysis of inorganic and organic molecules on solid surfaces (Benninghoven
et al., 1994; Pacholski and Winograd, 1999). During the last 10-20 years, ToF-SIMS has been used
mainly in material sciences (Vickerman and Briggs, 2001; Belu et al., 2003). The introduction
Chapter 4 - Glycerolipid reference spectra
58
of polyatomic cluster ion sources (e.g. Aun+, Bin
+, C60+) has expanded the capabilities of this
technique, opening new possibilities for the analysis of biological materials (Kollmer, 2004; Sjövall
et al., 2004; Touboul et al., 2004, 2005; Ostrowski et al., 2004) and consequently, the application
of ToF-SIMS in geobiology and organic geochemistry (Thiel et al., 2007; Sjövall et al., 2008,
Siljeström et al., 2009). A most advantageous property of ToF-SIMS is its ability to record the
intensities of any detected ion in a given area of interest at a microscopic scale (e.g. Hagenhoff,
2000). To date, this is not possible with any of the extract-based techniques routinely used in
biomarker studies, namely GC/MS and LC/MS (coupled gas chromatography/mass spectrometry,
coupled liquid chromatography/mass spectrometry). Whereas GC/MS and LC/MS are effective
tools for the identification and quantification of organic compounds, it remains difficult to link the
chemical information obtained to specific structures of interest in heterogeneous and structurally
complex biological or geological materials. In ToF-SIMS, identification of organic compounds is
achieved mainly through precise mass determination, sometimes corroborated by the analysis of
the lateral distribution of the species of interest in selected areas on the sample surface. However,
the absence or as yet sparse number of published ToF-SIMS spectral fragmentation patterns may
hamper an accurate structural assignment. Likewise, the influence of the chemical environment
(matrix) on the ionization of molecules and their fragmentation appears to be an important factor
(Sostarecz et al., 2004), but is still not well explored.
Studies performed previously on reference compounds of widespread hydrocarbon biomarkers
(Steele et al., 2001, Toporski and Steele, 2004, Toporski et al., 2002) showed that ToF-SIMS
spectra may, or may not, differ considerably from those obtained with conventional mass
spectrometric techniques (see also Vickerman and Briggs, 2001). By comparison with pure
reference compounds, it was recently proven possible to detect hydrocarbon biomarkers, namely
hopanes and steranes, in crude oils by ToF-SIMS12. Recent studies on animal tissues, eukaryotic
cells or microbial consortia also revealed the potential of ToF-SIMS with cluster ion sources for
investigating the distribution of intact lipids in natural samples (Börner et al., 2007; Thiel et al.,
2007a; Sjövall et al., 2004; Ostrowski et al., 2004, 2005). Whereas these studies focused on
materials with a more or less pre-characterized lipid content, the authors pointed out that the
establishment of ToF-SIMS reference data is a major prerequisite for the investigation of organic
molecules in barely studied or unknown environmental materials.
This study presents previously unpublished ToF-SIMS spectra of eight functionalized glycerolipids
as important members of cell membrane constituents of eukaryotes, bacteria, and archaea. These
lipids, or their derivatives, are commonly used as biomarkers in geo- and microbiology, organic
geochemistry, and microbial ecology (Börner et al., 2007; Thiel et al., 2007a; Sjövall et al., 2004;
Ostrowski et al., 2004, 2005). Our work aims to provide basic information about the ToF-SIMS
fragmentation patterns of these compounds in both, positive and negative ion modes. In addition to
Chapter 4 - Glycerolipid reference spectra
59
‘conventional’ ester-bound glycerolipids, we also included a number of ether-bound counterparts,
as such compounds may reveal important information on the protagonists in some microbially
driven ecosystems (Pancost et al., 2001). Emphasis was placed not only on high (molecular) mass
species, but also on characteristic fragments that may enable a robust identification of the
respective molecule, or the compound class, in a natural sample. However, detectability of a pure
reference substance does not necessarily imply that the compound can be easily identified by the
same features when analyzed in a complex chemical matrix. To assess the possibility of detecting
such lipids in natural samples and the influence of matrix effects, ToF-SIMS spectra of selected
glycerolipids (archaeol, phosphoglycerol, diglyceride) were therefore compared with those
recorded from the same, or related, compounds in an organic extract and in cryosections of
microbial mats.
4.3 Experimental
Eight commercially available glycerolipids (Avanti Lipids, Sigma, Chiron) were selected for
analysis, namely; (i) L-α-phosphatidylethanolamine (GPEtn), (ii) 1,2 di-O-hexadecyl-sn-glycero-3-
phosphatidylethanolamine (Diether-GPEtn), (iii) L-α-phosphatidylcholine (GPCho), (iv) 1,2-di-O-
dialkyl-sn-glycerol-3-phosphatidylcholine (Diether-GPCho), (v) L-α-phosphatidylglycerol
(GPGro), (vi) 1-Palmitoyl-2-oleoyl-sn-glycerol (DG), (vii) 1,2-di-O-hexadecyl-rac-glycerol
(Diether-DG), and (vii) 1,2-di-O-phytanyl-sn-glycerol (archaeol), see Table 4.1.
All reference lipids were stored cold and dark in glass vials with Teflon septa before, and between,
analyses. 1 mg of each reference lipid was dissolved in 1 ml pre-distilled solvents
(dichloromethane, n-hexane). For ToF-SIMS analysis, the compounds were deposited on silicon
wafers. The wafers were rinsed with de-ionised water and cleaned in a UV ozone apparatus prior to
use in order to remove any organic contaminants from the surface. Using a glass pipette, a few µL
of each lipid solution (except for GPCho, see below) were placed on a silicon wafer and the organic
solvent was allowed to evaporate. The deposition processes were carried out in a laminar air flow
cabinet in order to avoid airborne particulate contamination. The GPCho sample was prepared as a
supported lipid bilayer, according to Prinz et al. (2007). As controls, blank silicon wafers were
exposed to the same conditions during sample preparation, and analysed in parallel. To assess the
presence of contaminants, ToF-SIMS spectra were also obtained from the evaporation residues of
the pure solvents. These spectra were used as internal controls for a clean sample processing and
are not shown here. Typically, sets of six samples were mounted on a sample holder and introduced
to the vacuum chamber of the ToF-SIMS instrument immediately after preparation.
A sample of an iron oxidizing microbial mat dominated by Gallionella ferruginea (Pedersen et al.,
1997) was obtained from a subterranean fluid discharge at -150 m depth in the Äspö Tunnel, SE
Sweden. The mats were stored at -20°C prior to analysis. A sample of a methanotrophic microbial
Chapter 4 - Glycerolipid reference spectra
60
mat was retrieved from the GHOSTDABS methane seep field on the NW' Black Sea shelf from a
water depth of 230 m (joint project BEBOP, see acknowledgements). These microbial mats have
been studied in detail for their lipid biomarker patterns (Thiel et al., 2007b; Blumenberg et al.,
2004; Pape et al., 2005; Michaelis et al., 2002). An organic extract of the Black Sea microbial mat
was prepared as it would be typically done for LC/MS and GC/MS analyses. An aliquot of each
mat (10 mg) was extracted with 15 mL of dichloromethane / methanol (3:1, 1:1, 1:3) in a teflon
capped glass vial (ultrasonication, 20 min). After evaporation of the solvent mixture and re-
dissolution in pure dichloromethane, the extracts were deposited on silicon wafers and were
transferred to the ToF-SIMS instrument as described above.
For the preparation of the cryosections, the Black Sea and the Gallionella microbial mats were
allowed to thaw at room temperature, and a small amount (approx. 10 mm3) of each mat sample
was mounted on a cork sample holder using an embedding agent (Cryo-Gel®, Electron Microscopy
Sciences, PA). The samples were frozen for 30 sec in cold methyl butane at -150 °C and
immediately transferred into the cryochamber of a Leica CM 3050 S cryomicrotome (Leica
Microsystems, Wetzlar, Germany) that had been pre-cooled to -20 °C. Using a standard steel knife
(Leica Profile D), serial sections of ca. 8 µm thickness were cut, deposited on standard microscope
slides (76 x 26 mm), and stored at -20 °C in closed glass containers until analysis. Prior to transfer
into the ToF-SIMS instrument, the slides were allowed to approach room temperature with the
glass container kept closed, in order to avoid condensation of water vapor on the sample.
All glassware (microscope slides, pipettes, vials, beakers, glass containers) were heated to 400 °C
for 2 h prior to use, and/or cleaned by thoroughly rinsing with deionised water and acetone. Solvent
rinsing was also used to clean all steelware (spatula, tweezers, microtome knives) prior to use.
ToF-SIMS images and spectra of positive and negative ions were recorded using a ToF-SIMS IV
instrument (ION-TOF GmbH, Münster, Germany) equipped with a liquid bismuth cluster ion
source. Data were acquired in bunched mode with a mass resolution of ca. M/∆M 5000, using
25 keV Bi3+ primary ions at a pulsed current of 0.1 pA. Low energy electron flooding was used for
charge compensation, when necessary. The analysed areas were 100 x 100 µm2 or 200 x 200 µm2
for references and extracts, and 500 x 500 µm2 for the microbial mat cryosections. The areas were
scanned in a raster pattern at 128 x 128 pixels for reference lipids and extracts, and 256 x 256
pixels for the cryosections. The acquisition times were typically between 50 s and 100 s for the
pure lipid reference samples and the extracts, and 300 s to 500 s for the cryosections. All analyses
were thus done under so-called static SIMS condition, i.e. with primary ion doses well below those
where significant surface damage due to the ion bombardment starts to appear (Sjövall et al.,
2008).
Chapter 4 - Glycerolipid reference spectra
61
4.4 Results and Discussion
Through comparison of the spectra from the different lipids, it was possible to determine
characteristic peaks and fragmentation schemes for the respective lipid classes. In the low mass
range, fragments specifying phospholipids in general were m/z 78.95 [PO3]-, and 96.97 [H2PO4]
- as
previously reported (e.g. Ostrowski et al., 2005; Sjövall et al., 2004). In addition, other distinctive
headgroup fragments are present in the spectra of particular phospholipid classes. Such fragments
where reproducibly detected in both ester- and ether-bound phospholipids and are listed in
Table 4.2. Fragmentation of ester-bound lipids leads to prominent peaks of the corresponding fatty
acid chains whereas the ether-bound lipids exhibited weak fragment ion peaks of the alcohol side
chains (Tab. 4.2). In general, the fragmentation tendency of ether lipids is considerably lower
compared to ester-bound lipids, probably due to the higher chemical stability of the ether link.
4.4.1 Phosphatidylethanolamine (GPEtn):
C39H74NO8P; exact mass 715.52 Da (Dalton)
Source: eukaryotes (Ostrowski et al., 2004, 2005), bacteria (Mazalla et al., 2005)
Molecular ions are detected as at m/z 716.53 and m/z 740.55 in the positive spectrum. Whereas the
former is in accordance with the [M+H]+ ion of the actual GPEtn molecule containing one C16:0 and
one C18:2 moiety (C16:0/C18:2), the latter seems to originate from GPEtn that carries two C18:2 chains
(C18:2/C18:2). The observed distribution is in good agreement with the product specification from the
distributor (C16:0 = 24%, C18:2 = 60%). Both molecular ions produce sodium adducts [M+Na]+ at
m/z 738.53 and m/z 762.54, respectively. Characteristic fragments in positive mode are observed at
m/z 575.49 [M-headgroup]+, 306.29 and 282.28 (Table 4.1) and are interpreted to result from
cleavage within the glycerol backbone (see fragmentation scheme, Fig. 4.1 and Table 4.2). Specific
headgroup fragments are observed at m/z 142.03 and 182.06 corresponding to [C2H9NO4P]+ and
[C5H13NO4P]+.
In negative mode, deprotonated molecular ions [M-H]- occur at m/z 714.55 (C16:0/C18:2) and at m/z
738.55 (C18:2/C18:2). Ions at m/z 697.51 and 671.48 are interpreted as [M-NH3]- and [M-C2H7N]-.
Prominent peaks at m/z 96.97 [H2PO4]- and 78.96 [PO3]
- (not shown) and at m/z 140.02 clearly
specify the phosphate bearing headgroup, as observed in previous studies (Börner et al., 2007;
Ostrowski et al., 2005). Fragments at m/z 279.25 (C18:2) and m/z 255.24 (C16:0) can be assigned to
fatty acid chains (according to Börner et al., 2007), whereas fragments at m/z 476.29, 452.29 and
434.28 putatively derive from the PE molecule after loss of the fatty acid chains as indicated in
Fig. 4.1.
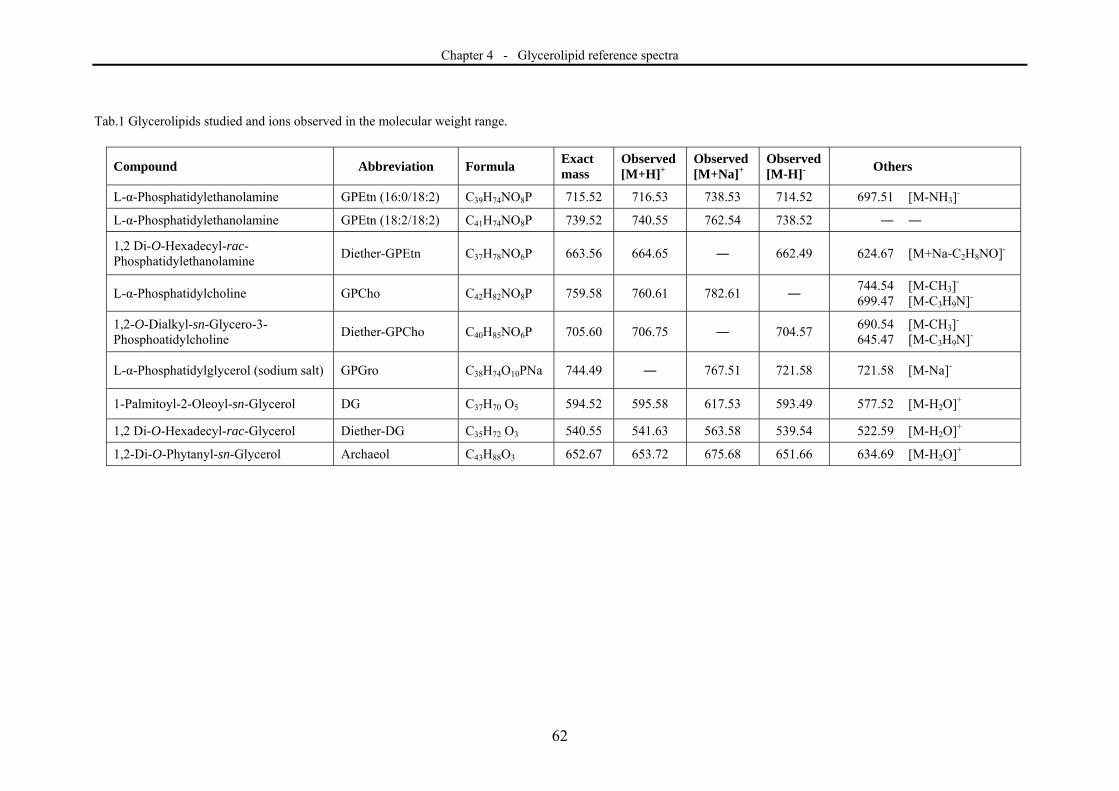
Chapter 4 - Glycerolipid reference spectra
62
Tab.1 Glycerolipids studied and ions observed in the molecular weight range.
Compound Abbreviation Formula Exact mass
Observed [M+H]+
Observed [M+Na]+
Observed [M-H]-
Others
L-α-Phosphatidylethanolamine GPEtn (16:0/18:2) C39H74NO8P 715.52 716.53 738.53 714.52 697.51 [M-NH3]-
L-α-Phosphatidylethanolamine GPEtn (18:2/18:2) C41H74NO8P 739.52 740.55 762.54 738.52 ― ―
1,2 Di-O-Hexadecyl-rac-Phosphatidylethanolamine
Diether-GPEtn C37H78NO6P 663.56 664.65 ― 662.49 624.67 [M+Na-C2H8NO]-
L-α-Phosphatidylcholine GPCho C42H82NO8P 759.58 760.61 782.61 ― 744.54
699.47 [M-CH3]
-
[M-C3H9N]-
1,2-O-Dialkyl-sn-Glycero-3-Phosphoatidylcholine
Diether-GPCho C40H85NO6P 705.60 706.75 ― 704.57 690.54 645.47
[M-CH3]-
[M-C3H9N]-
L-α-Phosphatidylglycerol (sodium salt) GPGro C38H74O10PNa 744.49 ― 767.51 721.58 721.58 [M-Na]-
1-Palmitoyl-2-Oleoyl-sn-Glycerol DG C37H70 O5 594.52 595.58 617.53 593.49 577.52 [M-H2O]+
1,2 Di-O-Hexadecyl-rac-Glycerol Diether-DG C35H72 O3 540.55 541.63 563.58 539.54 522.59 [M-H2O]+
1,2-Di-O-Phytanyl-sn-Glycerol Archaeol C43H88O3 652.67 653.72 675.68 651.66 634.69 [M-H2O]+
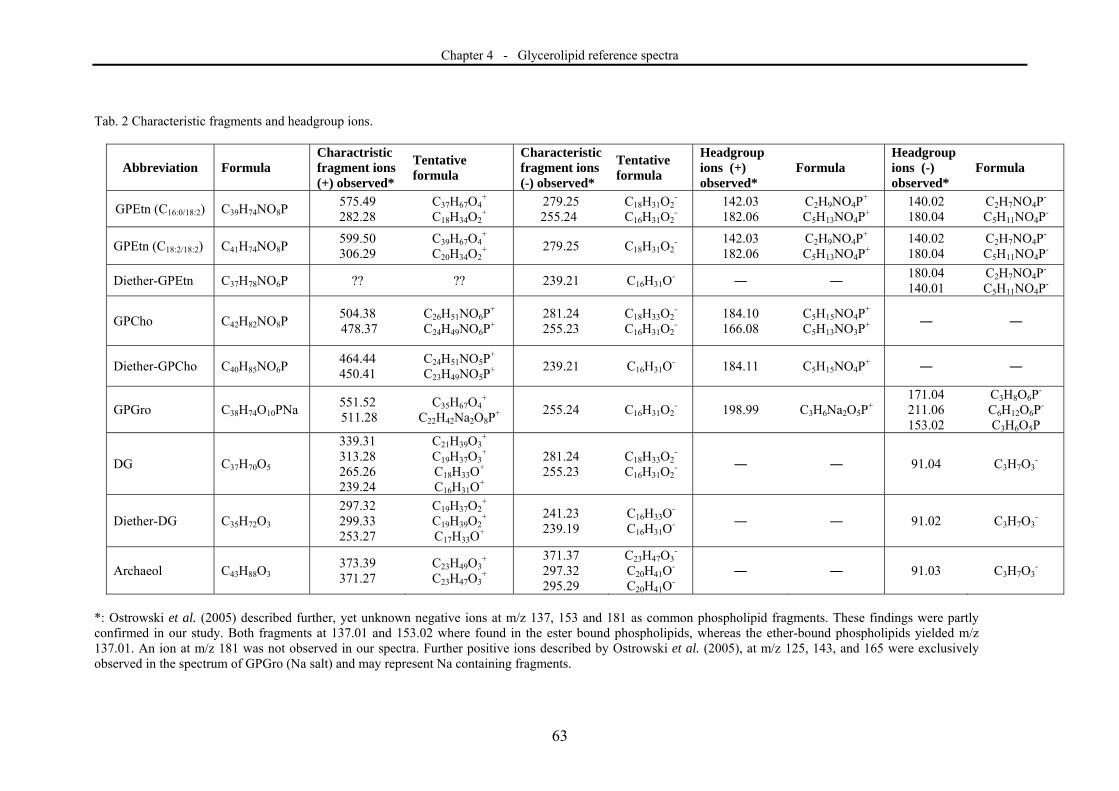
Chapter 4 - Glycerolipid reference spectra
63
Tab. 2 Characteristic fragments and headgroup ions.
Abbreviation Formula Charactristic fragment ions (+) observed*
Tentative formula
Characteristic fragment ions (-) observed*
Tentative formula
Headgroup ions (+) observed*
Formula Headgroup ions (-) observed*
Formula
GPEtn (C16:0/18:2) C39H74NO8P 575.49 282.28
C37H67O4+
C18H34O2+
279.25 255.24
C18H31O2-
C16H31O2-
142.03 182.06
C2H9NO4P+
C5H13NO4P+
140.02 180.04
C2H7NO4P-
C5H11NO4P-
GPEtn (C18:2/18:2) C41H74NO8P 599.50 306.29
C39H67O4+
C20H34O2+
279.25 C18H31O2-
142.03 182.06
C2H9NO4P+
C5H13NO4P+
140.02 180.04
C2H7NO4P-
C5H11NO4P-
Diether-GPEtn C37H78NO6P ?? ?? 239.21 C16H31O- ― ―
180.04 140.01
C2H7NO4P-
C5H11NO4P-
GPCho C42H82NO8P 504.38 478.37
C26H51NO6P+
C24H49NO6P+
281.24 255.23
C18H33O2-
C16H31O2-
184.10 166.08
C5H15NO4P+
C5H13NO3P+
― ―
Diether-GPCho C40H85NO6P 464.44 450.41
C24H51NO5P+
C23H49NO5P+
239.21 C16H31O- 184.11 C5H15NO4P
+ ― ―
GPGro C38H74O10PNa 551.52 511.28
C35H67O4+
C22H42Na2O8P+
255.24 C16H31O2- 198.99 C3H6Na2O5P
+ 171.04 211.06 153.02
C3H8O6P-
C6H12O6P-
C3H6O5P
DG C37H70O5
339.31 313.28 265.26 239.24
C21H39O3+
C19H37O3+
C18H33O+
C16H31O+
281.24 255.23
C18H33O2-
C16H31O2-
― ― 91.04 C3H7O3-
Diether-DG C35H72O3 297.32 299.33 253.27
C19H37O2+
C19H39O2+
C17H33O+
241.23 239.19
C16H33O-
C16H31O-
― ― 91.02 C3H7O3-
Archaeol C43H88O3 373.39 371.27
C23H49O3+
C23H47O3+
371.37 297.32 295.29
C23H47O3-
C20H41O-
C20H41O-
― ― 91.03 C3H7O3-
*: Ostrowski et al. (2005) described further, yet unknown negative ions at m/z 137, 153 and 181 as common phospholipid fragments. These findings were partly confirmed in our study. Both fragments at 137.01 and 153.02 where found in the ester bound phospholipids, whereas the ether-bound phospholipids yielded m/z 137.01. An ion at m/z 181 was not observed in our spectra. Further positive ions described by Ostrowski et al. (2005), at m/z 125, 143, and 165 were exclusively observed in the spectrum of GPGro (Na salt) and may represent Na containing fragments.
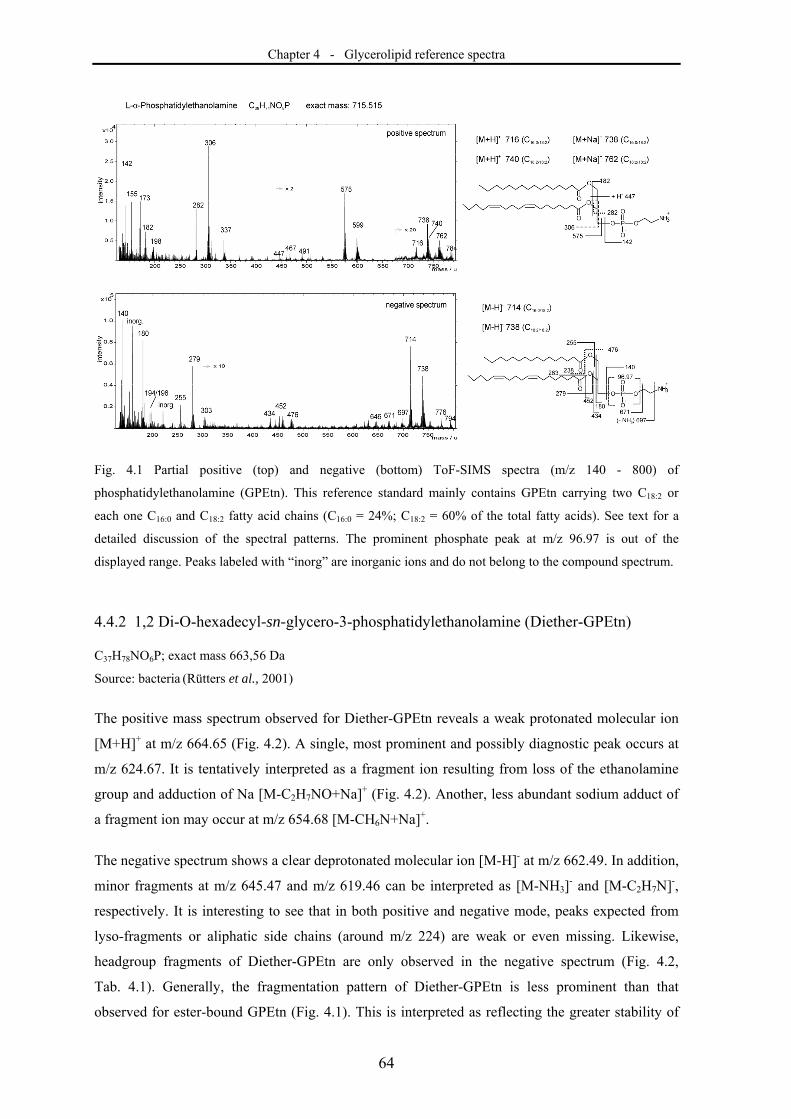
Chapter 4 - Glycerolipid reference spectra
64
Fig. 4.1 Partial positive (top) and negative (bottom) ToF-SIMS spectra (m/z 140 - 800) of
phosphatidylethanolamine (GPEtn). This reference standard mainly contains GPEtn carrying two C18:2 or
each one C16:0 and C18:2 fatty acid chains (C16:0 = 24%; C18:2 = 60% of the total fatty acids). See text for a
detailed discussion of the spectral patterns. The prominent phosphate peak at m/z 96.97 is out of the
displayed range. Peaks labeled with “inorg” are inorganic ions and do not belong to the compound spectrum.
4.4.2 1,2 Di-O-hexadecyl-sn-glycero-3-phosphatidylethanolamine (Diether-GPEtn)
C37H78NO6P; exact mass 663,56 Da
Source: bacteria (Rütters et al., 2001)
The positive mass spectrum observed for Diether-GPEtn reveals a weak protonated molecular ion
[M+H]+ at m/z 664.65 (Fig. 4.2). A single, most prominent and possibly diagnostic peak occurs at
m/z 624.67. It is tentatively interpreted as a fragment ion resulting from loss of the ethanolamine
group and adduction of Na [M-C2H7NO+Na]+ (Fig. 4.2). Another, less abundant sodium adduct of
a fragment ion may occur at m/z 654.68 [M-CH6N+Na]+.
The negative spectrum shows a clear deprotonated molecular ion [M-H]- at m/z 662.49. In addition,
minor fragments at m/z 645.47 and m/z 619.46 can be interpreted as [M-NH3]- and [M-C2H7N]-,
respectively. It is interesting to see that in both positive and negative mode, peaks expected from
lyso-fragments or aliphatic side chains (around m/z 224) are weak or even missing. Likewise,
headgroup fragments of Diether-GPEtn are only observed in the negative spectrum (Fig. 4.2,
Tab. 4.1). Generally, the fragmentation pattern of Diether-GPEtn is less prominent than that
observed for ester-bound GPEtn (Fig. 4.1). This is interpreted as reflecting the greater stability of
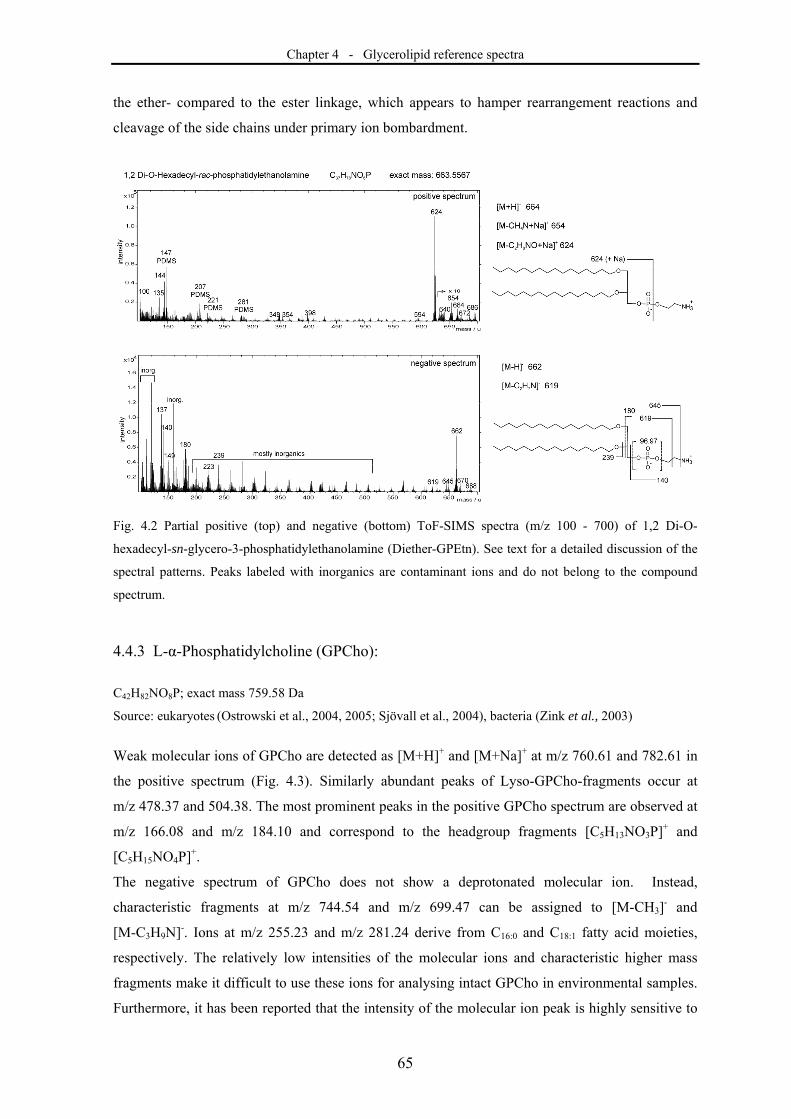
Chapter 4 - Glycerolipid reference spectra
65
the ether- compared to the ester linkage, which appears to hamper rearrangement reactions and
cleavage of the side chains under primary ion bombardment.
Fig. 4.2 Partial positive (top) and negative (bottom) ToF-SIMS spectra (m/z 100 - 700) of 1,2 Di-O-
hexadecyl-sn-glycero-3-phosphatidylethanolamine (Diether-GPEtn). See text for a detailed discussion of the
spectral patterns. Peaks labeled with inorganics are contaminant ions and do not belong to the compound
spectrum.
4.4.3 L-α-Phosphatidylcholine (GPCho):
C42H82NO8P; exact mass 759.58 Da
Source: eukaryotes (Ostrowski et al., 2004, 2005; Sjövall et al., 2004), bacteria (Zink et al., 2003)
Weak molecular ions of GPCho are detected as [M+H]+ and [M+Na]+ at m/z 760.61 and 782.61 in
the positive spectrum (Fig. 4.3). Similarly abundant peaks of Lyso-GPCho-fragments occur at
m/z 478.37 and 504.38. The most prominent peaks in the positive GPCho spectrum are observed at
m/z 166.08 and m/z 184.10 and correspond to the headgroup fragments [C5H13NO3P]+ and
[C5H15NO4P]+.
The negative spectrum of GPCho does not show a deprotonated molecular ion. Instead,
characteristic fragments at m/z 744.54 and m/z 699.47 can be assigned to [M-CH3]- and
[M-C3H9N]-. Ions at m/z 255.23 and m/z 281.24 derive from C16:0 and C18:1 fatty acid moieties,
respectively. The relatively low intensities of the molecular ions and characteristic higher mass
fragments make it difficult to use these ions for analysing intact GPCho in environmental samples.
Furthermore, it has been reported that the intensity of the molecular ion peak is highly sensitive to
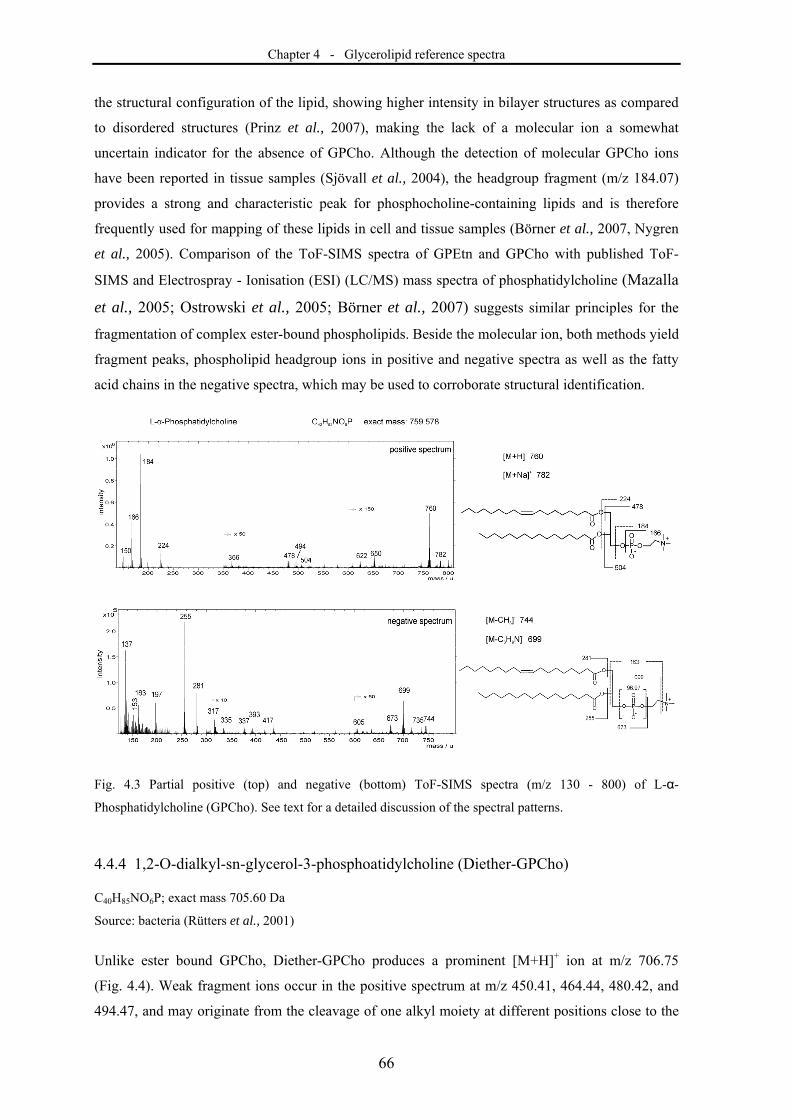
Chapter 4 - Glycerolipid reference spectra
66
the structural configuration of the lipid, showing higher intensity in bilayer structures as compared
to disordered structures (Prinz et al., 2007), making the lack of a molecular ion a somewhat
uncertain indicator for the absence of GPCho. Although the detection of molecular GPCho ions
have been reported in tissue samples (Sjövall et al., 2004), the headgroup fragment (m/z 184.07)
provides a strong and characteristic peak for phosphocholine-containing lipids and is therefore
frequently used for mapping of these lipids in cell and tissue samples (Börner et al., 2007, Nygren
et al., 2005). Comparison of the ToF-SIMS spectra of GPEtn and GPCho with published ToF-
SIMS and Electrospray - Ionisation (ESI) (LC/MS) mass spectra of phosphatidylcholine (Mazalla
et al., 2005; Ostrowski et al., 2005; Börner et al., 2007) suggests similar principles for the
fragmentation of complex ester-bound phospholipids. Beside the molecular ion, both methods yield
fragment peaks, phospholipid headgroup ions in positive and negative spectra as well as the fatty
acid chains in the negative spectra, which may be used to corroborate structural identification.
Fig. 4.3 Partial positive (top) and negative (bottom) ToF-SIMS spectra (m/z 130 - 800) of L-α-
Phosphatidylcholine (GPCho). See text for a detailed discussion of the spectral patterns.
4.4.4 1,2-O-dialkyl-sn-glycerol-3-phosphoatidylcholine (Diether-GPCho)
C40H85NO6P; exact mass 705.60 Da
Source: bacteria (Rütters et al., 2001)
Unlike ester bound GPCho, Diether-GPCho produces a prominent [M+H]+ ion at m/z 706.75
(Fig. 4.4). Weak fragment ions occur in the positive spectrum at m/z 450.41, 464.44, 480.42, and
494.47, and may originate from the cleavage of one alkyl moiety at different positions close to the
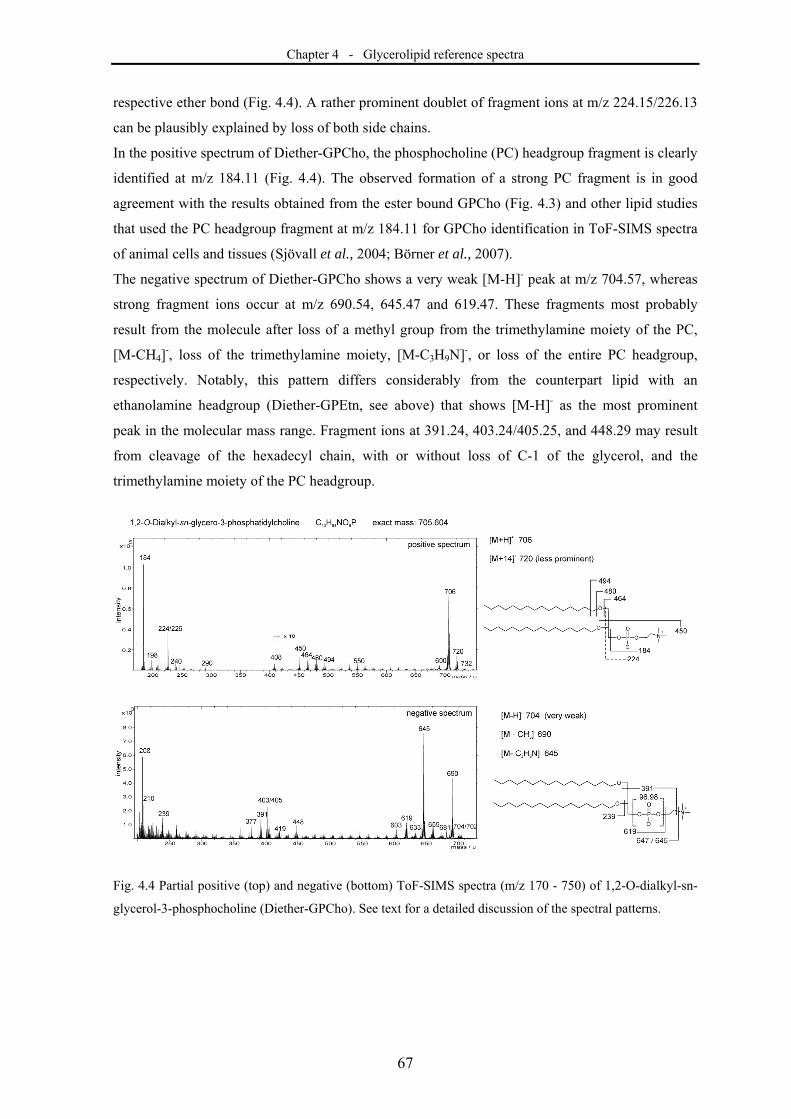
Chapter 4 - Glycerolipid reference spectra
67
respective ether bond (Fig. 4.4). A rather prominent doublet of fragment ions at m/z 224.15/226.13
can be plausibly explained by loss of both side chains.
In the positive spectrum of Diether-GPCho, the phosphocholine (PC) headgroup fragment is clearly
identified at m/z 184.11 (Fig. 4.4). The observed formation of a strong PC fragment is in good
agreement with the results obtained from the ester bound GPCho (Fig. 4.3) and other lipid studies
that used the PC headgroup fragment at m/z 184.11 for GPCho identification in ToF-SIMS spectra
of animal cells and tissues (Sjövall et al., 2004; Börner et al., 2007).
The negative spectrum of Diether-GPCho shows a very weak [M-H]- peak at m/z 704.57, whereas
strong fragment ions occur at m/z 690.54, 645.47 and 619.47. These fragments most probably
result from the molecule after loss of a methyl group from the trimethylamine moiety of the PC,
[M-CH4]-, loss of the trimethylamine moiety, [M-C3H9N]-, or loss of the entire PC headgroup,
respectively. Notably, this pattern differs considerably from the counterpart lipid with an
ethanolamine headgroup (Diether-GPEtn, see above) that shows [M-H]- as the most prominent
peak in the molecular mass range. Fragment ions at 391.24, 403.24/405.25, and 448.29 may result
from cleavage of the hexadecyl chain, with or without loss of C-1 of the glycerol, and the
trimethylamine moiety of the PC headgroup.
Fig. 4.4 Partial positive (top) and negative (bottom) ToF-SIMS spectra (m/z 170 - 750) of 1,2-O-dialkyl-sn-
glycerol-3-phosphocholine (Diether-GPCho). See text for a detailed discussion of the spectral patterns.
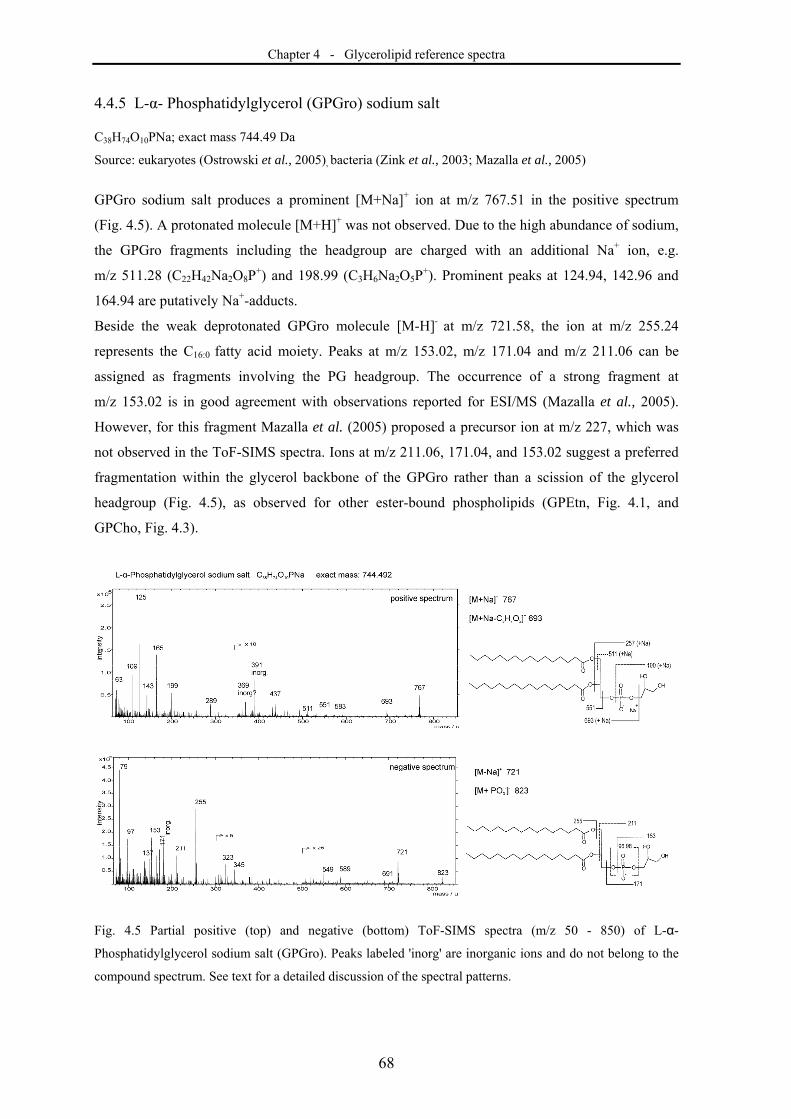
Chapter 4 - Glycerolipid reference spectra
68
4.4.5 L-α- Phosphatidylglycerol (GPGro) sodium salt
C38H74O10PNa; exact mass 744.49 Da
Source: eukaryotes (Ostrowski et al., 2005), bacteria (Zink et al., 2003; Mazalla et al., 2005)
GPGro sodium salt produces a prominent [M+Na]+ ion at m/z 767.51 in the positive spectrum
(Fig. 4.5). A protonated molecule [M+H]+ was not observed. Due to the high abundance of sodium,
the GPGro fragments including the headgroup are charged with an additional Na+ ion, e.g.
m/z 511.28 (C22H42Na2O8P+) and 198.99 (C3H6Na2O5P
+). Prominent peaks at 124.94, 142.96 and
164.94 are putatively Na+-adducts.
Beside the weak deprotonated GPGro molecule [M-H]- at m/z 721.58, the ion at m/z 255.24
represents the C16:0 fatty acid moiety. Peaks at m/z 153.02, m/z 171.04 and m/z 211.06 can be
assigned as fragments involving the PG headgroup. The occurrence of a strong fragment at
m/z 153.02 is in good agreement with observations reported for ESI/MS (Mazalla et al., 2005).
However, for this fragment Mazalla et al. (2005) proposed a precursor ion at m/z 227, which was
not observed in the ToF-SIMS spectra. Ions at m/z 211.06, 171.04, and 153.02 suggest a preferred
fragmentation within the glycerol backbone of the GPGro rather than a scission of the glycerol
headgroup (Fig. 4.5), as observed for other ester-bound phospholipids (GPEtn, Fig. 4.1, and
GPCho, Fig. 4.3).
Fig. 4.5 Partial positive (top) and negative (bottom) ToF-SIMS spectra (m/z 50 - 850) of L-α-
Phosphatidylglycerol sodium salt (GPGro). Peaks labeled 'inorg' are inorganic ions and do not belong to the
compound spectrum. See text for a detailed discussion of the spectral patterns.
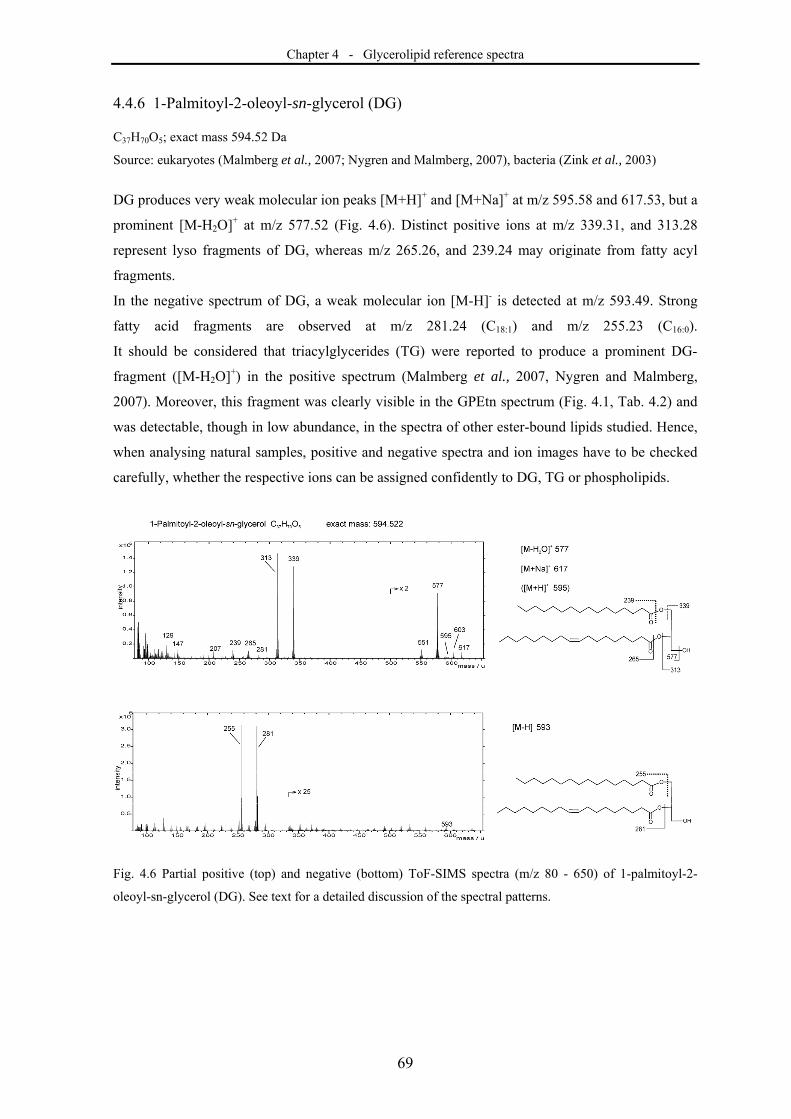
Chapter 4 - Glycerolipid reference spectra
69
4.4.6 1-Palmitoyl-2-oleoyl-sn-glycerol (DG)
C37H70O5; exact mass 594.52 Da
Source: eukaryotes (Malmberg et al., 2007; Nygren and Malmberg, 2007), bacteria (Zink et al., 2003)
DG produces very weak molecular ion peaks [M+H]+ and [M+Na]+ at m/z 595.58 and 617.53, but a
prominent [M-H2O]+ at m/z 577.52 (Fig. 4.6). Distinct positive ions at m/z 339.31, and 313.28
represent lyso fragments of DG, whereas m/z 265.26, and 239.24 may originate from fatty acyl
fragments.
In the negative spectrum of DG, a weak molecular ion [M-H]- is detected at m/z 593.49. Strong
fatty acid fragments are observed at m/z 281.24 (C18:1) and m/z 255.23 (C16:0).
It should be considered that triacylglycerides (TG) were reported to produce a prominent DG-
fragment ([M-H2O]+) in the positive spectrum (Malmberg et al., 2007, Nygren and Malmberg,
2007). Moreover, this fragment was clearly visible in the GPEtn spectrum (Fig. 4.1, Tab. 4.2) and
was detectable, though in low abundance, in the spectra of other ester-bound lipids studied. Hence,
when analysing natural samples, positive and negative spectra and ion images have to be checked
carefully, whether the respective ions can be assigned confidently to DG, TG or phospholipids.
Fig. 4.6 Partial positive (top) and negative (bottom) ToF-SIMS spectra (m/z 80 - 650) of 1-palmitoyl-2-
oleoyl-sn-glycerol (DG). See text for a detailed discussion of the spectral patterns.
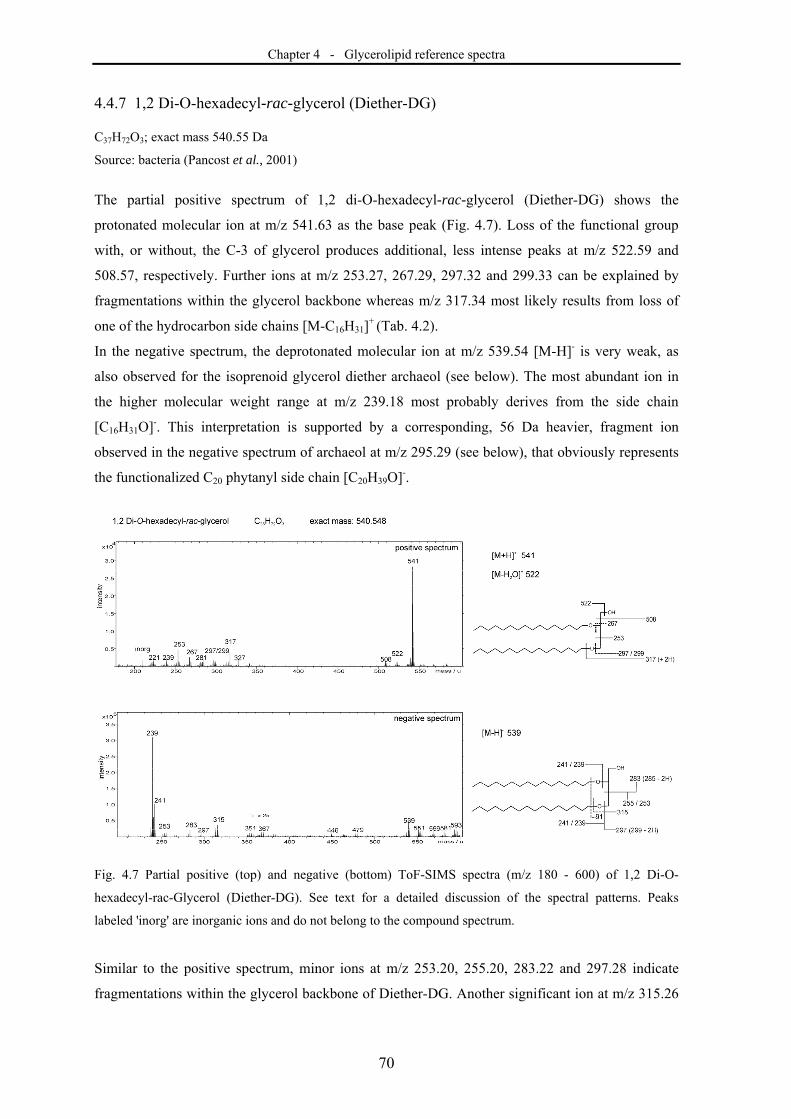
Chapter 4 - Glycerolipid reference spectra
70
4.4.7 1,2 Di-O-hexadecyl-rac-glycerol (Diether-DG)
C37H72O3; exact mass 540.55 Da
Source: bacteria (Pancost et al., 2001)
The partial positive spectrum of 1,2 di-O-hexadecyl-rac-glycerol (Diether-DG) shows the
protonated molecular ion at m/z 541.63 as the base peak (Fig. 4.7). Loss of the functional group
with, or without, the C-3 of glycerol produces additional, less intense peaks at m/z 522.59 and
508.57, respectively. Further ions at m/z 253.27, 267.29, 297.32 and 299.33 can be explained by
fragmentations within the glycerol backbone whereas m/z 317.34 most likely results from loss of
one of the hydrocarbon side chains [M-C16H31]+ (Tab. 4.2).
In the negative spectrum, the deprotonated molecular ion at m/z 539.54 [M-H]- is very weak, as
also observed for the isoprenoid glycerol diether archaeol (see below). The most abundant ion in
the higher molecular weight range at m/z 239.18 most probably derives from the side chain
[C16H31O]-. This interpretation is supported by a corresponding, 56 Da heavier, fragment ion
observed in the negative spectrum of archaeol at m/z 295.29 (see below), that obviously represents
the functionalized C20 phytanyl side chain [C20H39O]-.
Fig. 4.7 Partial positive (top) and negative (bottom) ToF-SIMS spectra (m/z 180 - 600) of 1,2 Di-O-
hexadecyl-rac-Glycerol (Diether-DG). See text for a detailed discussion of the spectral patterns. Peaks
labeled 'inorg' are inorganic ions and do not belong to the compound spectrum.
Similar to the positive spectrum, minor ions at m/z 253.20, 255.20, 283.22 and 297.28 indicate
fragmentations within the glycerol backbone of Diether-DG. Another significant ion at m/z 315.26
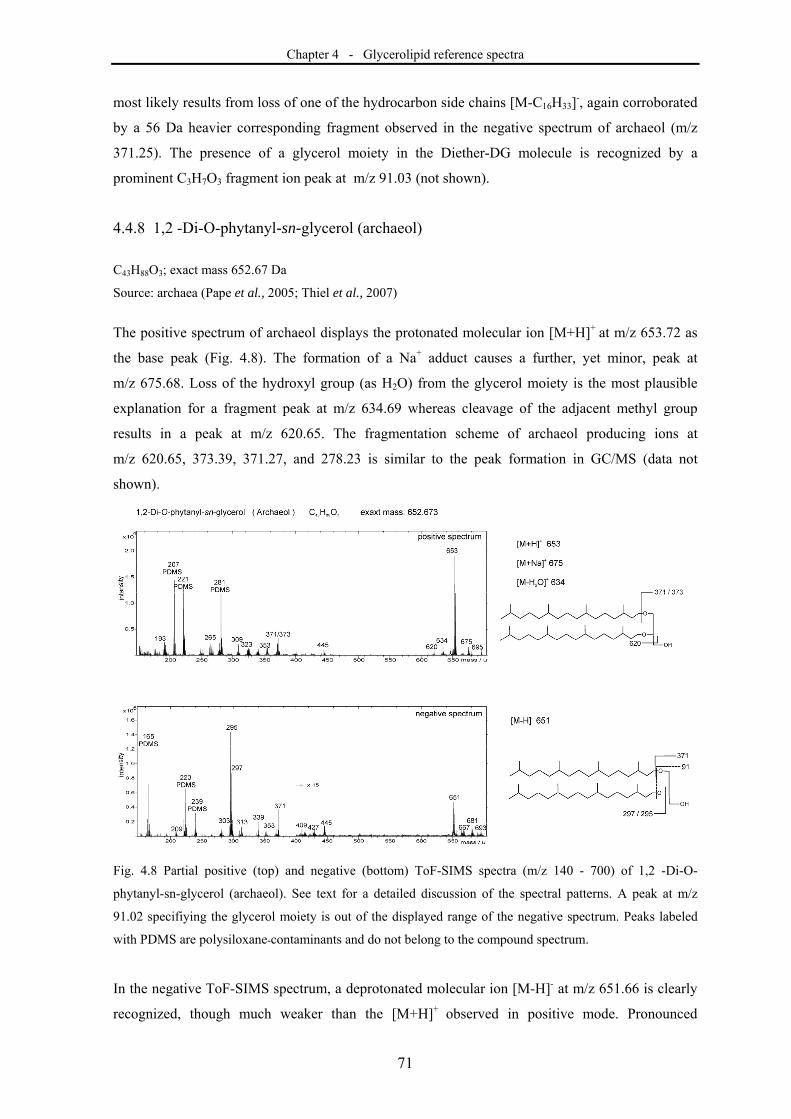
Chapter 4 - Glycerolipid reference spectra
71
most likely results from loss of one of the hydrocarbon side chains [M-C16H33]-, again corroborated
by a 56 Da heavier corresponding fragment observed in the negative spectrum of archaeol (m/z
371.25). The presence of a glycerol moiety in the Diether-DG molecule is recognized by a
prominent C3H7O3 fragment ion peak at m/z 91.03 (not shown).
4.4.8 1,2 -Di-O-phytanyl-sn-glycerol (archaeol)
C43H88O3; exact mass 652.67 Da
Source: archaea (Pape et al., 2005; Thiel et al., 2007)
The positive spectrum of archaeol displays the protonated molecular ion [M+H]+ at m/z 653.72 as
the base peak (Fig. 4.8). The formation of a Na+ adduct causes a further, yet minor, peak at
m/z 675.68. Loss of the hydroxyl group (as H2O) from the glycerol moiety is the most plausible
explanation for a fragment peak at m/z 634.69 whereas cleavage of the adjacent methyl group
results in a peak at m/z 620.65. The fragmentation scheme of archaeol producing ions at
m/z 620.65, 373.39, 371.27, and 278.23 is similar to the peak formation in GC/MS (data not
shown).
Fig. 4.8 Partial positive (top) and negative (bottom) ToF-SIMS spectra (m/z 140 - 700) of 1,2 -Di-O-
phytanyl-sn-glycerol (archaeol). See text for a detailed discussion of the spectral patterns. A peak at m/z
91.02 specifiying the glycerol moiety is out of the displayed range of the negative spectrum. Peaks labeled
with PDMS are polysiloxane-contaminants and do not belong to the compound spectrum.
In the negative ToF-SIMS spectrum, a deprotonated molecular ion [M-H]- at m/z 651.66 is clearly
recognized, though much weaker than the [M+H]+ observed in positive mode. Pronounced
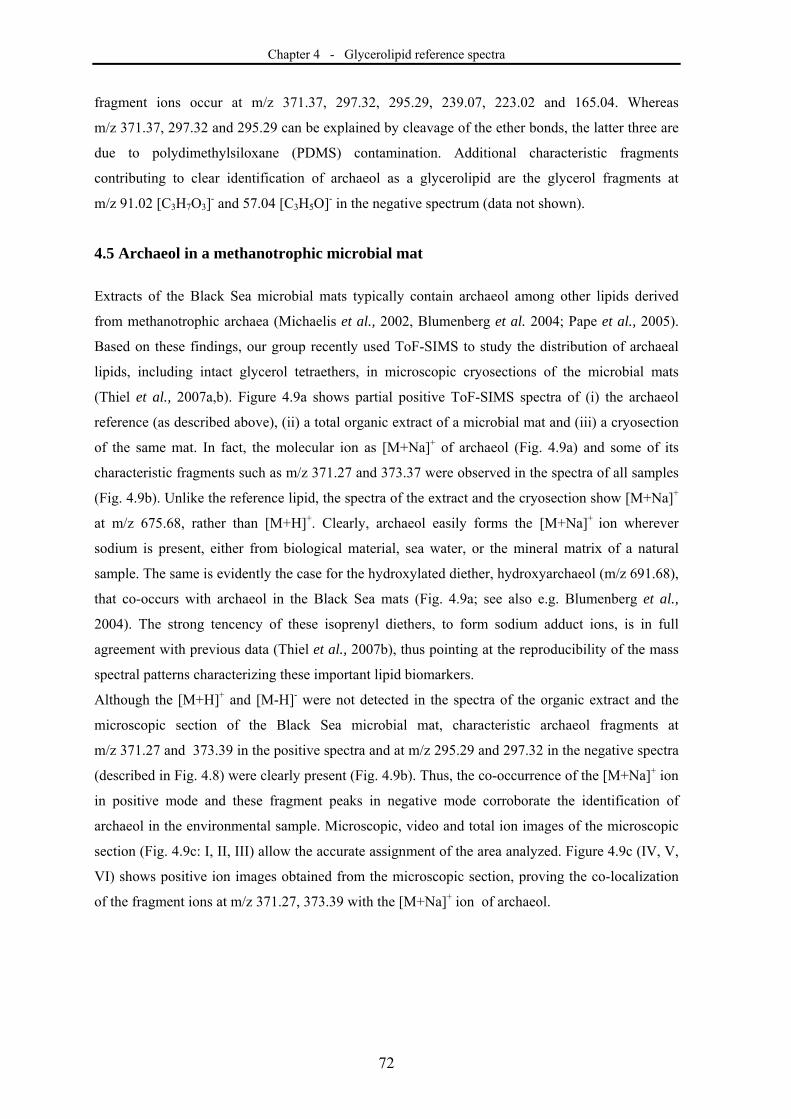
Chapter 4 - Glycerolipid reference spectra
72
fragment ions occur at m/z 371.37, 297.32, 295.29, 239.07, 223.02 and 165.04. Whereas
m/z 371.37, 297.32 and 295.29 can be explained by cleavage of the ether bonds, the latter three are
due to polydimethylsiloxane (PDMS) contamination. Additional characteristic fragments
contributing to clear identification of archaeol as a glycerolipid are the glycerol fragments at
m/z 91.02 [C3H7O3]- and 57.04 [C3H5O]- in the negative spectrum (data not shown).
4.5 Archaeol in a methanotrophic microbial mat
Extracts of the Black Sea microbial mats typically contain archaeol among other lipids derived
from methanotrophic archaea (Michaelis et al., 2002, Blumenberg et al. 2004; Pape et al., 2005).
Based on these findings, our group recently used ToF-SIMS to study the distribution of archaeal
lipids, including intact glycerol tetraethers, in microscopic cryosections of the microbial mats
(Thiel et al., 2007a,b). Figure 4.9a shows partial positive ToF-SIMS spectra of (i) the archaeol
reference (as described above), (ii) a total organic extract of a microbial mat and (iii) a cryosection
of the same mat. In fact, the molecular ion as [M+Na]+ of archaeol (Fig. 4.9a) and some of its
characteristic fragments such as m/z 371.27 and 373.37 were observed in the spectra of all samples
(Fig. 4.9b). Unlike the reference lipid, the spectra of the extract and the cryosection show [M+Na]+
at m/z 675.68, rather than [M+H]+. Clearly, archaeol easily forms the [M+Na]+ ion wherever
sodium is present, either from biological material, sea water, or the mineral matrix of a natural
sample. The same is evidently the case for the hydroxylated diether, hydroxyarchaeol (m/z 691.68),
that co-occurs with archaeol in the Black Sea mats (Fig. 4.9a; see also e.g. Blumenberg et al.,
2004). The strong tencency of these isoprenyl diethers, to form sodium adduct ions, is in full
agreement with previous data (Thiel et al., 2007b), thus pointing at the reproducibility of the mass
spectral patterns characterizing these important lipid biomarkers.
Although the [M+H]+ and [M-H]- were not detected in the spectra of the organic extract and the
microscopic section of the Black Sea microbial mat, characteristic archaeol fragments at
m/z 371.27 and 373.39 in the positive spectra and at m/z 295.29 and 297.32 in the negative spectra
(described in Fig. 4.8) were clearly present (Fig. 4.9b). Thus, the co-occurrence of the [M+Na]+ ion
in positive mode and these fragment peaks in negative mode corroborate the identification of
archaeol in the environmental sample. Microscopic, video and total ion images of the microscopic
section (Fig. 4.9c: I, II, III) allow the accurate assignment of the area analyzed. Figure 4.9c (IV, V,
VI) shows positive ion images obtained from the microscopic section, proving the co-localization
of the fragment ions at m/z 371.27, 373.39 with the [M+Na]+ ion of archaeol.
Chapter 4 - Glycerolipid reference spectra
73
Fig. 4.9. a) Partial positive ToF-SIMS spectra (m/z 630 - 730) showing molecular ions ([M+H]+ and
[M+Na]+) of archaeol from the standard, in a complex organic extract of the Black Sea microbial mat, and on
a microscopic cryosection of the same microbial mat. The peaks at 691.67 and 707.65 Da in the
environmental samples represent the [M+Na]+ of hydroxyarchaeol and dihydroxyarchaeol, respectively. b)
Characteristic archaeol fragments observed in the partial positive and negative spectra of the organic extract
and the microbial mat cryosection. c) Microscopic and Ion images of the Black Sea microbial mat section:
under reflected light (I), built in video camera in the ToF-SIMS (II), total ion image (III), distribution of m/z
371.27 and m/z 373.39 (IV), distribution of archaeol (V), and distribution of hydroxyarchaeol (VI).
4.6 Diglycerides and phosphatidylglycerol in a Gallionella-dominated microbial mat
Generally, analyses of environmental samples of iron-oxidizing Gallionella mats is hampered by
obscuring effects caused by the iron oxide precipitates that commonly make up more than 90 wt%
of the dry sample. It was nonetheless possible to reconstruct partially the lipid pattern of the
microbial system using spectra and the imaging capability of ToF-SIMS (Fig. 4.10).
In the positive spectrum ions at m/z 549.50, 577.54, 603.55, 639.47, and 643.49 are in agreement
with the [M-H2O]+ ions of diglyceride lipids namely C32:1, C34:1, C36:2, C40:12 and C40:10. This
assignment was corroborated through the fragmentation scheme of the DG reference (Fig. 4.6)
including occurrence of a glycerol derived fragment at m/z 91.02 [C3H7O]- and the corresponding
fatty acyl moieties in the negative spectrum. Here, fragment ions at m/z 253.19 and 255.21
correspond to C16:1 and C16:0 moieties, whereas m/z 279.20 and 281.215 arise from C18:2 and C18:1
moieties respectively. Additional ions at m/z 299.18, 301.19, and 303.21, are in agreement with
hexaenoic, pentaenoic and tetraenoic C20 fatty acids, respectively. These fatty acids were also
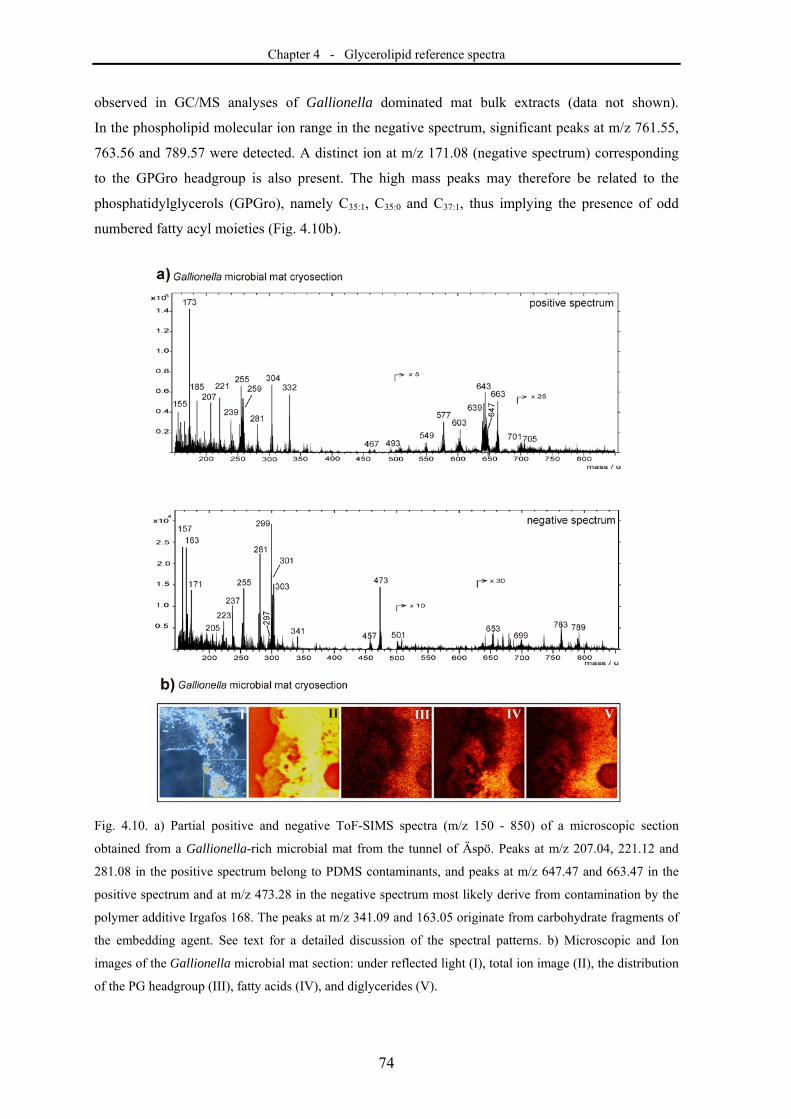
Chapter 4 - Glycerolipid reference spectra
74
observed in GC/MS analyses of Gallionella dominated mat bulk extracts (data not shown).
In the phospholipid molecular ion range in the negative spectrum, significant peaks at m/z 761.55,
763.56 and 789.57 were detected. A distinct ion at m/z 171.08 (negative spectrum) corresponding
to the GPGro headgroup is also present. The high mass peaks may therefore be related to the
phosphatidylglycerols (GPGro), namely C35:1, C35:0 and C37:1, thus implying the presence of odd
numbered fatty acyl moieties (Fig. 4.10b).
Fig. 4.10. a) Partial positive and negative ToF-SIMS spectra (m/z 150 - 850) of a microscopic section
obtained from a Gallionella-rich microbial mat from the tunnel of Äspö. Peaks at m/z 207.04, 221.12 and
281.08 in the positive spectrum belong to PDMS contaminants, and peaks at m/z 647.47 and 663.47 in the
positive spectrum and at m/z 473.28 in the negative spectrum most likely derive from contamination by the
polymer additive Irgafos 168. The peaks at m/z 341.09 and 163.05 originate from carbohydrate fragments of
the embedding agent. See text for a detailed discussion of the spectral patterns. b) Microscopic and Ion
images of the Gallionella microbial mat section: under reflected light (I), total ion image (II), the distribution
of the PG headgroup (III), fatty acids (IV), and diglycerides (V).
Chapter 4 - Glycerolipid reference spectra
75
Although the GPGro headgroup was co-localized with C17 and C19 fatty acids, this relation remains
uncertain, as the latter were observed only in minor abundance on the cryosections. Additional
prominent organic ions such as m/z 332.33, 304.29 and 173.08 in the positive spectrum and m/z
237.06, 157.11 in the negative spectrum still remain to be identified.
4.7 Conclusions
Our study showed that ToF-SIMS with a Bi cluster ion source is capable of revealing characteristic
mass spectral features of each of the eight glycerolipids investigated. However, a robust assignment
of the target compounds in the total ToF-SIMS spectrum of environmental samples should not only
rely on the presence of molecular ions (including adducts), but also on specific headgroup
fragments and other structural moieties, such as functional groups and alkyl chains. The
establishment of characteristic mass spectral features for a range of glycerolipids further expands
the range of complex lipids that can be analyzed using ToF-SIMS and provides the crucial basis for
the identification of these and related biomarkers in environmental materials. Nevertheless, the
question whether the patterns reported here represent general rules for the interpretation of ToF-
SIMS spectra of environmental samples still has to be corroborated by further studies.
A major advantage of ToF-SIMS is its capacity to provide simultaneous detection, identification
and microscopic localisation (mapping) of inorganic and organic compounds without the need for
bulk sample extraction or labelling. Unlike the more traditional techniques for lipid analysis such
as GC/MS and LC/MS, ToF-SIMS can be used to study compound distributions within
microscopic areas of interest on a sample surface. The imaging capacity of ToF-SIMS can also be
used to support the identification of organic compounds and their association with inorganic
species through the co-localisation of key ions on the area of interest. As the analytical procedure is
virtually non-destructive, subsequent examinations, e.g. microscopy, may allow a further
characterization of the sample in question.
The capability of visualizing lipid distributions on a micrometer scale makes ToF-SIMS a
promising tool for a wide range of geological, ecological, biological, and medical applications.
However, published ToF-SIMS spectra of lipid biomarkers as yet exist for a still limited number of
relevant compounds, and little research has been conducted on the effects of substrates and
compound concentrations on the quality of ToF-SIMS spectra. Furthermore, structural assignments
using the current single-stage TOF analyzers are still not satisfactory, and isomers can not be easily
differentiated. Moreover, SIMS is very susceptible to surface contamination.
Further efforts are therefore essential to minimise, or overcome these limitations and further
increase the utility of ToF-SIMS for molecular imaging in bio- and geosciences. Such efforts may
Chapter 4 - Glycerolipid reference spectra
76
include the implementation of tandem mass spectrometry, the improvement of preparation
techniques particularly for environmental samples, the establishment of further reference data from
pure substances, and the validation of the ToF-SIMS results against established knowledge and
methods.
Acknowledgements:
We are grateful to Michael Wiedenbeck and Jan Toporski for their constructive reviews that greatly
helped to improve the original manuscript. The authors acknowledge Jakob Malm (SP Borås) for
constructive discussions and help in the lab. We are also grateful to Walter Michaelis, Richard
Seifert (University of Hamburg) and Joachim Reitner (University of Göttingen), who initiated and
coordinated the joint projects through which the microbial mats studied here were retrieved. Our
study received financial support from the German Research Foundation (DFG) through grants Th
713/4 and FOR 571, the University of Hamburg (joint project BEBOP, R/V Poseidon cruise PO
317/2), and the Swedish Governmental Agency for Innovation Systems (VINNOVA). This is
publication no. 46 of the DFG Research Unit FOR 571 ‘Geobiology of Organo- and Biofilms’.
Chapter 4 - Glycerolipid reference spectra
77
References
Belu AM, Graham DJ, Castner DG (2003) Time-of-flight secondary ion mass spectrometry: techniques and
applications for the characterization of biomaterial surfaces. Biomaterials, 24, 3635-3653.
Benninghoven A (1994) Chemical Analysis of Inorganic and Organic Surfaces and Thin Films by Static
Time-of-Flight Secondary Ion Mass Spectrometry (ToF-SIMS). Angewandte Chemie International
Edition in English, 33, 1023-1043.
Blumenberg M, Seifert R, Reitner J, Pape T, Michaelis W (2004) Membrane lipid patterns typify distinct
anaerobic methanotrophic consortia. Proceedings of the National Academy of Sciences of the United
States of America, 101, 11111-11116.
Börner K, Malmber P, Månsson J-E, Nygren H (2007) Molecular imaging of lipids in cells and tissues. Mass
Spectrometry, 260, 128 – 136.
Hagenhoff B (2000) High resolution surface analysis by TOF-SIMS. Mikrochimica Acta, 132, 259-271.
Kollmer F (2004) Cluster primary ion bombardment of organic materials. Applied Surface Science, 231-2,
153-158.
Malmberg P, Nygren H, Richter K, Chen Y, Dangardt F, Friberg P, Magnusson Y (2007) Imaging of lipids in
human adipose tissue by cluster ion ToF-SIMS. Microscopy Research and Technique, 70, 828-835.
Mazalla N, Molinet J, Syakti AD, Dodi A, Bertrand J-C, Doumenq P (2005). Use of electrospray ionization
mass spectrometry for profiling of crude oil effects on the phospholipid molecular species of two
marine bacteria. Rapid Communications in Mass Spectrometry, 19, 3579-3558.
Michaelis W, Seifert R, Nauhaus K, Treude T, Thiel V, Blumenberg M, Knittel K, Gieseke A, Peterknecht K,
Pape T, Boetius A, Amann R, Jørgensen BB, Widdel F, Peckmann J, Pimenov NV, Gulin MB (2002)
Microbial reefs in the Black Sea fueled by anaerobic oxidation of methane. Science, 297, 1013-1015.
Nygren H, Borner K, Hagenhoff B, Malmberg P, Mansson J-E (2005) Localization of cholesterol
phosphocholine and galactosylceramide in rat cerebellar cortex with imaging TOF-SIMS equipped
with a bismuth cluster ion source. Biochimica et Biophysica Acta (BBA) - Molecular and Cell Biology
of Lipids, 1737, 102-110.
Nygren H, Malmberg P (2007). High resolution imaging by organic secondary ion mass spectrometry.
Trends in Biotechnology, 25, 499-504.
Ostrowski SG, Bell CTV, Winograd N, Ewing AG (2004) Mass spectrometric imaging of highly curved
membranes during Tetrahymena mating. Science, 305, 71-73.
Ostrowski SG, Szakal C, Kozole J, Roddy TP, Xu J, Ewing AG, Winograd N (2005) Secondary Ion MS
Imaging of Lipids in Picoliter Vials with a Buckminsterfullerene Ion Source. Analytical Chemistry, 77,
6190-6196.
Pacholski ML, Winograd N (1999) Imaging with mass spectrometry. Chemical Reviews, 99, 2977-3005.
Pape T, Blumenberg M, Seifert R, Egorov VN, Gulin SB, Michaelis W (2005) Lipid geochemistry of
methane-seep-related Black Sea carbonates. Palaeogeography, Palaeoclimatology, Palaeoecology,
227, 31-47.
Pancost RD, Bouloubassi I, Aloisi G, Sinninghe Damsté JS, the Medinaut Shipboard Scientific Party (2001).
Three series of non-isoprenoidal dialkyl glycerol diethers in cold-seep carbonate crusts. Organic
Geochemistry. 32, 695-707.

Chapter 4 - Glycerolipid reference spectra
78
Pedersen K (1997) Microbial life in deep granitic rock. FEMS Microbiology Reviews, 20, 399–414.
Prinz C, Hook F, Malm J, Sjövall P (2007) Structural effects in the analysis of supported lipid bilayers by
time-of-flight secondary ion mass spectrometry. Langmuir, 23, 8035-8041.
Rütters H, Sass H, Cypionka H, Rullkötter (2001) Monoalkylether phsopholipids in the sulfate reducing
bacteria Desulfosarcina variabilis and Desulforhabdus amnigenus. Archives of Microbiology, 176,
435-442.
Siljeström S, Hode T, Lausmaa J, Sjövall P, Toporski J, Thiel V (2009) Detection of organic biomarkers in
crude oils using ToF-SIMS. Organic Geochemistry, 40, 1, 135-143.
Sjövall P, Lausmaa J, Johansson B (2004) Mass spectrometric imaging of lipids in brain tissue. Analytical
Chemistry, 76, 4271-4278.
Sjövall P, Thiel V, Siljeström S, Heim C, Hode T, Lausmaa J, (2008) Organic geochemical microanalysis by
time-of-flight secondary ion mass spectrometry (ToF-SIMS). Geostandards and Geoanalytical
Research, 32, 267-277.
Sostarecz AG, Cannon DM jr, McQuaw CM, Sun S, Ewing AG, Winograd N (2004) Influence of molecular
environment on the analysis of phospholipids by time-of-flight secondary ion mass spectrometry.
Langmuir, 20, 4926-4932.
Steele A, Toporski JKW, Avci R, Guidry S, McKay DS (2001) Time of flight secondary ion mass
spectrometry (ToFSIMS) of a number of hopanoids. Organic Geochemistry, 32, 905-911.
Thiel V, Heim C, Arp G, Hahmann U, Sjövall P, Lausmaa J (2007a) Biomarkers at the microscopic range:
ToF-SIMS molecular imaging of archaea-derived lipids in a microbial mat. Geobiology, 5, 413-421.
Thiel V, Toporski J, Schumann G, Sjövall P, Lausmaa J (2007b) Analysis of archaeal core ether lipids using
time of flight-secondary ion mass spectrometry (ToF-SIMS): Exploring a new prospect for the study
of biomarkers in geobiology. Geobiology, 5, 75-83.
Toporski J, Steele A (2004) Characterization of purified biomarker compounds using time of flight-
secondary ion mass spectrometry (ToF-SIMS). Organic Geochemistry, 35, 793-811.
Toporski J, Steele A, Westall F, Avci R, Martill M, McKay DS (2002) Morphological and spectral
investigation of exceptionally well preserved bacterial biofilms from the Oligocene Enspel formation,
Germany. Geochimica et Cosmochimica Acta, 66, 1773-1791.
Touboul D, Halgand F, Brunelle A, Kersting R, Tallarek E, Hagenhoff B, Laprévote O (2004) Tissue
molecular ion imaging by gold cluster ion bombardment. Analytical Chemistry, 76, 1550-1559.
Touboul D, Kollmer F, Niehuis E, Brunelle A, Laprevote O (2005) Improvement of biological time-of-flight-
secondary ion mass spectrometry imaging with a bismuth cluster ion source. Journal of the American
Society for Mass Spectrometry, 16, 1608-1618.
Vickerman JC, Briggs D (2001) ToF-SIMS: Surface analysis by mass spectrometry. IM Publications and
SurfaceSpectra Limited (Charlton, Chichester, West Sussex, UK), 789pp.
Zink K-G, Wilkes H, Disko U, Elvert M, Horsfield B (2003) Intact phospholipids – microbial “life markers”
in marine deep subsurface sediments. Organic Geochemistry, 34, 755-769.

Chapter 5 - TREE accumulation and fractionation
79
5
Trace and rare earth element accumulation and fractionation
in microbial iron oxyhydroxides
Christine Heim, Klaus Simon, Nadia-Valérie Quéric, Joachim Reitner, Volker Thiel
Geochimica et Cosmochimica Acta, in revision
5.1 Abstract
Microbial iron oxyhydroxides are common deposits in natural waters, recent sediments and mine
drainage systems. Along with these minerals, trace and rare earth elements (TREE) are being
accumulated within the mineralizing microbial mats. TREE patterns are widely used to characterize
minerals and rocks, and to elucidate their evolution and origin. However, whether and which
characteristic TREE signatures allow to distinguish between a biological and an inorganic origin of
these iron minerals is still not well understood. Here we report on long-term flow reactor studies
performed in the Tunnel of Äspö (Äspö Hard Rock Laboratory, Sweden) to investigate the
development of microbial mats dominated by the iron-oxidizing bacterium Gallionella ferruginea.
The feeder fluids of the flow reactors were tapped at 183m and 290m below sea-level from two
brackish, but chemically differing aquifers within the surrounding, ~ 1.8 Ga old, granodioritic
rocks. The experiments allowed to investigate the accumulation and fractionation of TREE under
controlled conditions of the deep continental biosphere, and enabled us to assess potential
biosignatures evolving within the microbial iron oxyhydroxides. After two, respectively nine
months, the REE+Y content in the microbial iron oxyhydroxides was found to be 104 and 106 fold
enriched compared to the feeder fluids. Concentrations of Be, Y, Zn, Zr, Hf, W, Th, Pb, and U
were 103- to 105-fold higher than in the feeder fluids. These enormous enrichments of TREE
highlight the efficiency of G. ferruginea mats in removing metals from the supplying water, and
point to the potential utility of these microbial systems for the recycling of precious trace metals
and radionuclides. Except for a hydrothermally induced Eu anomaly, the normalized REE+Y
patterns of the microbial iron oxyhydroxides were found to be very similar to published REE+Y
distribution patterns of Archaean Banded Iron Formations (BIF). Furthermore, these patterns differ
significantly from those of chemically precipitated iron oxyhydroxides. These findings further
corroborate the hypothesis that iron-oxidizing microorganisms such as G. ferruginea were involved
in the formation of BIF, and highlight the utility of TREE patterns and distinctive element
fractionations as 'inorganic biosignatures' for palaeoenvironmental studies.
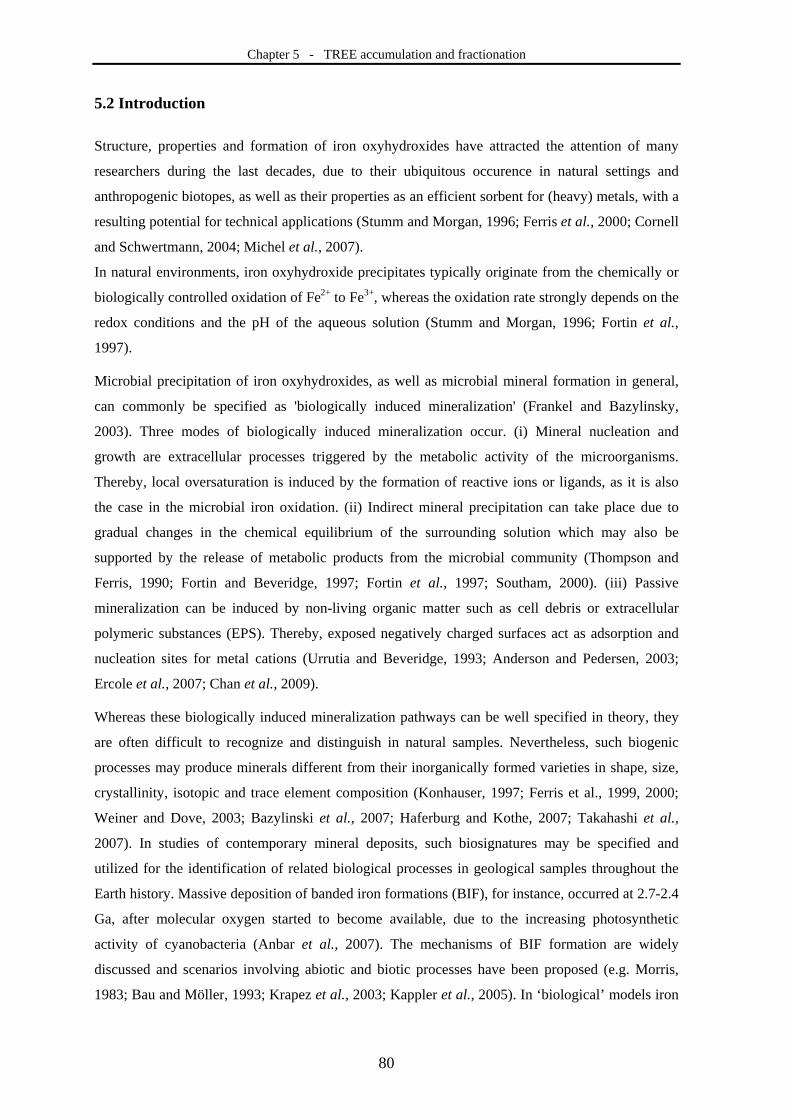
Chapter 5 - TREE accumulation and fractionation
80
5.2 Introduction
Structure, properties and formation of iron oxyhydroxides have attracted the attention of many
researchers during the last decades, due to their ubiquitous occurence in natural settings and
anthropogenic biotopes, as well as their properties as an efficient sorbent for (heavy) metals, with a
resulting potential for technical applications (Stumm and Morgan, 1996; Ferris et al., 2000; Cornell
and Schwertmann, 2004; Michel et al., 2007).
In natural environments, iron oxyhydroxide precipitates typically originate from the chemically or
biologically controlled oxidation of Fe2+ to Fe3+, whereas the oxidation rate strongly depends on the
redox conditions and the pH of the aqueous solution (Stumm and Morgan, 1996; Fortin et al.,
1997).
Microbial precipitation of iron oxyhydroxides, as well as microbial mineral formation in general,
can commonly be specified as 'biologically induced mineralization' (Frankel and Bazylinsky,
2003). Three modes of biologically induced mineralization occur. (i) Mineral nucleation and
growth are extracellular processes triggered by the metabolic activity of the microorganisms.
Thereby, local oversaturation is induced by the formation of reactive ions or ligands, as it is also
the case in the microbial iron oxidation. (ii) Indirect mineral precipitation can take place due to
gradual changes in the chemical equilibrium of the surrounding solution which may also be
supported by the release of metabolic products from the microbial community (Thompson and
Ferris, 1990; Fortin and Beveridge, 1997; Fortin et al., 1997; Southam, 2000). (iii) Passive
mineralization can be induced by non-living organic matter such as cell debris or extracellular
polymeric substances (EPS). Thereby, exposed negatively charged surfaces act as adsorption and
nucleation sites for metal cations (Urrutia and Beveridge, 1993; Anderson and Pedersen, 2003;
Ercole et al., 2007; Chan et al., 2009).
Whereas these biologically induced mineralization pathways can be well specified in theory, they
are often difficult to recognize and distinguish in natural samples. Nevertheless, such biogenic
processes may produce minerals different from their inorganically formed varieties in shape, size,
crystallinity, isotopic and trace element composition (Konhauser, 1997; Ferris et al., 1999, 2000;
Weiner and Dove, 2003; Bazylinski et al., 2007; Haferburg and Kothe, 2007; Takahashi et al.,
2007). In studies of contemporary mineral deposits, such biosignatures may be specified and
utilized for the identification of related biological processes in geological samples throughout the
Earth history. Massive deposition of banded iron formations (BIF), for instance, occurred at 2.7-2.4
Ga, after molecular oxygen started to become available, due to the increasing photosynthetic
activity of cyanobacteria (Anbar et al., 2007). The mechanisms of BIF formation are widely
discussed and scenarios involving abiotic and biotic processes have been proposed (e.g. Morris,
1983; Bau and Möller, 1993; Krapez et al., 2003; Kappler et al., 2005). In ‘biological’ models iron
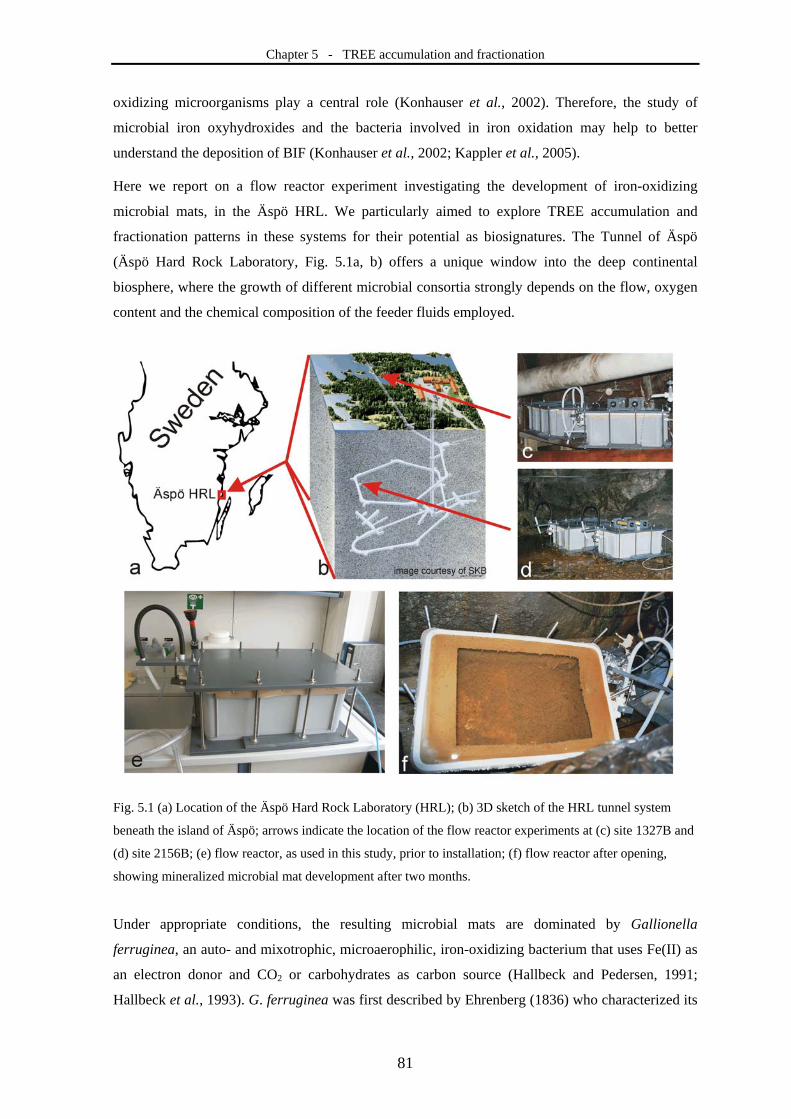
Chapter 5 - TREE accumulation and fractionation
81
oxidizing microorganisms play a central role (Konhauser et al., 2002). Therefore, the study of
microbial iron oxyhydroxides and the bacteria involved in iron oxidation may help to better
understand the deposition of BIF (Konhauser et al., 2002; Kappler et al., 2005).
Here we report on a flow reactor experiment investigating the development of iron-oxidizing
microbial mats, in the Äspö HRL. We particularly aimed to explore TREE accumulation and
fractionation patterns in these systems for their potential as biosignatures. The Tunnel of Äspö
(Äspö Hard Rock Laboratory, Fig. 5.1a, b) offers a unique window into the deep continental
biosphere, where the growth of different microbial consortia strongly depends on the flow, oxygen
content and the chemical composition of the feeder fluids employed.
Fig. 5.1 (a) Location of the Äspö Hard Rock Laboratory (HRL); (b) 3D sketch of the HRL tunnel system
beneath the island of Äspö; arrows indicate the location of the flow reactor experiments at (c) site 1327B and
(d) site 2156B; (e) flow reactor, as used in this study, prior to installation; (f) flow reactor after opening,
showing mineralized microbial mat development after two months.
Under appropriate conditions, the resulting microbial mats are dominated by Gallionella
ferruginea, an auto- and mixotrophic, microaerophilic, iron-oxidizing bacterium that uses Fe(II) as
an electron donor and CO2 or carbohydrates as carbon source (Hallbeck and Pedersen, 1991;
Hallbeck et al., 1993). G. ferruginea was first described by Ehrenberg (1836) who characterized its
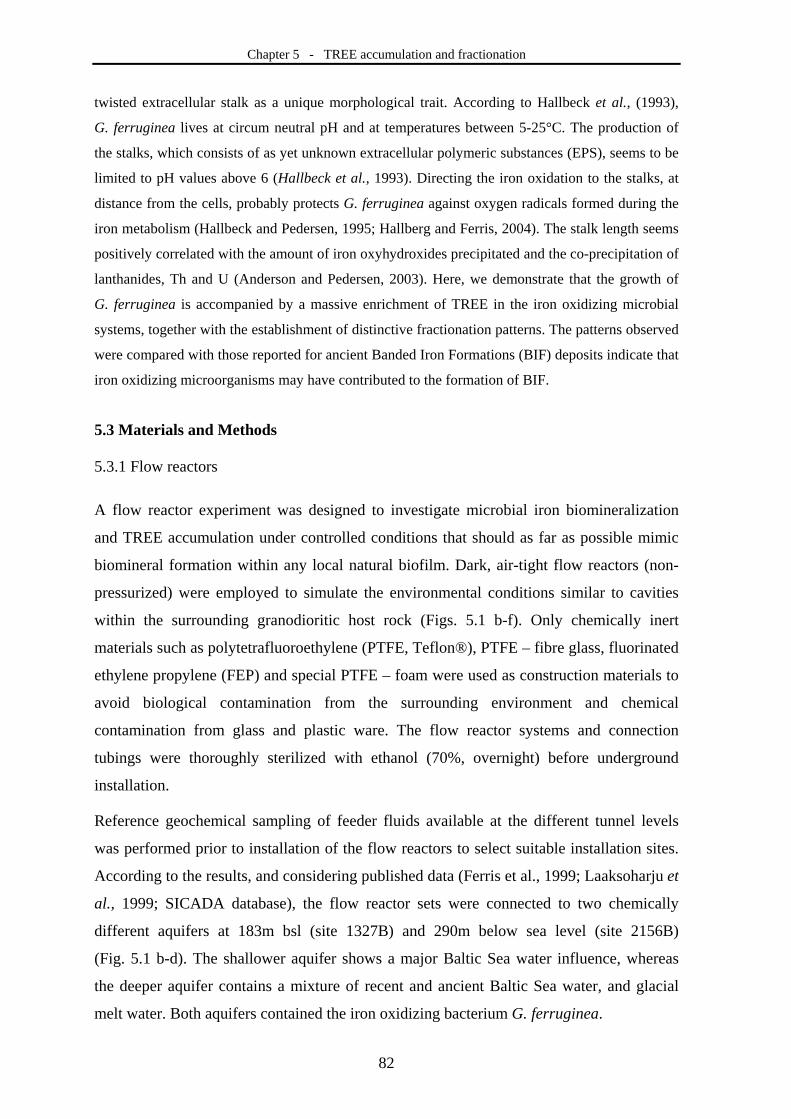
Chapter 5 - TREE accumulation and fractionation
82
twisted extracellular stalk as a unique morphological trait. According to Hallbeck et al., (1993),
G. ferruginea lives at circum neutral pH and at temperatures between 5-25°C. The production of
the stalks, which consists of as yet unknown extracellular polymeric substances (EPS), seems to be
limited to pH values above 6 (Hallbeck et al., 1993). Directing the iron oxidation to the stalks, at
distance from the cells, probably protects G. ferruginea against oxygen radicals formed during the
iron metabolism (Hallbeck and Pedersen, 1995; Hallberg and Ferris, 2004). The stalk length seems
positively correlated with the amount of iron oxyhydroxides precipitated and the co-precipitation of
lanthanides, Th and U (Anderson and Pedersen, 2003). Here, we demonstrate that the growth of
G. ferruginea is accompanied by a massive enrichment of TREE in the iron oxidizing microbial
systems, together with the establishment of distinctive fractionation patterns. The patterns observed
were compared with those reported for ancient Banded Iron Formations (BIF) deposits indicate that
iron oxidizing microorganisms may have contributed to the formation of BIF.
5.3 Materials and Methods
5.3.1 Flow reactors
A flow reactor experiment was designed to investigate microbial iron biomineralization
and TREE accumulation under controlled conditions that should as far as possible mimic
biomineral formation within any local natural biofilm. Dark, air-tight flow reactors (non-
pressurized) were employed to simulate the environmental conditions similar to cavities
within the surrounding granodioritic host rock (Figs. 5.1 b-f). Only chemically inert
materials such as polytetrafluoroethylene (PTFE, Teflon®), PTFE – fibre glass, fluorinated
ethylene propylene (FEP) and special PTFE – foam were used as construction materials to
avoid biological contamination from the surrounding environment and chemical
contamination from glass and plastic ware. The flow reactor systems and connection
tubings were thoroughly sterilized with ethanol (70%, overnight) before underground
installation.
Reference geochemical sampling of feeder fluids available at the different tunnel levels
was performed prior to installation of the flow reactors to select suitable installation sites.
According to the results, and considering published data (Ferris et al., 1999; Laaksoharju et
al., 1999; SICADA database), the flow reactor sets were connected to two chemically
different aquifers at 183m bsl (site 1327B) and 290m below sea level (site 2156B)
(Fig. 5.1 b-d). The shallower aquifer shows a major Baltic Sea water influence, whereas
the deeper aquifer contains a mixture of recent and ancient Baltic Sea water, and glacial
melt water. Both aquifers contained the iron oxidizing bacterium G. ferruginea.
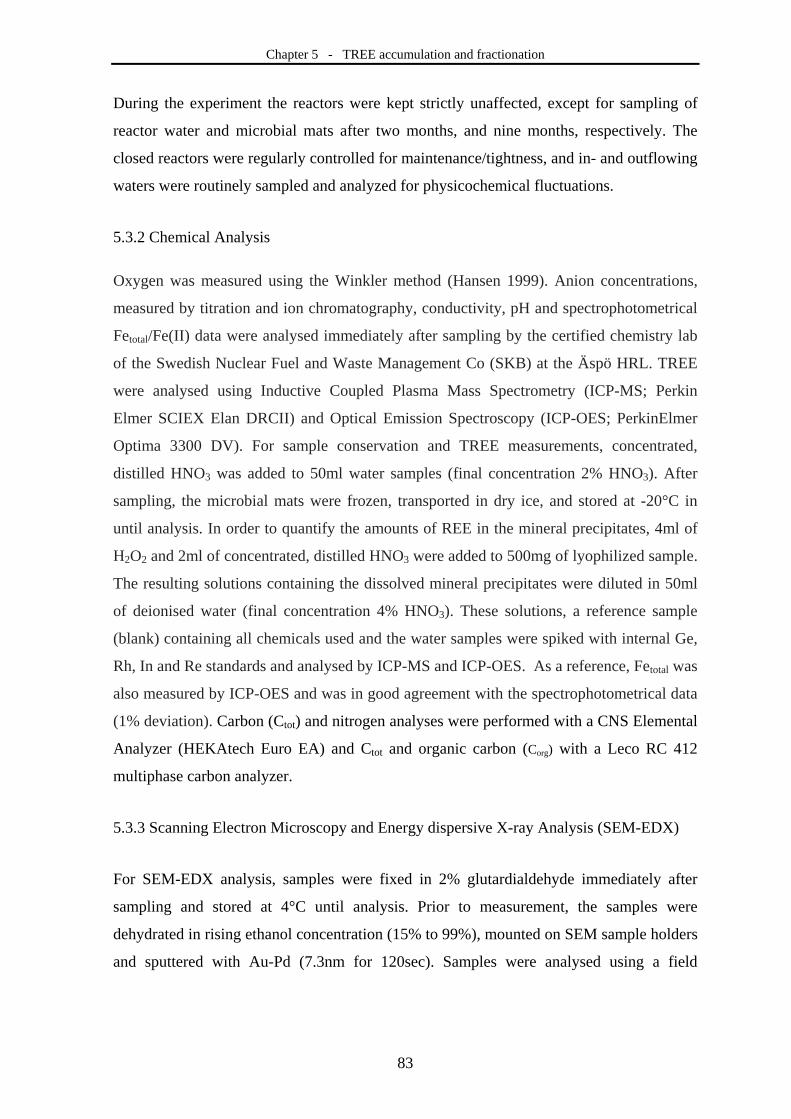
Chapter 5 - TREE accumulation and fractionation
83
During the experiment the reactors were kept strictly unaffected, except for sampling of
reactor water and microbial mats after two months, and nine months, respectively. The
closed reactors were regularly controlled for maintenance/tightness, and in- and outflowing
waters were routinely sampled and analyzed for physicochemical fluctuations.
5.3.2 Chemical Analysis
Oxygen was measured using the Winkler method (Hansen 1999). Anion concentrations,
measured by titration and ion chromatography, conductivity, pH and spectrophotometrical
Fetotal/Fe(II) data were analysed immediately after sampling by the certified chemistry lab
of the Swedish Nuclear Fuel and Waste Management Co (SKB) at the Äspö HRL. TREE
were analysed using Inductive Coupled Plasma Mass Spectrometry (ICP-MS; Perkin
Elmer SCIEX Elan DRCII) and Optical Emission Spectroscopy (ICP-OES; PerkinElmer
Optima 3300 DV). For sample conservation and TREE measurements, concentrated,
distilled HNO3 was added to 50ml water samples (final concentration 2% HNO3). After
sampling, the microbial mats were frozen, transported in dry ice, and stored at -20°C in
until analysis. In order to quantify the amounts of REE in the mineral precipitates, 4ml of
H2O2 and 2ml of concentrated, distilled HNO3 were added to 500mg of lyophilized sample.
The resulting solutions containing the dissolved mineral precipitates were diluted in 50ml
of deionised water (final concentration 4% HNO3). These solutions, a reference sample
(blank) containing all chemicals used and the water samples were spiked with internal Ge,
Rh, In and Re standards and analysed by ICP-MS and ICP-OES. As a reference, Fetotal was
also measured by ICP-OES and was in good agreement with the spectrophotometrical data
(1% deviation). Carbon (Ctot) and nitrogen analyses were performed with a CNS Elemental
Analyzer (HEKAtech Euro EA) and Ctot and organic carbon (Corg) with a Leco RC 412
multiphase carbon analyzer.
5.3.3 Scanning Electron Microscopy and Energy dispersive X-ray Analysis (SEM-EDX)
For SEM-EDX analysis, samples were fixed in 2% glutardialdehyde immediately after
sampling and stored at 4°C until analysis. Prior to measurement, the samples were
dehydrated in rising ethanol concentration (15% to 99%), mounted on SEM sample holders
and sputtered with Au-Pd (7.3nm for 120sec). Samples were analysed using a field

Chapter 5 - TREE accumulation and fractionation
84
emission SEM (LEO 1530 Gemini) combined with an INCA X-act EDX (Oxford
Instruments).
5.4 Results
5.4.1 Feeder fluid chemistry
Basic water chemistry data for the feeder fluids are given in Table 1. Replicate analyses (data not
shown) revealed that their chemical properties remained virtually stable over the duration of the
experiments (STD below 10%). Both feeder fluids contained brackish waters with salinities of
5.8‰ at site 1327B (183m bsl), and 7‰ at site 2156B (290m bsl). Oxygen measurements revealed
stable O2-concentrations between 0.28 and 0.38mg/l in the feeder fluids and thus, suboxic
conditions. The shallower aquifer, being influenced by recent Baltic Sea water, contained higher
amounts of sulphate and showed a higher alkalinity. At both sites, Fe in the feeder fluids is
exclusively present as ferrous iron (Fe (II), Tab. 5.1). Fe concentrations were considerably higher at
site 1327B than at site 2156B.
pH Cond. mS/m
HCO3-
[mg/l] Cl-
[mg/l] Br-
[mg/l]F-
[mg/l] SO4
2- [mg/l]
Sulfide [mg/l]
Fetotal [mg/l]
Fe2+ [mg/l]
O2 [mg/l]
1327B feeder fluid 7.33 978 209 3059 14.3 1.54 425 0.07 1.68 1.68 0.28 2156B feeder fluid 7.41 1188 139 3926 19.4 1.51 313 0.03 0.60 0.59 0.38
Table 5.1 Basic chemical parameters characterizing the feeder fluids. Mean values (<10% STD)
obtained from replicate sampling over the duration of the experiment.
5.4.2 Microbial mat development
Both flow reactors showed a rapid development of microbial mats after two months.
Macroscopically, the mats consisted of ochre, fluffy material (Fig. 5.1f). SEM studies
showed a massive abundance of twisted filamentous EPS stalks characteristic for G.
ferruginea (Fig. 5.2a). These stalks still showed a delicate filamentous structure with only
few mineral precipitates (Fig. 5.2b).
After nine months, the flow reactor at both sites still exhibited macroscopically similar
microbial mats, but the stalks were extensively incrusted with mineral precipitates
(Fig. 5.2c). These minerals predominantly consisted of 2-line ferrihydrite, as revealed by
XRD measurements (data not shown). Although microbially formed ferrihydrites are
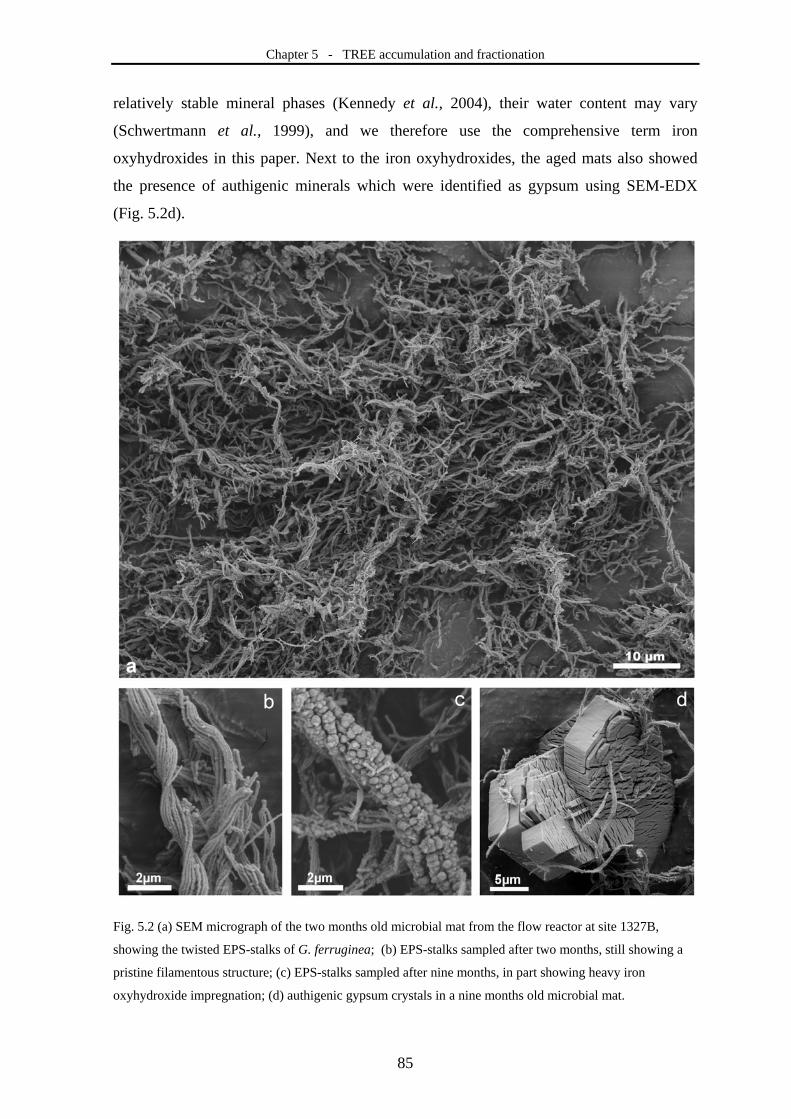
Chapter 5 - TREE accumulation and fractionation
85
relatively stable mineral phases (Kennedy et al., 2004), their water content may vary
(Schwertmann et al., 1999), and we therefore use the comprehensive term iron
oxyhydroxides in this paper. Next to the iron oxyhydroxides, the aged mats also showed
the presence of authigenic minerals which were identified as gypsum using SEM-EDX
(Fig. 5.2d).
Fig. 5.2 (a) SEM micrograph of the two months old microbial mat from the flow reactor at site 1327B,
showing the twisted EPS-stalks of G. ferruginea; (b) EPS-stalks sampled after two months, still showing a
pristine filamentous structure; (c) EPS-stalks sampled after nine months, in part showing heavy iron
oxyhydroxide impregnation; (d) authigenic gypsum crystals in a nine months old microbial mat.
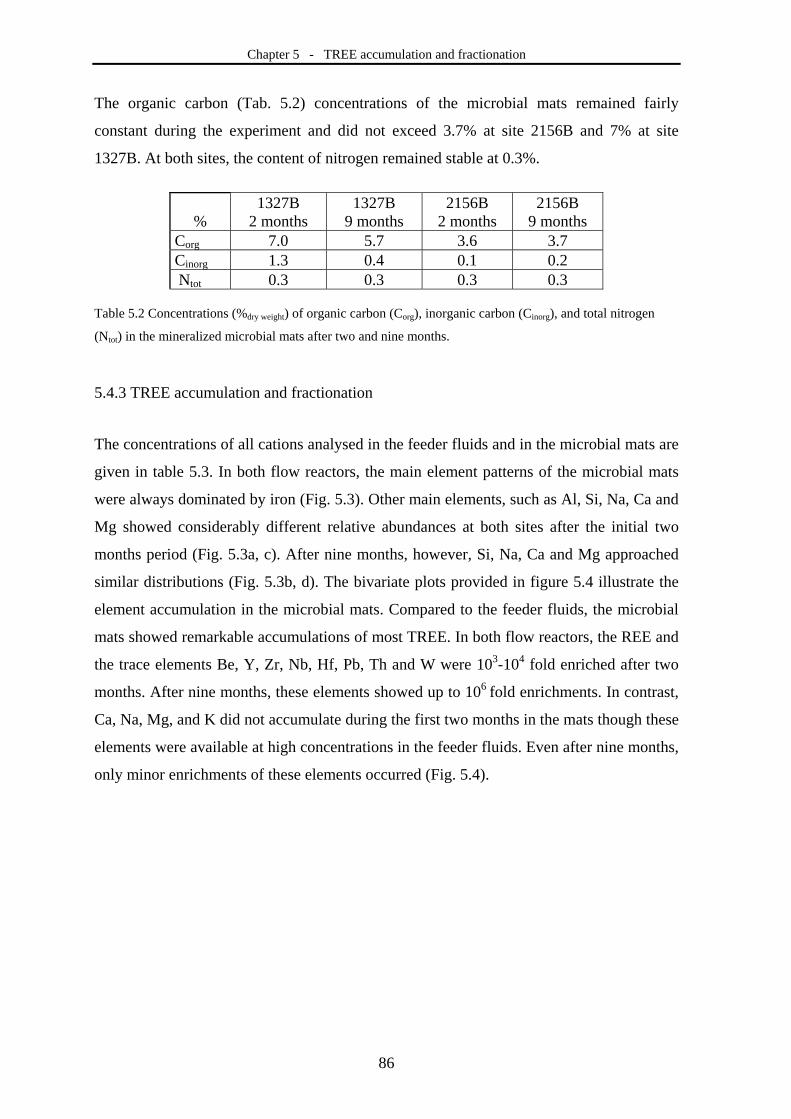
Chapter 5 - TREE accumulation and fractionation
86
The organic carbon (Tab. 5.2) concentrations of the microbial mats remained fairly
constant during the experiment and did not exceed 3.7% at site 2156B and 7% at site
1327B. At both sites, the content of nitrogen remained stable at 0.3%.
% 1327B
2 months 1327B
9 months 2156B
2 months 2156B
9 months Corg 7.0 5.7 3.6 3.7 Cinorg 1.3 0.4 0.1 0.2 Ntot 0.3 0.3 0.3 0.3
Table 5.2 Concentrations (%dry weight) of organic carbon (Corg), inorganic carbon (Cinorg), and total nitrogen
(Ntot) in the mineralized microbial mats after two and nine months.
5.4.3 TREE accumulation and fractionation
The concentrations of all cations analysed in the feeder fluids and in the microbial mats are
given in table 5.3. In both flow reactors, the main element patterns of the microbial mats
were always dominated by iron (Fig. 5.3). Other main elements, such as Al, Si, Na, Ca and
Mg showed considerably different relative abundances at both sites after the initial two
months period (Fig. 5.3a, c). After nine months, however, Si, Na, Ca and Mg approached
similar distributions (Fig. 5.3b, d). The bivariate plots provided in figure 5.4 illustrate the
element accumulation in the microbial mats. Compared to the feeder fluids, the microbial
mats showed remarkable accumulations of most TREE. In both flow reactors, the REE and
the trace elements Be, Y, Zr, Nb, Hf, Pb, Th and W were 103-104 fold enriched after two
months. After nine months, these elements showed up to 106 fold enrichments. In contrast,
Ca, Na, Mg, and K did not accumulate during the first two months in the mats though these
elements were available at high concentrations in the feeder fluids. Even after nine months,
only minor enrichments of these elements occurred (Fig. 5.4).
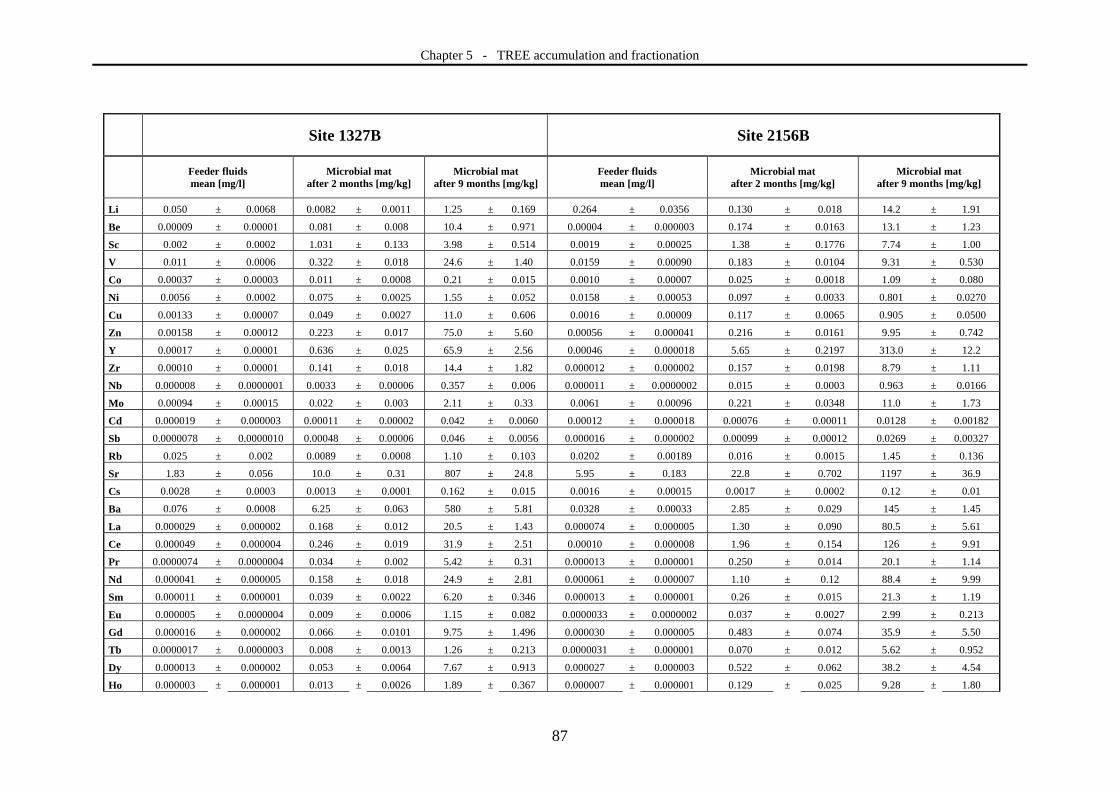
Chapter 5 - TREE accumulation and fractionation
87
Site 1327B Site 2156B
Feeder fluids mean [mg/l]
Microbial mat after 2 months [mg/kg]
Microbial mat after 9 months [mg/kg]
Feeder fluids mean [mg/l]
Microbial mat after 2 months [mg/kg]
Microbial mat after 9 months [mg/kg]
Li 0.050 ± 0.0068 0.0082 ± 0.0011 1.25 ± 0.169 0.264 ± 0.0356 0.130 ± 0.018 14.2 ± 1.91
Be 0.00009 ± 0.00001 0.081 ± 0.008 10.4 ± 0.971 0.00004 ± 0.000003 0.174 ± 0.0163 13.1 ± 1.23
Sc 0.002 ± 0.0002 1.031 ± 0.133 3.98 ± 0.514 0.0019 ± 0.00025 1.38 ± 0.1776 7.74 ± 1.00
V 0.011 ± 0.0006 0.322 ± 0.018 24.6 ± 1.40 0.0159 ± 0.00090 0.183 ± 0.0104 9.31 ± 0.530
Co 0.00037 ± 0.00003 0.011 ± 0.0008 0.21 ± 0.015 0.0010 ± 0.00007 0.025 ± 0.0018 1.09 ± 0.080
Ni 0.0056 ± 0.0002 0.075 ± 0.0025 1.55 ± 0.052 0.0158 ± 0.00053 0.097 ± 0.0033 0.801 ± 0.0270
Cu 0.00133 ± 0.00007 0.049 ± 0.0027 11.0 ± 0.606 0.0016 ± 0.00009 0.117 ± 0.0065 0.905 ± 0.0500
Zn 0.00158 ± 0.00012 0.223 ± 0.017 75.0 ± 5.60 0.00056 ± 0.000041 0.216 ± 0.0161 9.95 ± 0.742
Y 0.00017 ± 0.00001 0.636 ± 0.025 65.9 ± 2.56 0.00046 ± 0.000018 5.65 ± 0.2197 313.0 ± 12.2
Zr 0.00010 ± 0.00001 0.141 ± 0.018 14.4 ± 1.82 0.000012 ± 0.000002 0.157 ± 0.0198 8.79 ± 1.11
Nb 0.000008 ± 0.0000001 0.0033 ± 0.00006 0.357 ± 0.006 0.000011 ± 0.0000002 0.015 ± 0.0003 0.963 ± 0.0166
Mo 0.00094 ± 0.00015 0.022 ± 0.003 2.11 ± 0.33 0.0061 ± 0.00096 0.221 ± 0.0348 11.0 ± 1.73
Cd 0.000019 ± 0.000003 0.00011 ± 0.00002 0.042 ± 0.0060 0.00012 ± 0.000018 0.00076 ± 0.00011 0.0128 ± 0.00182
Sb 0.0000078 ± 0.0000010 0.00048 ± 0.00006 0.046 ± 0.0056 0.000016 ± 0.000002 0.00099 ± 0.00012 0.0269 ± 0.00327
Rb 0.025 ± 0.002 0.0089 ± 0.0008 1.10 ± 0.103 0.0202 ± 0.00189 0.016 ± 0.0015 1.45 ± 0.136
Sr 1.83 ± 0.056 10.0 ± 0.31 807 ± 24.8 5.95 ± 0.183 22.8 ± 0.702 1197 ± 36.9
Cs 0.0028 ± 0.0003 0.0013 ± 0.0001 0.162 ± 0.015 0.0016 ± 0.00015 0.0017 ± 0.0002 0.12 ± 0.01
Ba 0.076 ± 0.0008 6.25 ± 0.063 580 ± 5.81 0.0328 ± 0.00033 2.85 ± 0.029 145 ± 1.45
La 0.000029 ± 0.000002 0.168 ± 0.012 20.5 ± 1.43 0.000074 ± 0.000005 1.30 ± 0.090 80.5 ± 5.61
Ce 0.000049 ± 0.000004 0.246 ± 0.019 31.9 ± 2.51 0.00010 ± 0.000008 1.96 ± 0.154 126 ± 9.91
Pr 0.0000074 ± 0.0000004 0.034 ± 0.002 5.42 ± 0.31 0.000013 ± 0.000001 0.250 ± 0.014 20.1 ± 1.14
Nd 0.000041 ± 0.000005 0.158 ± 0.018 24.9 ± 2.81 0.000061 ± 0.000007 1.10 ± 0.12 88.4 ± 9.99
Sm 0.000011 ± 0.000001 0.039 ± 0.0022 6.20 ± 0.346 0.000013 ± 0.000001 0.26 ± 0.015 21.3 ± 1.19
Eu 0.000005 ± 0.0000004 0.009 ± 0.0006 1.15 ± 0.082 0.0000033 ± 0.0000002 0.037 ± 0.0027 2.99 ± 0.213
Gd 0.000016 ± 0.000002 0.066 ± 0.0101 9.75 ± 1.496 0.000030 ± 0.000005 0.483 ± 0.074 35.9 ± 5.50
Tb 0.0000017 ± 0.0000003 0.008 ± 0.0013 1.26 ± 0.213 0.0000031 ± 0.000001 0.070 ± 0.012 5.62 ± 0.952
Dy 0.000013 ± 0.000002 0.053 ± 0.0064 7.67 ± 0.913 0.000027 ± 0.000003 0.522 ± 0.062 38.2 ± 4.54
Ho 0.000003 ± 0.000001 0.013 ± 0.0026 1.89 ± 0.367 0.000007 ± 0.000001 0.129 ± 0.025 9.28 ± 1.80
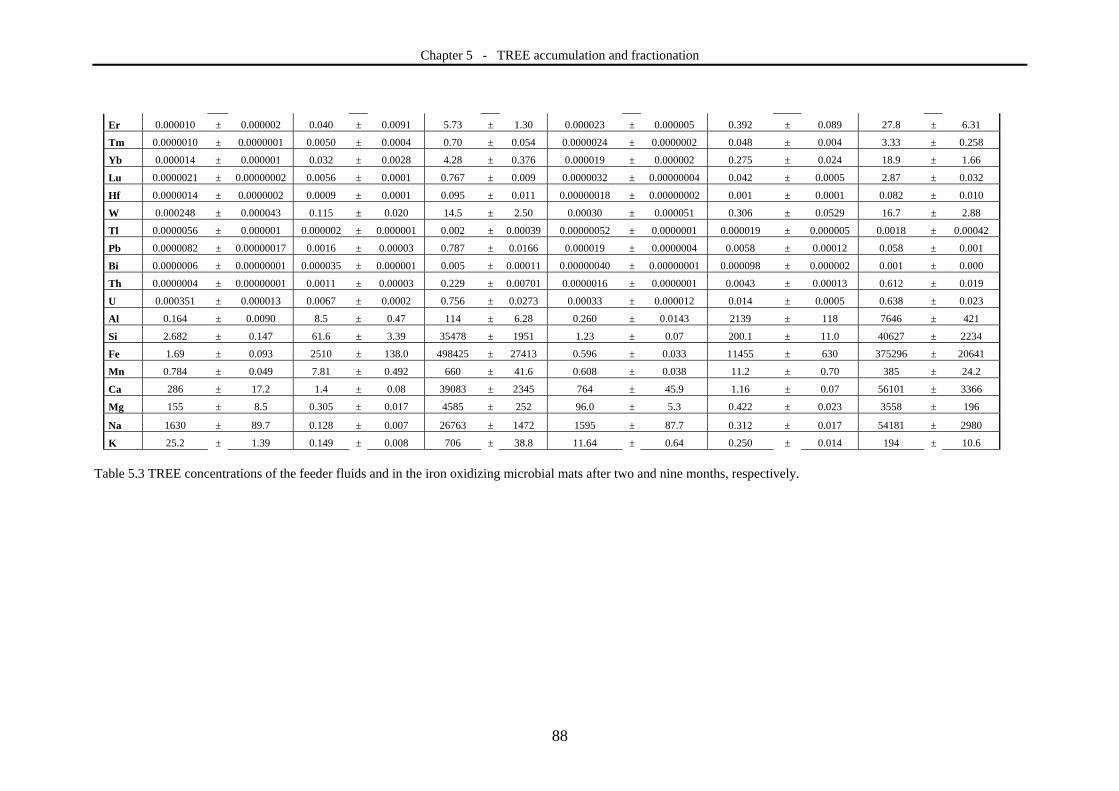
Chapter 5 - TREE accumulation and fractionation
88
Er 0.000010 ± 0.000002 0.040 ± 0.0091 5.73 ± 1.30 0.000023 ± 0.000005 0.392 ± 0.089 27.8 ± 6.31
Tm 0.0000010 ± 0.0000001 0.0050 ± 0.0004 0.70 ± 0.054 0.0000024 ± 0.0000002 0.048 ± 0.004 3.33 ± 0.258
Yb 0.000014 ± 0.000001 0.032 ± 0.0028 4.28 ± 0.376 0.000019 ± 0.000002 0.275 ± 0.024 18.9 ± 1.66
Lu 0.0000021 ± 0.00000002 0.0056 ± 0.0001 0.767 ± 0.009 0.0000032 ± 0.00000004 0.042 ± 0.0005 2.87 ± 0.032
Hf 0.0000014 ± 0.0000002 0.0009 ± 0.0001 0.095 ± 0.011 0.00000018 ± 0.00000002 0.001 ± 0.0001 0.082 ± 0.010
W 0.000248 ± 0.000043 0.115 ± 0.020 14.5 ± 2.50 0.00030 ± 0.000051 0.306 ± 0.0529 16.7 ± 2.88
Tl 0.0000056 ± 0.000001 0.000002 ± 0.000001 0.002 ± 0.00039 0.00000052 ± 0.0000001 0.000019 ± 0.000005 0.0018 ± 0.00042
Pb 0.0000082 ± 0.00000017 0.0016 ± 0.00003 0.787 ± 0.0166 0.000019 ± 0.0000004 0.0058 ± 0.00012 0.058 ± 0.001
Bi 0.0000006 ± 0.00000001 0.000035 ± 0.000001 0.005 ± 0.00011 0.00000040 ± 0.00000001 0.000098 ± 0.000002 0.001 ± 0.000
Th 0.0000004 ± 0.00000001 0.0011 ± 0.00003 0.229 ± 0.00701 0.0000016 ± 0.0000001 0.0043 ± 0.00013 0.612 ± 0.019
U 0.000351 ± 0.000013 0.0067 ± 0.0002 0.756 ± 0.0273 0.00033 ± 0.000012 0.014 ± 0.0005 0.638 ± 0.023
Al 0.164 ± 0.0090 8.5 ± 0.47 114 ± 6.28 0.260 ± 0.0143 2139 ± 118 7646 ± 421
Si 2.682 ± 0.147 61.6 ± 3.39 35478 ± 1951 1.23 ± 0.07 200.1 ± 11.0 40627 ± 2234
Fe 1.69 ± 0.093 2510 ± 138.0 498425 ± 27413 0.596 ± 0.033 11455 ± 630 375296 ± 20641
Mn 0.784 ± 0.049 7.81 ± 0.492 660 ± 41.6 0.608 ± 0.038 11.2 ± 0.70 385 ± 24.2
Ca 286 ± 17.2 1.4 ± 0.08 39083 ± 2345 764 ± 45.9 1.16 ± 0.07 56101 ± 3366
Mg 155 ± 8.5 0.305 ± 0.017 4585 ± 252 96.0 ± 5.3 0.422 ± 0.023 3558 ± 196
Na 1630 ± 89.7 0.128 ± 0.007 26763 ± 1472 1595 ± 87.7 0.312 ± 0.017 54181 ± 2980
K 25.2 ± 1.39 0.149 ± 0.008 706 ± 38.8 11.64 ± 0.64 0.250 ± 0.014 194 ± 10.6
Table 5.3 TREE concentrations of the feeder fluids and in the iron oxidizing microbial mats after two and nine months, respectively.
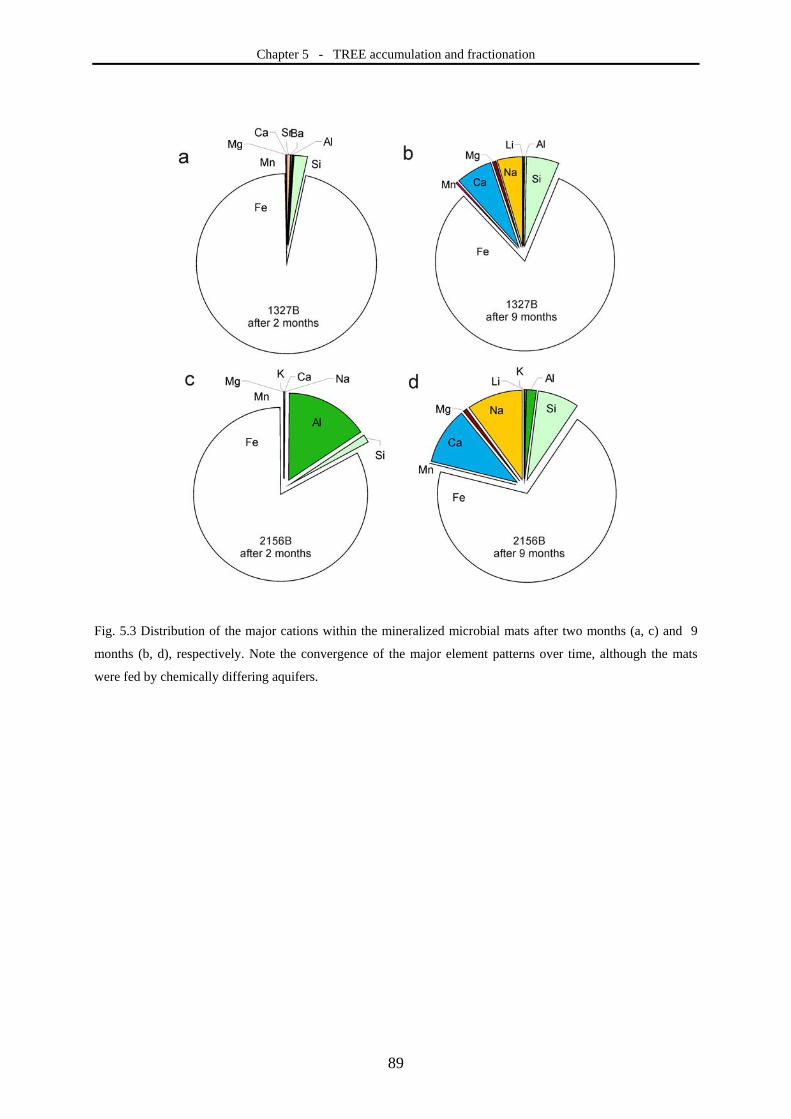
Chapter 5 - TREE accumulation and fractionation
89
Fig. 5.3 Distribution of the major cations within the mineralized microbial mats after two months (a, c) and 9
months (b, d), respectively. Note the convergence of the major element patterns over time, although the mats
were fed by chemically differing aquifers.
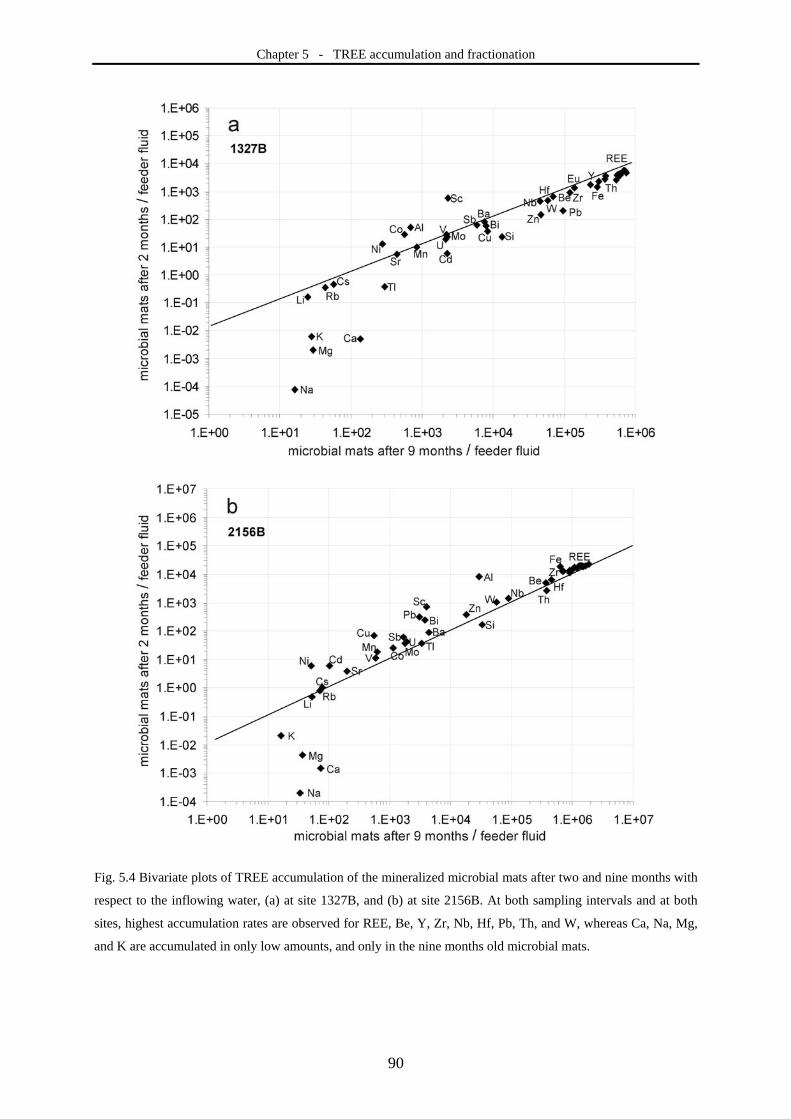
Chapter 5 - TREE accumulation and fractionation
90
Fig. 5.4 Bivariate plots of TREE accumulation of the mineralized microbial mats after two and nine months with
respect to the inflowing water, (a) at site 1327B, and (b) at site 2156B. At both sampling intervals and at both
sites, highest accumulation rates are observed for REE, Be, Y, Zr, Nb, Hf, Pb, Th, and W, whereas Ca, Na, Mg,
and K are accumulated in only low amounts, and only in the nine months old microbial mats.
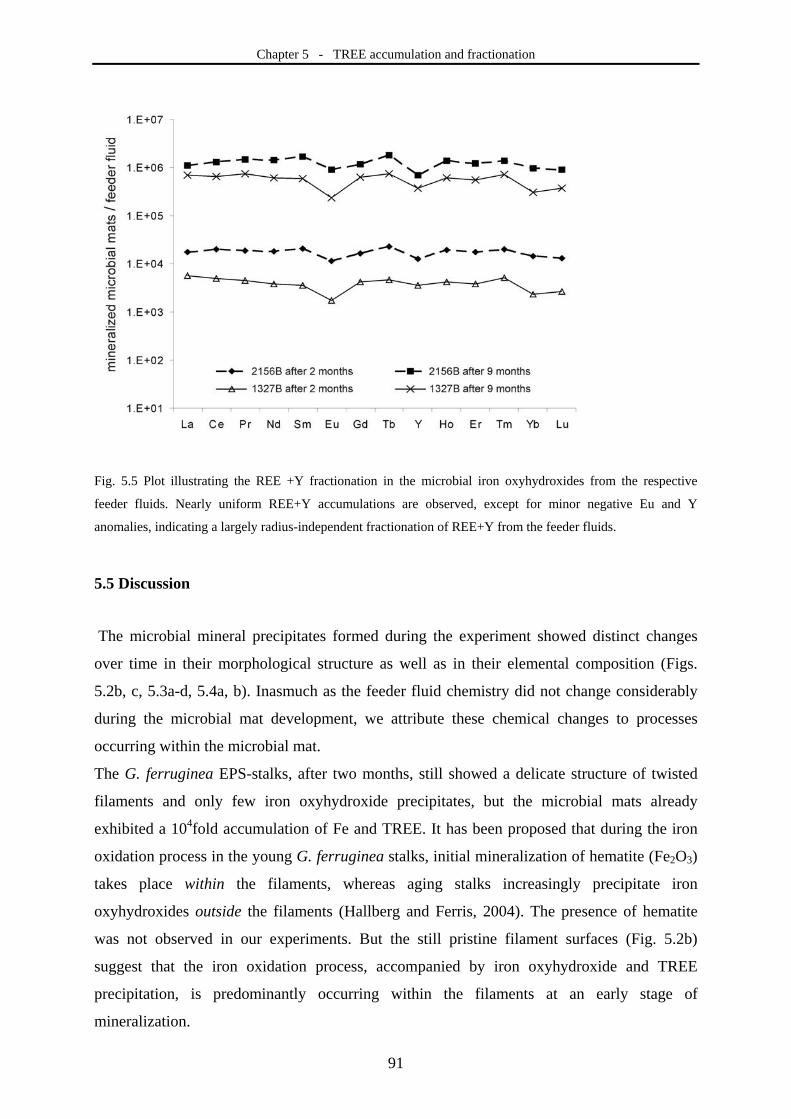
Chapter 5 - TREE accumulation and fractionation
91
Fig. 5.5 Plot illustrating the REE +Y fractionation in the microbial iron oxyhydroxides from the respective
feeder fluids. Nearly uniform REE+Y accumulations are observed, except for minor negative Eu and Y
anomalies, indicating a largely radius-independent fractionation of REE+Y from the feeder fluids.
5.5 Discussion
The microbial mineral precipitates formed during the experiment showed distinct changes
over time in their morphological structure as well as in their elemental composition (Figs.
5.2b, c, 5.3a-d, 5.4a, b). Inasmuch as the feeder fluid chemistry did not change considerably
during the microbial mat development, we attribute these chemical changes to processes
occurring within the microbial mat.
The G. ferruginea EPS-stalks, after two months, still showed a delicate structure of twisted
filaments and only few iron oxyhydroxide precipitates, but the microbial mats already
exhibited a 104fold accumulation of Fe and TREE. It has been proposed that during the iron
oxidation process in the young G. ferruginea stalks, initial mineralization of hematite (Fe2O3)
takes place within the filaments, whereas aging stalks increasingly precipitate iron
oxyhydroxides outside the filaments (Hallberg and Ferris, 2004). The presence of hematite
was not observed in our experiments. But the still pristine filament surfaces (Fig. 5.2b)
suggest that the iron oxidation process, accompanied by iron oxyhydroxide and TREE
precipitation, is predominantly occurring within the filaments at an early stage of
mineralization.
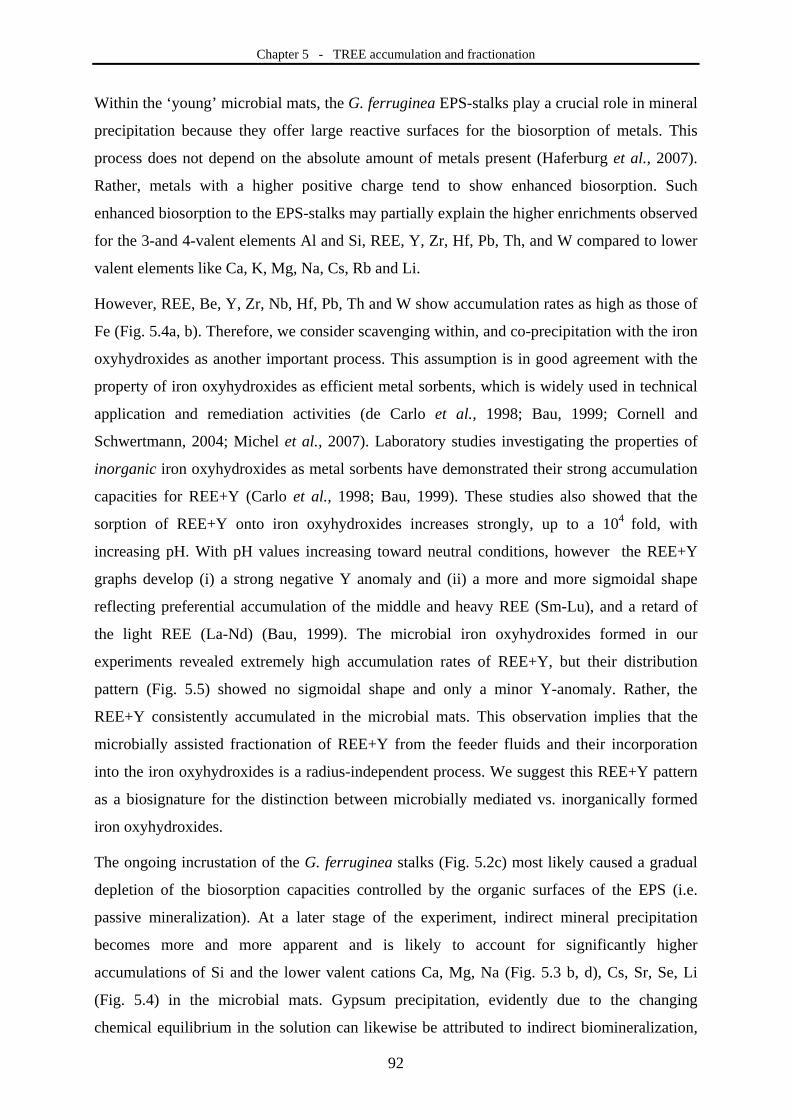
Chapter 5 - TREE accumulation and fractionation
92
Within the ‘young’ microbial mats, the G. ferruginea EPS-stalks play a crucial role in mineral
precipitation because they offer large reactive surfaces for the biosorption of metals. This
process does not depend on the absolute amount of metals present (Haferburg et al., 2007).
Rather, metals with a higher positive charge tend to show enhanced biosorption. Such
enhanced biosorption to the EPS-stalks may partially explain the higher enrichments observed
for the 3-and 4-valent elements Al and Si, REE, Y, Zr, Hf, Pb, Th, and W compared to lower
valent elements like Ca, K, Mg, Na, Cs, Rb and Li.
However, REE, Be, Y, Zr, Nb, Hf, Pb, Th and W show accumulation rates as high as those of
Fe (Fig. 5.4a, b). Therefore, we consider scavenging within, and co-precipitation with the iron
oxyhydroxides as another important process. This assumption is in good agreement with the
property of iron oxyhydroxides as efficient metal sorbents, which is widely used in technical
application and remediation activities (de Carlo et al., 1998; Bau, 1999; Cornell and
Schwertmann, 2004; Michel et al., 2007). Laboratory studies investigating the properties of
inorganic iron oxyhydroxides as metal sorbents have demonstrated their strong accumulation
capacities for REE+Y (Carlo et al., 1998; Bau, 1999). These studies also showed that the
sorption of REE+Y onto iron oxyhydroxides increases strongly, up to a 104 fold, with
increasing pH. With pH values increasing toward neutral conditions, however the REE+Y
graphs develop (i) a strong negative Y anomaly and (ii) a more and more sigmoidal shape
reflecting preferential accumulation of the middle and heavy REE (Sm-Lu), and a retard of
the light REE (La-Nd) (Bau, 1999). The microbial iron oxyhydroxides formed in our
experiments revealed extremely high accumulation rates of REE+Y, but their distribution
pattern (Fig. 5.5) showed no sigmoidal shape and only a minor Y-anomaly. Rather, the
REE+Y consistently accumulated in the microbial mats. This observation implies that the
microbially assisted fractionation of REE+Y from the feeder fluids and their incorporation
into the iron oxyhydroxides is a radius-independent process. We suggest this REE+Y pattern
as a biosignature for the distinction between microbially mediated vs. inorganically formed
iron oxyhydroxides.
The ongoing incrustation of the G. ferruginea stalks (Fig. 5.2c) most likely caused a gradual
depletion of the biosorption capacities controlled by the organic surfaces of the EPS (i.e.
passive mineralization). At a later stage of the experiment, indirect mineral precipitation
becomes more and more apparent and is likely to account for significantly higher
accumulations of Si and the lower valent cations Ca, Mg, Na (Fig. 5.3 b, d), Cs, Sr, Se, Li
(Fig. 5.4) in the microbial mats. Gypsum precipitation, evidently due to the changing
chemical equilibrium in the solution can likewise be attributed to indirect biomineralization,
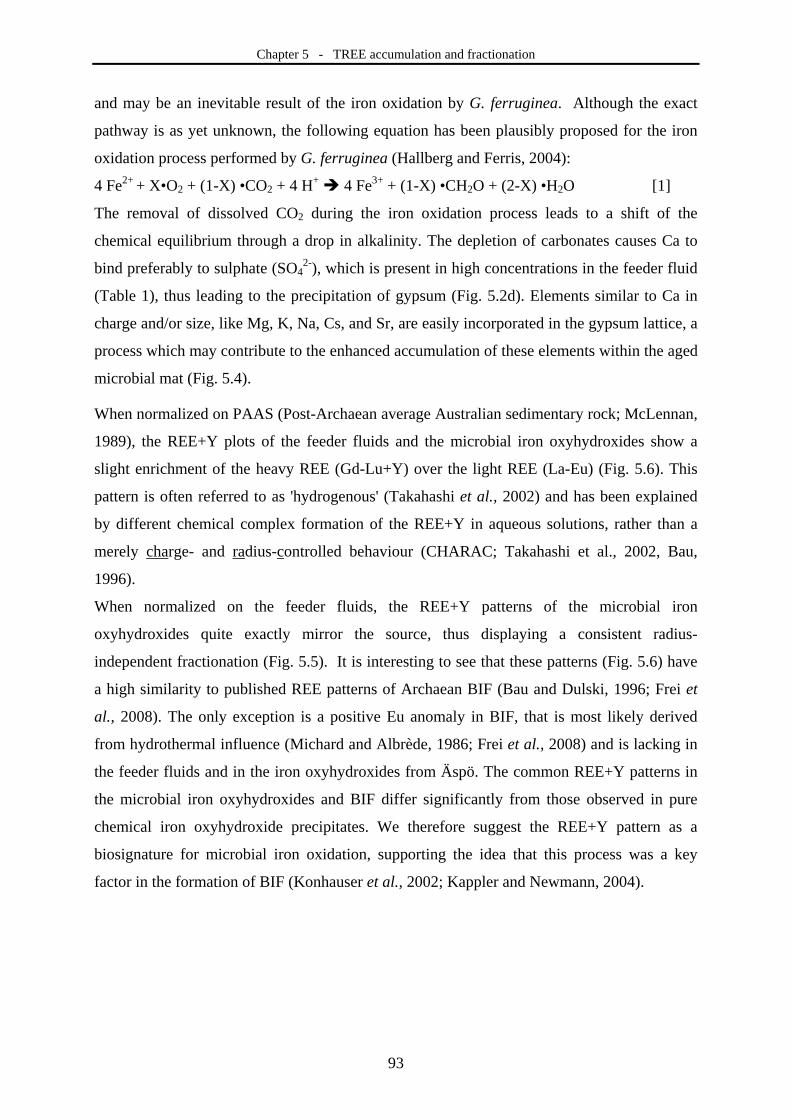
Chapter 5 - TREE accumulation and fractionation
93
and may be an inevitable result of the iron oxidation by G. ferruginea. Although the exact
pathway is as yet unknown, the following equation has been plausibly proposed for the iron
oxidation process performed by G. ferruginea (Hallberg and Ferris, 2004):
4 Fe2+ + X•O2 + (1-X) •CO2 + 4 H+ 4 Fe3+ + (1-X) •CH2O + (2-X) •H2O [1]
The removal of dissolved CO2 during the iron oxidation process leads to a shift of the
chemical equilibrium through a drop in alkalinity. The depletion of carbonates causes Ca to
bind preferably to sulphate (SO42-), which is present in high concentrations in the feeder fluid
(Table 1), thus leading to the precipitation of gypsum (Fig. 5.2d). Elements similar to Ca in
charge and/or size, like Mg, K, Na, Cs, and Sr, are easily incorporated in the gypsum lattice, a
process which may contribute to the enhanced accumulation of these elements within the aged
microbial mat (Fig. 5.4).
When normalized on PAAS (Post-Archaean average Australian sedimentary rock; McLennan,
1989), the REE+Y plots of the feeder fluids and the microbial iron oxyhydroxides show a
slight enrichment of the heavy REE (Gd-Lu+Y) over the light REE (La-Eu) (Fig. 5.6). This
pattern is often referred to as 'hydrogenous' (Takahashi et al., 2002) and has been explained
by different chemical complex formation of the REE+Y in aqueous solutions, rather than a
merely charge- and radius-controlled behaviour (CHARAC; Takahashi et al., 2002, Bau,
1996).
When normalized on the feeder fluids, the REE+Y patterns of the microbial iron
oxyhydroxides quite exactly mirror the source, thus displaying a consistent radius-
independent fractionation (Fig. 5.5). It is interesting to see that these patterns (Fig. 5.6) have
a high similarity to published REE patterns of Archaean BIF (Bau and Dulski, 1996; Frei et
al., 2008). The only exception is a positive Eu anomaly in BIF, that is most likely derived
from hydrothermal influence (Michard and Albrède, 1986; Frei et al., 2008) and is lacking in
the feeder fluids and in the iron oxyhydroxides from Äspö. The common REE+Y patterns in
the microbial iron oxyhydroxides and BIF differ significantly from those observed in pure
chemical iron oxyhydroxide precipitates. We therefore suggest the REE+Y pattern as a
biosignature for microbial iron oxidation, supporting the idea that this process was a key
factor in the formation of BIF (Konhauser et al., 2002; Kappler and Newmann, 2004).
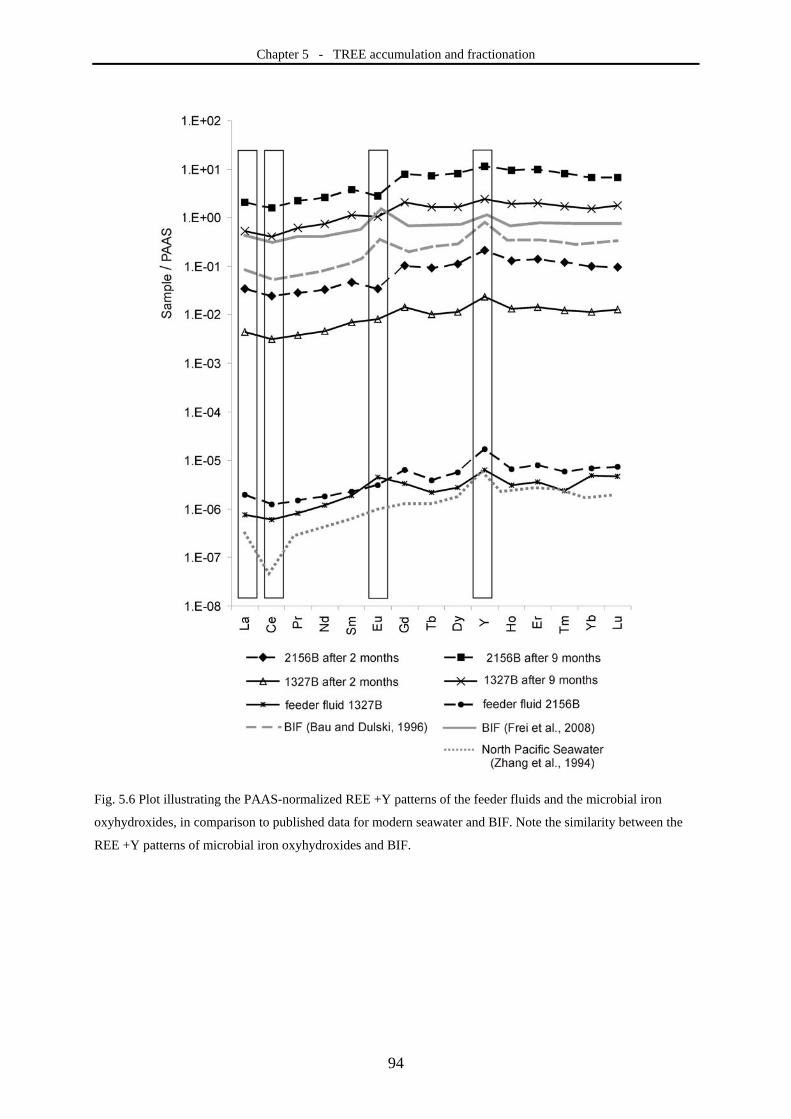
Chapter 5 - TREE accumulation and fractionation
94
Fig. 5.6 Plot illustrating the PAAS-normalized REE +Y patterns of the feeder fluids and the microbial iron
oxyhydroxides, in comparison to published data for modern seawater and BIF. Note the similarity between the
REE +Y patterns of microbial iron oxyhydroxides and BIF.
Chapter 5 - TREE accumulation and fractionation
95
5.6 Conclusions
In a suboxic aquifer system hosted by granodioritic rocks and influenced by Baltic Sea water,
the development of iron oxidizing microbial mats was studied employing a closed flow-
reactor system. Over the nine months of the experiment, the microbial mats were dominated
by the iron-oxidizing bacterium Gallionella ferruginea which precipitated microbial iron
oxyhydroxides along its EPS-stalks. The deposition of these iron minerals is initially
controlled by the metabolic activity of G. ferruginea and passive mineralisation processes
caused by the high biosorption capacity of the young EPS-stalks. Upon aging, ongoing iron
oxyhydroxide impregnation causes a gradual depletion of the biosorption capacities of the
EPS-stalks. As a result, indirect mineral precipitation becomes increasingly important over
time.
The iron-oxidizing microbial mats proved to be extremely efficient in the accumulation of
trace and rare earth elements (TREE), leading to massive (up to 106 fold) enrichments of
individual metals in the microbial iron oxyhydroxides. The REE+Y pattern of the microbial
iron oxyhydroxides is distinctly different from chemically precipitated iron oxyhydroxides,
but shows a strong resemblance to REE+Y patterns of Banded Iron Formations (BIF). These
findings lend further support to the hypothesis that iron-oxidizing microorganisms such as G.
ferruginea may have been involved in the formation of BIF.
Acknowledgments:
Andreas Pack is acknowledged for his constructive comments that helped to improve the
manuscript. We are grateful to Emmeli Johansson, Magnus Kronberg, Teresita Morales and
the SKB Chemistry Lab staff from SKB for technical, logistic and analytical support at the
Äspö HRL. Volker Karius and Veit-Enno Hoffmann, Erwin Schiffzyk, and Dorothea Hause-
Reitner are acknowledged for their assistance with the XRD, ICP-OES, and SEM-EDX
measurements, respectively. Our study received financial support from the German Research
Foundation (DFG). This is publication no. XX of the DFG Research Unit FOR 571
‘Geobiology of Organo- and Biofilms’.
Chapter 5 - TREE accumulation and fractionation
96
References:
Anbar AD, Duan Y, Lyons TW, Arnold GL, Kendall B, Creaser RA, Kaufman AJ, Gordon GW, Scott C, Garvin
J, Buick R (2007) A whiff of oxygen before the Great Oxidation Event? Science, 317, 1903-1906.
Anderson C R, Pedersen K (2003) In situ growth of Gallionella biofilms and partitioning of lanthanides and
actinides between biological material and ferric oxyhydroxides. Gebiology, 1, 169-178.
Bau M (1999) Scavening of dissolved yttrium and rare earths by precipitatin iron oxyhydroxide: Experimental
evidence for Ce oxidation, Y-Ho fractionation, and lanthanide tetrade effect. Geochimimica et
Cosmochimica Acta, 63, 67-77.
Bau M (1996) Controls on the fractionation of isovalent trace elements in magmatic and aqueous systems:
evidence from Y/Ho, Zr/Hf, and lanthanide tetrad effect. Contributionsto Mineral Petrology, 123, 323-
333.
Bau M, Dulski P (1996) Distribution of yttrium and rare-earth elements in the Penge and Kuruman iron-
formations, Transvaal Supergroup, South Africa. Precambrian Research, 79, 37–55.
Bau M, Möller P (1993) Rare earth element systematics of the chemically precipitated component in Early
Precambrian iron-formations and the evolution of the terrestrial atmosphere-hydrosphere-lithosphere
system. Geochimimica et Cosmochimica Acta, 57, 2239-2249.
Bazylinski DA, Frankel RB, Konhauser KO (2007) Modes of biomineralization of magnetite by microbes.
Geomicrobiology Journal, 24, 465-475.
Chan CS, Fakra SC, Edwards DC, Emerson D, Banfiled JF (2009) Iron oxyhydroxide mineralization of
microbial extracellular polysaccharides. Geochimimica et Cosmochimica Acta, 73, 3807-3818.
Cornell M, Schwertmann U (2004) The Iron Oxides. Wiley-VCH, 664 p.
De Carlo EH, Wen X-Y, Irving M (1998) The influence of redox reactions on the uptake of dissolved Ce by
suspended Fe and Mn oxide paricles. Aquatic Geochemistry, 3, 257-289.
Ehrenberg CG (1836) Vorläufige Mitteilungen über das wirkliche Vorkommen fossilier Infusorien und ihre
große Verbreitung. Poggendorf’s Annalen der Physik und Chemie, 38, 213-227.
Ercole C, Cacchio P, Botta AL, Centi V, Lepidi A (2007) Bacterially induced mineralization of calcium
carboante: The role of exopolysaccharides and capsular polysaccharides. Microscopy and Microanalysis,
13, 42-50.
Ferris FG, Hallberg RO, Lyvén B, Pedersen K (2000) Retention of strontium, cesium, lead and uranium by
bacterial iron oxides from subterranean environment. Applied Geochemistry, 15, 1035-1042.
Ferris FG, Kohnhauser KO, Lyvén B, Pedersen K (1999) Accumulation of metals by bacteriogenic iron oxides in
a subterranean environment. Geomicrobiology Journal, 16, 181-192.
Fortin D, Beveridge TJ (1997) Role of the bacterium Thiobacillus in the formation of silicates in acidic mine
tailings. Chemical Geology, 141, 235-250.
Fortin D, Ferris FG, Beveridge TJ (1997) Surface-mediated mineral development by bacteria. In
Geomicrobiology: Interactions between microbes and minerals. Reviews in Mineralogy Vol. 35, Ribbe PH
(series ed), Mineralogical Society of America. 161-180.
Frankel RB, Bazylinski DA (2003) Biologically induced mineralization by bacteria. In Dove PM,
De Yoreo JJ, Weiner S (eds), Biomineralization. Reviews in Mineralogy and Geochemistry Vol. 54, series
editor Rosso JJ, Mineralogical Society of America & Geochemical Society, 95-114.
Chapter 5 - TREE accumulation and fractionation
97
Frei R, Dahl PS, Duke EF, Frei KM, Hansen TR, Fransson MM, Jensen LA (2008). Trace element and isotopic
characterisation of Neoarchean and Paleoproterozoic formations in the Black Hills (South Dakota, USA):
Assessment of chemical change during 2.9-1.9 Ga deposition bracketing the 2.4-2.2 Ga first rise of
atmospheric oxygen. Precambrian Research, 162, 441-474.
Haferburg G, Merten D, Büchel G, Kothe E (2007) Biosorption of metal and salt tolerant microbial isolates from
a former uranium mining aerea. Their impact on changes in rare earth element patterns in acid mine
drainage. Journal of Basic Microbiology, 47, 474-484.
Haferburg G, Kothe E (2007) Microbes and metals: interactions in the environment. Journal of Basic
Microbiology, 47, 453-467.
Hallbeck L, Pedersen K (1995) Benefits associated with the stalk of Gallionella ferruginea, evaluated by
comparison of a stalk-forming and non-stalk-forming strain and biofilm studies in situ. Microbial
Ecology, 30, 257-268.
Hallbeck L, Ståhl F, Pedersen K (1993) Phylogeny and phenotypic characterization of the stalk-formin and iron
oxidizing bacterium Galionella ferruginea. Journal of General Microbiology, 139, 1531-1535.
Hallbeck L, Pedersen K (1991) Autotrophic and mixothrophic growth of Gallionella ferruginea. Journal of
General Microbiology, 137, 2657-2661.
Hallberg R, Ferris FG (2004) Biomineralization by Gallionella. Geomicrobiology Journal, 21, 325-330.
Hansen HP (1999) Determination of oxygen. In Grasshoff K, Kremling K, Ehrhardt M (eds.) Methods of
seawater analysis. Wiley-VCH, 75-89.
Kappler A, Straub B, Newman DK (2005) Fe(III) mineral formation and cell incrustation by the nitrate-
dependent Fe(II)-oxidizer strain BoFeN1. Geobiology, 3, 235-245.
Kappler A, Newmann DK (2004) Formation of Fe(III)-minerals by Fe(II)-oxidizing photoautotrophic bacteria.
Geochimimica et Cosmochimica Acta, 68, 1217-1226.
Kennedy DB, Scott SD, Ferris FG (2004) Hydrothermal phase stablization of 2-line ferrihydrite by bacteria.
Chemical Geology, 212, 269-277.
Konhauser KO, Hamade T, Raiswell R, Morris RC, Ferris FG, Southam G, Canfield DE (2002) Could bacteria
have formed the Precambrian banded iron formations? Geology, 20, 1079-1082.
Konhauser KO (1997) Bacterial iron biomineralization in nature. FEMS Microbiology Reviews, 20, 315-326.
Krapez B, Barley ME, Pickard AL (2003) Hydrothermal and resedimented origins of the precursor sediments to
banded iron formation: sedimentological evidence from the Early Paleoproterozoic Brockman
Supersequence of Western Australia. Sedimentology, 50, 979-1011.
Laaksoharju M, Tullborg E-L, Wikberg P, Wallin B, Smellie J (1999) Hydrogeochemical conditions and
evolution at the Äspö HRL, Sweden. Applied Geochemistry, 14, 835-859.
McLennan SM (1989) Rare earth elements in sedimentary rocks: influence of provenance and sedimentary
processes. In Lipin BR, McKay GA (eds), Geochemistry and mineralogy of rare earth elements. Reviews
in Mineralogy, 21, 169-200.
Michard A, Albarède F (1986) The REE content of some hydrothermal fluids. Chemical Geology, 55, 51-60.
Michel MF, Ehm L, Antao SM, Lee PL, Chupas PJ, Liu G, Strongin DR, Schoonen MAA, Phillips BL, Parise JB
(2007) The structure of ferrihydrite, a nanocycrstalline material. Science, 316, 1726-1729.
Morris RC, Horwitz RC (1983) The origin of the iron-formation-rich Hamersley Group of Western Australia –
Deposition on a platform. Precambrian Research, 21, 273-297.
Chapter 5 - TREE accumulation and fractionation
98
Schwertmann U, Friedl J, Stanjek H (1999) From Fe(III) ions to ferrihydrite and then to hematite. Journal of
Colloid and Interface Science, 209, 215-223.
SICADA. Database of the Swedish organisation for nuclear fuel and waste management (SKB), owner of the
Äspö HRL. See also www.skb.se
Southam G (2000) Bacterial surface-mediated mineral formation. In Lovley DR (ed), Environmental microbe-
mineral interactions. ASM Press, Washington DC, 257-276.
Stumm W, Morgan JJ (1996) Aquatic Chemistry: Chemical equilibria and rates in natural waters. John Wiley
and Sons, 1040 p.
Takahashi Y, Hirata T, Shimizu H, Ozaki T, Fortin D (2007) A rare earth element signature of bacteria in natural
waters. Chemical Geology, 244, 569-583.
Takahashi Y, Yoshida H, Sato N, Hama K, Yusa Y, Shimizu H (2002) W- and M-type tetrad effects in REE
patterns for water–rock systems in the Tono uranium deposit, central Japan. Chemical Geology, 184, 311-
335.
Thompson JB, Ferris FG (1990) Cyanobacterial precipitation of gypsum, calcite, and magnesite from natural
alkaline lake water. Geology, 18, 995-998.
Urrutia MM, Beveridge TJ (1993) Mechanism of silicate binding to the bacteria cell wall in Bacillus subtilis.
Journal of Bacteriology, 175, 1936-1945.
Weiner S, Dove PM (2003) An overview of biomineralization processes and the problem of the vital effect. In
Dove PM, De Yoreo JJ, Weiner S (eds), Biomineralization. Reviews in Mineralogy and Geochemistry
Vol. 54, series editor Rosso JJ, Mineralogical Society of America & Geochemical Society, 1-29.
Zhang J, Amakawa H, Nozaki Y (1994) The comparative behaviours of yttrium and lanthanides in the seawater
of the North Pacific. Geophysical Research Letters, 21, 2677–2680.
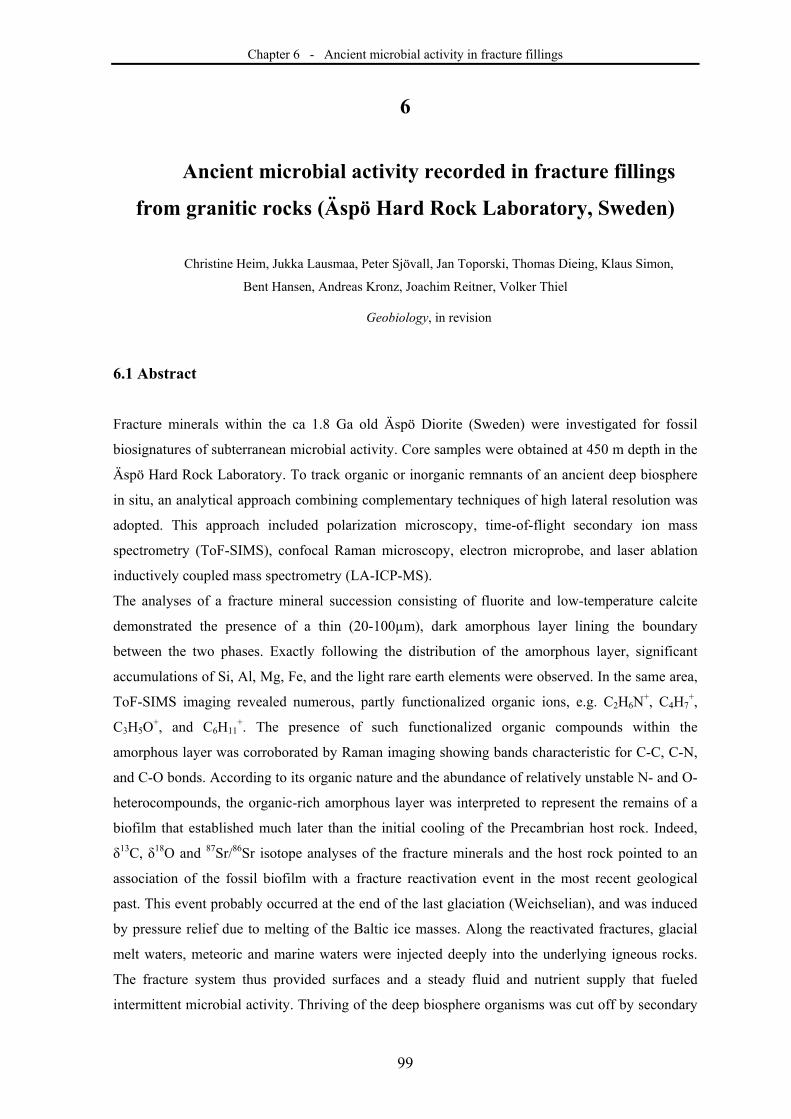
Chapter 6 - Ancient microbial activity in fracture fillings
99
6
Ancient microbial activity recorded in fracture fillings
from granitic rocks (Äspö Hard Rock Laboratory, Sweden)
Christine Heim, Jukka Lausmaa, Peter Sjövall, Jan Toporski, Thomas Dieing, Klaus Simon,
Bent Hansen, Andreas Kronz, Joachim Reitner, Volker Thiel
Geobiology, in revision
6.1 Abstract
Fracture minerals within the ca 1.8 Ga old Äspö Diorite (Sweden) were investigated for fossil
biosignatures of subterranean microbial activity. Core samples were obtained at 450 m depth in the
Äspö Hard Rock Laboratory. To track organic or inorganic remnants of an ancient deep biosphere
in situ, an analytical approach combining complementary techniques of high lateral resolution was
adopted. This approach included polarization microscopy, time-of-flight secondary ion mass
spectrometry (ToF-SIMS), confocal Raman microscopy, electron microprobe, and laser ablation
inductively coupled mass spectrometry (LA-ICP-MS).
The analyses of a fracture mineral succession consisting of fluorite and low-temperature calcite
demonstrated the presence of a thin (20-100µm), dark amorphous layer lining the boundary
between the two phases. Exactly following the distribution of the amorphous layer, significant
accumulations of Si, Al, Mg, Fe, and the light rare earth elements were observed. In the same area,
ToF-SIMS imaging revealed numerous, partly functionalized organic ions, e.g. C2H6N+, C4H7
+,
C3H5O+, and C6H11
+. The presence of such functionalized organic compounds within the
amorphous layer was corroborated by Raman imaging showing bands characteristic for C-C, C-N,
and C-O bonds. According to its organic nature and the abundance of relatively unstable N- and O-
heterocompounds, the organic-rich amorphous layer was interpreted to represent the remains of a
biofilm that established much later than the initial cooling of the Precambrian host rock. Indeed,
δ13C, δ18O and 87Sr/86Sr isotope analyses of the fracture minerals and the host rock pointed to an
association of the fossil biofilm with a fracture reactivation event in the most recent geological
past. This event probably occurred at the end of the last glaciation (Weichselian), and was induced
by pressure relief due to melting of the Baltic ice masses. Along the reactivated fractures, glacial
melt waters, meteoric and marine waters were injected deeply into the underlying igneous rocks.
The fracture system thus provided surfaces and a steady fluid and nutrient supply that fueled
intermittent microbial activity. Thriving of the deep biosphere organisms was cut off by secondary
Chapter 6 - Ancient microbial activity in fracture fillings
100
calcite precipitates that now provide a unique archive of the microbial and hydrologic processes
that once occurred at depth.
6.2 Introduction
Microbial life exists in, and seems to be adapted to, all kinds of ecological niches on earth.
Numerous reports exist about diverse, well adapted, active microorganisms recovered from
sedimentary and igneous rocks, being most likely indigenous, and occurring as deep as several
kilometers. Such occurrences raise the questions of (a) how the organisms got down there, (b) how
they are able to maintain life and growth, (c) what the limiting factors for life in the deep biosphere
are. Fluids, minerals, and H2 and CH4 from degassing volcanic or plutonic rocks are considered as
widespread nutrient and energy sources fueling chemotrophic ecosystems at depth (Pedersen, 2000;
Amend and Teske, 2005; Dobretsov et al., 2006). Learning more about recent and ancient life in
deep subterranean environments may help to understand how life evolved and survived crises such
as meteorite impacts, increased volcanic activity, or global glaciations such as the Late
Precambrian Snowball Earth. Models about the habitability of the Hadean Earth indicate that even
the late heavy meteorite bombardment around 3.9 Ga would not have been able to extinguish the
primeval biosphere, considering the existence of near- and subsurface biota within the Earth’s crust
(Abramov and Mojzis, 2009).
There is now ample evidence for the existence of living microorganisms and microbial mats in
groundwater aquifers within terrestrial igneous rocks (Szewzyk et al., 1994; Kotelnikova and
Pedersen, 1998; Pedersen, 2000; Kotelnikova, 2002; Reitner et al., 2005; Horsfield et al., 2006;
Kyle et al., 2008; Sahl et al., 2008; Eydal et al., 2009). Likewise, numerous reports exist about
fossilized remnants of microbial mats and microorganisms, but especially in sediments it is often
difficult to distinguish whether such biosignatures derive from buried surface (or near-surface-)
biota or from an indigenous subsurface biosphere (Ventura et al., 2007). Many studies on fossil
deep biosphere systems therefore focused on fracture fillings and mineral-filled cavities within
different, mostly igneous, rocks that have never been exposed to the surface (Pedersen et al., 1997;
Banerjee et al., 2006; Hofmann et al., 2008; Ivarsson et al., 2008, Staudigel et al., 2008; Bons
et al., 2009). Within igneous rocks, fractures can provide a steady fluid and nutrient supply and
surfaces suitable of hosting different kinds of chemoheterotrophic and chemolithotrophic
microorganisms. These structures, after being sealed by fracture mineral precipitation, may archive
geochemical traces of the microbial and hydrologic processes that once occurred at depth.
Permineralized fractures can therefore be considered as promising targets in the search for ancient
biosignatures in continental igneous rocks.
Apart from (electron) microscopy, geochemical tracers such as lipid biomarkers and stable isotopes
(e.g. δ13C, δ34S, δ56Fe) are successfully used in paleoenvironmental studies to reconstruct
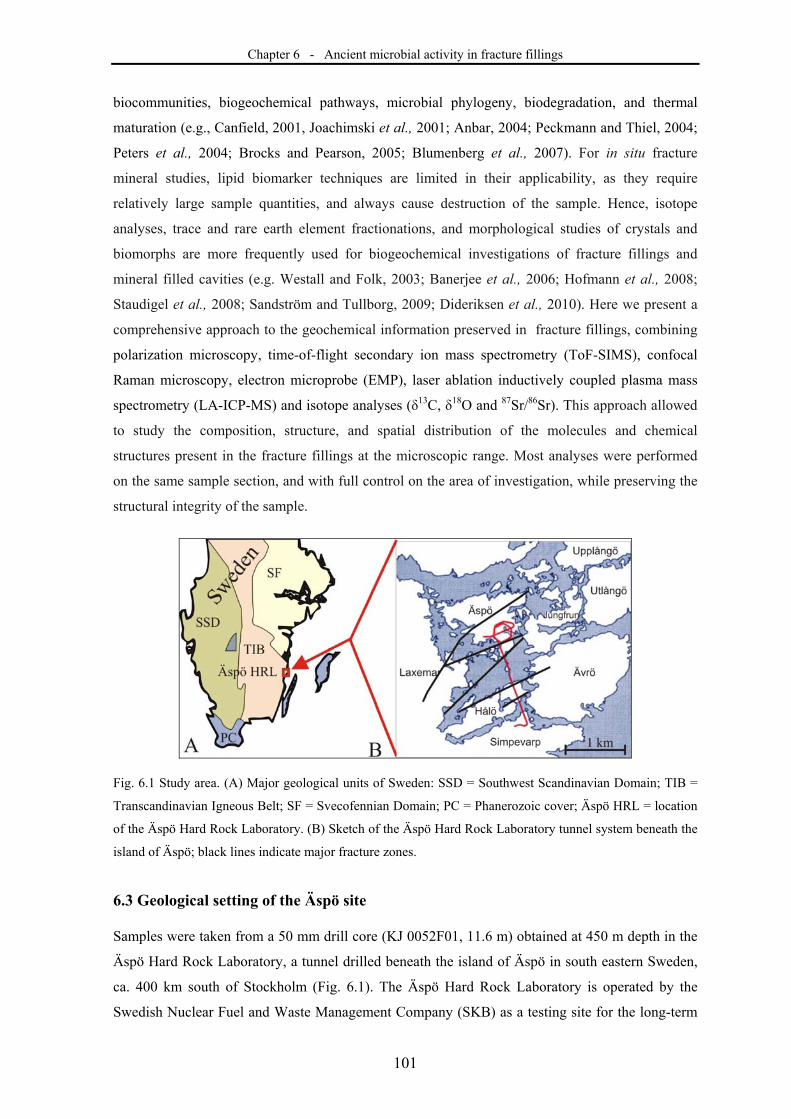
Chapter 6 - Ancient microbial activity in fracture fillings
101
biocommunities, biogeochemical pathways, microbial phylogeny, biodegradation, and thermal
maturation (e.g., Canfield, 2001, Joachimski et al., 2001; Anbar, 2004; Peckmann and Thiel, 2004;
Peters et al., 2004; Brocks and Pearson, 2005; Blumenberg et al., 2007). For in situ fracture
mineral studies, lipid biomarker techniques are limited in their applicability, as they require
relatively large sample quantities, and always cause destruction of the sample. Hence, isotope
analyses, trace and rare earth element fractionations, and morphological studies of crystals and
biomorphs are more frequently used for biogeochemical investigations of fracture fillings and
mineral filled cavities (e.g. Westall and Folk, 2003; Banerjee et al., 2006; Hofmann et al., 2008;
Staudigel et al., 2008; Sandström and Tullborg, 2009; Dideriksen et al., 2010). Here we present a
comprehensive approach to the geochemical information preserved in fracture fillings, combining
polarization microscopy, time-of-flight secondary ion mass spectrometry (ToF-SIMS), confocal
Raman microscopy, electron microprobe (EMP), laser ablation inductively coupled plasma mass
spectrometry (LA-ICP-MS) and isotope analyses (δ13C, δ18O and 87Sr/86Sr). This approach allowed
to study the composition, structure, and spatial distribution of the molecules and chemical
structures present in the fracture fillings at the microscopic range. Most analyses were performed
on the same sample section, and with full control on the area of investigation, while preserving the
structural integrity of the sample.
Fig. 6.1 Study area. (A) Major geological units of Sweden: SSD = Southwest Scandinavian Domain; TIB =
Transcandinavian Igneous Belt; SF = Svecofennian Domain; PC = Phanerozoic cover; Äspö HRL = location
of the Äspö Hard Rock Laboratory. (B) Sketch of the Äspö Hard Rock Laboratory tunnel system beneath the
island of Äspö; black lines indicate major fracture zones.
6.3 Geological setting of the Äspö site
Samples were taken from a 50 mm drill core (KJ 0052F01, 11.6 m) obtained at 450 m depth in the
Äspö Hard Rock Laboratory, a tunnel drilled beneath the island of Äspö in south eastern Sweden,
ca. 400 km south of Stockholm (Fig. 6.1). The Äspö Hard Rock Laboratory is operated by the
Swedish Nuclear Fuel and Waste Management Company (SKB) as a testing site for the long-term
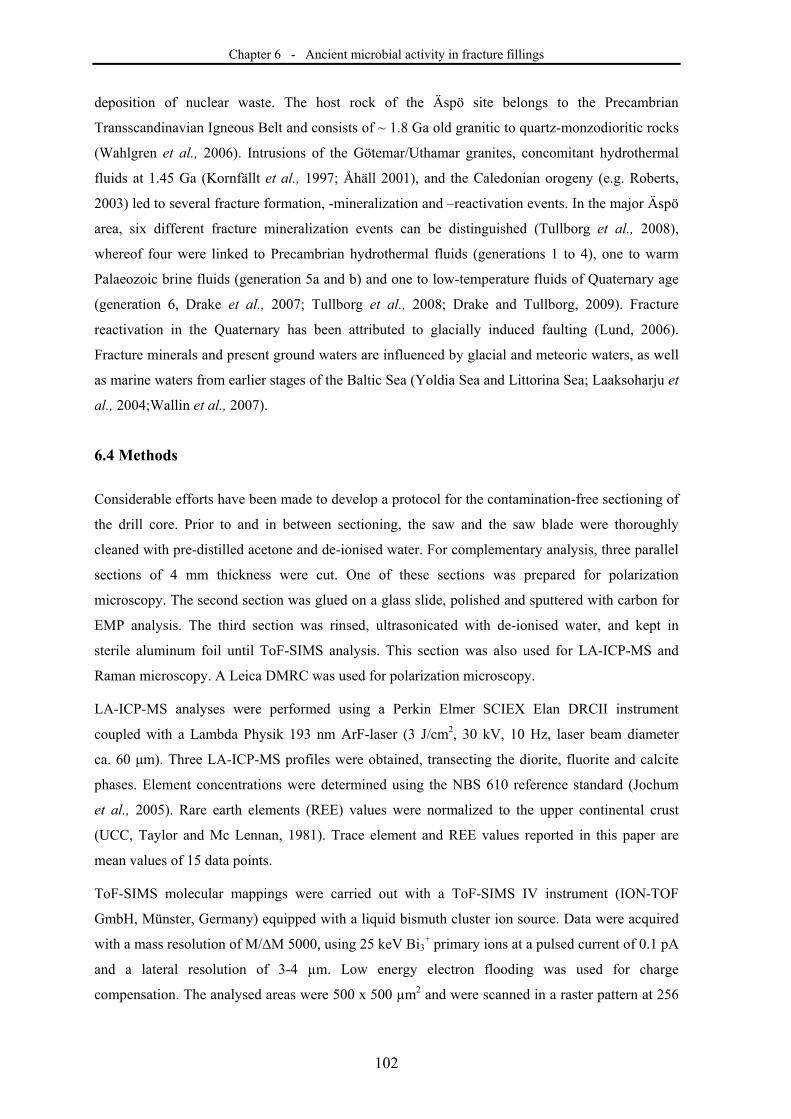
Chapter 6 - Ancient microbial activity in fracture fillings
102
deposition of nuclear waste. The host rock of the Äspö site belongs to the Precambrian
Transscandinavian Igneous Belt and consists of ~ 1.8 Ga old granitic to quartz-monzodioritic rocks
(Wahlgren et al., 2006). Intrusions of the Götemar/Uthamar granites, concomitant hydrothermal
fluids at 1.45 Ga (Kornfällt et al., 1997; Åhäll 2001), and the Caledonian orogeny (e.g. Roberts,
2003) led to several fracture formation, -mineralization and –reactivation events. In the major Äspö
area, six different fracture mineralization events can be distinguished (Tullborg et al., 2008),
whereof four were linked to Precambrian hydrothermal fluids (generations 1 to 4), one to warm
Palaeozoic brine fluids (generation 5a and b) and one to low-temperature fluids of Quaternary age
(generation 6, Drake et al., 2007; Tullborg et al., 2008; Drake and Tullborg, 2009). Fracture
reactivation in the Quaternary has been attributed to glacially induced faulting (Lund, 2006).
Fracture minerals and present ground waters are influenced by glacial and meteoric waters, as well
as marine waters from earlier stages of the Baltic Sea (Yoldia Sea and Littorina Sea; Laaksoharju et
al., 2004;Wallin et al., 2007).
6.4 Methods
Considerable efforts have been made to develop a protocol for the contamination-free sectioning of
the drill core. Prior to and in between sectioning, the saw and the saw blade were thoroughly
cleaned with pre-distilled acetone and de-ionised water. For complementary analysis, three parallel
sections of 4 mm thickness were cut. One of these sections was prepared for polarization
microscopy. The second section was glued on a glass slide, polished and sputtered with carbon for
EMP analysis. The third section was rinsed, ultrasonicated with de-ionised water, and kept in
sterile aluminum foil until ToF-SIMS analysis. This section was also used for LA-ICP-MS and
Raman microscopy. A Leica DMRC was used for polarization microscopy.
LA-ICP-MS analyses were performed using a Perkin Elmer SCIEX Elan DRCII instrument
coupled with a Lambda Physik 193 nm ArF-laser (3 J/cm2, 30 kV, 10 Hz, laser beam diameter
ca. 60 μm). Three LA-ICP-MS profiles were obtained, transecting the diorite, fluorite and calcite
phases. Element concentrations were determined using the NBS 610 reference standard (Jochum
et al., 2005). Rare earth elements (REE) values were normalized to the upper continental crust
(UCC, Taylor and Mc Lennan, 1981). Trace element and REE values reported in this paper are
mean values of 15 data points.
ToF-SIMS molecular mappings were carried out with a ToF-SIMS IV instrument (ION-TOF
GmbH, Münster, Germany) equipped with a liquid bismuth cluster ion source. Data were acquired
with a mass resolution of M/∆M 5000, using 25 keV Bi3+ primary ions at a pulsed current of 0.1 pA
and a lateral resolution of 3-4 µm. Low energy electron flooding was used for charge
compensation. The analysed areas were 500 x 500 µm2 and were scanned in a raster pattern at 256
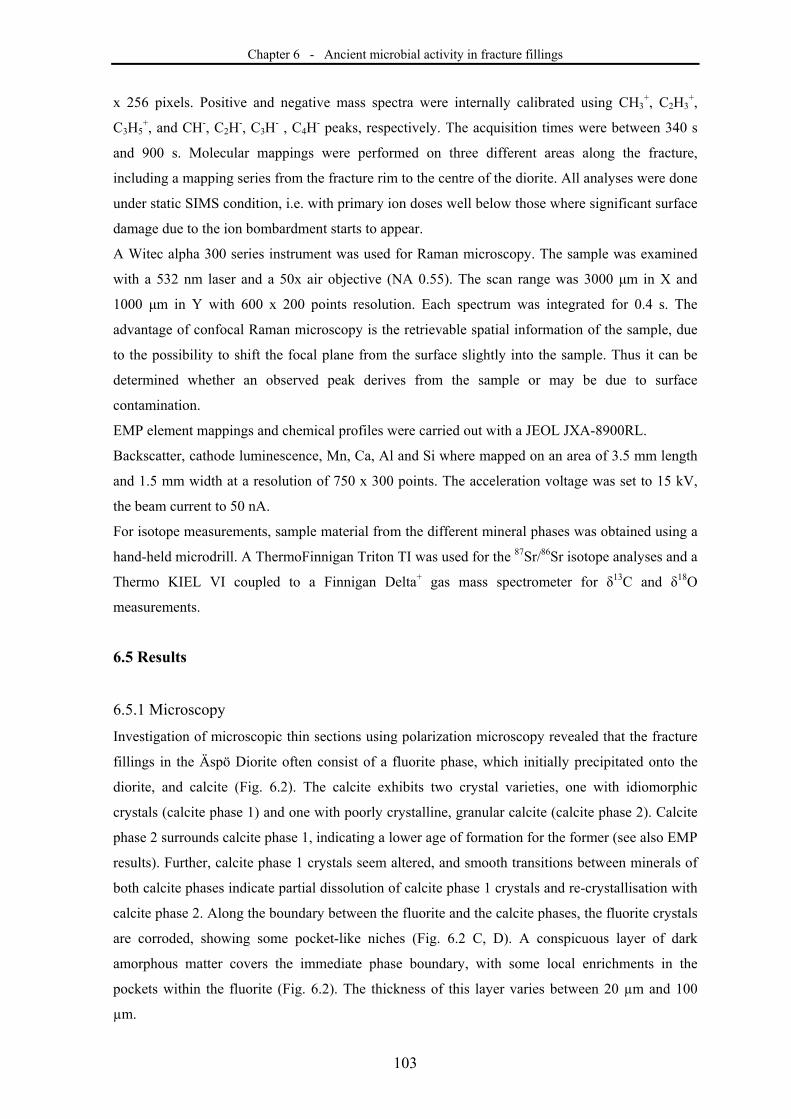
Chapter 6 - Ancient microbial activity in fracture fillings
103
x 256 pixels. Positive and negative mass spectra were internally calibrated using CH3+, C2H3
+,
C3H5+, and CH-, C2H
-, C3H- , C4H
- peaks, respectively. The acquisition times were between 340 s
and 900 s. Molecular mappings were performed on three different areas along the fracture,
including a mapping series from the fracture rim to the centre of the diorite. All analyses were done
under static SIMS condition, i.e. with primary ion doses well below those where significant surface
damage due to the ion bombardment starts to appear.
A Witec alpha 300 series instrument was used for Raman microscopy. The sample was examined
with a 532 nm laser and a 50x air objective (NA 0.55). The scan range was 3000 μm in X and
1000 μm in Y with 600 x 200 points resolution. Each spectrum was integrated for 0.4 s. The
advantage of confocal Raman microscopy is the retrievable spatial information of the sample, due
to the possibility to shift the focal plane from the surface slightly into the sample. Thus it can be
determined whether an observed peak derives from the sample or may be due to surface
contamination.
EMP element mappings and chemical profiles were carried out with a JEOL JXA-8900RL.
Backscatter, cathode luminescence, Mn, Ca, Al and Si where mapped on an area of 3.5 mm length
and 1.5 mm width at a resolution of 750 x 300 points. The acceleration voltage was set to 15 kV,
the beam current to 50 nA.
For isotope measurements, sample material from the different mineral phases was obtained using a
hand-held microdrill. A ThermoFinnigan Triton TI was used for the 87Sr/86Sr isotope analyses and a
Thermo KIEL VI coupled to a Finnigan Delta+ gas mass spectrometer for δ13C and δ18O
measurements.
6.5 Results
6.5.1 Microscopy
Investigation of microscopic thin sections using polarization microscopy revealed that the fracture
fillings in the Äspö Diorite often consist of a fluorite phase, which initially precipitated onto the
diorite, and calcite (Fig. 6.2). The calcite exhibits two crystal varieties, one with idiomorphic
crystals (calcite phase 1) and one with poorly crystalline, granular calcite (calcite phase 2). Calcite
phase 2 surrounds calcite phase 1, indicating a lower age of formation for the former (see also EMP
results). Further, calcite phase 1 crystals seem altered, and smooth transitions between minerals of
both calcite phases indicate partial dissolution of calcite phase 1 crystals and re-crystallisation with
calcite phase 2. Along the boundary between the fluorite and the calcite phases, the fluorite crystals
are corroded, showing some pocket-like niches (Fig. 6.2 C, D). A conspicuous layer of dark
amorphous matter covers the immediate phase boundary, with some local enrichments in the
pockets within the fluorite (Fig. 6.2). The thickness of this layer varies between 20 µm and 100
µm.
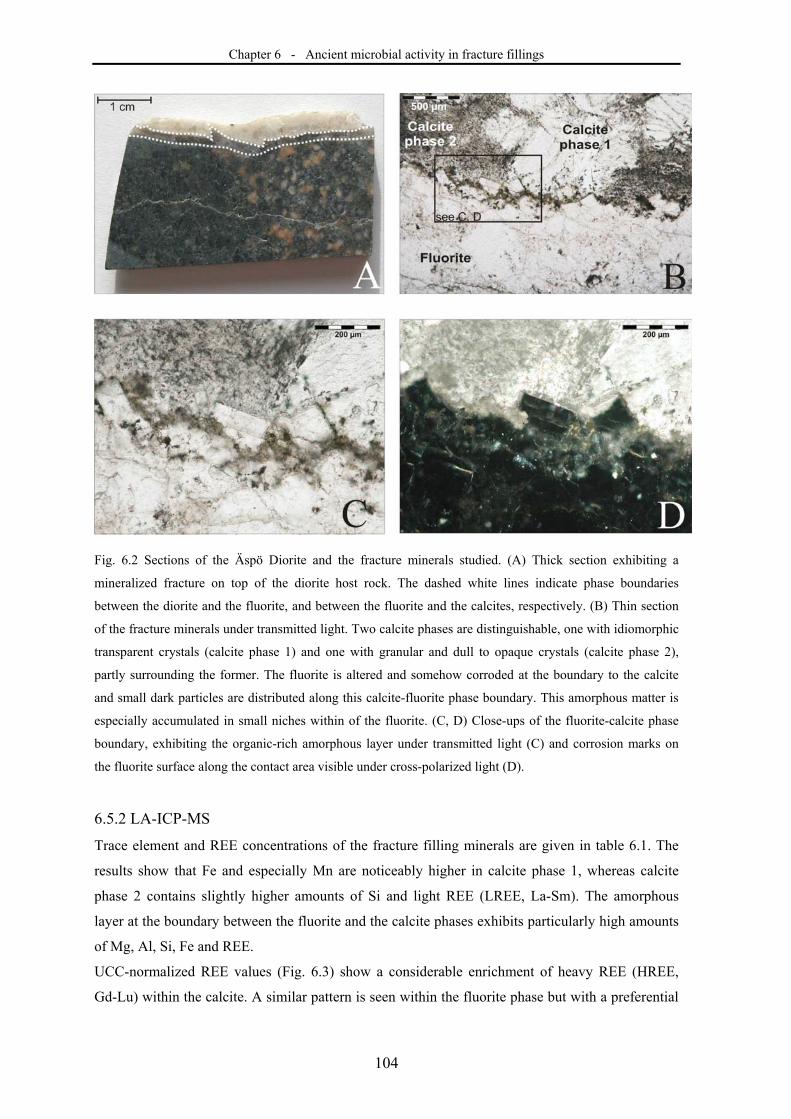
Chapter 6 - Ancient microbial activity in fracture fillings
104
Fig. 6.2 Sections of the Äspö Diorite and the fracture minerals studied. (A) Thick section exhibiting a
mineralized fracture on top of the diorite host rock. The dashed white lines indicate phase boundaries
between the diorite and the fluorite, and between the fluorite and the calcites, respectively. (B) Thin section
of the fracture minerals under transmitted light. Two calcite phases are distinguishable, one with idiomorphic
transparent crystals (calcite phase 1) and one with granular and dull to opaque crystals (calcite phase 2),
partly surrounding the former. The fluorite is altered and somehow corroded at the boundary to the calcite
and small dark particles are distributed along this calcite-fluorite phase boundary. This amorphous matter is
especially accumulated in small niches within of the fluorite. (C, D) Close-ups of the fluorite-calcite phase
boundary, exhibiting the organic-rich amorphous layer under transmitted light (C) and corrosion marks on
the fluorite surface along the contact area visible under cross-polarized light (D).
6.5.2 LA-ICP-MS
Trace element and REE concentrations of the fracture filling minerals are given in table 6.1. The
results show that Fe and especially Mn are noticeably higher in calcite phase 1, whereas calcite
phase 2 contains slightly higher amounts of Si and light REE (LREE, La-Sm). The amorphous
layer at the boundary between the fluorite and the calcite phases exhibits particularly high amounts
of Mg, Al, Si, Fe and REE.
UCC-normalized REE values (Fig. 6.3) show a considerable enrichment of heavy REE (HREE,
Gd-Lu) within the calcite. A similar pattern is seen within the fluorite phase but with a preferential
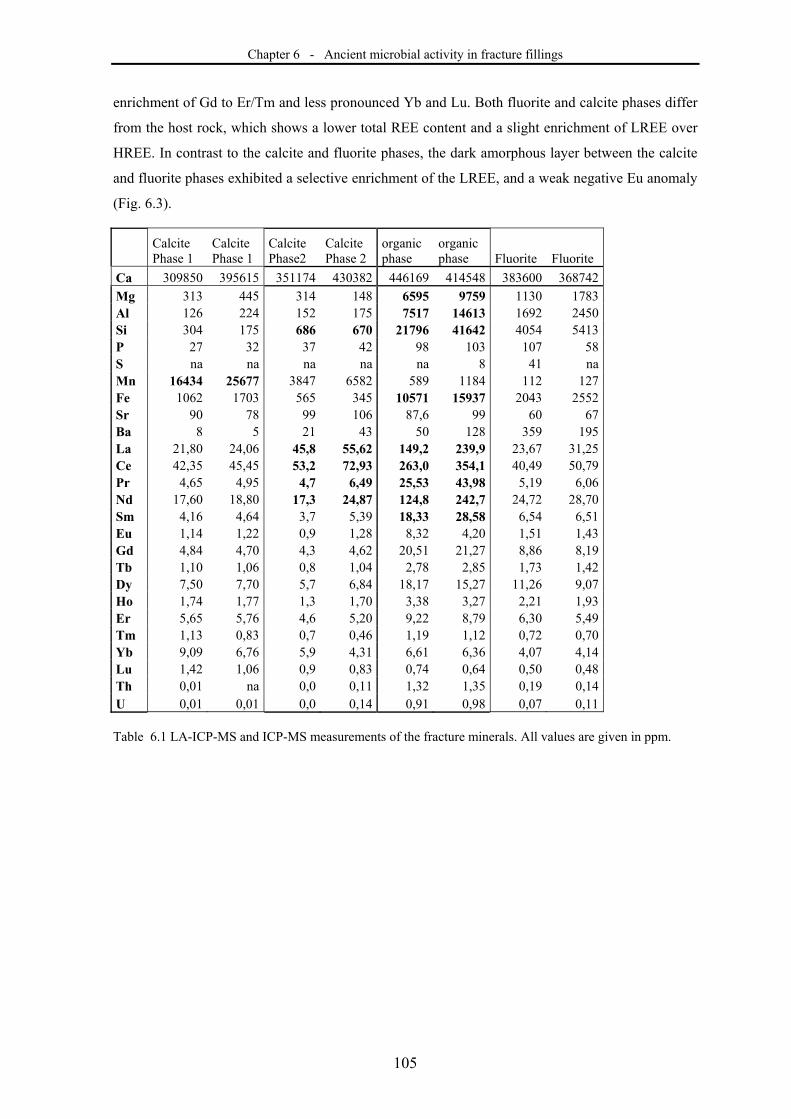
Chapter 6 - Ancient microbial activity in fracture fillings
105
enrichment of Gd to Er/Tm and less pronounced Yb and Lu. Both fluorite and calcite phases differ
from the host rock, which shows a lower total REE content and a slight enrichment of LREE over
HREE. In contrast to the calcite and fluorite phases, the dark amorphous layer between the calcite
and fluorite phases exhibited a selective enrichment of the LREE, and a weak negative Eu anomaly
(Fig. 6.3).
Calcite Phase 1
Calcite Phase 1
Calcite Phase2
Calcite Phase 2
organic phase
organic phase Fluorite Fluorite
Ca 309850 395615 351174 430382 446169 414548 383600 368742
Mg 313 445 314 148 6595 9759 1130 1783 Al 126 224 152 175 7517 14613 1692 2450 Si 304 175 686 670 21796 41642 4054 5413 P 27 32 37 42 98 103 107 58 S na na na na na 8 41 na Mn 16434 25677 3847 6582 589 1184 112 127 Fe 1062 1703 565 345 10571 15937 2043 2552 Sr 90 78 99 106 87,6 99 60 67 Ba 8 5 21 43 50 128 359 195 La 21,80 24,06 45,8 55,62 149,2 239,9 23,67 31,25 Ce 42,35 45,45 53,2 72,93 263,0 354,1 40,49 50,79 Pr 4,65 4,95 4,7 6,49 25,53 43,98 5,19 6,06 Nd 17,60 18,80 17,3 24,87 124,8 242,7 24,72 28,70 Sm 4,16 4,64 3,7 5,39 18,33 28,58 6,54 6,51 Eu 1,14 1,22 0,9 1,28 8,32 4,20 1,51 1,43 Gd 4,84 4,70 4,3 4,62 20,51 21,27 8,86 8,19 Tb 1,10 1,06 0,8 1,04 2,78 2,85 1,73 1,42 Dy 7,50 7,70 5,7 6,84 18,17 15,27 11,26 9,07 Ho 1,74 1,77 1,3 1,70 3,38 3,27 2,21 1,93 Er 5,65 5,76 4,6 5,20 9,22 8,79 6,30 5,49 Tm 1,13 0,83 0,7 0,46 1,19 1,12 0,72 0,70 Yb 9,09 6,76 5,9 4,31 6,61 6,36 4,07 4,14 Lu 1,42 1,06 0,9 0,83 0,74 0,64 0,50 0,48 Th 0,01 na 0,0 0,11 1,32 1,35 0,19 0,14 U 0,01 0,01 0,0 0,14 0,91 0,98 0,07 0,11
Table 6.1 LA-ICP-MS and ICP-MS measurements of the fracture minerals. All values are given in ppm.
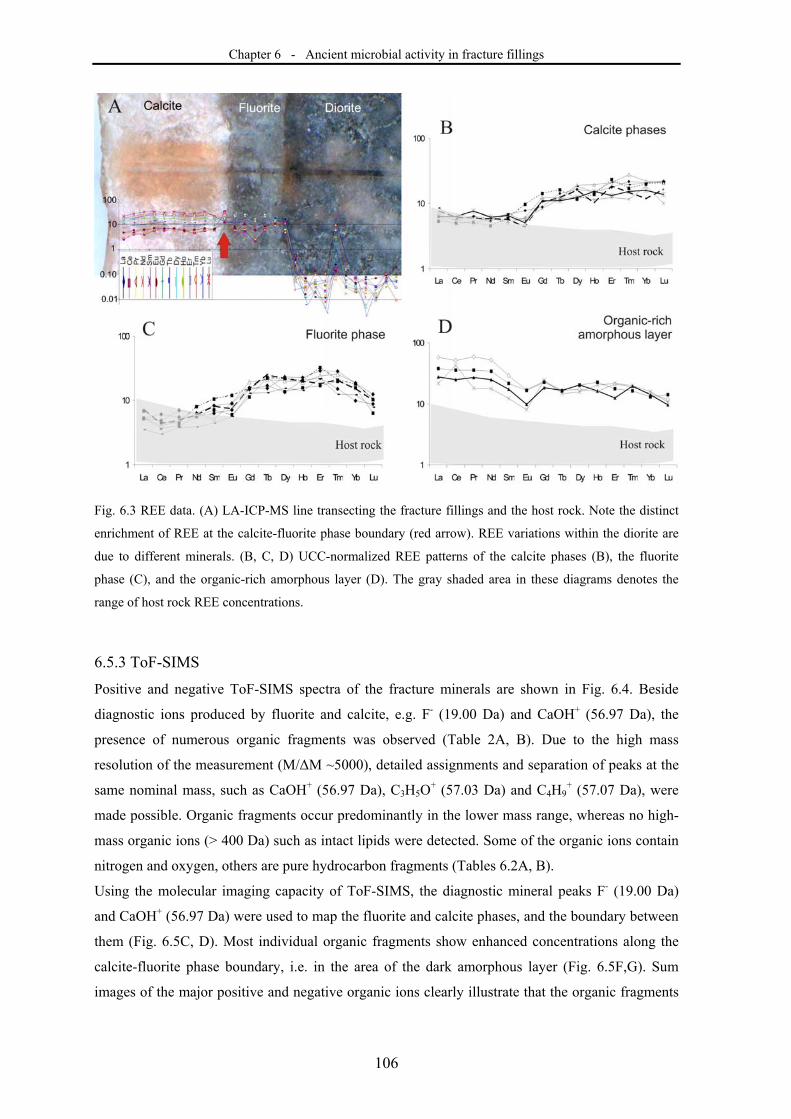
Chapter 6 - Ancient microbial activity in fracture fillings
106
Fig. 6.3 REE data. (A) LA-ICP-MS line transecting the fracture fillings and the host rock. Note the distinct
enrichment of REE at the calcite-fluorite phase boundary (red arrow). REE variations within the diorite are
due to different minerals. (B, C, D) UCC-normalized REE patterns of the calcite phases (B), the fluorite
phase (C), and the organic-rich amorphous layer (D). The gray shaded area in these diagrams denotes the
range of host rock REE concentrations.
6.5.3 ToF-SIMS
Positive and negative ToF-SIMS spectra of the fracture minerals are shown in Fig. 6.4. Beside
diagnostic ions produced by fluorite and calcite, e.g. F- (19.00 Da) and CaOH+ (56.97 Da), the
presence of numerous organic fragments was observed (Table 2A, B). Due to the high mass
resolution of the measurement (M/ΔM ~5000), detailed assignments and separation of peaks at the
same nominal mass, such as CaOH+ (56.97 Da), C3H5O+ (57.03 Da) and C4H9
+ (57.07 Da), were
made possible. Organic fragments occur predominantly in the lower mass range, whereas no high-
mass organic ions (> 400 Da) such as intact lipids were detected. Some of the organic ions contain
nitrogen and oxygen, others are pure hydrocarbon fragments (Tables 6.2A, B).
Using the molecular imaging capacity of ToF-SIMS, the diagnostic mineral peaks F- (19.00 Da)
and CaOH+ (56.97 Da) were used to map the fluorite and calcite phases, and the boundary between
them (Fig. 6.5C, D). Most individual organic fragments show enhanced concentrations along the
calcite-fluorite phase boundary, i.e. in the area of the dark amorphous layer (Fig. 6.5F,G). Sum
images of the major positive and negative organic ions clearly illustrate that the organic fragments
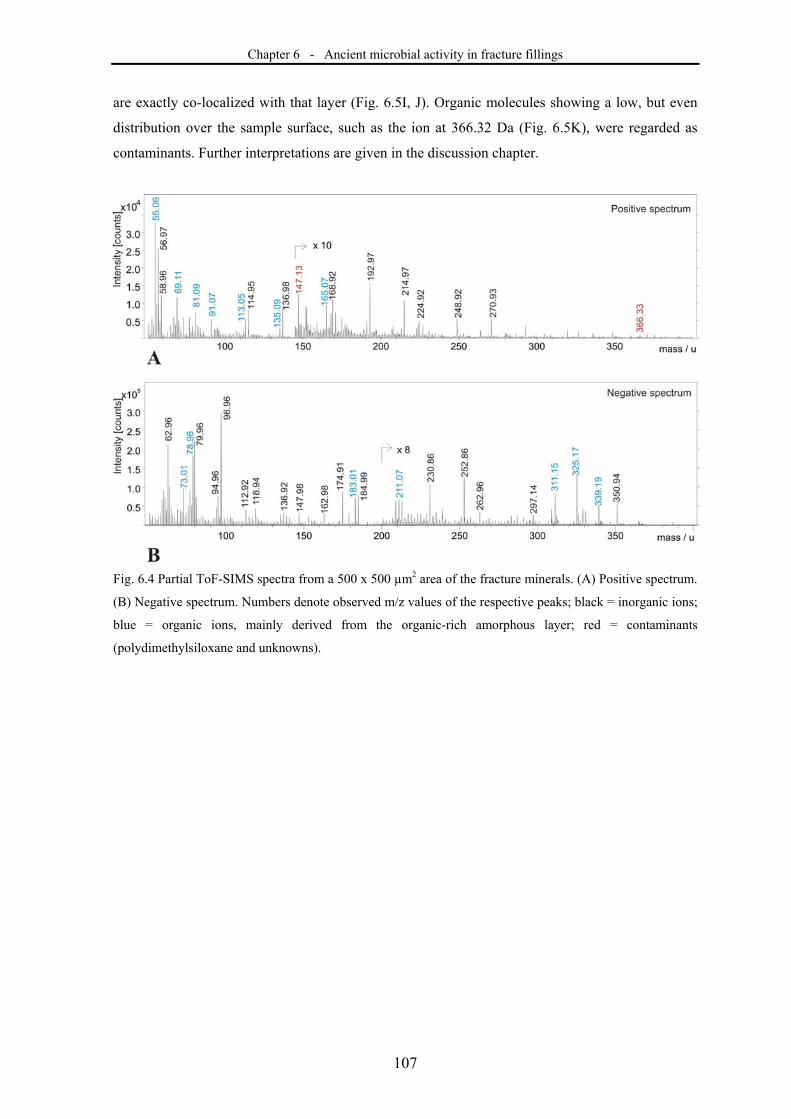
Chapter 6 - Ancient microbial activity in fracture fillings
107
are exactly co-localized with that layer (Fig. 6.5I, J). Organic molecules showing a low, but even
distribution over the sample surface, such as the ion at 366.32 Da (Fig. 6.5K), were regarded as
contaminants. Further interpretations are given in the discussion chapter.
Fig. 6.4 Partial ToF-SIMS spectra from a 500 x 500 µm2 area of the fracture minerals. (A) Positive spectrum.
(B) Negative spectrum. Numbers denote observed m/z values of the respective peaks; black = inorganic ions;
blue = organic ions, mainly derived from the organic-rich amorphous layer; red = contaminants
(polydimethylsiloxane and unknowns).
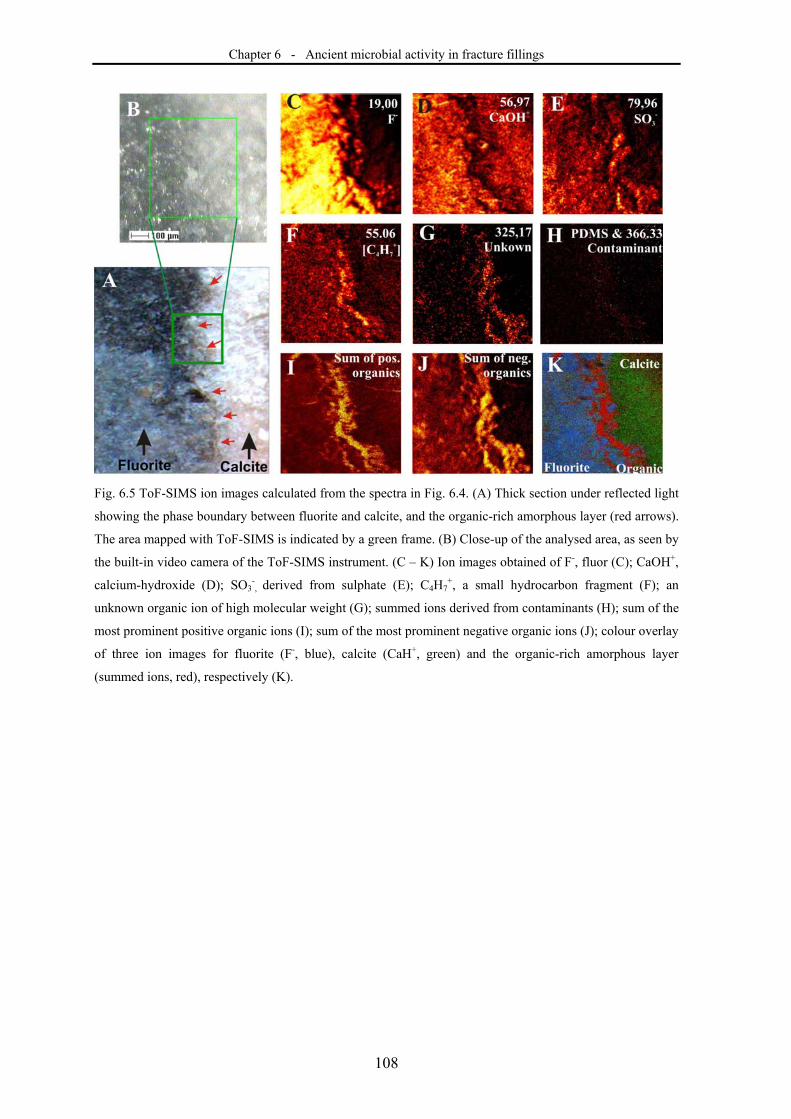
Chapter 6 - Ancient microbial activity in fracture fillings
108
Fig. 6.5 ToF-SIMS ion images calculated from the spectra in Fig. 6.4. (A) Thick section under reflected light
showing the phase boundary between fluorite and calcite, and the organic-rich amorphous layer (red arrows).
The area mapped with ToF-SIMS is indicated by a green frame. (B) Close-up of the analysed area, as seen by
the built-in video camera of the ToF-SIMS instrument. (C – K) Ion images obtained of F-, fluor (C); CaOH+,
calcium-hydroxide (D); SO3-, derived from sulphate (E); C4H7
+, a small hydrocarbon fragment (F); an
unknown organic ion of high molecular weight (G); summed ions derived from contaminants (H); sum of the
most prominent positive organic ions (I); sum of the most prominent negative organic ions (J); colour overlay
of three ion images for fluorite (F-, blue), calcite (CaH+, green) and the organic-rich amorphous layer
(summed ions, red), respectively (K).
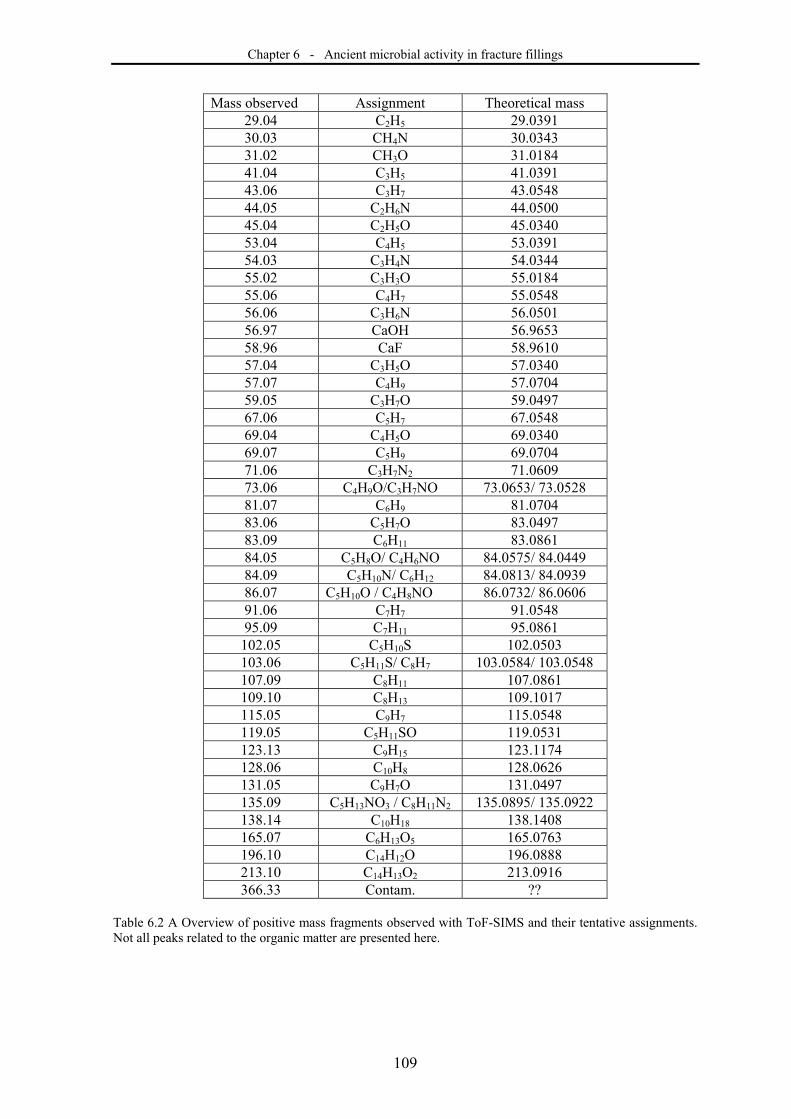
Chapter 6 - Ancient microbial activity in fracture fillings
109
Mass observed Assignment Theoretical mass 29.04 C2H5 29.0391 30.03 CH4N 30.0343 31.02 CH3O 31.0184 41.04 C3H5 41.0391 43.06 C3H7 43.0548 44.05 C2H6N 44.0500 45.04 C2H5O 45.0340 53.04 C4H5 53.0391 54.03 C3H4N 54.0344 55.02 C3H3O 55.0184 55.06 C4H7 55.0548 56.06 C3H6N 56.0501 56.97 CaOH 56.9653 58.96 CaF 58.9610 57.04 C3H5O 57.0340 57.07 C4H9 57.0704 59.05 C3H7O 59.0497 67.06 C5H7 67.0548 69.04 C4H5O 69.0340 69.07 C5H9 69.0704 71.06 C3H7N2 71.0609 73.06 C4H9O/C3H7NO 73.0653/ 73.0528 81.07 C6H9 81.0704 83.06 C5H7O 83.0497 83.09 C6H11 83.0861 84.05 C5H8O/ C4H6NO 84.0575/ 84.0449 84.09 C5H10N/ C6H12 84.0813/ 84.0939 86.07 C5H10O / C4H8NO 86.0732/ 86.0606 91.06 C7H7 91.0548 95.09 C7H11 95.0861
102.05 C5H10S 102.0503 103.06 C5H11S/ C8H7 103.0584/ 103.0548 107.09 C8H11 107.0861 109.10 C8H13 109.1017 115.05 C9H7 115.0548 119.05 C5H11SO 119.0531 123.13 C9H15 123.1174 128.06 C10H8 128.0626 131.05 C9H7O 131.0497 135.09 C5H13NO3 / C8H11N2 135.0895/ 135.0922 138.14 C10H18 138.1408 165.07 C6H13O5 165.0763 196.10 C14H12O 196.0888 213.10 C14H13O2 213.0916 366.33 Contam. ??
Table 6.2 A Overview of positive mass fragments observed with ToF-SIMS and their tentative assignments. Not all peaks related to the organic matter are presented here.
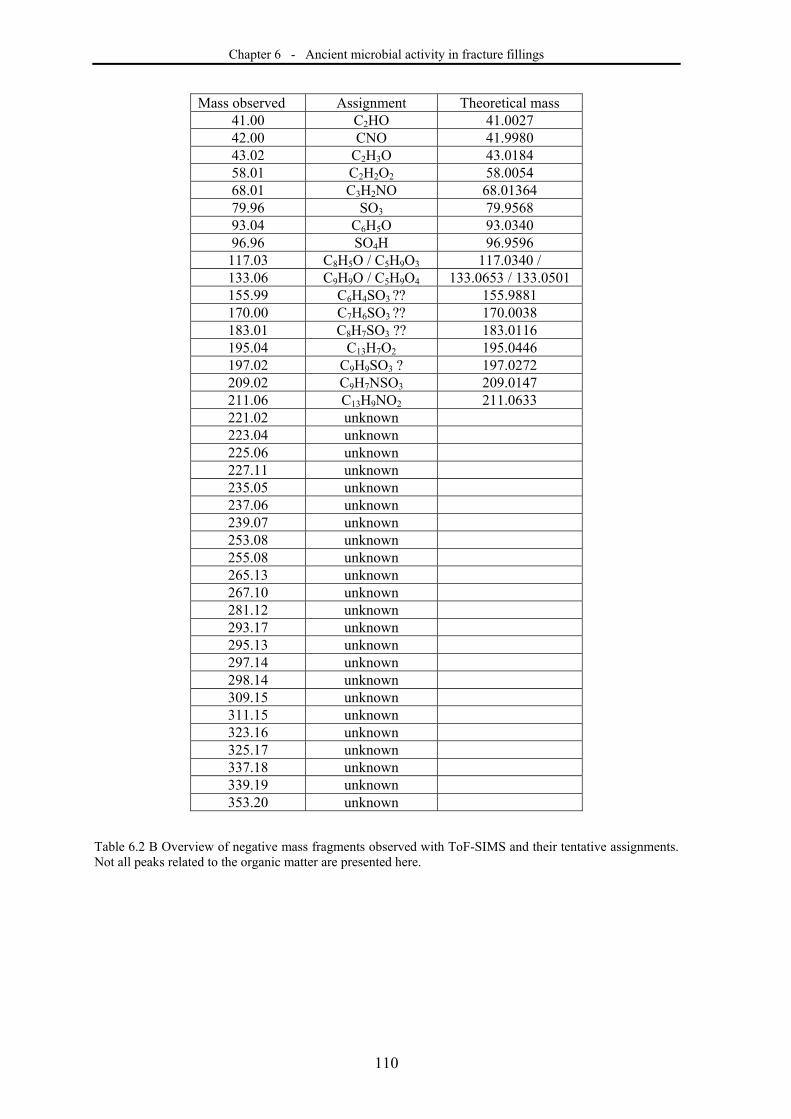
Chapter 6 - Ancient microbial activity in fracture fillings
110
Mass observed Assignment Theoretical mass 41.00 C2HO 41.0027 42.00 CNO 41.9980 43.02 C2H3O 43.0184 58.01 C2H2O2 58.0054 68.01 C3H2NO 68.01364 79.96 SO3 79.9568 93.04 C6H5O 93.0340 96.96 SO4H 96.9596
117.03 C8H5O / C5H9O3 117.0340 / 133.06 C9H9O / C5H9O4 133.0653 / 133.0501 155.99 C6H4SO3 ?? 155.9881 170.00 C7H6SO3 ?? 170.0038 183.01 C8H7SO3 ?? 183.0116 195.04 C13H7O2 195.0446 197.02 C9H9SO3 ? 197.0272 209.02 C9H7NSO3 209.0147 211.06 C13H9NO2 211.0633 221.02 unknown 223.04 unknown 225.06 unknown 227.11 unknown 235.05 unknown 237.06 unknown 239.07 unknown 253.08 unknown 255.08 unknown 265.13 unknown 267.10 unknown 281.12 unknown 293.17 unknown 295.13 unknown 297.14 unknown 298.14 unknown 309.15 unknown 311.15 unknown 323.16 unknown 325.17 unknown 337.18 unknown 339.19 unknown 353.20 unknown
Table 6.2 B Overview of negative mass fragments observed with ToF-SIMS and their tentative assignments. Not all peaks related to the organic matter are presented here.
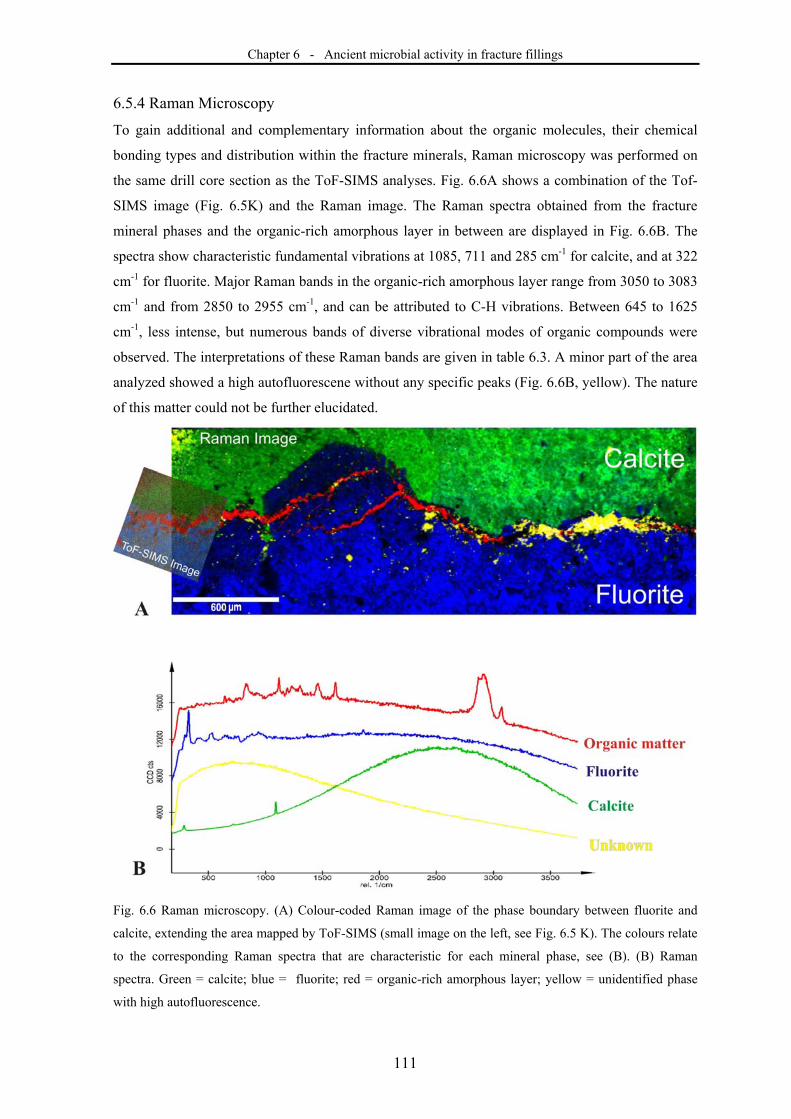
Chapter 6 - Ancient microbial activity in fracture fillings
111
6.5.4 Raman Microscopy
To gain additional and complementary information about the organic molecules, their chemical
bonding types and distribution within the fracture minerals, Raman microscopy was performed on
the same drill core section as the ToF-SIMS analyses. Fig. 6.6A shows a combination of the Tof-
SIMS image (Fig. 6.5K) and the Raman image. The Raman spectra obtained from the fracture
mineral phases and the organic-rich amorphous layer in between are displayed in Fig. 6.6B. The
spectra show characteristic fundamental vibrations at 1085, 711 and 285 cm-1 for calcite, and at 322
cm-1 for fluorite. Major Raman bands in the organic-rich amorphous layer range from 3050 to 3083
cm-1 and from 2850 to 2955 cm-1, and can be attributed to C-H vibrations. Between 645 to 1625
cm-1, less intense, but numerous bands of diverse vibrational modes of organic compounds were
observed. The interpretations of these Raman bands are given in table 6.3. A minor part of the area
analyzed showed a high autofluorescene without any specific peaks (Fig. 6.6B, yellow). The nature
of this matter could not be further elucidated.
Fig. 6.6 Raman microscopy. (A) Colour-coded Raman image of the phase boundary between fluorite and
calcite, extending the area mapped by ToF-SIMS (small image on the left, see Fig. 6.5 K). The colours relate
to the corresponding Raman spectra that are characteristic for each mineral phase, see (B). (B) Raman
spectra. Green = calcite; blue = fluorite; red = organic-rich amorphous layer; yellow = unidentified phase
with high autofluorescence.
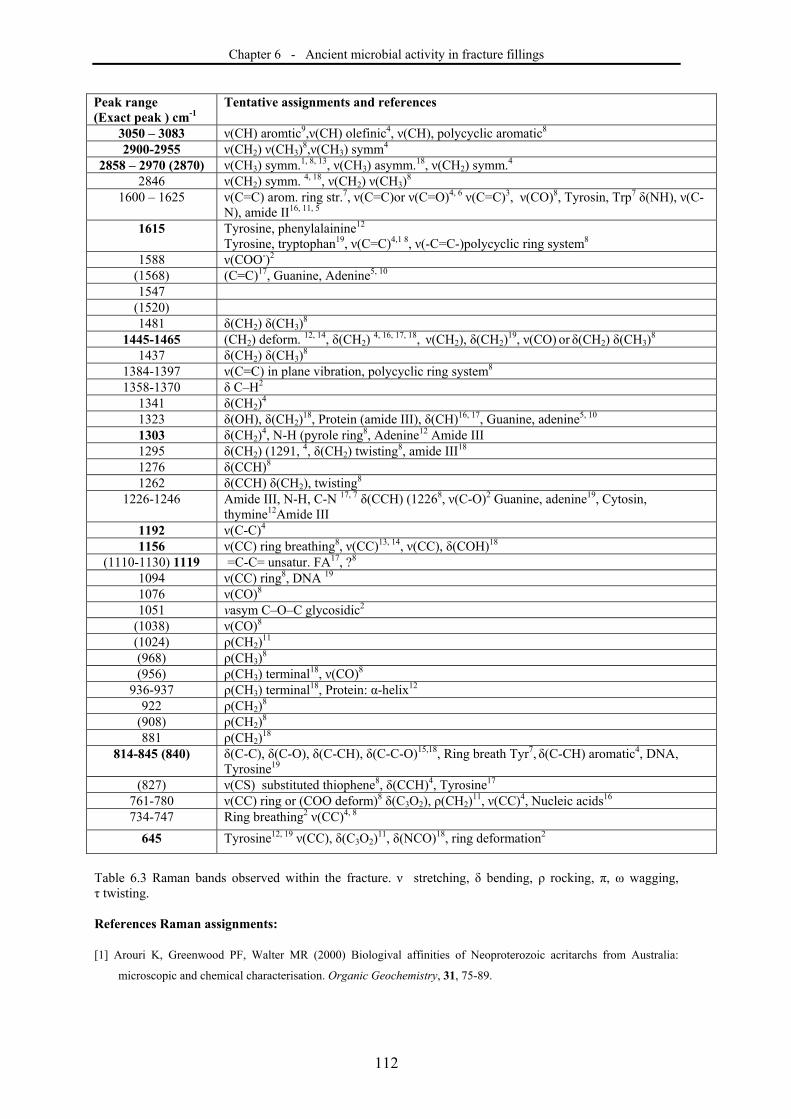
Chapter 6 - Ancient microbial activity in fracture fillings
112
Peak range (Exact peak ) cm-1
Tentative assignments and references
3050 – 3083 ν(CH) aromtic9,ν(CH) olefinic4, ν(CH), polycyclic aromatic8
2900-2955 ν(CH2) ν(CH3)8,ν(CH3) symm4
2858 – 2970 (2870) ν(CH3) symm.1, 8, 13, ν(CH3) asymm.18, ν(CH2) symm.4
2846 ν(CH2) symm. 4, 18, ν(CH2) ν(CH3)8
1600 – 1625 ν(C=C) arom. ring str.7, ν(C=C)or ν(C=O)4, 6 ν(C=C)3, ν(CO)8, Tyrosin, Trp7 δ(NH), ν(C-N), amide II16, 11, 5
1615 Tyrosine, phenylalainine12
Tyrosine, tryptophan19, ν(C=C)4,1 8, ν(-C=C-)polycyclic ring system8
1588 ν(COO-)2 (1568) (C=C)17, Guanine, Adenine5, 10
1547 (1520) 1481 δ(CH2) δ(CH3)
8
1445-1465 (CH2) deform. 12, 14, δ(CH2) 4, 16, 17, 18, ν(CH2), δ(CH2)
19, ν(CO) or δ(CH2) δ(CH3)8
1437 δ(CH2) δ(CH3)8
1384-1397 ν(C=C) in plane vibration, polycyclic ring system8
1358-1370 δ C–H2
1341 δ(CH2)4
1323 δ(OH), δ(CH2)18, Protein (amide III), δ(CH)16, 17, Guanine, adenine5, 10
1303 δ(CH2)4, N-H (pyrole ring8, Adenine12 Amide III
1295 δ(CH2) (1291, 4, δ(CH2) twisting8, amide III18
1276 δ(CCH)8
1262 δ(CCH) δ(CH2), twisting8
1226-1246 Amide III, N-H, C-N 17, 7 δ(CCH) (12268, ν(C-O)2 Guanine, adenine19, Cytosin, thymine12Amide III
1192 ν(C-C)4
1156 ν(CC) ring breathing8, ν(CC)13, 14, ν(CC), δ(COH)18 (1110-1130) 1119 =C-C= unsatur. FA17, ?8
1094 ν(CC) ring8, DNA 19
1076 ν(CO)8
1051 νasym C–O–C glycosidic2
(1038) ν(CO)8
(1024) ρ(CH2)11
(968) ρ(CH3)8
(956) ρ(CH3) terminal18, ν(CO)8
936-937 ρ(CH3) terminal18, Protein: α-helix12
922 ρ(CH2)8
(908) ρ(CH2)8
881 ρ(CH2)18
814-845 (840) δ(C-C), δ(C-O), δ(C-CH), δ(C-C-O)15,18, Ring breath Tyr7, δ(C-CH) aromatic4, DNA, Tyrosine19
(827) ν(CS) substituted thiophene8, δ(CCH)4, Tyrosine17
761-780 ν(CC) ring or (COO deform)8 δ(C3O2), ρ(CH2)11, ν(CC)4, Nucleic acids16
734-747 Ring breathing2 ν(CC)4, 8
645 Tyrosine12, 19 ν(CC), δ(C3O2)11, δ(NCO)18, ring deformation2
Table 6.3 Raman bands observed within the fracture. ν stretching, δ bending, ρ rocking, π, ω wagging, τ twisting. References Raman assignments: [1] Arouri K, Greenwood PF, Walter MR (2000) Biologival affinities of Neoproterozoic acritarchs from Australia:
microscopic and chemical characterisation. Organic Geochemistry, 31, 75-89.
Chapter 6 - Ancient microbial activity in fracture fillings
113
[2] Campos-Vallette MM, Chandía NP, Clavijo E, Leal D, Matsuhiro B, Osorio-Román IO, TorresS (2009)
Characterization of sodium alginates and its block fractions by surface-enhanced Raman spectroscopy. Journal of
Raman Spectroscopy, 2517-2523.
[3] Czaja AD, Kudryavtev AB, Cody GD, Schopf JW (2009) Characterization of permineralized kerogen from an Eocene
fossil fern. Organic Geochemistry, 40, 353-364.
[4] Edwards HGM, Farwell DW, Quye A (1997) ‘Dragon’s Blood’ I – Characterization of an Ancienct Resing Using
Fourier Transform Raman Spectroscopy. Journal of Raman Spectroscopy, 28, 243-249.
[5] Gaus K, Rösch P, Petry R, Peschke K-D, Ronneberger O, Burkhardt H, Baumann K, Popp J (2006) Classification of
Lactic Acid Bacteria with UV-Resonance Raman Spectroscopy. Biopolymers, 82, 286-290.
[6] Himmelsbach DS, Akin DE (1998) Near-Infrared Fourier-Transform Raman Spectroscopy of Flay (Linum
usitatissimum L.) Stems. Journal of Agricultural and Food Chemistry, 46, 991-998.
[7] Ivleva NP, Wagner M, Horn H, Niessner R, Haisch C (2009) Towards a nondestructie chemichal characterization of
biofilm matrix by Raman spectroscopy. Analytical and Bioanalytical Chemistry, 393, 197 – 206.
[8] Jehlička J, Edwards HGM (2008) Raman spectroscopy as a toll for the non-destructive odentification of organic
minerals in the geological record. Organic Geochemistry, 39, 371-386.
[9] Jenkins AL, Larsen RA, Williams TB (2005) Characterization of amino acids using Raman spectroscopy.
Spectromchimica Acta Parta A, 61, 1585-1594.
[10] Lopez-Diez EC, Goodacre R (2004) Characterization of Microorganisms using UV Resonance Raman Spectroscopy
and chemometrics. Analytical Chemistry, 76, 585-591.
[11] Mendham AP, Potter BS, Palmer RA, Dines TJ, Mitchell JC, Withnall R, Chowdhry BZ (2009) Vibration spectra
and crystal structure of the di-amino acid peptide cyclo(L-Met-L-Met): comparison of experimental data and DFT
calculations. Journal of Raman Spectroscopy, 41, 148-159.
[12] Puppels GJ, Garritsen HSP, Segers-Nolten GMJ, de Mul FFM, Greve J (1991) Raman microspectroscopic approach
to the study of human granulocytes. Biophysical Journal, 60, 1046-1056.
[13] Rösch P, Harz M, Schmitt M, Peschke K-D, Ronneberger O, Burkhardt H, Motzkus H-W, Lankers M, Hofer S,
Thiele H, Popp J (2005) Chemotaxonomic Identification of Single Bacteria by Micro-Raman Spectroscopy:
Application to Clean-Room-Relevant Biological Contaminations. Applied Environmental Microbiology,71, 1626-
1637.
[14] Rösch P, Schmitt M, Kiefer W, Popp J (2003) The identification of microorganisms by micro-Raman. Journal of
Molecular Structure, 661-662: 363-369.
[15] Schmid T, Messmer A, Yeo B-S, Zhang W, Zenobi R (2008) Towards chemical analysis of nanostructures in
biofilms II: tip-enhanced Raman spectroscopy of alginates. Analytical and Bioanalytical Chemistry, 391, 1907 –
1916.
[16] Schuster KC, Reese I, Urlaub E, Gapes JR, Lendl B (2000a) Multidimensional information on the chemical
composition of single bacterial cells by confocal Raman Microscopy. Analytical Chemistry, 72, 5529-5534.
[17] Schuster KC, Urlaub E, Gapes JR (2000b) Single-cell analysis by Raman microscopy: spectral information on the
chemical composition of cells and on the heterogeneity in a culture. Journal of Microbiological Methods, 42, 29-38.
[18] Williams AC, Edwards HGM (1994) Fourier Transform Raman Spectroscopy of Bacterial Cell Walls. Journal of
Raman Spectroscopy, 25, 673-677.
[19] Zinin PV, Misra A, Kamemoto L, Yu Q, Hu N, Sharma SK (2010) Visible, near-infrared, and ultraviolet lased
excited Raman Spectroscopy of the monocytes/macrophages(U937) cells. Journal of Raman Spectroscopy, 41, 268-
274.
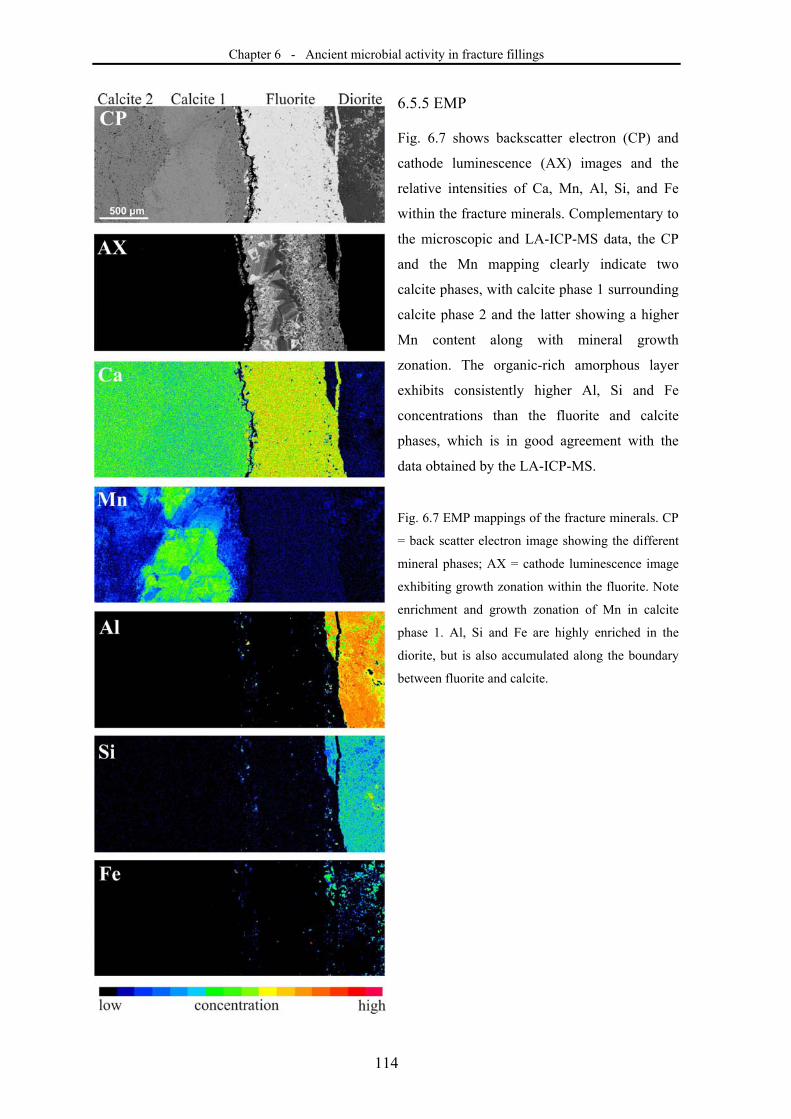
Chapter 6 - Ancient microbial activity in fracture fillings
114
6.5.5 EMP
Fig. 6.7 shows backscatter electron (CP) and
cathode luminescence (AX) images and the
relative intensities of Ca, Mn, Al, Si, and Fe
within the fracture minerals. Complementary to
the microscopic and LA-ICP-MS data, the CP
and the Mn mapping clearly indicate two
calcite phases, with calcite phase 1 surrounding
calcite phase 2 and the latter showing a higher
Mn content along with mineral growth
zonation. The organic-rich amorphous layer
exhibits consistently higher Al, Si and Fe
concentrations than the fluorite and calcite
phases, which is in good agreement with the
data obtained by the LA-ICP-MS.
Fig. 6.7 EMP mappings of the fracture minerals. CP
= back scatter electron image showing the different
mineral phases; AX = cathode luminescence image
exhibiting growth zonation within the fluorite. Note
enrichment and growth zonation of Mn in calcite
phase 1. Al, Si and Fe are highly enriched in the
diorite, but is also accumulated along the boundary
between fluorite and calcite.
Chapter 6 - Ancient microbial activity in fracture fillings
115
6.5.6 Isotope Analysis
∆13C, δ18O and 87Sr/86Sr values are provided in Table 6.4. The isotope data of the individual phases
are relatively homogenous. The δ13C values of the calcite phases range from -8.6 to
-5.3 ‰ and the δ18O values from -9.3 to -8.5 ‰ (PDB). The 87Sr/86Sr ratios of the calcite phase 1
range from 0.7120 to 0.7124, whereas the calcite phase 2 and the organic-rich amorphous layer
vary from 0.7133 to 0.7137. 87Sr/86Sr values in the fluorite vary significantly, from 0.7125 near
calcite phase boundary to 0.7096 at the fluorite-diorite boundary. For the diorite host rock, the 87Sr/86Sr ratios of 0.7063 were obtained at about 1 cm distance from the fracture.
87Sr/86Sr 2σ δ13C ST e δ13C δ18O (PDB) ST e δ18O Calcite phase 1 0.712023 0.000008 -5.268 0.005 -9.289 0.007 Calcite phase 2 0.713349 0.000015 -8.641 0.008 -8.519 0.011 Amorphous phase (P1) 0.713352 0.000029 Amorphous phase (P1) 0.713654 0.000016 Fluorite 0.712530 0.000024 Diorite-fluorite border 0.709621 0.000012 Diorite 0.706252 0.000015
Table 6.4 Isotope data observed for the fracture minerals.
6.6 Discussion
6.6.1 Fracture mineral generations
According to the mineralogy observed, the host rock of the fracture fillings can be specified as a
quartz monzodiorite (Wahlgren et al., 2004, 2006).
The δ18O values and the 87Sr/86Sr ratios (Tab. 4) of the calcite phases enable an assignment of the
Mn-rich calcite phase 1 to fracture generation 5a (<0.7132) from Paleozoic brines of ca 80°C
(Wallin et al., 2007; Drake and Tullborg, 2009). The δ18O values are consistent with those of
previously described Mn-rich fracture calcites from the Äspö area (Tullborg et al., 2008).
According to Milodowski et al., (2005), the uptake of high amounts of Mn(II) in the calcite lattice
indicates reducing conditions during crystallization. It has also been suggested that Mn(II)
incorporation in calcites is enhanced by elevated temperatures during mineral formation
(Dromgoole and Walter, 1989). Both, reducing conditions and elevated temperatures, are in good
agreement with a precipitation of calcite phase 1 from Paleozoic brines.
A clear assignment of calcite phase 2 and the organic-rich amorphous layer to a discrete fracture
mineral generation was more difficult, as their isotopic signatures do not fit exactly into the values
previously reported for different calcite generations (Drake and Tullborg, 2009). These phases
exhibit slightly higher 87Sr/86Sr ratios than those reported for generation 5a, but are significantly
lower than those reported for generation 5b and 6 (Drake and Tullborg, 2009). A possible
explanation relates to glacially induced faulting during the Quaternary (Lund, 2006). Such
Chapter 6 - Ancient microbial activity in fracture fillings
116
reactivation of the old fracture systems would have allowed glacial, meteoric and marine waters to
deeply penetrate into the host rock. Indeed, in the Äspö Hard Rock Laboratory, traces of glacial
and Littorina Sea water have been found down to depths of 840 m and 500 m, respectively (Wallin
et al., 2007). Partial dissolution of the pre-existing calcites (calcite phase 1) and mixing with new
fluids may have caused local “blurring” of the original 87Sr/86Sr ratio during the precipitation of
calcite phase 2.
Considering the sequence of the fracture minerals and the assignments of the calcite phases to the
generations 5 and 6, the fluorite is most likely related to an older, Precambrian, fracture generation
(1 to 4). Indeed, 87Sr/86Sr ratios at the fluorite-diorite contact zone are consistent with fracture
generation 3, thereby corroborating the hypothesis that the fluorite was precipitated from
Precambrian hydrothermal fluids. A somewhat higher 87Sr/86Sr ratio observed immediately at the
phase boundary towards the calcite may be due to alteration of the fluorite during fracture
reactivation.
6.6.2 REE and trace elements
LREE depletions and HREE enrichments, as observed in the fracture fluorite (Fig. 6.3 C), are
frequent features in hydrothermal fluorite, due to different sorption and complexation properties
among the REE during mineral formation (e.g. Sallet et al., 2005; Schwinn and Markl, 2005).
Differences between the REE patterns of the fracture fluorite and the Äspö Diorite indicate a
different source rock chemistry of the hydrothermal fluid and insignificant host rock leaching
(Schwinn and Markl, 2005).
The REE pattern of the calcite phases, with an enrichment of HREE over LREE
(Fig. 6.3 B), is similar to that of Baltic Sea water near the Äspö area (Rönnback et al., 2008). It
reflects REE transport (and precipitation) mainly as carbonate complexes, which, in turn, indicates
source fluids with low organic content (Tullborg et al., 1999).
An enrichment of LREE over HREE, as observed in the organic-rich amorphous layer, may result
from REE complexation with organic matter rather than HCO3 (Tullborg et al., 2008, and
references therein; Ingri et al., 2000). Increased abundances of LREE have also been described for
overburden groundwaters from the Simpevarp/Äspö area, which show higher contents of Fe-rich
colloids and dissolved organic matter (DOM, Rönnback et al., 2008).
REE, like metal cations in general, are easily adsorbed by or form complexes with exposed
negatively charged organic surfaces. Especially extracellular polymeric substances (EPS) in
biofilms offer such surfaces and thus often show strong enrichments of trace elements and REE
(Urrutia and Beveridge, 1993; Ngwenya et al., 2009). In conclusion, the observed distinct
enrichments of LREE, Mg, Al, Si, and Fe may plausibly be considered as a signature for a biofilm-
derived origin of the organic-rich amorphous layer.
Chapter 6 - Ancient microbial activity in fracture fillings
117
6.6.3 Organic matter composition
ToF-SIMS − Most of the hydrocarbon fragments observed in the organic-rich amorphous layer
(Tab. 6.2a) show a relative C/H ratio between 0.4 and 0.8 which can be attributed to aliphatic
hydrocarbons. Likewise C2H5+, C3H7
+, C4H9+ indicate saturated hydrocarbons fragments, whereas
C3H5+, C4H7
+, C5H9+ may derive from unsaturated hydrocarbon moieties. Only few fragments, e.g.
C9H7+, have a high C/H ratio between 1 and 2, indicative for aromatic hydrocarbons (NIST
database, Toporski and Steele, 2004, and references therein). C8H11+, C8H13
+, C9H15+, on the other
hand, likely derive from longer saturated hydrocarbon chains, and have been reported as prominent
fragments in the spectra of acyclic isoprenoids (Toporski et al., 2002). Major oxygen-
functionalized ions found in the organic-rich amorphous layer, namely CH3O+, C2H5O
+, C3H5O+
,
and C4H5O+, are very abundant in the spectra of carbohydrates (Sjövall et al., 2004). Nitrogen-
containing ions such as CH4N+, C2H6N
+, C3H6N+, and C3H2NO- are major products of nitrogen-
containing biogenic compounds such as amino acids and purines (Lu et al., 2004; Spool, 2004; Lee
et al., 2006).
In the negative spectrum, an alkylation series ranging from m/z 255.08 to 353.20 was observed,
maximizing at m/z 311.15, 325.17 and 339.19. A further parallel alkylation series ranges from m/z
239.07 to 337.18. These unidentified negative ions can tentatively be attributed to [M-H]- or [M-
OH]- ions containing a major saturated hydrocarbon moiety together with (a) carboxyl or hydroxyl
functional group(s). Particularly carboxylic acids produce strong [M-H]- ions rather than [M]+,
[M+H]+ and [M+Na]+ (Vickerman and Briggs, 2001). This interpretation is supported by fragments
characteristic for carboxyl-bearing molecules (C2H3O-, C2H2O2
-; Dubey et al., 2009) in the negative
ToF-SIMS spectrum of the organic-rich amorphous layer.
In ToF-SIMS, it is possible to robustly assign an individual mass peak to a chemical structure only
for low-mass fragments, or known analytes in pre-characterized samples (Vickerman and Briggs,
2001). The identification of unknown organic compounds, however, should ideally rely on the
presence of several characteristic fragments in the spectrum, and comparison with standard data
(Heim et al., 2009). For negative ToF-SIMS spectral data, this is hampered by the still limited
number of published reference spectra (see also Spool, 2004). Whereas no intact lipid biomarkers
were identified in the organic-rich amorphous layer, the small and partly functionalized organic
molecules observed may be plausibly related to EPS. EPS in biofilms are composed of
polysaccharides, proteins, nucleic acids, lipids and humic substances (Nielsen et al., 1997) and may
constitute between 50 and 90 % of the total organic matter (Wingender et al., 1999).
Raman microscopy − In the 1625 - 1568 cm-1 range, C=C stretching in the Raman spectra of the
organic-rich amorphous layer indicate unsaturation (van de Voort et al., 2001), including
aromatisation (Jehlička and Edwards, 2008). Characteristic bands for amino acids (amide II),
Chapter 6 - Ancient microbial activity in fracture fillings
118
however, are also observed in this range (Schuster et al., 2000a; Ivleva et al., 2009; Zinin et al.,
2010). Bendings of CH2 and CH3 groups are predominantly observed at 1481-1437 cm-1 and band
complexes between 1323 and 1226 cm-1 further suggest the presence of amino and nucleic acids,
respectively (Puppels et al., 1991; Schuster et al., 2000b; Zinin et al., 2010). The complex band
pattern between 1200 and 1000 cm-1 is mainly assigned to C-O and C-C stretching. Further small
bands between 968 and 881 cm-1 are related to CH2 and CH3 rocking vibrations (Williams and
Edwards, 1994; Jehlička and Edwards, 2008), whereas bands between 845-815 cm-1 are related to
C-C, C-O bending modes (Williams and Edwards 1994; Edwards et al., 1997; Schmid et al., 2008)
or ring breathing modes of tyrosine (Ivleva et al., 2009; Zinin et al., 2010). Raman bands related to
bending of NCO or tyrosine are observed at 645 cm-1 (Puppels et al., 1994; Williams and Edwards,
1994; Zinin et al., 2010).
Considering that Raman vibrations, their variation and intensity strongly depend on the orientation
and the physical conditions of the material investigated (Nasdala et al., 2004), the Raman data of
the organic-rich amorphous layer indicated diverse, functionalized organic molecules comprising
amino acids, nucleic acids, carbohydrates, aromatic and unsaturated hydrocarbons. These results
strongly support the interpretations drawn from the ToF-SIMS data, i.e., that the organic-rich
amorphous layer constitutes remains of a (relatively recent) fossil biofilm.
6.7 Conclusion and potential fracture reactivation scenario
A comprehensive analytical approach enabled a reconstruction and integrated understanding of
ancient environmental processes that occurred within the continental deep biosphere. The analyses
were performed on minute amounts of fracture minerals, i.e. at the microscopic range (µm-scale),
while leaving the integrity of the studied structures virtually intact. The Äspö Diorite contains four
generations of fracture fillings. The first generation is a fluorite phase, derived from Precambrian
hydrothermal fluids. The second mineral phase consists of Mn-rich calcites (calcite phase 1),
precipitated from Palaeozoic brine fluids. The third mineral phase is a 20-100 µm thick, organic-
rich amorphous layer that is interpreted to represent a fossilized biofilm whose formation was
induced by glacial reactivation of the fracture system and subsequent water injections during the
Late Pleistocene. ToF-SIMS and Raman imaging revealed fragments and bond types clearly
indicative of hydrocarbon moieties as well as N- and O-containing organic heterocompounds.
These organic compounds are exactly co-localized with the dark amorphous layer and may largely
derive from biofilm- associated EPS. The formation and growth of a biofilm in the fracture
reasonably explains the observed fractionations and accumulations of LREE, Mg, Al, Si, and Fe.
The breakdown of functionalized molecules occurs rapidly when considering geological time
scales, however this biofilm still shows a good preservation indicating a relatively recent formation
Chapter 6 - Ancient microbial activity in fracture fillings
119
rather than a Palaeozoic or even Precambrian age. A change in the chemical composition (salinity
and alkalinity) of the supplying water presumably lead to crystallization of the fourth fracture
mineral phase (calcite mineral phase 2), thereby terminating the growth and existence of the
subsurface biofilm.
Acknowledgements ….…Journal reviewers….. We are grateful to Emmeli Johansson, Magnus Kronberg, Carljohan
Hardenby and Oskar Sigurdsson from SKB for technical and logistic support at the Äspö Hard
Rock Laboratory. Wolfram Ibach (Witec GmbH) is acknowledged for software support. Our study
received financial support from the German Research Foundation (DFG). This is publication no.
XX of the DFG Research Unit FOR 571 ‘Geobiology of Organo- and Biofilms’.
References
Abramov O, Mojzis S (2009) Microbial habitability of the Hadean earth during late heavy bombardment.
Nature, 459, 419-422.
Åhäll K-I (2001) Åldersbestämning av svårdaterade bergarter i sydöstra Sverige. Svensk
Kärnbränslehantering AB, R-01-60, 24 p.
Amend JP, Teske A (2005) Expanding frontiers in deep subsurface microbiology. Palaeogeography,
Palaeoclimatology, Palaeoecology, 219, 131– 155.
Anbar AD (2004) Iron stable isotopes: beyond biosignatures. Earth and Planetary Science Letters, 217, 223-
236.
Arouri K, Greenwood PF, Walter MR (2000) Biologival affinities of Neoproterozoic acritarchs from
Australia: microscopic and chemical characterisation. Organic Geochemistry, 31, 75-89.
Banerjee NR, Furnes H, Muehlenbachs K, Staudigel H, de Wit M (2006) Preservation of ~3.4-3.5 Ga
microbial biomarkers in pillow lavas and hyaloclastites from the Barberton Greenstone Belt, South
Africa. Earth and Planetary Science Letters, 241, 707-722.
Blumenberg M, Seifert R, Petersen S, Michaelis W (2007) Biosignatures present in a hydrothermal massive
sulphide from the Mid-Atlantic Ridge. Geobiology, 5, 435-450.
Bons PD, Montenari M, Bakker RJ, Elburg M (2009) Potential evidence of fossilised Neoproterozoic deep
life : SEM observations on calcite veins from Oppaminda Creek, Arkoola, South Australia.
International Journal of Earth Sciences, 98, 327-343.
Brocks JJ, Pearson A (2005) Building the biomarker tree of life. Reviews in Mineralogy and Geochemistry,
59, 233-258.
Canfield DE (2001) Biogeochemistry of Sulfur Isotopes. Reviews in Mineralogy and Geochemistry, 43, 607-
636.
Chapter 6 - Ancient microbial activity in fracture fillings
120
Campos-Vallette MM, Chandía NP, Clavijo E, Leal D, Matsuhiro B, Osorio-Román IO, Torres S (2009)
Characterization of sodium alginates and its block fractions by surface-enhanced Raman spectroscopy.
Journal of Raman Spectroscopy, DOI 10.1002/jrs.2517.
Czaja AD, Kudryavtev AB, Cody GD, Schopf JW (2009) Characterization of permineralized kerogen from
an Eocene fossil fern. Organic Geochemistry, 40, 353-364.
Dideriksen K, Christiansen BC, Frandsen C, Balic-Zunic T, Mørup S, Stipp SLS (2010) Paleo-redox
boundaries in fractured granite. Geochimica et Cosmochimica Acta, 74, 2866-2880.
Dobretsov NL, Kolchanov NA, Suslov VV (2006) On the early stages of the evolution of the geosphere and
biosphere. Paleontological Journal, 40,407-424.
Drake H, Tullborg E-L (2009) Paeohydrological events recorded by stable isotopes, fluid inclusions and trace
elements in fracture minerals in crystalline rock, Simpevarp area, SE Sweden. Applied Geochemistry,
24, 715-732.
Drake H, Page L, Tullborg, E-L (2007) Oskarshamn site investigations. 40Ar/39Ar dating of fracture
minerals. Svensk Kärnbränslehantering AB, P-07-27, 42 p.
Drake H, Tullborg E-L (2006) Oskarshamn site investigation. Fracture mineralogy, Results from drill core
KSH03A + B. Svensk Kärnbränslehantering AB, P-06-03, 56 p.
Drake H, Tullborg E-L (2004) Oskarshamn site investigation. Fracture mineralogy and wall rock alteration.
Results from drill core KSH01A+B. Svensk Kärnbränslehantering AB, P-04-250, 112 p.
Dromgoole EL, Walter LM (1981) Iron and manganese incroporation into calcite: Effects of growth kinetics,
temperature and solution chemistry. Chemical Geology, 81, 311-336.
Dubey M, Emoto K, Cheng F, Gamble LJ, Takahashi H, Grainger DW, Castner DG (2009) Surface analysis
of photolithographic patterns using ToF-SIMS and PCA. Surface and Interface Analysis, 18, 645-652.
Edwards HGM, Farwell DW, Quye A (1997) ‘Dragon’s Blood’ I – Characterization of an Ancienct Resing
Using Fourier Transform Raman Spectroscopy. Journal of Raman Spectroscopy, 28, 243-249.
Eydal, HSC, Jägevall S, Hermansson M, Pedersen K (2009) Bacteriophage lytic to Desulfovibrio aespoeensis
isolated from deep groundwater. The ISME Journal, 3, 1139-1147.
Gaus K, Rösch P, Petry R, Peschke K-D, Ronneberger O, Burkhardt H, Baumann K, Popp J (2006)
Classification of Lactic Acid Bacteria with UV-Resonance Raman Spectroscopy. Biopolymers, 82,
286-290.
Heim C, Sjövall P, Lausmaa J, Leefmann T, Thiel V (2009). Spectral characterisation of eight glycerolipids
and their detection in natural samples using time-of-flight secondary ion mass spectrometry. Rapid
Communications In Mass Spectrometry, 23, 2741-2753.
Himmelsbach DS, Akin DE (1998) Near-Infrared Fourier-Transform Raman Spectroscopy of Flay (Linum
usitatissimum L.) Stems. Journal of Agricultural and Food Chemistry, 46, 991-998.
Hinrichs, K.-U., Hayes, J. M., Sylva, S. P., Brewer, P. G., DeLong, E. F., 1999. Methane-consuming
archaebacteria in marine sediments. Nature, 398, 802–805.
Hofmann BA, Farmer JD, von Blanckenburg F, Fallick AE (2008) Subsurface filamentous fabrics: An
evaluation of origins based on morphological and geochemical criteria, with implications for
exopaleontology. Astrobiology, 8, 87-117.
Chapter 6 - Ancient microbial activity in fracture fillings
121
Horsfield B, Schenk HJ, Zink K, Ondrak R, Diekmann V, Kallmeyer J, Mangelsdorf K, di Primo R, Wilkes
H, Parkes RJ, Fry J, Cragg B (2006) Living microbial ecosystems within the active zone of
catagenesis: Implications for feeding the deep biosphere. Earth and Planetary Science Letters, 246,
55-69.
Ingri J, Widerlund A, Land M, Gustafsson Ö, Andersson P, Öhlander B (2000) Temporal variations in the
fractionation of the rare earth elements in a boreal river; the role of colloidal particles. Chemical
Geology, 166, 23-45.
Ivarsson M, Lausmaa J, Lindblom S, Broman C, Holm NG (2008) Fossilized microorganisms from the
Emperor Seamounts: implications for the search for a subsurface fossil record on Earth and Mars.
Astrobiology, 8, 1139-1157.
Ivleva NP, Wagner M, Horn H, Niessner R, Haisch C (2009) Towards a nondestructie chemichal
characterization of biofilm matrix by Raman spectroscopy. Analytical and Bioanalytical Chemistry,
393, 197 -206.
Jehlička J, Edwards HGM (2008) Raman spectroscopy as a toll for the non-destructive odentification of
organic minerals in the geological record. Organic Geochemistry, 39, 371-386.
Jenkins AL, Larsen RA, Williams TB (2005) Characterization of amino acids using Raman spectroscopy.
Spectromchimica Acta Part A, 61, 1585-1594.
Joachimski, MM, Ostertag-Henning C, Pancost RD, Strauss H, Freeman KH, Littke R, Sinninghe Damsté JS,
Racki G (2001) Water column anoxia, enhanced productivity and concomitant changes in δ13C and
δ34S across the Frasnian-Famennian boundary (Kowala – Holy Cross Mountains /Poland). Chemical
Geology, 175, 109-131.
Jochum KP, Nohl U, Herwig K, Lammel E, Stoll B, Hofmann AW (2005) GeoReM: a new geochemical
database for reference materials and isotopic standards, Geostandards and Geoanalytical Research,
29, 333-8.
Kornfält KA, Persson PO, Wikman H (1997) Granitoids from the Äspo area, southeastern Sweden;
geochemical and geochronological data. Geologiska Föreningens i Stockholm Förhandligar, 119, 109-
114.
Kotelnikova S (2002) Microbial production and oxidation of methane in deep subsurface. Earth-Science
Reviews, 58, 367-395.
Kotelnikova S, Pedersen K (1998) Distribution and activity of methanogenes and homacetogenes on deep
granitic aquifers at Äspö Hard Rock Laboratory, Sweden. FEMS Microbiology Ecology, 26, 121-134.
Kyle JE, Eydal HSC, Ferris FG, Pedersen K (2008) Viruses in granitic groundwater from 69 to 450 m depth
of the Äspö Hard Rock Laboratory, Sweden. The ISME Journal, 2, 571-574.
Laaksoharju M, Smellie J, Gimeno M, Auqué L, Gómez J, Tullborg E-L, Gurban I (2004) Hydrogeochemical
evaluation of the Simpevarp area, model version 1.1. Svensk Kärnbränslehantering AB, R-04-16, 398
p.
Lee TG, Shon HK, Kim MS, Le HB, Moon DW (2006) ToF-SIMS imaging of gradient polyethylene and its
amine-functionalized surfaces. Applied Surface Sciences, 252, 6754-6756.
Chapter 6 - Ancient microbial activity in fracture fillings
122
Li J-X, Gardella JA Jr, McKeowen PJ (1995) A quantitative time-of-flight secondary ion mass spectrometry
study of ion formation mechanisms using acid-base alternating Langmuir-Blodgett films. Applied
Surface Science, 90, 205-215.
Lopez-Diez EC, Goodacre R (2004) Characterization of Microorganisms using UV Resonance Raman
Spectroscopy and chemometrics. Analytical Chemistry, 76, 585-591.
Lu D, Mo Z-Q, Xing Z-X, Gui D (2004) Analysis of amine contamination on silsicon oxide surfaces using
ToF-SIMS. Applied Surface Sciences, 233, 352-359.
Lund B (2006) Stress variations during a glacial cycle at 500 m depth in Forsmark and Oskarshman: Earth
model effects. Svensk Kärnbränslehantering AB, R-06-95, 32 p.
Mendham AP, Potter BS, Palmer RA, Dines TJ, Mitchell JC, Withnall R, Chowdhry BZ (2009) Vibration
spectra and crystal structure of the di-amino acid peptide cyclo(L-Met-L-Met): comparison of
experimental data and DFT calculations. Journal of Raman Spectroscopy, 41, 148-159.
Milodowski AE, Tullborg E-L, Buil B, Gômez P, Turrero M-J, Haszeldine S, England G, Gillespie MR,
Torres T, Ortiz JE, Zacharias J, Silar J, Chvátal M, Strnad L, Šebek O, Bouch JE, Chenery SR,
Chenery C, Shepherd TJ, McKervey JA (2005) Application of mineralogical petrological and
geochemical tools for evaluating the palaeohydrogeological evolution of the PADAMOT Study sites.
PADAMOT PROJECT - EU FP5 Contract No. FIKW-CT2001-20129, Technical Report WP2, 228 p.
Nasdala L, Smith DC, Kaindl R, Zieman MA (2004) Raman spectroscopy: Analytical perspectives in
mineralogical research. In Spectroscopic Methods in Mineralogy. Beran A., Libowitzky E., (eds) Emu
Notes in Mineralogy, Vol. 6, 281-343.
Ngwenya BT, Mosselmans JFW, Magennis M, Atkinson KD, Tourney J, Olive V, Ellam RM (2009)
Macroscopic and spectroscopic analysis of lanthanide adsorption to bacterial cells. Geochimica and
Cosmochimica Acta, 73, 3134-3147.
Nielsen PH, Jahn A, Palmgren R (1997) Conceptual model for production and composition of exopolymers
in biofilms. Water Science and Technology, 36, 11-19.
NIST. EI Mass Spectrum database. http://www.nist.gov/data/nist1a.htm.
Peckmann J, Thiel V (2004) Carbon cycling at ancient methane-seeps. Chemical Geology 204, 443-467.
Pedersen K (2000) Exploration of deep intraterrestrial microbial life: current perspectives. FEMS,
Microbiology Letters, 185, 9-16.
Perkins MC, Roberts CJ, Briggs D, Davies MC, Friedmann A, Hart CA, Bell GA (2005) Surface morphology
and chemistry of Prunus laurocerases L. leaves: a study using X-ray photoelectron spectroscopy,
time-of-flight secondary-ion mass spectrometry, atomic-force microscopy and scanning electron
microscopy. Planta, 221, 123-134.
Peters KE, Walters CC, Moldowan JM (2004) The Biomarker Guide: Volume 1: Biomarkers and Isotopes in
the Environments and Human History. Cambridge University Press, Cambridge, 490 p.
Puppels GJ, Garritsen HSP, Segers-Nolten GMJ, de Mul FFM, Greve J (1991) Raman microspectroscopic
approach to the study of human granulocytes. Biophysical Journal, 60, 1046-1056.
Reitner J, Schumann GA, Pedersen K (2005) Fungi in subterranean environments. In Gadd GJ (ed), Fungi in
biogeochemical cycles. Cambridge University Press, Cambridge, 378-403.
Chapter 6 - Ancient microbial activity in fracture fillings
123
Roberts D (2003) The Scandinavian Caledonides; event chronology, palaeogeographic settings and likely
modern analogues. Tectonophysics, 365, 283-299.
Rönnback P, Åström M, Gustafsson J-P (2008) Comparison of the behaviour of rare earth elements in surface
waters, overburden groundwaters and bedrock groundwaters in two granitoidic settings, Eastern
Sweden. Applied Geochemistry, 23, 1862-1880.
Rösch P, Harz M, Schmitt M, Peschke K-D, Ronneberger O, Burkhardt H., Motzkus H-W, Lankers M, Hofer
S, Thiele H, Popp J (2005) Chemotaxonomic Identification of Single Bacteria by Micro-Raman
Spectroscopy: Application to Clean-Room-Relevant Biological Contaminations. Applied
Environmental Microbiology, 71, 1626-1637.
Rösch P, Schmitt M, Kiefer W, Popp J (2003) The identification of microorganisms by micro-Raman.
Journal of Molecular Structure, 661-662, 363-369.
Sahl JW, Schmidt R, Swanner ED, Mandernack KW, Templeton AS, Kieft TL, Smith RL, Sandford WE,
Callaghan RL, Mitton JB, Spear JR (2008) Subsurface Microbial Diversity in Deep-Granitic Fracture
Water in Colorado. Applied and Environmental Microbiology, 74, 143-152.
Sallet R, Moritz R, Fontignie D (2005) The use of vein fluorite as probe for paleofluid REE and Sr-Nd
isotope geochemistry: The Santa Catarina Fluorite District, Southern Brazil. Chemical Geology, 223,
227-248.
Sandström B, Tullborg E-L (2009) Episodic fluid migration in the Fennoscandian Shield recorded by stable
isotopes, rare earth elements and fluid inclusions in fracture minerals at Forsmark, Sweden. Chemical
Geology, 266, 126-142.
Schmid T, Messmer A, Yeo B-S, Zhang W, Zenobi R (2008) Towards chemical analysis of nanostructures in
biofilms II: tip-enhanced Raman spectroscopy of alginates. Analytical and Bioanalytical Chemistry,
391, 1907-1916.
Schuster KC, Reese I, Urlaub E, Gapes JR, Lendl B (2000a) Multidimensional information on the chemical
composition of single bacterial cells by confocal Raman Microscopy. Analytical Chemistry, 72, 5529-
5534.
Schuster KC, Urlaub E, Gapes JR (2000b) Single-cell analysis by Raman microscopy: spectral information
on the chemical composition of cells and on the heterogeneity in a culture. Journal of Microbiological
Methods, 42, 29-38.
Schwinn G, Markl G (2005) REE systematics in hydrothermal fluorite. Chemical Geology 216, 225-248.
Sjövall, P,, Lausmaa, J., Johansson, B.-L., Andersson, M., 2004. Surface chemical analysis of carbohydrate
materials used for chromatography media by Time-of-Flight Secondary Ion Mass Spectrometry.
Analytical Chemistry, 76, 1857-1864.
Spool AM (2004) Interpretation of static secondary ion spectra. Surface and Interface Analysis, 36, 264-274.
Staudigel H, Furnes H, McLoughlin N, Banerjee NR, Connell LB, Templeton A (2008) 3.5 billion years of
glass bioalteration: volcanic rocks as a basis for microbial life? Earth-Science Reviews, 89, 156-176.
Steele A, Toporski JKW, Avci R, Guidry S, McKay DS (2001) Time of flight secondary ion mass
spectrometry (ToFSIMS) of a number of hopanoids. Organic Geochemistry, 32, 905-911.
Szewzyk U, Szewzyk R, Stenström T-A (1994) Thermophilic, anaerobic bacteria isolated from a deep
borehole in granite, Sweden. Proceedings of the National Academy of Sciences, USA, 91, 1810-1813.
Chapter 6 - Ancient microbial activity in fracture fillings
124
Taylor SR, McLennan SM (1985) The continental crust: its composition and evolution. Blackwell, Oxford,
312p.
Thiel V, Toporski J, Schumann G, Sjövall P, Lausmaa J (2007) Analysis of archaeal core ether lipids using
Time of Flight - Secondary Ion Mass Spectrometry (ToF-SIMS): Exploring a new prospect for the
study of biomarkers in geobiology. Geobiology, 5, 75-83.
Thiel V, Heim C, Arp G, Hahmann U, Sjövall P, Lausmaa J (2007) Biomarkers at the microscopic range:
ToF-SIMS molecular imaging of Archaea-derived lipids in a microbial mat. Geobiology, 5, 413-421.
Toporski J, Steele A (2004) Characterization of purified biomarker compounds using time of flight-
secondary ion mass spectrometry (ToF-SIMS). Organic Geochemistry, 35, 793–811.
Toporski J, Steele A, Westall F, Avci R, Martill M, McKay DS (2002) Morphological and spectral
investigation of exceptionally well preserved bacterial biofilms from the Oligocene Enspel formation,
Germany. Geochimica et Cosmochimica Acta, 66, 1773–1791.
Tullborg E-L, Drake H, Sandström B, (2008) Palaeohydrogeology: A method based on fracture mineral
studies. Applied Geochmistry, 23, 1881-1897.
Van de Voort FR, Sedman J, Russin T (2001) Lipid analysis by vibrational spectroscopy. European Journal
of Lipid Science and Technology, 103, 815-825.
Ventura GT, Kenig F, Reddy CM, Schieber J, Frysinger GS, Nelson RK, Dinel E, Gaine, RB, Schaeffer P
(2007) Molecular evidence of late Archaean archaea and the presence of a subsurface hydrothermal
biosphere. PNAS, 104, 14260-14625.
Vickerman, JC, Briggs D (2001) ToF-SIMS: Surface analysis by mass spectrometry. IM Publications and
Surface Spectra Limited. Charlton, Chichester, West Sussex, UK, 789 p.
Wahlgren C-H, Ahl M, Sandahl K-A, Berglund J, Petersson J, Ekström M, Persson PO (2004) Bedrock
mapping 2003 - Simpevarp subarea. Outcrop data, fracture data, modal and geochemical classification
of rock types, bedrock map, radiometric dating. Oskarshamn site investigation. Svensk
Kärnbänslehantering AB, P-04-102, 52 p.
Wahlgren C-H, Hermanson J, Forssberg O, Curtis P, Triumf C-A, Drake H, Tullborg E-L (2006) Geological
description of rock domains and deformation zones in the Simpevarp and Laxemar subareas.
Preliminary site description Laxemar subarea - version 1.2. Svensk Kärnbänslehantering AB. R-05-69,
265 p.
Wallin B, Laaksoharju M, Tullborg E-L (2007) Description of the different end-memebers identified from
interpretations of groundwater chemistry and mixing models; results from Äspö and Laxemar area. In.
Svensson U., (ed). Towards a new generation of flow and transport models for the Äspö Hard Rock
Laboratory. Svensk Kärnbänslehantering AB, R-08-74, 61-80.
Westall F, Folk RL (2003) Exogenous carbonaceous microstructures in early Arcaean cherts and BIFs from
the Isua Greenstone Belt: impications for the search for life in ancient rocks. Precambrian Research,
126, 313-330.
Williams AC, Edwards HGM (1994) Fourier Transform Raman Spectroscopy of Bacterial Cell Walls.
Journal of Raman Spectroscopy, 25, 673-677.
Chapter 6 - Ancient microbial activity in fracture fillings
125
Wingender J, Neu TR, Flemming H-C (1999) What are bacterial extracellular polymeric substances? In:
Wingender J, Neu TR, Flemming H-C, (Eds) Microbial Extracellular Polymeric Substances. Springer,
Berlin, 1-15.
Zinin PV, Misra A, Kamemoto L, Yu Q, Hu N, Sharma SK (2010) Visible, near-infrared, and ultraviolet
lased excited Raman Spectroscopy of the monocytes/macrophages (U937) cells. Journal of Raman
Spectroscopy, 41, 268-274.

126
Chapter 7 - Summary
127
7
Summary and Conclusions
In this thesis project, biomarkers, biomineralization processes and TREE (trace and rare earth
elements) patterns in mineralizing microbial mats were established and tested as biosignatures in
recent and fossil environments. To overcome limitations of conventional biomarker analysis, a
comprehensive analytical approach was developed that accomplished the detection and the laterally
resolved visualization of biomarkers on the same sample, and with minimal sample disruption.
In a pilot experiment, the application of ToF-SIMS (time-of-flight secondary ion mass
spectrometry) enabled the simultaneous analysis of major archaeal biomarker classes in calcifying
microbial mats from the Black Sea. Individual biomarker provenances on a µm-scale were
identified and assigned to colonies of methanotrophic archaeal communities, namely ANME-1 vs.
ANME-2 (anaerobic methane oxidizers). Previously equivocal lipid biomarkers could thus be
linked to distinctive source biota without the need to isolate and culture these microbes in the
laboratory. Subsequent microscopic investigations on the same sample provided further
morphological and mineralogical evidence that corroborated the assignments made.
ToF-SIMS has a strong potential for molecule detection, identification and visualization at the
microscopic range. However, because the method is still in its infancy with respect to the analysis
of organic biomarkers, further evaluations of capabilities and limitations are required. In that
respect, preparation protocols for geobiological samples have to be improved, and compound
specific matrix effects have to be examined. Even more important, more biomarker reference
standards have to be characterized and their fragmentation patterns determined to enhance the
understanding and interpretation of ToF-SIMS data. To further expand the range of biomarker
reference standards, ToF-SIMS spectra of selected glycerolipids were obtained, and the formation
of molecular ions and specific fragments was studied in detail. These data are most useful as a basis
for the identification of these and related biomarkers in environmental samples. Based on the
reference data, it was possible to identify lipids (diglycerides and phosphatidylglycerol) in
microscopic sections of mineralizing microbial mats from Black Sea methane seeps, and from
Gallionella ferruginea-dominated iron-oxidizing microbial mats from the Äspö Hard Rock
Laboratory (HRL).
G. ferruginea mats were also investigated to study biomineralization processes and corresponding
TREE fractionations as potential biosignatures for microbially induced formation of iron
oxyhydroxides. For that purpose, a long-term flow reactor experiment was established in the Äspö
HRL. Biomineralization processes and concomitant TREE accumulation within theses microbial
mats revealed different forms of biomineral formation during growth and aging of G. ferruginea
Chapter 7 - Summary
128
and massive, up to 106 fold accumulations of individual metals. Further, the REE+Y fractionation
patterns within the microbial iron oxyhydroxides differ significantly from chemically precipitated
iron oxyhydroxides, but show a strong similarity to REE+Y patterns reported for Precambrian BIF.
The findings support the idea that iron oxidizing microorganisms such as G. ferruginea may have
significantly contributed to the formation of BIF.
In a third experiment, a comprehensive analytical approach to biosignatures within fracture
minerals in the ~1.8 Ga old Äspö Diorite enabled the reconstruction and integrated understanding
of ancient environmental processes that occurred within the deep continental biosphere. ToF-SIMS,
CRM (Confocal Raman Microscopy) and LA-ICP-MS (laser ablation-inductively coupled mass
spectrometry) and respectively electron microprobe and isotope sampling analyses were performed
on two, 5 mm thick opposing rock sections, i.e. on a minute amount of fracture minerals, which
enabled to retrace four different fracture mineral generations. One of them, an organic-rich
amorphous layer, exhibited numerous functionalized organic molecules and accumulations and
fractionations of distinct TREE and was interpreted as a fossilized biofilm. Biofilm formation was
most probably induced by glacially induced fracture reactivation and water injections down to
450 m depth. Further fracture mineral formation terminated and entrapped the microbial activity
that once occurred at depth.
The integrated approach used in this study led to the successful establishment of source specific
biosignatures, and offers a strong tool kit for the study of mineralizing microbial mats and their
interaction with the environment. The techniques employed in this study may further help to link
biosignatures in recent systems to their fossil analogues and ultimately, to early complex forms of
life. It can be foreseen that high resolution techniques such as ToF-SIMS and CRM will grow in
importance not only in geobiology, but in all fields of natural sciences, wherever the detection and
precise localization of organic compounds in environmental materials is required.
Appendix A - Terrestrial Deep Biosphere
129
A
TERRESTRIAL DEEP BIOSPHERE
Christine Heim
Encyclopedia of Geobiology, Springer, 2011, in press
Synonyms
Continental deep biosphere, subterranean biosphere
Definition
The terrestrial deep biosphere comprises ecosystems in the marine (e.g. shelf-sediments) and
continental subsurface, beneath the rhizosphere or bioturbated zone. The habitable depth is limited
by space (rock porosity), the availability of water and in particular the maximum viable
temperature depending on the local geothermal gradient (Gold, 1992; Pedersen, 1993, 2000, 2001,
2002; Stevens, 2002).
Introduction
Microbial life exists in, and seems to be adapted to all kinds of ecological niches on earth. From the
early 30ies, increasing numbers of publications report on the occurrence of microorganisms in deep
terrestrial settings, such coal mines (Lipman, 1931, 1937; Liske, 1932) and deep formation waters
from oil drilling, as deep as 2000m (Ginsburg-Karagitscheva, 1933; Issatchenko, 1940). During the
following decades the scientific interest in subsurface microbiology focussed on the effects of
microorganisms on oil and gas exploration, such as corrosion of drilling devices, oil
transformation, but also the role of microorganisms in the biological origin of natural gas resources
(Zobell, 1945; Bailey et al.,1973; Belyaev et al.,1983; Colwell et al.,2004; Lollar et al.,2006).
Deep subsurface microorganisms have a potential impact not only on oil and gas exploration, but
also on groundwater (Chapelle, 2000), long-term storage of nuclear waste (Pedersen, 1993, 1997;
Boivin-Jahns et al.,1996; Christofi and Philip, 1997; Hersman, 1997; Pedersen et al.,2008), and
finally, implications for the origin of life and the search for extraterrestrial life (Stevens, 1997a;
Faison, 2003; Cockell, 2004).
Scientific continental drilling (ICDP), and also site investigations for the storage of nuclear waste
for a better understanding of geological, hydrological and biogeochemical processes in the deep
continental crust, supported the development of contamination minimizing, drilling, sampling and
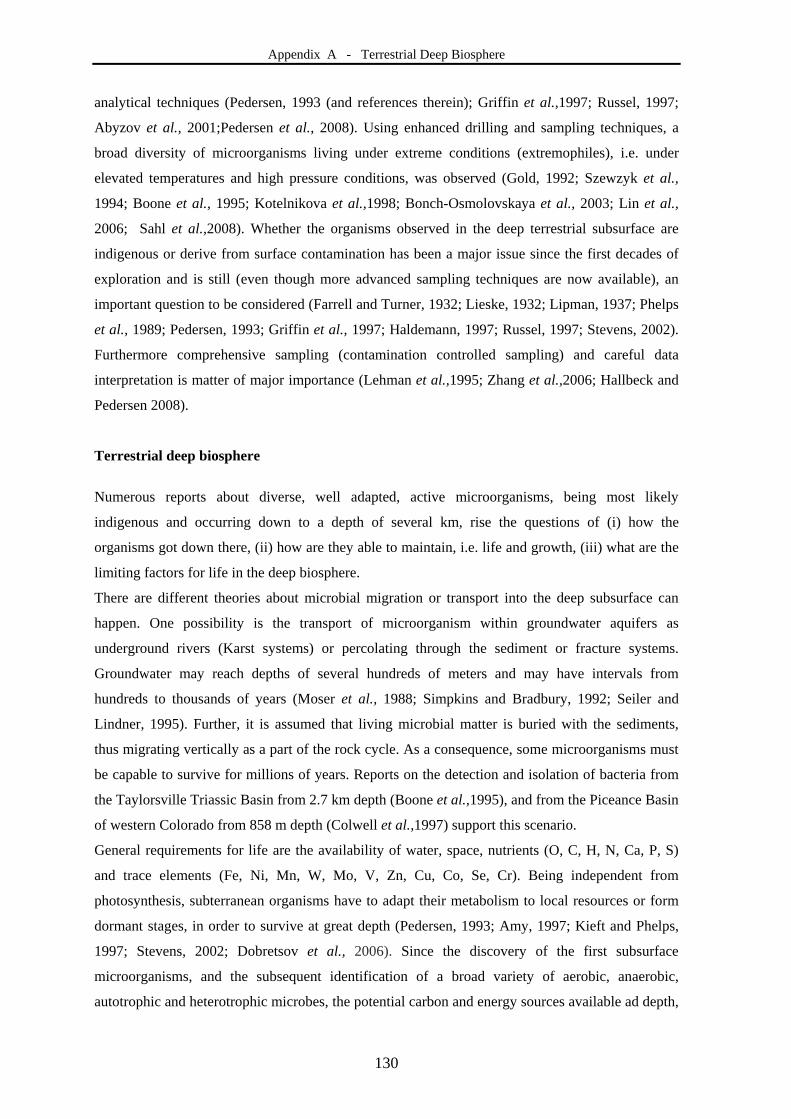
Appendix A - Terrestrial Deep Biosphere
130
analytical techniques (Pedersen, 1993 (and references therein); Griffin et al.,1997; Russel, 1997;
Abyzov et al., 2001;Pedersen et al., 2008). Using enhanced drilling and sampling techniques, a
broad diversity of microorganisms living under extreme conditions (extremophiles), i.e. under
elevated temperatures and high pressure conditions, was observed (Gold, 1992; Szewzyk et al.,
1994; Boone et al., 1995; Kotelnikova et al.,1998; Bonch-Osmolovskaya et al., 2003; Lin et al.,
2006; Sahl et al.,2008). Whether the organisms observed in the deep terrestrial subsurface are
indigenous or derive from surface contamination has been a major issue since the first decades of
exploration and is still (even though more advanced sampling techniques are now available), an
important question to be considered (Farrell and Turner, 1932; Lieske, 1932; Lipman, 1937; Phelps
et al., 1989; Pedersen, 1993; Griffin et al., 1997; Haldemann, 1997; Russel, 1997; Stevens, 2002).
Furthermore comprehensive sampling (contamination controlled sampling) and careful data
interpretation is matter of major importance (Lehman et al.,1995; Zhang et al.,2006; Hallbeck and
Pedersen 2008).
Terrestrial deep biosphere
Numerous reports about diverse, well adapted, active microorganisms, being most likely
indigenous and occurring down to a depth of several km, rise the questions of (i) how the
organisms got down there, (ii) how are they able to maintain, i.e. life and growth, (iii) what are the
limiting factors for life in the deep biosphere.
There are different theories about microbial migration or transport into the deep subsurface can
happen. One possibility is the transport of microorganism within groundwater aquifers as
underground rivers (Karst systems) or percolating through the sediment or fracture systems.
Groundwater may reach depths of several hundreds of meters and may have intervals from
hundreds to thousands of years (Moser et al., 1988; Simpkins and Bradbury, 1992; Seiler and
Lindner, 1995). Further, it is assumed that living microbial matter is buried with the sediments,
thus migrating vertically as a part of the rock cycle. As a consequence, some microorganisms must
be capable to survive for millions of years. Reports on the detection and isolation of bacteria from
the Taylorsville Triassic Basin from 2.7 km depth (Boone et al.,1995), and from the Piceance Basin
of western Colorado from 858 m depth (Colwell et al.,1997) support this scenario.
General requirements for life are the availability of water, space, nutrients (O, C, H, N, Ca, P, S)
and trace elements (Fe, Ni, Mn, W, Mo, V, Zn, Cu, Co, Se, Cr). Being independent from
photosynthesis, subterranean organisms have to adapt their metabolism to local resources or form
dormant stages, in order to survive at great depth (Pedersen, 1993; Amy, 1997; Kieft and Phelps,
1997; Stevens, 2002; Dobretsov et al., 2006). Since the discovery of the first subsurface
microorganisms, and the subsequent identification of a broad variety of aerobic, anaerobic,
autotrophic and heterotrophic microbes, the potential carbon and energy sources available ad depth,
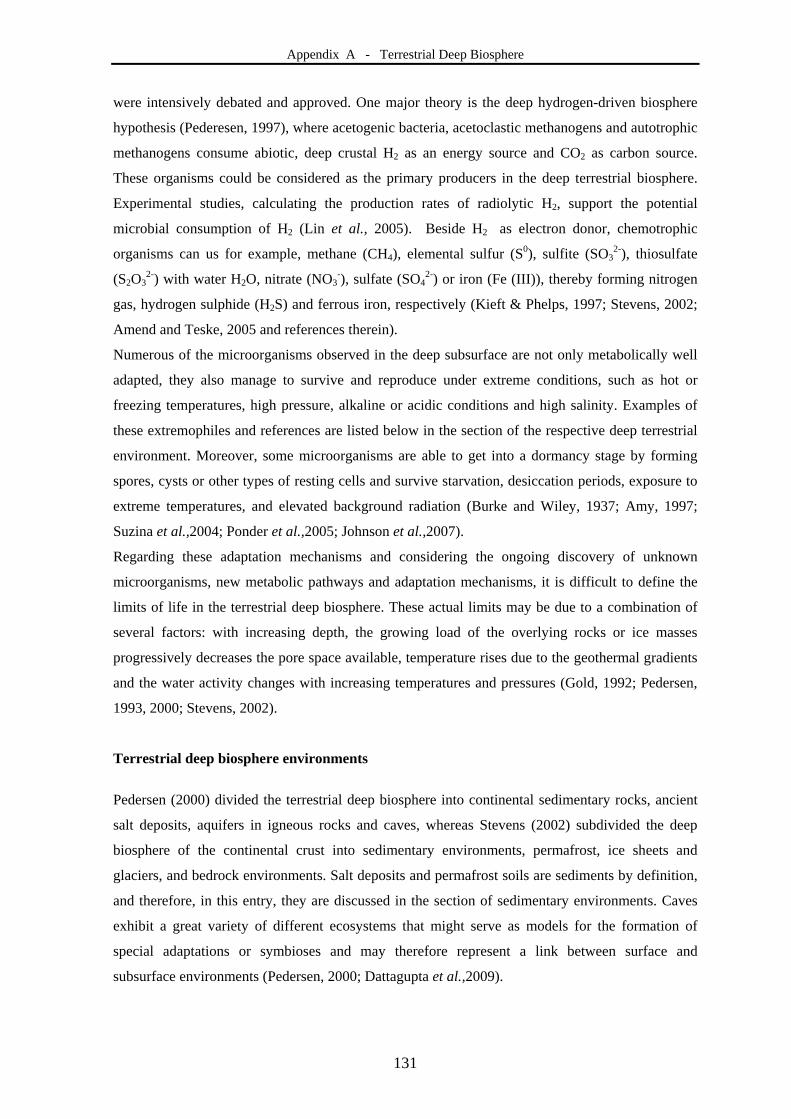
Appendix A - Terrestrial Deep Biosphere
131
were intensively debated and approved. One major theory is the deep hydrogen-driven biosphere
hypothesis (Pederesen, 1997), where acetogenic bacteria, acetoclastic methanogens and autotrophic
methanogens consume abiotic, deep crustal H2 as an energy source and CO2 as carbon source.
These organisms could be considered as the primary producers in the deep terrestrial biosphere.
Experimental studies, calculating the production rates of radiolytic H2, support the potential
microbial consumption of H2 (Lin et al., 2005). Beside H2 as electron donor, chemotrophic
organisms can us for example, methane (CH4), elemental sulfur (S0), sulfite (SO32-), thiosulfate
(S2O32-) with water H2O, nitrate (NO3
-), sulfate (SO42-) or iron (Fe (III)), thereby forming nitrogen
gas, hydrogen sulphide (H2S) and ferrous iron, respectively (Kieft & Phelps, 1997; Stevens, 2002;
Amend and Teske, 2005 and references therein).
Numerous of the microorganisms observed in the deep subsurface are not only metabolically well
adapted, they also manage to survive and reproduce under extreme conditions, such as hot or
freezing temperatures, high pressure, alkaline or acidic conditions and high salinity. Examples of
these extremophiles and references are listed below in the section of the respective deep terrestrial
environment. Moreover, some microorganisms are able to get into a dormancy stage by forming
spores, cysts or other types of resting cells and survive starvation, desiccation periods, exposure to
extreme temperatures, and elevated background radiation (Burke and Wiley, 1937; Amy, 1997;
Suzina et al.,2004; Ponder et al.,2005; Johnson et al.,2007).
Regarding these adaptation mechanisms and considering the ongoing discovery of unknown
microorganisms, new metabolic pathways and adaptation mechanisms, it is difficult to define the
limits of life in the terrestrial deep biosphere. These actual limits may be due to a combination of
several factors: with increasing depth, the growing load of the overlying rocks or ice masses
progressively decreases the pore space available, temperature rises due to the geothermal gradients
and the water activity changes with increasing temperatures and pressures (Gold, 1992; Pedersen,
1993, 2000; Stevens, 2002).
Terrestrial deep biosphere environments
Pedersen (2000) divided the terrestrial deep biosphere into continental sedimentary rocks, ancient
salt deposits, aquifers in igneous rocks and caves, whereas Stevens (2002) subdivided the deep
biosphere of the continental crust into sedimentary environments, permafrost, ice sheets and
glaciers, and bedrock environments. Salt deposits and permafrost soils are sediments by definition,
and therefore, in this entry, they are discussed in the section of sedimentary environments. Caves
exhibit a great variety of different ecosystems that might serve as models for the formation of
special adaptations or symbioses and may therefore represent a link between surface and
subsurface environments (Pedersen, 2000; Dattagupta et al.,2009).
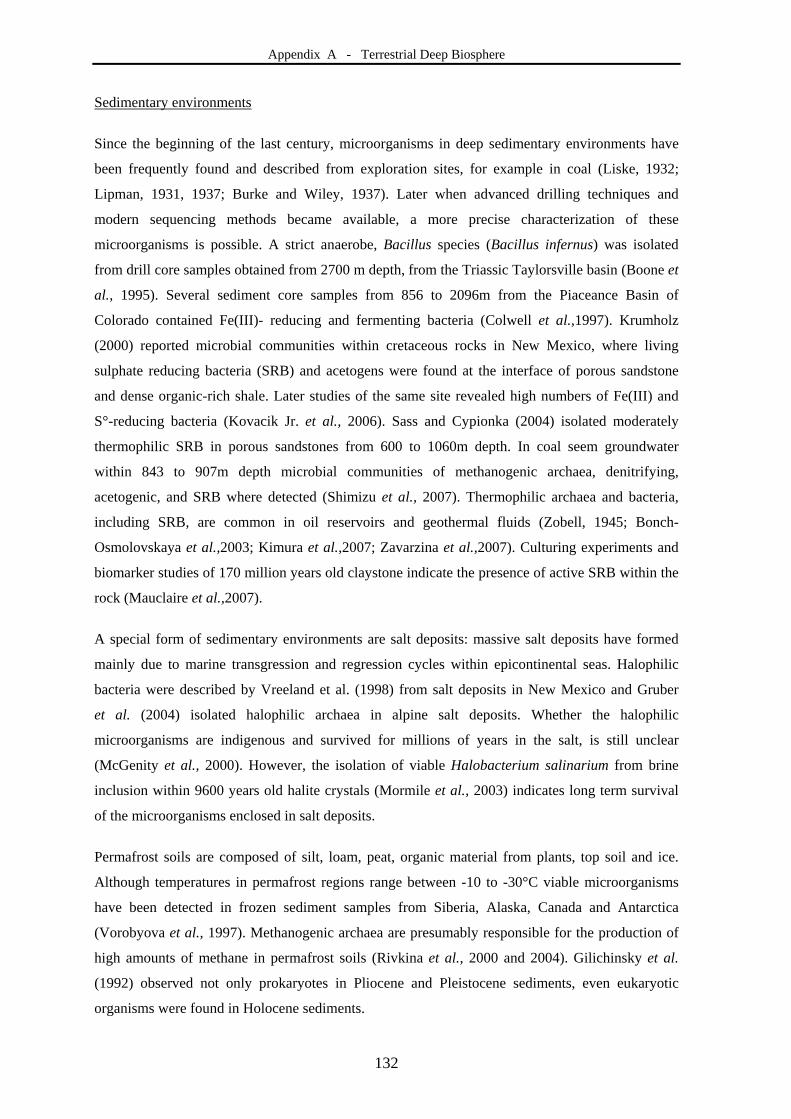
Appendix A - Terrestrial Deep Biosphere
132
Sedimentary environments
Since the beginning of the last century, microorganisms in deep sedimentary environments have
been frequently found and described from exploration sites, for example in coal (Liske, 1932;
Lipman, 1931, 1937; Burke and Wiley, 1937). Later when advanced drilling techniques and
modern sequencing methods became available, a more precise characterization of these
microorganisms is possible. A strict anaerobe, Bacillus species (Bacillus infernus) was isolated
from drill core samples obtained from 2700 m depth, from the Triassic Taylorsville basin (Boone et
al., 1995). Several sediment core samples from 856 to 2096m from the Piaceance Basin of
Colorado contained Fe(III)- reducing and fermenting bacteria (Colwell et al.,1997). Krumholz
(2000) reported microbial communities within cretaceous rocks in New Mexico, where living
sulphate reducing bacteria (SRB) and acetogens were found at the interface of porous sandstone
and dense organic-rich shale. Later studies of the same site revealed high numbers of Fe(III) and
S°-reducing bacteria (Kovacik Jr. et al., 2006). Sass and Cypionka (2004) isolated moderately
thermophilic SRB in porous sandstones from 600 to 1060m depth. In coal seem groundwater
within 843 to 907m depth microbial communities of methanogenic archaea, denitrifying,
acetogenic, and SRB where detected (Shimizu et al., 2007). Thermophilic archaea and bacteria,
including SRB, are common in oil reservoirs and geothermal fluids (Zobell, 1945; Bonch-
Osmolovskaya et al.,2003; Kimura et al.,2007; Zavarzina et al.,2007). Culturing experiments and
biomarker studies of 170 million years old claystone indicate the presence of active SRB within the
rock (Mauclaire et al.,2007).
A special form of sedimentary environments are salt deposits: massive salt deposits have formed
mainly due to marine transgression and regression cycles within epicontinental seas. Halophilic
bacteria were described by Vreeland et al. (1998) from salt deposits in New Mexico and Gruber
et al. (2004) isolated halophilic archaea in alpine salt deposits. Whether the halophilic
microorganisms are indigenous and survived for millions of years in the salt, is still unclear
(McGenity et al., 2000). However, the isolation of viable Halobacterium salinarium from brine
inclusion within 9600 years old halite crystals (Mormile et al., 2003) indicates long term survival
of the microorganisms enclosed in salt deposits.
Permafrost soils are composed of silt, loam, peat, organic material from plants, top soil and ice.
Although temperatures in permafrost regions range between -10 to -30°C viable microorganisms
have been detected in frozen sediment samples from Siberia, Alaska, Canada and Antarctica
(Vorobyova et al., 1997). Methanogenic archaea are presumably responsible for the production of
high amounts of methane in permafrost soils (Rivkina et al., 2000 and 2004). Gilichinsky et al.
(1992) observed not only prokaryotes in Pliocene and Pleistocene sediments, even eukaryotic
organisms were found in Holocene sediments.
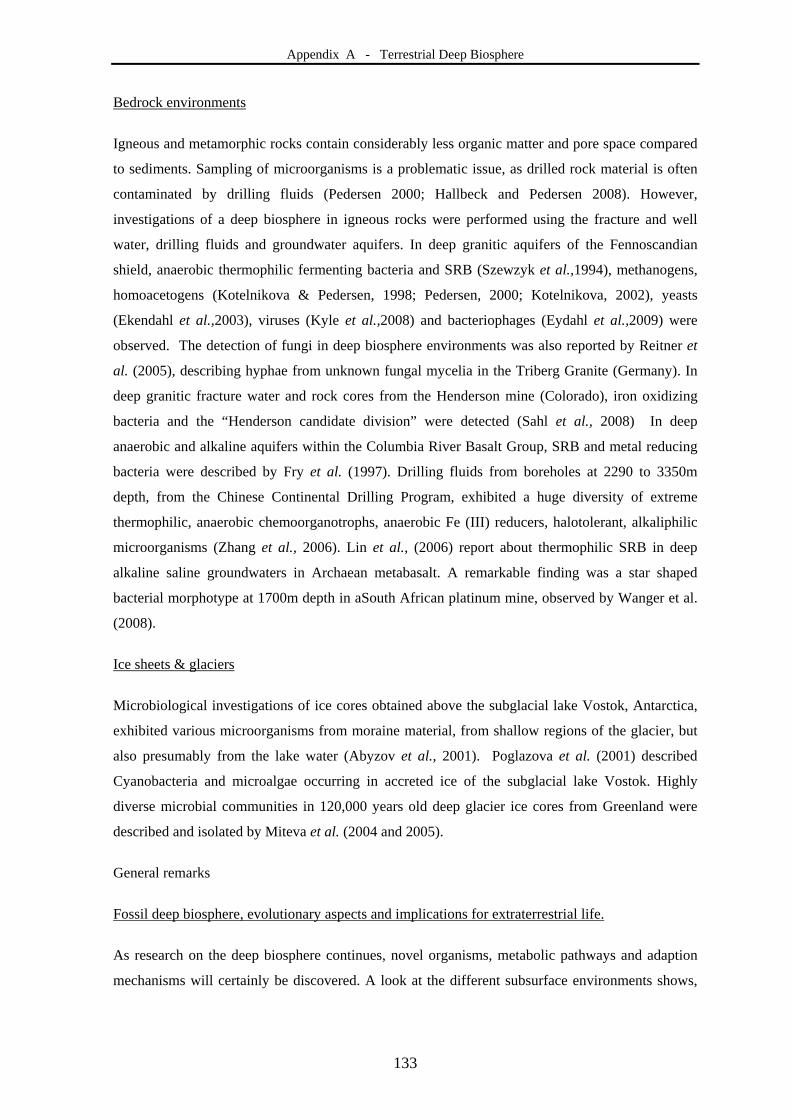
Appendix A - Terrestrial Deep Biosphere
133
Bedrock environments
Igneous and metamorphic rocks contain considerably less organic matter and pore space compared
to sediments. Sampling of microorganisms is a problematic issue, as drilled rock material is often
contaminated by drilling fluids (Pedersen 2000; Hallbeck and Pedersen 2008). However,
investigations of a deep biosphere in igneous rocks were performed using the fracture and well
water, drilling fluids and groundwater aquifers. In deep granitic aquifers of the Fennoscandian
shield, anaerobic thermophilic fermenting bacteria and SRB (Szewzyk et al.,1994), methanogens,
homoacetogens (Kotelnikova & Pedersen, 1998; Pedersen, 2000; Kotelnikova, 2002), yeasts
(Ekendahl et al.,2003), viruses (Kyle et al.,2008) and bacteriophages (Eydahl et al.,2009) were
observed. The detection of fungi in deep biosphere environments was also reported by Reitner et
al. (2005), describing hyphae from unknown fungal mycelia in the Triberg Granite (Germany). In
deep granitic fracture water and rock cores from the Henderson mine (Colorado), iron oxidizing
bacteria and the “Henderson candidate division” were detected (Sahl et al., 2008) In deep
anaerobic and alkaline aquifers within the Columbia River Basalt Group, SRB and metal reducing
bacteria were described by Fry et al. (1997). Drilling fluids from boreholes at 2290 to 3350m
depth, from the Chinese Continental Drilling Program, exhibited a huge diversity of extreme
thermophilic, anaerobic chemoorganotrophs, anaerobic Fe (III) reducers, halotolerant, alkaliphilic
microorganisms (Zhang et al., 2006). Lin et al., (2006) report about thermophilic SRB in deep
alkaline saline groundwaters in Archaean metabasalt. A remarkable finding was a star shaped
bacterial morphotype at 1700m depth in aSouth African platinum mine, observed by Wanger et al.
(2008).
Ice sheets & glaciers
Microbiological investigations of ice cores obtained above the subglacial lake Vostok, Antarctica,
exhibited various microorganisms from moraine material, from shallow regions of the glacier, but
also presumably from the lake water (Abyzov et al., 2001). Poglazova et al. (2001) described
Cyanobacteria and microalgae occurring in accreted ice of the subglacial lake Vostok. Highly
diverse microbial communities in 120,000 years old deep glacier ice cores from Greenland were
described and isolated by Miteva et al. (2004 and 2005).
General remarks
Fossil deep biosphere, evolutionary aspects and implications for extraterrestrial life.
As research on the deep biosphere continues, novel organisms, metabolic pathways and adaption
mechanisms will certainly be discovered. A look at the different subsurface environments shows,
Appendix A - Terrestrial Deep Biosphere
134
that a generalisation of the microbial diversity and adaption mechanisms is rather impossible, as
they all host their own specialized ecosystems.
Learning more about life in deep subterranean environments, may help to understand how life
might have evolved and survived during meteoric impacts, increased rates of volcanic activity or a
potential global glaciation (Snowball earth). In fact, geothermal waters, H2 and CH4 degassing
volcanic or plutonic rocks may have served as local nutrient and energy sources for chemotrophic
ecosystems (Dobretsov et al., 2006). Models about the habitability of the Hadean earth indicate,
that even the late heavy meteoric bombardment, around 3.9 Ga would not have been able to
sterilize the primeval biosphere of the earth crust, considering the existence of a near and
subsurface biosphere (Abramov and Mojzis, 2009).
Traces of a fossil subterraneous biosphere were observed in metasedimentary rocks from Timmins
(Canada) from the late Archaean (Ventura et al., 2007) and Bons et al.,(2009) report about
fossilized microbes within 585 Ma old calcite veins from Oppaminda Creek (Australia).
Increased interest for research in deep terrestrial, means also extreme environments, is its
implication for extraterrestrial life. A better understanding of the earth’s deep biosphere allows the
development of models to understand general biogeochemical processes not only for our earth but
maybe for biogeochemical processes on other planets. For example, permafrost soils on Mars may
comprise recent or ancient life (Gilichinsky et al.,1992; Rivkina et al., 2000 and 2004) or Jupiter’s
satellites may have ice-covered lakes similar to lake Vostok (Abyzov et al.,2001) serving as a
potential deep biosphere environments.
Appendix A - Terrestrial Deep Biosphere
135
References
Abramov O, Mojzis S (2009) Microbial habitability of the Hadean earth during late heavy bombardment.
Nature, 459, 419-422.
Abyzov SS, Mitskevich I N, Poglazova MN, Barkov NI, Lipenkov VY, Bobin NE, Koudryashov BB,
Pashkevich VM, Ivanov MV (2001) Microflora in the basal strata at anatarctic ice core above the
vostok lake. Advances in Space Research, 28, 701-706.
Amend JP, Teske A (2005) Expanding frontiers in deep subsurface microbiology. Palaeogeography,
Palaeoclimatology, Palaeoecology, 219, 131-155.
Amy PS (1997) Microbial dormacy and survival in the subsurface. In Amy P, Haldeman D,(eds) The
microbiology of the terrestrial subsurface. CRC Press, 185-203.
Bailey NJL, Jobson AM, Rogers MA (1973) Bacterial degradation of crude oil: Comparaison of field and
experimental data. Chemical Geology, 11, 203-221.
Belyaev SS, Wolkin R, Kenealy M, DeNiro MJ, Epstein S, Zeikus JG (1983) Methanogenic bacteria from the
bondyushskoe oil field: General characterization and analysis of stable-carbon isotopic
fractionation. Applied environmental microbiology, 45, 691-697.
Boivin-Jahns V, Ruimy R, Bianchi A, Daumas S, Christen R (1996) Bacterial diversity in a deep-subsurface
clay environment. Applied and Environmental Microbiology, 62, 3405-3412.
Bonch-Osmolovskaya EA, Miroshnichenko ML, Lebedinsky AV, Chernyh NA, Nazina TN, Ivoilov VS,
Belyaev SS (2003) Radioisotopic, culture-based, and oligonucleotide microchip analyses of
thermophilic microbial communities in a continental high-temperature petroleum reservoir. Applied
and Environmental Microbiology, 69, 6143-6151.
Bons PD, Montenari M, Bakker RJ, Elburg M (2009) Potential evidence of fossilised Neoproterozoic deep
life : SEM observations on calcite veins from Oppaminda Creek, Arkoola, South Australia.
International Journal of Erth Sciences, 98, 327-343.
Boone DR, Liu Y, Zhao Z-J, Balkwill DL, Drake GR, Stevens TO, Aldrich HC (1995) Bacillus infernus sp.
nov., an Fe(III)- and Mn(IV)-reducing anaerobe from the deep terrestrial subsurface. International
Journal of Systematic Bacteriology, 45, 441-448.
Burke V, Wiley AJ (1937) Bacteria in Coal. Journal of Bacteriology, 34, 475-481.
Chapelle, F. H., 2000. Ground-water Microbiology and Geochemistry. Wiley-VCH, 496 pages.
Christofi N, Philip JC (1997) European Microbiology related to the subsurface disposal of nuclear waste. In:
Amy P, Haldeman D (eds) The microbiology of the terrestrial subsurface. CRC Press, 267-297.
Cockell CS (2004) Impact-shocked rocks – insights into archean and extraterrestrial habitats (and sites for
prebiotic chemistry?). Advances in Space Research, 33, 1231-1235.
Colwell F, Matsumoto R, Reed D (2004) A review of the gas hydrates, geology, and biology of the Nankai
Trough. Chemical Geology, 205, 391-404.
Colwell FS, Onstott TC, Delwiche ME, Chandler D, Fredrickson JK, Yao Q-J, McKinley JP, Boone DR,
Griffiths R, Phelps TJ, Ringelberg D, White DC, LaFreniere L, Balkwill D, Lehman RM, Konisky J,
Long PE (1997) Microorganisms from deep high temperature sand stones: constrains on microbial
coloization. FEMS Microbiology Reviews, 20, 425-435.
Appendix A - Terrestrial Deep Biosphere
136
Dattagubta S, Schaperdoth I, Monanary A, Mariani S, Kita N, Valley JW, Macalady JL (2009) A novel
symbiosis between chemoautotrophic bacteria and a freshwater cave amphipod. The ISME Journal,
3, 935-943.
Dobretsov NL, Kolchanov NA, Suslov VV (2006) On the early stages of the evolution of the geosphere and
biosphere. Paleontological Journal, 40, 407-424.
Ekendahl S, O’Neill AH, Thomson E, Pedersen K (2003) Characterisation of yeasts isolated from deep
igneous rock aquifers of the Fennoscandian shield. Microbial Ecology, 46, 416-428.
Eydal HSC, Jägevall S, Hermansson M, Pedersen K (2009) Bacteriophage lytic to Desulfovibrio aespoeensis
isolated from deep groundwater. The ISME Journal, 3, 1139-1147.
Faison BD (2003) Microbial contributions to the Search for extraterrestrial life. Advances in Applied
Microbiology, 52, 397-432
Farrell MA, Turner H G (1932) Bacteria in anthracite coal. Journal of Bacteriology, 23, 155-162.
Fry NK, Fredrickson JK, Fishbain S, Wagner M, Stahl D (1997) Population structure of microbial
communities associated with two deep, anaerobic, alkaline aquifers. Applied and Environmental
Microbiology, 63, 1498-1504.
Gilichinsky DA, Vorobyova EA, Erokhina LG, Fyordorov-Dayvdov DG, Chaikovykaya NR (1992) Long-
term preservation of microbial ecosystems in permafrost. Advances in Space Research, 12, 4255-
4263.
Ginsburg-Karagitscheva TL (1933) Microflora of Oil Waters and Oil-Bearing Formations and Biochemical
Processes Caused by It. Bulletin of the American Association of Petroleum Geologists, 17, 52-65.
Griffin WT, Phelps TJ, Colwell FS, Fredrickson JK (1997) Methods for obtaining deep subsurface
microbiological samples. In Amy P, Haldeman D (eds) The microbiology of the terrestrial
subsurface. CRC Press, 23-44.
Gruber C, Legat A, Pfaffenhuemer M, Radax C, Weidler G, Busse H-J, Stan-Lotter H (2004) Halobacterium
noricense sp. nov., an archaeal isolate from a bore core of an alpine Permian salt deposit,
classification of Halobacterium sp. NRC-1 as a strain of H. salinarium and emended description of
H. salinarium. Extremophiles, 8, 431-439.
Gold T (1992) The deep hot biosphere. Proceedings of the National academy of Sciences, USA; 89,
6045-6049
Haldemann DL (1997) The storage related phenomenon: Implications for handling and analysis of subsurface
samples by drilling. In Amy P, Haldeman D (eds) The microbiology of the terrestrial subsurface.
CRC Press, 61-74.
Hallbeck L, Pedersen K (2008) Characterization of microbial processes in deep aquifers of the
Fennoscandian Shield. Applied Geochemistry, 23, 1796-1819.
Hersman LE (1997) Subsurface Microbiology: Effects on the transport of radioactive waste in the Vadose
Zone. In Amy P, Haldeman D (eds) The microbiology of the terrestrial subsurface. CRC Press, 299-
323.
Issatchenko V (1940) On the microorganisms of the lower limits of the biosphere. Journal of Bacteriology,
40, 379-381.
Appendix A - Terrestrial Deep Biosphere
137
Johnson SS, Hebsgaard MB, Christensen TR, Mastepanov M, Nielsen R, Munch K, Brand T, Gilbert P,
Zuber MT, Bunce M, Rønn R, Gilichinsky D, Froese D, Willerslev E (2007) PNAS, 104, 14401-
14405.
Kieft TL, Phelps TJ (1997) Life in the slow lane: activities of microorganisms in the subsurface. In Amy P,
Haldeman D (eds) The microbiology of the terrestrial subsurface. CRC Press, 137-163.
Kimura H, Ishibashi J-I, Masuda H, Kato K, Hanada S (20079 Selective phylogenetic analysis targeting 16S
rRNA genes of hyperthermophilic archaea in the deep-subsurface hot biosphere. Applied and
Environmental Microbiology, 73, 2110-2117.
Kotelnikova S (2002) Microbial production and oxidation of methane in deep subsurface. Earth-Science
Reviews, 58, 367-395.
Kotelnikova S, Macario AJL, Pedersen K (1998) Methanobacterium subterraneum sp. nov., a new
alkaliphilic, eurythermic and halotolerant methanogen isolated from deep granitic groundwater.
International Journal of Systematic Bacteriology, 48, 357–367.
Kotelnikova S, Pedersen K (1998) Distribution and activity of methanogenes and homacetogenes on deep
granitic aquifers at Äspö Hard Rock Laboratory, Sweden. FEMS Microbiology Ecology, 26, 121-
134.
Kovacik Jr WP, Takai K, Mormile MR, McKinley JP, Brockman FJ, Fredrickson JK, Holben W (2006)
Loecluar analysis of deep subsurface Cretaceous rock indicates abundant Fe(III)- and S°-reducing
bacteria in a sulfate-rich environment. Environmental Microbiology, 8, 141-155.
Krumholz LR (2000) Microbial communities in the deep subsurface. Hydrogeology Journal, 8, 4-10.
Kyle JE, Eydal HSC, Ferris FG, Pedersen K (2008) Viruses in granitic groundwater from 69 to 450 m depth
of the Äspö Hard Rock Laboratory, Sweden. The ISME Journal, 2, 571-574.
Lehman RM, Colwell FS, Ringelberg DB, White DC (1995) Combined microbial community-level analysis
for quality assurance of terrestrial subsurface cores. Journal of Microbiological Methods, 22, 263-
281.
Lieske R (1932) Über das Vorkommen von Bakterien in Kohlenflözen. Biochemische Zeitschrift, 250, 339-
351.
Lin L-H, Wang P-L, Rumble D, Lippmann-Pipke J, Boice E, Pratt LM, Lollar BS, Brodie EL, Hazen TC,
Andersen GL, DeSantis T Z, Moser DP, Kershaw D, Onstott TC (2006) Long-Term sustainability
of a high-energy, low-diversity crustal biome. Science, 314, 479-482.
Lin L-H, Slater GF, Lollar BS, Lacrampe-Couloume G, Onstott TC (2005) The yield and isotopic
composition of radiolytic H2, a potential energy source for the deep subsurface biosphere.
Geochimica et Cosmochimica Acta, 69, 893–903.
Lipman CB (1931) Living microorganisms in ancient rocks. Journal of Bacteriology, 22, 183-198.
Lipman CB (1937) Bacteria in Coal. Journal of Bacteriology, 34, 483-488.
Lollar BS, Lacrampe-Couloume G, Slater GF, Ward J, Moser DP, Gihring TM, Lin L-H, Onstott TC (2006)
Unravelling abiogenic and biogenic sources of methane in the earth’s deep subsurface. Chemical
Geology, 226, 328-339.
Appendix A - Terrestrial Deep Biosphere
138
Mauclaire L, McKenzie JA, Schwyn B, Bossart P (2007) Detection and cultivation of indigenous
microorganisms in Mesozoic claystone core sample from the Opalinus Clay Formation (Mont Terri
Rock Laboratory). Physics and Chemistry of the Earth, 32, 232-240.
McGenity TJ, Gemmell RT, Grant WD, Stan-Lotter H (2000) Origins of halophilic microorganisms in
ancient salt deposits. Environmental Microbiology, 2, 243-250.
Miteva VI, Brenchley JE (2005) Detection and isolation of ultra small microorganisms from a 120,000 year-
old Greenland glacier ice core. Applied and Environmental Microbiology, 71, 7806-7818.
Miteva VI, Sheridan PP, Brenchley JE (2004) Phylogenetic and physiological diversity of microorganism
from a deep Greenland glacier ice core. Applied and Environmental Microbiology, 70, 202-213.
Mormile MR, Biesen MA, Gutierrez MC, Ventosa A, Pavlovich JB, Onstott TC, Fredrickson JK (2003)
Isolation of Halobacterium salinarium retrieved directly from halite brine inclusions. Environmental
Microbiology, 5, 1094-1102.
Moser H, Wolf M, Fritz P, Fontes J-C, Florkowski T, Payne BR (1988) Deuterium, oxygen-18, and tritium in
Stripa groundwater. Geochimica et Cosmochimica Acta, 53, 1757-1763.
Pedersen K, Arlinger J, Hallbeck A, Hallbeck L, Eriksson S, Johansson J (2008) Numbers, biomass and
cultivable diversity of microbial populations relate to depth and borehole-specific conditions in
groundwater from depths of 4 to 450 m in Olkiluoto, Finland. The ISME Journal, 2, 760-775.
Pedersen K (2002) Microbial processes in the disposal of high level radioactive waste 500 m underground in
Fennoscandian shield rocks. In Keith-Roach MJ, Livens FR (eds). Interactions of microorganisms
with radionuclides. Elsevier, Amsterdam, 279-311.
Pedersen K (2001) Diversity and activity of microorganisms in deep igneous rock aquifers of the
Fennoscandian Shield. In Fredrickson JK, Fletcher M (eds), Subsurface microbiology and
biogeochemistry. Wiley-Liss Inc., New York: 97-139.
Pedersen K (2000) Exploration of deep intraterrestrial microbial life: current perspectives. FEMS,
Microbiology Letters, 185, 9-16.
Pedersen K (1997) Microbial life in deep granitic rock. FEMS Microbiology Reviews, 20, 399-414..
Pedersen K (1993) The deep subterranean biosphere. Earth-Science Reviews, 34, 243-260
Phelps TJ, Fliermans CB, Garland TR, Pfiffner SM, White DC (1989). Methods for recovery of deep
terrestrial subsurface sediments for microbiological studies. Journal of Microbiological Methods, 9,
267-279.
Poglazova MN, Mitskevich IN, Abyzov SS, Ivanov MV (2001) Microbiological characterization of the
accreted ice of subglacial Lake Vostok, Antarctica. Microbiology, 70, 723-730.
Ponder MA, Gilour SJ, Bergholz PW, Mindock CA, Hollongsworth R, Thomashow MF, Tiedje JM (2005)
Characterization of potential stress responses in ancient Siberian permafrost psychroactive bacteria.
FEMS Microbiology Ecology, 53, 103-115.
Reitner J, Schumann GA, Pedersen K (2005) Fungi in subterranean environments. In, Gadd GJ (ed), Fungi in
biogenchemical cycles. Cambridge University Press, Cambridge: 788-1002.
Rivkina EM, Friedmann, EI, McKay CP, Gilichinsky DA (2000) Metabolic activity of permafrost bacteria
below the freezing point. Applied and Environmental Microbiology, 66, 3230-3233.
Appendix A - Terrestrial Deep Biosphere
139
Rivkina E, Laurinavichius K, McGrath J, Tiedje J, Shcherbakova V, Gilichinsky D (2004) Microbial life in
permafrost. Advances in Space Research, 33, 1215-1221.
Russel CE (1997) The collection of subsurface samples by mining. In Amy P, Haldeman D (eds), The
microbiology of the terrestrial subsurface. CRC Press, 45-60.
Sahl JW, Schmidt R, Swanner ED, Mandernack KW, Templeton AS, Kieft TL, Smith RL, Sandford WE,
Callaghan RL, Mitton JB, Spear JR (2008) Subsurface Microbial Diversity in Deep-Granitic
Fracture Water in Colorado. Applied and Environmental Microbiology, 74, 143-152.
Sass H, Cypionka H (2004) Isolation of sulfate-reducing bacteria from the terrestrial deep subsurface and
description of Desulfovibrio cavernae sp. nov. Sytematic and Applied Microbiology, 27, 541-548.
Seiler K-P, Lindner W (1995) Near-surface and deep groundwaters. Journal of Hydrology, 165, 33-44.
Shimizu S, Akiyama M, Naganuma T, Fujioka M, Nako M, Ishijima Y (2007) Molecular characterization of
microbial communities in deep coal seam groundwater of northern Japan. Geobiology, 5, 423-433.
Simpkins WW, Bradbury KR (1992) Groundwater flow, velocity, and age in a thick, fine-grained till unit in
southeastern Wisconsin. Journal of Hydrogeology, 132, 283-319.
Szewzyk U, Szewzyk R, Stenström T-A (1994) Thermophilic, anaerobic bacteria isolated from a deep
borehole in granite, Sweden. Proceedings of the National Academy of Sciences, USA, 91, 1810-
1813.
Stevens TO (2002) The deep subsurface biosphere. In Staley JT, Reysenbach A-L (eds), Biodiversity of
microbial life. Foundation of the earth’s biosphere. Wiley-Liss, 552 pages.
Stevens TO (1997a) Subsurface microbiology and the evolution of the biosphere. In Amy P, Haldeman, D
(eds), The microbiology of the terrestrial subsurface. CRC Press, 203-221.
Stevens TO (1997b) Lithoautotrophy in the subsurface. FEMS Microbiology reviews, 20, 327-337.
Suzina NE, Mulyukin AL, Kozlova AN, Shorokova AP, Dmitriev VV, Barinova ES, Mokhova ON,
El’-Registan GI, Duda VI (2004) Ultrastructure of resting cells of some non-spore-forming bacteria.
Microbiology, 73, 516-529.
Ventura GT, Kenig F, Reddy CM, Schieber J, Frysinger G.S, Nelson RK, Dinel E, Gaines RB, Schaeffer P
(2007) Molecular evidence of late Archaean archaea and the presence of a subsurface hydrothermal
biosphere. PNAS, 104, 14260-14625.
Vorobyova E, Soina V, Gorlenko M, Minkovskaya N, Zalinova N, Mamukelashvih A, Gilichinsky D,
Rivkma E, Vishnivetskaya T (1997) The deep cold biosphere: facts and hypothesis. FEMS
Microbiology Reviews, 20, 277-290.
Vreeland RH, Piselli Jr AF, McDonnough S, Meyers SS (1998) Distribution and diversity of halophilic
bacteria in a subsurface salt formation. Extremophiles, 2, 321-331.
Wanger G, Onstott TC, Southam G (2008) Stars of the terrestrial deep subsurface: Anovel ‘star-shaped’
bacterial morphotype from a South African platinum mine. Geobiology, 6, 325-330.
Zavarzina D, Sokolova TG, Tourova TP, Chernyh NA, Kostrikina NA, Bonch-Osmolovskaya EA (2007)
Thermincola ferriacetica sp. Nov., a new anaerobic, thermophilic facultatively
chemilithoautotrophic bacterium capable of dissimilatory Fe(III) reduction. Extremophiles, 11, 1-7.
Zhang G, Dong H, Jiang H, Xu Z, Eberl DD (2006) Unique Microbial Community in Drilling Fluids from
Chinese Continental Scientific Drilling. Geomicrobiology Journal, 23,499–514.

Appendix A - Terrestrial Deep Biosphere
140
Zobell CE (1945) The role of bacteria in the formation and transdormation of petroleum hydrocarbons.
Science, 102, 364-369.
Appendix B - Microbial Biomineralization
141
B
MICROBIAL BIOMINERALIZATION
Christine Heim
Encyclopedia of Geobiology, Springer, 2011, in press
Synonyms
Microbial biomineral formation
Definition
Microbial biomineralization describes the formation and deposition of minerals directly mediated
or indirectly influenced by microorganisms (Mann, 2001; Weiner and Dove, 2003, Ehrlich, 1999).
A huge variety of minerals result from individual biomineralization pathways linked to the genetic
and metabolic activity of the microorganisms involved (Minsky, et al.,2002; Weiner and Dove
2003). Moreover, microbial biominerals may differ distinctly from their inorganically formed
equivalents in shape, size, crystallinity, isotopic and trace element composition (Weiner and Dove,
2003; Bazylinski et al.,2007; Haferburg and Kothe, 2007; Takahashi et al.,2007). A compilation of
microbial biominerals and their source organisms is given in Table 1.
Two principal modes of microbial biomineralization processes occur, namely biologically induced
mineralization (BIM) and biologically controlled mineralization (BCM, Lowenstam, 1981;
Lowenstam and Weiner, 1989). These modes are introduced in the following.
Biologically induced mineralization (BIM):
In BIM, the nucleation and growth of biominerals are extracellular processes triggered by the
metabolic activity of the microorganism. Biomineralization takes place due to changes in the
chemical equilibrium of the surrounding environment and may also be linked to particular
metabolic products. The resulting biominerals typically show a poor crystallinity, are chemically
heterogeneous, and often closely associated with the cell wall (Frankel and Bazylinsky, 2003). An
active and a passive mineralization process can be distinguished (Fortin and Beveridge, 2000;
Southam, 2000). Active mineralization refers to mineralization by (i) direct redox conversion of
specific metal ions bound to the bacterial surface, or (ii) by the excretion of metabolically produced
ions and thereby forming minerals. The term passive mineralization is used, when nonspecific
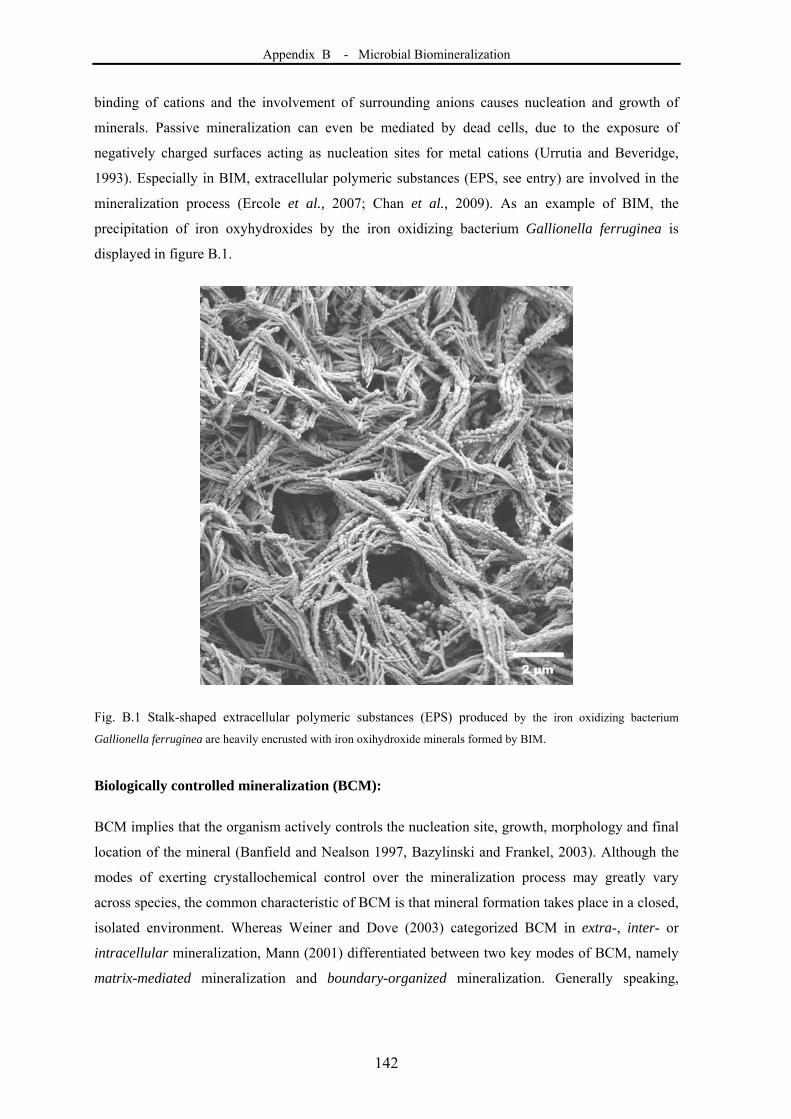
Appendix B - Microbial Biomineralization
142
binding of cations and the involvement of surrounding anions causes nucleation and growth of
minerals. Passive mineralization can even be mediated by dead cells, due to the exposure of
negatively charged surfaces acting as nucleation sites for metal cations (Urrutia and Beveridge,
1993). Especially in BIM, extracellular polymeric substances (EPS, see entry) are involved in the
mineralization process (Ercole et al., 2007; Chan et al., 2009). As an example of BIM, the
precipitation of iron oxyhydroxides by the iron oxidizing bacterium Gallionella ferruginea is
displayed in figure B.1.
Fig. B.1 Stalk-shaped extracellular polymeric substances (EPS) produced by the iron oxidizing bacterium
Gallionella ferruginea are heavily encrusted with iron oxihydroxide minerals formed by BIM.
Biologically controlled mineralization (BCM):
BCM implies that the organism actively controls the nucleation site, growth, morphology and final
location of the mineral (Banfield and Nealson 1997, Bazylinski and Frankel, 2003). Although the
modes of exerting crystallochemical control over the mineralization process may greatly vary
across species, the common characteristic of BCM is that mineral formation takes place in a closed,
isolated environment. Whereas Weiner and Dove (2003) categorized BCM in extra-, inter- or
intracellular mineralization, Mann (2001) differentiated between two key modes of BCM, namely
matrix-mediated mineralization and boundary-organized mineralization. Generally speaking,
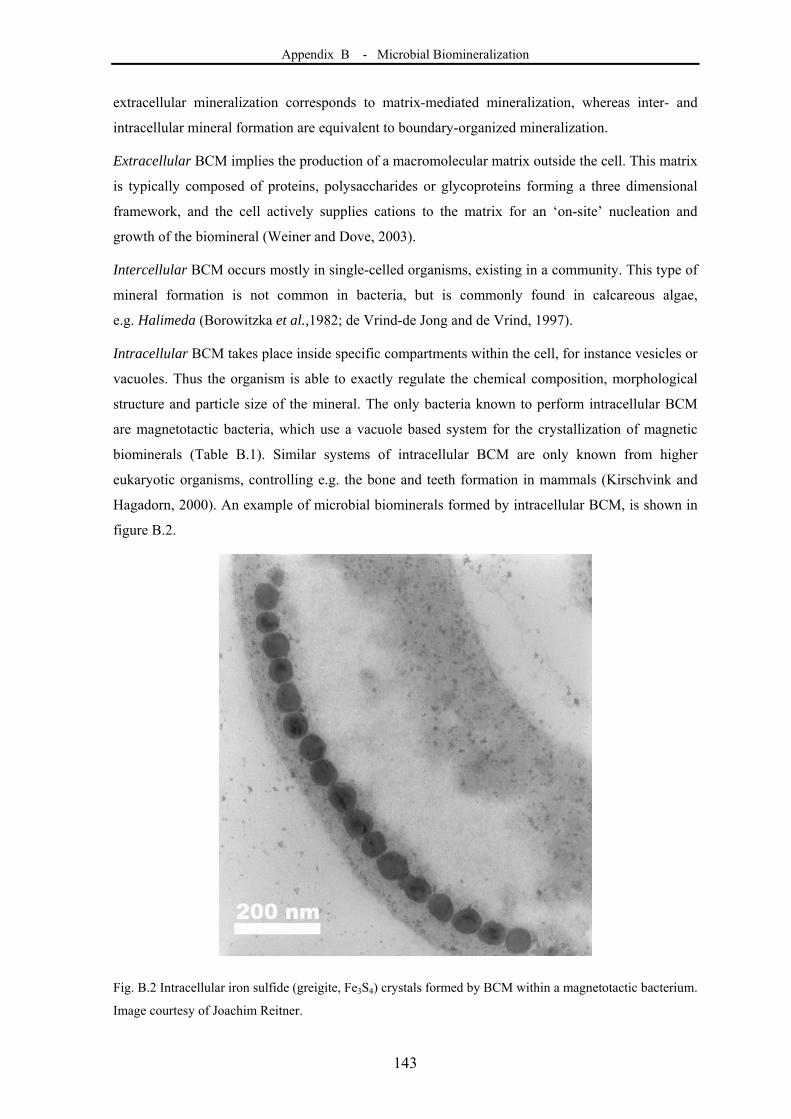
Appendix B - Microbial Biomineralization
143
extracellular mineralization corresponds to matrix-mediated mineralization, whereas inter- and
intracellular mineral formation are equivalent to boundary-organized mineralization.
Extracellular BCM implies the production of a macromolecular matrix outside the cell. This matrix
is typically composed of proteins, polysaccharides or glycoproteins forming a three dimensional
framework, and the cell actively supplies cations to the matrix for an ‘on-site’ nucleation and
growth of the biomineral (Weiner and Dove, 2003).
Intercellular BCM occurs mostly in single-celled organisms, existing in a community. This type of
mineral formation is not common in bacteria, but is commonly found in calcareous algae,
e.g. Halimeda (Borowitzka et al.,1982; de Vrind-de Jong and de Vrind, 1997).
Intracellular BCM takes place inside specific compartments within the cell, for instance vesicles or
vacuoles. Thus the organism is able to exactly regulate the chemical composition, morphological
structure and particle size of the mineral. The only bacteria known to perform intracellular BCM
are magnetotactic bacteria, which use a vacuole based system for the crystallization of magnetic
biominerals (Table B.1). Similar systems of intracellular BCM are only known from higher
eukaryotic organisms, controlling e.g. the bone and teeth formation in mammals (Kirschvink and
Hagadorn, 2000). An example of microbial biominerals formed by intracellular BCM, is shown in
figure B.2.
Fig. B.2 Intracellular iron sulfide (greigite, Fe3S4) crystals formed by BCM within a magnetotactic bacterium.
Image courtesy of Joachim Reitner.
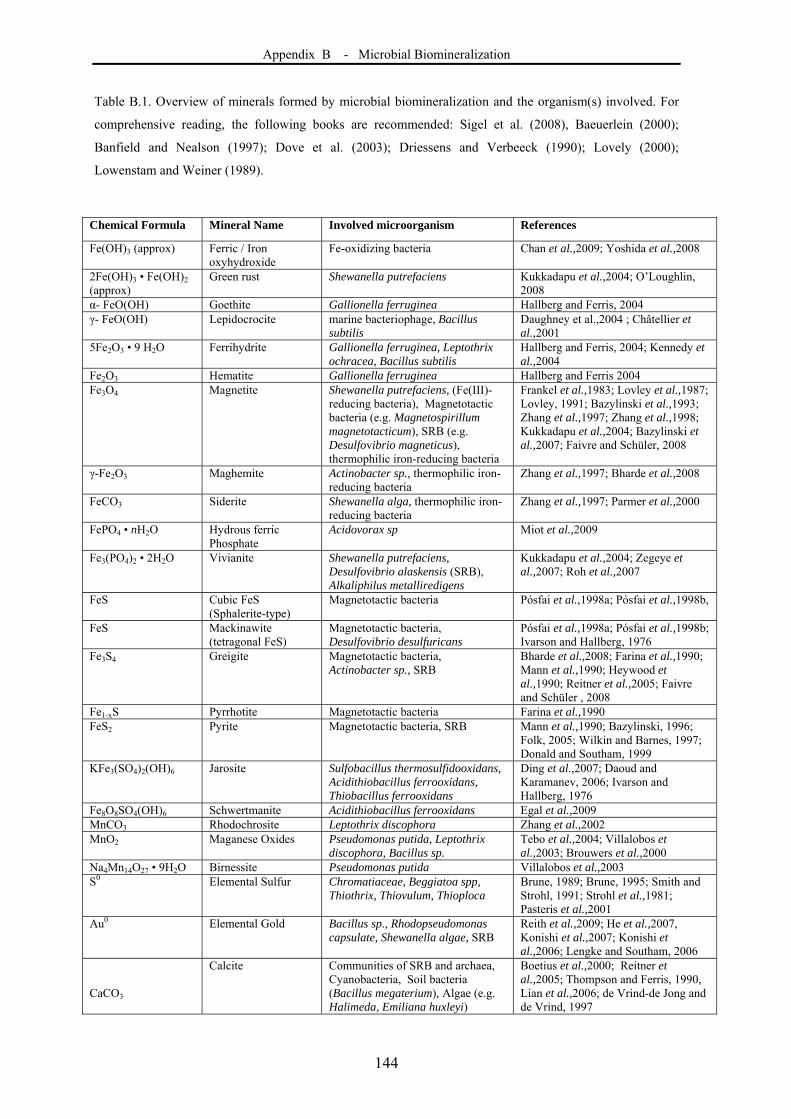
Appendix B - Microbial Biomineralization
144
Table B.1. Overview of minerals formed by microbial biomineralization and the organism(s) involved. For
comprehensive reading, the following books are recommended: Sigel et al. (2008), Baeuerlein (2000);
Banfield and Nealson (1997); Dove et al. (2003); Driessens and Verbeeck (1990); Lovely (2000);
Lowenstam and Weiner (1989).
Chemical Formula Mineral Name Involved microorganism References
Fe(OH)3 (approx) Ferric / Iron oxyhydroxide
Fe-oxidizing bacteria Chan et al.,2009; Yoshida et al.,2008
2Fe(OH)3 • Fe(OH)2 (approx)
Green rust Shewanella putrefaciens Kukkadapu et al.,2004; O’Loughlin, 2008
α- FeO(OH) Goethite Gallionella ferruginea Hallberg and Ferris, 2004 γ- FeO(OH) Lepidocrocite marine bacteriophage, Bacillus
subtilis Daughney et al.,2004 ; Châtellier et al.,2001
5Fe2O3 • 9 H2O Ferrihydrite Gallionella ferruginea, Leptothrix ochracea, Bacillus subtilis
Hallberg and Ferris, 2004; Kennedy et al.,2004
Fe2O3 Hematite Gallionella ferruginea Hallberg and Ferris 2004 Fe3O4 Magnetite Shewanella putrefaciens, (Fe(III)-
reducing bacteria), Magnetotactic bacteria (e.g. Magnetospirillum magnetotacticum), SRB (e.g. Desulfovibrio magneticus), thermophilic iron-reducing bacteria
Frankel et al.,1983; Lovley et al.,1987; Lovley, 1991; Bazylinski et al.,1993; Zhang et al.,1997; Zhang et al.,1998; Kukkadapu et al.,2004; Bazylinski et al.,2007; Faivre and Schüler, 2008
γ-Fe2O3 Maghemite Actinobacter sp., thermophilic iron-reducing bacteria
Zhang et al.,1997; Bharde et al.,2008
FeCO3 Siderite Shewanella alga, thermophilic iron-reducing bacteria
Zhang et al.,1997; Parmer et al.,2000
FePO4 • nH2O Hydrous ferric Phosphate
Acidovorax sp Miot et al.,2009
Fe3(PO4)2 • 2H2O Vivianite Shewanella putrefaciens, Desulfovibrio alaskensis (SRB), Alkaliphilus metalliredigens
Kukkadapu et al.,2004; Zegeye et al.,2007; Roh et al.,2007
FeS Cubic FeS (Sphalerite-type)
Magnetotactic bacteria Pósfai et al.,1998a; Pósfai et al.,1998b,
FeS Mackinawite (tetragonal FeS)
Magnetotactic bacteria, Desulfovibrio desulfuricans
Pósfai et al.,1998a; Pósfai et al.,1998b; Ivarson and Hallberg, 1976
Fe3S4 Greigite Magnetotactic bacteria, Actinobacter sp., SRB
Bharde et al.,2008; Farina et al.,1990; Mann et al.,1990; Heywood et al.,1990; Reitner et al.,2005; Faivre and Schüler , 2008
Fe1-xS Pyrrhotite Magnetotactic bacteria Farina et al.,1990 FeS2 Pyrite Magnetotactic bacteria, SRB Mann et al.,1990; Bazylinski, 1996;
Folk, 2005; Wilkin and Barnes, 1997; Donald and Southam, 1999
KFe3(SO4)2(OH)6 Jarosite Sulfobacillus thermosulfidooxidans, Acidithiobacillus ferrooxidans, Thiobacillus ferrooxidans
Ding et al.,2007; Daoud and Karamanev, 2006; Ivarson and Hallberg, 1976
Fe8O8SO4(OH)6 Schwertmanite Acidithiobacillus ferrooxidans Egal et al.,2009 MnCO3 Rhodochrosite Leptothrix discophora Zhang et al.,2002 MnO2 Maganese Oxides Pseudomonas putida, Leptothrix
discophora, Bacillus sp. Tebo et al.,2004; Villalobos et al.,2003; Brouwers et al.,2000
Na4Mn14O27 • 9H2O Birnessite Pseudomonas putida Villalobos et al.,2003 S0 Elemental Sulfur Chromatiaceae, Beggiatoa spp,
Thiothrix, Thiovulum, Thioploca Brune, 1989; Brune, 1995; Smith and Strohl, 1991; Strohl et al.,1981; Pasteris et al.,2001
Au0 Elemental Gold Bacillus sp., Rhodopseudomonas capsulate, Shewanella algae, SRB
Reith et al.,2009; He et al.,2007, Konishi et al.,2007; Konishi et al.,2006; Lengke and Southam, 2006
CaCO3
Calcite Communities of SRB and archaea, Cyanobacteria, Soil bacteria (Bacillus megaterium), Algae (e.g. Halimeda, Emiliana huxleyi)
Boetius et al.,2000; Reitner et al.,2005; Thompson and Ferris, 1990, Lian et al.,2006; de Vrind-de Jong and de Vrind, 1997
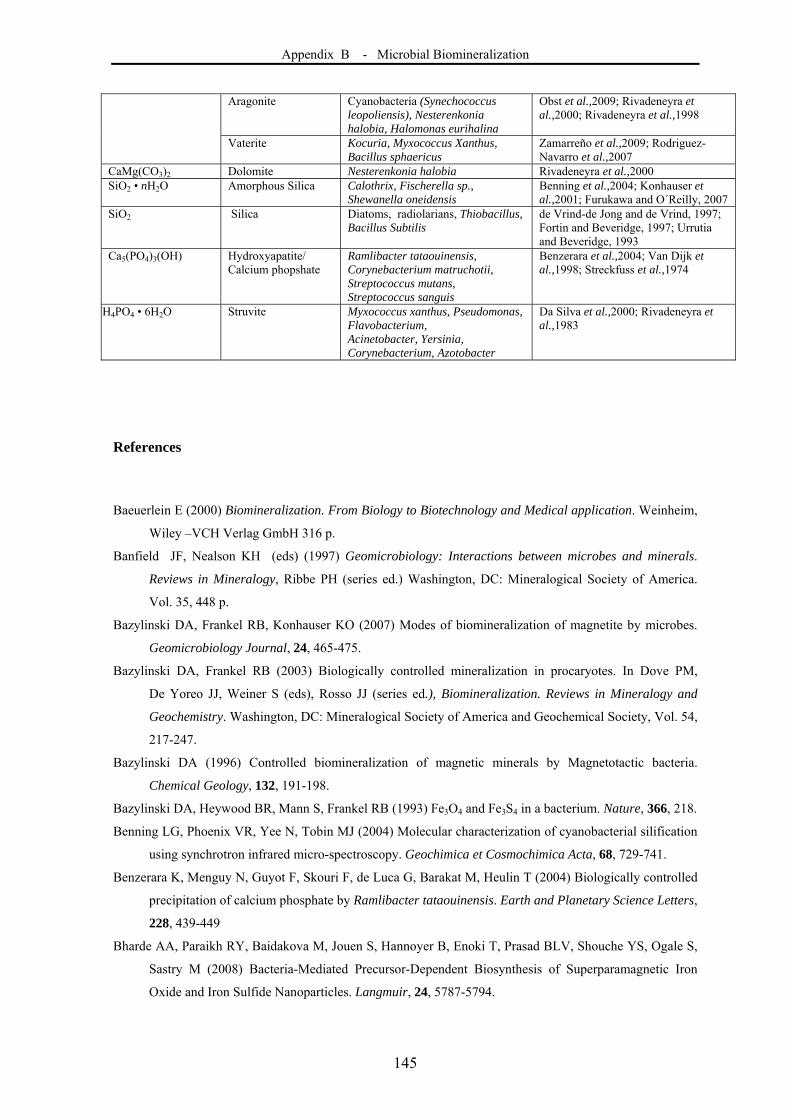
Appendix B - Microbial Biomineralization
145
Aragonite Cyanobacteria (Synechococcus leopoliensis), Nesterenkonia halobia, Halomonas eurihalina
Obst et al.,2009; Rivadeneyra et al.,2000; Rivadeneyra et al.,1998
Vaterite Kocuria, Myxococcus Xanthus, Bacillus sphaericus
Zamarreño et al.,2009; Rodriguez-Navarro et al.,2007
CaMg(CO3)2 Dolomite Nesterenkonia halobia Rivadeneyra et al.,2000 SiO2 • nH2O Amorphous Silica Calothrix, Fischerella sp.,
Shewanella oneidensis Benning et al.,2004; Konhauser et al.,2001; Furukawa and O´Reilly, 2007
SiO2 Silica Diatoms, radiolarians, Thiobacillus, Bacillus Subtilis
de Vrind-de Jong and de Vrind, 1997; Fortin and Beveridge, 1997; Urrutia and Beveridge, 1993
Ca5(PO4)3(OH) Hydroxyapatite/ Calcium phopshate
Ramlibacter tataouinensis, Corynebacterium matruchotii, Streptococcus mutans, Streptococcus sanguis
Benzerara et al.,2004; Van Dijk et al.,1998; Streckfuss et al.,1974
NH4PO4 • 6H2O Struvite Myxococcus xanthus, Pseudomonas, Flavobacterium, Acinetobacter, Yersinia, Corynebacterium, Azotobacter
Da Silva et al.,2000; Rivadeneyra et al.,1983
References
Baeuerlein E (2000) Biomineralization. From Biology to Biotechnology and Medical application. Weinheim,
Wiley –VCH Verlag GmbH 316 p.
Banfield JF, Nealson KH (eds) (1997) Geomicrobiology: Interactions between microbes and minerals.
Reviews in Mineralogy, Ribbe PH (series ed.) Washington, DC: Mineralogical Society of America.
Vol. 35, 448 p.
Bazylinski DA, Frankel RB, Konhauser KO (2007) Modes of biomineralization of magnetite by microbes.
Geomicrobiology Journal, 24, 465-475.
Bazylinski DA, Frankel RB (2003) Biologically controlled mineralization in procaryotes. In Dove PM,
De Yoreo JJ, Weiner S (eds), Rosso JJ (series ed.), Biomineralization. Reviews in Mineralogy and
Geochemistry. Washington, DC: Mineralogical Society of America and Geochemical Society, Vol. 54,
217-247.
Bazylinski DA (1996) Controlled biomineralization of magnetic minerals by Magnetotactic bacteria.
Chemical Geology, 132, 191-198.
Bazylinski DA, Heywood BR, Mann S, Frankel RB (1993) Fe3O4 and Fe3S4 in a bacterium. Nature, 366, 218.
Benning LG, Phoenix VR, Yee N, Tobin MJ (2004) Molecular characterization of cyanobacterial silification
using synchrotron infrared micro-spectroscopy. Geochimica et Cosmochimica Acta, 68, 729-741.
Benzerara K, Menguy N, Guyot F, Skouri F, de Luca G, Barakat M, Heulin T (2004) Biologically controlled
precipitation of calcium phosphate by Ramlibacter tataouinensis. Earth and Planetary Science Letters,
228, 439-449
Bharde AA, Paraikh RY, Baidakova M, Jouen S, Hannoyer B, Enoki T, Prasad BLV, Shouche YS, Ogale S,
Sastry M (2008) Bacteria-Mediated Precursor-Dependent Biosynthesis of Superparamagnetic Iron
Oxide and Iron Sulfide Nanoparticles. Langmuir, 24, 5787-5794.
Appendix B - Microbial Biomineralization
146
Boetius A, Ravenschlag K, Schubert CJ, Rickert D, Widdel F, Gieseke A, Amann R, Jørgensen BB,
Witte U, Pfannkuche O (2000) A marine microbial consortium apparently mediating anaerobic
oxidation of methane. Nature, 407, 623-626.
Borowitzka MA (1982) Morphological and cytological aspects of algal calcification. International review of
Cytology, 74, 127-162.
Brouwers GJ, Vijgenboom E, Corstjens PLAM, De Vrind JPM, De Vrind-De Jong EW (2000) Bacterial
Mn2+ oxidizing systems and multicopper oxidases: An Overview of mechanisms and functions.
Geomicrobiology Journal, 17, 1-24.
Brune DC (1995) Isolation and characterization of sulfur globule proteins from Chromatium vinosum and
Thiocapsa roseopersicina. Archives of Microbiology, 163, 391-399.
Brune DC (1989) Sulfur oxidation by phototrophic bacteria. Biochimica et Biophysica Acta, 975, 189-221.
Chan CS, Fakra SC, Edwards DC, Emerson D, Banfiled JF (2009) Iron oxyhydroxide mineralization of
microbial extracellular polysaccharides. Geochimica et Cosmochimica Acta, 73, 3807-3818.
Châtellier X, Fortin D, West MM, Leppard GG, Ferris FG (2001) Effect of the presence of bacterial surfaces
during the synthesis of Fe oxides by oxidation of ferrous ions. European Journal of Mineralogy, 13,
705-714.
Da Silva S, Bernet N, Delgenès JP, Moletta R (2000) Effect of culture conditions on the formation of struvite
by Myxococcus Xanthus. Chemosphere, 40, 1289-1296.
Daoud J, Karamanev D (2006) Formation of jarosite during Fe2+ oxidation by Acidithiobacillus ferrooxidans.
Minerals Engineering, 19, 960-967.
Daughney CD, Châtellier X, Chan A, Kenward P, Fortin D, Suttle CA, Fowl D (2004) Adsorption and
precipitation of iron from seawater by a marine bacteriophage (PWH3a-P1). Marine Chemistry, 91,
101-115.
De Vrind-de Jong EW, de Vrind JPM (1997) Algal deposition of carbonates and silicates. In Banfield JF,
Nealson KH (eds.), Geomicrobiology: interactions between microbes and minerals. Reviews in
Mineralogy. Washington, DC. Mineralogical Society of America, Vol. 35, 267-307.
Ding J-N, Gao J, Wu X-l, Zhang C-G, Qiu G-Z (2007) Jarosite –type precipitates mediated by YN22,
Sulfobacillus thermosulfidooxidans, an their influens on strain. Transactions of nonferrous metals.
Society of China, 17, 1038-1044.
Donald R, Southam G (1999) Low temperature anaerobic bacterial diagensis of ferrous monosulfide to
pyrite. Geochimica et Cosmochimica Acta, 63, 2019-2023.
Dove PM, De Yoreo JJ, Weiner S (eds) (2003) Biomineralization. Reviews in Mineralogy and Geochemistry,
Rosso J J (series ed) Washington DC: Mineralogical Society of America and Geochemical Society,
Vol. 54, 381 p.
Driessens FCM, Verbeeck RK (1990) Biominerals. Poca Raton, Florida: CRC Press Inc, 440.
Egal M, Casiot C, Morin G, Parmentier M, Bruneel O, Lebrun S, Elbaz-Poulichet F (2009) Kinetic control on
the formation of tooeleite, schwertmannite and jarosite by Acidithiobacillus ferrooxidans stains in an
As(III)-rich acid mine water. Chemical Geology, 265, 432-441.
Ehrlich HL (1999) Microbes as Geologic Agents: Their Role in Mineral Formation. Geomicrobiology
Journal, 16, 135-153.
Appendix B - Microbial Biomineralization
147
Ercole C, Cacchio P, Botta AL, Centi V, Lepidi A (2007) Bacterially induced mineralization of calcium
carboante: The role of exopolysaccharides and capsular polysaccharides. Microscopy and
Microanalysis, 13, 42-50.
Faivre D, Schüler D (2008) Magnetotactic bacteria and magnetosoms. Chemical Reviews, 108, 4875-4898.
Farina M, Esquivel DMS, Lins de Barros HGP (1990) Magnetic iron-sulphur crystals from magnetotactic
microorganism. Nature, 343, 256-258.
Folk RL (2005) Nannobacteria and the formation of framboidal pyrite: Textural evidence. Journal of earth
System Science, 114, 369-374.
Fortin D, Beveridge TJ (1997) Role of the bacterium Thiobacillus in the formation of silicates in acidic mine
tailings. Chemical Geology, 141, 235-250.
Fortin D, Beveridge TJ (2000) Mechanistic routes to biomineral surface development. In Bäuerlein E (ed),
Biomineralization: From Biology to Biotechnology and Medical Application. Weinheim, Wiley-VCH
GmbH, 7-24.
Frankel RB, Bazylinski DA (2003) Biologically induced mineralization by bacteria. In Dove PM, De
Yoreo JJ, Weiner S (eds), Rosso JJ (series ed.), Biomineralization. Reviews in Mineralogy and
Geochemistry. Washington, DC: Mineralogical Society of America and Geochemical Society, Vol. 54,
95-114.
Frankel RB, Papaefthymiou GC, Blakemore RP, O’ Brien W (1983) Fe3O4 precipitation in Magnetotactic
bacteria. Biochimica et Biophysica Acta, 763,147-159.
Furukawa Y, O`Reilly SE (2007) Rapid precipitaion of amorphous silica in experimental systems with
nontronite (Nau-1) and Shewanella oneidensis MR-1. Geochimica et Cosmochimica Acta, 71, 363-
377.
Haferburg G, Kothe E (2007) Microbes and metals: interactions in the environment. Journal of Basic
Microbiology, 47, 453-467.
Hallberg R, Ferris FG (2004) Biomineralization by Gallionella. Geomicrobiology Journal, 21, 325-330.
He S, Gui Z, Zhang Y, Zhang S, Wang J, Gu N (2007) Biosynthesis of gold nanoparticles using the bacteria
Rhodopseudomonas capsulata. Material Letters, 61, 3984-3987.
Heywood BR, Bazylinski DA, Garratt-Reed A, Mann S, Frankel RB (1990) controlled biosynthesis of
greigite (Fe3S4) in magnetotactic bacteria. Naturwissenschaften, 77, 536-538.
Ivarson KC, Hallberg RO (1976) Formation of mackinawite by the microbial reduction of jarosite and its
application to tidal sediments. Geoderma, 16, 1-7.
Kennedy CB, Scott SD, Ferris FG (2004) Hydrothermal phase stabilization of 2-line ferrihydrite by bacteria.
Chemical Geology, 212, 269-277.
Kirschvink JL, Hagadorn JW (2000) 10 a Grand unified thereory of Biomineralization. In Bäuerlein (ed), The
Biomineralisation of Nano- and Microstructures. Weinheim: Wiley-VCH GmbH, 139-150.
Konhauser KO, Phoenix VR, Bottrell SH, Adams DG, Head IM (2001) Microbial-silica interactions in
Iclandic hot spring sinter: possible analogues for some Precambrian siliceous stromatolites.
Sedimentology, 48, 415-433.
Konishi Y, Tsukiyama T, Tachimi T, Saitoh N, Nomura T, Nagamine S (2007) Microbial deposition of gold
nanoparticles by the metal-reducing bacterium Shewanella algae. Electrochimica Acta, 53, 186-192.
Appendix B - Microbial Biomineralization
148
Konishi Y, Tsukiyama T, Ohno K, Saitoh N, Nomura T, Nagamine S (2006) Intracellular recovery of gold by
microbial reduction of AuCl4- ions using the anaerobic bacterium Shewanella algae. Hydrometallurgy,
81, 24-29.
Kukkadapu RK, Zachara JM, Fredrickson JK, Kennedy DW (2004) Biotransformation of two-line silica-
ferrihydrite by dissimilatory Fe(III)-reducing bacterium: Formation of carbonate green rust in the
presence of phosphate. Geochimica et Cosmochimica Acta, 68, 2799-2814.
Lengke M, Southam G (2006) Bioaccumulation of gold by sulfate-reducing bacteria cultured in the presence
of gold(I)-thiosulfate complex. Geochimica et Cosmochimica Acta, 70, 3646-3661.
Lian B, Hu Q, Chen J, Ji J, Teng HH (2006) Carbonate biomineralization induced by soil bacterium Bacillus
megaterium. Geochimica et Cosmochimica Acta, 704, 5522-5535.
Lovely D (ed) 2000. Environmental microbe-metal interactions. ASM Press, Washington, DC, 395p.
Lovley DR (1991) Dissimilatory Fe(III) and Mn(IV) reduction. Microbiology Reviews, 55, 259-287.
Lovley DR, Stolz JF, Nord Jr GL, Phillips EJP (1987) Anaerobic production of magnetite by a dissimilatory
iron- reducing microorganism. Nature, 330, 252-254.
Lowenstam HA (1981) Minerals formed by organisms. Science, 211, 1126-1131.
Lowenstam HA, Weiner S (1989) On Biomineralization. New York: Oxford University Press, 324 p.
Mann S (2001) Biomineralization: Principles and concepts in bioinorganic materials chemistry. In Compton,
RG, Davies SG, Evans J (eds), Oxford Chemistry Masters Vol. 5. Oxford University Press, New York,
216 p.
Mann S, Sparks NHC, Frankel RB, Bazylinski DA, Jannasch HW (1990) Biomineralization of ferromagnetic
greigite /Fe3S4)and iron pyrite (FeS2) in a Magnetotactic bacterium. Nature, 343, 258-261.
Minsky A, Shimoni E, Frenkel-Krispin D (2002) Stress, order and survival. Nature Reviews Molecular Cell
Biology, 3, 50-60.
Miot J, Benzerara K, Morin G, Kappler A, Bernard S, Obst M, Férard C, Skouri-Panet F, Guigner J-M,
Posth N, Galvez M, Brown Jr GE, Guyot F (2009) Iron biomineralization by anaerobic neutrophilic
iron –oxidizing bacteria. Geochimica et Cosmochimica Acta, 73, 696-711.
Obst M, Dynes JJ, Lawrence JR, Swerhone GDW, Benterara K, Kaznatcheev K, Tyliszczak T,
Hitchcock A P (2009) Precipitation of amorphous CaCO3 (aragonite-like) by cyanobacteria: A STXM
study of the influence of EPS on the nucleation process. Geochimica et Cosmochimica Acta, 73, 4180-
4198.
O’Loughlin EJ (2008) Effects of electron transfer mediators on the bioreduction of Lepidocrocite (γ-FeOOH)
by Shewanella putrefaciens CN32. Environmental Science and Technology, 42, 6876-6882.
Parmar N, Warren LA, Roden EE, Ferris FG (2000) Sild phase capture of strontium by the iron reducing
bacteria Shewanella alga strain BRY. Chemical Geology, 169, 281-288
Pasteris JD, Freeman JJ, Goffredi SK, Buck KR (2001) Chemical Geology, 180, 3-18.
Pósfai M, Buseck PR, Bazylinski DA, Frankel RB (1998a) Reaction sequence of iron sulfide minerals in
bacteria and their use as biomarkers. Science, 280, 880–883.
Pósfai M, Buseck PR, Bazylinski DA, Frankel RB (1998b) Iron sulfides from magnetotactic bacteria:
Structure, compositions, and phase transitions. American Mineralogist, 83, 1469-1481.
Appendix B - Microbial Biomineralization
149
Reith F, Wakelin SA, Gregg A L, Schmidt-Mumm A (2009) A microbial pathway for the formation of gold-
anoumalous calcrete. Chemical Geology, 258, 315-326.
Reitner J, Peckmann J, Blumenberg M, Michaelis W, Reimer A, Thiel V (2005)Concretionary methane –seep
carbonates and associated microbial communities in Black Sea sediments. Palaeogegraphy,
Palaeoclimatology, Palaeoecology, 227,18-30.
Rivadeneyra MA, Delgado G, Soriano M, Ramos-Cormenzana A, Delgado R (2000) Precipitation of
carbonates by Nesterenkonia halobia in liquid media. Chemosphere, 41, 617-624.
Rivadeneyra MA, Delgado G, Ramos-Cormenzana A, Delgado R (1998) Biomineralization of carbonates by
Halomonas eurihalina in solid and liquid media with different salinities: crystal formation sequence.
Research in Microbiology, 149, 277-287.
Rivadeneyra MA, Ramos-Cormenzana A, García-Cervigon A, (1983) Bacterial formation of struvite.
Geomicrobiology Journal, 3, 151-163.
Rodriguez-Navarro C, Jiminez-Lopez C, Rodriguez-Navarro A, Gonzalez-Muñoz M T, Rodriguez-
Gallego M (2007) Bacterially mediated mineralization of vaterite. Geochimica et Cosmochimica Acta,
71, 1197-1213.
Roh Y, Chon C-M, Moon J-W (2007) Metal reduction and biomineralization by alkaliphilic metal reducing
bacterium, Alkaliphilus metalliredigens (QYMF). Geosciences Journal, 11, 415-423.
Sigel A, Sigel H, Sigel RO (eds) (2008) Biomineralization: from Nature to Application. Metal Ions in life
sciences. Wiley and Sons, West Sussex, 4 Vols, 700 p.
Smith DW, Strohl WR (1991) Sulfur oxidizing bacteria. In Shively J. M., Barton L. L., (eds.), Variations in
autotrophic life. Academic Press, London, 121-146.
Southam G (2000) Bacterial surface-mediated mineral formation. In Lovley, D. R. (ed.), Environmental
microbe-metal interactions. ASM Press, Washington DC, 257-276.
Streckfuss JL, Smith WN, Brown LR, Campbel MM (1974) Calcification of Selected Strains of
Streptococcus mutans and Streptococcus sanguis. Journal of Bacteriology, 120, 502-506.
Strohl WR, Geffers I, Larkin JM (1981) Structure of the sulfur inclusions envelopes from four beggiatoas.
Current Microbiology, 6, 75-79.
Takahashi Y, Hirata T, Shimizu H, Ozaki T, Fortin D (2007) A rare earth element signature of bacteria in
natural waters. Chemical Geology, 244, 569-583.
Tebo BM, Bargar JR, Clement BG, Dick GJ, Murray KJ, Parker D, Verity R, Webb SM (2004) Biogenic
Manganes Oxides: Properties and mechanisms of formation. Annual Review of Earth and Planetary
Sciences, 32, 287-328.
Thompson JB, Ferris FG (1990) Cyanobacterial precipitation of gypsum, calcite, and magnesite from natural
alkaline lake water. Geology, 18, 995-998.
Urrutia MM, Beveridge TJ (1993) Mechanism of silicate binding to the bacteria cell wall in Bacillus subtilis.
Journal of Bacteriology, 175, 1936–1945.
Van Dijk S, Dean DD, Zhao Y, Cirgwin JM, Schwartz Z, Boyan BD (1998) Purification, amino acid
sequence, and cDNA sequence of novel calcium-precipitating proteolipids involved in calcification of
Corynebacterium matruchotii, Calcified Tissue International, 62, 350– 358.
Appendix B - Microbial Biomineralization
150
Villalobos M, Toner B, Bargar J, Sposito G (2003) Characterization of manganese oxide prduced by
pseduomonas putida. Geochimica et Cosmochimica Acta, 67, 2649-2662.
Weiner S, Dove PM (2003) An overview of biomineralization processes and the problem of the vital effect.
In Dove PM, De Yoreo JJ, Weiner S (eds.), Biomineralization. Reviews in Mineralogy and
geochemistry. Mineralogical Society of America and Geochemical Society, Washington DC, Vol 54,
1-29.
Wilkin RT, Barnes HK (1997) Formation processes of framboidal pyrite. Geochimica et Cosmochimica Acta,
61, 323-339.
Yoshida H, Yamamoto K, Murakami Y, Katsuta N, Hayashi T, Naganuma T (2008) The development of Fe-
nodules surrounding biologica material mediated by microorganisms. Environmental Geology, 55,
1363-1374.
Zamarreño DV, Inkpen R, May E (2009) Studies on carbonate crystals precipitated by freshwater bacteria
and their use as a limestone consolidant. Applied and Environmental Microbiology, 75, 5981-5990.
Zegeye A, Huhuet L, Abdelmoula M, Carteret C, Mullet M, Jorand F (2007) Biogenic hydroxysulfate green
rust, a potential electron acceptor ofr SRB activity. Geochimica et Cosmochimica Acta, 71, 5450-
5462.
Zhang C, Liu S, Phelps TJ, Cole DR, Horita J, Fortier SM, Elless M, Valley J (1997) Phyiochemical,
mineralogical, and isotopic characterization of magnetite-rich iron oxides fromed by thermophilic
iron-reducing bacgeria. Geochimica et Cosmochimica Acta, 61, 4621-4632.
Zhang C, Vali H, Romanek CS, Phelps TJ, Liu SV (1998) Formation of single-domain magnetite by a
thermophilic bacterium. American Mineralogist, 83, 1409-1418.
Zhang J, Lion LW, Nelson YM, Shuler ML, Ghiorse WC (2002) Kinetics of Mn (II) oxidation by Leptothrix
discophora SS1. Geochimica et Cosmochimica Acta, 65, 773-781.
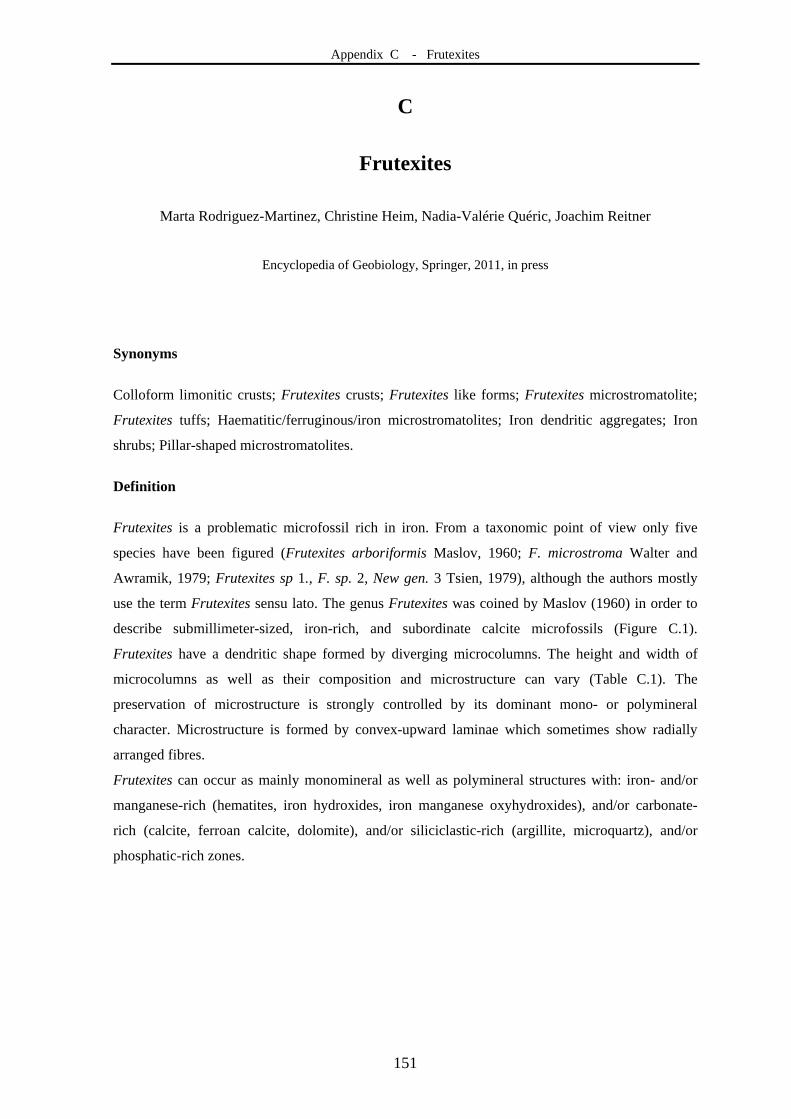
Appendix C - Frutexites
151
C
Frutexites
Marta Rodriguez-Martinez, Christine Heim, Nadia-Valérie Quéric, Joachim Reitner
Encyclopedia of Geobiology, Springer, 2011, in press
Synonyms
Colloform limonitic crusts; Frutexites crusts; Frutexites like forms; Frutexites microstromatolite;
Frutexites tuffs; Haematitic/ferruginous/iron microstromatolites; Iron dendritic aggregates; Iron
shrubs; Pillar-shaped microstromatolites.
Definition
Frutexites is a problematic microfossil rich in iron. From a taxonomic point of view only five
species have been figured (Frutexites arboriformis Maslov, 1960; F. microstroma Walter and
Awramik, 1979; Frutexites sp 1., F. sp. 2, New gen. 3 Tsien, 1979), although the authors mostly
use the term Frutexites sensu lato. The genus Frutexites was coined by Maslov (1960) in order to
describe submillimeter-sized, iron-rich, and subordinate calcite microfossils (Figure C.1).
Frutexites have a dendritic shape formed by diverging microcolumns. The height and width of
microcolumns as well as their composition and microstructure can vary (Table C.1). The
preservation of microstructure is strongly controlled by its dominant mono- or polymineral
character. Microstructure is formed by convex-upward laminae which sometimes show radially
arranged fibres.
Frutexites can occur as mainly monomineral as well as polymineral structures with: iron- and/or
manganese-rich (hematites, iron hydroxides, iron manganese oxyhydroxides), and/or carbonate-
rich (calcite, ferroan calcite, dolomite), and/or siliciclastic-rich (argillite, microquartz), and/or
phosphatic-rich zones.
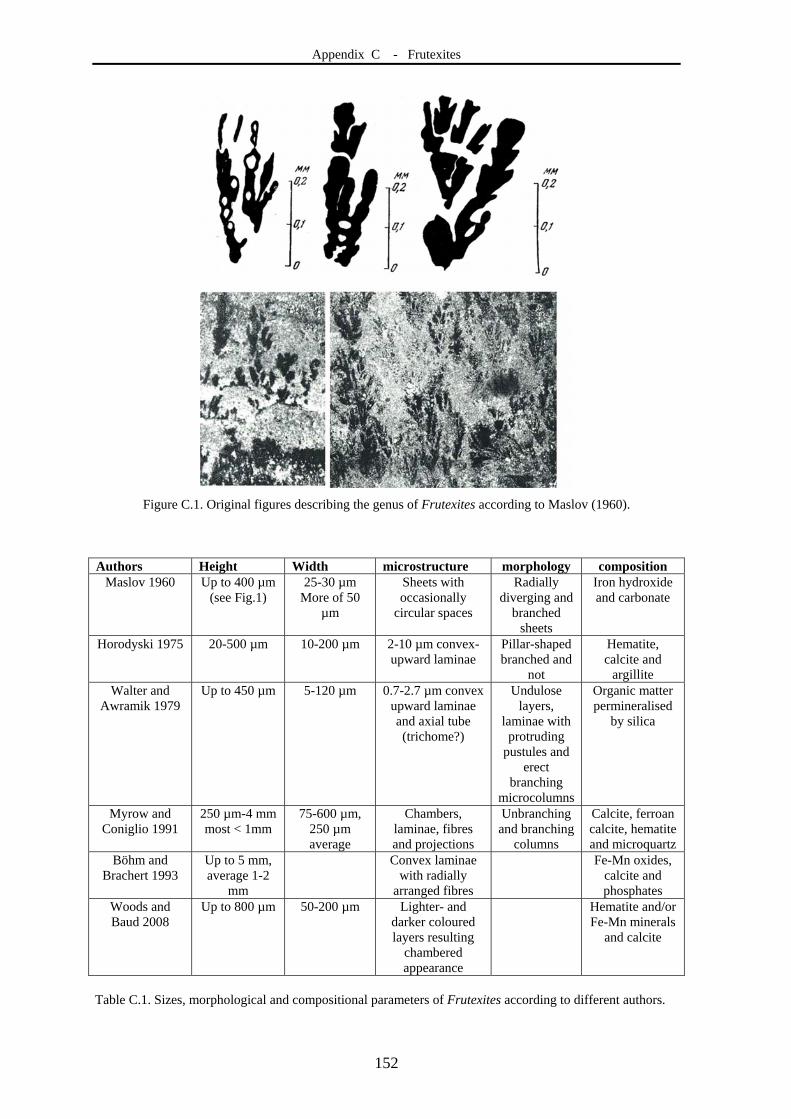
Appendix C - Frutexites
152
Figure C.1. Original figures describing the genus of Frutexites according to Maslov (1960).
Authors Height Width microstructure morphology composition Maslov 1960 Up to 400 µm
(see Fig.1) 25-30 µm
More of 50 µm
Sheets with occasionally
circular spaces
Radially diverging and
branched sheets
Iron hydroxide and carbonate
Horodyski 1975 20-500 µm 10-200 µm 2-10 µm convex-upward laminae
Pillar-shaped branched and
not
Hematite, calcite and
argillite Walter and
Awramik 1979 Up to 450 µm 5-120 µm 0.7-2.7 µm convex
upward laminae and axial tube (trichome?)
Undulose layers,
laminae with protruding
pustules and erect
branching microcolumns
Organic matter permineralised
by silica
Myrow and Coniglio 1991
250 µm-4 mm most < 1mm
75-600 µm, 250 µm average
Chambers, laminae, fibres and projections
Unbranching and branching
columns
Calcite, ferroan calcite, hematite and microquartz
Böhm and Brachert 1993
Up to 5 mm, average 1-2
mm
Convex laminae with radially
arranged fibres
Fe-Mn oxides, calcite and phosphates
Woods and Baud 2008
Up to 800 µm 50-200 µm Lighter- and darker coloured layers resulting
chambered appearance
Hematite and/or Fe-Mn minerals
and calcite
Table C.1. Sizes, morphological and compositional parameters of Frutexites according to different authors.
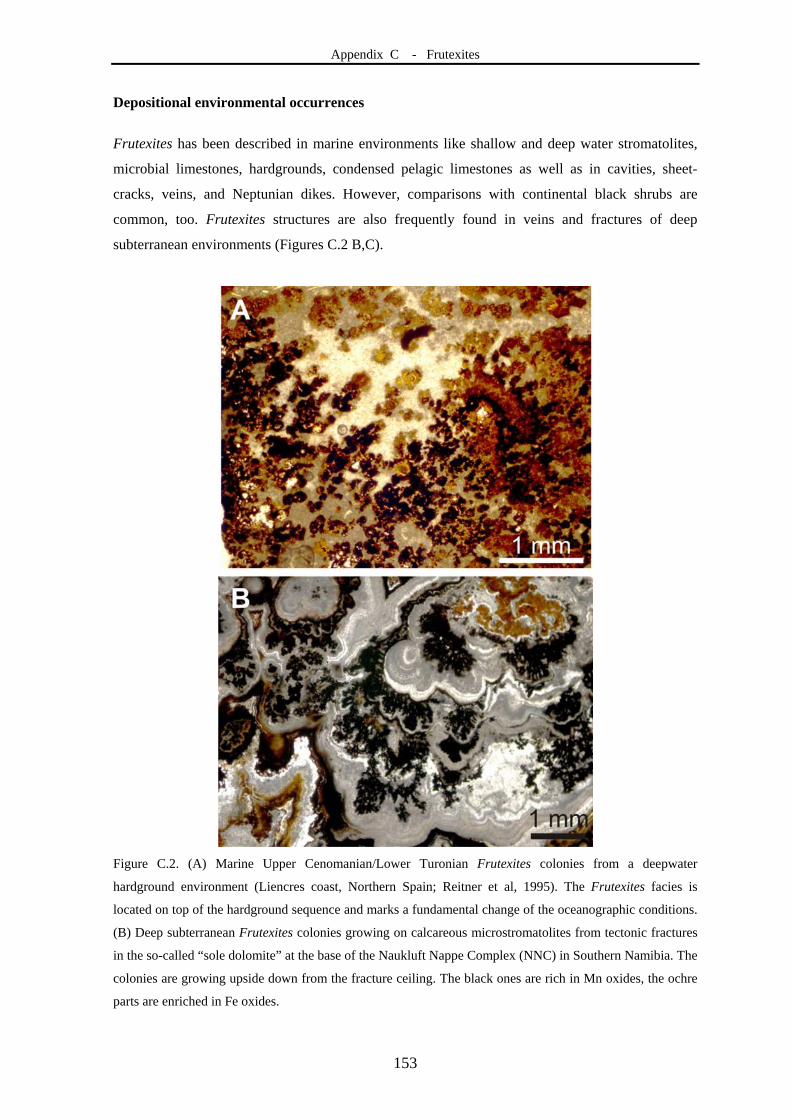
Appendix C - Frutexites
153
Depositional environmental occurrences
Frutexites has been described in marine environments like shallow and deep water stromatolites,
microbial limestones, hardgrounds, condensed pelagic limestones as well as in cavities, sheet-
cracks, veins, and Neptunian dikes. However, comparisons with continental black shrubs are
common, too. Frutexites structures are also frequently found in veins and fractures of deep
subterranean environments (Figures C.2 B,C).
Figure C.2. (A) Marine Upper Cenomanian/Lower Turonian Frutexites colonies from a deepwater
hardground environment (Liencres coast, Northern Spain; Reitner et al, 1995). The Frutexites facies is
located on top of the hardground sequence and marks a fundamental change of the oceanographic conditions.
(B) Deep subterranean Frutexites colonies growing on calcareous microstromatolites from tectonic fractures
in the so-called “sole dolomite” at the base of the Naukluft Nappe Complex (NNC) in Southern Namibia. The
colonies are growing upside down from the fracture ceiling. The black ones are rich in Mn oxides, the ochre
parts are enriched in Fe oxides.
Appendix C - Frutexites
154
Stromatolites
The main record of Frutexites has commonly been recognized from shallow to deep calcareous
stromatolites from Proterozoic to Recent examples (see Caldera lake stromatolites at Tonga, by
Kazmierczak and Kempe, 2006). Frutexites structures grow upwards perpendicular to the
stromatolite laminae, however they can sometimes cross them (Horodyski, 1975) and even destroy
them. For this reason, Böhm and Brachert (1993) interpreted that stromatolite accretion was
independent of Frutexites which would act as dweller or secondary binder in the Jurassic deep
water stromatolites from Germany and Austria. Descriptions about the associated macro- and
microfauna in the Frutexites-bearing stromatolites are not abundant. In the Canning Basin, the late
Devonian Frutexites-bearing stromatolites show abundant metazoans in life position as crinoids
and coral holdfasts encrusting the successive laminae (Playford et al.,1976), which would indicate
normal oxygenated water conditions (Nicoll and Playford, 1993). In Jurassic stromatolites,
Frutexites occur with shells of Bositra and Lenticulina foraminifers.
Cavities, sheet cracks, veins, and Neptunian dikes
The second most frequent occurrence of Frutexites in the geologic record is related to cavity walls
and fissures. On the horizontal surfaces Frutexites could display a dominant upward growth, but, in
general, their growth is normally perpendicular to the substrate where they were nucleated.
Frutexites occur interbedded with fibrous calcite cements as well as with internal sediment. The
oldest described record is in sheet cracks within stromatolites of the upper Vendian to Lower
Cambrian Chapel Island Formation, Canada (Myrow and Coniglio, 1991). Frutexites have been
found in cavities of Devonian deep water mud mounds and grouped with Renalcis-Epiphyton
calcimicrobes, and with deep water stromatolites assemblage (Tsien, 1979) as well as in
stromatactoid cavities from Viséan microbial limestones where they occur interbedded with marine
isopachous crusts of fibrous and botroydal calcite cements (Gischler, 1996). The presence of
Frutexites in Neptunian dikes has been described only in Devonian records from the Harz
Mountains in Germany (Gischler, 1996) and mud mounds of the Hamar Laghdad Ridge in
Morocco (Cavalazzi et al.,2007). Similar structures as Frutexites have also been described in voids
from Toarcian Mn-rich layer at Tatra Mountains in Poland (Jach and Dudek, 2005) as well as in
synsedimentary karstic cavities in Pleistocene travertines in Germany (Koban and Schweigert,
1993).
Condensed pelagic limestones and hardgrounds
The last most extended occurrence of Frutexites is associated with condensed hemipelagic and
pelagic red to grey limestones like Griotte and Hallstatt Limestone, as well as Rosso Ammonitico
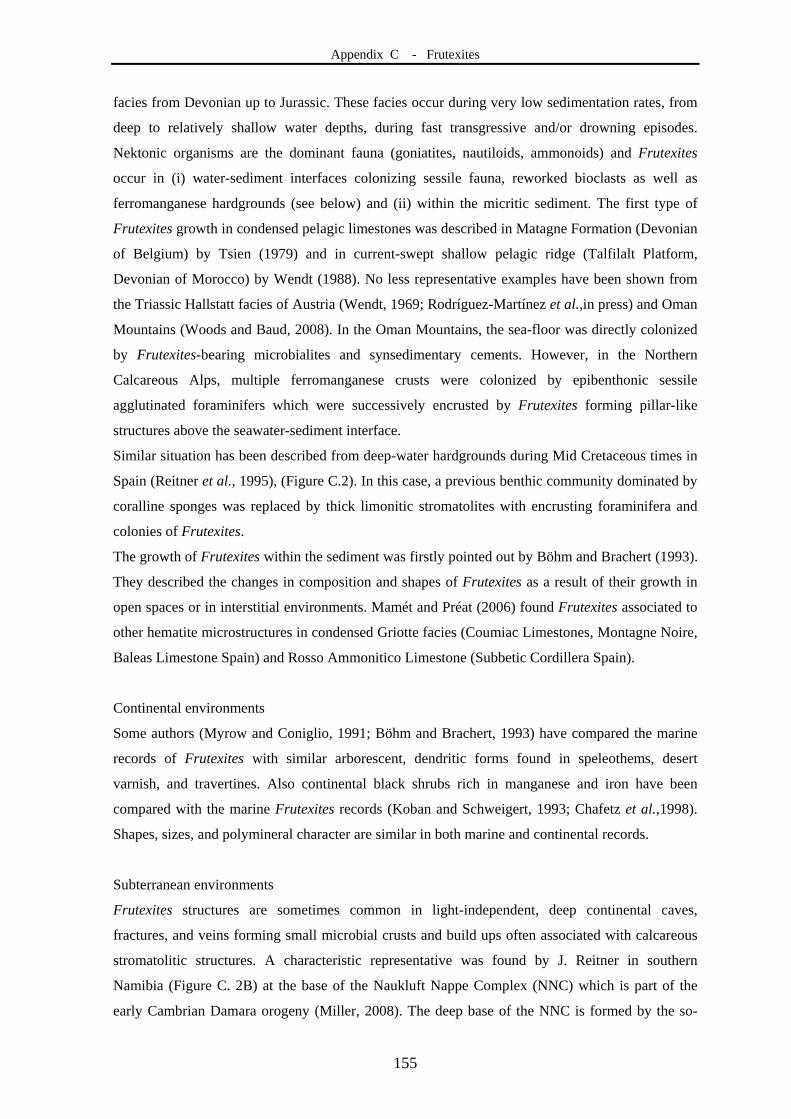
Appendix C - Frutexites
155
facies from Devonian up to Jurassic. These facies occur during very low sedimentation rates, from
deep to relatively shallow water depths, during fast transgressive and/or drowning episodes.
Nektonic organisms are the dominant fauna (goniatites, nautiloids, ammonoids) and Frutexites
occur in (i) water-sediment interfaces colonizing sessile fauna, reworked bioclasts as well as
ferromanganese hardgrounds (see below) and (ii) within the micritic sediment. The first type of
Frutexites growth in condensed pelagic limestones was described in Matagne Formation (Devonian
of Belgium) by Tsien (1979) and in current-swept shallow pelagic ridge (Talfilalt Platform,
Devonian of Morocco) by Wendt (1988). No less representative examples have been shown from
the Triassic Hallstatt facies of Austria (Wendt, 1969; Rodríguez-Martínez et al.,in press) and Oman
Mountains (Woods and Baud, 2008). In the Oman Mountains, the sea-floor was directly colonized
by Frutexites-bearing microbialites and synsedimentary cements. However, in the Northern
Calcareous Alps, multiple ferromanganese crusts were colonized by epibenthonic sessile
agglutinated foraminifers which were successively encrusted by Frutexites forming pillar-like
structures above the seawater-sediment interface.
Similar situation has been described from deep-water hardgrounds during Mid Cretaceous times in
Spain (Reitner et al., 1995), (Figure C.2). In this case, a previous benthic community dominated by
coralline sponges was replaced by thick limonitic stromatolites with encrusting foraminifera and
colonies of Frutexites.
The growth of Frutexites within the sediment was firstly pointed out by Böhm and Brachert (1993).
They described the changes in composition and shapes of Frutexites as a result of their growth in
open spaces or in interstitial environments. Mamét and Préat (2006) found Frutexites associated to
other hematite microstructures in condensed Griotte facies (Coumiac Limestones, Montagne Noire,
Baleas Limestone Spain) and Rosso Ammonitico Limestone (Subbetic Cordillera Spain).
Continental environments
Some authors (Myrow and Coniglio, 1991; Böhm and Brachert, 1993) have compared the marine
records of Frutexites with similar arborescent, dendritic forms found in speleothems, desert
varnish, and travertines. Also continental black shrubs rich in manganese and iron have been
compared with the marine Frutexites records (Koban and Schweigert, 1993; Chafetz et al.,1998).
Shapes, sizes, and polymineral character are similar in both marine and continental records.
Subterranean environments
Frutexites structures are sometimes common in light-independent, deep continental caves,
fractures, and veins forming small microbial crusts and build ups often associated with calcareous
stromatolitic structures. A characteristic representative was found by J. Reitner in southern
Namibia (Figure C. 2B) at the base of the Naukluft Nappe Complex (NNC) which is part of the
early Cambrian Damara orogeny (Miller, 2008). The deep base of the NNC is formed by the so-
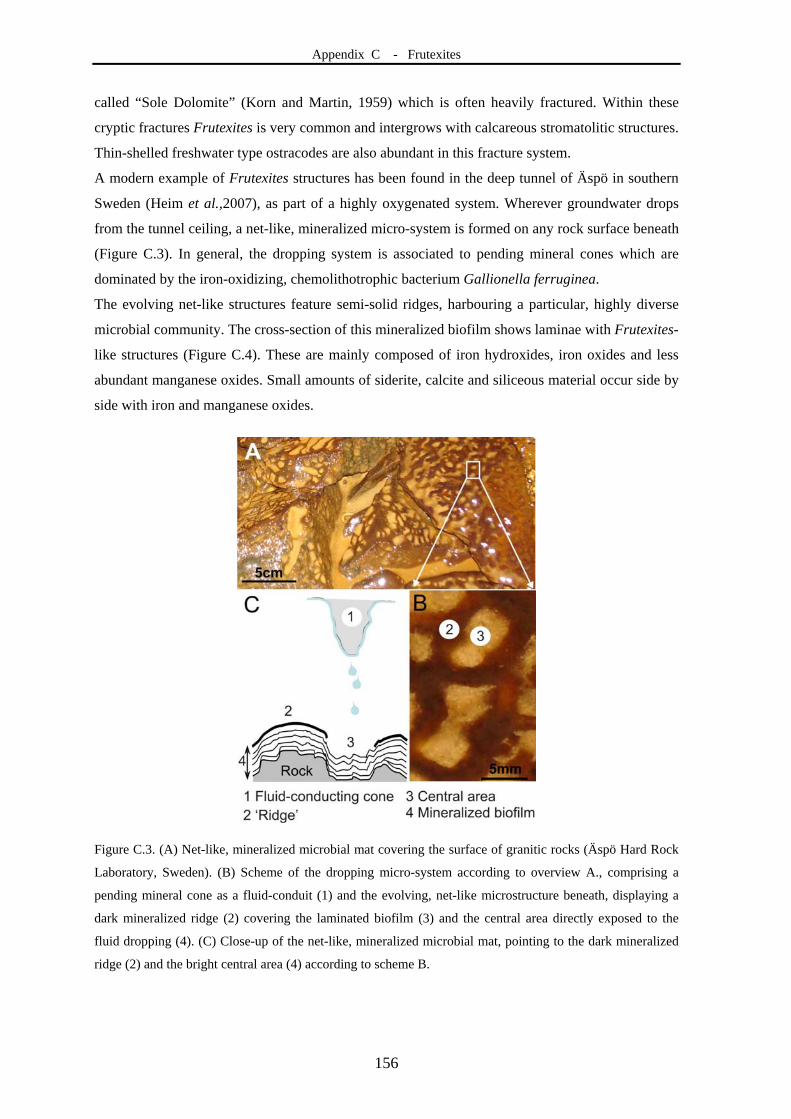
Appendix C - Frutexites
156
called “Sole Dolomite” (Korn and Martin, 1959) which is often heavily fractured. Within these
cryptic fractures Frutexites is very common and intergrows with calcareous stromatolitic structures.
Thin-shelled freshwater type ostracodes are also abundant in this fracture system.
A modern example of Frutexites structures has been found in the deep tunnel of Äspö in southern
Sweden (Heim et al.,2007), as part of a highly oxygenated system. Wherever groundwater drops
from the tunnel ceiling, a net-like, mineralized micro-system is formed on any rock surface beneath
(Figure C.3). In general, the dropping system is associated to pending mineral cones which are
dominated by the iron-oxidizing, chemolithotrophic bacterium Gallionella ferruginea.
The evolving net-like structures feature semi-solid ridges, harbouring a particular, highly diverse
microbial community. The cross-section of this mineralized biofilm shows laminae with Frutexites-
like structures (Figure C.4). These are mainly composed of iron hydroxides, iron oxides and less
abundant manganese oxides. Small amounts of siderite, calcite and siliceous material occur side by
side with iron and manganese oxides.
Figure C.3. (A) Net-like, mineralized microbial mat covering the surface of granitic rocks (Äspö Hard Rock
Laboratory, Sweden). (B) Scheme of the dropping micro-system according to overview A., comprising a
pending mineral cone as a fluid-conduit (1) and the evolving, net-like microstructure beneath, displaying a
dark mineralized ridge (2) covering the laminated biofilm (3) and the central area directly exposed to the
fluid dropping (4). (C) Close-up of the net-like, mineralized microbial mat, pointing to the dark mineralized
ridge (2) and the bright central area (4) according to scheme B.
Appendix C - Frutexites
157
Figure C.4. (A) Thin section of the mineralized, net-like, recent biofilm from the tunnel of Äspö (Schweden)
under reflected light, revealing the typical laminated structure. These laminae predominantly consist of iron
oxides and hydroxides. (B) UV-Fluorescence micrography exhibits Frutexites-like colonies within the
laminae of the mineralized biofilm.
Interpretation
Holotypes of Frutexites species (Frutexites arboriformis Maslov, 1960; Frutexites microstroma
Walter and Awramik, 1979) were originally described from stromatolites; thus they were
genetically linked to different types of cyanobacteria (Playford et al.,1976, 1984; Scytonematacea –
Walter and Awramik, 1979; Rivulariacea – Hofmann and Grotzinger, 1985; Angulocellularia –
Riding, 1991). Hofmann and Grotzinger (1985) discussed the affinity of Frutexites to different
cyanobacteria and proposed further alternatives (purely physicochemical accretion and/or iron
bacteria due to the ferruginous character of stromatolites). The occurrence of Frutexites in cavities,
fissures, and dykes was interpreted as cryptobiosis (Myrow and Coniglio, 1991). However, Tsien
(1979) was the first suggesting a non-phototrophic character, sometimes linked to
chemoheterotrophic cyanobacteria (Gischler, 1996) or to chemohetero- and -autotrophic bacteria
(Cavalazzi et al.,2007). Böhm and Brachert (1993) emphazised the cryptobiontic role, a negative
phototactic downward growth as well as the cryptoendopelitic behaviour (living in interstitial
habitats) of Frutexites. Based on these aspects the authors proposed the preference of Frutexites for
oxygen-deficient environments (dysaerobic to anaerobic conditions). Furthermore, they suggested a
bacterial precursor for the formation of Frutexites, but did not exclude a possible fungal and/or
Appendix C - Frutexites
158
physicochemical origin. According to previous publications (Maslov, 1960; Myrow and Coniglio
op cit), Böhm and Brachert (1993) explained the ferromanganese or phosphate mineralogy of
Frutexites as a replacement of primary carbonate mineralogy. A primary iron mineralization of
Frutexites was postulated by Horodyski (1975), Hurley and Van der Voo (1990). Others like
Hofmann and Grotzinger (1985) believed that microbiota involved in Frutexites could regulate the
local water chemistry and iron oxyhydroxides as well as aragonite coprecipitations.
Finally, the occurrence of Frutexites in condensed pelagic limestones and hardgrounds has been
linked to a physicochemical origin (Wendt, 1969) as well as to iron bacteria (Reitner et al.,1995;
Mamet and Préat, 2006). Reitner et al (1995) interpreted the Frutexites–foraminifera assemblage as
a R-strategic community which replaced the previous K-strategic community (sponges-microbes)
due to fundamental changes in oceanographic conditions (from oligotrophic to more eutrophic
conditions). Mamet and Préat discussed the origin of red pigmentation in Phanerozoic limestones,
where some condensed pelagic limestones with Frutexites are included. They argued that under
anoxic to dysoxic conditions, ferrous iron may be available for oxidation by microaerophilic iron
microbes growing at the sediment-water interface. In contrast, the recent Frutexites-like structures
found in the deep biosphere in fact grow in air-exposed environments (under aerobic conditions).
However, the presence of different mineral phases within these structures could be associated to
changing redox conditions and/or to a different microbial community composition at micrometer-
range.
Conclusions
The different modes of growth of Frutexites have been recognized within shallow to deep water
stromatolites, on the seawater-sediment interface, marine micritic sediments, continental cavities,
and fractures of deep subterranean environments. Such wider environmental distribution has been
taken into consideration for palaeoecological interpretations. According to the occurrence of
Frutexites, some general aspects can be summarized: i) its distribution does not show bathymetric
control (although its dominant record is in deep waters); ii) it formed in environments with very
low sedimentation rate (in quiet as well as in agitated waters); iii) in marine environments,
Frutexites mainly encrusts heterozoan assemblages (crinoids, sponges, solitary corals and
foraminifers); and finally, iv) there is no proof for an exclusive occurrence of Frutexites under
anoxic and aphotic conditions.
Most of the authors considered a bacterially-induced growth Frutexites, but the final assessment
strongly depends on which mineralogical composition they interpreted as primary (timing of iron
mineralization) as well as its loci of growth.
Appendix C - Frutexites
159
References
Böhm F, Brachert TC (1993) Deep-water stromatolites and Frutexites Maslov from the Early and Middle
Jurassic of S-Germany and Austria. Facies, 28, 145-168.
Cavalazzi B, Barbieri R, Ori G (2007) Chemosynthetic microbialites in the Devonian carbonate mounds of
Hamar Laghdad (Anti-Atlas, Morocco). Sedimentary Geology, 200, 73–88.
Chafetz HS, Akdim B, Julia R, Reid A (1998) Mn- and Fe-rich black travertine shrubs: bacterially (and
nanobacterially) induced precipitates. Journal of Sedimentary Research, 68, 404-412.
Gischler E (1996) Late Devonian-Early Carboniferous deep-water coral assemblages and sedimentation on a
Devonian seamount: Iberg Reef, Harz Mts., Germany. Palaeogeography, Palaeoclimatology,
Palaeoecology, 123, 297-322
Heim C, Simon K, Queric N-V, Thiel V (2007) Mineralized microbial mats with extreme lanthanum
enrichments in the tunnel of Äspö, Sweden. Geochimica et Cosmochimica Acta, Goldschmidt
Abstracts 2007, H- A390.
Hofmann J, Grotzinger JP (1985) Shelf-facies microbiotas from the Odjick and Rocknest formations
(Epworth Group; 1.89 Ga), northwestern Canada. Canadian Journal of Earth Sciences, 22, 1781-1792.
Horodyski RJ (1975) Stromatolites of the Lower Missoula Group (middle Proterozoic), Belt Supergroup,
Glaciar National Park, Montana. Precambrian Research, 2, 215-254.
Hurley NF, Van der Voo R (1990) Magnetostrigraphy, Late Devonian iridium anomaly, and impact
hyphotheses. Geology, 18, 291-294.
Jach R, Dudek T (2005) Origin of a Toarcian manganese carbonate/silicate deposit from the Krı´zˇna unit,
Tatra Mountains, Poland. Chemical Geology, 224, 136-152.
Kazmierczak J, Kempe S (2006) Genuine modern analogues of Precambrian stromatolites from caldera lakes
of Niuafo‘ou Island, Tonga. Naturwissenschaften, 93, 119–126.
Koban CG, Schweigert G (1993) Microbial origin of travertine fabrics - two examples from southern
Germany (Pleistocene Stuttgart travertines and Miocene Riedoschingen travertine). Facies, 29, 251–
264.
Korn H, Martin H (1959) Gravity tectonics in the Naukluft Mountains of South West Africa. Bulletin of
Geological Society of America, 70, 1047-1078
Mamet B, Préat A (2006) Iron-bacteria mediation in Phanerozoic red limestones: State of the art.
Sedimentary Geology, 185, 147-157.
Maslov VP (1960) Stromatolites. Trudy Instituta geologicheskikh nauk, Akademiya nauk SSR 41, 188 p.
Miller RMcG (2008) The Geology of Namibia, Volume 2, Geological Survey of Namibia, Windhoek.
Myrow PM, Coniglio M (1991) Origin and diagenesis of cryptobiontic Frutexites in the Chapel island
Formation (Vendian to Early Cambrian) of Southeast Newfoundland, Canada. Palaios, 6, 572-585.
Nicoll R S, Playford PE (1993) Upper Devonian iridium anomalies, conodont zonation and the Frasnian-
Famennian boundary in the Canning Basin, Western Australia. Palaeogeography, Palaeoclimatology,
Palaeoecology, 104, 105-113.
Playford PE, Cockbain AE, Druce EC, Wray JL (1976) Devonian stromatolites from the Canning Basin,
Western Australia. In Walter MR (Ed.), Stromatolites, Elsevier, Amsterdam, 543-563.
Appendix C - Frutexites
160
Playford PE, McLaren DJ, Orth CJ, Gilmore JS, Goodfellow WD (1984) Iridium anomaly in the Upper
Devonian of the Canning Basin, Western Australia. Science, 226, 437-439.
Reitner J, Wilmsen M, Neuweiler F (1995) Cenomanian/Turonian Sponge Microbialite Deep-Water
Hardground Community (Liencres, Northern Spain). Facies, 32, 203-212.
Riding R (1991) Calcified Cyanobacteria. In Riding R (ed.), Calcareous Algae and Stromatolites. Springer,
Berlin, 55-87.
Rodríguez-Martínez M, Heim C, Simon K, Reitner J, Zilla T (2010). Tolypammina gregaria Wendt-
Frutexites assemblage and ferromanganese crusts: a coupled nutrient-metal interplay in the Carnian
sedimentary condensed record of Hallstatt Facies (Austria). Lecture Notes in Earth Sciences, in press.
Tsien H H (1979) Paleoecology of algal-bearing facies in the Devonian (Couvirtian to Frasnian) Reef
Complexes of Belgium. Palaegeography, Palaeoclimatology, Palaeoecology, 27, 103-127.
Walter MR, Awramik SM (1979) Frutexites from stromatolites of the Gunflint iron formation of Canada, and
its biological affinities. Precambrian Research, 9, 23-33.
Wendt J (1969) Foraminiferen-‘Riffe’ im karnischen Hallstätter Kalk des Feuerkogels (Steiermark,
Österreich). Paläontologische Zeitschrift, 43, 177-193.
Wendt J (1988) Condensed carbonate sedimentation in the late Devonian of the eastern Anti-Atlas
(Morocco). Eclogae geologicae Helvetica, 81, 155-173.
Woods AD, Baud A (2008) Anachronistic facies from a drowned Lower Triassic carbonate platform: Lower
member of the Alwa Formation (Ba'id Exotic), Oman Mountains. Sedimentary Geology, 209, 1-14.
Appendix D - Raman Microscopy
161
D
Raman Microscopy
Jan Toporski, Thomas Dieing, Christine Heim
Encyclopedia of Geobiology, Springer, 2011, in press
Synonyms
Confocal Raman imaging (CRI)
Definition
Confocal Raman microscopy (CRM) is a non-destructive analytical technique that merges Raman
spectroscopy and confocal microscopy for the visualization of molecular information over a defined
sample area.
Introduction
Raman spectroscopy is well suited for studies in mineralogy and petrography, as it provides
nondestructive mineral identification fast and with high specificity. In addition, Raman spectroscopy
allows the characterization of complex organic materials, which makes it particularly useful in
biogeoscience applications (Hild et al., 2008). This technique has long been applied in geosciences, for
example, for the identification and characterization of minerals, or in the observation of mineral phase
transitions in high and ultra-high pressure/temperature experiments.
In most cases, measurements have been carried out in a micro-Raman set up, i.e., information was
obtained from single or multiple points of interest on a sample. This way, little detail on the spatial
distribution and association of components or mineral phases, or chemical variation could be observed,
even though this information may contribute significantly to the understanding of a sample’s complexity.
By means of CRM, such sample characteristics can be evaluated from large scale scans in the centimeter
range to the finest detail with sub-micron resolution. Modern confocal Raman microscopes allow for such
measurements with very high sensitivity and spatial as well as spectral resolution. CRM is a tool that not
only provides complementary information to data obtained by e.g., electron microprobe (EMP), energy
dispersive x-ray analysis (EDX), or secondary ion mass spectrometry (SIMS). In addition to the
quantitative and semiquantitative elemental and/or isotopic data acquired by these techniques, CRM
Appendix D - Raman Microscopy
162
contributes the visualization of the distribution for molecular information over a defined sample area.
Furthermore, considering that most geomaterials are transparent from the UV (NUV) to VIS and NIR to
some degree, this information can be obtained three dimensionally due to the confocal set-up of the
microscopes. The following discussion provides background information and examples that shall serve to
highlight some key analytical features of this technique for applications in geosciences. A recent and
comprehensive summary on the application of CRM in geoscience can be found in Fries and Steele
(2009).
Principles of confocal Raman microscopy
CRM essentially merges two techniques into one. First, Raman spectroscopy, which allows
nondestructive chemical analysis; secondly, Confocal microscopy which allows the user to examine
samples with diffractionlimited resolution as well as to obtain three-dimensional information from the
sample. The theory behind these two techniques will be explained in the following sections, followed by
an illustration of how images with chemical sensitivity can be obtained using this combination of
techniques.
Raman spectroscopy
When light of a certain wavelength interacts with a molecule, most photons are elastically scattered and
therefore have the same energy as the incident photons. However, a very small fraction (approximately 1
in 106–107 photons) is in elastically scattered, which means that the energy of the scattered photon is
different (usually lower) than the energy of the incident photon.
This is called the “Raman effect”, which was discovered by Sir Chandrasekhara Raman in 1928 (Raman,
1928; Raman and Krishnan, 1928). Unlike today, he used a filtered beam of sunlight as an excitation
source and his eye as a detector for the frequency shifted light. This was long before the development of
the first laser by Maiman in 1960. Raman was awarded the Nobel Prize in 1930 for this discovery. The
theory behind the Raman effect was derived five years earlier by Smekal (1923). The tremendous
importance of the Raman effect lies in the fact that the energy shift between the exciting and the Raman
scattered photon is caused by the excitation (or annihilation) of a molecular vibration. This energy shift is
characteristic and therefore a fingerprint for the type and coordination of the molecules involved in the
scattering process.
Theory
The following section shall provide some basic descriptions and definitions relevant to Raman
spectroscopy. Readers interested in a detailed theoretical background are referred to Ibach and Lüth
(2003). In quantum mechanics, the scattering process between a photon and a molecule is described as an
excitation of a molecule to a virtual state lower in energy than a real electronic state and the (nearly
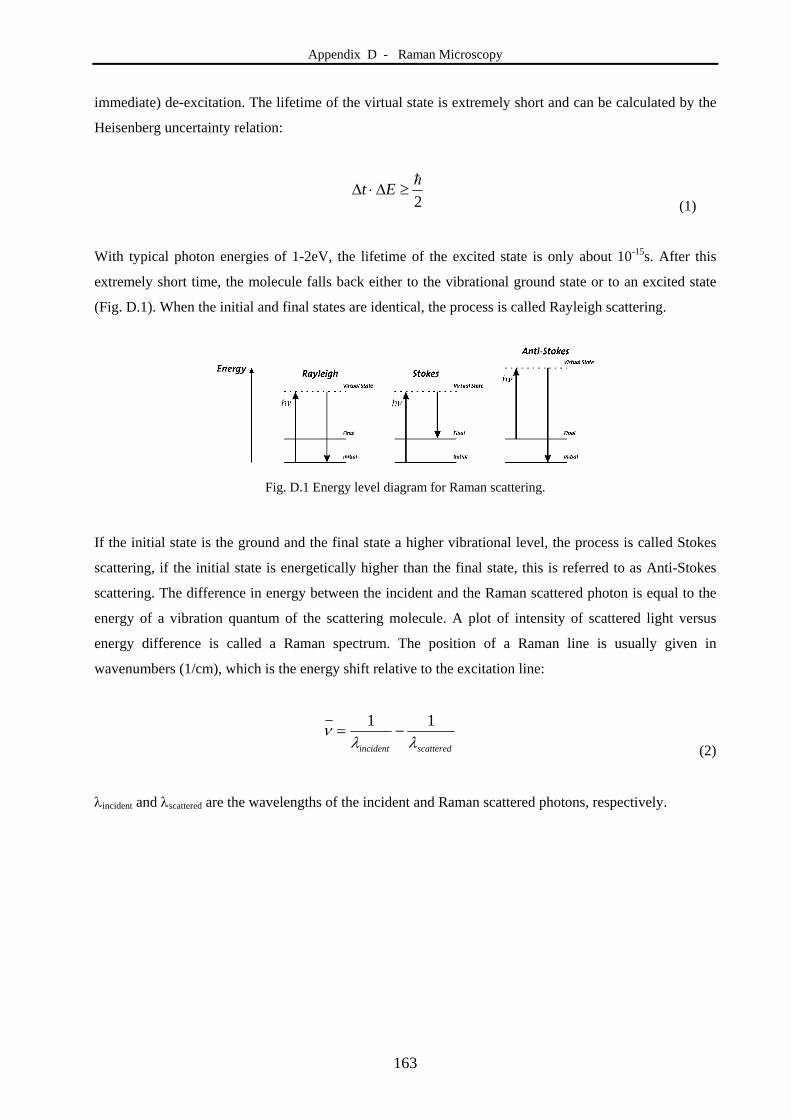
Appendix D - Raman Microscopy
163
immediate) de-excitation. The lifetime of the virtual state is extremely short and can be calculated by the
Heisenberg uncertainty relation:
2
Et
(1)
With typical photon energies of 1-2eV, the lifetime of the excited state is only about 10-15s. After this
extremely short time, the molecule falls back either to the vibrational ground state or to an excited state
(Fig. D.1). When the initial and final states are identical, the process is called Rayleigh scattering.
Fig. D.1 Energy level diagram for Raman scattering.
If the initial state is the ground and the final state a higher vibrational level, the process is called Stokes
scattering, if the initial state is energetically higher than the final state, this is referred to as Anti-Stokes
scattering. The difference in energy between the incident and the Raman scattered photon is equal to the
energy of a vibration quantum of the scattering molecule. A plot of intensity of scattered light versus
energy difference is called a Raman spectrum. The position of a Raman line is usually given in
wavenumbers (1/cm), which is the energy shift relative to the excitation line:
scatteredincident 11
(2)
incident and scattered are the wavelengths of the incident and Raman scattered photons, respectively.
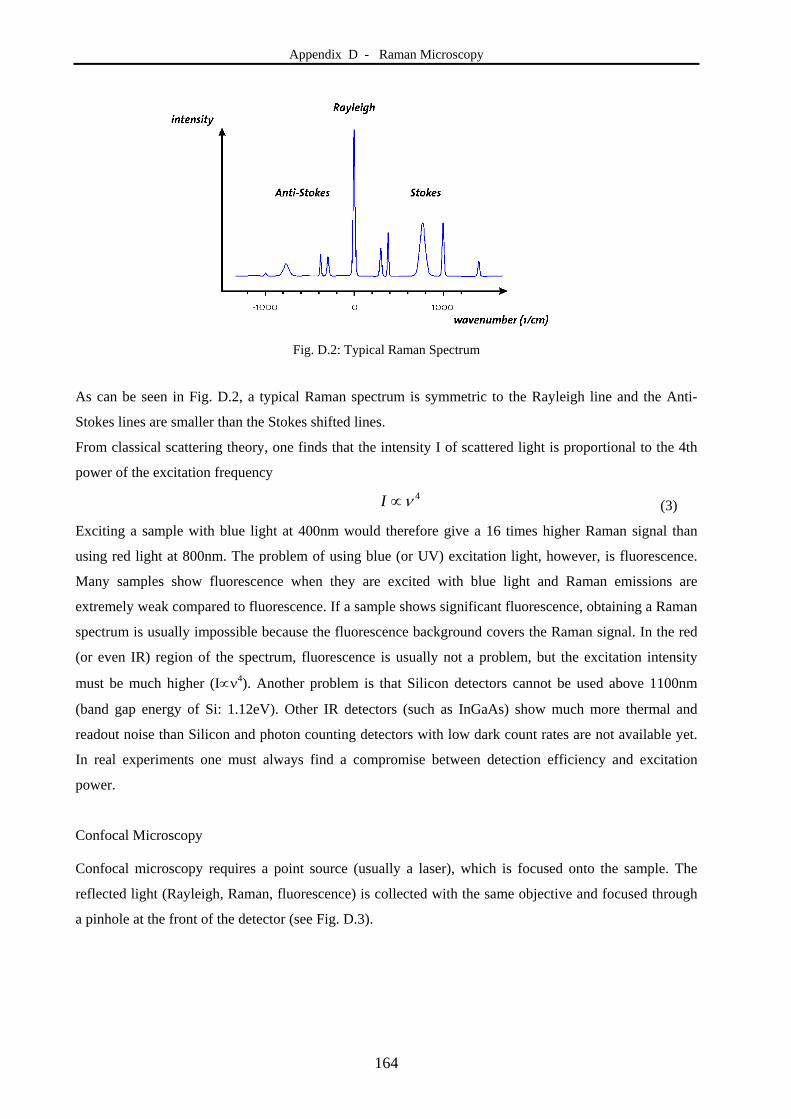
Appendix D - Raman Microscopy
164
Fig. D.2: Typical Raman Spectrum
As can be seen in Fig. D.2, a typical Raman spectrum is symmetric to the Rayleigh line and the Anti-
Stokes lines are smaller than the Stokes shifted lines.
From classical scattering theory, one finds that the intensity I of scattered light is proportional to the 4th
power of the excitation frequency
4I (3)
Exciting a sample with blue light at 400nm would therefore give a 16 times higher Raman signal than
using red light at 800nm. The problem of using blue (or UV) excitation light, however, is fluorescence.
Many samples show fluorescence when they are excited with blue light and Raman emissions are
extremely weak compared to fluorescence. If a sample shows significant fluorescence, obtaining a Raman
spectrum is usually impossible because the fluorescence background covers the Raman signal. In the red
(or even IR) region of the spectrum, fluorescence is usually not a problem, but the excitation intensity
must be much higher (I4). Another problem is that Silicon detectors cannot be used above 1100nm
(band gap energy of Si: 1.12eV). Other IR detectors (such as InGaAs) show much more thermal and
readout noise than Silicon and photon counting detectors with low dark count rates are not available yet.
In real experiments one must always find a compromise between detection efficiency and excitation
power.
Confocal Microscopy
Confocal microscopy requires a point source (usually a laser), which is focused onto the sample. The
reflected light (Rayleigh, Raman, fluorescence) is collected with the same objective and focused through
a pinhole at the front of the detector (see Fig. D.3).
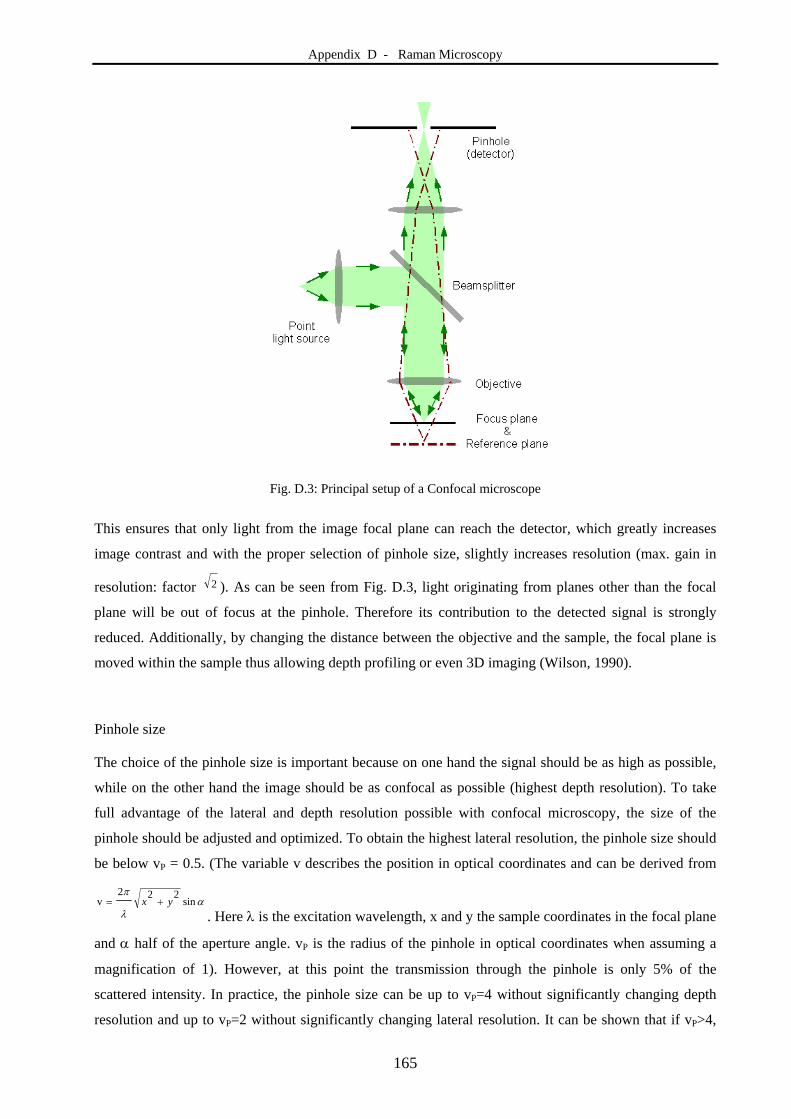
Appendix D - Raman Microscopy
165
Fig. D.3: Principal setup of a Confocal microscope
This ensures that only light from the image focal plane can reach the detector, which greatly increases
image contrast and with the proper selection of pinhole size, slightly increases resolution (max. gain in
resolution: factor 2 ). As can be seen from Fig. D.3, light originating from planes other than the focal
plane will be out of focus at the pinhole. Therefore its contribution to the detected signal is strongly
reduced. Additionally, by changing the distance between the objective and the sample, the focal plane is
moved within the sample thus allowing depth profiling or even 3D imaging (Wilson, 1990).
Pinhole size
The choice of the pinhole size is important because on one hand the signal should be as high as possible,
while on the other hand the image should be as confocal as possible (highest depth resolution). To take
full advantage of the lateral and depth resolution possible with confocal microscopy, the size of the
pinhole should be adjusted and optimized. To obtain the highest lateral resolution, the pinhole size should
be below vP = 0.5. (The variable v describes the position in optical coordinates and can be derived from
sin
222v yx
. Here is the excitation wavelength, x and y the sample coordinates in the focal plane
and half of the aperture angle. vP is the radius of the pinhole in optical coordinates when assuming a
magnification of 1). However, at this point the transmission through the pinhole is only 5% of the
scattered intensity. In practice, the pinhole size can be up to vP=4 without significantly changing depth
resolution and up to vP=2 without significantly changing lateral resolution. It can be shown that if vP>4,
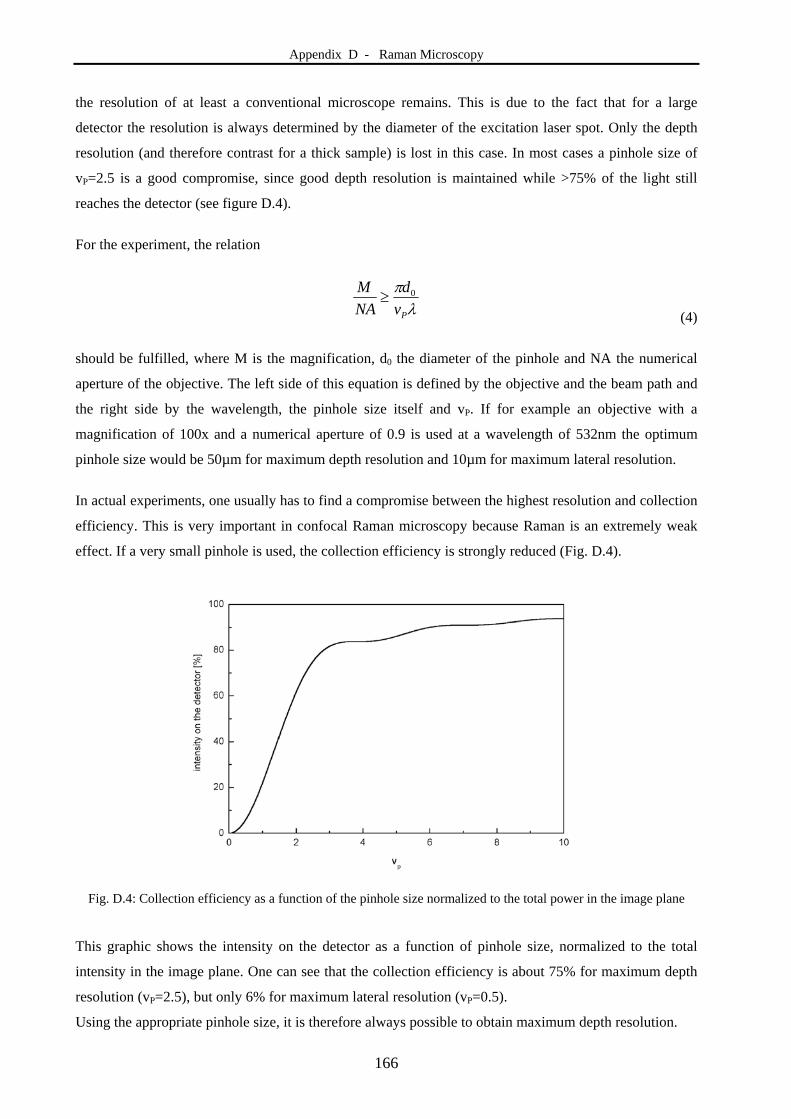
Appendix D - Raman Microscopy
166
the resolution of at least a conventional microscope remains. This is due to the fact that for a large
detector the resolution is always determined by the diameter of the excitation laser spot. Only the depth
resolution (and therefore contrast for a thick sample) is lost in this case. In most cases a pinhole size of
vP=2.5 is a good compromise, since good depth resolution is maintained while >75% of the light still
reaches the detector (see figure D.4).
For the experiment, the relation
Pv
d
NA
M 0 (4)
should be fulfilled, where M is the magnification, d0 the diameter of the pinhole and NA the numerical
aperture of the objective. The left side of this equation is defined by the objective and the beam path and
the right side by the wavelength, the pinhole size itself and vP. If for example an objective with a
magnification of 100x and a numerical aperture of 0.9 is used at a wavelength of 532nm the optimum
pinhole size would be 50µm for maximum depth resolution and 10µm for maximum lateral resolution.
In actual experiments, one usually has to find a compromise between the highest resolution and collection
efficiency. This is very important in confocal Raman microscopy because Raman is an extremely weak
effect. If a very small pinhole is used, the collection efficiency is strongly reduced (Fig. D.4).
Fig. D.4: Collection efficiency as a function of the pinhole size normalized to the total power in the image plane
This graphic shows the intensity on the detector as a function of pinhole size, normalized to the total
intensity in the image plane. One can see that the collection efficiency is about 75% for maximum depth
resolution (vP=2.5), but only 6% for maximum lateral resolution (vP=0.5).
Using the appropriate pinhole size, it is therefore always possible to obtain maximum depth resolution.
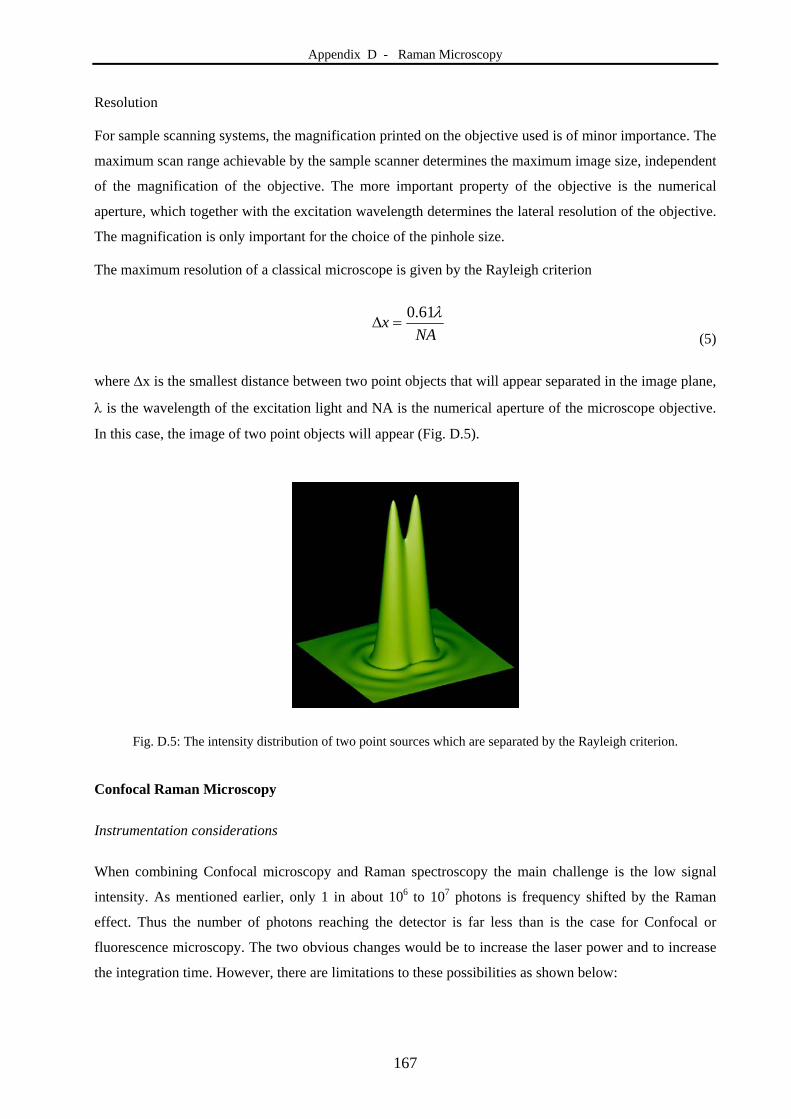
Appendix D - Raman Microscopy
167
Resolution
For sample scanning systems, the magnification printed on the objective used is of minor importance. The
maximum scan range achievable by the sample scanner determines the maximum image size, independent
of the magnification of the objective. The more important property of the objective is the numerical
aperture, which together with the excitation wavelength determines the lateral resolution of the objective.
The magnification is only important for the choice of the pinhole size.
The maximum resolution of a classical microscope is given by the Rayleigh criterion
NAx
61.0
(5)
where x is the smallest distance between two point objects that will appear separated in the image plane,
is the wavelength of the excitation light and NA is the numerical aperture of the microscope objective.
In this case, the image of two point objects will appear (Fig. D.5).
Fig. D.5: The intensity distribution of two point sources which are separated by the Rayleigh criterion.
Confocal Raman Microscopy
Instrumentation considerations
When combining Confocal microscopy and Raman spectroscopy the main challenge is the low signal
intensity. As mentioned earlier, only 1 in about 106 to 107 photons is frequency shifted by the Raman
effect. Thus the number of photons reaching the detector is far less than is the case for Confocal or
fluorescence microscopy. The two obvious changes would be to increase the laser power and to increase
the integration time. However, there are limitations to these possibilities as shown below:
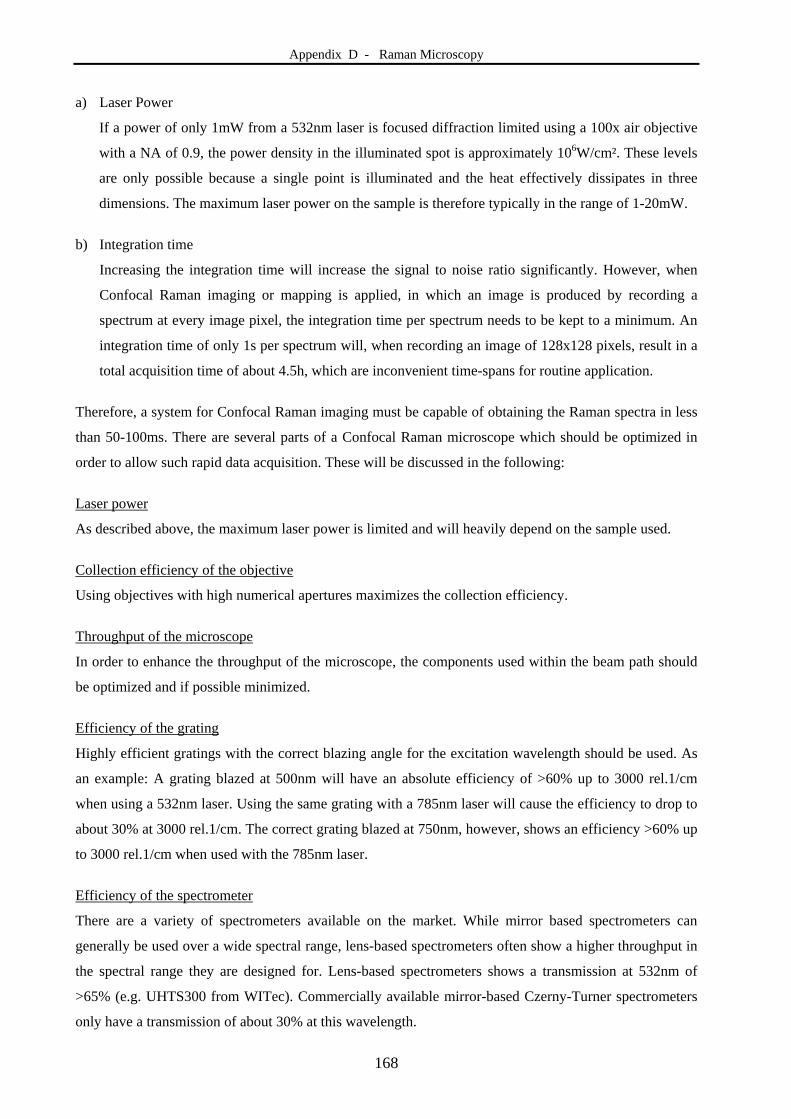
Appendix D - Raman Microscopy
168
a) Laser Power
If a power of only 1mW from a 532nm laser is focused diffraction limited using a 100x air objective
with a NA of 0.9, the power density in the illuminated spot is approximately 106W/cm². These levels
are only possible because a single point is illuminated and the heat effectively dissipates in three
dimensions. The maximum laser power on the sample is therefore typically in the range of 1-20mW.
b) Integration time
Increasing the integration time will increase the signal to noise ratio significantly. However, when
Confocal Raman imaging or mapping is applied, in which an image is produced by recording a
spectrum at every image pixel, the integration time per spectrum needs to be kept to a minimum. An
integration time of only 1s per spectrum will, when recording an image of 128x128 pixels, result in a
total acquisition time of about 4.5h, which are inconvenient time-spans for routine application.
Therefore, a system for Confocal Raman imaging must be capable of obtaining the Raman spectra in less
than 50-100ms. There are several parts of a Confocal Raman microscope which should be optimized in
order to allow such rapid data acquisition. These will be discussed in the following:
Laser power
As described above, the maximum laser power is limited and will heavily depend on the sample used.
Collection efficiency of the objective
Using objectives with high numerical apertures maximizes the collection efficiency.
Throughput of the microscope
In order to enhance the throughput of the microscope, the components used within the beam path should
be optimized and if possible minimized.
Efficiency of the grating
Highly efficient gratings with the correct blazing angle for the excitation wavelength should be used. As
an example: A grating blazed at 500nm will have an absolute efficiency of >60% up to 3000 rel.1/cm
when using a 532nm laser. Using the same grating with a 785nm laser will cause the efficiency to drop to
about 30% at 3000 rel.1/cm. The correct grating blazed at 750nm, however, shows an efficiency >60% up
to 3000 rel.1/cm when used with the 785nm laser.
Efficiency of the spectrometer
There are a variety of spectrometers available on the market. While mirror based spectrometers can
generally be used over a wide spectral range, lens-based spectrometers often show a higher throughput in
the spectral range they are designed for. Lens-based spectrometers shows a transmission at 532nm of
>65% (e.g. UHTS300 from WITec). Commercially available mirror-based Czerny-Turner spectrometers
only have a transmission of about 30% at this wavelength.
Appendix D - Raman Microscopy
169
Efficiency of the detector (CCD)
Back-illuminated CCD cameras show a quantum efficiency (QE) of >90% over the entire spectral range
of interest for 532nm excitation. Deep depletion back-illuminated CCD cameras, on the other hand, show
a QE of >70% for 785nm excitation. As a comparison, front illuminated CCD cameras do not exceed
55% quantum efficiency at any wavelength.
Additionally, the dark current of the cameras needs to be minimized, which is achieved through efficient
Peltier cooling.
The readout noise is another limiting factor for small signals. As the analog to digital (A/D) converter of
all cameras will add at least 5-10 electrons read-out noise to the signal, any signal below approximately 5
electrons will be lost in the noise. Additionally, the faster the A/D converter is operating, the higher the
read-out noise will be. Electron-multiplying CCD (EM-CCD) cameras can be used to overcome this
problem. With these cameras, the signal is amplified before the A/D conversion, allowing the detection of
even single photons and reducing the necessary integration time down to milliseconds.
Principle of operation
Confocal Raman microscopes generally provide a variety of modes of operations. The most common are
listed below:
Collection of Raman spectra at selected sample areas (Single Spectrum)
Single Raman spectra can be collected at user-selectable sample areas with integration times ranging from
ms to hours. The position of the collected spectrum can normally be fully controlled in 3D. A stable and
precise positioning system must be included in the instrument to ensure that the point of interest will
remain fixed under the excitation focus. This is very important when spectra with longer integration times
for the best quality and signal to noise ratio are to be obtained from extremely small sample volumes. For
example, using an oil immersion objective (NA 1.4) with a 532nm laser and the proper pinhole size
allows the sample volume to be as small as 230x230x550nm.
Collection of time series of Raman spectra at selected sample areas (Time Spectrum)
With this mode, time series of Raman spectra can be obtained to analyze dynamic sample properties.
Thousands of spectra can be obtained over time and analyzed with integration times ranging from ms to
tens of seconds.
Raman spectral imaging
In the Raman spectral imaging mode, the sample is moved in X and Y and a full Raman spectrum is
obtained at every pixel measured. From these data sets images of e.g. the integrated intensity of various
bands can be generated. This is illustrated in the following example.
A sample from the Äspö Hard Rock Laboratory, Sweden, was studied using the large area scan mode of
an alpha500 R, aiming to characterize secondary cleavage fillings in a 1.8 to 1.4 Billion years old diorite.
Appendix D - Raman Microscopy
170
A section was obtained from a drill core from the SKB (Swedish nuclear fuel and waste management
company) core library and drilled from a tunnel at ~450 m below the surface. This sample was examined
by confocal Raman imaging (WITec alpha500R confocal Raman microscope) with a 532nm laser and a
50x air objective (NA 0.55). The scan range was 8000µm in X and 2000µm in Y with 800x200 points
resolution. Each spectrum was integrated for 36ms. Fig. 6 shows the characteristic spectra of Calcite,
Fluorite and Quartz found in the sample. Integrating over, for example, the area marked in green in
Fig. D.6d results in a single value for each of the 160000 spectra and this can then be displayed as an
image as shown in Fig. D.6a for Quartz. Here brighter values indicate a higher integrated intensity of the
Quartz peak. The distribution of Quartz can thus be seen from this image. Other spectra of the same scan
show the characteristic features of Calcite or Fluorite (Fig. D.6d). Using these, the Calcite (Fig. D.6b) and
Fluorite (Fig. D.6c) images can easily be generated by using additional integral filters for the marked
regions. Other features of the spectra such as the width of peaks or their position can also easily be
evaluated by applying the corresponding filters.
Fig D.6: Spectra (d) and spectral images of Quartz (a), Calcite (b) and Fluorite (c) recorded from the diorite (a) and
the fracture fillings (b and c).
Further evaluation of the data allows the averaging of similar spectra (for which a cluster analysis is often
used) and the subtraction of, for example, pure spectra from mixed spectra to extract the spectra of the
various components. These spectra can then be used with the basis analysis, where each of the spectra
recorded are fitted with a linear combination of the basis spectra. The result of such an analysis is one
image for each basis spectra and these images can then be combined to generate a false color image
showing the distribution of all components in one image (Fig. D.7). Mixed areas are shown as the
corresponding mixed color and the spectra are color coded in the same way as the image.
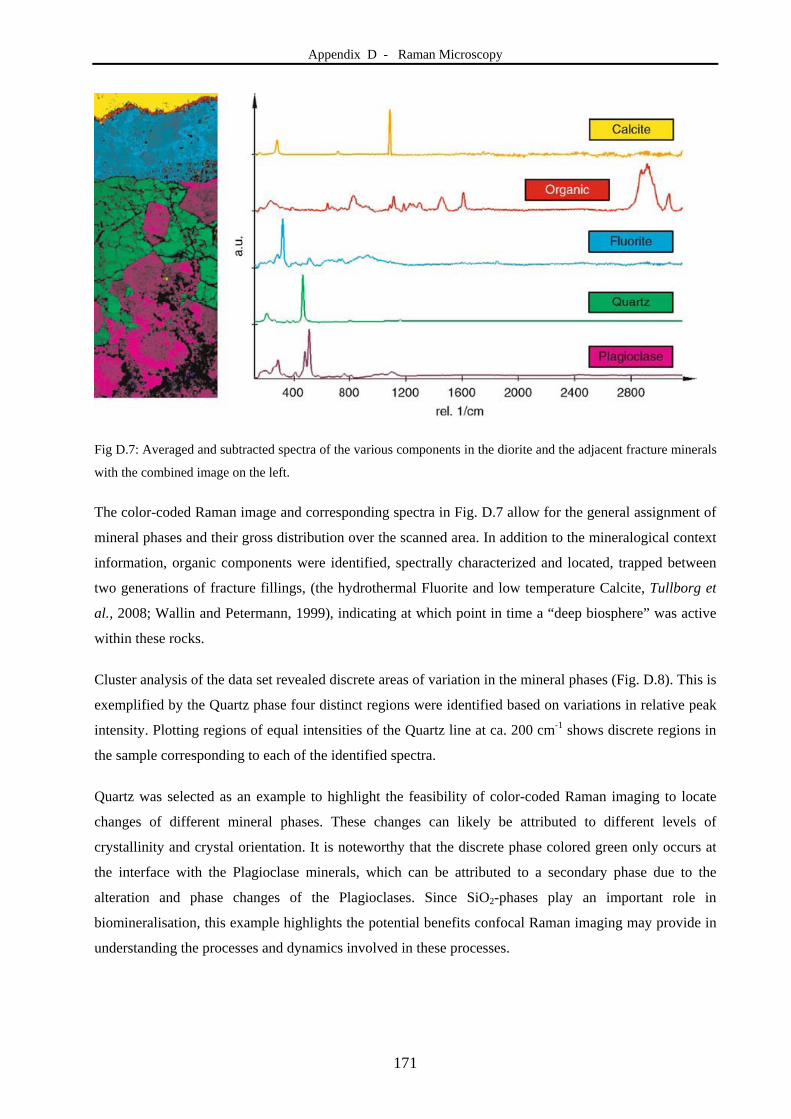
Appendix D - Raman Microscopy
171
Fig D.7: Averaged and subtracted spectra of the various components in the diorite and the adjacent fracture minerals
with the combined image on the left.
The color-coded Raman image and corresponding spectra in Fig. D.7 allow for the general assignment of
mineral phases and their gross distribution over the scanned area. In addition to the mineralogical context
information, organic components were identified, spectrally characterized and located, trapped between
two generations of fracture fillings, (the hydrothermal Fluorite and low temperature Calcite, Tullborg et
al., 2008; Wallin and Petermann, 1999), indicating at which point in time a “deep biosphere” was active
within these rocks.
Cluster analysis of the data set revealed discrete areas of variation in the mineral phases (Fig. D.8). This is
exemplified by the Quartz phase four distinct regions were identified based on variations in relative peak
intensity. Plotting regions of equal intensities of the Quartz line at ca. 200 cm-1 shows discrete regions in
the sample corresponding to each of the identified spectra.
Quartz was selected as an example to highlight the feasibility of color-coded Raman imaging to locate
changes of different mineral phases. These changes can likely be attributed to different levels of
crystallinity and crystal orientation. It is noteworthy that the discrete phase colored green only occurs at
the interface with the Plagioclase minerals, which can be attributed to a secondary phase due to the
alteration and phase changes of the Plagioclases. Since SiO2-phases play an important role in
biomineralisation, this example highlights the potential benefits confocal Raman imaging may provide in
understanding the processes and dynamics involved in these processes.
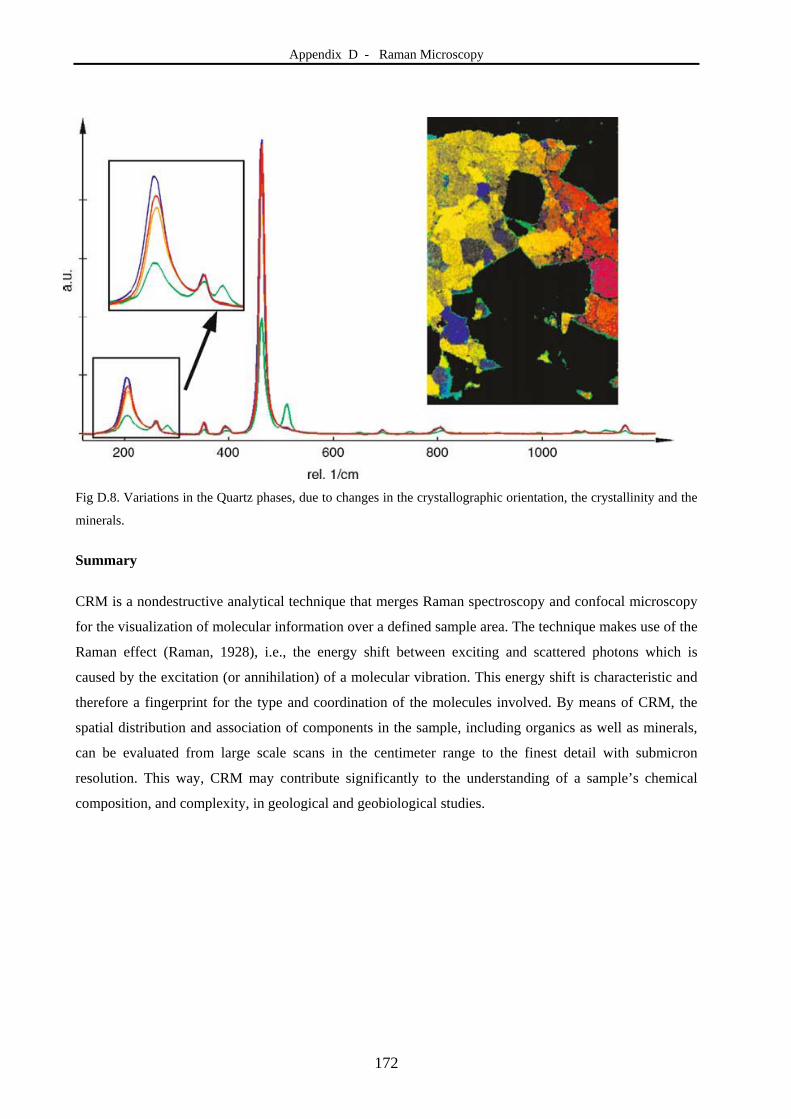
Appendix D - Raman Microscopy
172
Fig D.8. Variations in the Quartz phases, due to changes in the crystallographic orientation, the crystallinity and the
minerals.
Summary
CRM is a nondestructive analytical technique that merges Raman spectroscopy and confocal microscopy
for the visualization of molecular information over a defined sample area. The technique makes use of the
Raman effect (Raman, 1928), i.e., the energy shift between exciting and scattered photons which is
caused by the excitation (or annihilation) of a molecular vibration. This energy shift is characteristic and
therefore a fingerprint for the type and coordination of the molecules involved. By means of CRM, the
spatial distribution and association of components in the sample, including organics as well as minerals,
can be evaluated from large scale scans in the centimeter range to the finest detail with submicron
resolution. This way, CRM may contribute significantly to the understanding of a sample’s chemical
composition, and complexity, in geological and geobiological studies.
Appendix D - Raman Microscopy
173
References
Fries M, Steele A (2009) Raman spectroscopy and confocal Raman imaging in mineralogy and petrography. In
Dieing T, Hollricher O, Toporski J (eds.), Confocal Raman Microscopy. Springer, Heidelberg, 320p.
Hild S, Marti O, and Ziegler A, (2008) Spatial distribution of calciteand amorphous calcium carbonate in the cuticle
of the terrestrial crustaceans Porcellio scaber and Armadillidium vulgare. Journal of Structural Biology,
142, 100–108.
Ibach H, Lüth H (2003) Solid State Physics. An Introduction to Principles of Materials Science. Springer, Berlin,
501p.
Raman C (1928) A new radiation. Indian Journal of Physics, 2, 387.
Raman C, Krishnan K (1928) A new type of secondary radiation. Nature, 121, 501.
Smekal A G (1923) Zur Quantentheorie der Dispersion. Naturwissenschaften, 11, 873–875.
Tullborg E-L, Drake H, Sandström B (2008) Palaeohydrogeology: A method based on fracture mineral studies.
Applied Geochemistry, 23, 1881-1897.
Wallin B, Peterman Z (1999) Calcite fracture fillings as indicators of palaeohydrology at Laxemar at the Äspö Hard
Rock Laboratory, southern Sweden. Applied Chemistry, 14, 953–962.
Wilson T (1990) Confocal Microscopy. Academic Press, London, 448p.

174
175
CURRICULUM VITAE
Christine Nora Heim
Geburtstag und Geburtsort: 24.04.1979 Hannover, Deutschland
Nationalität: Deutsch
Promotionsstudium
2005 Seit 01.08.2005 Doktorandin und wissenschaftliche Mitarbeiterin in der Abteilung
Geobiologie des Geowissenschaftlichen Zentrums der Georg-August-Universität
Göttingen
Grund- und Hauptstudium
2005 Diplom in Geologie - Diplomarbeit in Zusammenarbeit der Universität Frankfurt mit
der Abteilung Marine Geochemie des Alfred-Wegener-Institutes für Polar- and
Meeresforschung. Titel der Arbeit: Die geochemische Zusammensetzung der
Sedimente im Aralsee und Sedimentationsprozesse während der letzen 100 Jahre.
2002 Vordiplom in Geologie
1999 – 2005 Studium der Geologie an der Johann-Wolfgang-Goethe-Universität Frankfurt/Main
1998 – 1999 Freiwilliges Soziales Jahr beim Rettungsdienst des Deutschen Roten Kreuzes in Fulda
Schulzeit
1989 – 1998 Gymnasium: Winfriedschule Fulda, Abschluss: Abitur
1985 – 1989 Grundschule in Fulda- Niesig