an integrated approach for real-time model-based state … · an integrated approach for real-time...
TRANSCRIPT

An integrated approach for real-time model-based state-of-chargeestimation of lithium-ion batteries
Zhang, C., Li, K., Pei, L., & Zhu, C. (2015). An integrated approach for real-time model-based state-of-chargeestimation of lithium-ion batteries. Journal of Power Sources, 283, 24-36. DOI: 10.1016/j.jpowsour.2015.02.099
Published in:Journal of Power Sources
Document Version:Peer reviewed version
Queen's University Belfast - Research Portal:Link to publication record in Queen's University Belfast Research Portal
Publisher rights© 2015 Elsevier. This manuscript version is made available under the CC-BY-NC-ND 4.0 license http://creativecommons.org/licenses/by-nc-nd/4.0/ whichpermits distribution and reproduction for non-commercial purposes, provided the author and sourceare cited.
General rightsCopyright for the publications made accessible via the Queen's University Belfast Research Portal is retained by the author(s) and / or othercopyright owners and it is a condition of accessing these publications that users recognise and abide by the legal requirements associatedwith these rights.
Take down policyThe Research Portal is Queen's institutional repository that provides access to Queen's research output. Every effort has been made toensure that content in the Research Portal does not infringe any person's rights, or applicable UK laws. If you discover content in theResearch Portal that you believe breaches copyright or violates any law, please contact [email protected].
Download date:29. May. 2018

Accepted Manuscript
An Integrated Approach for Real-time Model-based State-of-Charge Estimation ofLithium-ion Batteries
Cheng Zhang, Kang Li, Lei Pei, Chunbo Zhu
PII: S0378-7753(15)00344-4
DOI: 10.1016/j.jpowsour.2015.02.099
Reference: POWER 20727
To appear in: Journal of Power Sources
Received Date: 22 November 2014
Revised Date: 4 February 2015
Accepted Date: 17 February 2015
Please cite this article as: C. Zhang, K. Li, L. Pei, C. Zhu, An Integrated Approach for Real-time Model-based State-of-Charge Estimation of Lithium-ion Batteries, Journal of Power Sources (2015), doi:10.1016/j.jpowsour.2015.02.099.
This is a PDF file of an unedited manuscript that has been accepted for publication. As a service toour customers we are providing this early version of the manuscript. The manuscript will undergocopyediting, typesetting, and review of the resulting proof before it is published in its final form. Pleasenote that during the production process errors may be discovered which could affect the content, and alllegal disclaimers that apply to the journal pertain.

MANUSCRIP
T
ACCEPTED
ACCEPTED MANUSCRIPT
An Integrated Approach for Real-time Model-basedState-of-Charge Estimation of Lithium-ion Batteries
Cheng Zhanga, Kang Lia,∗, Lei Peib, Chunbo Zhub
aSchool of Electronics, Electrical Engineering and Computer Science, Queen’s UniversityBelfast, 125 Stramillis Road, Ashby Building, Belfast, BT9 5AH, UK
bSchool of Electrical Engineering and Automation, Harbin Institute of Technology, 92Xidazhi St., Harbin, 150001, China
Abstract
Lithium-ion batteries have been widely adopted in electric vehicles (EVs), and
accurate state of charge (SOC) estimation is of paramount importance for the
EV battery management system. Though a number of methods have been
proposed, the SOC estimation for Lithium-ion batteries, such as LiFePo4 bat-
tery, however, faces two key challenges: the flat open circuit voltage (OCV)
versus SOC relationship for some SOC ranges and the hysteresis effect. To ad-
dress these problems, an integrated approach for real-time model-based SOC
estimation of Lithium-ion batteries is proposed in this paper. Firstly, an auto-
regression model is adopted to reproduce the battery terminal behaviour, com-
bined with a non-linear complementary model to capture the hysteresis effect.
The model parameters, including linear parameters and non-linear parameters,
are optimized off-line using a hybrid optimization method that combines a meta-
heuristic method (i.e., the teaching learning based optimization method) and
the least square method. Secondly, using the trained model, two real-time
model-based SOC estimation methods are presented, one based on the real-
time battery OCV regression model achieved through weighted recursive least
square method, and the other based on the state estimation using the extended
Kalman filter method (EKF). To tackle the problem caused by the flat OCV-
versus-SOC segments when the OCV-based SOC estimation method is adopted,
∗Corresponding author: [email protected] (K. Li)
Preprint submitted to Journal of Power Source February 18, 2015

MANUSCRIP
T
ACCEPTED
ACCEPTED MANUSCRIPT
a method combining the coulombic counting and the OCV-based method is pro-
posed. Finally, modelling results and SOC estimation results are presented and
analysed using the data collected from LiFePo4 battery cell. The results con-
firmed the effectiveness of the proposed approach, in particular the joint-EKF
method.
Keywords: LiFePo4 battery, Real-time SOC estimation, Hysteresis effect,
Extended Kalman Filter, Weighted Recursive Least square, Teaching Learning
Based Optimization (TLBO) method
1. Introduction
Due to the imminent challenges of environment protection and the exhaus-
tion of non-renewable fossil fuels, electric vehicles (EVs) and hybrid electric
vehicles (HEVs) are rapidly gaining popularity worldwide in recent years as an
effort of replacing the internal combustion engine (ICE) vehicles to improve the5
fuel efficiency and reduce the emissions in the transport sector. Many countries
have proposed their national plans to increase the EV/HEV penetration in the
coming decades [1]. The battery system is a key component in the EV/HEV
system. Among different cell types, Lithium-ion batteries, such as LiFePo4
that is under investigation in this paper, are favoured power supplies for EVs10
and HEVs due to their high power and high energy densities, long service life,
high efficiency and environmental-friendly figures [2]. A battery management
system (BMS) is essential in EV/HEV applications for safe and efficient op-
eration where hundreds or even thousands of battery cells are connected in
series/parallel configuration to fulfil the high power and high voltage needs of15
the vehicles [3]. One key functionality of the BMS is to estimate the state-of-
charge (SOC) of the battery, which is not directly measurable. SOC indicates
the charge left in the battery available for further service, which determines the
remaining range an EV can travel without re-charging the battery. Battery SOC
indicator is similar to the fuel gauge in an ICE vehicle. Therefore accurate real-20
time SOC estimation is of great importance to prevent stranding halfway and to
2

MANUSCRIP
T
ACCEPTED
ACCEPTED MANUSCRIPT
relieve the range anxiety. Further, SOC estimation can be used for preventing
over-charging and over-discharging operations of the battery, thus reducing the
harm caused to the battery. Some EVs require to cycle the battery within a
specific SOC range, e.g., 20% to 70 %, to achieve higher efficiency and longer25
service life, which again relies on accurate SOC estimation. On the other hand,
inaccurate SOC estimation will result in an over-sized battery system, therefore
a significant increase of the overall cost of EVs.
Another application of SOC estimation is for battery cell balancing. There
are slight differences between different cells within the same pack, such as dif-30
ferent cell capacity or internal impedance. As time goes by, this difference will
become more and more significant [4]. The overall capacity of battery cells
connected in series is limited by the cell with the least capacity, and without a
balancing method this cell will be stressed more than other cells under the same
working condition, leading to a deteriorating unbalancing problem. Therefore35
cell balancing is another essential functionality of the BMS, and the cell SOC
can be used as an indicator for balancing the battery [3]. There are other ad-
vantages brought by accurate SOC estimation, such as accurate available power
estimation, and battery SOC estimation can also be used for developing power
and energy management strategies, etc.40
Despite the demanding necessity, accurate real-time SOC estimation is not
easy to acquire. First of all, all the estimation methods in the EV applications
should be based on the on-board measured signals, such as the battery terminal
voltage, load current and the temperature. Due to the high-voltage, high-current
and highly dynamic profile of the load, voltage and current measurements are45
often corrupted with noises. Besides, some SOC estimation methods, such as
the open circuit voltage (OCV) based methods, are sensitive to the voltage mea-
surement error. Secondly, the battery behaviour is highly non-linear and non-
stationary, and some internal chemical reactions, such as the parasitic reaction,
self-discharge and ageing process that affect the battery SOC, are extremely50
difficult to model.
Over the years, researchers have developed different SOC estimation meth-
3

MANUSCRIP
T
ACCEPTED
ACCEPTED MANUSCRIPT
ods [5, 6, 7, 8, 9, 10]. These methods can be generally divided into two groups:
direct measurement methods and model-based estimation methods. Direct
measurement methods, or model-free methods, estimate battery SOC by a di-55
rectly measurable physical property, such as coulombic counting method (or Ah
method) and OCV based methods. For model-based SOC estimation methods,
a model is firstly built to reproduce the battery terminal behaviour. Then the
battery SOC can be linked to one or several of the model parameters. After the
model parameters are identified, the battery SOC can be inferred. Another ap-60
proach is to model the battery behaviour using a state-space model with the bat-
tery SOC as one state, then different state estimation methods, such as Kalman
Filter (KF) and Unscented Kalman Filter (UKF), can be used for SOC esti-
mation. Direct measurement methods are generally open-loop methods. They
are easy to implement, but sensitive to current and voltage measurement errors.65
On the other hand, the model-based methods are generally close-loop methods
and not sensitive to measurement errors, but they rely on an accurate battery
model, which is difficult to acquire.
Further, the SOC estimation for Lithium-ion batteries faces two key chal-
lenges. Firstly, batteries like LiFePo4 show a flat OCV-versus-SOC curve within70
some SOC ranges, and therefore a small voltage measurement error can cause a
large SOC estimation error for the OCV-based SOC estimation methods. An-
other difficulty is that the battery shows a hysteresis effect, i.e., the battery
OCV depends on the direction of the load current, which needs to be consid-
ered during battery modelling and SOC estimation. To address these problems,75
an integrated approach for real-time model-based SOC estimation of Lithium-
ion batteries is proposed in this paper. The contributions of this paper are
summarized as follows. Firstly, a new battery model is proposed, including
an auto-regression relaxation model together with a non-linear complementary
model to capture the hysteresis effect. Secondly, the model parameters are di-80
vided into two groups, namely the linear parameters and the non-linear parame-
ters, and a hybrid optimization method that combines a meta-heuristic method
(i.e., the teaching learning based optimization (TLBO) method) and the least
4

MANUSCRIP
T
ACCEPTED
ACCEPTED MANUSCRIPT
square method is used to optimize the two distinctively different sets of param-
eters. This leads to a high modelling accuracy. Thirdly, based on the off-line85
trained model, two real-time SOC estimation methods are then proposed us-
ing the weighted recursive least square (WRLS) method and the Kalman Filter
method, respectively. Finally, to tackle the problem caused by the flat OCV-
versus-SOC curve of Lithium-ion batteries, a new method combining coulombic
counting method and OCV-based method is also proposed.90
The rest of this paper is organized as follows. Section II presents a brief in-
troduction to different SOC estimation methods, including direct measurement
methods and model-based methods. The battery test system and the test data
used in this paper are presented in section III. Then the auto-regression model is
presented in section IV, together with the hysteresis model. The model parame-95
ters are optimized using TLBO and least square method. The modelling results
are then presented. The two different model-based SOC estimation methods
are given in section V, and the SOC estimation results are analysed in section
VI. Finally, section VII concludes this paper.
2. Different SOC estimation methods100
2.1. Direct measurement methods
Based on the onboard measurable signals, i.e., battery terminal voltage and
current, there are two popular direct measurement methods for SOC estimation,
i.e., coulombic counting method (or Ah method, Ah stands for Ampere-hour,
which is the unit of battery capacity) and OCV-based method.105
2.1.1. Ah method
The Ah method is to integrate the discharging current to calculate the re-
maining charge in the battery, as follows.
SOC(k) = SOC(0)− T
Cn
∫ k
0
(η ∗ i(t)− Sd)dt (1)
where SOC(0) is the initial SOC, Cn the nominal capacity of the battery, T is
the sampling period, i(t) is the load current at time t, η is coulombic efficiency,
5

MANUSCRIP
T
ACCEPTED
ACCEPTED MANUSCRIPT
and Sd is the self-discharging rate. For LiFePo4 battery used in this experiment,
η > 0.994 under room temperature [11]; according to the manufacturer, the110
battery self-discharging rate is less than 5% per month. Therefore, η = 1 and
Sd = 0 are assumed in this paper.
Based on the on-board measured current signals, it seems straightforward to
apply Ah method for SOC estimation. However, this is an open-loop method,
and is vulnerable to the current measurement error, especially the sensor drift115
error. Therefore, the Ah method needs to be calibrated periodically. Further,
the initial SOC, SOC(0), has to be determined accurately by other method. If
the battery is fully charged periodically, then SOC(0) can be calibrated to 100%
after a fully charging procedure. However, during shadow cycle discharging
when the battery is cycled within a limited SOC range, e.g., 30% – 70%, it is120
not easy to calibrate the initial SOC.
2.1.2. OCV-based method
The OCV method relies upon the relationship between battery OCV and
SOC. Battery OCV is the battery terminal voltage when the battery internal
equilibrium is reached in the absence of load. There exists a stable one-to-one125
relationship between battery OCV and SOC, if the temperature effect and hys-
teresis are not considered [12]. Battery OCV voltage is slightly affected by the
battery temperature [13]. If the battery is operated under different temperature
conditions, temperature effect on OCV should be taken into consideration [14].
However, in this paper, the test is operated under constant temperature, and130
we assume that the battery pack temperature in EV/HEV is well controlled by
the temperature management system, therefore temperature effect on OCV is
not considered in this paper.
The hysteresis effect arises as the battery relaxes to a voltage value higher
than the OCV for a given SOC after charging, and to a lower value than the OCV135
after discharging, even after sufficient relaxation time, as shown in Fig 1. The
battery OCV is taken as the mean of the charging OCV and discharging OCV,
while the hysteresis is calculated as half the difference between the charging
6

MANUSCRIP
T
ACCEPTED
ACCEPTED MANUSCRIPT
OCV and the discharging OCV [15]. The hysteresis effect in Li-ion batteries
is generated due to the thermodynamic entropic effects, mechanical stress, and140
microscopic distortions within the active electrode materials during Lithium
insertion/extraction [16]. LiFePo4 batteries show significant hysteresis effect
[17, 18], as can be seen in Fig 1. Therefore, a hysteresis model is essential for
accurate SOC estimation for LiFePo4 batteries when OCV based methods are
used.145
Figure 1: Hysteresis effect of the LiFePo4 cell used in this paper
As mentioned above, the Ah method needs to be calibrated periodically.
Based on the onboard measured voltage signals, it is a natural choice to use
battery OCV for calibration. However, it takes very long time (more than 1
hours) for the battery terminal voltage to stabilize. To tackle this problem,
researchers have proposed several model-based methods to estimate battery150
OCV in real-time [19]. Another problem is that the LiFePo4 battery used in
this experiment shows a very flat OCV-SOC curve during two SOC segments,
one from 70% to 90% SOC and another from 30% to 50% SOC, as shown in
Fig 1, making it extremely difficult to accurately estimate battery SOC using
OCV-based method during these two SOC ranges. This effect will be detailed155
in the following section.
7

MANUSCRIP
T
ACCEPTED
ACCEPTED MANUSCRIPT
2.1.3. Other direct measurement methods
There are other battery properties which can be used for SOC estimation,
such as battery impedance [20, 21] and magnetism measurement [22]. Battery
impedance is measured by generating a small AC current to flow through the160
battery under investigation, and the AC voltage response is recorded. Then the
complex impedance of the battery can be calculated by a FFT analyser. The
frequency of the AC current signal sweeps from mHz (sometimes µHz) to several
kHz [23]. The measured impedance in a range of frequency is referred to as the
electrochemical impedance spectroscopy (EIS). However, specific equipments,165
such as a signal generator or potentiostat, are required by these methods, making
it impractical for real-time EV applications.
2.2. Model-based method
There are different model-based SOC estimation methods that use different
types of battery models. Electrochemical models (or physical model, white-box170
model) adopt physical laws, such as the porous electrode theory that governs
the battery electrochemical processes, to describe battery behaviour. This is the
most accurate battery model and can be used to estimate battery SOC [24, 25].
However, Electrochemical models are very complex and involve partial differ-
ential equations which are difficult to solve and analyse for real-time purposes.175
Besides, the model parameters are related to the electrochemical structure of
the battery, which can be difficult to obtain. Based on the electrochemical
model, researchers proposed reduced-order models by introducing more approx-
imations, such as the volume averaging method, for model simplification and
SOC estimation [24, 26, 27].180
There are also different SOC estimation methods based on a simpler battery
model, such as a linear equivalent circuit model (ECM) [28, 29]. A linear ECM
uses a combination of electric elements, such as a voltage source, resistors and
capacitors, to model the battery behaviour, as shown in Fig 2, where OCV
represents the battery OCV that depends on battery SOC, Ri the internal185
resistance. The RC networks are used to capture the battery relaxation effect.
8

MANUSCRIP
T
ACCEPTED
ACCEPTED MANUSCRIPT
The ECM model enjoys a simple and interpretable structure, thus suitable for
on-line applications.
Figure 2: Linear equivalent circuit model
Many SOC estimation methods based on black-box models have been pro-
posed, such as neural networks [30, 31], fuzzy logic [32], support vector machine190
[33], etc. There are also many combined methods for SOC estimation to make
full use of the advantages of different methods [34].
In this paper, we particularly investigate the SOC estimation of Lithium-ion
batteries for real-time applications.
3. Test Data195
A 5-Ah LiFePo4 battery was tested under room temperature (25 ◦C) with
Arbin BT2000 battery test system. The voltage and current measurement ac-
curacy are up to 0.02% full scale range (FSR) for low power applications and
0.05% FSR for high power applications. The temperature is maintained by a
temperature chamber. Three different procedures were tested on the battery,200
namely, the Hybrid Pulse Power Characterization (HPPC) discharging test,
HPPC charging test and the Federal Urban Drive Schedule (FUDS) test. The
load current is positive for discharging and negative for charging.
During the HPPC discharging test, the battery is firstly fully charged to
100% SOC. Then the battery goes through ten discharging segments, as shown205
in Fig 3. One augmented part of the HPPC test data is shown in Fig 4, where
9

MANUSCRIP
T
ACCEPTED
ACCEPTED MANUSCRIPT
the starting two large current pulses, i.e., the first 10-second 25 A discharg-
ing current and the second 10-second 17.5 A charging current, are applied to
test the battery’s capacity of supporting large discharging and charging power,
respectively. The following 5 A discharging pulse for 360 seconds reduces the210
battery SOC by 10%.
The HPPC charging test data is shown in Fig 5, with one segment augmented
in Fig 6. As can be seen in Fig 6, the battery is firstly discharged using a 10-
second 25 A load current, and then charged by a 10-second 17.5 A current. The
following 5 A charging current that lasts for 360 second is applied to increase215
the battery SOC by 10%.
As can be seen in Fig 4, after the load current disappears, the battery
terminal voltage relaxes gradually to a stable value, which is referred to as
the relaxation effect. The battery is rested for one hour after each test segment,
and the voltage at the end of the rest time is taken as the battery discharging220
OCV at that SOC point. The battery charging OCV is calculated in the same
way using the HPPC charging data shown in Fig 6. Battery OCV is taken as the
mean value of the charging and discharging OCV, as shown in Fig 1 and in Table
1. As can be seen in Table 1, from 90% SOC to 70% SOC, the battery OCV is
only reduced by 1.6 mV, while in practical EV/HEV management system, the225
voltage measurement accuracy is usually about 5 mV. Therefore it is extremely
difficult to achieve reliable SOC estimation using OCV-based methods during
this SOC range. Therefore, the model-based SOC estimation is only considered
during 10 - 70% SOC range.
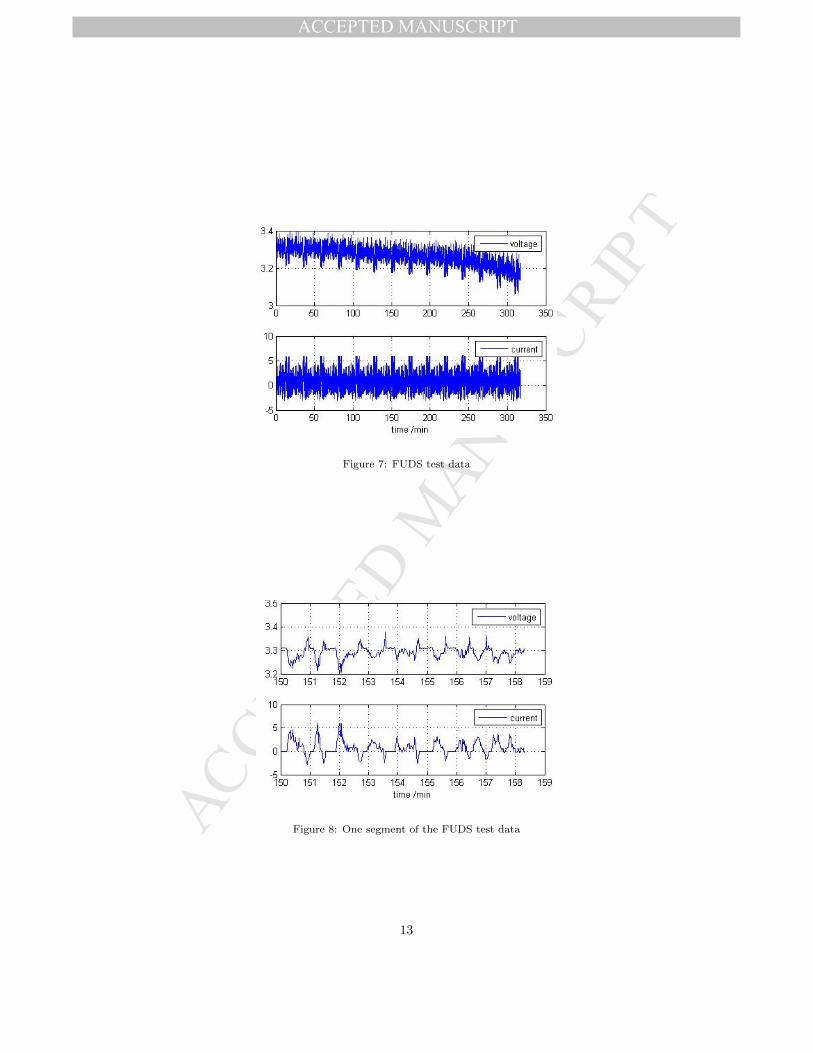
The FUDS test shown in Fig 7 is to simulate the load profile of urban230
city driving, including acceleration and regenerative break, with one augmented
segment shown in Fig 8.
The test data under 10-90% SOC range are shown in Fig 3 to Fig 7.
10

MANUSCRIP
T
ACCEPTED
ACCEPTED MANUSCRIPT
Table 1: Battery mean OCV vs SOC
SOC /% 10 20 30 40 50
OCV /V 3.2176 3.2663 3.2955 3.3022 3.3056
SOC /% 60 70 80 90
OCV /V 3.3226 3.3385 3.3390 3.3401
Figure 3: HPPC discharging test data
Figure 4: One segment of the HPPC discharging test data
11

MANUSCRIP
T
ACCEPTED
ACCEPTED MANUSCRIPT
Figure 5: HPPC charging test data
Figure 6: One segment of the HPPC charging test data
12
MANUSCRIP
T
ACCEPTED
ACCEPTED MANUSCRIPT
Figure 7: FUDS test data
Figure 8: One segment of the FUDS test data
13

MANUSCRIP
T
ACCEPTED
ACCEPTED MANUSCRIPT
4. Modelling
Before presenting the SOC estimation method, the equations governing the235
model together with the model parameter identification method are given as
follows.
4.1. Hysteresis model
As mentioned above, a hysteresis model is essential for the SOC estimation
of LiFePo4 batteries using OCV based method, yet a model that explains the
electrochemical causes of the hysteresis effect is too complex to use. Plett [28]
proposed a first-order hysteresis model, as follows,
Vh(k + 1) =exp(−|γ ∗ i(k)|) ∗ Vh(k)+
(1− exp(−|γ ∗ i(k)|)) ∗ sign(i(k)) ∗Mh
(2)
where Vh(k) is the hysteresis voltage, i(k) is the current, γ a coefficient, and Mh
is the maximum hysteresis voltage which depends on battery SOC and current
rate, and
sign(i(k)) =
1, if i(k) > ε
−1, if i(k) < −ε
sign(i(k − 1)), otherwise
where ε is a small threshold value.
According to Eq (2), the battery hysteresis voltage is limited between −Mh240
and Mh, and reaches the limit faster under a larger load current. A constant
Mh is adopted in this paper.
4.2. AR model to capture the relaxation effect
Several equivalent circuit models (ECMs) using a series of RC networks as
shown in Fig 2 are widely adopted for capturing the battery relaxation effect,
and the model parameters bear certain physical interpretations. For example,
the resister Ri stands for the battery internal resistance. While ECMs enjoy
high interpret-ability, on the other hand, it is this physical interpretation that
imposes restrictions on the choice of values for these model parameters. For
14

MANUSCRIP
T
ACCEPTED
ACCEPTED MANUSCRIPT
example, all the model parameters for an ECM, e.g., Ri, Ci, have to be positive
(i.e., it is unreasonable to assume a negative resistor or negative capacitor in an
electric circuit model). This restriction on model parameters will however lead
to a limited model fitting performance. Further, some model parameters, such
as these RC network time constants, e.g., t = Ri ∗Ci, are nonlinear parameters
that have to be optimized using complex optimization methods, such as genetic
algorithm [29], which will inevitably increase the computational expense. To
overcome this limitation and improve the model fitting accuracy, a more general
auto-regression AR(m,n) model is adopted in this paper, as shown in Fig 9. The
governing equation of the relaxation model is
Vr(k) = Σmi=1ai ∗ Vr(k − i) + Σni=1bi ∗ i(k − i) + e(t) (3)
where Vr is the battery relaxation voltage, i.e., the over-potential across the
AR model, and e(k) is the error term. Although the interpret-ability of the RC245
networks in the ECM in Fig 2 is lost and the parameters in the AR model, i.e.,
ai, bi bear no physical meanings, yet on the other hand the generic AR model
is capable of capturing unmodelled dynamics of the battery terminal behaviour
by the RC networks model.
Figure 9: Battery model with AR(m,n) instead of RC networks
4.3. Model identification250
According to the model in Fig. 9,
Vr(k) = OCV (SOC(k))− Vh(k)− v(k)−Ri ∗ i(k) (4)
15

MANUSCRIP
T
ACCEPTED
ACCEPTED MANUSCRIPT
where v(k) is the measured battery terminal voltage, and Ri stands for the
battery internal resistance.
Let
va(k) = OCV (SOC(k))− Vh(k)− v(k) (5)
and substitute Eq (5) and Eq (4) into Eq (3), we have
va(k) =Σmi=1ai ∗ va(k − i) +Ri ∗ i(k)
+ Σni=1(bi − ai ∗Ri) ∗ i(k − i) + e(t)(6)
The objective function that is to be optimized is
SSE = ΣNi=1e2(t) (7)
while N is the number of data samples used for model training.
Once the measurements of battery terminal voltage and current, i.e.,v(k), i(k),255
become available, SOC(k) can be calculated by Ah method under the labora-
tory testing conditions, then OCV (SOC(k)) by linear interpolation method
using the OCV vs SOC curve recorded in Table 1; Vh can be calculated by Eq
(2) after Mh, γ are determined. The initial hysteresis voltage, Vh(1), depends
on the previous load history. In another word, Vh(1) = Mh if the battery was260
discharged previously, and Vh(1) = −Mh if the battery was charged previously.
The model parameters that need to be optimized include
θ = [a, b, γ,Mh, Ri] (8)
where
a = [a1, a2, ..., am]
b = [b1, b2, ..., bn]
This is a non-linear optimization problem, as the γ and Mh in Eq (2) are
non-linear parameters. The Gradient or Hessian information are very difficult
to calculate, therefore a heuristic method, namely teaching-learning-based op-
timization (TLBO) proposed by Rao et al [35], is adopted in this paper for265
model parameter optimization. TLBO method is a population based method
16

MANUSCRIP
T
ACCEPTED
ACCEPTED MANUSCRIPT
that simulates the teaching and learning process in a class. The optimization
procedure includes two phases: teacher phase when all the students learn from
the teacher (elect the the best student as the teacher), and student phase when
the students learn from each other. This optimization algorithm is easy to im-270
plement as there is no specific tuning parameters that need to be adjusted by
the user.
Note that after γ and Mh are determined, va can be calculated as in Eq
(5), then according to Eq (6), the rest parameters, i.e., Ri, a, b, can be opti-
mized using least square method. Therefore, to improve the parameter training275
efficiency, a hybrid parameter optimization method, namely TLBO plus least
square, is used for model training. In another word, the TLBO method is used
for non-linear parameter optimization, while the linear parameters are optimzed
by the least square method, and the least square method is nested in the TLBO
optimization procedure. Therefore, only the two non-linear parameters γ and280
Mh need to be optimized by the TLBO method, and the searching space is sig-
nificantly reduced. Beside, the linear parameters Ri, a, b are always kept optimal
by using the least square method during the whole model training procedure,
which is another advantage of adopting this AR(m,n) model other than the
conventional RC circuit model.285
The model order selection, i.e, m,n, is a trade-off between model complexity
and accuracy. The HPPC discharging and charging test data are used for model
training, and the FUDS test data are used for model validation. The modelling
root mean square error with respect to the model order is shown in Fig 10. As
can be seen, as the model order increases from one to three, both the training290
error and the validation error are reduced noticeably. However, further increas-
ing the model order does not bring about any significant improvement on the
model accuracy. Accordingly, m = n = 3 is selected.
The model parameter optimization procedure is illustrated in Fig 11.
17

MANUSCRIP
T
ACCEPTED
ACCEPTED MANUSCRIPT
Figure 10: modelling training and validation error with respect to model order
4.4. Modelling results295
Two test data sets, the HPPC discharging and HPPC charging data, were
used for model training, and the FUDS test data was used for model validation.
Note that only the test data within 10% - 70% SOC range were used for battery
model training and validation. The model training results are shown in Fig 12
using HPPC discharging data and Fig 13 using HPPC charging data.300
As can be seen, the model outputs match the measured data closely except
for a couple of error spikes. The root mean square error is 2.16 mV for HPPC
discharging data, and 2.05 mV for HPPC charging data. Consider that the
battery voltage changes between 3.0 V and 3.4 V, the modelling error is less
than 0.1% of the battery voltage.305
The FUDS data were used for model validation. The root mean square error
is 6.1 mV, about 0.2% of the battery voltage. For illustration purpose, only a
part of the validation result is shown in Fig 14. As can be seen, the validation
error reminds small except for several spikes.
Those error spikes occur when the load current changes suddenly, or when310
the load current changes from charging to discharging. These error spikes can
be caused by that the simple battery model is not sufficient to capture all the
non-linearity of the battery behaviour.
Finally, the model parameters are listed in Table 2.
18

MANUSCRIP
T
ACCEPTED
ACCEPTED MANUSCRIPT
Figure 11: Flowchart of the hybrid parameter optimization method
19

MANUSCRIP
T
ACCEPTED
ACCEPTED MANUSCRIPT
Table 2: Identified AR model parameters
Parameter Value
γ 8.12 E-4
Mh 0.0307
Ri 0.0143
a1 0.4091
a2 0.3104
a3 0.2356
b1 5.965 E-4
b2 2.061 E-4
b3 -2.098 E-4
Figure 12: Modelling results using HPPC discharging data
20

MANUSCRIP
T
ACCEPTED
ACCEPTED MANUSCRIPT
Figure 13: Modelling results using HPPC charging data
Figure 14: Model validation results using FUDS test data
21

MANUSCRIP
T
ACCEPTED
ACCEPTED MANUSCRIPT
5. Real-time model-based SOC estimation315
Based on the trained model, two types of real-time SOC estimation methods
are presented in this section. The first method takes battery OCV as a model
parameter which is identified in real-time using WRLS method, then battery
SOC is inferred by a lookup table, i.e., Table 1. This method is combined with
the Ah method to provide a weighted SOC estimation result. The second one320
formulates the ECM into a state-space model, and the battery SOC is taken as
a state. Then EKF and joint-EKF method are adopted for SOC estimation.
5.1. Parameter identification based SOC estimation
The aim of this method is for real-time estimation of the battery OCV. As
mentioned before, based on the on-board measured voltage and current signals,325
Ah method can be used to estimate the SOC; on the other hand, based on the
identified model, battery OCV can be inferred in real-time, which will be used
to compensate the Ah method.
By substituting Eq (4) into Eq (3) we have
OCV (SOC(k))− Σmi=1ai ∗OCV (SOC(k − i)) =
v(k) + Vh(k) +Ri ∗ i(k) + Σni=1bi ∗ i(k − i)
− Σmi=1ai ∗ (v(k − i) + Vh(k − i) +Ri ∗ i(k − i)) + e(k)
(9)
Now take OCV (SOC) as a time varying parameter, as θocv = OCV (SOC(k)).
Apparently, θocv changes as the discharging continues. If a 5 A discharging
current is applied to a 5 Ah battery, it takes one hour (3600 seconds) for
the battery to evolve from fully charged to fully discharged, i.e., for θocv to
change from about 3.4 V to 3.0 V. Consider that the sampling period used
in the test is T = 1s, therefore θocv varies slowly with time. Assumed that
θocv = OCV (SOC(k)) ' OCV (SOC(k − i)), i = 1, 2, ...,m, then Eq (9) can be
reformulate as
(1− Σmi=1ai) ∗ θocv = u(k) + e(k) (10)
22

MANUSCRIP
T
ACCEPTED
ACCEPTED MANUSCRIPT
Table 3: Procedure of WRLS
Problem formulation:
y(k) = ϕ(k) ∗ θ + η(k)
where ϕ(k) is the regressing vector, and θ the parameter
vector to be identified,η(k) the modelling error
Initialize
θ(0), P (0) = E{(θ(0)− θ)(θ(0)− θ)T };
determine the forgetting factor λ
For k = 1,2,3 ...,
1) prediction error:
e(k) = y(k)− ϕT (k) ∗ θ(k − 1)
2) gain:
K = P (k−1)∗ϕ(k)λ+ϕ(k)T ∗P (k−1)∗ϕ(k)
3) update
θ(k) = θ(k − 1) +K ∗ e(k)
P (k) = 1λ (P (k − 1)−K ∗ ϕ(k)T ∗ P (k − 1))
where u(k) stands for all the right hand side terms in Eq (9) excluding e(k).
After the battery terminal voltage and current measurement become available,330
u(k) can be calculated, then θocv can be deduced in real-time.
Since θocv is a time-varying parameter, the WRLS method is adopted for
this parameter estimation. Refer to [36] for details of WRLS method and [37]
for a generalize recursive least square parameter identification method. The
implementation of WRLS is detailed in Table 3. In this case, there is only one335
constant regressor, i.e., ϕ = (1 − Σmi=1ai) and one parameter, i.e., θocv to be
estimated.
The procedure of SOC estimation using WRLS method is shown in Fig 15
and summarized as follows,
23

MANUSCRIP
T
ACCEPTED
ACCEPTED MANUSCRIPT
1. Initialize SOCe(0), the initial estimated SOC; then initialize the WRLS340
parameters θocv and P (0) in Table 3,
2. For k = 1,2,3,..., after new measurements, v(k), i(k) become available:
a) Use Ah method to update battery SOC as follows,
SOCi(k + 1) = SOCe(k)− i(k) ∗ T/Cn
Note that SOCi is updated based on previously estimated SOC, SOCe(k),
not SOCi(k).
b) Update battery hysteresis voltage Vh(k) in Eq (2), then u(k) as in Eq345
(9). Then apply WRLS method to estimate θocv(k+1) (thusOCV (SOCk+1))
using Eq (10).
c) Based on this estimated OCV (SOCk+1), a SOC value can be obtained,
i.e., SOCv(k + 1), by linear interpolation method using Table 1.
3) The weighted average between SOCi(k + 1) and SOCv(k + 1) is used
to update battery SOC estimation as follows,
SOCe(k + 1) = w ∗ SOCi(k + 1) + (1− w) ∗ SOCv(k + 1) (11)
Figure 15: SOC estimation method using WRLS method
5.2. State-spcae based SOC estimation method350
The transfer function that governs the AR(m,n) model, i.e., Eq (3), can be
converted into a state-space formulation as follows,
xar(k + 1) =Aar ∗ xar(k) +Bar ∗ i(k)
Vr(k) =Car ∗ xar(k)(12)
where
xar(k) = [x1(k), x2(k), x3(k)]T
24

MANUSCRIP
T
ACCEPTED
ACCEPTED MANUSCRIPT
Aar =
0 1 0
0 0 1
a3 a2 a1
Bar = [0, 0, 1]T
Car = [b3, b2, b1]T
Combining Eq (2), and Eq (1), and Eq (4), the overall equations governing
the model in Fig (9) can be formed into a state-space representation as follows,
x(k + 1) = A(k) ∗ x(k) +B(k) (13)
v(k) = OCV (SOC(k))− Car ∗ xar(k)− Vh(k)−Ri ∗ i(k) (14)
where
x(k) = [SOC(k), xar(k), Vh(k)]T
A(k) =
1 0 0 0 0
0 0 1 0 0
0 0 0 1 0
0 a3 a2 a1 0
0 0 0 0 a5,5
,
B(k) = [−T/Cn ∗ i(k), 0, 0, i(k), b5]
a5,5 = exp(−γ ∗abs(i(k))), and b5 = (1− exp(−γ ∗abs(i(k)))) ∗ sign(i(k)) ∗Mh.
This is a standard state space formulation, with Eq (13) as the state equa-
tion, Eq (14) as the output equation, and the battery SOC is one of the model355
states.
Here,different state estimation methods can be applied for real-time battery
SOC estimation, such as extended Kalman filter (EKF) [38], unscented Kalman
Filter (UKF) [15], adaptive Kalman filter [39], slide mode observer [40] and H∞
filter [41], etc.360
25

MANUSCRIP
T
ACCEPTED
ACCEPTED MANUSCRIPT
Kalman filter has been widely applied for on-line state estimation of linear
system in various applications. Kalman Filter works in a prediction-correction
way. The state is firstly predicted using the state equation. Once a new mea-
surement becomes available, the prediction error is used to correct the state
prediction. To extend its application to non-linear systems, extended Kalman365
filter (EKF) is proposed which firstly linearises the system at the current oper-
ating point using first-order Taylor series, then KF can be applied.
As mentioned above, battery internal resistance, Ri, varies with battery
SOC, therefore Ri can be taken as a time-varying parameter, or an extra state.
Plett [38, 15] proposed using two different methods, joint state estimation or
dual state and parameter estimation, to track both battery state and time-
varying model parameters in real-time. The joint state estimation method is
adopted in this paper, i.e., to treat Ri as another state as follows,
Ri(k) = Ri(k − 1) + nr
where nr is assumed to be independent white Gaussian noise, and E{nr ∗nTr } =
QR.
It is straightforward to add Ri into the state equation in Eq (13) to form an
augmented state vector. Then the system parameters will change as follows,
xa(k) =[xT (k), Ri(k)]T
Aa =blkdiag(A, 1)
Ba =[B, 0]T
(15)
Note that the output equation in Eq (14) keeps unchanged.370
In this paper, the OCV (SOC(k)) in Eq (14) is a linear-interpolation func-
tion using the data recorded in Table 1. To apply EKF and joint-EKF for state
estimation, the derivative of OCV (SOC(k)) with respect to SOC(k) is calcu-
lated as follows. The derivative at 15%, 25%,..., and 65% are calculated as the
slope of the corresponding segment of the OCV vs SOC curve recorded in Table375
1, and the results are listed in Table 4. For example, the derivative at 15% SOC
is calculated as the slope of the OCV vs SOC curve during 10% to 20% SOC
26

MANUSCRIP
T
ACCEPTED
ACCEPTED MANUSCRIPT
Table 4: Calculate of d(OCV (SOC(k))/dSOC(k)
SOC % 15 25 35 45 55 65
dOCV/dSOC 0.484 0.293 0.0671 0.0331 0.170 0.159
range. The derivative of OCV (SOC(k)) with respect to SOC(k) at other SOC
points are defined as the linear interpolation of Table 4.
The implementation procedure of EKF is depicted in Table 5.380
6. Results and discussions
In total, three different SOC estimation methods are compared in this sec-
tion, one parameter identification based method, i.e., WRLS method, and two
state estimation based methods, i.e., EKF and joint-EKF methods. Two differ-
ent situations are considered, one with correct SOC initial value and the other385
with 20% initial error.
6.1. WRLS based method
The WRLS-based SOC estimation method is applied to the FUDS test data.
Generally speaking, the choice of the forgetting factor in WRLS depends on the
change rate of the estimated variables or state. If the variables change slowly390
with time, a large forgetting factor should be applied as more data samples can
be used for generating the estimations. In this study, the average load current of
the FUDS test data is about 1 amps, and the sampling time interval is 1 second.
So it takes about 900 data samples to reduce the battery SOC by 5%. Thus, the
battery OCV, i.e, the estimated parameter changes slowly with time. On the395
other hand, the weight w in Eq (11) determines the correction rate of the OCV
based SOC estimation to the Ah method. Therefore, when the OCV based SOC
estimation is reliable, larger weight should be adopted on the OCV estimation.
On the other hand, for ranges where the OCV based SOC estimation is not very
reliable, e.g., during the flat OCV range, smaller weight should be put on the400
OCV based SOC correction. Given this above consideration, a variable weight
27

MANUSCRIP
T
ACCEPTED
ACCEPTED MANUSCRIPT
Table 5: Procedure of EKF
Problem formulation:
state equation:
x(k + 1) = f(x(k), u(k)) + w(k)
output equation:
y(k) = g(x(k), u(k)) + v(k)
w(k) and v(k) are assumed to be independent Gaussian noise, and
E(w(k)wT (k)) = Q(k), E(v(k)vT (k)) = R(k)
Calculate:
A(k) =∂f(x, u)
∂x|x=x(k)
C(k) =∂g(x, u)
∂x|x=xp(k)
Initialize
x(0), Σ(0) = E{(x(0)− x(0))(x(0)− x(0))T }
For k = 1,2,3,...
1) prediction:
xp(k + 1) = f(x(k), u(k))
prediction covariance:
Σp(k + 1) = A(k) ∗ P (k) ∗AT (k) +Q(k)
2)correction:
prediction error:
e(k + 1) = y(k + 1)− g(xp(k + 1), u(k + 1))
gain:
K = Σp(k + 1) ∗ CT (k + 1)∗
(C(k + 1) ∗ Σp(k + 1) ∗ CT (k + 1) +R(k))−1
update:
x(k + 1) = xp(k + 1) +K ∗ e(k + 1)
Σ(k + 1) = (I −K ∗ C(k + 1)) ∗ Σp(k + 1)
28

MANUSCRIP
T
ACCEPTED
ACCEPTED MANUSCRIPT
is preferable for the method combining both Ah method with OCV based SOC
estimation. In the following section, we first choose w=0.95, and then discuss
the impact of variable weight w on the estimation performance.
The estimation results with a 20% initial SOC estimation error are depicted405
in Fig 16, and with correct initial SOC estimation in Fig 17.
Figure 16: SOC estimation results using WRLS with 20% initial estimation error
Figure 17: SOC estimation results using WRLS with correct initial SOC
As can be seen in Fig 16, the SOC estimation error converges from 20% to
within 5% in about five minutes, which proved the effectiveness of this OCV-
based compensation method. The error at the starting stage in Fig 17 might be
caused by the incorrect initial guess of the hysteresis voltage, i.e., Vh(0), which410
faded away in couple of minutes.
However, in both Fig 16 and Fig 17, large SOC estimation errors occur
29

MANUSCRIP
T
ACCEPTED
ACCEPTED MANUSCRIPT
during 50% - 30% SOC range. It is because the battery OCV vs SOC curve is
so flat during this SOC range that it is very difficult to provide correct SOC
estimation using the noisy estimated battery OCV value. As can be seen in415
Table 1, battery OCV only drops 3.4 mV and 6.7 mV when battery SOC is
reduced from 50% to 40%, and from 40% to 30 %, respectively.
Under the laboratory test condition, the battery SOC can be directly cal-
culated by the Ah method, then the battery OCV can be obtained by linear
interpolation method using the OCV vs SOC relation as listed in Table 1, and420
the resultant OCV data is called ’real OCV ’ in this paper. Note that the ’real
OCV ’ is calculated using the average of the charging and discharging battery
OCV values. The difference between the estimated battery OCV using WRLS
method and the ’real OCV ’ is depicted in Fig. 18. The battery SOC is correctly
initialized.425
As it is shown in Fig 18, the estimated battery OCV is very close to the
’real OCV ’. As a matter of fact, the estimated OCV error keeps below 5 mV
for most of the time. However, because of the flat slope of the OCV vs SOC
curve, 5 mV error in the estimated OCV can cause up to 7.5% SOC estimation
error during the 30% -40% SOC range, and more than 10% SOC estimation430
error during 40% - 50% SOC range using linear interpolation of Table 1. On
the other hand, 5 mV OCV estimation error can only cause about 1% SOC
estimation error during 10% - 20% SOC range.
A practical way to tackle this problem is to reduce the weight of SOCv in Eq
(11) when SOCv lies between 30% and 50 % SOC, i.e., reduce the compensation435
effect when the OCV-based correction is not so reliable. Let w = 1 in Eq (11)
when 30% < SOCv < 50%, which means that when the estimated OCV falls
between 30% and 50% SOC range (i.e., SOCv is not reliable), the OCV-based
correction is avoided. Note that a constant estimation error is expected when
w = 1. The new SOC estimation results are depicted in Fig 19 with 20%440
initial SOC estimation error and in Fig 20 where the estimated SOC is correctly
initialized. As can be seen, the large SOC estimation errors during 30% to 50%
SOC range in Fig 16 and Fig 17 are successfully removed and replaced with
30

MANUSCRIP
T
ACCEPTED
ACCEPTED MANUSCRIPT
constant estimation error as shown in Fig 19 and Fig 20.
Figure 18: Estimated OCV using WRLS and the ’real OCV ’ with correct initial SOC
Figure 19: SOC estimation results using WRLS after changing the weight during 30% to 50%
SOC range with 20% initial SOC estimation error
6.2. EKF445
The SOC estimation results using the EKF method are shown in Fig 21 and
Fig 22. In Fig 21 the initial SOC estimation error is 20%. As can be seen, the
estimated SOC converges to within 5% SOC error in about 5 minutes, and the
error remains within 5% SOC afterwards. The large estimation errors caused by
the flat OCV vs SOC curve during 50% to 30% SOC range, as shown in Fig 16450
and Fig 17, are greatly suppressed. The reason is that the estimated SOC has
already converged to the corrected SOC before reaching 50% SOC level. The
31

MANUSCRIP
T
ACCEPTED
ACCEPTED MANUSCRIPT
Figure 20: SOC estimation results using WRLS after changing the weight during 30% to 50%
SOC range with correct initial SOC estimation
change of the gain K in the EKF algorithm shown in Table 5, i.e., ‖K‖2 which
determines the correction weight, is depicted in Fig 23. As can be seen, after
the estimation error converges, the amplitude of K falls quickly to a very low455
value.
In Fig 22, the estimated SOC is correctly initialized. It shows that the SOC
estimation error remains quite small, except for one segment at the end of the
discharging period. This problem will be tackled using the joint-EKF method.
Figure 21: SOC estimation results using EKF with 20% initial estimation error
32

MANUSCRIP
T
ACCEPTED
ACCEPTED MANUSCRIPT
Figure 22: SOC estimation results using EKF with correct initial SOC
Figure 23: Amplitude of the gain K
33

MANUSCRIP
T
ACCEPTED
ACCEPTED MANUSCRIPT
6.3. joint-EKF460
As discussed in the previous section, the battery internal resistance, Ri can
be taken as another state, thus forming the augmented state vector as shown in
(15). Then the EKF method can be applied for SOC estimation. The results are
depicted in Fig 24 with 20% initial SOC estimation error and in Fig 25 where
the estimated SOC is correctly initialized. It shows that with a 20% initial465
SOC estimation error, it takes less than one minute for the estimated error to
fall below 5% and remain within 5% afterwards. In both cases, the estimation
errors are very small.
The large SOC estimation error at the end of discharge in Fig 22 is suc-
cessfully suppressed in Fig 25 by introducing Ri as another state. Besides, the470
convergence speed using joint-EKF method (about one minute) is much faster
than EKF method (about 5 minutes). The identified battery internal resistance,
Ri, as an extra state is shown in Fig 26. It shown that Ri increased notably at
the end of discharging when the battery SOC is reduced to less than 30%, which
coincides with laboratory observations that the battery internal resistance will475
increase as it approaches the end of discharging.
Figure 24: SOC estimation results using joint-EKF with incorrect initial SOC
6.4. Summary of the results
Finally, the above SOC estimation results using different methods are sum-
marized in Table 6. As can be seen, the joint-EKF method prevails at both
34

MANUSCRIP
T
ACCEPTED
ACCEPTED MANUSCRIPT
Figure 25: SOC estimation results using joint-EKF with correct initial SOC
Figure 26: The identified battery internal resistance
35
MANUSCRIP
T
ACCEPTED
ACCEPTED MANUSCRIPT
Table 6: Root mean square of SOC estimation error of different methods
WRLS WRLS
changing
weight
EKF joint
EKF
20% ini-
tial error
3.67% 2.78% 2.81% 1.63%
no initial
error
3.51% 2.36% 2.17% 1.48%
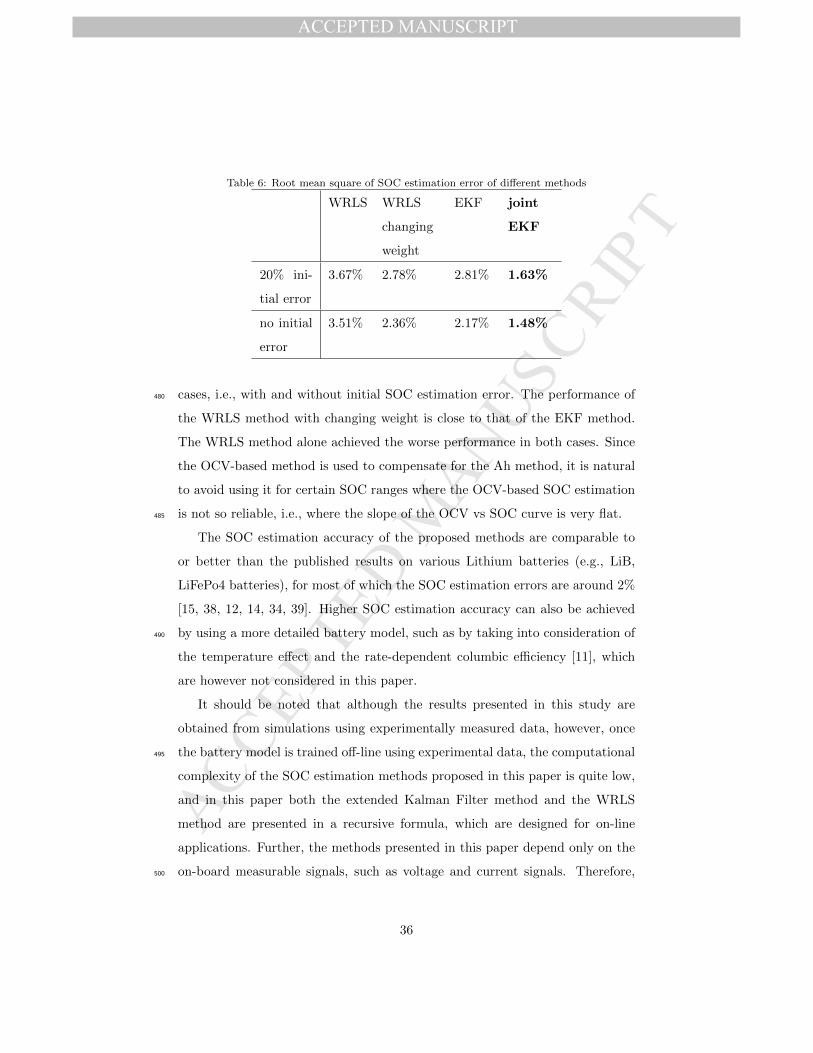
cases, i.e., with and without initial SOC estimation error. The performance of480
the WRLS method with changing weight is close to that of the EKF method.
The WRLS method alone achieved the worse performance in both cases. Since
the OCV-based method is used to compensate for the Ah method, it is natural
to avoid using it for certain SOC ranges where the OCV-based SOC estimation
is not so reliable, i.e., where the slope of the OCV vs SOC curve is very flat.485
The SOC estimation accuracy of the proposed methods are comparable to
or better than the published results on various Lithium batteries (e.g., LiB,
LiFePo4 batteries), for most of which the SOC estimation errors are around 2%
[15, 38, 12, 14, 34, 39]. Higher SOC estimation accuracy can also be achieved
by using a more detailed battery model, such as by taking into consideration of490
the temperature effect and the rate-dependent columbic efficiency [11], which
are however not considered in this paper.
It should be noted that although the results presented in this study are
obtained from simulations using experimentally measured data, however, once
the battery model is trained off-line using experimental data, the computational495
complexity of the SOC estimation methods proposed in this paper is quite low,
and in this paper both the extended Kalman Filter method and the WRLS
method are presented in a recursive formula, which are designed for on-line
applications. Further, the methods presented in this paper depend only on the
on-board measurable signals, such as voltage and current signals. Therefore,500
36

MANUSCRIP
T
ACCEPTED
ACCEPTED MANUSCRIPT
the methods proposed in this paper are for real-time on-board applications.
7. Conclusions
Real-time accurate SOC estimation is of great importance for the battery
management system in EV/HEV applications. Different SOC estimation meth-
ods are firstly presented in this paper, including direct measurement methods505
and model-based estimation methods. An auto-regression battery model is then
proposed to reproduce the battery terminal behaviour together with a non-linear
complementary model to capture the battery hysteresis effect. The model pa-
rameters are optimized using a hybrid optimization method combining TLBO
and least square method. Based on the off-line trained model, two different510
real-time model-based SOC estimation methods for Lithium-ion batteries are
presented, one based on model parameter identification using WRLS method
and another based on state estimation using EKF method. Considering that
the battery internal resistance changes with battery SOC, joint-EKF method is
adopted for both parameter and state estimation to improve the SOC estimation515
performance. The proposed methods are compared using test data collected on
a LiFePo4 battery cell. Two different cases are considered, with and without
initial SOC estimation error. The estimation results confirmed the effective-
ness of the modelling method and the model-based SOC estimation methods,
in particular the joint-EKF method.520
Note that the modelling and SOC estimation methods proposed in this paper
are data-driven methods using on-board measured signals such as terminal volt-
age and current, and involve no specific battery chemistries, therefore they are
generic for wide applications. In particular, this paper addresses the two most
challenging issues in estimating the SOC of these battery types, i.e. flat OCV-525
versus-SOC curve for some SOC ranges, and the hysteresis nonlinearity during
the charging and discharging phases. Therefore, although only the LiFePo4 bat-
tery is tested in this paper, the methods can be applied to other types of lithium
batteries as well as other cathode-based batteries, such as NMP and LiCoO2
37

MANUSCRIP
T
ACCEPTED
ACCEPTED MANUSCRIPT
batteries.530
In this paper only one battery cell is investigated. We assumed that the bat-
tery pack is well-balanced by the battery management system, therefore it can
be taken as one large battery cell. In the future research, the battery pack SOC
estimation under imbalance condition will be studied. Further, the temperature
change of the battery system, which will affect the battery behaviour and thus535
affecting the battery model identification, is not considered in this paper. The
temperature effect on the battery SOC estimation is another research topic in
the future.
Acknowledgment
This research is funded by the EPSRC under the ’Intelligent Grid Inter-540
faced Vehicle Eco-charging (iGIVE)’ project EP/L001063/1 and NSFC under
the grant 51361130153.
Cheng Zhang would like to thank Chinese Scholarship Council and UK-
China Science Bridge project and EPSRC IGIVE project for sponsoring his
research.545
[1] IEA, Global ev outlook (Apr. 2013).
URL http://www.iea.org/publications/freepublications.html
[2] wikipedia, Electric vehicle battery (Feb. 2014).
URL http://en.wikipedia.org/wiki/Electric_vehicle_battery
[3] L. Lu, X. Han, J. Li, J. Hua, M. Ouyang, A review on the key issues550
for lithium-ion battery management in electric vehicles, Journal of Power
Sources 226 (2013) 272–288.
[4] J. Cao, N. Schofield, A. Emadi, Battery balancing methods: A comprehen-
sive review, in: Vehicle Power and Propulsion Conference, IEEE, 2008, pp.
1–6.555
[5] S. Piller, M. Perrin, A. Jossen, Methods for state-of-charge determination
and their applications, Journal of power sources 96 (1) (2001) 113–120.
38

MANUSCRIP
T
ACCEPTED
ACCEPTED MANUSCRIPT
[6] W. Chang, The state of charge estimating methods for battery: a review,
ISRN Applied Mathematics 2013.
[7] N. Watrin, B. Blunier, A. Miraoui, Review of adaptive systems for lithium560
batteries state-of-charge and state-of-health estimation, in: Transportation
Electrification Conference and Expo (ITEC), IEEE, 2012, pp. 1–6.
[8] V. Prajapati, H. Hess, E. William, V. Gupta, M. Huff, M. Manic, F. Rufus,
A. Thakker, J. Govar, A literature review of state-of-charge estimation
techniques applicable to lithium poly-carbon monoflouride (li/cfx) battery,565
in: Power Electronics (IICPE), 2010 India International Conference on,
IEEE, 2011, pp. 1–8.
[9] J. Li, J. Klee Barillas, C. Guenther, M. A. Danzer, A comparative study of
state of charge estimation algorithms for lifepo4 batteries used in electric
vehicles, Journal of Power Sources 230 (2013) 244–250.570
[10] H. He, H. Qin, X. Sun, Y. Shui, Comparison study on the battery soc
estimation with ekf and ukf algorithms, Energies 6 (10) (2013) 5088–5100.
[11] M.-H. Chang, H.-P. Huang, S.-W. Chang, A new state of charge estimation
method for lifepo4 battery packs used in robots, Energies 6 (4) (2013) 2007–
2030.575
[12] S. Lee, J. Kim, J. Lee, B. Cho, State-of-charge and capacity estimation of
lithium-ion battery using a new open-circuit voltage versus state-of-charge,
Journal of Power Sources 185 (2) (2008) 1367–1373.
[13] Lifepo4 battery temperatures test (Jun. 2014).
URL http://www.bestgopower.com/technology/documents/580
temperature-test.html
[14] F. Baronti, G. Fantechi, L. Fanucci, E. Leonardi, R. Roncella, R. Saletti,
S. Saponara, State-of-charge estimation enhancing of lithium batteries
through a temperature-dependent cell model, in: Applied Electronics (AE),
2011 International Conference on, IEEE, 2011, pp. 1–5.585
39

MANUSCRIP
T
ACCEPTED
ACCEPTED MANUSCRIPT
[15] G. L. Plett, Sigma-point kalman filtering for battery management systems
of lipb-based hev battery packs: Part 2: Simultaneous state and parameter
estimation, Journal of Power Sources 161 (2) (2006) 1369–1384.
[16] M. A. Roscher, O. Bohlen, J. Vetter, Ocv hysteresis in li-ion batteries
including two-phase transition materials, International Journal of Electro-590
chemistry 2011.
[17] Y. Zhu, C. Wang, Strain accommodation and potential hysteresis of lifepo4
cathodes during lithium ion insertion/extraction, Journal of Power Sources
196 (3) (2011) 1442–1448.
[18] T. Sasaki, Y. Ukyo, P. Novak, Memory effect in a lithium-ion battery,595
Nature materials 12 (6) (2013) 569–575.
[19] L. Pei, R. Lu, C. Zhu, Relaxation model of the open-circuit voltage for
state-of-charge estimation in lithium-ion batteries, IET Electrical Systems
in Transportation 3 (4) (2013) 112–117.
[20] S. Rodrigues, N. Munichandraiah, A. Shukla, A review of state-of-charge600
indication of batteries by means of ac impedance measurements, Journal
of Power Sources 87 (1) (2000) 12–20.
[21] F. Orsini, M. Dolle, J.-M. Tarascon, Impedance study of the li/electrolyte
interface upon cycling, Solid State Ionics 135 (1) (2000) 213–221.
[22] How to measure state-of-charge (Feb. 2014).605
URL http://batteryuniversity.com/learn/article/
howtomeasurestateofcharge
[23] S. Buller, M. Thele, E. Karden, R. W. De Doncker, Impedance-based non-
linear dynamic battery modeling for automotive applications, Journal of
Power Sources 113 (2) (2003) 422–430.610
[24] D. Di Domenico, G. Fiengo, A. Stefanopoulou, Lithium-ion battery state
of charge estimation with a kalman filter based on a electrochemical model,
40

MANUSCRIP
T
ACCEPTED
ACCEPTED MANUSCRIPT
in: Control Applications, IEEE International Conference on, IEEE, 2008,
pp. 702–707.
[25] S. J. Moura, N. A. Chaturvedi, M. Krstic, Adaptive partial differential615
equation observer for battery state-of-charge/state-of-health estimation via
an electrochemical model, Journal of Dynamic Systems, Measurement, and
Control 136 (1) (2014) 011015.
[26] K. A. Smith, C. D. Rahn, C. Y. Wang, Model-based electrochemical esti-
mation and constraint management for pulse operation of lithium ion bat-620
teries, Control Systems Technology, IEEE Transactions on 18 (3) (2010)
654–663.
[27] R. Klein, N. A. Chaturvedi, J. Christensen, J. Ahmed, R. Findeisen, A. Ko-
jic, State estimation of a reduced electrochemical model of a lithium-ion
battery, in: American Control Conference (ACC), 2010, IEEE, 2010, pp.625
6618–6623.
[28] G. L. Plett, Extended kalman filtering for battery management systems of
lipb-based hev battery packs: Part 2. modeling and identification, Journal
of power sources 134 (2) (2004) 262–276.
[29] H. He, R. Xiong, J. Fan, Evaluation of lithium-ion battery equivalent circuit630
models for state of charge estimation by an experimental approach, energies
4 (4) (2011) 582–598.
[30] T. Weigert, Q. Tian, K. Lian, State-of-charge prediction of batteries and
battery–supercapacitor hybrids using artificial neural networks, Journal of
Power Sources 196 (8) (2011) 4061–4066.635
[31] C. Bo, B. Zhifeng, C. Binggang, State of charge estimation based on evolu-
tionary neural network, Energy conversion and management 49 (10) (2008)
2788–2794.
41

MANUSCRIP
T
ACCEPTED
ACCEPTED MANUSCRIPT
[32] A. J. Salkind, C. Fennie, P. Singh, T. Atwater, D. E. Reisner, Determi-
nation of state-of-charge and state-of-health of batteries by fuzzy logic640
methodology, Journal of Power Sources 80 (1) (1999) 293–300.
[33] T. Hansen, C.-J. Wang, Support vector based battery state of charge esti-
mator, Journal of Power Sources 141 (2) (2005) 351–358.
[34] W. Junping, G. Jingang, D. Lei, An adaptive kalman filtering based state
of charge combined estimator for electric vehicle battery pack, Energy Con-645
version and Management 50 (12) (2009) 3182–3186.
[35] R. Rao, V. Savsani, D. Vakharia, Teaching-learning-based optimization:
A novel method for constrained mechanical design optimization problems,
Computer-Aided Design 43 (3) (2011) 303–315.
[36] L. Ljung, System identification: theory for the user, Cliffs, N.J.: Prentice650
Hall, 1987.
[37] M. Verbrugge, B. Koch, Generalized recursive algorithm for adaptive mul-
tiparameter regression application to lead acid, nickel metal hydride, and
lithium-ion batteries, Journal of The Electrochemical Society 153 (1) (2006)
A187–A201.655
[38] G. L. Plett, Extended kalman filtering for battery management systems
of lipb-based hev battery packs: Part 3. state and parameter estimation,
Journal of Power sources 134 (2) (2004) 277–292.
[39] F. Sun, X. Hu, Y. Zou, S. Li, Adaptive unscented kalman filtering for state
of charge estimation of a lithium-ion battery for electric vehicles, Energy660
36 (5) (2011) 3531–3540.
[40] I.-S. Kim, A technique for estimating the state of health of lithium batteries
through a dual-sliding-mode observer, Power Electronics, IEEE Transac-
tions on 25 (4) (2010) 1013–1022.
42

MANUSCRIP
T
ACCEPTED
ACCEPTED MANUSCRIPT
[41] F. Zhang, G. Liu, L. Fang, H. Wang, Estimation of battery state of charge665
with observer: Applied to a robot for inspecting power transmission lines,
Industrial Electronics, IEEE Transactions on 59 (2) (2012) 1086–1095.
43

MANUSCRIP
T
ACCEPTED
ACCEPTED MANUSCRIPT
Highlights
• An auto-regression battery model is built considering hysteresis nonlinearity
• A hybrid model training method combining TLBO and least square is proposed
• WRLS and joint-EKF approaches are used for real-time model-based SOC estimation
• Flat OCV problem is tackled by combining WRLS method with coulomb counting