an inquiry/technology based approach to...
TRANSCRIPT
1
An Inquiry/Technology Based Approach to Introductory Chemistry
Summary
For many years we have been concerned about the instructional effectiveness of the generalchemistry course taken primarily by freshman science majors. We, like many other faculty membersinvolved in this course, have become increasingly alarmed by the lack of motivation of our students,their refusal to read the textbook, their poor performance on tests, and shoddy attendance in ourclasses. While some may argue that the root of these ills can be found in the quality of availabletextbooks, instructors, or the nature of our students; we believe the lack of engagement on the part ofour students may be the result of a traditional teacher centered instructional approach. Chemicaleducation research has shown that a student centered inquiry-based instructional approach developsmore positive attitudes towards learning, increases student understanding of concepts and improvesthe ability to use scientific processes. Currently, however, there is not a complete set of learningmaterials that support such an approach in a practical manner. To address this, we propose todevelop a set of materials that supports an inquiry-based instructional strategy called the learningcycle approach.
The Traditional Approach to General Chemistry
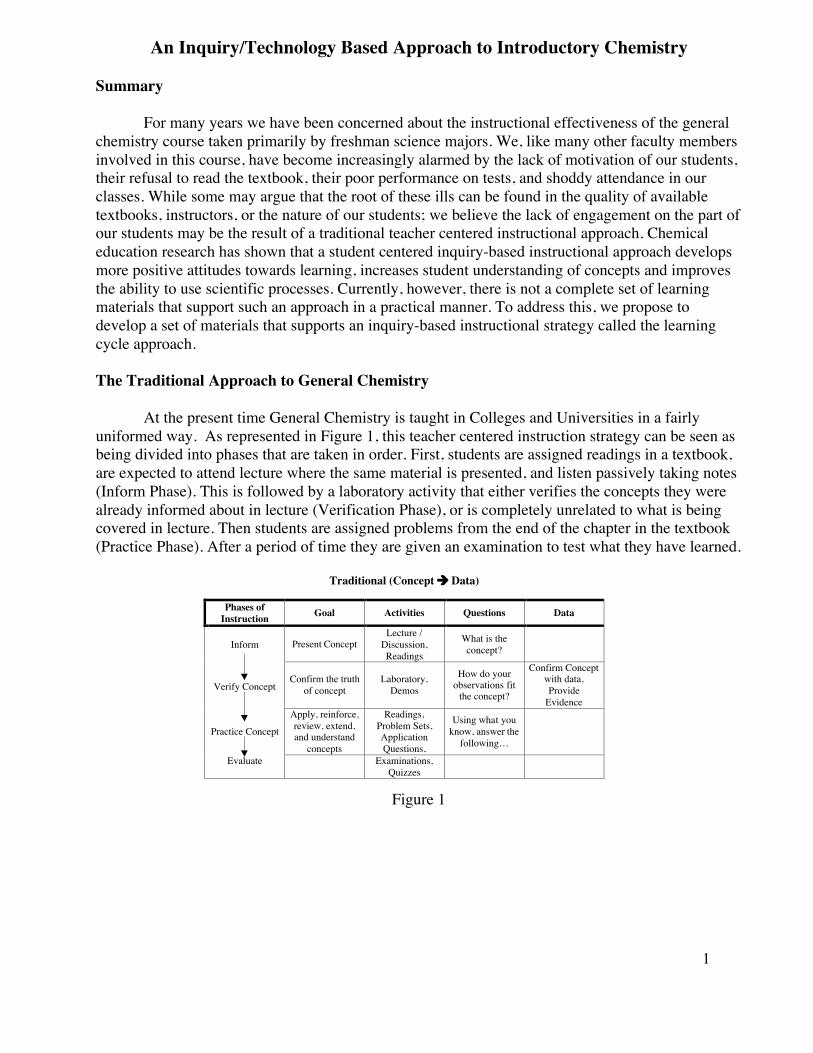
At the present time General Chemistry is taught in Colleges and Universities in a fairlyuniformed way. As represented in Figure 1, this teacher centered instruction strategy can be seen asbeing divided into phases that are taken in order. First, students are assigned readings in a textbook,are expected to attend lecture where the same material is presented, and listen passively taking notes(Inform Phase). This is followed by a laboratory activity that either verifies the concepts they werealready informed about in lecture (Verification Phase), or is completely unrelated to what is beingcovered in lecture. Then students are assigned problems from the end of the chapter in the textbook(Practice Phase). After a period of time they are given an examination to test what they have learned.
Figure 1
Traditional (Concept ‡ Data)
Phases ofInstruction Goal Activities Questions Data
Inform Present ConceptLecture /
Discussion,Readings
What is theconcept?
Verify ConceptConfirm the truth
of conceptLaboratory,
DemosHow do your
observations fitthe concept?
Confirm Conceptwith data,Provide
Evidence
Practice ConceptApply, reinforce,review, extend,and understand
concepts
Readings,Problem Sets,ApplicationQuestions,
Using what youknow, answer the
following…
Evaluate Examinations,Quizzes

2
We believe that this approach is less than effective for the following reasons:
– Traditional lectures presentations are not an effective method for helping students learnchemistry.
– Current textbooks are not effective learning tools for students.– Technology plays a secondary rather than central role in instruction.– The traditional approach does not allow students to develop their own understanding of
chemical concepts.– The traditional approach does not effectively address the difficulties that many students
have with solving problems.
A Better Way - The Learning Cycle Approach
Research on instructional strategies has clues as to how to change our courses. Aninstructional strategy that is research based is a student centered inquiry-oriented approach called thelearning cycle. The learning cycle approach, as represented in Figure 2, can also be seen as beingdivided into phases that are taken in order. First, students are exposed to data (Exploration Phase)from which concepts can be derived (Invention Phase). Students can then apply the concept to otherphenomena (Application Phase). In contrast to the traditional approach, this inquiry-orientedapproach is based upon data. This difference has several consequences to the role played by variousinstructional activities. Laboratory and other data generating activities play a more central role inintroducing concepts rather than verifying concepts. Classroom discussions are focused on usingdata to generate concepts rather than informing students of the concepts. Textual materials are usedto apply, reinforce, review, and extend concepts rather than introduce concepts. This approachencourages more active learning by students. More details about the learning cycle approach can befound in Appendix 1.
Figure 2
However, for this approach to be viable, a much greater source of data generating activitiesmust be available to the instructor. Instructional technology offers a source of these activities.
Inquiry (Data ‡ Concept)
Phases ofInstruction Goal Activities Questions Data
Explore
Explore relationsand patterns in
data
Laboratory,Demos, MoLES,Lab Simulations,
Video
What did youdo? What didyou observe?
Gathering Data
Invent Concept
Develop andunderstand
concepts withteacher/peers
Lecture /Discussion
What does itmean? Explaining Data
Apply Concept
Apply, reinforce,review, extend,and understand
concepts
Readings,Problem Sets,ApplicationQuestions,
VerificationLaboratory
Using what youknow, answer the
following…
Using Data,Provide
Evidence
Evaluate Examinations,Quizzes

3
Technology is the Key to Implementation
Although technology is beginning to make inroads into General Chemistry instruction, it hasdone little to change its nature. For the most part, technology is being used to supplement traditionalinstruction or to replicate traditional methods. We propose to use technology in a more central role
This project will develop a set of learning tools that will be informed by theoretical andresearch based principles and that take advantage of the instructional technologies available to mostmodern colleges and universities. The proposed activities and materials, in addition to supporting allthe concepts commonly presented in a two-semester course, will be flexible and can be used in avariety of instructional strategies.
The Tools
Here is description of the materials we propose to develop.
Computer-Based Concept Development Resources: These are computer-based resourcesthat allow students to generate data from which a chemistry concept can be invented or to explorethe application of the concept. These resources will allow students to explore chemical concepts atthe macroscopic, submicroscopic and symbolic levels, and to analyze and interpret data in a virtuallaboratory. Accompanying the resources would be an Activity Manual(s) that would direct studentinquires into chemical phenomena and contain their observations and responses to questions. Theseinquires could be used as pre-lecture, during lecture, or post-lecture activities. There are three typesof resources:
MoLE (molecular level laboratory experiments): These are Web accessible,computer-based simulation activities that mirror the procedures and the instructional strategyof guided inquiry sensory-level laboratory activities. The computer window of the activity isdivided into submicroscopic (atomic/molecular) representations, a symbolic (graphicalrepresentation) and a macroscopic representation. See the example for the gas law MoLEactivity. Students can use the simulation to generate data to support a submicroscopicrepresentation of a concept. With each MoLE activity an activity guide is included to assistthe student in collecting, analyzing and interpreting the data. This component is design forgreater flexibility to allow the instructor greater range of implementation strategies, includinga computer laboratory setting; as an independent homework assignment; and in alecture/group discussion setting. As in the case of the guided inquiry laboratory activities theMoLE activities should be used to introduce the concept. (See Appendix 4 for Gas Lawexample.)
Video demonstrations: Video demonstrations are macroscopic demonstrations ofchemical phenomenon. Students will be able to collect qualitative and/or quantitative dataand with the aid of an activity guide assist the student in collecting, analyzing andinterpreting the data. The activity guide will also include paper and pencil inquiry activitiesfor individual and cooperative group investigations. These simulations can be viewed on theWeb, in groups, during a lecture/discussion class, or as an assignment to be completed beforeor following lecture.
Laboratory Simulations: Laboratory simulations will have a virtual laboratory feel,and allow students to investigate a concept at the macroscopic level. Some of the LaboratorySimulations will include submicroscopic views to encourage linking between levels.Students will be able to collect qualitative and/or quantitative data and with the aid of anactivity guide assist the student in collecting, analyzing and interpreting the data. Theactivity guide will also include paper and pencil inquiry activities for individual and

4
cooperative group investigations. These simulations can be viewed on the Web, in groups,during a lecture/discussion class, or as an assignment to be completed before or followinglecture.
PreLecture Explorations: A PLE is a web-based exercise that students do before theyattend a lecture. It usually consists of 5 to 7 questions that require only 10 to 15 minutes of astudent’s time to complete. It is platform independent and can contain text, static images, video,and/or animations. Upon submission of the PLE, students can receive an expert’s response to thesame questions for comparison. PLEs can consist of questions about a concept, problems to solve, orobservation made on viewing a video demonstration or by manipulating a simulation. PLEs can beused to: pool data to be used to invent concepts in lecture, identify student misconceptions to beaddressed in lecture, review concepts needed as prerequisite knowledge for a lecture topic, andpractice using concepts covered in a previous lecture. The instructor can access student responses toPLEs and use them to customize their lecture, to address specific students’ misconceptions, to assessstudents’ prerequisite knowledge, and to develop charts and graphs of student-generatedobservations that can be used to invent concepts. One of the goals of PLEs is to encourage studentsto come to the lecture already thinking about the topic to be discussed. Taking large lecture classescan be a passive experience for most students. PLEs are one method for more actively involvingthem.
In Class Explorations: An ICE is a paper and pencil activity that is designed to be done bysmall cooperative groups of no more than five students in a class setting. The activity will pose aquestion/problem or questions/problems that are focused on a course learning objective. Thequestions/problems are presented in a handout or as a class presentation by the instructor. Studentsare expected to have a group discussion and come to a consensus response to thequestions/problems. They then submit the consensus response for the instructor’s consideration. Aclass discussion can then be based on the ICE. ICEs can be used to introduce concepts, reviewconcepts, or test student understanding, They can be used as part of an instructional tactic thatcombines an ICE with a PLE and/or a class discussion, ICEs can be based on a problem set, inquiryquestions, a chemical demonstration, or a data table or graph.
Guided and Open Inquiry Laboratory Resources: We are recommending the use of theInquiries into Chemistry Laboratory Manual by Michael R. Abraham and Michael J Pavelich as thelaboratory manual for this project. This laboratory manual uses an inquiry approach based on theLearning Cycle. The guided inquiry activities in this laboratory manual lead the student to collectdata that can be used to support the invention of a major concept. Each laboratory activity consistsof the following sections: a problem statement that focuses students on the eventual conceptualoutcome of the activity; a data collection section that guides the students to generate data that willsupport the concept necessary to eventually invent/derive the concept; a data analysis section thathelps students organize the data in a way that facilitates conceptual invention; and an interpretationsection that offers the opportunity for students to identify the concept and can be used as the base forthe concept invention discussion that will occur in lecture. The intended use of the guided inquirylaboratory activities is as an introduction to the concepts to be invented and therefore must occurprior to any lecture coverage of the same materials. (See Appendix 3 for Gas Law example.)
The Abraham and Pavelich laboratory manual also includes descriptions of chemical systemsthat students can use to further investigate using an Open-Inquiry format. The student is expected todevelop a problem statement, to design and carry out a laboratory investigation to solve the problem.(See Appendix 3 for Gas Law example.)

5
WebText: We envision using a Web-based reference source as an alternative to thetraditional textbook. The entries from the WebText will summarize and define the concept/termsdeveloped/invented in class. The entries consist of a terse exposition of the content with anysupporting graphical, tabular, or mathematical relationships, formulas, and equations associated withthe particular concept. Bold-faced key words will be linked to related concept/terms in the WebText.Links will also be provided to the instructional tools used in class to invent the particular conceptand to the associated problem-solving tutorials. Supporting graphics and figures will play a centralrole in the discussion of the concept. Real world applications and chemical applications of theconcept will also appear here. The WebText will use linear computer animations and QuickTimemovies to provide dynamic representation of the concept. The course instructor will define theScope and Sequence of the course from a collection of learning objectives that are associated with alist of Concepts/Topics (see Appendix 2). The instructor can further customize the list ofConcepts/Topics by adding their own learning objectives and associated activities for each of theTools (i.e., MoLE, Video Demonstrations, Problems, etc.)
Problem Solving Resources: This is an interactive feature that can be used to help studentsdevelop problem-solving skills. Each tutorial consists of three prototype questions that are randomlysequenced. In the tutorial the student views the first question and is given three choices of how tointeract with the problem. The ‘Show Me’ function presents the student with a detailed presentationthat parses the information in a step-by-step approach similar to a teacher doing a sample problem atthe board. The Show Me feature will include an audio overlay during the step-by-step presentation.The ‘HELP! Me’ function presents the student with an interactive parsed approach to solving thesame problem. Input from the student is evaluated by the computer as the student progressesthrough the problem. The ‘Watch Me’ function presents the student with an input box where thestudent is expected to enter the answer to the problem. The computer evaluates the answer.Incorrect answers are compared to a set of answers that exist as a result of predictable errors. If amatch occurs the student receives some feedback and asked to try again. If the answer does notmatch a correct answer or a known incorrect answer the student is given the choice to return to the‘HELP! Me’ or ‘Show Me’ functions. If the answer is correct the student can exit the Tutorial andproceed to the Computerized Problem Sets (see following). If the student uses the ‘Show Me’functions, the program moves them to a second question that only has the ‘Watch Me’ and the‘HELP! Me’ functions available. If the student uses the ‘HELP! Me’ function, the program movesthem to a second question that only has the ‘Watch Me’ and the ‘Show Me’ functions available. Ifthe student successfully answers the second problem correctly they can exit the Tutorial. If thestudent cannot correctly answer the question they are automatically moved to the ‘HELP Me’presentation after which they will be moved to the third and final problem in the Tutorial. In thethird problem they only have the option of the entering an answer to the question. If the student isstill unsuccessful they are directed to find assistance from an instructor. At anytime the student mayreturn to the ‘Show Me’ or ‘HELP! Me’ function of previous questions to review their work.
Students who successfully complete the Problem Solving Tutorial will be able to accesscollections of additional problems associated with the particular concept. These problems wouldreside on a WedCT or WebCT like server and have a number of features. Questions would beindividualized to each student by using randomly generated numbers. Different chemical speciescould be used in a fixed problem stem. The questions could be computer graded with facility forfeedback. The instructor would be able to control the number of submissions and specify deadlinesfor submission. Finally, grades could be added to computer grade book. This resource could also beused to generate problem sets, quizzes, and exam questions.
6
Administrative Structure
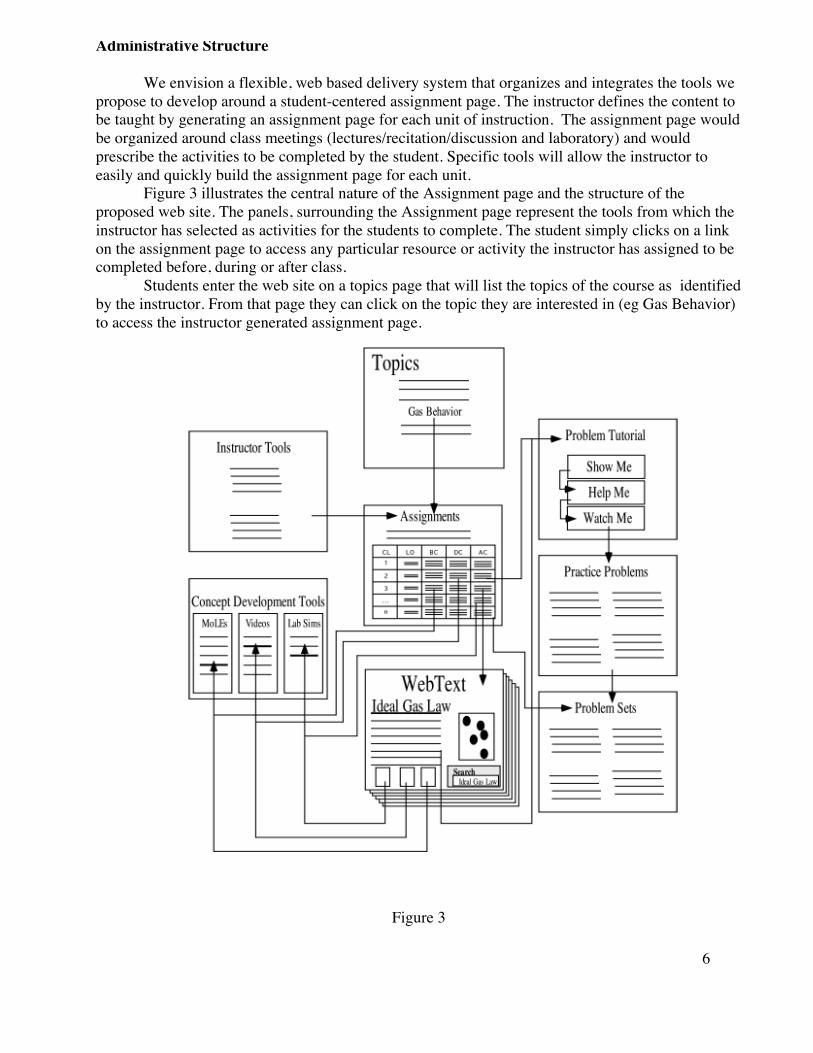
We envision a flexible, web based delivery system that organizes and integrates the tools wepropose to develop around a student-centered assignment page. The instructor defines the content tobe taught by generating an assignment page for each unit of instruction. The assignment page wouldbe organized around class meetings (lectures/recitation/discussion and laboratory) and wouldprescribe the activities to be completed by the student. Specific tools will allow the instructor toeasily and quickly build the assignment page for each unit.
Figure 3 illustrates the central nature of the Assignment page and the structure of theproposed web site. The panels, surrounding the Assignment page represent the tools from which theinstructor has selected as activities for the students to complete. The student simply clicks on a linkon the assignment page to access any particular resource or activity the instructor has assigned to becompleted before, during or after class.
Students enter the web site on a topics page that will list the topics of the course as identifiedby the instructor. From that page they can click on the topic they are interested in (eg Gas Behavior)to access the instructor generated assignment page.
Figure 3

7
Figure 4 and Figure 5 are sample class and laboratory assignment pages that an instructormight generate for the Gas Law Unit. It is presented as one of many possible examples that aninstructor might produce using the Instructor Tools.
Figure 4
Figure 5
Class Learning Objectives Before Class During Class After Class
1
(LO: Describe measuringgas pressures using
barometers andmanometers. Relate
pressure units.)
View VideoDemonstrations(Collapsing Can)
respond to challengequestions
Discuss CollapsingCan view Cartesian
Diver video andrespond to questions
in groups, discussbarometers and
manometers
Webtext assignment,measuring pressure
problem tutorial andpractice problems
2
(LO: Apply the ideal gaslaw to relate and calculate
values for pressure,volume, temperature, and
amount of a gas.)
View VideoDemonstrations(Boyle’s Law,
Charles’ Law, Gay-Lussac Law) collect
data respond tochallenge questions
Use student data toinvent the Ideal Gaslaw, group problemsolving using ideal
gas law
WebText assignment,Ideal Gas Law tutorialand practice problems
3
(LO: Apply the ideal gaslaw to relate and calculate
values for pressure,volume, temperature, and
amount of a gas.)
View VideoDemonstration
(Burning Candle)
Group activityapplication of the
Ideal Gas Law to theburning candleexperiment, gas
density, gasstoichiometry
WebText assignment,Ideal Gas Law
Tutorial and practiceproblems.
Problem Set on LO’sfrom Lectures 1 - 3
4
(LO: Apply Dalton’s Law ofpartial pressure to calculatethe pressure of combinedgases and to calculate the
partial pressures of gases inmixtures.)
Dalton’s Law VideoDemonstration
Continue gasstoichiometry and
Dalton’s Law
WebText assignment,Dalton’s Law Tutorialand practice problems.
5
(LO: Describe gases interms of KMT)
Ideal Gas LawMoLE guided-inquiry activity
Group activity toanalyze data collectedfrom MoLE activity,plan an open-ended
activity
Do open-ended MoLEactivity, WebText,
KMT Problem tutorialand practice problems
6
(LO: Relate MW andspeeds of molecules using
Graham’s law and RealGases.)
VideoDemonstration of
Graham’s Law
Group activity toanalyze data collectedfrom Graham’s Law
and discuss RealGases
WebText, Graham’sLaw and Real GasesProblem tutorial andpractice problems.
Problem Set on LO’sfrom Lectures 1 – 6.
Lab Learning Objectives Before Laboratory During Laboratory After Laboratory
1
(LO: Apply the idealgas law to relate andcalculate values forpressure, volume,temperature, andamount of a gas.)
Your Lab Instructorwill assign you one ofthe activities fromyour lab manual(E.1.A, B, C: GasRelationships)
Complete LaboratoryReport
2(LO: Describe gases in
terms of KMT)
Print out thelaboratoryexperiment: Guided-inquiry activity (Dopages 1 - 8) usingGas Law MoLE
Complete LaboratoryReport
3
(LO: Apply the idealgas law to relate andcalculate values forpressure, volume,temperature, andamount of a gas.)
(LO: Apply the idealgas law to relate andcalculate values forpressure, volume,temperature, andamount of a gas.)
Pick one of thesystems from theopen-inquiryexperiments from E.Gas Systems
Pick one of thesystems from page 9of Guided-inquiryactivity using GasLaw MoLE

8
Using the Instructor Tools the assignment page can be quickly generated. The instructorenters the number of class days need to present the contents of the unit, selects or provides thespecific learning objectives and identifies the class day(s) the particular objective will be covered.The instructor then selects the resources from Concept Development Tools, Web Text, ProblemTutorials and Problem Sets to be used before, during and after class.
How This New Project Will Improve Instruction in the General Chemistry Course
A number of observations can be made regarding current effectiveness of instruction inintroductory chemistry, what changes are needed, and how our project addresses these needs.Students undercut our efforts by not reading the assigned material in the textbook; not attending theclass lectures; dry-labing their experiments, copying the solutions of the problems from a solutionmanual, or from fraternity files; and miserably failing the examinations.
Observation #1: Current textbooks are not effective learning tools for students.Textbooks try to serve two functions simultaneously: a stand alone, complete instructional
tool, and a reference tool. Consequently current textbooks do neither very well. As an instructionaltool textbooks, by their very nature, are didactic and teacher centered. Most students trying to usethe textbook as an instructional tool are either confused or under the false impression that simplyreading the assigned material will result in their understand the concepts and their ability to doproblem assignments. Many of our students do not read their textbook at all.
Many students do use the textbook as a reference for problem solving, to pick up conceptsthey did not understand in lecture, and to review for examinations. However as a reference toolcurrent textbooks are wordy and not well organized.
• Textbooks should emphasize their role as a reference.
Our 'Text' will exist on the Internet but will function as a reference tool that focuses on theapplication phase that follows concept invention in lecture.
Observation #2: Lectures are not an effective method for helping students learn chemistry.A didactic instructional strategy is the norm in introductory chemistry classes despite the
advantages of a more active, student centered instructional strategy. Most chemistry professors usethe traditional lecture method to deliver information and “cover” material. Many professors believethat if you present the material in a clear well-organized manner, students will learn. Unfortunatelystudents are generally so passive in a lecture classroom they do not get involved in the learningprocess.
Inquiry instructional strategies have been shown to have advantages over traditionalinstructional strategies in attitudes, motivation, and concept and process learning. Inquiry isrecognized by numerous professional organizations and funding agencies as the preferred strategyfor science teaching. In spite of this, a paucity of available inquiry-oriented instructional materialshas resulted in little or no change in how chemistry is taught.
The tools we propose to develop can be used in a wide variety of instructional strategies,including inquiry. The MoLE Simulations, video demonstrations and macroscopic laboratorysimulations could be used to introduce a topic in a lecture setting. These tools could also be used asexplorations in a laboratory setting by students using guided-inquiry instructions. These tools couldalso be the basis of challenge questions posed to students to address particular ideas.

9
Observation #3: Most instructional materials can be used in a limited range of instructionalsettings.
Most instructional materials have prescribed instructional strategies either implicit or explicitin their use. In spite of what the curriculum developer might consider is the best instructionalapproach most instructors would insist on personalizing their instruction given curriculum materialsflexible enough to do so. Even if you agree that inquiry instructional strategies are superior there aremany variations in the implementation in any one teacher's classroom.
• Instructional materials that are flexible and can be used in a wide variety ofinstruction settings are needed.Our instructional materials can be used in a wide variety of instructional settings, including;
lecture, lecture supplements, homework assignments, computer laboratory, as either group orindividual activities, and to introduce or verify concepts.
Observation #4: Technology plays a secondary role in instruction.Although technology through the use of CD-ROMs has begun to be used to help students
develop visualization of particulate nature of matter (PNM) phenomenon they are typically used asancillary materials and play a secondary role in instruction. Furthermore the computer resources aredesigned to fit into an instructional strategy that is fundamentally didactic.
• More technology-based activities need to be developed that can be used as a centralfocus of instruction.
The Computer based Concept Development Resources will allow students to visualizechemistry models at the atomic, macroscopic and symbolic levels. Guided-inquiry activities will beused in concert with the software to help students explore and invent fundamental chemicalconcepts.
Observation #5: There is a paucity of instructional materials that can be used to introduceconcepts.
At the present time new concepts are commonly introduced through the use of assignedreadings, didactic lecture, or lecture demonstrations. In rare instances new concepts may beintroduced in laboratory. Technology offers a way to easily and quickly generate reproducible data,within the context of a real experiment, to support concept development.
The Computer Based Concept Development Resources are designed to be used to introduceconcepts by providing a source of data that students can use in support of conceptual invention.
Observation #6: Materials that allow visualization at the particulate level of matter are limited.In recent year the use of computer animations to illustrate particulate nature of matter
phenomenon have been on the increase. However, these materials are not particularly interactiveand students have difficulty linking particulate behavior of matter with macroscopicbehavior/properties.
The MoLE simulations, a component of the Computer Based Concept DevelopmentResources, are designed as interactive explorations of chemical phenomenon that can be viewedsimultaneously at the macroscopic, submicroscopic and symbolic levels.
Observation #7: Students are poor problem solvers.Students come to our lectures to listen, take notes, and watch the instructor do the problems.
They (instructor as well as the student) then believe they can now do the problems themselves. Butwhen given an examination they get low grades. They do not do assigned problems, and fail

10
miserable at trying to explain what we consider basic chemical concepts. Too often problem-solvingis taught in isolation of the concepts upon which the problem is based. A stronger link between theconceptual ideas and the problem-solving strategies is needed.
A common complaint from students is that we are not working enough sample problems inclass. Students do not see the problems as the culmination of their understanding of the material butas proof of their understanding of the concept. Reality strikes when the instructor wants to get at theproof of a student's understanding of a concept by asking a slightly different question. Students seethis 'new' problem as "unfair" or "tricky".
• A more active, student-centered, investigative approach that is technology based canhelp students develop superior problem-solving abilities.
The MoLE, Video Demonstrations and the Macroscopic Laboratory Demonstrations can beused as a source of problems and as a basis for linking problem-solving to conceptual understanding.
The Problem Solving Tutorials and the Computerized Problem Sets will take advantage oftechnology and inquiry activities to deliver a more interactive and systematic approach to problemsolving.
Observation #8: Students exhibit poor conceptual understanding of chemistry.While students can solve plug and chug PV = nRT problems, they cannot correctly represent
what a sample of helium gas looks like in a picture diagram when it is cooled from 25°C to 5°C.Most students can correctly calculate the pH of a 0.0010 M HCl solution. However, they are notsuccessful when asked to estimate the pH when 10 mL of HCl at pH = 2 are mixed with 10 mL ofHCl at pH = 6. Problems that cannot be solved by the use of an equation or problems that require awritten explanation are considered to be conceptual problems. Research has shown that students whohave better conceptual understanding are better problem solvers. Instructors who adopt a strongconceptual understanding approach to teaching and learning use instructional strategies andmaterials that require students to organize and make sense of data, predict outcomes, and explainobservations to their peers. Instructors who incorporate the particulate nature of matterrepresentation of chemical processes in their teaching provide students with an alternative methodfor understanding chemistry. A conceptual change approach to teaching has been shown to be apowerful basis for problem solving. Students who have a strong conceptual understanding are ableto solve more sophisticated multiple concept problems.
• Materials that require more active, student-centered, investigative approach can helpstudents develop superior conceptual understanding.We envision our tools can be utilized in a more active, student-centered classroom; such as
cooperative learning, peer lead team learning, supplemental instruction and other active learningstrategies.
The Key Differences With Our Approach
In summary, we believe the key distinguishing features of the materials we propose to develop are asfollows.
Use of Technology: Presently, the use of technology in general chemistry is ancillary in nature,peripheral to the central role of instruction, used as examples and illustrations, and supporting adidactic approach to instruction. In our approach the technology will play a more centralized role ininstruction. It will replace the textbook in introducing concepts, by serving as a source of data fromwhich concepts and principles can be invented. These computer-based materials will be studentcentered and interactive. Another strength of the components of this technology will be their ability

11
to be used in a variety of different instructional approaches, including a computer laboratory setting;as an independent homework assignment; and in a lecture/group discussion setting.
Laboratory: In so far as the laboratory is coordinated with the rest of the course its traditional rolehas been to generate data to verify or confirm concepts previously introduced in the textbook and/orlecture. In this project the use of an inquiry approach in laboratory is compatible with the otherelements of this project as a source of student generated data that is used to invent concepts. Anadditional feature will be a number of parallel macroscopic and computer-based virtualsubmicroscopic laboratory experiments that are designed to help students link the sensory,particulate and symbolic levels of understanding.
WebText: The traditional textbook has played a central role and carried the major burden ofinstruction. Our project would replace the traditional textbook with a Web-based text (WebText).The WebText will play a different role of instruction, that of applying, reinforcing, extending andreviewing the conceptual content of the course. The WebText would not be used to introduceconceptual content; a role that now would be played by other technology based tools and thelaboratory. The WebText is essentially a database from which the instructor can define the Scopeand Sequence of the course, and subsequently the student, can access information important to thecontent being studied. The instructor will be able to add supplementary entries of their own to theWebText database and the students will have a measure of control over the path they use to movethrough the information using links. Due to the nature of the database structure of the WebText,revisions and corrections can be done conveniently and easily when necessary. Although we do notthink it would be necessary, instructors who are uncomfortable with the WebText as the only sourceof text-based instruction could adopt a traditional text (either new or used) to supplement theircourse.
Problem Solving: In the traditional textbook most problems are organized by subtopics (learningobjectives) at the end of the Chapter. The problems in the WebText will be linked to the learningobjectives that are chosen/defined by the instructor. To access the problems in the WebText studentswill be routed through a tutorial that will allow a more intelligent and systematic tutoring strategy.Students can bypass the tutorial by proving they can solve a particular problem, but if unsuccessfulthey will be interactively guided through the process. Once the student completes the tutorial theywill be exposed to a collection of problems, similar to problems that appear at the end of the chapterin the traditional text, to practice problem solving for the particular learning objective. Afterproblem solving in several learning objectives, a new problem set containing randomly generatedproblems from several learning objectives can be accessed. The engine used to generate theseproblem sets will also be able to generate examination questions. Instructor who feel the need foradditional problems, and worked out problem examples could adopt the Schaum's Outline as asupplement.
12
Appendices
1. Research Base for the Project2. Proposed Content for the Project
a. Topicsb. Sub Topicsc. Learning Objectives
3. Sample Macroscopic Laboratory (Gas Laws)a. Guided Inquiry Lab (E-1A, B and C)b. Open Inquiry Lab (E. Gas systems)
4. Parallel Submicroscopic Laboratory (using MoLE Simulation)a. Guided Inquiry Labb. Open Inquiry Lab

13
1. Research Base for the Project
The Learning Cycle Approach: The learning cycle approach is an inquiry-basedinstructional strategy derived from constructivist ideas of the nature of science (Bodner, 1986), andthe developmental theory of Jean Piaget (Piaget, 1970). Instruction is divided into three phases. First,in the exploration phase (E), students are given experience with the concept to be developed.Second, in the conceptual invention phase (I), the student and/or teacher derives the concept fromthe data. Third, the application phase (A) gives the student the opportunity to explore the usefulnessand application of the concept.
There are several characteristics which, when used in combination, establish the learningcycle approach as a distinct instructional strategy. The most important of these is the presence ofthree phases of instruction in a specific sequence, E-->I-->A. This sequence has a number of logicalconsequences. The exploration phase coming first implies that the information exposed by thelearning activity will be used inductively by students during the invention phase.
There has been a large amount of research concerning the Learning Cycle Approach since itsorigins in the 1960’s. Most of the research supporting the Learning Cycle Approach is discussed indetail in Lawson, Abraham, & Renner (1989).
The theoretical justification for the learning cycle approach can be found in the history andphilosophy of science and in the psychology of learning, especially the developmental psychology ofJean Piaget. Although Piaget’s theories are too complex to discuss in detail here, a briefconsideration of one aspect of his ideas is provided to clarify how the learning cycle approach isconsistent with these ideas.
According to Piaget, human beings have mental structures that interact with the environment.We assimilate or transform information from our environment into our existing mental structures.Our mental structures operate on the assimilated information and transform it in a process ofaccommodating to it. Thus, information from the environment transforms our mental structures,while at the same time our mental structures transform the information. This change is driven andcontrolled by the process of disequilibration. When our mental structures have accommodated to theassimilated information, we are in a state of equilibrium and have reached an 'accord of thought withthings' (Piaget 1963, p. 8). In accommodating the information, however, the altered mental structurecan become disequilibrated with related existing mental structures. The new structure must beorganized with respect to the old structures to develop a new equilibrated organization. In otherwords, we must bring the 'accord of thought with itself' (Piaget 1963, p. 8).
If learning spontaneously occurs through a process of assimilation accommodation andorganization, then instruction could take advantage by sequencing instructional activities to becompatible. In order to facilitate assimilation, instructional activities should expose the learner to asegment of the environment that demonstrates the information to be accommodated. This should befollowed by activities that help the learner to accommodate to the information. Finally, in order toorganize the accommodated information, activities should be developed that help the learner to seethe relation between the new information and other previously learned information. The parallelsbetween Piaget’s functioning model, the Learning Cycle Approach, and the activities of this projectare illustrated in the following table.

14
Piaget’sFunctioning Model
Learning CycleTeaching Model
Project Activities andMaterials
Assimilation Exploration Data Collection &Analysis
Accommodation Concept Invention Conclusions and/orInterpretation
Organization Application Application Activities
Bodner, G. M. (1986). Constructivism: A theory of knowledge. Journal of Chemical Education,63(10), 873-878.
Piaget, J. (1970). Structuralism (Chaninah Maschler, Trans.). New York: Harper and Row.
Piaget, J. (1963). The origins of intelligence in children. New York: Norton.
Lawson, A. E. (1995). Science teaching and the development of thinking. Belmont, CA: WadsworthPublishing Company.
Lawson, A. E., Abraham, M. R., & Renner, J. W. (1989). A theory of instruction: Using the learningcycle to teach science concepts and thinking skills [Monograph, Number One]. Kansas StateUniversity, Manhattan, Ks: National Association for Research in Science Teaching.
Cooperative Groups: Cooperative, collaborative, and/or group learning activities have beenshown to have many advantages over more individual learning modes (Johnson & Johnson, 1975,1979; Johnson, 1976). We have suggested how group learning and data pooling can be structured bythe teacher into our activities and materials.
Johnson, D. W. and R. T. Johnson (1975). Learning together and alone: Cooperation, competitionand individualization. Englewood Cliffs, New Jersey, Prentice Hall.
Johnson, D. W. and R. T. Johnson (1979). Cooperation, competition and individualization.Educational Environments and Effects. H. J. Walberg. Berkeley, California, McCutchen.
Johnson, R. T. (1976). “The relationship between cooperation and inquiry in science classrooms.”Journal of Research in Science Teaching 13(1): 55-63.
Linking Levels of Understanding: Chemistry has many special instructional problems thatshould be taken into account when instructional materials are developed and implemented inclassroom settings. A critical issue in instruction is the interrelationships of the three levels ofrepresentation of most chemistry concepts; the sensory, particulate, and symbolic levels (Gabel,Samuel et al. 1987; Kozma & Russell, et al., 1996). Sensory information derived from a chemicalprocess is explained by chemists in terms of particles (atomic and molecular behavior), which is thentranslated into symbols or formulas. The particulate nature of matter (PNM) is the very essence oftheoretical chemistry. Atomic and molecular behavior is an abstract construct that is used to explainmost chemical concepts. We know that students have difficulty understanding concepts at theparticulate level and with linking these three levels of understanding. This is a frequent source ofstudent misconceptions (Novick and Nussbaum 1981; Osborne, Cosgrove et al. 1982; Shepherd and

15
Renner 1982; Mitchell and Gunstone 1984; Griffiths and Preston 1989; Peterson, Treagust et al.1989; Haidar and Abraham 1991; Abraham, Williamson et al. 1994). Instructional materialsdesigned to aid the visualization of PNM using computer-generated, interactive, dynamicrepresentations of atomic level behavior have been shown to be effective (Williamson and Abraham,1995; & Abraham and Aldamash, 1996). These kinds of materials will form the base of the proposedcurriculum.
Abraham, M. R. & Aldahmash, A. (1996). The use of kinetic and static visuals in organic chemistry.Paper presented at the meeting of the National Association for Research in Science Teaching, StLouis, MO.Abraham, M. R., Williamson, V. M., & Westbrook, S. L. (1994). A cross-age study of theunderstanding of five chemistry concepts. Journal of Research in Science Teaching, 31(2), 147-165.Gabel, D. L., Samuel, K. V., & Hunn, D. (1987). Understanding the particulate nature of matter.Journal of Chemical Education, 64(8), 695-697.Griffiths, A. K. & Preston, K. R. (1989, March). An investigation of grade 12 student'smisconceptions relating to fundamental characteristics of molecules and atoms. . Paper presented atthe meeting of the National Association for Research in Science Teaching, San Francisco, CA.Haidar, A. H. & Abraham, M. R. (1991). A Comparison of applied and theoretical knowledge ofconcepts based on the particulate nature of matter. Journal of Research in Science Teaching, 28(10),919-938.Kozma, R. B., J. Russell, et al. (1996). The use of multiple, linked representations to facilitatescience understanding. International perspectives on the psychological foundations of technology-based learning environments. S. Vosniadou, R. Glaser, E. DeCorte and H. Mandel. Hillsdale, NJ,Erlbaum.Mitchell, I. & Gunstone, R. (1984). Some student conceptions brought to the study of stoichiometry.Australian Research in Science Education, 14, 78-88.Novick, S. & Nussbaum, J. (1981). Pupil's understanding of the particulate nature of matter: A cross-age study. Science Education, 65(2), 187-196.Osborne, R., Cosgrove, M., & Schollum, B. (1982). Chemistry and the learning in science project.Chemistry in New Zealand, 46(5), 104-106.Peterson, R. F., Treagust, D. F., & Garnett, P. (1989). Development and application of a diagnosticinstrument to evaluate grade-11 and -12 student's concept of covalent bonding and structurefollowing a course of instruction. Journal of Research in Science Teaching, 26(4), 301-314.Shepherd, D. L. & Renner, J. W. (1982). Students' understandings and misunderstandings of thestates of matter and density changes. School Science and Mathematics, 82(8), 650-665.Williamson, V. M. & Abraham, M. R. (1995). The effects of computer animation on the particulatemental models of college chemistry students. Journal of Research in Science Teaching, 32(5), 521-534.

16
2. Proposed Content for the Project (Scope and Sequence)
The scope and sequence of the proposed project is not unusual. It follows the path of manyavailable general chemistry texts. What we feel is innovative about the proposed curriculum is thetools that we will develop and how they offer a fully integrated teaching and learning package. Assuch the following proposed topics is not rigid. The authors are open to additions and subtractions tosuit the needs of potential users.
a. Topics
Chemistry IUnit 1 - Basic Concepts, Atoms, Molecules, & Ions -Unit 2 - Stoichiometry -Unit 3 - Thermochemistry -Unit 4 - Atomic Structure & Periodicity -Unit 5 - Molecular Structure & Bonding -Unit 6 - Properties of Gases -Unit 7 - Properties of Liquids, Solids, & Solutions -Unit 8 - Organic Chemistry
Chemistry IIUnit I - Kinetics -Unit II - Equilibrium -Unit III - Acid/Base -Unit IV - Aqueous Equilibrium -Unit V - Chemical Thermodynamics -Unit VI - Electrochemistry -Unit VII - Nuclear Chemistry -Unit VIII - Coordination Chemistry -
b. Sub Topics
Chemistry IUnit 1 - Basic Concepts, Atoms, Molecules, & Ions -
Metric Measurement and ConversionsSignificant FiguresBasic PeriodicityBasic Atomic TheoryFormulas and Nomenclature of Simple Compounds
Unit 2 - Stoichiometry -Molar MassesChemical EquationsMass and Molar and Molecular Reaction RelationshipsMolar Concentration
Unit 3 - Thermochemistry -CalorimetryEnthalpy in Physical and Chemical ChangeHess' Law

17
Enthalpies of FormationBond Energies
Unit 4 - Atomic Structure & Periodicity -LightLine SpectraEnergy LevelsQuantum NumbersElectron ConfigurationOrbitalsPeriodicity
Unit 5 - Molecular Structure & Bonding -PolaritySimple Bonding TypesLewis StructuresMolecular Geometry
Unit 6 - Properties of Gases -PressureIdeal Gas Law (Boyle’s Law, Charles’ Law, Gay Lussac, Avogadro)
Gas DensityMolar MassGas Stoichiometry
Dalton’s LawKMTGraham’s LawReal Gases
Unit 7 - Properties of Liquids, Solids, & Solutions -Phase ChangeIntermolecular BondingSolutions
Unit 8 - Organic ChemistrySimple NomenclatureFunctional GroupsIsomerism
Chemistry IIUnit I - Kinetics -
Collision TheoryRates, Rate Laws, and Rate ConstantsHalf LifeReaction ProfilesCatalystsActivation EnergyTemperature EffectsMechanisms
Unit II - Equilibrium -Law of Mass ActionEquilibrium StoichiometryLe Chatelier's Principle
Unit III - Acid/Base -

18
pHAcid/Base TheoriesStrong AcidsWeak AcidsA/B SaltsPolyprotic Acids
Unit IV - Aqueous Equilibrium -BuffersA/B Neutralization/TitrationSolubility Product
Unit V - Chemical Thermodynamics -EnthalpyEntropyGibbs EquationFree Energy and Equilibrium and Temperature
Unit VI - Electrochemistry -Balance Redox EquationsVoltaic CellsStandard PotentialsElectrical Potential, Equilibrium, and Free EnergyNon Standard ConditionsElectrolytic Cells
Unit VII - Nuclear Chemistry -Subatomic ParticlesPredict StabilityBalanced Nuclear EquationsHalf-Life & DatingNuclear Energetics
Unit VIII - Coordination Chemistry -Transition MetalsCoordination CompoundsIsomerismMagnetic and Color Properties
c. Learning Objectives:
Chemistry IUnit 1 - Basic Concepts, Atoms, Molecules, & Ions -1.1. Convert units (e.g., length, mass, volume, temperature) within a unit system1.2. Convert units (e.g. length, mass, volume, temperature) between unit systems.1.3. Combine measurements to calculate properties (e.g. density).1.4. Express measured and calculated quantities in exponential form.1.5. Express measured quantities in the proper number of significant figures.1.6. Express calculated quantities in the proper number of significant figures.1.7. Trace the historical development of theories of matter.1.8. State the name and symbol for the elements and their ions.1.9. Characterize the important subatomic particles.1.10. Determine the subatomic structure of atoms, ions, and isotopes. Use AZX charge notation.1.11. Characterize the various parts of the periodic table.

19
1.12. Name and write formulas for simple compounds.
Unit 2 - Stoichiometry -2.1. Determine atomic weights from isotope abundance.2.2. Relate formula weights and moles to weights and numbers of particles in a chemical formula.2.3. Determine the % composition of compounds.2.4. Determine molecular formulas from experimental analysis data.2.5. Write and balance simple chemical equations.2.6. Relate numbers of moles, grams, and particles in a chemical equation. (including limitingreagents)2.7. Determine and use molar concentration units.2.8. Use the MAVA = MBVB relationship to do dilution determinations.
Unit 3 - Thermochemistry -3.1. Utilize and convert different forms of energy.3.2. Determine the heat produced by a chemical or physical process from experimental data (calorimetry).3.3. Determine the heat produced during changes in state from experimental data.3.4. Given a thermochemical equation, calculate ∆ H for a given amount of reactant or product.3.5. Apply Hess’ Laws to determine ∆ H for reactions.3.6. Apply standard ∆ Hf to determine ∆ Hrxn of reactions.3.7. Use bond energies to predict ∆ Hrxn.
Unit 4 - Atomic Structure & Periodicity -4.1. Relate color, l, speed, and energy of light being released or absorbed by atoms.4.2. Interpret the line spectrum of an atom in terms of quantum mechanics.4.3. Describe the location and nature of electrons in an atom or ion in terms of: (a) quantumnumbers, (b) energy level diagrams, (c) electron configuration, and (d) orbital shape.4.4. Relate the periodic table to electron configurations.4.5. Predict trends; similarities, and differences of physical and chemical properties of elementsusing the periodic table and electron configuration. (e.g. ionization energy, radius, formulas,reactivity)
Unit 5 - Molecular Structure & Bonding -5.1. Predict the relative polarity and ionic/covalent character of bonds and molecules.5.2. Identify simple bonding types.5.3. Draw Lewis structures of ions and molecules.5.4. Identify resonance structures for molecules.5.5. Determine the geometric arrangement of atoms in a molecule.5.6. Predict the types of orbitals (including hybrids) involved in bonding and resulting bond types(sigma, pi).
Unit 6 - Properties of Gases -6.1. Describe measuring gas pressures using barometers and manometers. Relate pressure units.6.2. Apply the ideal gas law to relate and calculate values for pressure, volume, temperature,and amount of a gas.6.3. Apply Dalton’s Law of partial pressure to calculate the pressure of combined gases and tocalculate the partial pressures of gases in mixtures.6.4. Describe gases in terms of KMT.

20
6.5. Relate MW and speeds of molecules using Graham’s law.6.6. Distinguish between ideal and real gases.
Unit 7 - Properties of Liquids, Solids, & Solutions -7.1. Use KMT to explain the general properties of liquids and solids and to explain phase changes.7.2. Classify intermolecular bonds and predict relative properties of chemical substances.7.3. Describe the structure and properties of liquids.7.4. Describe the structure and properties of solids.7.5. Interpret phase diagrams.7.6. Identify the composition of a solution.7.7. Characterize the dissolving process. Characterize hydrolysis.7.8. Predict products of precipitation reactions.7.9. Characterize solutions as strong electrolytes, weak electrolytes, and nonelectrolytes.
Unit 8 - Organic Chemistry8.1. Describe the bonds associated with organic molecules.8.2. Use IUPAC system to name simple organic compounds.8.3. Identify types of organic molecules according to functional group.8.4. Characterize the simple reactions of organic molecules.8.5. Identify isomers of simple organic compounds.8.6. Characterize the formation of polymers.
Chemistry IIUnit I - Kinetics -1.1. Express and compare rates of chemical reactions in terms of the concentration changes of thereactants and products (or factors proportional to concentration) per unit time.1.2. Use collision theory to explain how chemical reactions occur and how rates are affected.1.3. From experimental kinetics data, derive the rate law, order, and rate constant for a chemicalreaction.1.4. For a zero, first or second order reaction, determine the exact rate constant and half-life for achemical reaction from time/concentration data.1.5. From a reaction profile, determine ∆H & Ea for a chemical reaction. [Readings 16.6 Problem 62]1.6. Explain the role of catalysts, what they are, how they work, and how they affect a reactionprofile.1.7. From kinetic data, determine the relationship between Ea, k, and the temperature of bothcatalyzed and uncatalyzed chemical reactions.1.8. Determine the relationship between the rate law and the mechanism of a simple chemicalreaction.
Unit II - Equilibrium -2.1. Characterize chemical reactions in terms of reversibility and relative concentrations of reactantsand products.2.2. Determine equilibrium expressions for homogeneous and heterogeneous chemical reactionsfrom stoichiometry.2.3. Determine the stoichiometric relationship between initial and equilibrium concentrations ofreactants and products.2.4. Determine the relationship between Kold and Knew when a chemical reaction is reversed or

21
multiplied by a constant factor of n.2.5. Determine the relationship between KC and KP for a chemical reaction involving gaseouscomponents.2.6. Determine value for K from equilibrium concentrations of reactants and products in a chemicalreaction.2.7. Determine the equilibrium concentrations of reactants and products of a chemical reaction frominitial concentrations and value of K.2.8. Determine if equilibrium has been reached in a chemical reaction; determine the direction thereaction will shift if equilibrium has not been reached.2.9. Use Le Châtelier’s Principle to predict the direction a reaction at equilibrium will shift as aresult of changes in concentration, pressure/volume, and temperature as it approaches a newequilibrium.
Unit III - Acid/Base -3.1. Relate [H+], [OH-], and KW in an aqueous solution.3.2. Determine the pH and/or pOH of an aqueous solution from the [H+] (or [OH-]) and v.3.3 Define acids and bases in terms of Arrhenius, and Brönsted-Lowry theories.3.4. Recognize and construct conjugates of acids or bases.3.5. Determine the [H+], [OH-], pH and/or pOH of a strong acid or strong base solution.3.6. Determine and relate equilibrium concentrations, [H+], [OH-], pH and/or pOH with Ka values forweak acids (also, same for Kb values for weak bases).3.7. Determine the [H+], [OH-], pH and/or pOH for weak acids or weak bases from initialconcentrations.3.8. Construct an ordered list of strongest to weakest (or v.v.) for acids or bases.3.9. Determine the Kb for a weak base, given the Ka value of its conjugate acid (v.v.).3.10. Determine the [H+], [OH-], pH and/or pOH of a salt solution.3.11. Qualitatively determine the acidic, basic, or neutral properties of a salt.3.12. Identify acids and bases using Lewis theory.3.13. Determine the [H+], [OH-], pH and/or pOH of weak and strong polyprotic acids.
Unit IV - Aqueous Equilibrium -4.1. Define and make buffer solutions from (1) a weak acid and its conjugate base, (2) a weak baseand its conjugate acid, (3) a weak acid and a strong base, and (4) a weak base and a strong acid.4.2. Determine the pH of a buffer solution from concentrations and v.v.4.3. Make a buffer with a specific pH. [Readings 19.1 Problems 23,25]4.4. Determine the conjugate pair best suited to make a buffer of desired pH.4.5. Analyze a strong acid/strong base titration (including polyprotic) (determine end point locationand entire pH curve, including pH at beginning, pH at end point, and pH at all other points).4.6. Analyze a titration of a weak acid or base with a strong base or acid (determine end pointlocation and entire pH curve, including pH at beginning, pH at end point, and pH at all other points).4.7. Determine the KSP equilibrium expression for a partially soluble salt.4.8. Determine the KSP value, given the solubility of a salt (v.v.).4.9. Determine the effect of a common ion on the solubility of a partially soluble salt.
Unit V - Chemical Thermodynamics -5.1. Apply Hess’ Laws to thermodynamic quantities.5.2. Determine ∆H° for a chemical reaction from ∆Hf° values of reactants and products.5.3. Predict the qualitative change in enthalpy for various chemical reactions.5.4. Predict and compare the qualitative change in entropy for various chemical reactions and

22
physical processes.5.5. Determine ∆S° for a chemical reaction from S° values of reactants and products.5.6. Determine ∆G° for a chemical reaction from the Gibbs equation.5.7. Determine ∆G° for a chemical reaction from ∆Gf° values of reactants and products.5.8. Determine ∆G for a chemical reaction from ∆G° and the reaction quotient, Q.5.9. Predict whether a chemical reaction, as written, is spontaneous, non-spontaneous, or atequilibrium.5.10. Calculate the standard free energy for a chemical reaction from the equilibrium constant (v.v.).5.11. Determine the equilibrium temperature, Te, for a chemical reaction from ∆H° and ∆S° (v.v.).
Unit VI - Electrochemistry -6.1. Assign oxidation numbers (oxidation states) to individual elements in a chemical compound orcomplex ion.6.2. Recognize redox reactions; distinguish from reactions not involving oxidation/reduction.6.3. Stoichiometrically balance both half-reactions and cell reactions involving redox.6.4. Draw a diagram of a voltaic (galvanic, spontaneous) cell and explain how it works, predictingchanges that will occur during discharge.6.5. Define and identify anode, cathode, oxidation process, reduction process, oxidizing agent, andreducing agent for a redox reaction.6.6. Calculate E° for a chemical reaction using a standard reduction potential table.6.7. Predict the products of a redox reaction.6.8. Calculate and relate values of E°, ∆G°, and K for an oxidation-reduction reaction.6.9. Calculate E for a redox reaction under non-standard conditions of constituent concentrationsand/or pressures.6.10. Draw a diagram of an electrolytic (non-spontaneous) cell and explain how it works, predictingchanges that will occur during operation.6.11. Construct a line notation for an electrochemical cell from information concerning the anode,cathode, oxidation process, reduction process, oxidizing agent, and/or reducing agent (v.v.).6.12. Relate the amount of product(s) produced and/or reactant consumed in an electrolytic cell tothe current used, time involved, and moles of electrons associated with the corresponding half-reaction.
Unit VII - Nuclear Chemistry -7.1. Identify the number of protons and neutrons found in the nucleus of any atom.7.2. Identify the symbols representing various subatomic particles.7.3. Using N and Z relationships for individual nuclides, predict stability/instability (non-radioactivity/radioactivity).7.4. Write balanced equations for nuclear reactions including decay, transmutation, fission, & fusion.7.5. Identify missing nuclear particles in a nuclear reaction.7.6. Determine the half-life, beginning amount, final amount, or elapsed time in a radioactive decayreaction.7.7. Use radioactive (e.g. carbon-14) dating techniques to calculate the age of a substance.7.8. Determine the mass defect, binding energy, and binding energy per nucleon for a nuclearparticle.7.9. Determine the energy absorbed or released in a nuclear reaction.
Unit VIII - Coordination Chemistry -8.1. Determine the electronic configurations of transition metals and metal ions.8.2. Recognize and identify coordination compounds and their components.

23
8.3. Determine oxidation number, coordination number, orbitals used in bonding, and geometry ofthe central metal atom in coordination compounds and complexes.8.4. Describe the bonding effects of polydentate ligands.8.5. Given their formulas, name coordination compounds and complexes (and v.v.).8.6. Recognize, describe, and identify structural isomers (coordination & linkage) and stereoisomers(geometrical and optical) of coordination complexes.8.7. Explain spin state and the magnetic and color properties of transition elements.8.8. Relate and predict electronic structure, field strength (∆), spin state, and magnetic and colorproperties of coordination complexes in octahedral, tetrahedral, and square planar environments.8.9. Relate and predict electronic structure, field strength (∆), spin state, and magnetic and colorproperties of coordination complexes based on ligand strength.

24
3. Sample Macroscopic Laboratory (Gas Laws)
Gas Pressure and Volume RelationshipsExp. E-1A
Name________________________________ Lab Section______________________
Lab Partner___________________________
Problem Statement: How are the pressure and volume of a gas sample related?
I. Data Collection:
Figure A
A. Obtain a pressure measuring device as indicated by your lab instructor. Obtain a 60 mLsyringe, fill it with air, and connect the syringe to the gas measuring device as indicated in figure A.Test your apparatus for gas leaks. If you can’t eliminate all leaks, see your lab instructor.
B. If necessary, calibrate your gas measuring device as indicated by your lab instructor. Fillyour syringe to the largest volume mark on the syringe and reconnect it to the gas measuring device.What is the pressure of the trapped air in the syringe? Explain.

25
C. Depress the plunger of the syringe and describe the system. Is the pressure of the trappedair greater or less than atmospheric pressure? Explain.
D. Release the plunger of the syringe. Adjust the plunger to the 60 mL mark. Record thepressure reading of the trapped air in the following table. Compress the trapped air by pushing on theplunger. Note the volume of the trapped air, close the stopcock to trap the pressure, and then note thepressure reading on the pressure device. Record these data in the following table. Take volume andpressure readings for a total of ten compressions down to as small a syringe volume as is practical.Obtain atmospheric pressure. Record these values in the following table.
Atmospheric pressure=_________torr at______________(time),____________(date)
Pressure Reading Syringe Volume
_____________ ____________
_____________ ____________
_____________ ____________
_____________ ____________
_____________ ____________
_____________ ____________
_____________ ____________
_____________ ____________
_____________ ____________
_____________ ____________

26
II. Data Analysis:
A. If necessary, calculate the total pressure of the trapped air for each reading and record itin the following table. Show how you calculate this pressure for your first reading in the spacebelow.
B. Calculate the total volume of the trapped air for each reading and record it in thefollowing table. Show how you calculated this volume for your first reading. (Hint: treat the volumein the tubing and the pressure measuring device as a cylinder, V = π r2 l.)
Data Table
Pressure Total Volume
_____________ ____________
_____________ ____________
_____________ ____________
_____________ ____________
_____________ ____________
_____________ ____________
_____________ ____________
_____________ ____________
_____________ ____________
_____________ ____________

27
C. What patterns are shown in these data? It might be helpful to graph the data. Try to comeup with an algebraic equation that expresses the pattern you found.
III. Interpretation and Conclusions:
A. How are the pressure and volume of a gas sample related?
B. Mental Model - Draw a picture(s) that explains how the pressure and volume of a gassample are related at the level of atoms and molecules and that illustrates the observations you madein the experiment. In words, explain how your picture(s) illustrate(s) this relationship.

28
Gas Pressure and Temperature RelationshipsExp. E-1B
Name________________________________ Lab Section______________________
Lab Partner___________________________
Problem Statement: How are the pressure and temperature of a gas sample related?
I. Data Collection:
A. Obtain a pressure measuring device as indicated by your lab instructor. Assemble a 125mL Erlenmeyer flask with thermometer, tubing, and a 1000 mL beaker as shown in figure A.Connect this via a three way stopcock to the pressure measuring device and test for gas leaks. If youcan’t eliminate all leaks, see your lab instructor.
Figure AB. If necessary, calibrate your gas measuring device as indicated by your lab instructor.
Using a ring and wire gauze, support the 1000 mL beaker so that a gas burner can be used to heat thebeaker. Using a clamp, suspend the flask in the beaker so that only its neck is above the beaker rimand does not touch the sides or bottom of the beaker.
Fill the beaker with tap water to about 1 1/2 cm from the rim. Be careful to not get anywater into the flask.
Adjust the stopcock so that the flask is vented to the outside. Using a gas burner, heat thewater to a temperature of 80-85˚ C using a second thermometer dipped directly into the water. Thewater should be constantly stirred during the heating process. The thermometer can be used, but caremust be taken to not break the fragile thermometer.
When the temperature reaches 80-85˚ C, remove the heat. When the thermometermeasuring the air temperature inside the flask reaches a maximum, adjust the stopcock to connectthe flask to the pressure measuring device while closing the vent to the outside. While continuing togently stir the water, allow the temperature to drop about 5˚ C.
C. Record the temperature and pressure reading in the following table. Allow thetemperature to cool approximately another 5˚ C while continuing to stir the water. Record thetemperature of the gas sample and the pressure reading in the following table. Using the procedureoutlined above continue to record readings at approximately 5˚ C intervals until a temperature ofabout 15˚ C is reached.

29
Notes:1. If the system leaks at any time, the experiment must be restarted2. Cooling can be hastened by adding small amounts of ice to the water. However, to
insure the temperature of the gas sample has been equalized, stir for at least 3 minutes after the icehas disappeared before taking readings.
3. Excess water can be removed from the beaker. However, the water level should be atmost 3 cm from the rim.
II. Data Analysis:
A. If necessary, calculate the total pressure of the trapped air for each reading and record itin the following table. Show how you calculated this pressure for your first reading in the spacebelow. Obtain atmospheric pressure. Record these values in the following table.
Atmospheric pressure=_________torr at______________(time),____________(date)
Data Table
Pressure Reading Temperature (˚ C) Pressure of Trapped Gas
_____________ ____________ ____________________
_____________ ____________ ____________________
_____________ ____________ ____________________
_____________ ____________ ____________________
_____________ ____________ ____________________
_____________ ____________ ____________________
_____________ ____________ ____________________
_____________ ____________ ____________________
_____________ ____________ ____________________
_____________ ____________ ____________________

30
B. What patterns are shown in these data? It might be helpful to graph the data. Try to comeup with an algebraic equation that expresses the pattern you found.
C. (Optional) Estimate the temperature of a gas when the pressure is reduced to zero.Discuss the significance of this temperature.
III. Interpretation and Conclusions:
A. How are the pressure and temperature of a gas sample related?
B. Mental Model - Draw a picture(s) that explains how the pressure and temperature of a gassample are related at the level of atoms and molecules and that illustrates the observations you madein the experiment. In words, explain how your picture(s) illustrate(s) this relationship.
31
Gas Volume and Temperature RelationshipsExp. E-1C
Name________________________________ Lab Section_______________________
Lab Partner___________________________
Problem Statement: How are the volume and temperature of a gas sample related?
I. Data Collection:
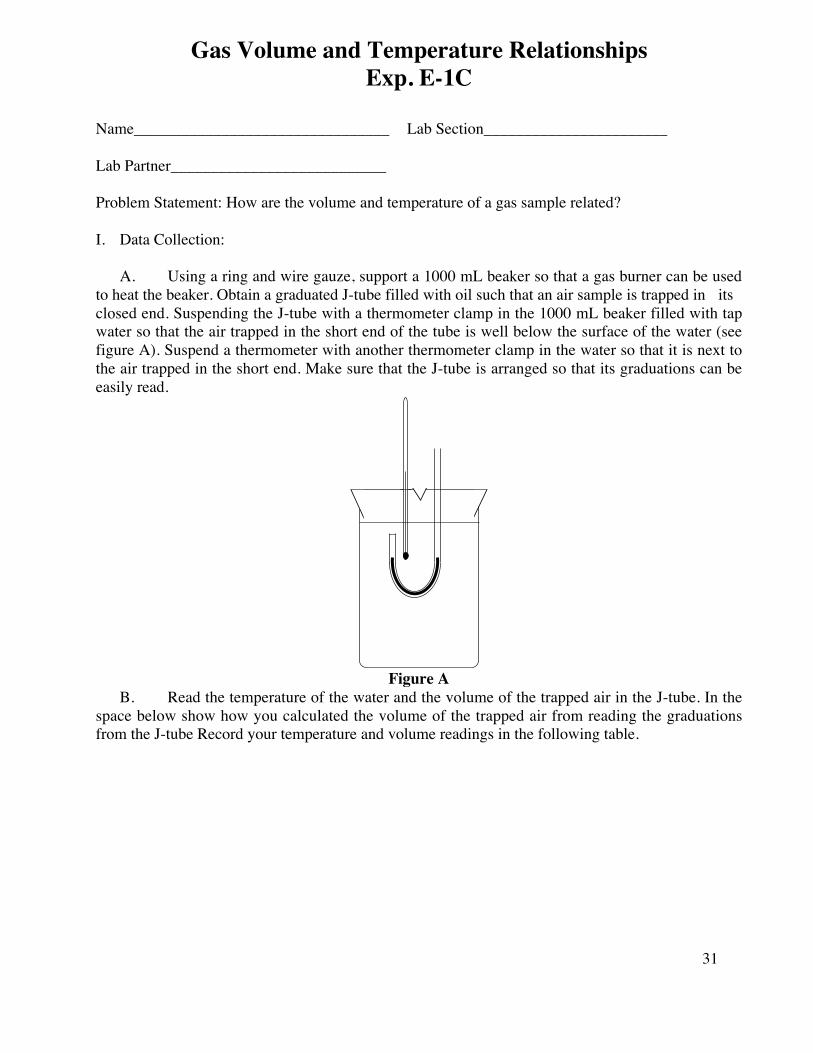
A. Using a ring and wire gauze, support a 1000 mL beaker so that a gas burner can be usedto heat the beaker. Obtain a graduated J-tube filled with oil such that an air sample is trapped in itsclosed end. Suspending the J-tube with a thermometer clamp in the 1000 mL beaker filled with tapwater so that the air trapped in the short end of the tube is well below the surface of the water (seefigure A). Suspend a thermometer with another thermometer clamp in the water so that it is next tothe air trapped in the short end. Make sure that the J-tube is arranged so that its graduations can beeasily read.
Figure AB. Read the temperature of the water and the volume of the trapped air in the J-tube. In the
space below show how you calculated the volume of the trapped air from reading the graduationsfrom the J-tube Record your temperature and volume readings in the following table.

32
C. Using a gas burner, heat the water to a temperature of 75-80˚ C. The water should beconstantly stirred during the heating process. When the temperature reaches 75-80˚ C, remove theheat. Allow the temperature of the trapped air to equalize with the water temperature by continuingto gently stir the water and allowing the temperature to drop about 5˚ C. At that point read thetemperature and volume of the trapped air and record these values in the following table. Using theprocedure outlined above continue to record readings at approximately 5˚ C intervals until atemperature of about 15˚ C is reached.
Notes:1. Cooling can be hastened by adding small amounts of ice to the water. However, to
insure the temperature of the trapped air has been equalized, stir for at least 3 minutes after the icehas disappeared before taking readings.
2. Excess water can be removed from the beaker. However, make sure the J-tube remainssubmerged well below the water level.
Data Table
Temperature Volume
_____________ ____________
_____________ ____________
_____________ ____________
_____________ ____________
_____________ ____________
_____________ ____________
_____________ ____________
_____________ ____________
_____________ ____________
_____________ ____________
_____________ ____________
_____________ ____________

33
II. Data Analysis:
A. What patterns are shown in these data? It might be helpful to graph the data. Try to comeup with an algebraic equation that expresses the pattern you found.
B. (Optional) Estimate the temperature of a gas when the volume is reduced to zero. Discussthe significance of this temperature.
III. Interpretation and Conclusions:
A. How are the volume and temperature of a gas sample related?
B. Mental Model - Draw a picture(s) that explains how the volume and temperature of a gassample are related at the level of atoms and molecules and that illustrates the observations you madein the experiment. In words, explain how your picture(s) illustrate(s) this relationship.

34
E. GAS SYSTEMSOpen Inquiry Laboratory
System 1
Investigate and compare the behavior of gases other than air. Possibilities include oxygen (can begenerated by heating potassium chlorate with a pinch or manganese dioxide as a catalyst), or carbondioxide (can be generated by adding dilute acid to calcium carbonate). CAUTION!!! When dilutingacids extreme care must be taken not to allow the acid to come into contact with your skin or clothes.Also add acid to water, not vice versa, when diluting.
System 2
Investigate and compare the vapor pressures of pure liquids with combinations of these liquids. Seeyour instructor for suggested liquids.
System 3
Investigate the relationship between the amount of gas and its pressure at constant temperature andvolume.
System 4
Investigate and compare the vapor pressures of liquids using different sized flasks.
System 5
Investigate and compare the vapor pressures of pure liquids with solutions of those liquidscontaining measured amounts of dissolved solid chemicals.
System 6
Investigate the relationship between the density of air and temperature. (Hint: Derive an equationrelating the change in mass of air at different temperatures at constant pressure and volume.)
System 7
Investigate the molecular weight of gases from the mass of a measured volume. CO2 and CH4 areexamples.
System 8
Investigate any other gas system or investigate a modification of any of the above systems. Forsafety reasons, discuss your system with the lab instructor before proceeding.

35
4. Parallel Submicroscopic LaboratoryMoLE Gas Laws Activities*
To begin this assignment you must be able to log on to the Internet using Internet Explorer(Microsoft) 4.5 or higher. If you do not have the current version of the browser, go tohttp://www.microsoft.com/downloads and follow the instructions on the page. You will needInternet Explorer for your particular operating system. If you have any difficulties contact yourinstructor.
Once the browser is running, type the following address into the location-input line near thetop of the Internet Explorer window:
(see referenced web site)This will load the Gas Simulation. Once you have the simulation is running your screen will looklike what is shown in left hand section of Figure I. below.
Figure I.
There are three important regions that require some discussion. The Gas Sample Region hasthe most activity. It is a container with a plunger. To explore the behavior of the gas sample youcan change the variables located in the Control Bar Region. The Control Bar Region shows
* ”
Control Bar Region
Gas Sample RegionGraphing Region

36
five scrollbars: pressure (in units of atmospheres), volume (in units of liters), mol of gas (one for Hegas and the other for Ne gas), and temperature (in units of Kelvins). To the left of each scrollbar is aradio button. When selected, that particular variable (called the dependent variable) is calculatedbased on the value of the other four variables. In the default mode the pressure scrollbar's radiobutton is selected so the pressure of the gas sample is calculated.
As a simple exploration try moving each of the scrollbars and observe the effect on the gassample. These effects will be addressed in more detail in this experiment.
There are three buttons immediately below the Control Bar Region. The Pause button willsuspend the motion in the gas sample, the Reset button returns the program to the default conditions,and the Enable Tracking button turns a red tracking line on and off.
Below the Pause Button is a fourth button different from the previous three in that it is adropdown menu. Clicking and holding the mouse button will reveal three choices: Velocities(default); Relations (graphing); and Help.
Figure II.
The default mode is Velocities. The Velocity Distribution Region shows a plot of thevelocity distribution in the gas sample (see Figure II.). The y-axis of this plot represents the numberof particles. The x-axis represents the range of velocities starting at zero. The bars in this plotrepresent the velocities of the particles in the Gas Sample Region. As the velocities of the particleschange, the plot is redrawn. The smooth curved line in the plot represents the ideal distribution of thevelocities for the gas sample. The vertical line represents the average (root-mean-square average)velocity of the sample. Observe the behavior of this region while changing each of the variables inthe Control Bar Region. In the Gas Sample Region, one of the particles is labeled with a red dot.This same particle is identified in red in the velocity distribution plot. If you click on the enabletracking button, you can follow the path of the particle. The length of the tail represents a fixed unitof time, and consequently can be used as a measure of the velocity of the particle. If you pause themotion of the particles, you can click on different particles to get a measure of their velocity.
A second choice from the drop down menu is the Relations view. This choice reveals an x,ygraph with a dropdown menu on each axis. Selecting the dropdown menu on either axis provides alist of the variables shown in the Control Bar Region. The two buttons, Enable and Multiple are usedwhen plotting pairs of variables. If you select pressure for the y-axis and volume for the x-axis, andthe click on “Enable,” these same variables are activated in the Control Bar Region. By scrolling thevolume slide bar in the Control Bar Region you will trace out a plot that will look similar to FigureIII.

37
Figure III.
The Multiple Button allows two or more plots to be superimposed. Select Pressure and Volume asthe variable to be plotted on your graph. Then click on the Multiple button and adjust thetemperature to 400 K. Click on the Enable button and scroll the Volume slide bar. Click on theDisable button and change the temperature to 200 K. Click on the Enable button and scroll theVolume slide bar. Repeat this process for the minimum temperature. You will see a graph that lookssimilar to Figure IV.
Figure IV.
Got the hang of it? If you have any questions check with another student in the class, yourinstructor.