an independent verification of education sector data in
TRANSCRIPT

2020
An Independent Verification of Education Sector Data in
Indonesia
THE WORLD BANK
SANTOSO, JAVIER LUQUE, NOVIANDRI NURLAILI KHAIRINA, AND WISNU HARTO ADI WIJOYO
Pub
lic D
iscl
osur
e A
utho
rized
Pub
lic D
iscl
osur
e A
utho
rized
Pub
lic D
iscl
osur
e A
utho
rized
Pub
lic D
iscl
osur
e A
utho
rized

i
This report is a product of the staff of the World Bank, supported by funding from the Australian government. The findings, interpretations, and conclusions expressed in this report do not necessarily reflect the views of the Executive Directors of the World Bank or the governments they represent, or the Australian government. The World Bank does not guarantee the accuracy of the data included in this work. The boundaries, colors, denominations, and other information shown on any map in this work do not imply any judgment on the part of the World Bank concerning the legal status of any territory or the endorsement or acceptance of such boundaries. © 2020 The World Bank 1818 H Street NW, Washington DC 20433 Telephone: 202-473-1000 www.worldbank.org The material in this publication is copyrighted. Copying and/or transmitting portions or all of this work without permission maybe a violation of applicable law. The World Bank encourages dissemination of its work and will normally grant permission to reproduce portions of this work promptly. For permission to photocopy or reprint any part of this work, please send a request with complete information to the Copyright Clearance Center, Inc., 222 Rosewood Drive, Danvers, MA 01923, USA, telephone 978-750-8400, fax 978-750-4470, http://www.copyright.com/. All queries on rights and licenses, including subsidiary rights, should be addressed to World Bank Publications, The World Bank Group, 1818 H Street NW, Washington, DC 20433, USA; fax: 202-5222625; e-mail: [email protected].

ii
Acknowledgements
This report was prepared by a team led by Noah Yarrow composed of Santoso, Javier Luque, Noviandri
Nurlaili Khairina, and Wisnu Harto Adi Wijoyo. The report was prepared under the overall guidance of
Toby Linden (Practice Manager, Education, East Asia and Pacific).
Funding from the Australian Government, Department of Foreign Affairs and Trade supported the
research and production of the report.
iii
Table of Contents Executive Summary ................................................................................................................................. 1
1. Introduction .................................................................................................................................... 2
2. Methodology ................................................................................................................................... 4
3. Data Management Policy ................................................................................................................ 4
(a) MoEC’s Policy.......................................................................................................................... 4
(b) MoRA’s Policy ......................................................................................................................... 4
4. Findings ........................................................................................................................................... 5
(a) Student Data ........................................................................................................................... 5
(b) Student Characteristics: KIP, PKH, Travel Time and Distance Data .......................................... 7
(c) Number of Classes Data ................................................................................................................ 8
(d) Teacher Data ................................................................................................................................. 9
(e) Teacher Absenteeism ........................................................................................................... 11
(f) School Infrastructure Data: Number of Classrooms and School Conditions .......................... 12
(g) Laboratory Facilities Data .................................................................................................... 15
(h) Data on WASH Facilities ....................................................................................................... 17
(i) Whiteboard, Desktop and Laptop Data ................................................................................... 19
5. Analysis ......................................................................................................................................... 21
6. Summary of Main Findings ........................................................................................................... 22
7. Recommendations ........................................................................................................................ 23
References ............................................................................................................................................ 25
ANNEX 1 ................................................................................................................................................ 27
ANNEX 2 ................................................................................................................................................ 28
ANNEX 3 ................................................................................................................................................ 32

1
Executive Summary
Reliable and timely data on key education sector status and performance measures are essential for
effective policy- and decision-making. Cognizant of this, education organizations around the world are
upgrading their information systems to include comprehensive data on students, teachers, school
conditions, and student learning outcomes. The coexistence of two administrative systems in
Indonesia, one under the Ministry of Education and Culture (MoEC) and the other under the Ministry
of Religious Affairs (MoRA), as well as the decentralized nature of the education sector, results in
duplication of data records. This report presents the first external systematic effort to assess the
quality of education data gathered by MoEC and MoRA. The study team visited 192 schools and
madrasahs in six provinces between April and May 2019 to compare data registered in the system
with independent observations made during unannounced school visits.
The study found data discrepancies in all data categories. While, for some indicators, such as number
of classes and number of students receiving social assistance programs, there were data reporting
inaccuracies for only a small proportion of sampled schools, they were much higher for others.
Discrepancies between the numbers of reported students and observed students were found in more
than 40 percent of sampled schools. These discrepancies could potentially have significant
implications since the respective ministries use these data for budget allocation purposes. For
example, the number of students in Data Pokok Pendidikan (Dapodik) and the Education Management
Information System (EMIS) is used for the school grant program (Bantuan Operasional Sekolah, BOS)
budgeting process, while information on classroom conditions is used to allocate infrastructure grants.
Extrapolating from the discrepancies we observed to the whole system, it is conceivable that the
Government of Indonesia (GoI) may have misallocated as much as IDR 960.8 billion (about US$$66.2
million) of its BOS budget in 2019.
Mechanisms for data verification and regular data audits can be developed to improve the validity and
accuracy of data used for budgeting and other decision-making purposes, as MoRA is now starting to
do as part of the ‘Realizing Education’s Promise’ project. The first step is to build a system to enable
monitoring of the quality of data by having the school supervisor verify data reported in Dapodik and
EMIS and the results of the verification reported to the district/city and provincial education
authorities. Through this verification, the ministries and education offices may be able to identify
errors in the reported data.

2
1. Introduction
Education organizations around the world are continually upgrading their information systems to
include comprehensive data on students, teachers, school conditions, and student learning outcomes.
Reliable and timely data regarding key education sector status and performance measures are
essential for well-informed decision-making and adequate policy-making. Makwati, Audinos, and
Lairez (2003) find that the achievement of good quality education is partially dependent on the quality
of information that informs the policy formulation and educational planning, as well as management
and monitoring processes. These data systems take advantage of progress in information technology,
which allows faster and more reliable data-entry, data-sharing, and report generation. New data
systems empower education policymakers around the world to distribute their resources more
efficiently and effectively, while relying on teachers and schools to track essential data. Effective and
high-performing Education Management Information Systems (EMIS) are useful for teachers and
schools in tracking classroom learning practices, teacher development and student performance,
among other performance indicators (Abdul-Hamid, 2014). Indonesia has a long tradition of using data
in the education sector, but this has led to the development of several overlapping data systems,
creating duplication. This is further compounded by decentralization of the education system and the
coexistence of two educational subsystems: one under the Ministry of Education and Culture (MoEC),
with about 85 percent of total enrolment, and another under the Ministry of Religious Affairs (MoRA),
with about 15 percent of total enrolment.1
In 2015, MoEC established a single-data-system policy through MoEC Regulation No. 79/2015. The
regulation created Data Pokok Pendidikan (Dapodik) as a comprehensive information system, which
was expected to become a reference for all education data. The system covers data entry and data
management, while produces reports for internal and external purposes for MoEC. Dapodik is
accessible to all schools, district education officers, and MoEC officers. In practice, basic data from
MoRA schools are included in Dapodik. This is partly due to the regulation that all identification (ID)
data of MoRA education entities (school IDs, student IDs, and teacher IDs) must be contained in the
MoEC data system. The IDs are, for instance, a requirement to participate in the national examination.
MoRA has also been improving its data management but does not yet have a single-data-system
policy. MoRA has at least 18 applications that manage its data.2 The World Bank identified several
overlapping areas across the applications that MoRA currently uses. The primary system in MoRA is
the EMIS, which gathers information on students, teachers, and school infrastructure. This is
complemented by other systems, including Sistem Informasi Pendidik dan Tenaga Kependidikan
Kemenag (Simpatika), which focuses on teacher data, and Sistem Informasi dan Administrasi Guru
Agama (Siaga), which focuses on Islamic religious teachers in MoEC schools. These information
systems are being integrated and streamlined with support from the World Bank.3
Both MoEC and MoRA make extensive use of the data generated by their respective systems, a key
indicator of high-performing systems (WDR 2018). For example, both ministries use information on
the number of students for Bantuan Operasional Sekolah (BOS) allocation purposes. MoRA also uses
EMIS data for school accreditation, while MoEC uses the infrastructure data in Dapodik to allocate
grants to support school infrastructure. Teacher information from Simpatika is used to disburse the
teacher professional allowance (tunjangan profesi guru, TPG). Nonetheless, to date, there have been
1 Total enrolment for pre-tertiary education, excluding ECED. 2 The World Bank: MoRA Education Data Management System, collaboration with Datacom Systems Asia Sdn Bhd, 2019. 3 https://projects.worldbank.org/en/projects-operations/project-detail/P168076?lang=en

3
only limited efforts to monitor the quality of the data captured in the system. There has been little
research on MoRA’s EMIS; one of the most recent publications is the 2003 project completion report
of the Asian Development Banks (ADB’s) Basic Education Project, when the EMIS was first established
at the central and provincial levels. Other documents simply emphasize the importance of having an
effective EMIS for both MoEC and MoRA to monitor the status and condition of schools (Bappenas,
2015).
This document presents the first known systematic effort to assess the quality of the data gathered
by MoEC and MoRA. To assess the accuracy of the data, unannounced visits were conducted to a
representative sample of schools by a team of trained observers. These independent school
observations were later compared with the official data records. This report compares collected data
with the data in the respective ministry systems and identifies the shortcomings of current data
management approaches in MoEC and MoRA, which might adversely affect data quality and
subsequent decisions made using this information.
This report was produced jointly by the World Bank, together with MoEC and MoRA. The World Bank
received financial support from the Government of Australia’s Department of Foreign Affairs and
Trade (DFAT) through the “Improving Dimensions of Teaching, Education Management and Learning
Environment” (ID-TEMAN) Trust Fund. This Trust Fund aims to support Indonesia to improve learning
outcomes through better policy, operations, and implementation.

4
2. Methodology
This assessment compares data captured in the information systems of MoEC and MoRA with data
collected by a team of observers during unannounced school visits. Variables relating to students,
teachers and school conditions were selected for analysis, in consultation with MoEC and MoRA. The
observers were trained in data collection methods. In some cases, data verification involved a simple
headcount of students and teachers, while in others the observers had to make trained judgements
based on ministry standards, for example, to assess the condition of school infrastructure. In addition,
the observers conducted in-depth interviews with principals at schools/madrasahs and officials from
education offices or MoRA offices, to explore possible reasons for the differences between the data
on the system and collected information.
This study used a sample of 192, comprising 116 MoEC schools and 76 MoRA schools. Schools were
selected from across Indonesia through a multi-stage random selection process. The visits were
conducted between April and May 2019. In each visit, the observer visited both the school and the
relevant district/provincial education office. For a discussion of the technical considerations related
to sample design/selection, please refer to Annex 1.
3. Data Management Policy
(a) MoEC’s Policy MoEC Regulation No. 79/2015 established a single database (Dapodik) to be managed by a sole data
agency within MoEC. Some directorates within MoEC are responsible for collecting data from schools,
but the Dapodik team is required to store, classify, and verify the data. All internal and external data-
users should only refer to Dapodik for education data. According to the regulation, relevant
directorates should use Dapodik’s data to make estimates for planning, budgeting, and policy-making
purposes. For example, the Directorate of Teachers uses Dapodik data to calculate teacher
professional allowances, which amounted to IDR 56.9 trillion (about US$3.85 billion) in 2019.
Dapodik uses a semi-online data mechanism, which means that schools complete the Dapodik form
electronically offline and then submit it online, to be uploaded into the central database of Dapodik
in MoEC. District education offices in each city and district have access to the data in order to monitor
school statistics, but they cannot directly change the system’s data.
(b) MoRA’s Policy MoRA does not yet have an integrated data system. A World Bank review of MoRA’s data management
in 2019 identified that multiple data-collecting tools are used in madrasahs, some of which overlap in
terms of the data they manage. MoRA’s largest information system is its EMIS, which captures data
on students, teachers, and infrastructure. However, there are also other data systems to which
madrasahs are required to submit information. For instance, Simpatika is used to manage data on
teachers in madrasahs, while Siaga is used for teachers of religion in MoEC schools. As a part of the
‘Realizing Education’s Promise’ project, a process is underway to establish a single, unified data system
within MoRA.
MoRA’s EMIS uses fully online processes to capture data. Madrasahs and other schools capture data
directly into the online EMIS. MoRA establishes an input schedule for the data submission. Outside of
these usually short input periods, the madrasahs cannot access the EMIS to update information.

5
4. Findings
This assessment measures data accuracy by identifying gaps between the data in the information
system completed by schools and data collected in the field by the observers. The process used use
MoEC’s Dapodik and MoRA’s EMIS for comparison.
(a) Student Data Student data are central to the functioning of the education system. Data on the number of students
help to identify resource requirements in the sector, in terms of teachers, classrooms, textbooks, and
other relevant variables. At the same time, data on the student progression (repetition, drop-outs,
etc.) indicate the efficiency of the education system. In Indonesia, information on the number of
students also has important financial implications, as it is used to assign the per-student BOS school
grant to schools and madrasahs. The budgeting process requires accurate numbers of students to
estimate the total BOS funds required from the national budget and to ensure that each school
receives the prescribed funding. In 2019, the value of BOS was IDR 51.2 trillion (about US$3.5 billion)
for MoRA schools and IDR 9 trillion (about US$610 million) for MoEC schools.
For MoEC schools, this assessment found that about 50 percent of surveyed primary schools, Sekolah
Dasar (SD), and lower secondary education schools, Sekolah Menengah Pertama (SMP), and about 28
percent of senior secondary schools, Sekolah Menengah Atas (SMA), and 36 percent of vocational
secondary schools, Sekolah Menengah Kejuruan (SMK), registered discrepancies between the number
of students observed and those according to Dapodik (Figure 1).
Figure 1. Percentage of schools with inaccurate student numbers in the MoEC system
Figure 2. Percentage of schools with inaccurate student numbers in the MoRA system
For MoRA schools, the percentage of schools for which data discrepancies between the EMIS and the
direct observations was similar to that identified in MoEC schools. In primary schools, Madrasah
Ibtidaiyah (MI), there were differences in 42 percent of the schools, in junior-secondary, Madrasah
Tsanawiyah (MT), there were differences in 35 percent of the schools, and in upper-secondary,
Madrasah Aliyah (MA), there were differences in 39 percent of the schools (Figure 2). In almost all
cases, the number of schools underreporting in the system was greater than the number of schools
overreporting.
Magnitude of the discrepancy. On average, the observers found fewer students in the schools visited
than those registered in the education data systems. In the MoEC system, the average gap was 2.8
students in SDs, 5.2 students SMPs, 2.1 students in SMAs, and 3.1 students in SMKs. In the MoRA
system, the average gap was 7.1 students in MIs, 5.7 in MTs, and 5.2 students in MAs (Figure 3).
Overall, the average magnitude of the discrepancy was 6.0 fewer observed students for MoRA schools
and 3.3 fewer observed students for MoEC schools. Even though, on average, schools were most likely
48.39 50.0072.73 64.00
22.58 20.59
13.6412.00
29.03 29.4113.64 24.00
0%
20%
40%
60%
80%
100%
SD SMP SMA SMK
accurate overreporting underreporting
57.69 65.22 60.87
11.5413.04 17.39
30.77 21.74 21.74
0%
20%
40%
60%
80%
100%
MI MTs MA
accurate overreporting underreporting

6
to report the correct number or, if there was a discrepancy, to under-report, those schools that over-
reported did so by a much larger margin (on average, more than double the average magnitude of the
under-reporting).
Figure 3. Average gap of student data, MoEC and MoRA systems
As shown in Figure 1, there are MoEC schools that had fewer students than reported and schools that
had more students than reported. In SDs, the average over-reporting was 7.9 students, while the
average under-reporting was 3.6 students. The figures for over-reporting and under-reporting were
18.1 and 4.9, 10.7 and 4.6, and 12.3 and 6.7, respectively, in SMPs, SMAs and SMKs (Figure 4).
Figure 4. Over-reporting and under-reporting in the MoEC
Figure 5. Over-reporting and under-reporting in the MoRA
Similarly, as shown in Figure 2, there are MoRA schools that had fewer students than reported and
MoRA schools that had more students than reported. In MIs, the average over-reporting was 11.3,
while the average under-reporting was 18.9 students. The figures were 25.3 and 10.8, and 22.8 and
5.8, respectively, for MTs and MAs (Figure 5), showing a consistent pattern across school types and
ministries.
Explaining the gaps. As reported by schools and municipal authorities, several factors may explain the
over-reporting of student numbers. First, student mobility within the school year is likely to explain
part of the gap. In a properly working system, underreporting and overreporting should reconcile,
given that once a student leaves a school, he or she should be recorded as a new addition by another
school. ‘System’ here refers to the whole education system covering both MoEC and MoRA, as
students might graduate from MoRA primary schools and continue in MoEC secondary schools or vice-
versa, for example. A second factor is that some students may drop out of school within the school
year but the schools do not adjust their records accordingly, a problem exacerbated by the fact that,
2.81
5.18
2.09
3.08
7.12
5.655.22
0.00
1.00
2.00
3.00
4.00
5.00
6.00
7.00
8.00
SD/MI SMP/MTs SMA/MA SMK
MoEC MoRA
-3.56 -4.90 -4.67-6.67
7.86
18.14
10.67 12.33
-10.00
0.00
10.00
20.00
SD SMP SMA SMK
underreporting overreporting
-18.88-10.80 -5.80
11.33
25.33 22.75
-40.00
-20.00
0.00
20.00
40.00
MI MTs MA
underreporting overreporting
7
for the MoRA system, BOS amounts for the current year are determined based on the data for the
previous school year. Given that resources (monetary or otherwise) allocated to schools decreases as
student numbers go down, this reduces the incentive of schools to make timely downward
adjustments to their student numbers.
Importance of the gaps. As mentioned at the beginning of the section, reliable information on the
number of students is essential for designing education policy in general. The minimum service
standards (MSS) on education strictly regulate the maximum number of students allowed in each
classroom. Although there is no enforcement of this regulation nor any sanctions for its violation,
schools are advised to only accept students within their capacity, to ensure that the quality of
education delivery and student learning outcomes is not adversely affected. Moreover, there are also
financial implications in these numbers. The per-student school grant (BOS) is calculated based on the
number of students in each school, as is the number of teachers.
If we estimate the fiscal impact based on findings from this study, the Government of Indonesia (GoI)
could have potentially misallocated BOS budget in 2019 by a total of IDR 960.8 billion (about US$66.2
million). There was a possibility of budget excess of IDR 420 billion because of over-reporting in MoEC
schools but, at the same time, the potential lack of money for some schools that reported fewer
students than they actually had was around IDR 228 billion. In total, the potential budget misallocation
of BOS in MoEC schools was IDR 648.6 billion.4 On the other hand, using the same method to run the
estimation, MoRA could have incurred a potent budget deficit of IDR 42 billion. This is the total sum
of potential budget misallocation from over-reporting (IDR 135 billion) and under-reporting madrasah
(–IDR 177 billion). Although further analysis is needed to confirm the actual impact on the budget side,
this illustration shows that data discrepancies hampered an effective process of budget planning and
allocation. For the detailed estimation of the fiscal impact see Annex 2.
(b) Student Characteristics: KIP, PKH, Travel Time and Distance Data5
Observers also assessed the reliability of the data regarding certain student characteristics captured
in education data systems. Grants from the central government include support to disadvantaged
students, Kartu Indonesia Pintar (KIP), as well as to poor households, Program Keluarga Harapan (PKH)
with the aim of ensuring that students attend school and receive the correct education services. KIP
and PKH data are essential to estimate the distribution of poor students in schools. The information
can be used to estimate affirmative programs, while travel time and distance can also be useful in
estimating school zone maps (Zonasi reform). Study observers found that the percentage of schools
that had differences between the information in the data system and information gathered during the
school visit was 3.1 percent for the KIP program and 4.8 percent for the PKH program. No under-
reporting for KIP or PKH data was observed: 5 percent of elementary schools claimed more KIP
students than were observed having, while 9 percent of junior and senior secondary schools claimed
more PKH students than observed. In PKH data, the over-reporting is higher: 13 percent for
elementary, 9 percent in junior secondary and 67 percent in senior secondary. The higher over-
reporting in PKH data could be related to the nature of the program, which aims to support households
instead of directly supporting students.
4 Misallocation here is calculated from adding the potential overpay and underpay due to data discrepancies reported by schools and madrasahs. It is different from the potential state loss which is calculated from the differences in budget which is not absorbed at the end of financial year. 5 Unfortunately, data from MoRA schools are not available in this section. Data on KIP and PKH recipients were not updated for the year in which data collection took place, while travel time and distance data were not available in MoEC’s data system.

8
The observers also collected information on the distances that students have to travel to get to school
and the time this takes. To assess the accuracy of travel times, two students were randomly selected
in each school. An average difference (in both directions) of 23.7 percent was found between Dapodik
data and travel times stated by the students. With regards to the distance, the discrepancy in distance
was 15 percent (Figure 6).
Figure 6. Gaps in KIP, PKH, travel time and distance data (MoEC system)
Figure 7. Over-reporting in KIP data (MoEC) Figure 8. Over-reporting in PKH data (MoEC)
(c) Number of Classes Data Information on the number of classes is key in assigning teachers and distributing materials among
other key processes in the education system. A teacher needs assessment that estimates the number
of teachers to be hired is usually based on the total number of teaching hours derived from the
number of classes and subjects. The number of classes in MoEC and MoRA schools was also verified
during this assessment. MoEC schools had discrepancies of 12.9, 2.9, 8.3 and 8.0 percent in SDs, SMPs,
SMAs and SMKs, respectively. MoRA schools had discrepancies of 22.2, 12.5 and 13.0 percent in MIs,
MTs and MAs schools, respectively (Figure 7). The study found that class data tend to be under-
reported, though the gap is relatively small and the magnitude of the error is higher in MoRA’s data
system.
3.10%4.80%
23.70%
14.90%
0.00%
5.00%
10.00%
15.00%
20.00%
25.00%
KIP PKH Travel Time(Hour)
Distance (KM)
13% 9%
67%
17%
87% 91%
33%
83%
0%
50%
100%
SD SMP SMA SMK
overreporting Accurate

9
Figure 9. Percentage of schools that have discrepancies in the number of classes data
Figure 10. Over-reporting and under-reporting in classes data
(d) Teacher Data Teachers are the most important resource in the education process. It is important to provide students
and classes with the right number of quality teachers. Therefore, student data is important to estimate
the required number of teachers and administration staff, which then needs to be compared with
actual teacher data to determine under- and over-supply. Teacher data is also essential to calculate
teacher payments and allowances. Accurate data on teachers will enable better teacher management
and inform policy changes related to improving teacher quality. The assessment found that 69 percent
of MoEC schools had accurate data on the number of teachers, while 12 percent over-reported and
19 percent under-reported the number of teachers in Dapodik. The highest gap was observed in SMK
and the lowest in SMP (Figure 8). Similarly, 68 percent of MoRA schools had accurate data on the
number of teachers in the system, with the highest reported gap observed in MAs and the lowest in
MIs (Figure 9).
12.90%
2.90%
8.30% 8.00%
22.20%
12.50% 13.00%
0.00%
5.00%
10.00%
15.00%
20.00%
25.00%
SD/MI SMP/MTs SMA/MA SMK
MoEC MoRA
2.964.48
6.65 6.15
3.88
6.234.84
-7.00-6.14
-8.50
-1.00
-7.00 -7.00-10.00
-5.00
0.00
5.00
10.00
SD SMP SMA SMK MI MTs MA
overreporting underreporting

10
Figure 11. Percentage of schools that have gaps in teacher data, the MoEC
Figure 12. Percentage of schools that have gaps in teacher data, the MoRA
Magnitude of the discrepancy on teacher data. For MoEC schools that had gaps between Dapodik
and the observed data (31 percent), the average gap was 1.0 teacher, while in MoRA schools, among
schools that had a discrepancy (32 percent), the average gap was almost twice as large at 1.8 teachers
(Figure 10).
Figure 13. Average discrepancy level of teacher data in the MoEC and the MoRA, absolute data
In MoEC schools, the average over-reporting was 1.62 teachers, while the average under-reporting
was 4.1 teachers (Figure 11). In MoRA schools, the average over-reporting was much larger at 9.0
teachers, while the average under-reporting was 3.6 teachers (Figure 12).
Figure 14. Over-reporting and under-reporting of teachers in the MoEC
Figure 15. Over-reporting and under-reporting of teachers in the MoRA
64.5281.25
56.5269.57 68.81
16.139.38
13.048.7 11.93
19.35 9.3830.43 21.74 19.27
0%
20%
40%
60%
80%
100%
SD SMP SMA SMK Total
accurate overreporting underreporting
81.4868.18
52.1768.06
3.7018.18
17.3912.50
14.81 13.6430.43 19.44
0%
20%
40%
60%
80%
100%
MI MTs MA Total
accurate overreporting underreporting
1.10
0.31
1.521.22
0.98
0.48
1.23
4.00
1.83
0.00
0.50
1.00
1.50
2.00
2.50
3.00
3.50
4.00
4.50
SD/MI SMP/MTS SMA/MA SMK Total
MoEC MoRA
-4.67
-2.00
-4.14 -4.60-4.10
1.20 1.332.00
2.501.62
-6.00
-4.00
-2.00
0.00
2.00
4.00
SD SMP SMA SMK Total
underreporting overreporting
-3.00 -2.67-4.43 -3.64
1.004.75
15.25
9.00
-10.00
-5.00
0.00
5.00
10.00
15.00
20.00
MI MTs MA Total
underreporting overreporting

11
Explaining the gap. There are differences in internal verification procedures between the MoEC and
MoRA systems. In the case of Dapodik, manual checking is used to verify consistency among the data
variables and is often used to verify that teachers comply with the subject and total number of
teaching hours. In the case of MoRA, the EMIS does not have an internal checking system.
(e) Teacher Absenteeism Teacher absenteeism has a direct impact on the learning process in schools.6 Indonesia has been
working to reduce teacher absenteeism for the past two decades. Analytical and Capacity
Development Partnership (ACDP) Indonesia published a policy brief on teacher absenteeism in 2014,
which showed that the absentee rate had dropped from 19 percent in 2003 to 10 percent in 2013.
Despite this improvement, the rate remains high in remote areas (19.3 percent). Indonesia previously
recorded a similar absence rate as other middle-income countries such as Peru (11 percent),
Bangladesh (16 percent), Papua New Guinea (15 percent) and India (25 percent) in the first round of
visits in 2002/03.7 A recent Service Delivery Indicator survey conducted in 350 madrasahs and schools
in Indonesia found that about one-third of schools in Indonesia have an absenteeism rate above 20
percent and on average one in four teachers is absent from classroom (Yarrow, et al, 2020). A survey
of 203 schools in remote areas conducted by KIAT Guru in 2016 found that the teacher absenteeism
rate in the 203 schools was at 25% (World Bank, 2019). A survey conducted by SMERU in 2010 showed
a higher rate of teacher absenteeism in remote areas (24.4%) than the average national rate (15%).
Teacher absenteeism in this study is defined as the number of teachers who were present during
school visits. While there are multiple reasons for teacher absenteeism, they can generally be
categorized into two types: (i) absent without notification; and (ii) absent with notification due to
sickness, family matters, training, or school administration business. The study found that the rate of
teachers leaving schools without notification was about 0.7 percent in MoEC schools and 0.3 percent
in MoRA schools. The highest absenteeism (absent without notification) was at the SMK level for MoEC
schools (2.3 percent) and at the MI level for MoRA schools (0.9 percent) (Figure 13). The ‘absent
without notification’ numbers are low compared with other middle-income countries (MoEC, 2014).
Figure 16. Average percentage of teachers absent without notification
6 Muzenda (2013) found that lecturers’ regular attendance positively affects students’ academic performance. Also, Finlayson (2009) found that the higher a teacher’s absenteeism, the lower his/her students’ academic performance. 7 Analytical and Capacity Development Partnership, “Study on Teacher Absenteeism in Indonesia 2014,” Technical Report, Ministry of Education and Culture 2014.
0.40%0.20%
0.10%
2.30%
0.70%0.90%
0.00% 0.00%
0.30%
0.00%
0.50%
1.00%
1.50%
2.00%
2.50%
SD/MI SMP/MTs SMA/MA SMK Total
MoEC MoRA

12
On the day of unannounced observation for this study, the total percentage of absent teachers with
notification was 12 percent for both MoEC and MoRA schools. In both, teachers reported being absent
most frequently because they were required to undertake some administrative activity, such as going
to the education office for meetings on BOS administration or dealing with professional allowance
requirements. However, absenteeism due to training is low, suggesting limited levels teacher training
(Figure 14). This finding is consistent with the previous study by McKenzie et al. (2014) and Suryahadi
and Sambodho (2013). A recent World Bank study also found that reasons for teacher absence are
primarily illness, maternity leave, accompanying students to attend competitions, and personal leave.
Only 6 percent of teachers are absent because of training outside school (Yarrow, et al, 2020)
Figure 17. Reasons for teacher absenteeism, MoEC and MoRA
(f) School Infrastructure Data: Number of Classrooms and School Conditions The number of classrooms and their condition are important to plan for school construction and
maintenance, particularly to budget accurately for special allocation funds (Dana Alokasi Khusus, DAK)
in the education budget. In MoEC schools, schools with an absolute discrepancy in number of between
Dapodik and the observation were 16.1, 17.6, 29.2 and 12.0 percent in SD, SMP, SMA and SMK schools,
respectively (Figure 15). In MoRA schools, discrepancies in over- or under-reporting the number of
classrooms was found in almost all schools, regardless of the education level (Figure 15). This suggests
that, in MoEC, most schools have valid data on classrooms, but the same is not true in the MoRA EMIS.
Figure 18. Discrepancy on the number of classrooms, MoEC and MoRA
1.6%0.6% 0.4%
2.0%
12.1%
0.8% 1.0% 1.2%
3.1%
12.4%
0.0%
2.0%
4.0%
6.0%
8.0%
10.0%
12.0%
14.0%
Sick Personal Training Administration Overall
MoEC MoRA
16.1% 17.6%
29.2%
12.0%
96.3% 95.8% 100.0%
0.0%
10.0%
20.0%
30.0%
40.0%
50.0%
60.0%
70.0%
80.0%
90.0%
100.0%
SD/MI SMP/MTs SMA/MA SMK
MoEC MoRA

13
Magnitude of the Discrepancy in Classroom Data. The average gap in the data on numbers of
classrooms was small in MoEC schools, but far larger in MoRA schools. The average gap in MoEC
schools was less than one classroom (meaning schools reported having greater or fewer classrooms
than they actually did) regardless of the level of education, while in MoRA schools it ranged between
8 and 11 classrooms depending on the level of education. The suggests not only that more schools in
MORA have discrepancies more MoEC, but also that the average discrepancy is higher. This might be
linked to capacity constraints in the MoRA system, both in terms of management capacity at school
level and the capacity of the EMIS application itself.
Figure 19. Average gap of each level of education, MoEC and MoRA
In the MoEC data system, among the schools that over-reported the number of classrooms, the
average difference was 4.3, 1.4, 8.3 and 0 for SDs, SMPs, SMAs and SMKs, respectively. Among MoEC
schools that under-reported, the average difference was 2.5, 1.5, 5.3, and 2.3 for SDs, SMPs, SMAs
and SMKs, respectively. In the MoRA system, among the schools that over-reported, the average
difference was 4.4, 3.1, and 5.9 for MIs, MTs and MAs, respectively. And, among the schools that
under-reported, the average difference was 1.8, 2.7, and 3.0 for MIs, MTs and MAs, respectively. In
general, all schools in MoEC and MoRA tend to overreport, which might be linked to the use of this
data for school accreditation, which incentivizes schools to inflate the infrastructure data.
0.58 0.26
1.92
0.28
8.33
10.5811.39
0.00
2.00
4.00
6.00
8.00
10.00
12.00
SD/MI SMP/MTS SMA/MA SMK
MoEC MoRA

14
Figure 20. Level of discrepancy, the MoEC and MoRA
Infrastructure conditions. According to MoEC’s guidelines, a classroom’s infrastructure is classified in
Dapodik by the level of damage: good, mild, medium, and heavily damaged.8 Schools tend to designate
the school “operator”9 as the key person to input the data. A challenge could be that operators receive
only limited or no training, and so may not know precisely how to distinguish between ‘mild’ or
‘medium’ damaged classrooms. The school observers participating in this study were trained on
MoEC’s guidelines to classify classroom conditions and were instructed to report the information. To
allow comparison between both sources of information, the data both in Dapodik and in this survey
were collected at the school level, and a school index was constructed.10
8 MoEC has produced a guidance document for school to analyze the degree of damage of school infrastructure. The Dapodik team has also provided technical guidance on how schools should input infrastructure data in Dapodik. 9 The school operator is a person assigned to manage the entire school data system, including Dapodik, BOS, KIP, etc. Usually, they are temporary staff, mostly with a background in education or experience in IT. In most cases, the role of school operators is limited to supporting IT-related matters in school, but sometimes they are also responsible for making decisions on indicators reported in the system, such as measuring the damage level of school infrastructure. 10 We assign a value for each classroom that school have: 1 (heavily damaged), 2 (medium damage), 3 (mild damage), and 4 (good condition). The value is multiplied by the total number of classrooms that belong to each category. The sums of these values are then divided by the total classroom in the school to have the school condition index ranging in between 1 (all classrooms are in poor condition) to 4 (all classrooms are in good condition)
-2.50-1.50
-5.25
-2.33 -1.8-2.7 -3.0
4.33
1.50
8.33
0.00
4.43.1
5.9
-6.00
-4.00
-2.00
0.00
2.00
4.00
6.00
8.00
10.00
SD SMP SMA SMK MI MTs MA
underreporting overreporting

15
Figure 21. Index of classroom conditions by school Dapodik vs observation
Of the 114 schools that participated in the study, in 82 schools the index of classroom conditions
matched between the observations and the data, i.e., these schools lie along the diagonal line in Figure
20. There were discrepancies in 32 schools, representing 28 percent of the sample. Actual classrooms
were on average in better condition in 12 schools (12 percent of the sample) and in worse condition
in 18 schools (16 percent of the sample). The gap between underreporting and overreportingt is not
major (12% and 16% respectively). However, as more schools reported their condition as better than
the actual condition, this might be probably related to use of Dapodik data for accreditation purposes.
Availability and condition of school infrastructure is one component of the accreditation process for
schools and madrasahs; the better the data on conditions of school infrastructure, the higher
accreditation value a school will receive.
(g) Laboratory Facilities Data Laboratory facilities data are also important for decision-making, especially to ensure that the
availability of such facilities is adequate to support learning.
The number of schools that had a gap between the data system and the observations was lower in
MoEC than in MoRA schools. The percentage of schools with a gap in laboratory data was about 8.8
percent in SMPs, 25 percent in SMAs and 12 percent in SMKs. About 62.5 percent of MT schools and
78.3 percent of MA schools had a discrepancy in the EMIS. These large discrepancies in MoRA data
might be related to the existence of multiple data systems being used for different purposes. SIM-
SARPRAS is the application used by MoRA to collect detailed information of infrastructure in
madrasahs. Data from this application is used for infrastructure grant allocation. Unfortunately, data
from this and many other similar data systems is not integrated into the EMIS, which might explain
the extent of inaccuracies in EMIS data.

16
Figure 22. Percentage of schools that have a data discrepancy, MoEC and MoRA
Schools of all types tended to report having fewer laboratories than they were observed having, with
the magnitude of this under-reporting was higher in MoRA and in SMA/MA schools. The average gap
was three laboratories for SMA schools that were under-reporting, while the average gap was 1.4
laboratories for schools that reported more laboratories than actually observed. In MA schools, the
gap was 2.4 laboratories for schools that reported fewer laboratories in the EMIS, while for those that
input more, the gap was 1.9 laboratories. Schools mentioned that the discrepancy was because some
laboratories were being renovated recently to comply with the NES standards11 and these changes
had not been updated in the system yet.
Figure 23. Laboratory data discrepancy, the MoEC and the MoRA
11 Under NES standards (MoEC regulation No 24/2007), primary and junior secondary schools are required to have at least one science laboratory. For senior secondary level school need to have a separate laboratory for biology, physics, chemistry, computer, and language subject.
8.8%
25.0%
12.0%
62.5%
78.3%
0.0%
10.0%
20.0%
30.0%
40.0%
50.0%
60.0%
70.0%
80.0%
90.0%
SMP/MTS SMA/MA SMK
MoEC MoRA
-1.4
-3.0
-2.10-1.6
-2.4
1.11.4 1.30
1.0
1.9
-4.0
-3.0
-2.0
-1.0
0.0
1.0
2.0
3.0
SMP SMA SMK MTs MA
underreporting overreporting

17
As in the case of classrooms, an index was created to assess the condition of laboratories.12 Of the 68
schools for which comparison between the data and observations was possible,13 laboratories were
in worse condition than reported in 8 schools and in better condition than reported in 12 percent.
Figure 24. Index of laboratory conditions by school data vs observation
(h) Data on WASH Facilities The availability of water, sanitation and hygiene (WASH) facilities is one of the requirements to achieve
national standards and is an important consideration for school operations in the time of COVID-19.
Adequate WASH facilities in schools contribute to a better learning environment and bring tangible
benefits in terms of education, health, and the wellbeing of teachers and students alike. One study
found that the number of student absenteeism days caused by illness declined by about 25 percent
following an intervention in hygiene facilities.14 Handwashing promotion initiatives in some middle-
income countries have also generated similar results (Lopez-Quintero et al., 2009). The recent COVID-
19 outbreak also emphasizes the importance of regular handwashing in helping to prevent the
transmission of viruses. However, currently there are no specific questions on handwashing facilities
included in either Dapodik or the EMIS questionnaire. Both ministries only collect information on the
washroom/toilet facilities in schools and, as a result, this section can only elaborate on these facilities.
12 The index is created using the same approach as before (classroom condition index). 13 We have fewer sample for laboratory data because primary schools equivalent (SD and MI) are not required to have one in the school. 14 Master et al. (1997) emphasize the concept that basic soap-and-water handwashing prevents the spread of infection and should be encouraged as a standard infection control measure. The study was conducted at Trombley Elementary School in Grosse Pointe Park, Michigan. A similar study based on an intervention at five schools in Pennsylvania shows that student absence rate was lower by about 50 percent in the test group (Guinan et al., 2002).
18
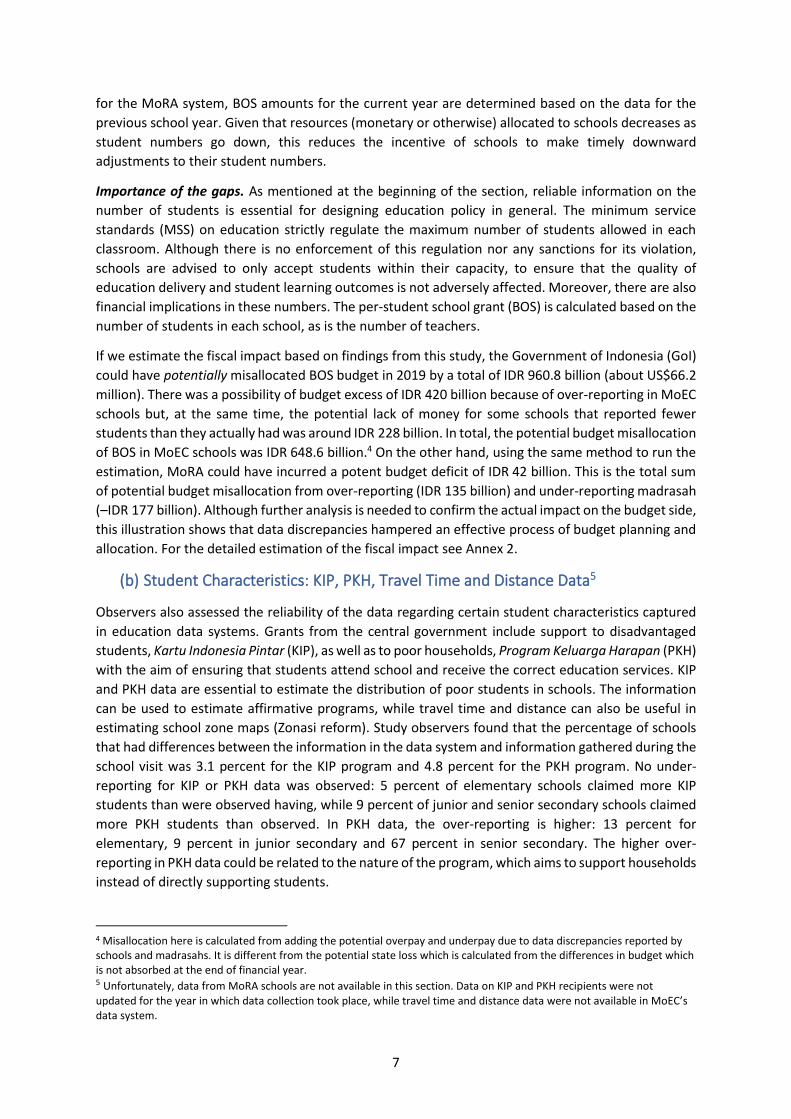
In all levels of schools, data accuracy was high for this variable. For SDs and SMPs, the accuracy rate
was about 90 percent, and for SMAs and SMKs it was about 75 percent. In MoRA, the number was
almost the same. In MoEC, the highest accuracy was in SMAs and SMKs, and in MoRA it was in MTs.
Figure 25. Data accuracy on toilet facility data, the MoEC and the MoRA
The magnitude of the discrepancy in toilet facility data between MoRA and MoEC was less than 1.0
toilets, except in MTs. In elementary schools, the gap in MoEC was higher than in MoRA, but in junior
secondary the gap in MoEC was lower than in MoRA, while in senior secondary it was almost the same.
Figure 26. Average gap in toilet facility data, the MoEC and the MoRA
The data show that MoEC schools tend to report fewer toilet facilities in Dapodik than they were
observed as having. The average magnitude of the discrepancy in schools that reported fewer toilet
facilities in SMA was 3.8 toilets, while it was 3.0 toilets in schools that reported more. A similar pattern
is seen in SD and MTs, but in SMPs and MIs, schools tended to report more than observed.
0.90 0.91
0.75 0.76
0.89
0.670.65
0.06 0.06
0.21 0.20
0.04
0.210.09
0.03 0.03 0.04 0.04 0.04 0.08 0.09
0%
10%
20%
30%
40%
50%
60%
70%
80%
90%
100%
SD SMP SMA SMK MI MTs MA
accurate underreporting overreporting
0.2 0.2
0.90.8
0.1
1.2
0.8
0.0
0.2
0.4
0.6
0.8
1.0
1.2
1.4
SD/MI SMP/MTs SMA/MA SMK
MoEC MoRA
19
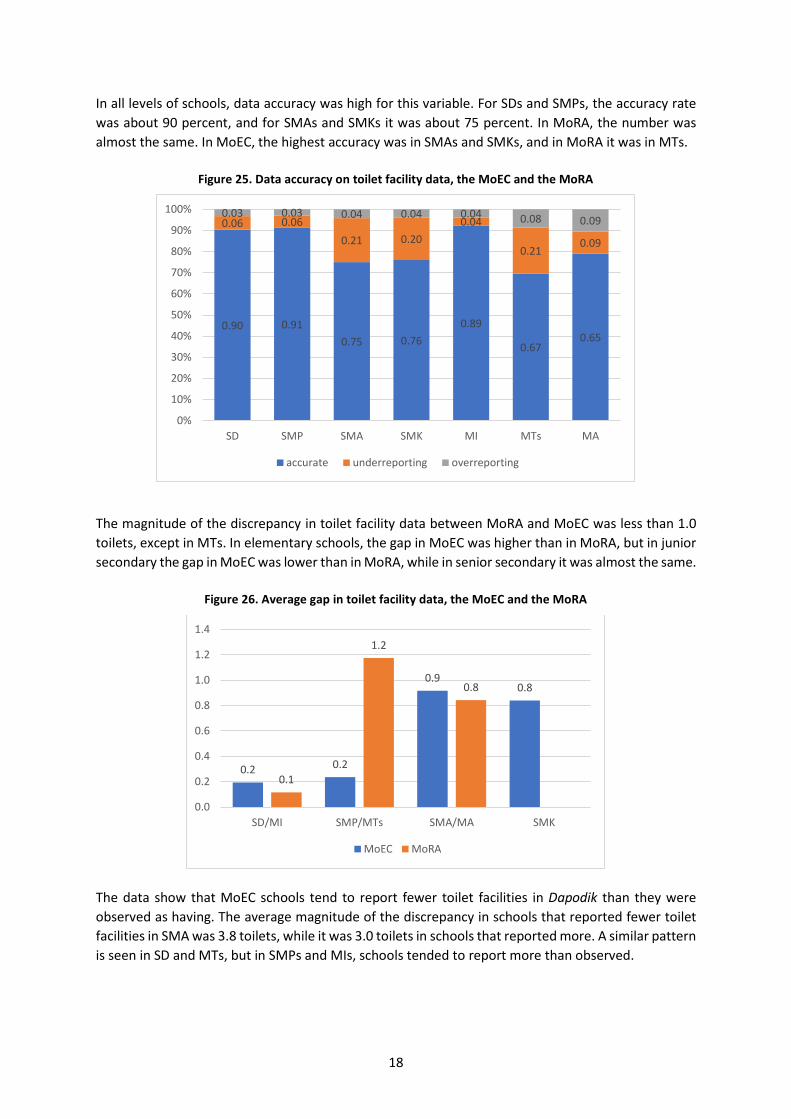
Figure 27. Level of gap of toilet facility data, the MoEC and the MoRA
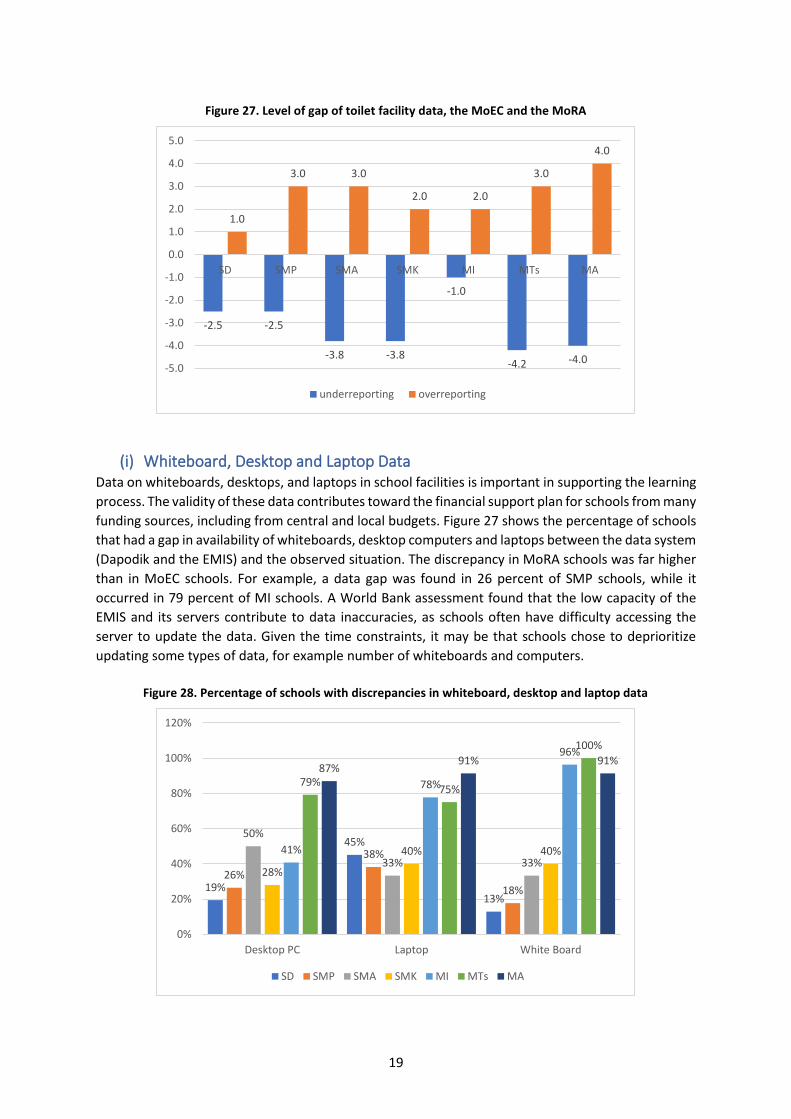
(i) Whiteboard, Desktop and Laptop Data Data on whiteboards, desktops, and laptops in school facilities is important in supporting the learning
process. The validity of these data contributes toward the financial support plan for schools from many
funding sources, including from central and local budgets. Figure 27 shows the percentage of schools
that had a gap in availability of whiteboards, desktop computers and laptops between the data system
(Dapodik and the EMIS) and the observed situation. The discrepancy in MoRA schools was far higher
than in MoEC schools. For example, a data gap was found in 26 percent of SMP schools, while it
occurred in 79 percent of MI schools. A World Bank assessment found that the low capacity of the
EMIS and its servers contribute to data inaccuracies, as schools often have difficulty accessing the
server to update the data. Given the time constraints, it may be that schools chose to deprioritize
updating some types of data, for example number of whiteboards and computers.
Figure 28. Percentage of schools with discrepancies in whiteboard, desktop and laptop data
-2.5 -2.5
-3.8 -3.8
-1.0
-4.2 -4.0
1.0
3.0 3.0
2.0 2.0
3.0
4.0
-5.0
-4.0
-3.0
-2.0
-1.0
0.0
1.0
2.0
3.0
4.0
5.0
SD SMP SMA SMK MI MTs MA
underreporting overreporting
19%
45%
13%
26%
38%
18%
50%
33% 33%28%
40% 40%41%
78%
96%
79%75%
100%
87%91% 91%
0%
20%
40%
60%
80%
100%
120%
Desktop PC Laptop White Board
SD SMP SMA SMK MI MTs MA

20
Both the number of schools that reported a gap and the average magnitude of the discrepancy were
higher in MoRA schools than in MoEC schools regarding desktop, laptop, and whiteboard data.
However, the gap was lower in laptop data than desktop and whiteboard data. This might be because
laptops are financed by BOS funds, which encourages schools to keep the data up to date while
desktop data is typically not being kept current.
Figure 29. The average gap in desktop, laptop and whiteboard data
Schools tend to report fewer numbers of desktops, laptops, and whiteboards than they were observed
having. The average number of MoEC schools at all levels that reported fewer desktops in Dapodik
than observed was higher than the schools that reported more desktops than observed. In SMPs, the
magnitude of underreporting was about 24 desktops per school, but the magnitude for schools that
were overreporting was about 11 desktops. Unfortunately, data from sampled MoRA schools in this
study were incomplete in our survey.
Figure 30. Level of discrepancy in desktop data, the MoEC and the MoRA
0.6 0.7 0.2
5.6
1.60.3
5.1
0.9 1.5
6.5 5.63.53.1
1.8
7.8
16.7
4.2
10.2
27.1
7.4
11.8
0.0
5.0
10.0
15.0
20.0
25.0
30.0
Desktop PC Laptop White Board
SD SMP SMA SMK MI MTs MA
-3.5
-24.0
-13.3
-26.3
-7.5
-21.1
-31.2
2.5
11.0
5.8 4.0
-40.0
-30.0
-20.0
-10.0
0.0
10.0
20.0
SD SMP SMA SMK MI MTs MA
underreporting overreporting

21
5. Analysis
As described earlier, the study found data discrepancies in all data categories. For some indicators,
such as the number of students receiving the social assistance program, the prevalence of mis-
reporting is small, with only 3.1 and 4.8 percent of schools reporting data discrepancies for KIP and
PKH programs, respectively.15 In a similar vein, less than 20 percent of schools and madrasahs have
reported data discrepancies in the number of classrooms. However, the proportion of schools with
reporting data discrepancies in the number of students and teachers is large. The research found
discrepancies in the number of students in more than 40 percent of the sampled schools.
Inaccuracies in the education data systems directly impact education sector planning and budgeting.
However, it is very difficult to have real-time and accurate information of the overall education sector
data. There can be delays between student movements and renovations and reporting time periods,
especially if they occur during semester breaks. Data audits such as this study comparing data reported
in the system and observatory data during school visits must take this consideration into account. Each
data indicator is used for different purposes and might need to be taken at a different point in time.
Therefore, it is important to have a clear timeline of education sector planning, which would impact
different timelines for school operators to report the data in the system, including data on school
infrastructure and school condition. A couple of examples are listed below.
Figure 31. Summary of education sector data in Indonesia
Name of indicator Number of students Number of teachers
Data sources Dapodik, EMIS Dapodik, Simpatika
Data purpose School-grant (BOS) Teacher allowance
Disbursement 3x a year (MoEC) 2x a year (MoRA – private schools) 1 x a year (MoRA – public schools)
4x a year (MoEC) Monthly, or, periodically (MoRA)
Data update timeline Annual (MoEC) 2x a year (MoRA)
Semester (MoEC) Monthly (MoRA)
Cut-off time August 31 (MoEC) January 30, August 31 (MoRA)
March, September (MoEC) Every sixth day of the following month (MoRA)
Regulation - MoEC Regulation No. 8/2020 - Decree of DG Islamic Education No.
7330/2019
- MoEC Regulation No. 19/2019 - Decree of DG Islamic Education No.
7381/2019
Based on the example above, currently schools are not expected to update their information on a real-
time basis. There are certain cut-off times that school principals need to be aware of and for school
operators to update the data in a timely manner. As a follow-up, both ministries could have a data
audit and validation mechanism to ensure that all numbers reported in the system are valid and
accurate. When this is not the case, the ministries will need to be able to distinguish whether this is a
systematic error or data discrepancies caused by other problems. The definition of a systematic error
in this report refers to errors that are not determined by chance but are introduced by an inaccuracy
(involving either the observation or measurement process) inherent to the system (Merriam-
Webster). This refers to a consistent, repeatable error associated with a certain pattern, whether it be
faulty measurement equipment, flawed experiment design, or specific patterns in the data. For
example, it is possible that data discrepancies are caused by problems with internet connectivity when
15 This indicator only available in Dapodik, hence comparisons for MoRA schools are not available.

22
updating the data. It is also possible that the ministries find a specific pattern in schools reporting
inaccurate data, whether it be related to the school size, technical knowledge of the school operator,
or any other pattern. The two ministries could perform additional analysis to check whether there is
a systematic error in the sampled school and look for a possible trend that might increase the
probability of a school having a data discrepancy.
The team performed regression analyses using the gaps between numbers of students and numbers
teachers as dependent variables, and tested factors such as school size, school status (private vs
public), school location (rural vs urban), and level of education (primary, junior secondary, senior
secondary) as the independent variables. The results show that the gap in the reported number of
students does not correlate with factors such as school size, status, location, etc. When the team
performed partial regressions for each, only school location showed a significant level of correlation,
meaning that the gap in reported versus actual numbers of students is likely to be higher in urban
areas than in rural areas. For the reported versus actual numbers of teachers, the regression shows
that the gap tends to be higher in larger schools, which makes sense since they have a larger number
of teachers to potentially mis-report. Results from this regression analysis are provided in Annex 3.
6. Summary of Main Findings
The research identified key areas of discrepancy between observed data and captured data reported
in the MoEC Dapodik and MoRA EMIS, with potentially major implications:
1. Higher-than-observed student numbers could lead to misuse of education sector resources.
Student population data in Dapodik and the EMIS were higher than observed during school
visits. This may be related to students changing schools or dropping out during the school
year. The observed gap was larger in MoRA schools than MoEC schools. Given per-student
school grants, inaccurate student data could lead to an inadequate distribution of student
resources. It is estimated that around IDR 960.8 billion in school grant funds (BOS) were
misallocated in 2019 due to inaccurate data in Dapodik and the EMIS.
2. There are significant discrepancies in the number of teachers present in schools, with
differences between the two ministries. For MoEC, the observed discrepancies were smaller,
possibly reflecting mechanisms in place to verify consistency incorporated in Dapodik. In the
case of MoRA, the discrepancies in the EMIS were larger, possibly reflecting the existence of
other reporting mechanisms for teacher information in the Ministry.
3. Discrepancies in school infrastructure data differed by ministry. Schools in MoEC tended to
report conditions that were worse than the actual situation, while schools in MoRA tended to
report conditions that were better. This may be because EMIS data in MoRA are used for
accreditation and therefore schools tend to mark up the data. Conversely, data from Dapodik
were used for possible grants to support school infrastructure, and therefore schools tended
to report worse conditions.
4. The study found high levels of teacher absenteeism but, in most cases, this was related to
official tasks that teachers performed outside the school. The report therefore confirmed
consistent evidence from previous studies that teacher absenteeism is high in Indonesia.
Nonetheless, the report also found that most the teachers absent had sound reasons that
were usually related to school administration work.

23
5. Observed differences reflect, in several cases, challenges facing system operators in
identifying the different categories clearly and filling them in, for example, in assessing the
quality of school infrastructure. Another challenge could be the capacity of internet
connectivity at the central and school levels, as noted in previous World Bank studies.
7. Recommendations
Given the importance of accurate school information, both MoEC and MoRA would benefit from
developing an integrated and comprehensive data accuracy audit system to ensure validity and
timeliness of education sector data. Ideally, this system should be able to recognize errors
automatically through the data collection software used by Dapodik and the EMIS. Once that
happens, the ministries will only need to focus and allocate resources towards the most urgently
needed areas or/and schools. Given that there is no systematic way for the ministries to measure
actual data discrepancies in all schools, such a system needs to be developed. This study proposes
a gradual approach toward building an ideal data accuracy audit system.
1. Include the participation of districts and provinces through their local education offices,
together with the quality assurance office of MoEC. One possible mechanism to achieve this
is by expanding the role of school supervisors to ensure that school teams input valid data into
Dapodik and the EMIS. School supervisors could report observatory data on key indicators in
the system, providing ministries with actual data to compare with self-reported data in
Dapodik and the EMIS. With the help of data collection software, the system could then
automatically recognize data errors where discrepancies exist between self-reported data and
observed reports from the school supervisor. An advanced system could also recognize and
flag if there is a significant change in data for a particular school or indicator, which would help
the ministries to continue with the following steps.
2. An independent verification mechanism should be established that targets a sample of schools
every year, aiming to cover all schools over a certain period. Publishing the results of this
regularly could encourage schools to report more accurate information. It is especially
important to have accurate information on infrastructure quality.
3. Efforts should be made to understand what factors and incentives drive errors, using the
above two mechanisms to identify data errors requiring further investigation. In the absence
of precise knowledge of the problem, ministries will continue to spend resources in
suboptimal ways. By having a list of confirmed data errors (e.g. schools or indicators that
reported significant differences), the ministries will be able to examine more closely the actual
causes of data discrepancies, whether these be human resource problems (e.g., lack of
training for school supervisors), unclear manual guidelines for data input, system and
connectivity issues, incentives to misreport data, or other causes.
4. With the above steps implemented, it will then be possible for the ministries to allocate
resources more effectively to improve the effectiveness and efficiency of the system. In a
previous World Bank study,16 it was found that most school operators lacked the required
skills, and only received minimal salary and remuneration packages. Our recommendation at
that time was to improve the capacity of system operators so that they could manage data
more effectively, including entering and updating data, as well raising the competency of
16 The World Bank, Ministry of Religious Affair (MoRA), Report and Findings: Education Management Information System, supported by Datacom System Asia, 2019.

24
municipal-level personnel who participate in the data-gathering process. We believe that it is
of the utmost importance that both MoEC and MoRA develop a training and consultation
mechanism to equip school operators, for example when measuring the level of damage in
school infrastructure. As it is understood that MoEC and MoRA at the central and local levels
have limited budgets for operator capacity development, the development of online training
could be one option. However, design of such interventions needs to be guided by clear
information on where the biggest problems in data accuracy reside.
5. The World Bank study mentioned above also recommended introducing incentives into the
data management process. For example, MoEC and MoRA might develop an incentive
mechanism to encourage schools to input valid data in a timely manner. Based on the
observatory data reported by the school supervisors, the results could become a performance
indicator on each school’s scorecard. The incentive scheme could use existing schemes such
as BOS Kinerja (performance-based school grant) or other initiatives to incentivize data
validity. This could also include incentives to school operators to improve their performance.
6. It is likely that a key underlying problem exacerbating data inaccuracies is the difficult of
identifying students in the system uniquely throughout their learning careers under MoEC and
MoRA. To solve this, schools should enforce use of unique student identifiers when enrolling
students. The process of students moving from one school to another should rely on using the
unique identifier to track movements. There is ongoing discussion regarding whether to use
the national identification number as the student identifier, despite some challenges. The
advantage of using this identifier would be that all students could be traced wherever they
move. However, some students struggle to obtain this number. MoEC and MoRA could focus
on ensuring that all students receive national identification numbers by coordinating with the
Ministry of Home Affairs (MoHA) during school registration periods. To strengthen this
further, the number of students used to calculate BOS transfers should be updated at least
twice a year and schools should also report any students who drop out during the school year.
7. Although this is not strictly related to data accuracy issues, the research identified some gaps
in key data, suggest that some information could be added to existing instruments. For
example, detailed information on the availability of handwashing facilities would be very
useful for MoEC and MoRA to help to prevent infectious diseases in schools and for strategic
planning during health emergency periods (the ministries recently included this information
in the Dapodik and EMIS data collection round for the first semester of academic year
2020/2021).

25
References
Abdul-Hamid, Husein. 2014. What Matters Most for Education Management Information Systems: A
Framework Paper. SABER Working Paper Series; No. 7. World Bank Group, Washington, DC. © World
Bank.
ADB. 2003. Project Completion Report on The Basic Education Project in Indonesia
Badan Perencanaan Pembangunan Nasional. "Background Study for the Preparation of the RPJMN
For Education 2015-2019."
Charan, J, and T. Biswas. 2013. “How to Calculate Sample Size for Different Study Designs in Medical
Research?” Indian J Psychol Medcine 35 (2): 121–126. doi:10.4103/0253-7176.116232.
Dyer DL, Shinder A, Shinder F. Alcohol-free instant hand sanitizer reduces elementary school illness
absenteeism. Fam Med 2000;32(9):633–8.
Finlayson, Mary. 2009. The Impact of Teacher Absenteeism on Student Performance: The Case of the
Cobb County School District.
Guinan, Maryellen, Maryanne McGuckin, and Yusef Ali. "The effect of a comprehensive handwashing
program on absenteeism in elementary schools." American journal of infection control 30.4 (2002):
217-220.
Hamid, Husein Abdul. 2014. SABER : What matters for most education management information
systems - a framework paper (English). SABER working paper series no. 7. Washington, DC : World
Bank Group.
Lopez-Quintero, Catalina, Paul Freeman, and Yehuda Neumark. "Hand washing among school
children in Bogota, Colombia." American Journal of Public Health 99.1 (2009): 94-101.
Makwati, G., Audinos, B., & Lairez, T. (2003, December). The role of statistics in improving the quality
of basic education in Sub-Saharan Africa. In ADEA Biennial Meeting (pp. 3-6).
Master, D., SH Longe Hess, and H. Dickson. "Scheduled hand washing in an elementary school
population." Family medicine 29.5 (1997): 336-339.
McKenzie, Phillip; Nugroho, Dita; Ozolins, Clare; McMillan, Julie; Sumarto, Sudarno; Toyamah, Nina;
Febriany, Vita; Sodo, R Justin; Bima, Luhur; and Sim, Armand Arief, (November 2014). 'Teacher
Absenteeism in Indonesia: Policy brief'. Jakarta: Education Sector Analytical and Capacity
Development Partnership (ACDP)
Muzenda, A. 2013. Lecturers’ Competences and Students’ Academic Performance.
Pourhoseingholi, M. A., M. Vahedi, and M. Rahimzadeh. 2013. “Sample Size Calculation in Medical
Studies.” Gastroenterol Hepatol Bed Bench 6 (1): 14–17.
Sahito, Z., M. Khwawaja, U. M. Panhwar, A. Siddiqui, and H. Saeed. 2016. Teachers’ Time
Management and the Performance of Students: A Comparison of Government and Private Schools of
Hyderabad, Sindh, Pakistan.
Suryahadi, Asep, and Prio Sambodho. Assessment of policies to improve teacher quality and reduce
teacher absenteeism. SMERU Research Institute, 2013.
Yarrow, Noah, et al. Measuring the Quality of MoRA's Education Services. World Bank Group, 2020.

26

27
ANNEX 1
Sample Size
To determine the sample size for this study, a cross-sectional sample-size calculation was used.
According to Charan and Biswas (2013) and Pourhoseingholi, Vahedi and Rahimzadeh (2013), this
calculation aims to estimate the adequate size of the sample that provides the prevalence of the
population with precision.
To calculate this adequate sample size, the following formula was employed:
𝑛 = 𝑍
((1−∝)/2)21 𝑃(1−𝑃)
𝑑2 ,
where n is the sample size estimated by this formula, and Z is the statistic corresponding to confidence
level. P stands for expected population responses obtained from similar studies or a pilot project from
the previous study. Lastly, d is the precision or margin of error corresponding to the effect size.
The level of confidence for this study is 95 percent, with critical value of 1.96 (two-tailed), the assumed
P value of 93 percent schools with reliable student and teacher data, and the precision of 5 percent
margin of error. The total school population is 270,000. According to Morris (1985), the sample size
does not change much for the population larger than 20,000 observations. According to the formula,
it yields a minimum of 173 samples of schools needed for the study. In addition, another 10 percent
of reserved schools were embedded into the sample size, thus 191 samples for this study (rounded to
192).
Sample Selection
Education institutions sampled will be selected using multistage random sampling. First, it classifies
provinces into three groups based on the number of students: large, medium and small provinces. The
province size refers to the number of students from schools and madrasahs. A large province has a
large number of students, schools and madrasahs at the same time. The same criterion applies to
medium and small provinces.
One province will be selected from the large province group, two from the medium province group,
and three from the small province; in total six provinces are selected. Simple random sampling is used
at this stage.
Then from each province one kabupaten (rural) and one kota (urban) are selected randomly, which
add up to 12 districts. Only kabupaten/kota that have a madrasah are included in the sampling frame.
From each district, the sample will be classified on the level of education (basic education [SD/SMP
and MI/MTs] and senior secondary [SMA/SMK and MA]), large and small schools in terms of the
number of students, and public and private schools. Using quota samples where each type of sample
consists of the same number of schools, the total sample is 192 schools. For example, SD/SMP public
schools with a high number of students (large) in a certain district (kabupaten) have one school
sampled.
28
ANNEX 2
Student Data
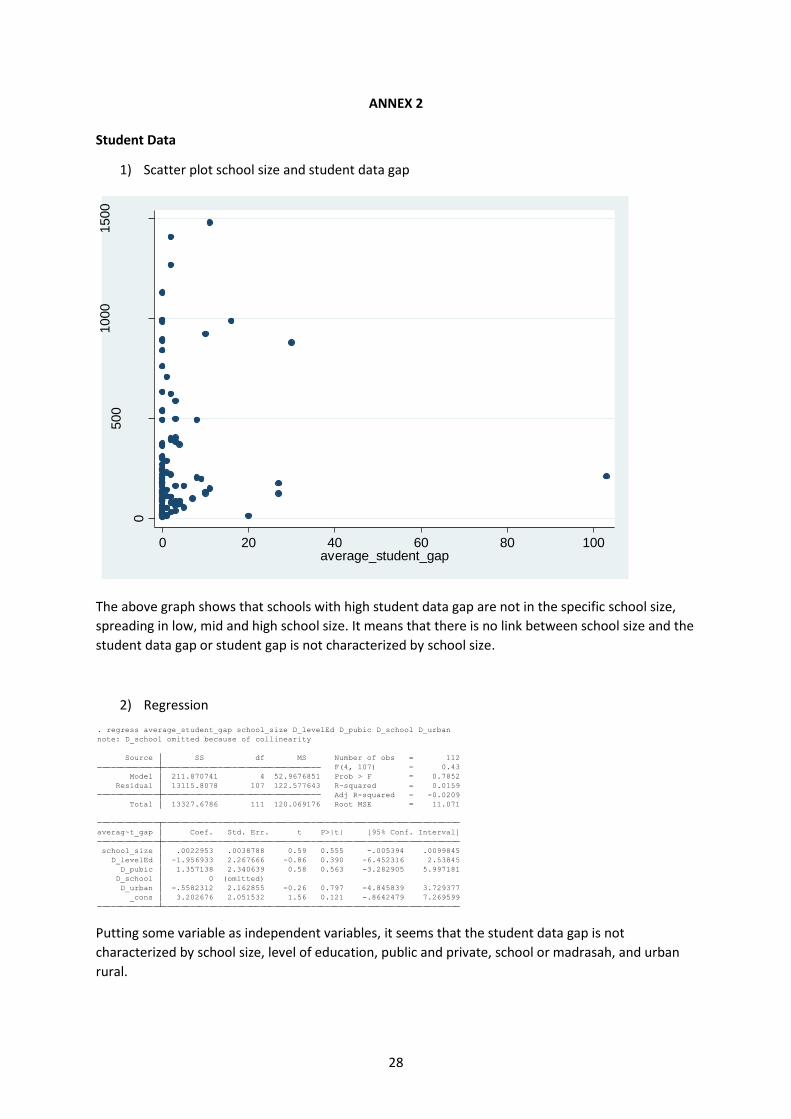
1) Scatter plot school size and student data gap
The above graph shows that schools with high student data gap are not in the specific school size,
spreading in low, mid and high school size. It means that there is no link between school size and the
student data gap or student gap is not characterized by school size.
2) Regression
Putting some variable as independent variables, it seems that the student data gap is not
characterized by school size, level of education, public and private, school or madrasah, and urban
rural.
0
500
1000
1500
school_
siz
e
0 20 40 60 80 100average_student_gap
_cons 3.202676 2.051532 1.56 0.121 -.8642479 7.269599
D_urban -.5582312 2.162855 -0.26 0.797 -4.845839 3.729377
D_school 0 (omitted)
D_pubic 1.357138 2.340639 0.58 0.563 -3.282905 5.997181
D_levelEd -1.956933 2.267666 -0.86 0.390 -6.452316 2.53845
school_size .0022953 .0038788 0.59 0.555 -.005394 .0099845
averag~t_gap Coef. Std. Err. t P>|t| [95% Conf. Interval]
Total 13327.6786 111 120.069176 Root MSE = 11.071
Adj R-squared = -0.0209
Residual 13115.8078 107 122.577643 R-squared = 0.0159
Model 211.870741 4 52.9676851 Prob > F = 0.7852
F(4, 107) = 0.43
Source SS df MS Number of obs = 112
note: D_school omitted because of collinearity
. regress average_student_gap school_size D_levelEd D_pubic D_school D_urban

29
Partial regression
If we do partial regression for each variable, the results are all not significant, except for urban vs
rural.
_cons 2.677778 1.327619 2.02 0.045 .0582739 5.297282
D_urban 3.492435 1.857456 1.88 0.062 -.1724811 7.157351
averag~t_gap Coef. Std. Err. t P>|t| [95% Conf. Interval]
Total 29431.7337 183 160.829146 Root MSE = 12.595
Adj R-squared = 0.0137
Residual 28870.9322 182 158.631495 R-squared = 0.0191
Model 560.801544 1 560.801544 Prob > F = 0.0617
F(1, 182) = 3.54
Source SS df MS Number of obs = 184
. regress average_student_gap D_urban
.
_cons 6.041667 1.491136 4.05 0.000 3.099531 8.983803
D_school -2.595238 1.911248 -1.36 0.176 -6.366291 1.175815
averag~t_gap Coef. Std. Err. t P>|t| [95% Conf. Interval]
Total 29431.7337 183 160.829146 Root MSE = 12.653
Adj R-squared = 0.0046
Residual 29136.5536 182 160.090954 R-squared = 0.0100
Model 295.180124 1 295.180124 Prob > F = 0.1762
F(1, 182) = 1.84
Source SS df MS Number of obs = 184
. regress average_student_gap D_school
.
_cons 4.48 1.271662 3.52 0.001 1.970904 6.989096
D_pubic -.0395238 1.882093 -0.02 0.983 -3.753051 3.674003
averag~t_gap Coef. Std. Err. t P>|t| [95% Conf. Interval]
Total 29431.7337 183 160.829146 Root MSE = 12.717
Adj R-squared = -0.0055
Residual 29431.6624 182 161.712431 R-squared = 0.0000
Model .0713147 1 .0713147 Prob > F = 0.9833
F(1, 182) = 0.00
Source SS df MS Number of obs = 184
. regress average_student_gap D_pubic
.
_cons 5.070175 1.188777 4.27 0.000 2.724618 7.415732
D_levelEd -1.598747 1.927349 -0.83 0.408 -5.401568 2.204074
averag~t_gap Coef. Std. Err. t P>|t| [95% Conf. Interval]
Total 29431.7337 183 160.829146 Root MSE = 12.693
Adj R-squared = -0.0017
Residual 29320.8815 182 161.103744 R-squared = 0.0038
Model 110.852242 1 110.852242 Prob > F = 0.4079
F(1, 182) = 0.69
Source SS df MS Number of obs = 184
. regress average_student_gap D_levelEd
.
_cons 2.887616 1.383899 2.09 0.039 .1450532 5.63018
school_size .0019847 .0032494 0.61 0.543 -.0044548 .0084242
averag~t_gap Coef. Std. Err. t P>|t| [95% Conf. Interval]
Total 13327.6786 111 120.069176 Root MSE = 10.989
Adj R-squared = -0.0057
Residual 13282.6305 110 120.751186 R-squared = 0.0034
Model 45.0480731 1 45.0480731 Prob > F = 0.5426
F(1, 110) = 0.37
Source SS df MS Number of obs = 112
. regress average_student_gap school_size

30
It is possible that the gap in student data is higher in urban (cities) areas than rural (districts).
Teacher data
1) Scatter plot school size and teacher data gap
Similar with the student data, the teacher data gap also shows that the pattern of the gap is not
characterized by school size.
2) Regression
By controlling level of education, public-private, urban-rural, It shows that the bigger the school size
the higher teacher data gap.
0
500
1000
1500
school_
siz
e
0 20 40 60 80average_teacher_gap
_cons -.5790601 1.568082 -0.37 0.713 -3.688277 2.530157
D_urban .7027771 1.648227 0.43 0.671 -2.565353 3.970907
D_school 0 (omitted)
D_pubic -.3616494 1.762356 -0.21 0.838 -3.856077 3.132778
D_levelEd 1.186298 1.708683 0.69 0.489 -2.201704 4.5743
school_size .0058806 .0029544 1.99 0.049 .0000225 .0117387
average_te~p Coef. Std. Err. t P>|t| [95% Conf. Interval]
Total 7787.85455 109 71.4482068 Root MSE = 8.3222
Adj R-squared = 0.0306
Residual 7272.22461 105 69.259282 R-squared = 0.0662
Model 515.629939 4 128.907485 Prob > F = 0.1227
F(4, 105) = 1.86
Source SS df MS Number of obs = 110
note: D_school omitted because of collinearity
. regress average_teacher_gap school_size D_levelEd D_pubic D_school D_urban
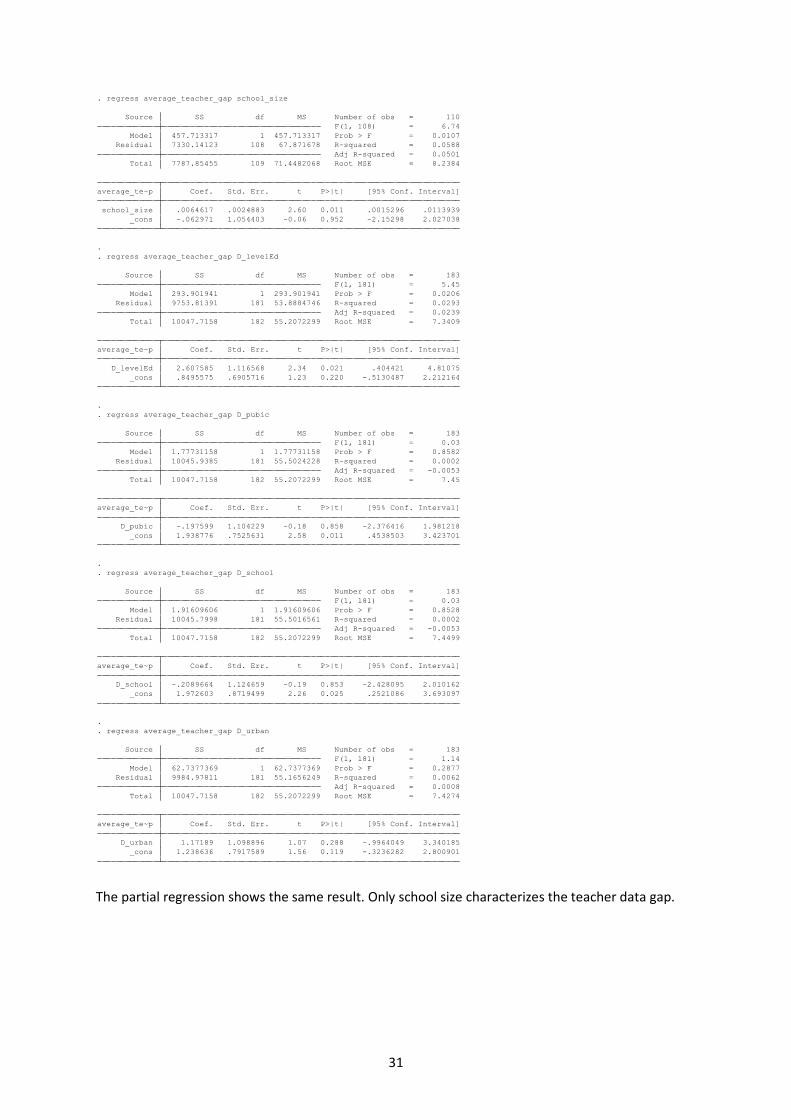
31
The partial regression shows the same result. Only school size characterizes the teacher data gap.
_cons 1.238636 .7917589 1.56 0.119 -.3236282 2.800901
D_urban 1.17189 1.098896 1.07 0.288 -.9964049 3.340185
average_te~p Coef. Std. Err. t P>|t| [95% Conf. Interval]
Total 10047.7158 182 55.2072299 Root MSE = 7.4274
Adj R-squared = 0.0008
Residual 9984.97811 181 55.1656249 R-squared = 0.0062
Model 62.7377369 1 62.7377369 Prob > F = 0.2877
F(1, 181) = 1.14
Source SS df MS Number of obs = 183
. regress average_teacher_gap D_urban
.
_cons 1.972603 .8719499 2.26 0.025 .2521086 3.693097
D_school -.2089664 1.124659 -0.19 0.853 -2.428095 2.010162
average_te~p Coef. Std. Err. t P>|t| [95% Conf. Interval]
Total 10047.7158 182 55.2072299 Root MSE = 7.4499
Adj R-squared = -0.0053
Residual 10045.7998 181 55.5016561 R-squared = 0.0002
Model 1.91609606 1 1.91609606 Prob > F = 0.8528
F(1, 181) = 0.03
Source SS df MS Number of obs = 183
. regress average_teacher_gap D_school
.
_cons 1.938776 .7525631 2.58 0.011 .4538503 3.423701
D_pubic -.197599 1.104229 -0.18 0.858 -2.376416 1.981218
average_te~p Coef. Std. Err. t P>|t| [95% Conf. Interval]
Total 10047.7158 182 55.2072299 Root MSE = 7.45
Adj R-squared = -0.0053
Residual 10045.9385 181 55.5024228 R-squared = 0.0002
Model 1.77731158 1 1.77731158 Prob > F = 0.8582
F(1, 181) = 0.03
Source SS df MS Number of obs = 183
. regress average_teacher_gap D_pubic
.
_cons .8495575 .6905716 1.23 0.220 -.5130487 2.212164
D_levelEd 2.607585 1.116568 2.34 0.021 .404421 4.81075
average_te~p Coef. Std. Err. t P>|t| [95% Conf. Interval]
Total 10047.7158 182 55.2072299 Root MSE = 7.3409
Adj R-squared = 0.0239
Residual 9753.81391 181 53.8884746 R-squared = 0.0293
Model 293.901941 1 293.901941 Prob > F = 0.0206
F(1, 181) = 5.45
Source SS df MS Number of obs = 183
. regress average_teacher_gap D_levelEd
.
_cons -.062971 1.054403 -0.06 0.952 -2.15298 2.027038
school_size .0064617 .0024883 2.60 0.011 .0015296 .0113939
average_te~p Coef. Std. Err. t P>|t| [95% Conf. Interval]
Total 7787.85455 109 71.4482068 Root MSE = 8.2384
Adj R-squared = 0.0501
Residual 7330.14123 108 67.871678 R-squared = 0.0588
Model 457.713317 1 457.713317 Prob > F = 0.0107
F(1, 108) = 6.74
Source SS df MS Number of obs = 110
. regress average_teacher_gap school_size

32
ANNEX 3
Part 1. Potential overbudget estimation
Estimated fiscal impact on BOS allocation SD SMP SMA SMK MI MTs MA
a. Percentage of overreporting school 23% 21% 14% 12% 12% 13% 17%
b. Number of schools (total, 2019) 148,673 39,637 13,692 14,064 25,555 18,137 8,789
c. Magnitude of discrepancy (number of students), per school 7.86 18.14 10.67 12.33 11.33 25.33 22.75
d. Total magnitude of discrepancy (national, estimated) (a x b x c)
263,863 148,045 19,927 20,809 33,413 59,907 34,771
e. BOS per student (2019) 800,000 1,000,000
1,400,000
1,600,000
800,000 1,000,000
1,400,000
Estimated fiscal impact (2019), IDR billion (d x e)
211.1 148.0 27.9 33.3 26.7 59.9 48.7
420.3 135.3
Part 2. Potential underbudget estimation
Estimated fiscal impact on BOS allocation SD SMP SMA SMK MI MTs MA
f. Percentage of underreporting school 29% 29% 14% 24% 31% 22% 22%
g. Number of schools (total, 2019) 148,673 39,637 13,692 14,064 25,555 18,137 8,789
h. Magnitude of discrepancy (number of students), per school (3.56) (4.90) (4.67) (6.67) -18.88 -10.80 -5.80
i. Total magnitude of discrepancy (national, estimated) (a x b x c)
(153,649) (57,120) (8,722) (22,514) (148,459) (42,584) (11,082)
j. BOS per student (2019) 800,000 1,000,000
1,400,000
1,600,000
800,000 1,000,000
1,400,000
Estimated fiscal impact (2019), IDR billion (d x e)
(122.9) (57.1) (12.2) (36.0) (118.8) (42.6) (15.5)
(228.3) (176.9)
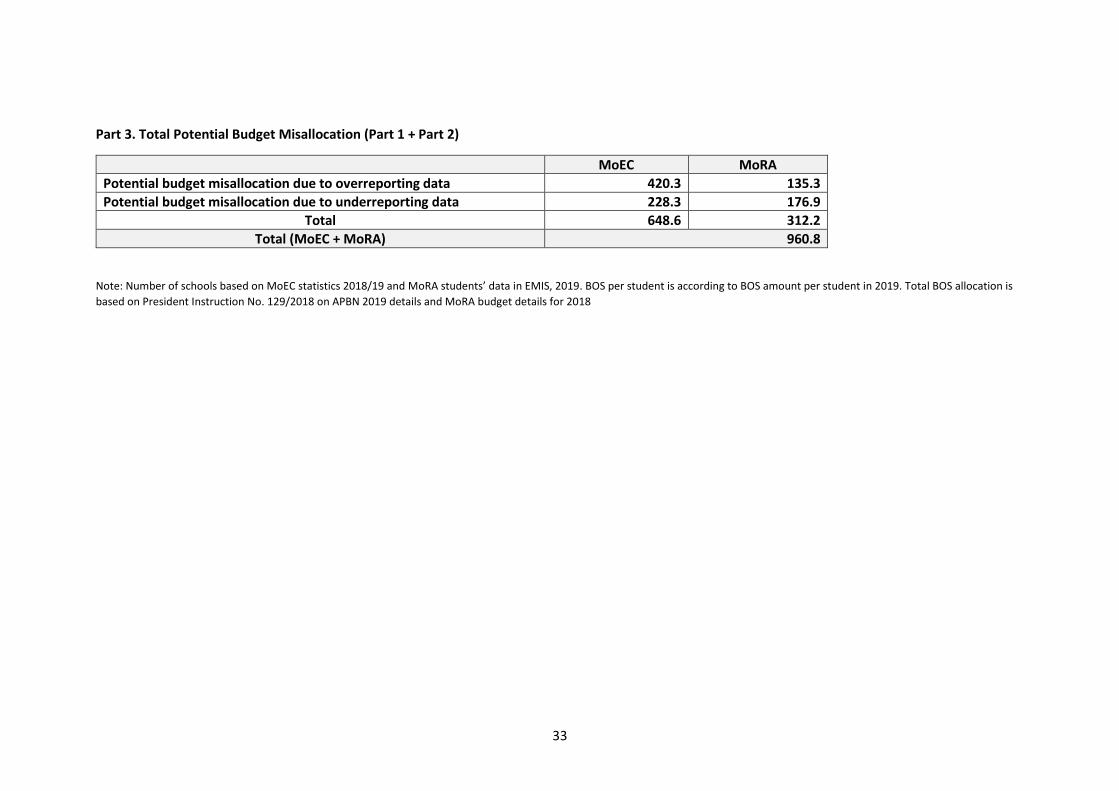
33
Part 3. Total Potential Budget Misallocation (Part 1 + Part 2)
MoEC MoRA
Potential budget misallocation due to overreporting data 420.3 135.3
Potential budget misallocation due to underreporting data 228.3 176.9
Total 648.6 312.2
Total (MoEC + MoRA) 960.8
Note: Number of schools based on MoEC statistics 2018/19 and MoRA students’ data in EMIS, 2019. BOS per student is according to BOS amount per student in 2019. Total BOS allocation is
based on President Instruction No. 129/2018 on APBN 2019 details and MoRA budget details for 2018

34