an inclusive & efficient service delivery
TRANSCRIPT

An Inclusive & Efficient Service Delivery:
Imperative for Sustainable Provision of Drinking Water”
Anshuman
Associate Director,
Water Resources Division
The Energy and Resources Institute (TERI)
‘‘G.STIC, Brussels”
24th October, 2017
Structure of Presentation
1. Major Challenges in Water sector in India
2. Case Studies
• Community-led Water Kiosk System
• Urban Water Demand Management
• River Bank Filtration System
3. Way Forward & Key Messages
State of Water Resources

June 1, 2003:
(Natwarghad)
Gujarat
(Amit Dave/Reuters)
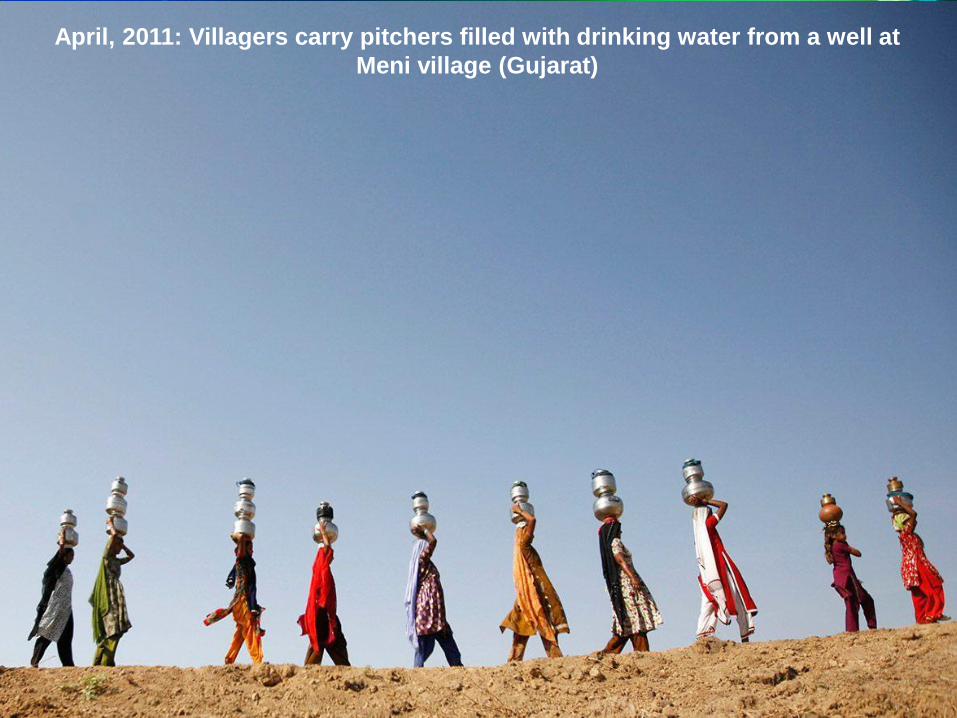
April, 2011: Villagers carry pitchers filled with drinking water from a well at
Meni village (Gujarat)


August, 2010: A man, marooned by flood waters along with his livestock, waves
towards an army helicopter for relief handout in the Rajanpur Pakistan's Punjab (Reuters)
Maharashtra 2013: Drought in village
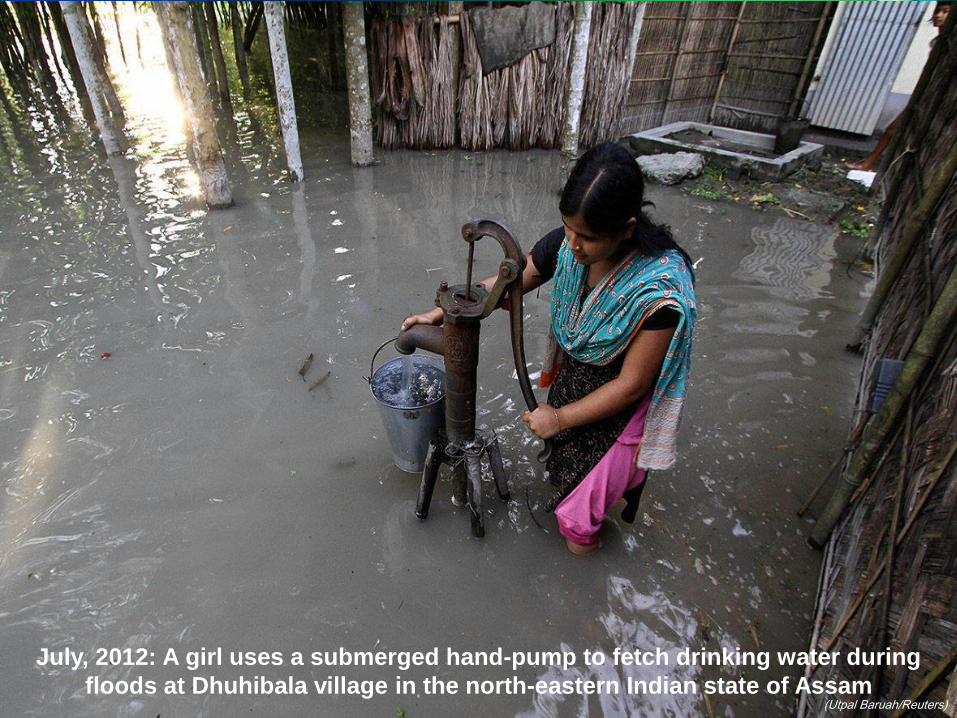
July, 2012: A girl uses a submerged hand-pump to fetch drinking water during
floods at Dhuhibala village in the north-eastern Indian state of Assam (Utpal Baruah/Reuters)

Saturday, March 14, 2015
Foam from industrial effluents covers the surface of the Yamuna River in New
Delhi, as a man, center background, tries to catch fish

Major Challenges in Water
Sector
Global & Indian Scenario

Declining per capita water availability
Many river basins are water stressed and likely to be
water scarce.
Increasing & competing water demand
Overexploitation/Depletion of groundwater
Water quality issues
Inefficient use of water: Agri/ Irrigation; Domestic (Urban
& Rural), Industrial
Irrational Tariff, inequitable access
Climate change impacts
Limited trans-boundary cooperation (both National and
Regional) on water management & information sharing
Major Regional Challenges in Water Sector

State of water resources: Global
Total annual renewable water resources: Global
Most recent estimates (1985-2010)
The South Asian countries (Afghanistan; Bangladesh;
Bhutan; India; Iran; Maldives; Nepal; Pakistan; Sri Lanka) are
home to about 1/4th of the world’s population, but only
contain about 4.5% (1,945 billion m3 ) of the world’s annual
renewable water resources (43,659 billion m3 ) Source: WWAP 2012. The UN WWDR 4: UNESCO

Developmental stress on water resources
(India)
• Fierce
competition
among sectors:
industries, irrigation,
drinking water etc.
• Industrial water
requirement
doubled during last
decade &
expected to
increase 7 folds
by 2050
Competing Water demand (BCM)
688910
1072
5673
102
12
23
63
5
15
130
52
72 80
8131093
1447
1
10
100
1000
10000
2010 2025 2050
Years
Wate
r D
em
an
d (
Bil
lio
n C
ub
ic M
ete
r)
Irrigation
Drinkingwater
Industry
Energy
Others
Total
Increasing & competing demand

Impacts on water resources
Per capita water availability
Source: WWAP (World water assessment programme). 2015. The UN WWDR -2015: Water for a sustainable world, Paris, UNESCO
India falls in water stressed category

Major issues in Urban Water Sector
Inequitable access
- Access to safe drinking water in Urban areas has increased in last two decades (91.9%; 2011 Census). However, still about 8% lack access in urban and 16% in rural (84%; 2008).
- High Disparity in per capita water supply (Eg. Delhi 29 to 509 lpcd); (India wide- 9 lpcd in Tuticorin to 584 lpcd in Triuvannamalai).
- Slippages!
Unsustainable &
inefficient water-use - Inconsistent supply (2-3
hours) with high leakages, thefts

Major issues in Urban Water Sector
MDG India Country Report 2015:
During 2012, at all India level, 87.8% households had access to improved
source of drinking water while 86.9% households in rural and 90.1%
households in urban area had access to improved source of drinking water..

Major issues in Urban Water Sector
High UFW - UFW (Unaccounted for water)
in Urban water supply: (generally 20-50%);
- NCR – 30-50%
Metering - Very low coverage in metering.
- Many places no metering at all
A (2007) study by MoUD & ADB in 20
major cities of India shows an
average water availability of 4.3
hours/day, an average UFW of
about 32% and average metered
connection of only 24.5%

Irrational Tariff - Water tariff does not represent the actual O&M, social and environment cost of
water. Lack of ‘water pinch’.
• Bhopal (lowest tariff that can not cover production cost of Rs. 3/m3 )- Rs. 0.6/m3
• Indore: Average tariff Rs. 2.79/ m3 against production cost of Rs. 13.18/m3
- Low billing & collection efficiency,
- High Staffing ratio (Bhopal (20.7), Indore (18.7), Mumbai (17.2)
Major issues in Urban Water Sector

"ENSURE AVAILABILITY AND SUSTAINABLE MANAGEMENT OF
WATER AND SANITATION FOR ALL"
Target 6.1 “By 2030, achieve universal & equitable access to safe &affordable drinking
water for all” (Proportion of population using safely managed drinking water services)
Target 6.2 “By 2030, achieve access to adequate & equitable sanitation/hygiene for all and
end open defecation. (Proportion of population using safely managed sanitation services, including hand-washing)
Target 6.3 “By 2030, improve water quality by reducing pollution, halving the proportion of
untreated wastewater and increasing recycling and safe reuse globally” (Proportion of wastewater
safely treated)
Target 6.4 “By 2030, substantially increase water-use efficiency across all sectors and
ensure sustainable withdrawals and supply of freshwater to address water scarcity and
substantially reduce the number of people suffering from water scarcity”. (Change in water use
efficiency over time)
Target 6.5 “By 2030, implement IWRM at all levels, including through transboundary
cooperation as appropriate”
Target 6.6 “By 2020, protect and restore water-related ecosystems,
Additional targets on Means of Implementation
Target 6.a “By 2030, expand international cooperation and capacity-building support
Target 6.b “Support &strengthen participation of local communities
And in addition Target 11.5 : link to other targets (Disaster Management)

What Needs to Be Done?

Given the challenges in water sector…
• The conscience for efficient water management
with use of efficient technologies needs to take a
center stage in planning by the Water
managers/Planners.
• Need to focus with an integrated approach − that takes into account the need of all stakeholders
confined within a particular boundary like basin, sub-
basin, watersheds
• Multi agency, multi disciplinary and multi faceted
approach

Case Studies
(Water Kiosk, WDM, & RBF)
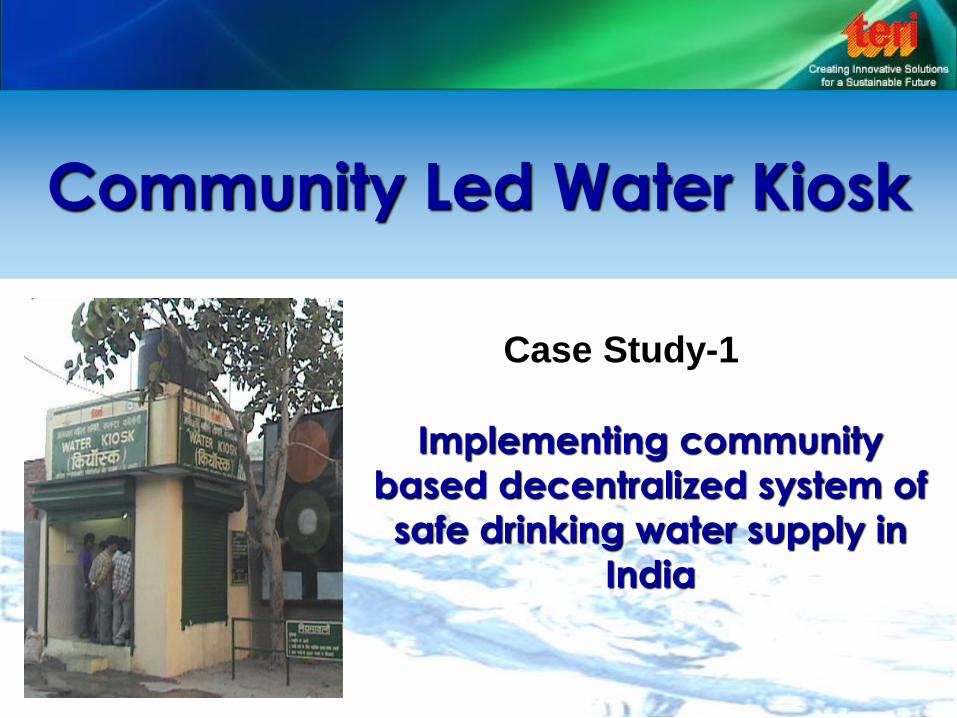
Community Led Water Kiosk
Implementing community
based decentralized system of
safe drinking water supply in
India
Case Study-1

The Vision
Provision of reliable safe drinking water for a low income
community
Decentralized water supply system
Running in an economically self-sustainable model
Developed capability of generating gainful employment
Reduced burden of disease from unsafe drinking water
Community & women centric & enhances the “Bhagidari”
initiative of the Delhi State Government & DJB’s commitment to
serve the urban poor
Potential for replicability
Kiosk ultimately aimed at increasing access and
availability of safe drinking water supply (at affordable
price) to people, especially the poor, who bear the heaviest
burden of poor water quality.
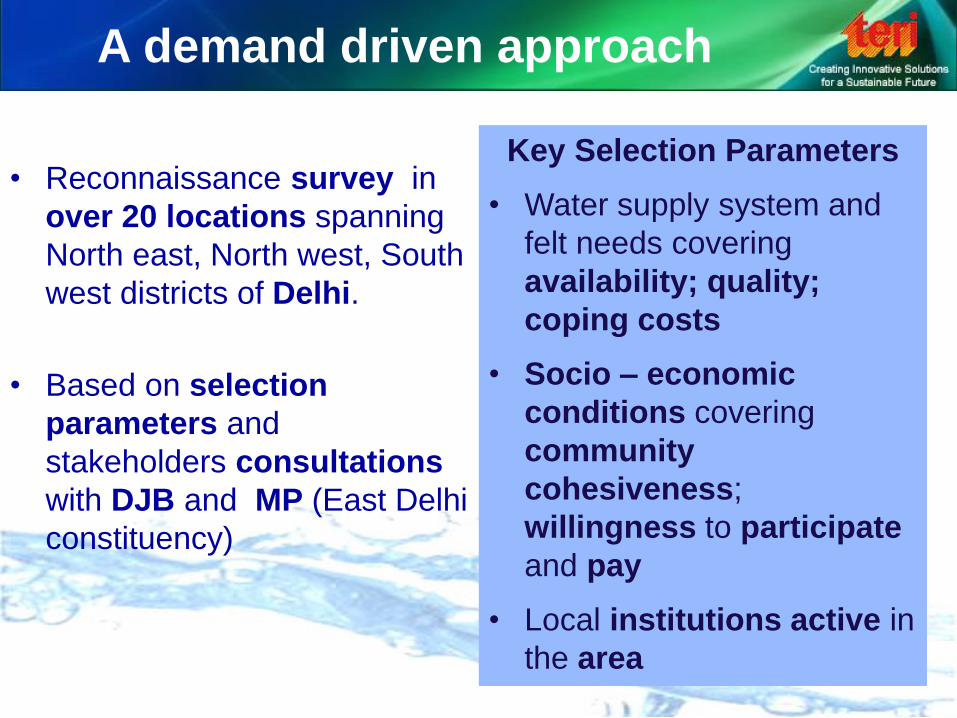
• Reconnaissance survey in
over 20 locations spanning
North east, North west, South
west districts of Delhi.
• Based on selection
parameters and
stakeholders consultations
with DJB and MP (East Delhi
constituency)
A demand driven approach
Key Selection Parameters
• Water supply system and
felt needs covering
availability; quality;
coping costs
• Socio – economic
conditions covering
community
cohesiveness;
willingness to participate
and pay
• Local institutions active in
the area
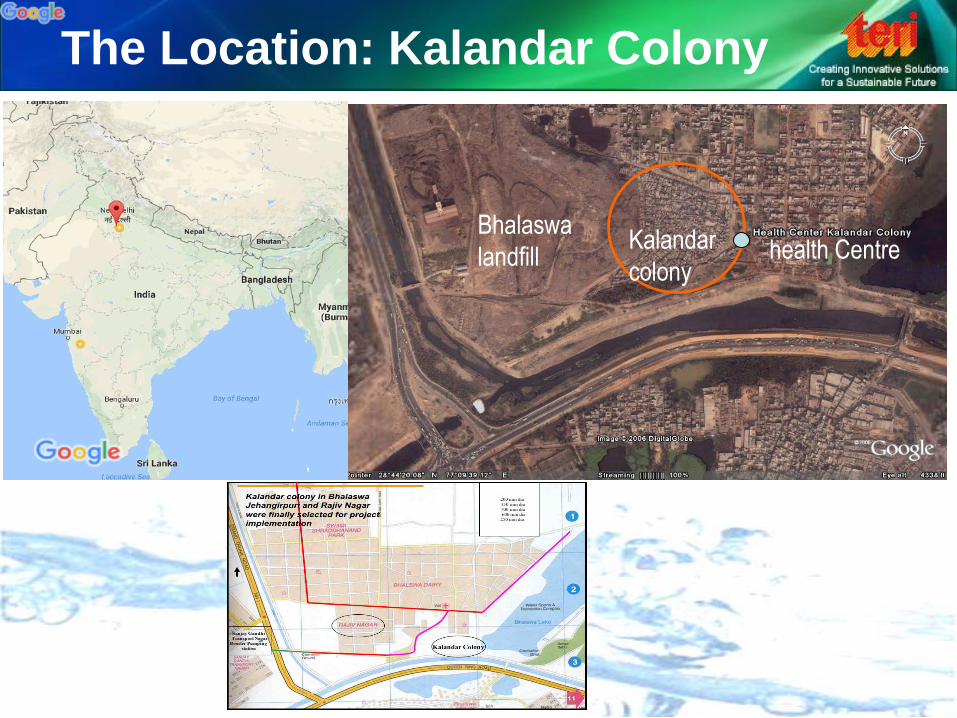
The Location: Kalandar Colony
Bhalaswa
landfill Kalandar
colony health Centre
24/10/17, 9*32 AMDelhi - Google Maps
Page 1 of 2ht tps:/ /www.google.be/maps/place/Delhi,+India/@23.9332278,73.…47eb62d:0x37205b715389640!8m2!3d28.7040592!4d77.1024902?dcr=0
Map data ©2017 Google, ORION-ME, ZENRIN Belgium 500 km
Delhi
ि दल India
Delhi, India’s capital territory, is a massive metropolitan area in the country’s north. In Old Delhi, a neighborhood
dating to the 1600s, stands the imposing Mughal-era Red Fort, a symbol of India, and the sprawling Jama Masjid
Photos
Quick facts
Delhi

Contd..
• Predominant Occupation: Unskilled labor
(45%)
• Predominant Income: Rs. 2500-5000 (58%)
Dilapidated water infrastructure
Poor and worsening water quality
High coping costs and health
costs
Bhalaswa Landfill
Low income community with
nearly 1760 households (20-25
years old)
Located adjacent to Bhalaswa
sanitary landfill site
• Poses potential health risks
• Serious environmental concern

Parameter Sample from
Pumping station
Pipe water samples from
Kalandar colony
TDS
( 500 mg/l) 350 -600 mg/l 500-1300 mg/l
Total Coliform negative Positive in few
Heavy metal
such as IRON
(0.3 mg/l)
0.01- 0.2 mg/l exceeding the 0.3 limit in 3
samples and extended limit
of 1 mg/l in 2 samples
Occasional Colour, Odour & suspended solids
chlorination
Ranney well
at Palla
UGT + Pumping
station at Sanjay
Gandhi Transport
Nagar
KALANDAR
COLONY (15-20yrs old)
RAJIV NAGAR
D BLOCK
Water supply system and quality

The Process
Baseline development
Qualitative and quantitative tools (Customized
indicators)
Participatory approaches for issue identification
System Design
Water quality assessment (time series data)
Demand assessment for Kiosk capacity design
Resource assessment (water supply, electricity,
siting)
Treatment system design
Feasibility study to assess the viability
Demand based
Multi stakeholders partnerships Low cost / Economically viable
Community owned and managed Project
approach

The Participatory Approach
Community mobilization (workshops, street plays, cluster meetings
etc.) (water & health linkage; water handling & hygiene practices)

The Participatory Approach
Institutionalizing the Kiosk management
Formation of kiosk committee
Developing the distribution system
Consensus water costing
Creating & strengthening committee
capacity for O&M
Technical training
Accounts management training
Conflict resolution
Fostering multi stakeholder
Partnership

The Facility: Water Kiosk
Officially launched and fully functional
Supplying treated safe water to the community
Operated and managed by the Community
through a Committee “Jal Dhara Mahila Samiti”
Nearly, 150 household members of the facility
User cards, cans and coupons distributed
Households paid user fee of Rs. 35/ month
Current cost of water approx. Rs. 0.09/ Liter and
could reduce with increased user base.
Now, operational community based decentralized water
supply system ensures safe reliable potable water for
the residents of Kalandar Colony everyday.

Urban
Water Demand Management
Four Cities
Indore, Jabalpur, Gwalior, Bhopal
Case Study-2

A Paradigm Shift
Supply Driven
How much water
is pumped into
the system
Demand Driven
How much water
is getting to the
consumers
From an Engineering approach
to a Management approach
that considers all issues in a holistic way!
Water Demand Management

The Concept
Source:
Klas Sandtrom, ACADIA Consultants
WDM refers to
implementation of
policies & measures to
control or influence
the water demand

Urban Water Supply: Standard IWA Water Balance
System
Input
Volume
Authorized
Consumption
Revenue
Water
Non
Revenue
Water
(NRW)
Billed
Authorized
Consumption
Unbilled
Authorized
Consumption
Apparent
Losses
Real
Losses
Water
Losses
Billed Metered Consumption
Unbilled Unmetered Consumption
Unauthorized Consumption
Customer Meter Inaccuracies
Leakage on Transmission and
Distribution Mains
Billed Unmetered Consumption
Unbilled Metered Consumption
Leakage on Service Connections
up to point of Customer Meter
Leakage and Overflows at
Storage Tanks

Aqualibre : Water Balance

Summary of Findings
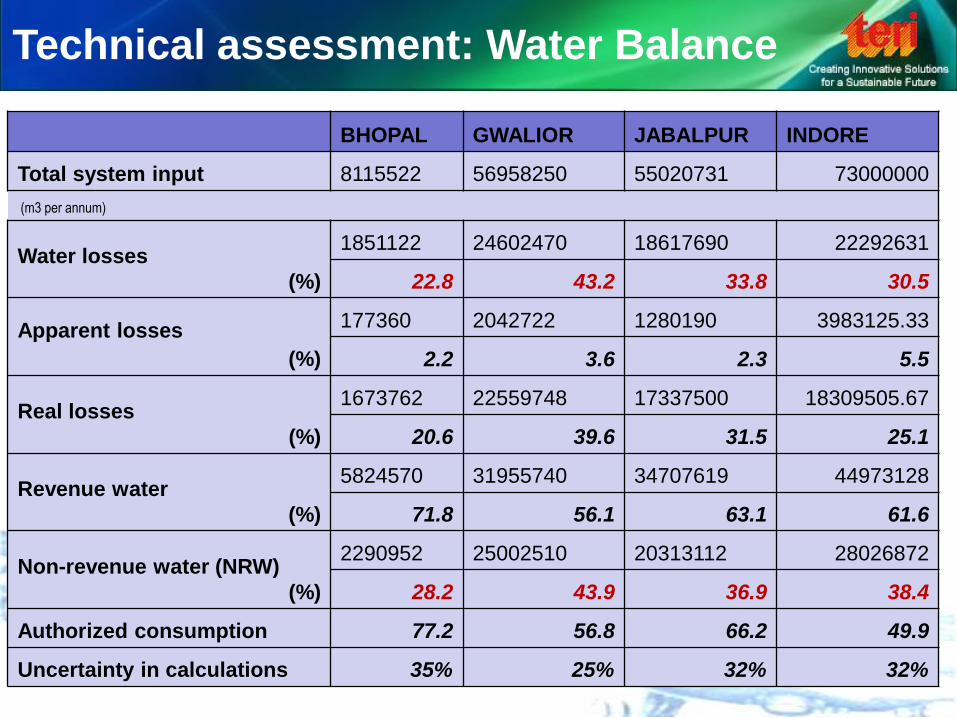
Technical assessment: Water Balance
BHOPAL GWALIOR JABALPUR INDORE
Total system input 8115522 56958250 55020731 73000000
(m3 per annum)
Water losses
(%)
1851122 24602470 18617690 22292631
22.8 43.2 33.8 30.5
Apparent losses
(%)
177360 2042722 1280190 3983125.33
2.2 3.6 2.3 5.5
Real losses
(%)
1673762 22559748 17337500 18309505.67
20.6 39.6 31.5 25.1
Revenue water
(%)
5824570 31955740 34707619 44973128
71.8 56.1 63.1 61.6
Non-revenue water (NRW)
(%)
2290952 25002510 20313112 28026872
28.2 43.9 36.9 38.4
Authorized consumption 77.2 56.8 66.2 49.9
Uncertainty in calculations 35% 25% 32% 32%

Water Used
57 % Houses, Commercial, Industrial
145 Ml/d ≈ 53 000 Ml/year
Losses
43 % or 20% ?
43%: 23 000 Ml/year
or 20%: 10 600 Ml/year
30 000 Ml/year
Eg. Gwalior

Yield of a medium sized dam each year
Assume 20% Losses in Gwalior
Losses: 10.6 million kl/year

Projections with continuation of existing/pre-2004 tariffs
Key features of current accounting system and tariff structure
Single-entry cash based system
Single part tariff structure
Parameter
(Rs. Crore)
Base Case I (Fixed charges)
Short-term (2006-08)
Medium-term
(2008-10)
Long-term (2010-12)
Revenue 13.37 15.16 17.10 18.44
Expenditure 27.88 31.74 36.01 40.78
Gap (tariffs) (14.50) (16.58) (18.92) (22.35)
Financial performance appraisal of Bhopal Municipal Corporation (BMC)

Financial performance appraisal of Bhopal Municipal Corporation (BMC)
Assessment of the revenue-expenditure of Waterworks Department
Parameter FY 2004-05
Revenue Collection/KL of water supplied Rs. 0.93 /KL
Expenditure/KL of water supplied Rs. 1.76 /KL
Revenue – Expenditure Gap (In Rs./KL) Loss of Rs. 0.83 /KL
Revenue Collected per no. of connections (Assuming
80,114 consumers)
Rs. 660.63 /Consumer
Expenditure per no. of connections Rs. 1256.94 /Consumer
Revenue – Expenditure Gap (In Rs./connections) Loss of Rs. 596.31 /Consumer
Actual Loss (In Rs.) Rs. 4.78 Crores

Strategies for
Water Demand Management

• Metering (Smart Meters)
– Bulk management meters
– Consumer meters (domestic and bulk)
• Water audits (as a tool) and balancing
• GIS and MIS (use of ICT)
• Sectorisation/District Metered Areas
• Leak detection and control
• Pressure management
• Energy auditing
• Assets management program
• Water conservation at consumer end ....
WDM strategies (Technical)

- A separate cell for leak
detection and control
within the MC.
- A major drive for
detection of all leaks.
(Active and passive leakage
control using modern
equipment such as sounding
rods.)
- Contractual Leak
detection and maintenance
WDM strategies (Technical)
Leakage detection and control
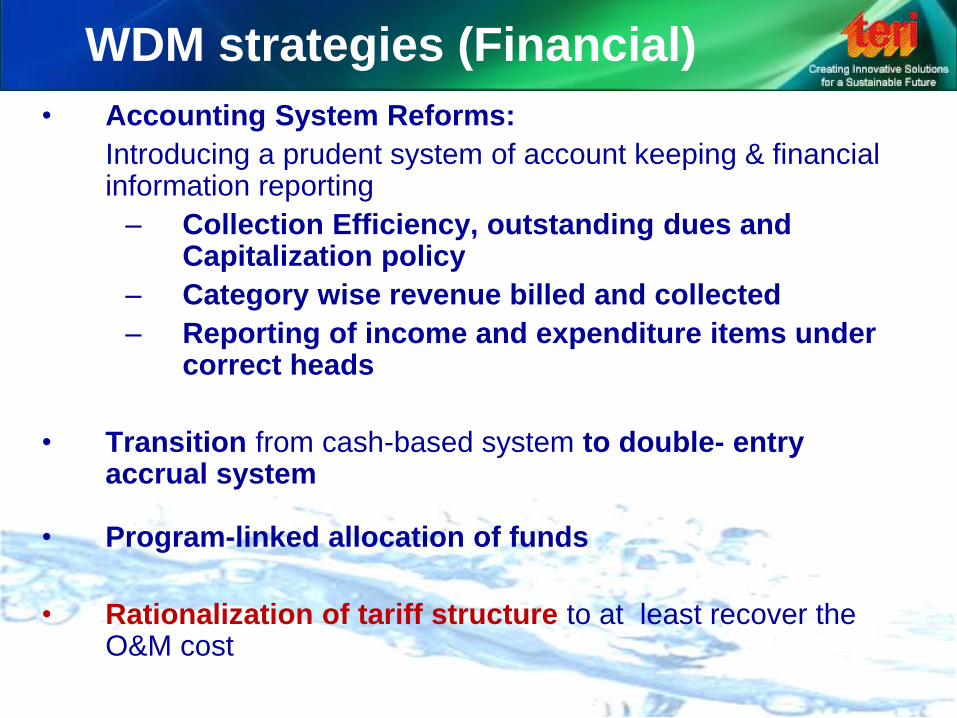
• Accounting System Reforms:
Introducing a prudent system of account keeping & financial information reporting
– Collection Efficiency, outstanding dues and Capitalization policy
– Category wise revenue billed and collected
– Reporting of income and expenditure items under correct heads
• Transition from cash-based system to double- entry accrual system
• Program-linked allocation of funds
• Rationalization of tariff structure to at least recover the O&M cost
WDM strategies (Financial)

• Formulation of a vision, policy and legislative
framework for provision of water supply services
• Organizational restructuring
• Operationalizing Performance measurement and
Management Information System (MIS)
• Staff Capacity Building /motivation
• Increased stakeholder involvement, especially politicians
• Public Participation and Consumer interface, IEC
campaigns
• Legislation for control on groundwater use
• Policy guidelines for service delivery
• Public private partnership (PPP) arrangements
• Reforms in billing system
WDM strategies (Institutional)

Role of Technology
Role of Technology in Urban Water Service Delivery
Access to efficient and affordable technology is key factor in achieving
the objective of safe & affordable drinking water for all as well as the
SDG goals.
Technological innovations & advancements in water sector hold
considerable promise in the urban water sector. Some examples includes
smart metering & leak detection equipment, advanced ultrafiltration
systems, desalination technologies, river bank filtration systems,
nanotechnology (nano-filtration & nano-sensors), advanced
wastewater treatment & recycle/reuse technologies etc.
Besides these, advancement & use of ICT (information and
communications technology). Use of real-time sensors coupled with
satellite-based wireless data transfer (including GIS, SCADA & cloud
computing etc.) can significantly facilitate & improve the monitoring &
supply of water resources in terms of water quality, water levels, leakage
control etc., and as well help in effective & timely decision making.

River Bank Filtration (Potential pre-treatment technology for drinking water)
Kariyampalli, near Kali River, (south of Dandeli), Karnataka, India.
P. Cady1, T. B. Boving1,2*, B. S. Choudri3, A. Cording4, K. Patil5, V. Reddy5 Fraddry D’souza5 1. University of Rhode Island, Department of Geosciences, Kingston, Rhode Island.
2. * University of Rhode Island, Department of Civil and Environmental Engineering, 315 Woodward Hall, Kingston, RI, 02881; e-
mail: [email protected].
3. Centre for Environmental Studies & Research (CESAR), Sultan Qaboos University, Muscat, Sultanate of Oman.
4. University of Vermont, Department of Plant and Soil Sciences, Burlington.
5. The Energy and Resources Institute (TERI), Coastal Ecology and Marine Resources Center, Goa, India.
Case Study-3

RBF Technology
The Potential:
• Riverbank Filtration - proven low-tech water treatment technology
• Scalable at predictable cost and efficiency
• Supports access to drinking water & water efficient drip-irrigation
systems.
• Solar powered in off grid areas.
References:
Acknowledgement:
Introduction
Methods
Results
Conclusions
Illustrating the Potential of Riverbank Filtration Technology: Case Studies from Southern India
Kavita Patil1*, Thomas Boving2 and Fraddry D’souza1
1The Energy and Resources Institute, India . 2 University of Rhode Island, USA*Corresponding Author: [email protected]
ISWATS ConferenceApril 21-23 2016, Pune.
Two case studies - one in Uttar Kanada district of Karanataka and the other inSouth Goa district of Goa - demonstrate the potential of River Bank Filtration(RBF) for providing water. Like most parts of India, people in these districts donot have access to safe water for drinking or irrigation or face severe problemswith contaminated surface water resources. In such situations RBF canpotentially address these issues. For instances, RBF provided safe drinking waterfor residents of Kariyampalli village in Karnataka (Cady et al. 2013) and cleanirrigation water for rural farmers of Navelim, Goa (Boving et al. 2016).
In a RBF system, river water is forced to flow through porous riverbed (alluvial) sediments towards the RBF extraction well. As raw surface water travels towards the RBF well, pathogens and dissolved/suspended chemicals are removed or significantly reduced via natural, self-regenerating filtration processes.
Metals: Inductively Coupled Plasma Mass Spectrometer (ICPMS) Bacteria: IDEXX Most Probable Number (MPN) technique
Figure 1: Riverbank Filtration (RBF) system diagram: cross-sectional viewshows path of infiltrating river water to the production well.
0
1
2
3
4
5
6
7
8
9
Bore
Well
Kali
River
Open
Well
Well
3
Co
nce
ntr
atio
n (
pp
b) Lead
Copper
Error bars show maximum range
Figure 4.2: RBF well 3 water has lower averagemetals levels than other local drinking wateroptions Copper showed reduction of up to 98.3%and Lead was removed up to 99.2%
References:
Cady, P., Boving, T.B., Choudri, B.S., Davis, A., Patil, K., Reddy, V., 2013. Attenuation of Bacteria at a Riverbank Filtration Site in Rural India. Water Environment Research; Vol. 85, Number 11, November 2013, pp. 2164-2174.
Boving, T.B., Patil, K., 2016. Riverbank Filtration Technology at the Nexus of Water-Energy-Food. In: Water-Energy-Food Nexus: Theories and Practices (Salam et al. Eds.). Accepted .
Acknowledgement: Funding is provided by World Bank Development Marketplace Program for site at Uttarkanada & Ramboll- Environ Foundation, USA for Goa region.
Figure 5: Fecal coli form bacteria concentration along the Sal River in Goa . Data reported by the Goa State Pollution Control Board.
0
5000
10000
15000
20000
25000
30000
35000
40000
Apr-14 May-14 Jun-14 Jul-14 Aug-14 Sep-14 Oct-14 Nov-14 Dec-14 Jan-15 Feb-15 Mar-15
Fecal Coliform BacteriaSal River, Goa 2014-15
PAZORCONI, CUNCOLIM
RIVER SAL AT MOBOR
RIVER SAL AT ORLIM BRIDGE
RIVER SAL AT KHAREBAND, MARGAO
RBF improves water quality. Removal of Copper: 62.1–86.4%. Lead: 95.4–97.9%.Bacteria: Total Coliform: 93.5% and E. coli: 98.7% average removal.
RBF water is safer than other drinking water sources in the area, while also reducing groundwater drawdown.
High value crops promise greatest return on investment into RBF in combination with drip irrigation.
Solar energy can power the RBF system, permitting water production in non-electrified, remote areas.
all prupose70%
Drinking10%
Cooking20%
Agriculture0%
Purpose of Usage of RBF water
Yes100%
No0%
Don’t Know0%
Use of RBF water post survey
Use of River Water before RBF
No opinion
7.7%
Domestic
Use
31%
Agriculture
23%
Drinking
32.2%
No - Other
5.1%
No - Bad
Quality
10.3%
No - No
access
16.7%
Figure 3: Survey data pre- and post- RBF installations at Kali river site
Figure 4.1: Total Coliform bacteriashowed an average reduction of93.52% (geometric mean) with amaximum removal rate of 99.82%from the river to the RBF pumpingwell.
Figure 2: RBF site layoutin Karnataka (left) andGoa (right).
Table 1: Technical details of RBF wells. All depth measurements from ground surface elevation.
Figure 6: At the Goa RBF site, a 0.9 KW photovoltaic system powers the submersible pump during day time.
Parameters W1 W2 W3 W4 GW1 GW2*
Station name Kariyampalli Kariyampalli Kariyampalli Kariyampalli Navelim Navelim
Date installed Oct. 26, 2008 Oct. 26, 2008 Oct. 26, 2008 Oct. 26, 2008 Nov 24,2015 Feb 25,2015
Land ownership Private
Location description 5 km ESE from Dandeli 5 km S from Margao
Latitude 150 13' 56.8'' N 150 13' 56.9'' N 150 13' 57.3'' N 150 13' 57.8'' N 15°15‘02.52"N 15°15‘02.01“N
Longitude 740 39' 54.8'' E 740 39' 55.0'' E 740 39' 55.4'' E 740 39' 56.1'' E 73°58'28.88"E 73°58'28.96“E
Above MSL (m) 446 452 455 460 21 20
Distance from river
(m) 29 36 52 79 63 77
Depth of well at
time of drilling (m) 20 25 25 25 18.3 27.4
Depth to bedrock
(m) 13.3 13.0 12.5 14.0 5.2 5.5
Width of well bore
(in) 7.5 9
Length of casing (m) 12 12 11 12 5.5
5.5 (outer)
24.4 (inner)
Casing diameter 15.0 cm (6 inches) 20 cm (8 inches)
8 ( outer)
4 ( inner)
Slotted screening
length (m) No screen 7 7 7 1.8
1.8 (outer)
24.4 (inner)
Slotted screen
diameter (in) NA 6 6 6 8 4
Static water level
below MP (m) 4.29 4.42 3.79 3.84 0.68 0.68
Yield (m3/hr) 2.16 3.60 >9.3 6.85 1.87 3.66
Slug test hydraulic
conductivity (K;
cm/sec) 2.0*10-2 1.8*10-2 7.2*10-3 6.4*10-3 N/A N/A
Kali
RiverWell
1Well
2
Well
3Well
4
Open
well
Bore
well
0
500
1000
1500
2000
2500
Geo
metr
ic M
ean
(M
PN
/ 1
00
mL
)
RBF
Pumping Well
No not any more for
HH38%
Yes only for agriculture
54%
Other uses8%
Use River Water After RBF
In Riverbank Filtration a shallow well
is drilled near a surface water source
(river) and river water is forced to flow
through porous riverbed (alluvial)
sediments towards the RBF extraction
well. As raw surface water travels
towards the RBF well, pathogens and
suspended chemicals are removed or
significantly reduced via natural, self-
regenerating filtration processes.

RBF near River Kali
Implementation of RBF at Kali River (Dandeli, Karnataka)
Introduction
This project investigates a small Riverbank Filtration
(RBF) system in the tropical monsoon climate of rural
western India. As in much of India, the residents of the
small village of Kariyampalli do not have reliable access
to safe drinking water and face problems with
contaminated surface water and with the potential for
groundwater depletion. Riverbank Filtration addresses
both issues of polluted surface water supplies and the
overuse of groundwater, a worldwide problem with
recent data showing severe examples in northern India
(Rodell et al, 2009).
ObjectiveDissolved silica (Hooper and Shoemaker, 1986) and
stable isotope (Sklash and Farvolden, 1979) levels are
examined to determine the percentage of bacterial and
metal contaminant removal that can be attributed to
groundwater dilution versus other RBF processes.
AcknowledgmentsThank you to Anne Veeger and Vinka Craver for advice and guidance,
Prasanna Namannavar and Ataur Rehaman Khazi for field support, and
Heather Cook for laboratory assistance. Funding for this project was
provided by the World Bank Development Marketplace Program.
Bacteria Data
Discussion
The silica mixing model uses the Kali River and local
groundwater from the Bore Well as end members to calculate
average percentage of surface water and groundwater in the RBF
wells. This model shows an average of 27.5% river water in the
production well, RBF Well 3. Although other wells in the RBF
well field show a change in silica concentration with time, Well 3
shows a constant percentage of groundwater in samples taken
before and after 10 months of regular pumping. Isotopic data
suggest evaporation in the rice paddies near the research
site is affecting Wells 3 and 4. Metals and total coliform
data indicate that the Bore Well water has higher
contaminant concentrations than the river. The pumping
well concentrations are lower than both theoretical
source waters for all contaminants examined.
Pamela Cady1, Dr. Tom Boving1 Dr. B.S. Choudri2, Kavita Patil2, Veerabasawant Reddy2
1Department of Geosciences, University of Rhode Island, Kingston, RI 02881 USA
2The Energy and Resources Institute, Western Regional Centre, Alto-St. Cruz, Goa, India 403 202
Figure 5: Total Coliform bacteria show an average reduction of 93.517% (geometric
mean) with a maximum removal rate of 99.836 % from the river to the pumping well
(Well 3). Dilution levels calculated with dissolved silica data are shown as predicted
values (diamonds). Detection limits of IDEXX system are minimum: <1 MPN / 100
mL and maximum: >2,419.6 MPN / 100 mL.
Performance of Riverbank Filtration in India#404
Figure 6. E. coli bacteria show an average reduction of 98.730% (geometric mean) and
a maximum removal rate of 99.963% from the river to the production well (Well 3).
Dilution levels calculated with dissolved silica data are shown as predicted values
(diamonds).
River
The World Bank
The Energy and Resources Institute
Riverbank Filtration (RBF)In Riverbank Filtration a shallow well is drilled near
a surface water source to improve the water quality
by drawing river water through the aquifer material.
Figure 1: Riverbank Filtration (RBF) system diagram: cross-sectional view
shows path of infiltrating river water to the production well (Kim et al., 2003)
Field Site
Source: maps.google.com
The Riverbank Filtration
research site is located in
India’s Western Ghats
Materials and Methods•Stable isotopes: isotope-ratio mass spectrometer
•Dissolved silica: UV-vis spectrophotometer
•Metals: Inductively Coupled Plasma Mass
Spectrometer (ICPMS)
•Bacteria: IDEXX Most Probable Number
(MPN) enumeration technique
ReferencesHooper, R., and Shoemaker, C., 1986, A comparison of chemical and
isotopic hydrogaph separation: Water Resources Research, v. 22, no.
10, p. 11.
Rodell, M., Velicogna, I., and Famiglietti, J.S., 2009, Satellite-based
estimates of groundwater depletion in India: Nature 460, p. 999-1002.
Sklash, M., and Farvolden, R., 1979, The role of groundwater in storm
runoff: Journal of Hydrology, v. 43, p. 21.
Figure 4. RBF water has lower average metals levels than other local
drinking water options
0
50
100
150
200
250
300
350
Kali
River
Well
1
Well
2
Well
3
Well
4
Open
Well
Bore
Well
Geo
met
ric
Mea
n (
MP
N /
100 m
L)
Predicted Values
Observed Values
0
500
1000
1500
2000
2500
Kali
River
Well
1
Well
2
Well
3
Well
4
Open
Well
Bore
Well
Geo
met
ric
Mea
n (
MP
N /
10
0 m
L)
Observed Value
Predicted Value
0%
20%
40%
60%
80%
100%
0 10 20 30 40 50
Silica Concentration (mg/L)
% R
iver
Wat
er
Circled data points are
separated from uncircled
points by 10 months of
regular pumping
Isotope Data
Dissolved Silica Data
Metals Data
Figure 3. Silica concentration demonstrates percentage of Kali River water drawn
into RBF wells 1, 2 and 4 increases with time pumping.
Figure 2. Mixing line A shows Wells 1 and 2 falling between river water and
groundwater (Bore Well). Mixing line B shows evaporative effect of rice paddies
on Open Well and Wells 3 and 4.
Figure 4. RBF water has lower average metals levels than other local drinking
water options
0%
20%
40%
60%
80%
100%
0 10 20 30 40 50
Silica Concentration (mg/L)
% R
iver
Wat
er
Circled data points are
separated from uncircled
points by 10 months of
regular pumping
-6
-5
-4
-3
-2
-1
0
1
2
3
4
0 10 20 30 40 50
Dissolved Silica (mg/L)
del
ta 1
8-O
(0/0
0)
River Bore Well Open Well W 1 W 2 W 3 W 4
AB
Conclusions
● Isotopes: Wells 1 & 2 are similar to Kali River
Wells 3 & 4 are influenced by evaporation
● Silica: Wells 1 & 2 are similar to Kali River
Wells 3 & 4 are closer to local groundwater
Well 3 shows an average of 27.5% river water
● Metals: Copper: Well 3: 62.1–86.4% average removal
Lead: Well 3: 95.4–97.9% average removal
● Bacteria: Total Coliform: 93.5% average removal
E. coli: 98.7% average removal
● Percent groundwater in RBF water is unclear
● Groundwater dilution by itself does not explain metals
and pathogen removal
● RBF water is safer than other drinking water sources
in the area, while also reducing groundwater drawdown
Contact InformationPamela Cady
Department of Geosciences
College of the Environment and Life Sciences
University of Rhode Island
Kingston, RI 02881
phone: 401-440-4423
email: [email protected]
0
1
2
3
4
5
6
7
8
9
Bore
Well
Kali
River
Open
Well
Well
3
Con
centr
atio
n (
pp
b) Lead
Copper
Error bars show maximum range
• Surface water was too polluted to be used safely for irrigation, drinking.
• RBF was implemented along with stakeholder engagement, and pre
and post intervention impacts evaluated
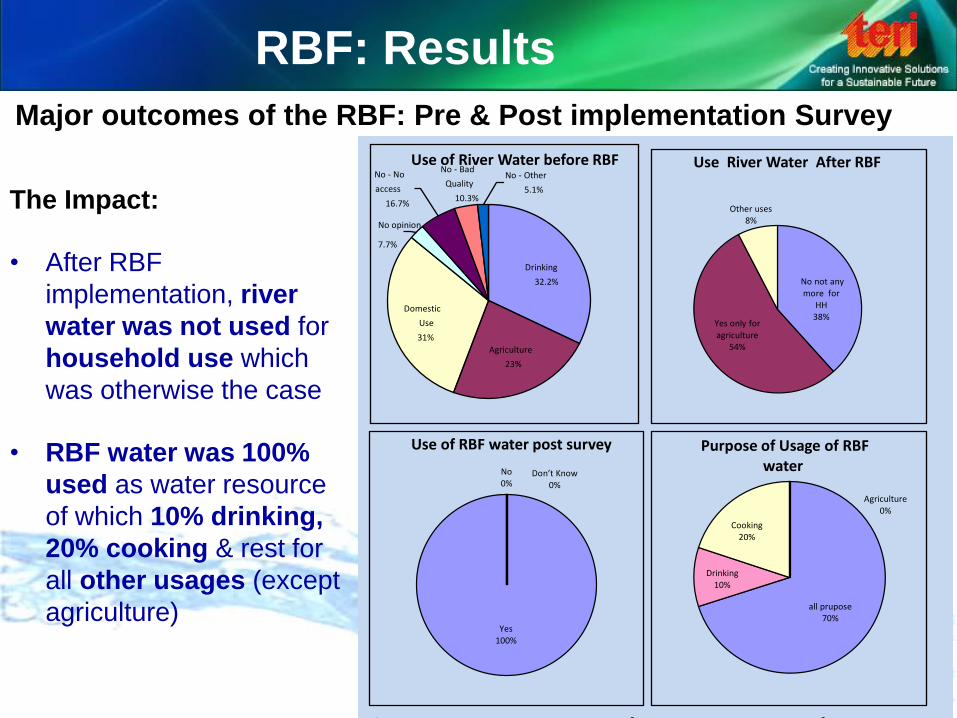
RBF: Results
Major outcomes of the RBF: Pre & Post implementation Survey
References:
Acknowledgement:
Introduction
Methods
Results
Conclusions
Illustrating the Potential of Riverbank Filtration Technology: Case Studies from Southern India
Kavita Patil1*, Thomas Boving2 and Fraddry D’souza1
1The Energy and Resources Institute, India . 2 University of Rhode Island, USA*Corresponding Author: [email protected]
ISWATS ConferenceApril 21-23 2016, Pune.
Two case studies - one in Uttar Kanada district of Karanataka and the other inSouth Goa district of Goa - demonstrate the potential of River Bank Filtration(RBF) for providing water. Like most parts of India, people in these districts donot have access to safe water for drinking or irrigation or face severe problemswith contaminated surface water resources. In such situations RBF canpotentially address these issues. For instances, RBF provided safe drinking waterfor residents of Kariyampalli village in Karnataka (Cady et al. 2013) and cleanirrigation water for rural farmers of Navelim, Goa (Boving et al. 2016).
In a RBF system, river water is forced to flow through porous riverbed (alluvial) sediments towards the RBF extraction well. As raw surface water travels towards the RBF well, pathogens and dissolved/suspended chemicals are removed or significantly reduced via natural, self-regenerating filtration processes.
Metals: Inductively Coupled Plasma Mass Spectrometer (ICPMS) Bacteria: IDEXX Most Probable Number (MPN) technique
Figure 1: Riverbank Filtration (RBF) system diagram: cross-sectional viewshows path of infiltrating river water to the production well.
0
1
2
3
4
5
6
7
8
9
Bore
Well
Kali
River
Open
Well
Well
3
Con
cent
rati
on (
ppb) Lead
Copper
Error bars show maximum range
Figure 4.2: RBF well 3 water has lower averagemetals levels than other local drinking wateroptions Copper showed reduction of up to 98.3%and Lead was removed up to 99.2%
References:
Cady, P., Boving, T.B., Choudri, B.S., Davis, A., Patil, K., Reddy, V., 2013. Attenuation of Bacteria at a Riverbank Filtration Site in Rural India. Water Environment Research; Vol. 85, Number 11, November 2013, pp. 2164-2174.
Boving, T.B., Patil, K., 2016. Riverbank Filtration Technology at the Nexus of Water-Energy-Food. In: Water-Energy-Food Nexus: Theories and Practices (Salam et al. Eds.). Accepted .
Acknowledgement: Funding is provided by World Bank Development Marketplace Program for site at Uttarkanada & Ramboll- Environ Foundation, USA for Goa region.
Figure 5: Fecal coli form bacteria concentration along the Sal River in Goa . Data reported by the Goa State Pollution Control Board.
0
5000
10000
15000
20000
25000
30000
35000
40000
Apr-14 May-14 Jun-14 Jul-14 Aug-14 Sep-14 Oct-14 Nov-14 Dec-14 Jan-15 Feb-15 Mar-15
Fecal Coliform BacteriaSal River, Goa 2014-15
PAZORCONI, CUNCOLIM
RIVER SAL AT MOBOR
RIVER SAL AT ORLIM BRIDGE
RIVER SAL AT KHAREBAND, MARGAO
RBF improves water quality. Removal of Copper: 62.1–86.4%. Lead: 95.4–97.9%.Bacteria: Total Coliform: 93.5% and E. coli: 98.7% average removal.
RBF water is safer than other drinking water sources in the area, while also reducing groundwater drawdown.
High value crops promise greatest return on investment into RBF in combination with drip irrigation.
Solar energy can power the RBF system, permitting water production in non-electrified, remote areas.
all prupose70%
Drinking10%
Cooking20%
Agriculture0%
Purpose of Usage of RBF water
Yes100%
No0%
Don’t Know0%
Use of RBF water post survey
Use of River Water before RBF
No opinion
7.7%
Domestic
Use
31%
Agriculture
23%
Drinking
32.2%
No - Other
5.1%
No - Bad
Quality
10.3%
No - No
access
16.7%
Figure 3: Survey data pre- and post- RBF installations at Kali river site
Figure 4.1: Total Coliform bacteriashowed an average reduction of93.52% (geometric mean) with amaximum removal rate of 99.82%from the river to the RBF pumpingwell.
Figure 2: RBF site layoutin Karnataka (left) andGoa (right).
Table 1: Technical details of RBF wells. All depth measurements from ground surface elevation.
Figure 6: At the Goa RBF site, a 0.9 KW photovoltaic system powers the submersible pump during day time.
Parameters W1 W2 W3 W4 GW1 GW2*
Station name Kariyampalli Kariyampalli Kariyampalli Kariyampalli Navelim Navelim
Date installed Oct. 26, 2008 Oct. 26, 2008 Oct. 26, 2008 Oct. 26, 2008 Nov 24,2015 Feb 25,2015
Land ownership Private
Location description 5 km ESE from Dandeli 5 km S from Margao
Latitude 150 13' 56.8'' N 150 13' 56.9'' N 150 13' 57.3'' N 150 13' 57.8'' N 15°15‘02.52"N 15°15‘02.01“N
Longitude 740 39' 54.8'' E 740 39' 55.0'' E 740 39' 55.4'' E 740 39' 56.1'' E 73°58'28.88"E 73°58'28.96“E
Above MSL (m) 446 452 455 460 21 20
Distance from river
(m) 29 36 52 79 63 77
Depth of well at
time of drilling (m) 20 25 25 25 18.3 27.4
Depth to bedrock
(m) 13.3 13.0 12.5 14.0 5.2 5.5
Width of well bore
(in) 7.5 9
Length of casing (m) 12 12 11 12 5.5
5.5 (outer)
24.4 (inner)
Casing diameter 15.0 cm (6 inches) 20 cm (8 inches)
8 ( outer)
4 ( inner)
Slotted screening
length (m) No screen 7 7 7 1.8
1.8 (outer)
24.4 (inner)
Slotted screen
diameter (in) NA 6 6 6 8 4
Static water level
below MP (m) 4.29 4.42 3.79 3.84 0.68 0.68
Yield (m3/hr) 2.16 3.60 >9.3 6.85 1.87 3.66
Slug test hydraulic
conductivity (K;
cm/sec) 2.0*10-2 1.8*10-2 7.2*10-3 6.4*10-3 N/A N/A
Kali
RiverWell
1Well
2
Well
3Well
4
Open
well
Bore
well
0
500
1000
1500
2000
2500
Geo
met
ric
Mea
n (
MP
N /
10
0 m
L)
RBF
Pumping Well
No not any more for
HH38%
Yes only for agriculture
54%
Other uses8%
Use River Water After RBF
The Impact:
• After RBF
implementation, river
water was not used for
household use which
was otherwise the case
• RBF water was 100%
used as water resource
of which 10% drinking,
20% cooking & rest for
all other usages (except
agriculture)

RBF: Results
Major outcomes of the RBF: Pre & Post implementation Survey
The Impact:
• Total Coliform bacteria showed an
average reduction of 93.52%
(geometric mean) with a maximum
removal rate of 99.82% from the
river to the RBF pumping well.
• RBF well 3 water has lower
average metals levels than other
local drinking water options. Copper
showed reduction of up to 98.3%
and Lead was removed up to 99.2%
References:
Acknowledgement:
Introduction
Methods
Results
Conclusions
Illustrating the Potential of Riverbank Filtration Technology: Case Studies from Southern India
Kavita Patil1*, Thomas Boving2 and Fraddry D’souza1
1The Energy and Resources Institute, India . 2 University of Rhode Island, USA*Corresponding Author: [email protected]
ISWATS ConferenceApril 21-23 2016, Pune.
Two case studies - one in Uttar Kanada district of Karanataka and the other inSouth Goa district of Goa - demonstrate the potential of River Bank Filtration(RBF) for providing water. Like most parts of India, people in these districts donot have access to safe water for drinking or irrigation or face severe problemswith contaminated surface water resources. In such situations RBF canpotentially address these issues. For instances, RBF provided safe drinking waterfor residents of Kariyampalli village in Karnataka (Cady et al. 2013) and cleanirrigation water for rural farmers of Navelim, Goa (Boving et al. 2016).
In a RBF system, river water is forced to flow through porous riverbed (alluvial) sediments towards the RBF extraction well. As raw surface water travels towards the RBF well, pathogens and dissolved/suspended chemicals are removed or significantly reduced via natural, self-regenerating filtration processes.
Metals: Inductively Coupled Plasma Mass Spectrometer (ICPMS) Bacteria: IDEXX Most Probable Number (MPN) technique
Figure 1: Riverbank Filtration (RBF) system diagram: cross-sectional viewshows path of infiltrating river water to the production well.
0
1
2
3
4
5
6
7
8
9
Bore
Well
Kali
River
Open
Well
Well
3
Con
cent
ratio
n (p
pb) Lead
Copper
Error bars show maximum range
Figure 4.2: RBF well 3 water has lower averagemetals levels than other local drinking wateroptions Copper showed reduction of up to 98.3%and Lead was removed up to 99.2%
References:
Cady, P., Boving, T.B., Choudri, B.S., Davis, A., Patil, K., Reddy, V., 2013. Attenuation of Bacteria at a Riverbank Filtration Site in Rural India. Water Environment Research; Vol. 85, Number 11, November 2013, pp. 2164-2174.
Boving, T.B., Patil, K., 2016. Riverbank Filtration Technology at the Nexus of Water-Energy-Food. In: Water-Energy-Food Nexus: Theories and Practices (Salam et al. Eds.). Accepted .
Acknowledgement: Funding is provided by World Bank Development Marketplace Program for site at Uttarkanada & Ramboll- Environ Foundation, USA for Goa region.
Figure 5: Fecal coli form bacteria concentration along the Sal River in Goa . Data reported by the Goa State Pollution Control Board.
0
5000
10000
15000
20000
25000
30000
35000
40000
Apr-14 May-14 Jun-14 Jul-14 Aug-14 Sep-14 Oct-14 Nov-14 Dec-14 Jan-15 Feb-15 Mar-15
Fecal Coliform BacteriaSal River, Goa 2014-15
PAZORCONI, CUNCOLIM
RIVER SAL AT MOBOR
RIVER SAL AT ORLIM BRIDGE
RIVER SAL AT KHAREBAND, MARGAO
RBF improves water quality. Removal of Copper: 62.1–86.4%. Lead: 95.4–97.9%.Bacteria: Total Coliform: 93.5% and E. coli: 98.7% average removal.
RBF water is safer than other drinking water sources in the area, while also reducing groundwater drawdown.
High value crops promise greatest return on investment into RBF in combination with drip irrigation.
Solar energy can power the RBF system, permitting water production in non-electrified, remote areas.
all prupose70%
Drinking10%
Cooking20%
Agriculture0%
Purpose of Usage of RBF water
Yes100%
No0%
Don’t Know0%
Use of RBF water post survey
Use of River Water before RBF
No opinion
7.7%
Domestic
Use
31%
Agriculture
23%
Drinking
32.2%
No - Other
5.1%
No - Bad
Quality
10.3%
No - No
access
16.7%
Figure 3: Survey data pre- and post- RBF installations at Kali river site
Figure 4.1: Total Coliform bacteriashowed an average reduction of93.52% (geometric mean) with amaximum removal rate of 99.82%from the river to the RBF pumpingwell.
Figure 2: RBF site layoutin Karnataka (left) andGoa (right).
Table 1: Technical details of RBF wells. All depth measurements from ground surface elevation.
Figure 6: At the Goa RBF site, a 0.9 KW photovoltaic system powers the submersible pump during day time.
Parameters W1 W2 W3 W4 GW1 GW2*
Station name Kariyampalli Kariyampalli Kariyampalli Kariyampalli Navelim Navelim
Date installed Oct. 26, 2008 Oct. 26, 2008 Oct. 26, 2008 Oct. 26, 2008 Nov 24,2015 Feb 25,2015
Land ownership Private
Location description 5 km ESE from Dandeli 5 km S from Margao
Latitude 150 13' 56.8'' N 150 13' 56.9'' N 150 13' 57.3'' N 150 13' 57.8'' N 15°15‘02.52"N 15°15‘02.01“N
Longitude 740 39' 54.8'' E 740 39' 55.0'' E 740 39' 55.4'' E 740 39' 56.1'' E 73°58'28.88"E 73°58'28.96“E
Above MSL (m) 446 452 455 460 21 20
Distance from river
(m) 29 36 52 79 63 77
Depth of well at
time of drilling (m) 20 25 25 25 18.3 27.4
Depth to bedrock
(m) 13.3 13.0 12.5 14.0 5.2 5.5
Width of well bore
(in) 7.5 9
Length of casing (m) 12 12 11 12 5.5
5.5 (outer)
24.4 (inner)
Casing diameter 15.0 cm (6 inches) 20 cm (8 inches)
8 ( outer)
4 ( inner)
Slotted screening
length (m) No screen 7 7 7 1.8
1.8 (outer)
24.4 (inner)
Slotted screen
diameter (in) NA 6 6 6 8 4
Static water level
below MP (m) 4.29 4.42 3.79 3.84 0.68 0.68
Yield (m3/hr) 2.16 3.60 >9.3 6.85 1.87 3.66
Slug test hydraulic
conductivity (K;
cm/sec) 2.0*10-2 1.8*10-2 7.2*10-3 6.4*10-3 N/A N/A
Kali
RiverWell
1Well
2
Well
3Well
4
Open
well
Bore
well
0
500
1000
1500
2000
2500
Geo
met
ric
Mea
n (M
PN
/ 10
0 m
L)
RBF
Pumping Well
No not any more for
HH38%
Yes only for agriculture
54%
Other uses8%
Use River Water After RBF
References:
Acknowledgement:
Introduction
Methods
Results
Conclusions
Illustrating the Potential of Riverbank Filtration Technology: Case Studies from Southern India
Kavita Patil1*, Thomas Boving2 and Fraddry D’souza1
1The Energy and Resources Institute, India . 2 University of Rhode Island, USA*Corresponding Author: [email protected]
ISWATS ConferenceApril 21-23 2016, Pune.
Two case studies - one in Uttar Kanada district of Karanataka and the other inSouth Goa district of Goa - demonstrate the potential of River Bank Filtration(RBF) for providing water. Like most parts of India, people in these districts donot have access to safe water for drinking or irrigation or face severe problemswith contaminated surface water resources. In such situations RBF canpotentially address these issues. For instances, RBF provided safe drinking waterfor residents of Kariyampalli village in Karnataka (Cady et al. 2013) and cleanirrigation water for rural farmers of Navelim, Goa (Boving et al. 2016).
In a RBF system, river water is forced to flow through porous riverbed (alluvial) sediments towards the RBF extraction well. As raw surface water travels towards the RBF well, pathogens and dissolved/suspended chemicals are removed or significantly reduced via natural, self-regenerating filtration processes.
Metals: Inductively Coupled Plasma Mass Spectrometer (ICPMS) Bacteria: IDEXX Most Probable Number (MPN) technique
Figure 1: Riverbank Filtration (RBF) system diagram: cross-sectional viewshows path of infiltrating river water to the production well.
0
1
2
3
4
5
6
7
8
9
Bore
Well
Kali
River
Open
Well
Well
3
Con
cen
trat
ion
(p
pb) Lead
Copper
Error bars show maximum range
Figure 4.2: RBF well 3 water has lower averagemetals levels than other local drinking wateroptions Copper showed reduction of up to 98.3%and Lead was removed up to 99.2%
References:
Cady, P., Boving, T.B., Choudri, B.S., Davis, A., Patil, K., Reddy, V., 2013. Attenuation of Bacteria at a Riverbank Filtration Site in Rural India. Water Environment Research; Vol. 85, Number 11, November 2013, pp. 2164-2174.
Boving, T.B., Patil, K., 2016. Riverbank Filtration Technology at the Nexus of Water-Energy-Food. In: Water-Energy-Food Nexus: Theories and Practices (Salam et al. Eds.). Accepted .
Acknowledgement: Funding is provided by World Bank Development Marketplace Program for site at Uttarkanada & Ramboll- Environ Foundation, USA for Goa region.
Figure 5: Fecal coli form bacteria concentration along the Sal River in Goa . Data reported by the Goa State Pollution Control Board.
0
5000
10000
15000
20000
25000
30000
35000
40000
Apr-14 May-14 Jun-14 Jul-14 Aug-14 Sep-14 Oct-14 Nov-14 Dec-14 Jan-15 Feb-15 Mar-15
Fecal Coliform BacteriaSal River, Goa 2014-15
PAZORCONI, CUNCOLIM
RIVER SAL AT MOBOR
RIVER SAL AT ORLIM BRIDGE
RIVER SAL AT KHAREBAND, MARGAO
RBF improves water quality. Removal of Copper: 62.1–86.4%. Lead: 95.4–97.9%.Bacteria: Total Coliform: 93.5% and E. coli: 98.7% average removal.
RBF water is safer than other drinking water sources in the area, while also reducing groundwater drawdown.
High value crops promise greatest return on investment into RBF in combination with drip irrigation.
Solar energy can power the RBF system, permitting water production in non-electrified, remote areas.
all prupose70%
Drinking10%
Cooking20%
Agriculture0%
Purpose of Usage of RBF water
Yes100%
No0%
Don’t Know0%
Use of RBF water post survey
Use of River Water before RBF
No opinion
7.7%
Domestic
Use
31%
Agriculture
23%
Drinking
32.2%
No - Other
5.1%
No - Bad
Quality
10.3%
No - No
access
16.7%
Figure 3: Survey data pre- and post- RBF installations at Kali river site
Figure 4.1: Total Coliform bacteriashowed an average reduction of93.52% (geometric mean) with amaximum removal rate of 99.82%from the river to the RBF pumpingwell.
Figure 2: RBF site layoutin Karnataka (left) andGoa (right).
Table 1: Technical details of RBF wells. All depth measurements from ground surface elevation.
Figure 6: At the Goa RBF site, a 0.9 KW photovoltaic system powers the submersible pump during day time.
Parameters W1 W2 W3 W4 GW1 GW2*
Station name Kariyampalli Kariyampalli Kariyampalli Kariyampalli Navelim Navelim
Date installed Oct. 26, 2008 Oct. 26, 2008 Oct. 26, 2008 Oct. 26, 2008 Nov 24,2015 Feb 25,2015
Land ownership Private
Location description 5 km ESE from Dandeli 5 km S from Margao
Latitude 150 13' 56.8'' N 150 13' 56.9'' N 150 13' 57.3'' N 150 13' 57.8'' N 15°15‘02.52"N 15°15‘02.01“N
Longitude 740 39' 54.8'' E 740 39' 55.0'' E 740 39' 55.4'' E 740 39' 56.1'' E 73°58'28.88"E 73°58'28.96“E
Above MSL (m) 446 452 455 460 21 20
Distance from river
(m) 29 36 52 79 63 77
Depth of well at
time of drilling (m) 20 25 25 25 18.3 27.4
Depth to bedrock
(m) 13.3 13.0 12.5 14.0 5.2 5.5
Width of well bore
(in) 7.5 9
Length of casing (m) 12 12 11 12 5.5
5.5 (outer)
24.4 (inner)
Casing diameter 15.0 cm (6 inches) 20 cm (8 inches)
8 ( outer)
4 ( inner)
Slotted screening
length (m) No screen 7 7 7 1.8
1.8 (outer)
24.4 (inner)
Slotted screen
diameter (in) NA 6 6 6 8 4
Static water level
below MP (m) 4.29 4.42 3.79 3.84 0.68 0.68
Yield (m3/hr) 2.16 3.60 >9.3 6.85 1.87 3.66
Slug test hydraulic
conductivity (K;
cm/sec) 2.0*10-2 1.8*10-2 7.2*10-3 6.4*10-3 N/A N/A
Kali
RiverWell
1Well
2
Well
3Well
4
Open
well
Bore
well
0
500
1000
1500
2000
2500
Geo
metr
ic M
ean
(M
PN
/ 1
00
mL
)
RBF
Pumping Well
No not any more for
HH38%
Yes only for agriculture
54%
Other uses8%
Use River Water After RBF

Potential of RBF
Conclusions
• RBF improves water quality. Removal of Copper: 62.1–
86.4%. Lead: 95.4–97.9%.Bacteria: Total Coliform: 93.5%
and E. coli: 98.7% average removal.
• RBF water is safer than other drinking water sources in
the area, while also reducing groundwater drawdown.
• High value crops promise greatest return on investment into
RBF in combination with drip irrigation.
• Solar energy can power the RBF system, permitting water
production in non-electrified, remote areas.

Way Forward &
Key Messages

For many countries specially the South Asian nations, Water
Demand Management (WDM) interventions like reducing
leakages/losses/NRW/UFW, etc., needs to be prioritized over
supply side interventions.
While the full infrastructure develops in due course, the access
to drinking water for rural & peri-urban population can be
supplemented through innovative decentralized water supply
systems such as community-run water kiosks.
Local community engagement, sensitization and capacity
building has to be integrated in rural & peri-urban water supply
systems.
Careful blending of innovative technologies along with local
community/stakeholder engagement can supplement (e.g.
RBF) and enhance the sustainability of water supply
interventions
Key Messages

Government policies and investment plans need to prioritize
and incentivize the water demand management.
Water must be valued through appropriate and rational pricing
that can make a cost beneficial sense of water efficient
interventions and become a driver for use of innovative
systems & technologies in water sector.
Appropriate incentives/disincentives & market mechanisms
(micro-credits, subsidies, low interest loans etc.) need to be
created to facilitate uptake & wide-scale use of efficient &
innovative technologies amongst the majority of the
populations.
Key Messages

Thank You
Contact Details:
Anshuman
Associate Director
Water Resources Division
The Energy and Resources Institute (TERI)
India Habitat Center, Lodhi Road, New Delhi-03.
Email: [email protected]
Ph: +9111 24682100 (Ext: 2207)
Mobile: (+91) 9899809115