an impact vibration absorber a thesis
TRANSCRIPT

EXPERIMENTAL STUDY ON
AN IMPACT VIBRATION ABSORBER
by
iHSAN CEM DE$EN, B.S.M.E.
A THESIS
IN
MECHANICAL ENGINEERING
Submitted to the Graduate Faculty of Texas Tech University in
Partial Fulfillment of the Requirements for
the Degree of
MASTER OF SCIENCE
MECHANICAL ENGINEERING
Approved
Aqcepted
D e ^ of the Graduate School
May, 2000

ACKNOWLEDGEMENTS
I am grateful for the consistent guidance and support of my advisor, Dr. Stephen
Ekwaro-Osire, who made this experience enjoyable as well as challenging. Without him,
this work would never have been possible. I also want to thank him for helping me
improve myself professionally. Special thanks are due to my committee members. Dr.
Atila Ertas, to whom I am also indebted for realizing my ideals, and to Dr. Timothy T.
Maxwell.
I also would like to thank all the staff and faculty of the Department of
Mechanical Engineering at Texas Tech University for their help and support, I enjoyed
working for my classes, as well as working for my professors as their teaching assistant,
including the teaching assignment, which I took extreme pleasure from doing, I am also
grateful for the support of my friends and colleagues at the department, especially those
of the Dynamical Systems and Vibrations Lab.
Very special thanks are due to my professors at Bogazici University of Istanbul,
Turkey. Without the support of Dr. Gunay Anlas and Dr. Ozer Arnas, I would not have
been able to realize my dreams. In addition, the help of Dr. Eren Semercigil of
Mechanical Engineering-Victoria University of Technology, Australia is greatly
appreciated. His expertise on impact vibration absorbers has helped me throughout my
research, and I am grateful for his never-ending support.
However, above all, I want to thank my mother and father, Puran and Erdogan
Desen, for helping me be the man that I am today, and for their support and
understanding through all my life. Finally, my gratitude is extended to my love, Guldal,
for her encouragement, understanding, and support.
11

TABLE OF CONTENTS
ACKNOWLEDGEMENTS ii
ABSTRACT v
LIST OF FIGURES vi
LIST OF SYMBOLS viii
1 INTRODUCTION 1
1.1 Introduction 1
1.2 Vibration Control 3
1.2.1 Introduction 3
1.2.2 Passive Vibration Control 4
1.2.2.1 Introduction 4
1.2.2.2 Passive Vibration Control by Structural Design 4
1.2.2.3 Passive Vibration Control by Localized Additions 5
1.2.2.4 Passive Vibration Control by Added Damping 6
1.2.2.5 Passive Vibration Control by Resilient Isolation 7
1.3 Impact Vibration Absorbers 7
1.3.1 Introduction 7
1.3.2 Single-Unit Impact Vibration Absorbers 8
1.3.3 Multi-Unit Impact Vibration Absorbers 10
1.3.4 Hybrid Impact Vibration Absorbers 11
1.3.5 Compound Impact Vibration Absorbers 12
1.4 Objectives 13
1.5 Scope of Work 13
2 EXPERIMENTS 40
2.1 Introduction 40
2.2 Model 40
2.3 Setup 42
2.4 Controlling the Shaker 44
2.4.1 Feedback Control 44
iii

2.4.2 Coherence 44
2.4.3 Controllability 45
2.5 Experimental Procedure 46
2.5.1 Introduction 46
2.5.2 Transient Vibration 47
2.5.3 Forced Vibration 47
2.5.3.1 Introduction 47
2.5.3.2 Sweep 47
2.5.3.3 Dwell 47
3 RESULTS AND DISCUSSION 54
3.1 Introduction 54
3.2 Transient Vibration 54
3.2.1 Linear vs. Exponential Decay 54
3.2.2 Parametric Studies 55
3.3 Forced Vibration 56
3.3.1 Time Series Data 56
3.3.2 Motion Plot 56
3.3.3 Frequency Response Plots and Parametric Studies 57
3.3.4 Coherence Measurements 59
3.3.5 Phase Portrait 59
4 CONCLUSIONS AND RECOMMENDATIONS 81
4.1 Conclusions 81
4.2 Recommendations 81
REFERENCES 82
APPENDIX
A TABLE OF EXPERIMENTS 88
IV

ABSTRACT
An Impact Vibration Absorber (IVA), which is also referred to as an impact
damper, consists of a free mass moving between the motion limiting stops of a primary
system. When the amplitude of vibration of the primary system exceeds the gap between
the stops, the absorber mass collides with the stop. Under sufficient excitation, the IVA
undergoes cyclic motion, colliding intermittently with the stops. By this mechanism, the
IVA reduces the vibration of the primary system through momentum transfer by collision
and dissipation of kinetic energy as acoustic and heat energy.
The aim of the current study is to investigate the effects of mass ratio, clearance
between stops, and excitation amplitude on IVA effectiveness and system dynamics.
Vibration absorption is studied for both free and forced vibrations. Constant frequency
and frequency sweep experiments are conducted to study system dynamics. Coherence
between the forcing function and primary mass response is studied, as a first step in
proposing a new method for determining the efficiency of vibration absorbers.
Extensive parametric studies were performed on the IVA. Free vibration studies
revealed the effect of system parameters on rate of decay of vibrations. For forced
vibrations, it was shown that an optimum clearance exists for which the energy
absorption is greatest. The efficiency of the absorber is highest around the natural
frequency of the primary structure, and diminishes as excitation frequency moves away
from the natural frequency. The characteristic jump phenomenon was observed for the
case without the IVA, at different locations for upsweep and downs weep. In the absence
of the IVA, the high response amplitude at resonance caused the coherence to drop. The
introduction of the IVA was shown to attenuate the vibrations in such a maimer that the
response amplitude of the primary mass is consistently low for the whole range of the
swept frequency. This results in a coherence function that is close to unity for the range
of the swept frequency. Therefore, coherence between the forcing function and response
of a system may be used as a measure the absorber effectiveness.

LIST OF FIGURES
.1: Classificationof Deterministic Vibration 14
.2: Vibration Control Methods 15
.3: 2-DOF Model of Main Structure and Tuned Mass Damper 16
.4: Centrifugal Pendulum Absorber 17
.5: A Pendulum Absorber-Colimm with a tip appendage 18
.6: Three-mass Pendulum Absorber 19
.7: A Beam-Mass Absorber 20
.8: Beam-Pendulum Absorber 21
.9: Liquid Dampers 22
.10: Impact Damper for Damping Turbine Blade Vibration 23
.11: Vibration Isolator 24
.12: Types of Impact Vibration Absorbers 25
.13: Theoretical model of IVA system 26
.14: IVA operating in the (a) horizontal and (b) vertical direction 27
.15: IVA installed in motorized hang glider 28
.16: Hanging Chain Damper 29
.17: Multi-unit IVA 30
.18: Multi-unit IVA for reducing highway light pole vibration 31
.19: Beanbag damper 32
.20: Multi-unit IVA with single cavity 33
.21: Combined IVA-TMA system 34
.22: Hybrid friction-impact damper 35
.23: IVA with spring-supported mass 36
.24: IVA connected to the primary mass with leaf spring 37
.25: IVA for controlling wind-induced excitation 38
.26: Hydrodynamic sloshing impactor 39
2.1: Experiments done and parameters studied 49
2.2: Model 50
vi

2.3: IVA assembly 51
2.4: Experiment layout 52
2.5: Experiment setup 53
3.1: Transient vibration without IVA-time series 61
3.2: PSD of time series 61
3.3: Decay of transient vibration with and without the IVA 62
3.4: Exponential and linear decay 63
3.5: Effect of mass ratio on rate of decay 64
3,6: Effect of clearance on rate of decay 65
3,7: Effect of initial displacement on rate of decay 66
3,8: Time series data for A=0,254 mm, d=2,l 12 mm, |LI=0.193, f=9 Hz 67
3,9: Motion Plot for A=0.254 mm, d=2,l 12 mm, fi=0.193, f=9 Hz 68
3.10: Effect of mass ratio on amplitude 69
3.11: Effect of mass ratio on amplitude ratio 70
3.12: Effect of clearance on amplitude ratio 71
3.13: Typical shaker displacements for experiments 72
3.14: Effect of excitation amplitude on amplitude ratio 73
3.15: Upsweep without IVA for two amplitudes 74
3.16: Downsweep without IVA for two amplitudes 75
3.17: Effect of mass ratio on upsweep response 76
3.18: Effect of mass ratio on downsweep response 77
3.19: Frequency response of sweep and dwell data 78
3.20: Coherence and absorption 79
3.21: Phase portrait for efficient and inefficient operation 80
Vll

LIST OF SYMBOLS
/ Frequency of vibration, excitation frequency (Hz).
fn Natural frequency (Hz).
w Frequency of vibration, excitation frequency (Rad/s).
w„ Natural frequency (Rad/s).
r Frequency ra t io , /% or w/w„.
/ Time (s).
A Zero-to-peak amplitude of excitation (m).
e Coefficient or restitution,
X Deflection of primary mass from equilibrium position (m),
z Deflection of IVA from equilibrium position (m).
z Velocity of impact vibration absorber (m/s).
k Stiffness ( N W ) ,
mi Mass of primary mass (kg).
mi Mass of impact vibration absorber (kg).
\i Mass ratio, mj/mi.
c Damping ratio (N-sec/m).
/ Length of pendulum (m).
d Clearance between walls (m).
Q Angle of rotation of pendulum (degrees),
Gxx(f) Auto (Power) Spectral density function of input.
Gyyff) Auto (Power) Spectral density function of output,
GxyCf) Cross-Spectral density function,
Y xy60 Coherence function.
Vlll

CHAPTER 1
INTRODUCTION
1.1 Introduction
Vibration is the study of the repetitive motion of objects. Vibration is caused by
anything that oscillates and it is transmitted through continuous media. Therefore,
vibrations caused by a system effect other systems, unless the systems are separated by
vacuum, as in space. It is observed in nature as well as in man-made devices and
structures. When talking about vibration, one usually refers to the displacement, velocity
and acceleration of a point on the vibrating structure. These quantities are functions of
time, and are referred to as signals. Throughout the text, vibration signals will be referred
to simply as vibration. Vibration, or vibration signals, can be divided into two main
categories with respect to the characteristics of signals, namely, deterministic and non-
deterministic. Deterministic vibration, which can be categorized further as in Figure 1.1,
can be periodic or non-periodic. Furthermore, on one hand periodic vibration is classified
as sinusoidal or complex periodic, on the other hand non-periodic vibration is classified
as almost periodic or transient (Bendat and Piersol, 1986). Sinusoidal vibration has the
form of a sine signal, while complex periodic vibration may have the form of a
combination of sine signals of different frequency and amplitude, or it may be any other
signal that is periodic. Vibration caused by the rotation of unbalanced machinery such as
turbines, wheels and shafts is an example to sinusoidal vibration. The vibration of an
engine, however, is complex periodic since the components of the engine move
periodically with different periods. Vibration that is present in the nature, e.g., vibration
caused by earthquakes, often shows non-deterministic characteristics, hence the term
random vibration. For repeated observations under basically identical conditions, random
vibrations do not depict the same time histories. Therefore, statistical and probabilistic
tools, e.g., mean and correlation, are used to study these vibrations. Transient vibration is
another case of non-periodic vibration. In this case, an initial displacement, velocity or
acceleration, or a sudden change in one of these quantities caused by an external element,
causes the structure to experience vibrations that decay with time. Transient vibration is
1

also referred to as free vibration, since the primary structure is not forced to move
continuously, but instead, it vibrates freely due to initial conditions that are imposed on
the structure.
Vibration is used in different fields for numerous applications. Vibrating mixers
and sieves are used in production systems for use in automated production, e.g,,
automatic feeders. Vibrating sieves and tools are used in construction, e.g., pneumatic
drills. In medicine, vibrating machines are used by doctors to cure diseases, e,g,, sound
waves are used to break kidney stones, as in the lithotripter, which is used for
Extracorporeal Shock Wave Lithotripsy (ESWL) treatments.
Although there are some applications that benefit form vibrations, in general,
vibration is not desired in mechanical systems and engineering structures. The cyclic
characteristic of vibration introduces dynamic stresses in members, which cause fatigue
and can eventually lead to failure. Vibrations caused by earthquakes may cause structures
to fail unless they are designed properly. Vibration of the passenger compartments of
vehicles cause discomfort to the passengers.
The concept of resonance is very important and has a high priority in the study of
forced vibrations. The term forced vibration is used for cases where the structure is
excited continuously by an external source, e.g., a sinusoidal force. The forcing
frequency is the frequency of this forcing function, e.g., the frequency of the sine wave.
For a vibratory system, resonance occurs when the forcing frequency is equal to the
natural frequency, also referred to as the resonant frequency, of the structure. Under
resonance, displacement of a nodal point reaches its highest value. Since displacements
are maximum at resonance, resonance imposes the highest strains and stresses on the
structural members, and therefore causes the most damage. The idea in using a vibration
absorber in a system is mainly to reduce the destructive vibrations that the primary
system experiences when it is excited at or around its natural frequency, i.e., when it
experiences resonance, A vibration absorber can be described as an auxiliary system
connected to the primary system of concern, which attenuates the vibrations of the
primary system by absorbing and/or dissipating its kinetic energy. Vibration absorbers
have found extensive use in engineering systems for about a hundred years. The first

hydraulic vibration absorber was actually used in 1909 to reduce the rolling motion of
ships (Frahm, 1909), As the technology advances, applications require more efficient,
smaller and lighter vibration absorbers,
1.2 Vibration Control
1.2.1 Introduction
There are different methods to control vibration. If the system is not designed for
vibration, problems may be faced once vibration is observed during operation. In this
case, a vibration control strategy needs to be employed to reduce the levels of vibration
and enable reliable and comfortable operation. Vibration control can be divided into three
main categories, namely, passive, active, and hybrid vibration control (Figure 1,2),
Passive vibration control systems function without external assistance, e,g., they do not
require a power source, simply because they are driven by the vibration itself In most
cases, they offer the fastest, simplest and cheapest solution to the problem. They require
little or no maintenance, and installation is relatively simple. The tuned mass damper,
which consists of a mass-spring-damper system, is a common example for vibration
absorbers that operate on this principle. However, passive control may not be sufficient in
some applications, and active vibration control systems may be required. Contrary to
passive systems, active vibration control systems depend on a power source. They require
power for operating the sensors that sense the level of vibration, the control systems that
process the sensor signals and send driving signals, and the driving devices that apply
forces to reduce the level of vibration. Active vibration control systems are mostly more
complex and expensive than passive systems, require maintenance, and there is a higher
possibility of failure, but they may show better performance or be the only solution in
some cases. Active vibration control systems used in buildings that protect them from the
destructive effects of earthquakes is a good example for this category. Hybrid control
systems utilize both passive and active components.

1.2,2 Passive Vibration Control
1.2.2.1 Introduction
Passive vibration control methods (Figure 1.2), which are usually simpler
compared to active methods, involves modifying the existing design, or adding extra
components to the system. These modifications may be changing the structural design,
making localized additions to the system, adding damping to the system, using resilient
isolation, or a combination of these methods. Changing the structural design may be done
by changing the dimensions, shapes or materials of some elements in order to change
stiffness, damping and mass of the structure. Making additions involves adding localized
or continuous components, e.g., vibration absorbers, or adding damping to the main
system. Using vibration isolators between components is an example of the resilient
isolation technique. Depending on the design considerations, space, weight and cost
constraints, a decision can be made on the passive vibration control method to be used.
1.2.2.2 Passive Vibration Control by Structural Design
It is best to take vibration considerations into account while designing a structure.
This will mostly include designing the structure so that the natural frequencies of the
system are far from the frequencies of operation, and the levels of vibration are
acceptable. The most general methods used for controlling vibrations by structural design
are detuning, reducing the number of responding modes, nodalizing, decoupling,
optimizing the structural geometry, structural stiffening and selecting the best material.
Detuning implies modifying the structure in such a way that its resonance frequencies do
not coincide with the excitation frequencies. Reducing the number of responding modes
is applicable to finite-band random excitation. Undamped continuous structures under
harmonic excitation possess points at which the vibration displacement is zero, referred
to as nodes. Nodalizing involves locating the sources of excitation at the nodes, by so
doing minimizing the response amplitude throughout the entire structure. Increasing the
stiffness of the structure reduces the number of modes that fall in the frequency band of
excitation, which causes the total response to decrease. Decoupling is done by relocating
the masses on the structure to minimize the vibrational power flow between the modes

and parts of the structure. The material selection and stiffening methods refer to
modifying the stiffness in order to reduce the response levels (Mead, 1998).
1.2.2.3 Passive Vibration Control by Localized Additions
In some cases, the most effective and economic method for reducing vibration is
to add an extra system at a discrete location on the main system. This addition can be in
the form of a mass-spring-damper system attached to a single point on the main system,
i.e., lumped parameter absorbers, or it can be a beam attached to the main system from its
end points, i.e., continuous absorbers. In both cases, the added systems are attached to the
main system at discrete points, rather than being connected continuously along the
primary structure, and therefore are localized additions. Different types of absorbers can
be connected to the primary structure as localized additions.
Lumped parameter absorbers have two distinguishing characters. The absorber
mass is located at a discrete point, i.e., its mass is concentrated in a smaller volume
compared to the main structure, and therefore it can be modeled as a discrete mass. The
connection of the absorber mass to the main system is also discrete. The simplest type of
absorber that falls in this category is the well-known mass-spring-damper system,
commonly known as the tuned mass damper, as shown in Figure 1.3. Ms is the main
system and Mr is the absorber mass. Another example is the pendulum absorber, which
can be tuned to any harmonic excitation (Crossley, 1953), used as a dynamic damper for
absorbing torsional vibrations (Figure 1.4). Mustafa and Ertas (Mustafa and Ertas, 1995)
utilized the pendulum absorber for damping vibrations of flexible structures, where a
single mass is connected to the primary structure via a pendulum (Figure 1.5). The three-
mass pendulum absorber, which consists of three interconnected masses, is another
example of this type of absorbers (Figure 1.6) (Korenev and Reznikov, 1993).
In the case of continuous absorbers, the absorber mass is distributed along its
length, in which case the mass of the absorber can not be modeled as discrete. The
absorber may also be connected to the primary structure at multiple points, or along its
length, instead of being connected at a single point. Examples to this type are beam-mass
absorbers, beam-pendulum absorbers, and liquid dampers. Ibrahim and Sullivan proposed

in 1990 a beam-mass absorber, where a beam-mass system is used as an absorber to
another beam-mass structure. Ibrahim et al. (1989) studied a beam-mass absorber for a
nonlinear building model (Figure 1.7). Sevin (1961) proposed a beam connected to two
linkages at its ends, as an absorber (Figure 1.8). Liquid dampers, which consist of
containers partially filled with liquids, (Figure 1.9) have been proposed and used for
vibration absorption.
The absorber mass of an Impact Vibration Absorber (IVA) may either be
connected to the primary mass as in the case of the tuned mass damper, or it may be free
to move in a cavity with no connections with the primary structure. The distinguishing
character of IVAs is the existence of the walls, the movement limiting stops that
constrain the range of movement of the absorber mass. The first IVA was proposed by
Paget (Figure 1.10) in 1937 to damp the vibrations of turbine blades (Paget, 1937). Here,
the impact mass (c) is a steel ball, which is free to move along the rectangular section (a)
that is cut into the turbine blade.
1.2.2.4 Passive Vibration Control by Added Damping
Damping causes the decay of transient vibrations, by removing the energy from
the system. The energy is either removed from the system by radiation, or it is dissipated
within the system. Using layers of high-damping materials in or on a structure increases
damping. By increasing the damping, the energy dissipation is increased. If more energy
is dissipated from a vibratory system, there will be less kinetic energy left, which will
cause the velocities and displacements related to vibration to be lower (Ungar, 1992).
This method is most effective for reducing flexural vibrations of beams, plates and
cylinders, but usually ineffective for torsional and longitudinal vibration. The internal
damping of beams can be increased by using stainless steel instead of aluminum, or by
adding viscoeleastic materials to dissipate energy. The radiafion damping of a vibrating
beam can also be increased, e.g., by clamping it to a supporting structure instead of
suspending it by wires (Crandall, 1970).

1.2.2.5 Passive Vibration Control bv Resilient Isolation
Vibration isolation refers to the use of comparatively resilient elements for
reducing vibrations that are induced on a system by another system (Ungar, 1992), For
physically connected systems, it is not possible to eliminate vibration transmission
completely, but it can be minimized by isolating the two systems using resilient
interconnections, referred to as vibration isolators. The resilient elements can be modeled
as spring damper systems, as shown in Figure 1.11. Mechanical applications include anti-
vibration mounts by which the engines of vehicles are attached to the main structure.
Applications in civil structures include solid viscoeleastic dampers, fluid viscoeleastic
devices and fluid viscous devices that are used in buildings to restrict the transmission of
earthquake, wind or traffic caused vibration (Penalba, 1999).
1.3 Impact Vibration Absorbers
1.3.1 Introduction
Since the introduction of the IVA, different types of IVAs have been proposed,
studied and used in practical applications. The IVAs that have been proposed up to date
can be classified as (a) single-unit IVAs, (b) multi-unit IVAs, (c) hybrid IVAs, and (d)
compound IVAs (Figure 1.12). Single-unit IVAs consist of a single mass moving freely
in the primary system (Figure 1.12 (a)), whereas multi-unit IVAs utilize multiple impact
masses contained either in the same cavity (Figure 1.12 (b)), or in separate cavities.
Hybrid IVAs are IVA systems combined with other absorbers, e.g., an IVA connected to
a mass-spring-damper absorber (Figure 1.12 (c)). On the other hand, the impact mass in
compound IVAs is cormected to the primary system, e.g., by a pendulum or leaf spring
(Figure 1.12 (d)). Although the absorber mass in the current study is connected to the
encoder by a pendulum, it does not fall into the compound category since the holding
mechanism is separate from the primary mass. The IVA in the current study belongs to
the single-unit IVA class.

1.3.2 Single-Unit Impact Vibration Absorbers
Single-unit IVAs are the simplest type of IVAs. The first IVA proposed by Paget
(1937) was of this type. He studied the effect of clearance on the efficiency of the IVA
under transient excitation in the vertical direction, and found out that the IVA increased
the rate of energy dissipation of the system up to 60 times. Grubin (1956) found
theoretically for harmonic excitation that the IVA was most efficient at resonance, Masri
and Caughey (1966) presented the exact solution of the two-impacts-per-cycle motion,
for harmonic excitafion (Figure 1.13). Masri (1969) also showed that best attenuation was
achieved by highest coefficient of restitution and highest mass ratio. He also stated that
lightly damped systems that operate over a frequency band needed lower coefficient of
restitution for stability. Furthermore, he showed that the sensitivity of tuning to clearance
increased with increasing gap, decreased with decreasing coefficient of restitution. He
also proved theoretically that when the IVA experienced stable steady state motion, with
two-impacts-per-cycle, impacts were equispaced and motion was symmetric. Masri and
Ibrahim (1973) studied the response of the IVA to white noise random excitation and
observed the best vibration attenuation for 0.2<g<0.8. The authors showed that even with
small mass ratios, substantial attenuations were possible, e.g., 50% attenuation for a 5%
mass ratio, and that IVA performance was enhanced if there is little or negligible viscous
damping in the system. Roy et al. (1975) investigated the application of IVAs on simply
supported and clamped beams both experimentally and theoretically, and showed the
effect of mass ratio, clearance, and excitation on absorption effectiveness. Thomas et al.
(1975) applied the IVA for vibration reduction of boring bars and found at that boring
bars effectiveness was improved with the installation of an IVA, giving increases in
stable metal removal rates. They also showed IVA performance was insensitive to the
excitation frequency. Skipor and Bain (1980) applied the IVA to a rotary printing
equipment for reducing response of system to transient vibrations, studied the
maintenance, wear, and failure of the IVA, and showed that oscillations were reduced to
21% of their undamped values within one cycle of vibration. Popplewell et al. (1983)
showed that best attenuations were obtained when frequency ratio of 1, and the
performance of the ID detonates noticeably if frequency ratio was lower than 1. For this
8

reason, the authors proposed that driving frequency or speed would require close
controls. Masri et al (1989) proposed an actively controlled IVA with variable clearance,
and found it quite effective in reducing peak response of vibrating structures under swept
sine and random excitation, including non-stationary wide-band random excitation,
Chalmers and Semercigil (1991) studied the performance on the IVA applied to a long
aluminum beam under harmonic excitation. Cases of single IVA at the tip, single IVA at
2nd mode, and two IVAs at both locations were studied and the authors determined the
desired location for second IVA for the second mode of the beam. It was shown that
using two IVAs gave much better vibration reduction and also using hard rubber on
impact surfaces increased reduction, while also reducing the sensitivity of the system
response to clearance. Hoang and Semercigil (1992) proposed an IVA to control the
excessive transient vibrations of a single-link flexible robot arm for transient excitation,
e.g,, after a sudden stop or after hitting a stop block. The authors demonstrated
experimentally that the IVA was capable of attenuating up to 95% of the vibrations, with
a simple, self-contained construction and without any obstruction to the tasks to be
performed by the robot. The previous study was extended by numerical simulations and
experiments, and it showed that the performance of the IVA detoriates slightly if the
impacts take place in the vertical direction (Figure 1.14)(Chen and Semercigil, 1993).
The authors proposed a new IVA employing an oscillator rather than a loose mass, since
it would have consistent damping in both horizontal and vertical directions, and showed
that the new IVA was as effective in the vertical direction as the horizontal direction. Cao
and Semercigil (1994) studied a semi-active controller to change the clearance of an
impact damper to control the excessive transient vibrations of light flexible systems.
Bapat (1995) studied an IVA operating on an inclined surface, showing that effects of
gravity and friction were detrimental and reduced stability ranges in most cases and
considered using compressed air to accelerate the IVA, Ema and Marui (1995) applied
the IVA to boring bars and drills to reduce chatter vibration, considering operation in
vertical and horizontal direction. The authors showed that the damping capability was
increased by eight-fold or more. Moore et al. (1995) developed an IVA for turbo-pumps.
The authors stated the difficulty of damping of such machinery due to cryogenic

temperatures and low viscosity of the operating fluid. The optimum operating amplitudes
for different modes and mass ratios were determined experimentally and analytically, and
the damping performance is characterized by an equivalent viscous damping coefficient
to compare performance of IVA by other dampers. The results proved the ID to be a
viable means to suppress vibration in cryogenic rotor-bearing systems, Oledzki et al.
(1999) used a self contained IVA in the fuselage of the motorized hang-glider in Figure
1.15, where the arrow shows the location of the IVA, showing that it decreased the
resonance amplitude up to four times, and especially at idling speeds of the motor which
caused resonance. The authors investigated impact phenomena between bodies with
plastic inserts, found optimum values for mass ratio, clearance, and stated that small
amounts of friction force would benefit the efficiency, while efficiency did not depend on
frequency ratio.
1,3,3 Multi-Unit Impact Vibration Absorbers
As the name suggests, multi-unit IVAs utilize multiple impact masses. The impact
masses can be enclosed in a single cavity, as in Figure 1.12 (b), or they may be enclosed
in their respective cavities, e.g., three impact masses in three cavities. Also, the impact
masses can be connected to each other, as in the case of hanging chain dampers. Paget
(1937) was also the first to utilize a chain as an IVA. Reed (1967), showed that the IVA
increased the damping of a 70-foot tall erected launch vehicle by a factor of up to 3, and
utilized the IVA effectively to reduce transverse vibrations caused by wind excitation
(Figure 1,16). Masri (1968) obtained the exact solution for the two-impacts-per-particle-
per-cycle motion, and showed that a properly designed multiple-unit IVA was more
efficient than an equivalent single-unit IVA in regard to vibration reduction and noise
level of operation. The model used in this study is a good example for multi-mass/multi-
cavity IVAs (Figure 1,17). Semercigil and Popplewell (1988) proposed the use of the
"beanbag damper," a bag filled with lead shots, as an IVA. The authors showed
experimentally that the beanbag damper reduced the vibrations of systems under random
excitation by about 40%, whereas the traditional IVA was quite ineffective. They also
showed that the beanbag damper attenuated the accelerations due to impacts, and
10

operation was quiet, and commented that the beanbag dissipated more energy because of
its design and more plastic behavior. Popplewell and Semercigil (1989) studied the
beanbag damper (Figure 1,19) for sinusoidal excitation and showed that it had better
performance over the single-unit IVA, They also utilized optical sensors to measure the
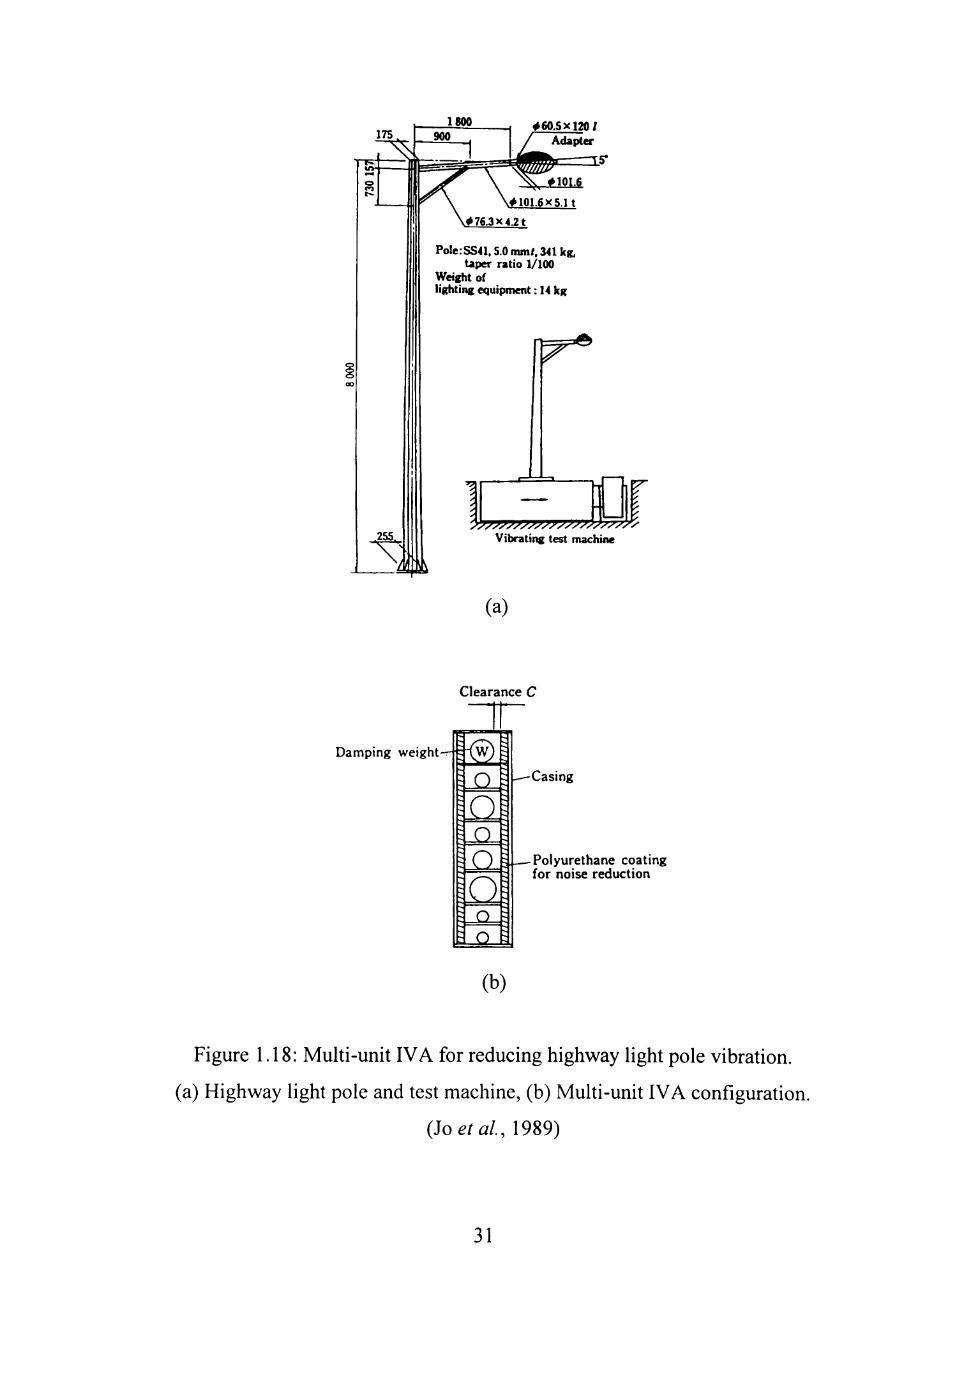
displacement of the beanbag damper with respect to the primary mass, Jo et al. (1989)
used multiple IVAs for absorbing wind and road excited vibrations of highway light
poles (Figure 1.18), while coating contact surfaces with polyurethane for noise reduction.
By attaching IVAs to the inside of the pole, the authors were able to obtain 90%
reduction in vibration amplitudes, while also proposing a self-contained design. Koss and
Melbourne (1995) utilized the hanging chain damper for reducing wind-induced
vibrations of communication towers. Hanging chain dampers were employed inside the
towers to increase their structural damping, and it was shown that the impacts occurred
not only at the free and but along most of the length of the chain as vibration became
more severe. The authors also proposed that energy dissipation was by inelastic impact of
chain against the wall of the cylinder and by the internal friction of the chain links,
Yokomichi et al. (1996) studied the effects of the damper parameters, mode shapes and
damper locations, and showed that good vibration reduction was achieved when the
damper was applied to points of large modal amplitudes, Papalou and Masri (1998)
showed that replacing a single-particle IVA with smaller particles of equal total mass
improved the surface detoriation, reduced noise and sensitivity of efficiency to excitation
amplitude with a compromise in reduction in the peak efficiency. The model used in this
study (Figure 1.20) is a good example to multiple-unit IVAs in a single cavity,
1,3,4 Hybrid Impact Vibration Absorbers
Ying and Semercigil (1991) were the first to propose this type of an IVA, The
authors demonstrated that the inclusion of an impact damper as an extra system may
improve the capabilities of the conventional tuned mass absorbers for random excitation
(Figure 1.21), and suggested installing the system in existing absorbers to provide extra
protection in the event of unexpected excitation such as earthquakes. Moore et al. (1997)
studied a hybrid friction-impact vibration absorber (Figure 1.22) for high-speed rotor
11

dynamic applications at cryogenic temperatures. The authors stated that since the
coefficient of restitution is a weak function of temperature, the IVA was effective at
cryogenic temperatures as well. According to the authors, the friction damper shows
superior performance at low amplitudes and speeds, while the IVA requires a certain
acceleration to initiate impacting motion, and therefore yields optimal performance at
higher amplitudes and speeds. The two dampers complement each other providing
vibration suppression over the full speed range. Collette (1998) analyzed the
effectiveness of the combined tuned mass absorber-IVA for a three-story building model
under random excitation, and studied its sensitivity to variations of clearance, coefficient
of restitution, and mass ratio. Performance of the combined absorber is compared to the
conventional tuned absorber. Collette and Semercigil (1998) and Collette et al. (2000)
studied similar systems under transient vibration.
1.3.5 Compound Impact Vibration Absorbers
Kato et al. (1976) studied an IVA connected to the primary mass with a spring
(Figure 1.23), under swept sinusoidal excitation, and showed that IVA of one-sided
impact design is superior in damping effect to one of two-sided impact design. The
authors stated that choosing a proper static distance between the IVA and the stopper and
a WnivA/WnpM ratio between 0.6 to 0.8, achieves damping effect over a wide range of
frequencies. It is worthwhile to note that in the case of compound IVAs, it is necessary to
tune the IVA as in the case of tuned mass absorbers, as well as tuning IVA parameters.
Steinberg (1977) utilized IVAs he named "snubbers," in the form of resilient rubber posts
attached to the center of adjacent boards and separated by a gap of a few hundredths of an
inch, for damping printed-circuit boards in order to protect them form vibrating under
dynamic loads and results of cracked solder joints, broken leads and loose components.
He reported that snubbers limited vibration to a safe amplitude by coupling boards
together for added structural support. Fuse (1989) proposed a dynamic damper with an
IVA connected to the primary mass with a leaf spring. The primary mass and the IVA is
coupled in this case, since they are connected (Figure 1.24). In fact. The IVA would be a
TVA if there were no impacts. This study is interesting, since this absorber can be
12

thought of a TVA for smaller displacements and as an IVA for displacements large
enough to cause impacts. Ogawa et al. (1992) proposed an IVA with a mass connected to
a cable suspended from the top of a 2 m. tower model whose vibrations are to be reduced.
Since there is no initial clearance, this design is also effective for small vibration
amplitudes. Ogawa et al. (1997) studied the vibration absorption of a hanging mass IVA
(Figure 1.25) for transient and wind tunnel excitation. Since neoprene was used on
impact surfaces, the noise levels are reported to be lower than 60 dB. This IVA was used
to suppress wind-induced vibration of a bridge pylon by increasing the structural
damping of the pylon, in order to increase the galloping onset wind velocity. El-Sayad et
al. (1999) proposed an IVA system in the form of a simple pendulum (Figure 1.26)
impacting with the walls of a tank whose vibrations are to be reduced.
1.4 Objectives
The objective of this research is to study the effectiveness of the IVA under swept
and constant sinusoidal excitation, and the effect of the system parameters on system
dynamics. This involved determining the effect of mass ratio, excitation amplitude, and
clearance on absorber efficiency and on system dynamics.
1.5 Scope of Work
For free vibration experiments, the time series data for the primary mass and the
IVA are recorded. For forced vibration, the time series data for the forcing function,
which is the excitation amplitude, the primary mass displacement, and IVA displacement
are collected. The time series data is used to obtain the motion plots, phase portraits,
frequency response plots and coherence curves at selected frequencies, and for a range of
frequencies by sweeping the frequency range in both directions. Data is also utilized to
show the effect of system parameters on system response. The results are analyzed and
where appropriate, compared with published results
13

Deterministic
Periodic Non periodic
Sinusoidal Complex periodic
Almost-periodic
Transient
Figure 1.1: Classification of Determinisfic Vibration
(Bendat and Piersol, 1986).
14

Vibration Control
Active Passive Hybrid
structural Design
Localized Additions
Added Damping
Resilient Isolation Hybrid
Figure 1,2: Vibration Control Methods
15

KT,CT
41i A /////
Figure 1.3: 2-DOF Model of Main Structure and Tuned Mass Damper
(lemura, 1994)
16

Figure 1.4: Centrifugal Pendulum Absorber
(Crossley, 1953)
17

L
Figure 1.5: A Pendulum Absorber-Column with a tip appendage
(Mustafa and Ertas, 1995)
18

d Y///^(//(///////A \L
>
k : - i A
A-A
>
|±| >
Figure 1.6: Three-mass Pendulum Absorber.
(Korenev and Reznikov, 1993)
19

'^J>'c' '"7
Figure 1.7: A Beam-Mass Absorber
(Ihrsihim etai, 1989)
20

Figure 1.8: Beam-Pendulum Absorber
(Sevin, 1961)
21

Figure 1,9: Liquid Dampers
(Modi and Seto, 1998)
22

Figure 1,10: Impact Damper for Damping Turbine Blade Vibration
(Paget, 1937)
23

xii) xU) F(t) = F„ COS
Mach
w/ f F{i) = F„ cos 0)/ f achine (m) I f Machine (m) I
7 ^J I I—^7=-jJ
77777
Resilient member Resilient J "
member
Foundation or base Foundation or base
Figure 1,11: Vibration Isolator
(Rao, 1995)
24

AAAAAIZ r
M •
(a)
AAAAAJZLQ
M •
(b)
< »
(c)
"VWVNAZI O r7 Un-A/Z7Y7/
< •
(d)
Figure 1,12: Types of Impact Vibrafion Absorbers
(a) Single-Unit-IVA, (b) Muhi-Unit IVA, (c) Hybrid IVA, (d) Compound IVA,
25

I I — y - v F« tin At
L. Figure 1,13: Theoretical model of IVA system.
(Masri and Caughey, 1966)
26

Xl(t) X2(t)
^ X
1 rh $ 1
is
(a) (b)
Figure 1.14: IVA operating in the (a) horizontal and (b) vertical direction.
(Chen and Semercigil, 1993)
27

, -
?—-.'
§ p. 4Uk»-U-iM«*«. --JX
t^^^
Figure 1.15: IVA installed in motorized hang glider.
(Oledzki era/., 1999)
28

Vibrating structure
Rubber covered chain Container
Figure 1.16: Hanging Chain Damper
(Reed, 1967)
29

A / / / / / / / / / / / / / /
' . / / -/ / / / /
AAAAAA
^
F.sinilt
Figure 1,17: Mulfi-unit IVA.
(Masri, 1968)
30
1800 »60 .5x l20 / Adapter
J K .
'v 101.6 X5.lt
\.» 76.3 X 4.21
PoIe:SS41,5.0 mm/. 341 kg. Uper ratio 1/100
Weight of lighting equipment: 14 kg
W^
^
^^^7777r7777777r7>^777i^y Vibrating test machine
(a)
Clearance C
Damping weight-
a £Li n. Q JD_ _a
-Casing
-Polyurethane coating for noise reduction
(b)
Figure 1.18: Mulfi-unit IVA for reducing highway light pole vibration,
(a) Highway light pole and test machine, (b) Multi-unit IVA configuration.
(Joetal., 1989)
31

Impedance heod
\ -^ c.
^ f r j . ^ j | W ^ f r M ,
f
F l .
my FQ $jn ut
h Figure 1.19: Beanbag damper.
(Popplewell and Semercigil, 1989)
32

|v^///<//////^z. t ^ ^ o„ .H I
^ , = 1 ^ - .
i
3-©-.©©® ^ ^ ^
^
^
©
y-^ a g \>/////^yy7A m
T «ly=l - |^ in . 32
i dx= l-if- in.
(b)
/-©Oe.* :^
A:Q^\VC i
z
h H d « = l ^ i . 1 .
(C )
T dv = l - • , 2C
32 1.1 .
1 ^::^^^:^::^
i n .
H d«-52-in.
(d)
k/////) V
^ ^ ^
d.,= i 20 ,
i 32 1.1.
d.=-|§-in.
(•)
Figure 1.20: Multi-unit IVA with single cavity.
(Papalou and Masri, 1998)
33

Tuned obsorber
Impoct damper
Primory moss
Steel strips (primory)
Fixed plate
Figure 1.21: Combined IVA-TMA system.
(Ying and Semercigil, 1991)
34

BEARINOS
BALANCE D*SK
(a)
AXIAL IfKME
(b)
. J "y mi titi
(c)
Figure 1.22: Hybrid friction-impact damper,
(a) Assembly, (b) Close-up of IVA design, (c) Friction damper exploded view.
(Moore era/., 1997)
35

y^///^
1 I SJfl Oit
Figure 1.23: IVA with spring-supported mass.
(Kato etal., 1976)
36

J ^ l
777777777777Z7777777777777777
Figure 1,24: IVA connected to the primary mass with leaf spring,
(Fuse, 1989)
37

r 1900
1 8? CVJ-
o 8
Hanger
Base plate
Rib
Hard rubber cushion
/
^
z <A ii
ii
Nr 1 '1 M
M-- ^ J;N I
Weight
(units : mn)
Figure 1,25: IVA for controlling wind-induced excitation.
(Ogawa e/«/., 1997)
38

Figure 1.26: Hydrodynamic sloshing impactor.
(El-Sayad era/., 1999)
39

CHAPTER 2
EXPERIMENTS
2.1 Introduction
The experimental model was designed and built to enable the variation of the
parameters to be studied. The experiment setup contains mechanical and electronic
components from different manufacturers. Each of these components had to be setup to
function properly with one another. Feedback control is utilized to control the shaker.
Each set of experiments is run with and without the IVA to gather displacement data in
the time domain. The data is later used for studying the absorption and dynamics of the
system. The effects of parameters such mass ratio, amplitude of excitation, and clearance
are also studied. Three different excitation amplitudes are used to show the effect of the
amplitude on the system response, as well as the absorption efficiency and region. Figure
2.1 shows the different experiments done and the parameters that are studied.
2.2 Model
The experimental model (Figure 2.2) consists of two aluminum plates connected
with four 1.65 mm Thick, 25.4 mm wide, and 220 mm long steel beams, which funcfion
as leaf springs. The lower plate rests on four wheels, and is free to move forward and
backward. The shaker is connected to the bottom plate, which can be considered as the
base of the primary mass, the top plate. Therefore, when the shaker is excited, base
excitation is imposed on the primary mass. There are two L-shaped pieces, on the top
plate that act as motion stops. The mofion stops are also referred to as walls. The top
plate has slots machined through the surface, where the walls are bolted. The clearance
between the walls can be adjusted as desired, since the slots enable the bolts to be located
anywhere on the plate.
The impact mass, which is referred to as the IVA, connected to an encoder via a
pendulum, collides intermittently with the walls and reduces the vibrations of the primary
mass. The IVA to be used for preliminary experiments was made of steel. However, since
the shaker is electromagnetic, the magnetic field produced by the shaker caused the IVA
40

to stick to the walls on some occasions. Therefore, a nonmagnetic material was required
to isolate the IVA from all magnetic forces. The other considerations for the material
selection were that a high-density material was needed in order to obtain the desired mass
without making the IVA too large, and the hardness of the material needed to be high
enough not to deform the IVA by impacts during operation. Stainless steel was selected
as the material, since it combines all the above properties in sufficient proportions. The
IVA was designed to provide four mass ratios without changing the diameter. The IVA
assembly (Figure 2.3) consists of a main mass of 38.1 mm diameter and mass of 86 g,
with a curved circumference, i.e., it is a disc of varying diameter, which can be attached
to the secondary masses. The impacts occur on the circumference of the main mass, i.e.,
the IVA and the walls contact on the circumference of the IVA. Point contact is desired
during impacts, instead of line or area contact. Therefore the final design of the IVA was
chosen as above, although the prototype IVA was simply a disc, which experienced line
contact with the walls. The main mass also has a hole through its center along the
diameter, through which the pendulum is inserted in order to attach the IVA to it. The
four secondary masses are discs of 33-mm diameter, one pair of which weigh 46 g, and
the other pair 93 g. They can be attached to the main mass in 4 different combinations to
provide 4 different mass ratios. All the masses, including the main mass, also have two
holes through their thickness. Setting pins, each weighing 3 g, are inserted through these
holes to hold the masses together. The holes were machined so that the pins fit through
them tightly, allowing the omission of setscrews. The pendulum that cormects the IVA to
the encoder was a hollow carbon rod, which has a relatively high strength to density ratio
compared to most other materials that could be used for this purpose, e.g,, steel. The
carbon rod was used in order to concentrate all the mass of the IVA on the IVA itself, so
that we can make a reasonable assumption that the IVA is a free mass moving between
the walls. The IVA was connected to the pendulum by using setscrews. However, since
the carbon rod was not stiff enough to withstand the pressure applied by the setscrews, a
slotted brass sleeve was inserted into the hole of the IVA, and the rod was inserted into
the sleeve. In this way, the pressure applied by the setscrews was distributed to a larger
area on the rod, and cracking of the rod was prevented. The rod was connected to the
41

shaft of the encoder in a similar way, utilizing an aluminum connector to translate the
rotation of the shaft into translation of the IVA, The length of the carbon rod, and
therefore the pendulum, was 211 mm. Since the angular rotation of the pendulum is very
small, it can also be assumed that the IVA is translating linearly, rather that rotating about
a pivot. A detailed three-dimensional drawing of the experiment layout is shown in
Figure 2.4.
2,3 Setup
The experiment setup is shown in Figure 2,5, The setup consists of (a) controller,
(b) amplifier, (c) shaker, (d) accelerometer, (e) signal conditioner, (f) primary system, (g)
absorber, (h) encoder system, and (i) acquisition and analysis system. Feedback control is
used to control the frequency and amplitude of the signal. A personal computer with Data
Physics SignalCalc 550 Vibration Controller software is used for this purpose. The drive
signal is sent to an MB Dynamics Model S6K Power Amplifier, which drives the shaker.
The function of the shaker is to excite the model under investigation with a signal of
specified amplitude and frequency content. The shaker used was an MB Dynamics Model
C-10 Type E electromagnetic shaker.
An accelerometer mounted on the shaker table provides the feedback signal for
the vibration control system. A PCB Piezotronics Model 353B52 accelerometer is used
with a PCB Model 480C02 signal conditioner for the experiments without the IVA, while
a PCB Model 353B34 accelerometer and a PCB Model 480B10 signal conditioner is used
for experiments that include the IVA. The reason for this change is the noise created by
the IVA. When the IVA is not in operation, the signal from the accelerometer has a high
enough signal-to-noise ratio for using it as the control signal. However, when the IVA is
operating, the impacts introduce high frequency noise into the signal, therefore using the
acceleration data for control reduces the performance of the controller. The integrating
switch on the 480B10 signal conditioner can be used to convert acceleration signal from
the accelerometer into low-noise displacement signal. This is expected since integration
reduces noise, in a mathematical perspective (Chapra and Canale, 1998). The reason for
using different accelerometers was that the 353B34 accelerometer signal is always
42

recorded in displacement mode to track the driving force. The reason for using different
types of signal condifioners was that the 480B10-signal condifioner does not provide
enough voltage to power the 353B52 accelerometer. The selected control signal was fed
to the controller, while at the same time the shaker displacement signal was recorded by
the data acquisition system. The vibration control program uses this feedback signal to
keep the shaker displacement within the desired values specified by the user.
The displacement data from the primary mass is obtained by a 350A14
accelerometer and a 480B10 signal condifioner in displacement mode. During the earlier
preliminary experiments, a strain-gage and a piezo-film were used to measure the
position of the primary mass, but it was later decided that an accelerometer should be
used due to reliability and repeatability considerafions. However, an MEM Type CEA-
06-250UR-350 strain gage installed on one of the steel beams is used to determine the
initial displacement applied to the model in transient vibration experiments. The strain
gage is connected to a Vishay Measurements Group Model P3500 strain indicator. An
optical encoder and an Allen-Bradley digital programmable control system are used to
measure the angular position of the IVA. This measurement system produces a voltage
proportional to the angular position of the pendulum. The encoder was calibrated in such
a way that the voltage is zero when the pendulum is in the downward vertical position.
The voltage increases linearly with the rotation angle from 0 to 10 V, as the pendulum
turns clockwise, until it reaches the vertical upward position. Turning it clockwise from
the vertical upward to the downward position, the voltage changes from -10 to 0 V. In
other words, the voltage is negative to the right of the vertical axis and positive to the left.
Details about this measurement system can be found in the article by Ertas and Mustafa
(1992), The displacement data is recorded by a personal computer equipped with a
National Instruments model SCB-68, AT MIO-16E-2 data acquisifion board, using
Nafional Instruments LabVIEW 5.1 software.
A jig is built to suspend the encoder and the IVA from above the top plate. The jig
is designed in a way to accommodate different pendulum lengths; however, it was
decided that the pendulum length would not affect the results significantly, and a single
pendulum is used in all experiments. The jig is also designed in a rigid manner so that it
43

is not affected by vibrations. The two screw at the bottom of two legs allow the
adjustment of the length of those legs, which enables adjusting the jig to stand in a
vertical posifion.
2.4 Controlling the Shaker
2.4.1 Feedback Control
As stated in the previous sections, the control signal is chosen as displacement or
acceleration, for different experiments. This is done because the controller performs
better using different signals for different experiments. The reason for the difference in
performance is related to the coherence, which will be discussed in section 2,4,2.
Constant displacement mode is selected for all forced vibration experiments.
Therefore, the controller operates to keep the zero-to-peak value of the shaker table
displacement at the desired value that is input to the program. The controller calculates
the acceleration value that should be produced by the specified zero-to-peak displacement
during the period of the specified sine wave. This is the desired acceleration value that
the controller tries to establish. The controller then compares the feedback signal with the
desired value, and adjusts the driving volts to keep the feedback signal as close as
possible to the desired signal. The controller always uses accelerafion for comparing the
signals, i.e., even though the feedback signal is displacement, it is converted to
acceleration first for comparing with the desired acceleration. Further details about the
control system may be found in the manuals (Data Physics Corporation, 1999).
2.4.2 Coherence
For pairs of random records from two different stationary random processes,
coherence function is an important joint statistical property. The coherence ftinction is a
measure of the accuracy of the assumed linear input/output model, and can also be
computed from the measured auto spectral and cross-spectral density functions, G^ocif)
and Gxy(f), respectively. The coherence function Y^y(/) of two quantities x(t) and y(t) is
the ratio of the square of the absolute value cross-spectral density function to the product
of the auto spectral density functions of the two quantities:
44

. GJf) '' GJf)GJf)
For all f, the quantity y y ^ satisfies 0 < Y\y(^ < 1, i.e., the coherence is bounded
by zero and unity. This ordinary coherence funcfion measures the extent to which y(t)
may be predicted from x(t) by an optimum linear least squares relationship (Bendat and
Piersol, 1986),
A zero value means there is no linear dependence and a value of unity means
there is a perfect linear dependence between the signals at the frequency f A coherence
value that is less than unity at one or more frequencies is usually indicative of one of the
following situations (Piersol, 1992):
1. Noise is present in the measurements.
2. The frequency resolution of the frequency spectrum is too wide.
3. The relation between y(t) to x(t) is dependent on time.
4. The relation between y(t) and x(t) is not linear.
5. The output y(t) depends on other inputs as well as x(t).
2.4.3 Controllability
In the case of controlling the shaker, the input refers to the driving volts supplied
by the controller to the shaker, while the output refers to the actual displacement of the
shaker table, which is fed back to the controller as the feedback signal. For all systems
utilizing feedback control, there needs to be a relation between the input and the output
for the control to work efficiently. The stronger this relation, the higher the coherence and
vice-versa. A stronger relation, i.e., higher coherence will enable better control. The
coherence value varies between 0 and 1. A coherence of 0.5 means that there is a 50%
probability that the feedback control system will be able to control the system. For every
type of experiment, e.g., with/without IVA, sweep/dwell, the feedback signal was chosen
as displacement or acceleration, so that the coherence was as high as possible.
45

2.5 Experimental Procedure
2,5,1 Introduction
The natural frequency of the primary system was tuned while the absorber was
not in place. The primary mass is given an initial excitafion and let to oscillate freely,
while the displacement data is recorded for 10 seconds. By using a power spectral density
(PSD) program written in LabVIEW, the natural frequency of the model was obtained.
For this study the natural frequency was adjusted to 9 Hz, by changing the sfiffness of the
system. The sfiffness was adjusted by making use of the formula w„ = (k/m) '^\ For a leaf
spring (steel beam), the stiffness increases by decreasing length, and vice versa.
Since the amplitude of excitation was in the order of 0.25 mm, the distance
between the walls need to be measured very precisely. For this purpose, a telescoping
gage and a micrometer were used. The walls were installed in such a way that the impact
surfaces were parallel to each other but perpendicular to the direction of motion of the
IVA. This and the curved surface of the IVA assure perpendicular point contact during
the impacts.
The desired mass ratio was obtained by assembling the IVA as required. When
experiments without the IVA are to be conducted, the IVA was elevated above the walls
by moving the encoder higher along the jig.
A data acquisition rate of 70 scans/sec was used to acquire data. This rate was
selected due to the speed involved in the dynamics of the system, as well as the
sensitivity of the encoder. The scan rate was also set to avoid antialliasing. The encoder
sends 2048 pulses per revolution of its shaft, therefore the smallest angle it can measure
is 360/2048 degrees. Since the pendulum is forced to move at around 9 Hz throughout the
experiment, higher scan rates cause data points to be at the same level, e.g., 1 V of
voltage at two consequent data points although the pendulum has rotated slightly, but the
rotation is not enough for the encoder to give a different signal.
46

2.5.2 Transient Vibration
Transient vibration experiments were done by applying an initial displacement to
the primary mass. The same initial displacement was applied to the system, with and
without the IVA, by using the strain gage. The primary mass was displaced from its
equilibrium position by pulling it, until the desired value was read from the strain
indicator, and the system was let to oscillate. Four displacement inifial displacements
were applied to the system, while four clearances and four mass ratios were used. The
parameters that are used are shown in the table in the appendix,
2,5,3 Forced Vibration
2.5.3.1 Introduction
Feedback control is utilized for all the forced vibration experiments. For every
such experiment, the frequency and displacement content of the desired shaker
displacement signal is input to the program. Dwell (constant frequency) and sweep
(varying frequency) experiments are conducted. The non-dimensional frequency ratio is
obtained by dividing the excitation frequency by the natural frequency of the primary
mass, which is 9 Hz. The frequency range of interest is 8.7 to 9.3 Hz, which corresponds
to a non-dimensional frequency ratio range of 0.967 to 1.033. The frequencies where data
was collected is seen in the table in the appendix. A smaller frequency increment was
used around resonance and jump points.
2.5.3.2 Sweep
The frequency of excitation is swept in both directions, namely, upsweep and
downsweep. The sweep rate was chosen as 0.001 Hz/sec, which is the lowest sweep rate
the control system supports. The system is let to dwell at the starting frequency for 20
seconds, until it reaches steady state before the sweep starts and data is collected.
2.5.3.3 Dwell
For constant frequency experiments, the dwell option of the controller is chosen
to specify the dwell frequency and the duration of the dwell. All the dwell frequencies are
47

programmed in sequence, so that when one measurement for one frequency is taken, the
controller ramps down the drive, stops the shaker completely, and then ramps up at the
next frequency.
The data for each discrete frequency value is recorded for 25 seconds after the
system has been excited with the same frequency for at least 15 seconds. This initial time
is necessary for the system to reach steady state before data is taken. To determine the
time the system needs to reach steady state, the real time data is analyzed while the
experiment is rurming, and the system is assumed to have reached steady state when three
consecutive sets of data show the same trend, i.e., when the displacement amplitude
reaches a constant value.
48

Free Vibration
Experiments
Without absorber
Forced Vibration
With absorber
Frequency Sweep
Frequency Dwell
Frequency Sweep
Frequency Dwell
Initial Displacement
— I Mass Ratio " "
Clearance
Initial Displacement
Mass Ratio
Clearance
Excitation Amplitude
i Mass Ratio ^
Clearance
Excitation Amplitude
i Mass Ratio ~
Clearance
Excitation Amplitude
i Mass Ratio " "
Clearance
I Excitation Amplitude
Mass Ratio
Clearance
Figure 2.1: Experiments done and parameters studied.
49

T y
Ky Cy I
Uo Sin(wO Figure 2.2: Model.
50

Figure 2.3: IVA assembly.
51

Figure 2.4: Experiment layout.
52

(a) A l ^ I ' i ^ (i)
Figure 2.5: Experiment setup.
53

CHAPTER 3
RESULTS AND DISCUSSION
3.1 Introduction
In all plots, the parameters used to get the data is illustrated by the legend.
Transient vibration experiments can be with or without the IVA, and the data is
illustrated by the legend as w/o IVA-ID or MxCx-ID, respectively, where the term w/o
IVA means without IVA, ID stands for initial displacement, the x's in Mx and Cx are the
mass ratio and clearance of the IVA, hence the presence of Mx means the IVA is in
operation. The initial displacement is the strain applied to the steel beams, in
microstrains, e.g., if the number shown is 400, the inifial displacement applied to the
primary mass causes a strain of 400 microstrains. A Stands for amplitude, M stands for
mass, or mass ratio, and C stands for clearance. The data is organized in such a way that
A4>A3>A2>A1, M4>M3>M2>M1, and C4>C3>C2>C1. The values for these
parameters that were used for the experiments are shown in Appendix. Forced vibration
experiments are organized in a similar manner, except that the amplitude of excitation is
shown by an additional parameter, A.
Displacement values are the voltage values read by the data acquisition board.
Since the transducers' output is a linear ftinction of displacement, the data is qualitative,
even though it is not quantitative.
3.2 Transient Vibration
3.2.1 Linear vs. Exponential Decay
The time series displacement data of the primary mass without the absorber is
shown in Figure 3.1. The data depicts the characteristic decay of damped systems under
free vibration. Using the LabVIEW program utilizing power spectral density analysis, the
natural frequency of the primary mass is seen to be 9 Hz (Figure 3.2), since there is a
peak at 9 Hz.
A typical time series data for transient vibration is shown in Figure 3.3. The black
line represents the position of the primary mass in the absence of the IVA, while the red
54

line represents the position of the primary mass when the IVA is operafing. It is observed
that in the latter case, the vibrations are reduced much faster compared to the case
without the IVA, due to faster energy dissipation. When the IVA is not in place, the slow
decay is a resuh of the internal damping in the system.
A LabVIEW program was used to locate the maximum displacement points in a
data file. Figure 3.4 shows these points for the first 11 seconds of motion, for the cases
without and with the IVA. Fitting curves to the peak points proves that for the case
without the IVA, the decay is exponential, whereas for the case with the IVA the decay is
linear until the vibrations of the primary mass go below a certain level that impacts are
not observed anymore. This result is in agreement with the results presented by Bapat and
Sankar (1985), The damping inclination formula proposed by the authors is related to the
slope of the line, for the cases with the IVA. In this case, the higher the absolute value of
the slope, the steeper the line, the higher the damping inclination, and faster the
attenuation of vibrations.
3.2.2 Parametric Studies
Figure 3.5 shows the results for transient vibration experiments for studying the
effect of mass ratio, while all other parameters are kept constant. It is seen that a higher
mass ratio causes faster absorption, since the slope of the line increases as the mass ratio
is increased. This result is also consistent with the results of other researchers (Bapat and
Sankar, 1985; Chen and Semercigil, 1993; Ema and Marui, 1994).
The effect of clearance is shown in Figure 3,6, while all other parameters are kept
constant. It is seen from the equations of the best fit lines that the fastest absorption
corresponds to the largest clearance, but this trend is not consistent with the other
clearance values, e.g., the absorption corresponding to C2 is better than that of C3.
Similar results were reported by Bailey and Semercigil (1994), and Araki et al. (1989). In
this case, more clearance values need to be studied to make conclusions.
The effect of initial displacement on the rate of decay is presented in Figure 3.7.
Four experiments were done with the same mass ratio and clearance, while initial
displacement was changed for each case. It was observed that higher initial displacements
55

result in faster vibration attenuations. This may be attributed to the severity of impacts
when the initial displacement is higher. Since the spring force is directly proportional to
the initial displacement, the primary mass may gain more speed, resulting in a higher
relative impact speed. From the theory of impact, coefficient of restitufion, which effects
the amount of energy dissipated by an impact, depends on the velocities of the bodies at
the instant of impact (Babitsky, 1998). The change in coefficient of restitufion may cause
faster attenuations.
3.3 Forced Vibration
3.3.1 Time Series Data
A sample of time series data for the shaker, the primary mass and the IVA is
shown in Figure 3.8, for an excitation amplitude of 0.254 mm, clearance of 2.112 mm,
mass ratio of 0.193 and excitafion frequency of 9 Hz. The voltage signals from the
transducers connected to the latter two are mulfiplied by 10, to display the signals on the
same graph. The reason for the large amplitude of the shaker signal is due to the high
sensitivity of the accelerometer used to control the shaker. From the nature of operation
of the IVA, it requires impacts to change its direction of motion. The instants of impact of
the IVA can be located as the highest and lowest points on the time series data.
Observation of this graph reveals that there are two impacts per cycle of excitation. Masri
and Caughey (1966) studied this type of motion theoretically and stated that two impacts
per cycle motion is necessary for the stability of the system. Further observation of
Figure 3.8 reveals that there is a phase difference between the displacement of the shaker
and the primary mass. This is due to the leaf spring connecting the base and the primary
mass.
3.3.2 Motion Plot
Although Kato et al. (1976) and Popplewell and Semercigil (1989) have used
non-contact displacement transducers to measure the position of a compound and a multi-
unit IVA, respectively, this study is the first one to show the position of the impact mass
of a single-unit IVA experimentally. The mofion of the IVA is presented in Figure 3.9,
56

where the two-impacts-per-cycle motion can be observed. Since the impact mass is
smaller than the primary mass, impacts cause the impact mass to change direction, while
the velocity of the primary mass is reduced. The primary mass also changes direction
after the impacts, but this is due to the cyclic characteristic of vibrations.
3.3.3 Frequency Response Plots and Parametric Studies
Figure 3.10 shows the amplitude of vibrations of the primary mass without the
IVA, and with the IVA for four different impact masses. The curve for the case without
the IVA shows the traditional trend of vibratory systems around resonance, reaching a
maximum at natural frequency. As in the case of transient vibration, a higher mass ratio
provides better absorption. This result is consistent by the results reported, among others,
by Roy et al. (1975), and Popplewell and Liao (1991).
For cases when the IVA is active, the non-dimensional displacement ratio is
obtained by dividing the displacement of the system with the IVA, with the displacement
of the system without the IVA. Similarly, dividing the forcing frequency by the natural
frequency of the model establishes the dimensional frequency ratio r.
Figure 3.11 shows the effect of mass ratio on the amplitude ratio. As stated above,
a higher mass ratio increases the attenuations. The absorption is best around resonance,
and absorber effectiveness diminishes as the excitation frequency moves away from the
natural frequency. In addition, the IVA amplifies the vibrations in some cases, i.e., the
amplitude ratio may go above 1. These results are in agreement with the results published
by Roy et al. (1975) and Popplewell and Liao (1991). In addifion, the trends of the curves
are similar to the ones in the aforementioned studies.
The effect of clearance on the displacement rafio is presented in Figure 3.12.
From the four different clearances studied, C3 shows the best performance, followed by
C2 and CI. C4, which is the largest clearance, attains the worst absorption. This is
because of the fact that the clearance in this case is too large for the system to reach
steady state and perform two impacts per cycle motion.
57

Figure 3.13 shows the excitation levels as measured by the control accelerometer
located on the shaker table. It is observed that the system controls the shaker within
desired accuracy limits.
The effect of excitation amplitude on displacement ratio is shown in Figure 3.14.
The excitation amplitude A3 offers the best performance along the frequency range of
interest. The performance with A4 is better than A2 and Al, except for r<0.94. The
excitation amplitude A2 shows better performance than Al. These results suggest that,
for constant clearance, the performance of the system for a certain excitation amplitude
differs along the frequency spectrum, i.e., a different excitation amplitude is most
efficient in different regions. However, it is not possible to change the excitafion
amplitude in real systems where vibration is a problem, i.e., the aim in using absorbers is
to reduce the amplitude; therefore the clearance may be changed to improve performance
in some cases.
Figure 3.15 shows the frequency response plots for upsweep, without the IVA.
For two different excitation amplitudes, the shape of the curve is similar even though the
jump phenomenon (Nayfeh and Mook, 1979) and maximum amplitudes are observed at
different frequencies. The same behaviors are observed for downsweep (Figure 3.16).
The effect of mass ratio is also studied by sweep experiments. For both upsweep
(Figure 3.17) and downsweep (Figure 3.18), IVA efficiency is best around resonance, and
diminishes as excitation frequency moves away from the resonant frequency. As in the
case of dwell experiments, higher mass ratio enables better absorption. For the smallest
mass ratio Ml, the shape of the response curve with the IVA is similar to the shape of the
response curve without the IVA, except that the peak point of the curve has shifted to a
lower frequency. This behavior is similar to the case of tuned-mass absorbers where the
primary mass and the absorber are coupled, and the introduction of the absorber
dislocates the resonant amplitudes (lemura, 1994). A similar peak in response may also
be observed at a higher frequency. In general, the shapes of the response curves are
similar to those presented in previous studies (Masri, 1969; Masri, 1973; Roy et al, 1975;
C\i2MQX]QQetal, 1996)
58

The frequency response plots obtained from dwell and sweep experiments are
presented together in Figure 3.19. This data was obtained for the highest excitation
amplitude A4, and the highest mass ratio M4. Jump phenomenon is observed at different
frequencies for upsweep and downsweep. Also, the dwell data seems to correspond with
the downsweep data. Absorption is observed, and it is seen that the IVA generally keeps
the amplitude of vibration below a certain level, when the impact mass is large enough.
3.3.4 Coherence Measurements
The coherence measurements were done for the same conditions stated above
(Figure 3.20). As stated in Secfion 2.4.2, coherence is a measure of the linear relationship
between two signals, e.g., input and output of a system, and is measured on a scale of 0 to
1. For a vibratory system, the excitation can be considered as the input to the system,
while the response can be considered as the output. For such a system, around resonance,
the response of the system reaches very high amplitudes regardless of the level of
excitation. This causes coherence to drop, since the output of the system is greatly
exaggerated. However, for the same excitation level, the response of the system is
considerably lower as excitation frequency moves away from natural frequency, and
therefore coherence is higher. When the IVA is introduced to the system, since the high
amplitudes of vibration around resonance are absorbed, coherence goes up to
approximately I. Although coherence was first studied to measure the performance of
feedback control, it is shown that it can be used to determine absorption, and possibly
vibration absorber efficiency. Furthermore, comparing Figure 3.19 and Figure 3.20
reveals that the frequencies where coherence is lowest for both upsweep and downsweep
(Figure 3.20) corresponds to the frequencies where the jump phenomenon is observed in
the frequency response curves (Figure 3.19).
3.3.5 Phase Portrait
Figure 3.21 shows the phase portrait of the IVA signal. In this case, all parameters
are kept constant and measurements are taken at two different dwell frequencies. It has
been shown before that the performance of the IVA is highest around resonance, and
59

drops as excitation frequency moves away from the natural frequency of the system. It is
observed from the figure that for the case of efficient absorption (8.98 Hz), the motion of
the IVA is periodic and symmetric, and it has reached steady state. On the other hand,
when the efficiency diminishes, the displacement and velocity of the IVA is higher, and
the mofion is observed to be somehow periodic, but unstable (8.69 Hz). Therefore, the
theoretical resuhs by Masri (1969) have been proven experimentally.
60
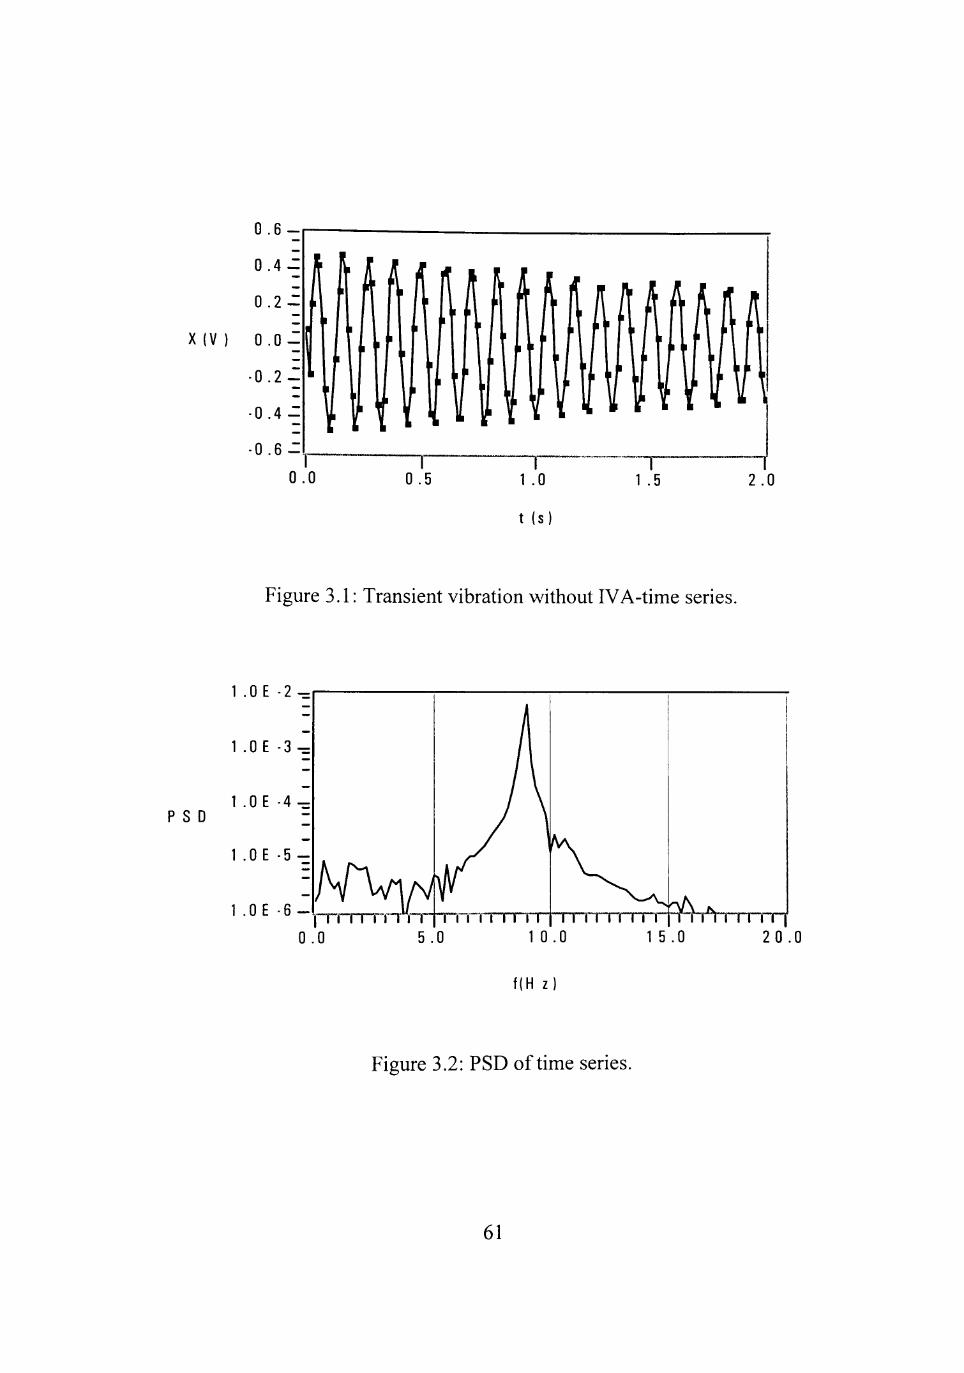
0.6
X ( V )
0 . 6 -
t ( s )
Figure 3.1: Transient vibration without IVA-time series.
1 .OE - 2 ^
P S D
1 .OE -5
1 .OE -6 l~rrmrrT
0 . 0 5 . 0
rVrTTTT-i 1 0 . 0
f(H z)
1 5 . 0 2 0 . 0
Figure 3.2: PSD of time series.
61

0.8 r
0.6 .
0.4 .
0.2 .
•W/O IVA-400
M4C4-400
X(V) 00 .
-0.2
-0.4
-0.6 •
-0.8 0.0 0.5 1.0 1.5 2.0 2.5 3.0
t(s)
Figure 3.3: Decay of transient vibration with and without the IVA
62

X(V)
0.7
0.6 •'
0.5
0.4
0.3
0.2
0.1
0.0
•
X**
. \
"X
\
1
\
y=0,63e"°^^^
y = -0.32x + 0.57
• w/o IVA-400
• M4C2-400
^*^V<^
\ . . . . " * . . • • . • • ; . . • . . • . . . • • • • . . • • • . . • - ' • . . • • • • . . • • . . . . . .
t(s) 8 10 12
Figure 3.4: Exponential and linear decay
63

0.6 r
0.5 -
0.4 •
X(V) 0 3 .
0.2 -
0.1 -
0.0 0.0
y = -0.20x+0.53
y = -0.26x + 0.51
y=-0.29x+0.54
y=-0.32x + 0.57
0.5 1.0
t(S)
• M1C2-400
- M2C2-400
A M3C2-400
M4C2-400
1.5 2.0
Figure 3.5: Efiect of mass ratio on rate of decay
64

0.6
0.5
0.4 't
X(V) 0 3 .
0.2
0.1 -
0.0 L 0.0 0.2 0.4
y = -0.25x+0.45
y = -0.35x + 0.50
y = -0,31x + 0,38
y = -0.40x + 0.49
0.6
t(s)
0.8
M4C1^00
M4C2-400
M4C3-400
X M4C4-400
1.0 1.2
Figure 3.6: Effect of clearance on rate of decay
65

X(V)
0.0 0.2
y = -0.246X + 0.306
y = -0.253X + 0.334
y = -0.342X + 0.542
y = -0.414X + 0.667
• M4C2-256
- M4C2-320
* M4C2-400
. M4C2-500
0.4 0.6 0.8 1.0 1.2 1.4 t(s)
Figure 3.7: Efiect of initial displacement on rate of decay
66

Primary mass*10 Shaker displacement IVA*10
0.1 0.2 0.3 0.4 0.5
t(s)
Figure 3.8: Time series data for A=0.254 mm, d=2.112 mm, ^=0.193, f=9 Hz
67

0.1 0.2 0.3
t(s)
Motion stop 1 Motion stop 2 IVA
0.4 0.5
Figure 3.9: Motion Plot for A=0.254 mm, d=2.112 mm, |a=0.193, 9 Hz
68

4.0 r
X(V) 20
8.70 8.80 8.90 9.00
f(Hz)
^ A 4 w/o IVA *-A4M1C2 ^ A4M2C2 ^A4M3C2 ^ A4M4C2
9.10 9.20 9.30
Figure 3.10: Effect of mass ratio on amplitude
69

10.0 r
8.0 •
6.0 -O
X 4.0 •
2.0 •
0.0
-•-A4M1C2
-»- A4M2C2
-^- A4M3C2
^ ^ A4M4C2
0.96 0.97 0.98 0.99 1.00 1.01 1.02 1.03 1.04
Figure 3.11: Effect of mass ratio on amplitude ratio
70

0.5
0.4
0.3
O
X
0.2
0.1
0.0
•^A4M4C1
^- A4M4C2
-*- A4M4C3
•^ A4M4C4
• • * ^
I I
0.96 0.97 0.98 0.99 1.00
r
1.01 1.02 1.03 1.04
Figure 3.12: Effect of clearance on amplitude ratio
71

2.5 r
2.0 t
1.5
A(V) 1.0
0.5
0.0
8.70
2.5 r
2.0
1.5
A(V) 1.0
0.5
0.0
*
8.80
-^A4M4C1 *-A4M4C2 • A4M4C3 ^ A4M4C4
8.90 9.00
f(Hz) 9.10 9.20 9.30
(a)
_ifc=^ ««r-
• « I B " H K H
• ' i • ' •
-•-A1M4C2 i- A2M4C2 A3M4C2 A4M4C2
8.70 8.80 8.90 9.00 9.10 9.20 9.30
f(Hz)
Figure 3.13: Typical shaker displacements for experiments
(a) Same excitation amplitude, (b) Different excitation amplitudes
72

1.4
1.2 -
1.0 •
P 0.8
I X 0.6
0.4
0.2
0.0
-•-A1M4C2 *-A2M4C2 -^A3M4C2 •^ A4M4C2
0.96 0.97 0.98 0.99 1.00 1.01 1.02 1.03
r
1.04
Figure 3.14: Effect of excitation amplitude on amplitude ratio
73

X(V)
8.7 8.8 8.9 9.0 f(Hz)
9.1
w/o IVA-A4 w/o IVA-A1
9.2 9.3
Figure 3.15: Upsweep without IVA for two amplitudes
74

X(V) 15 .
8.7 8.8 8.9 9.0
f(H2)
9.1
w/o IVA-A1 w/o IVA-A4
9.2 9.3
Figure 3.16: Downsweep without IVA for two amplitudes
75

X(V)
3.5 r
3.0 •
2.5 •
2.0
1.5
1.0 -.
0.5
0.0 8.7 8.8 8.9 9.0
KHz) 9.1
•w/o IVA-A4 OA4M4C2 •A4M3C2 •A4M2C2 •A4M1C2
9.2 9.3
Figure 3.17: Effect of mass ratio on upsweep response
76

3.0 r
2.5 -
2.0
X(V) 15
1.0
0.5
0.0 £ 8.7 8.8 8.9 9.0
f(Hz) 9.1
• w/o IVA-A4
0 A4M4C2
• A4M3C2
• A4M2C2
0 A4M1C2
9.2 9.3
Figure 3.18: Effect of mass ratio on downsweep response
77

3.0 r
2.5
2.0
X(V) 1.5
1.0
0.5
0.0
upsweep without absorber
downsweep without absorber
dwell without absorber
dwell with absorber
8.5 8.6 8.7 8.8 8.9 9.0 f(Hz)
9.1 9.2 9.3 9.4 9.5
Figure 3.19: Frequency response of sweep and dwell data
78

1.0
0.9 .
0.8 •
0.7
8 0.6 c p fe 0.5 o O 0.4
0.3
0.2
0.1
0.0 8.7
^ ^ ^ ' ' ^ ' • i . ^ x ^ ^ -irrr^TrTT^
upsweep without absorber
-•- - downsweep without absorber
— I - — upsweep with absorber
-X - - downsweep with absorber
8.8 8.9 9.0 9.1
f(Hz)
9.2 9.3 9.4
Figure 3.20: Coherence and absorption
79

0.3
0.2
0.1 • • * • •
• • • • •
• •
Z (V) 0 0 1—4
-0.1
-0.2
1 * I ^ • • £ • !
• • • Tfe." •
• • •
•
•
-TiV
-0.3
• 8.69 Hz
• 8.98 Hz •
• ' . - • , • * •
« *•
-0.3 -0.2 -0.1 0.0
z(V)
0.1 0.2 0.3
Figure 3.21: Phase portrait for efficient and inefficient operation
80

CHAPTER 4
CONCLUSIONS AND RECOMMENDATIONS
4.1 Conclusions
It has been shown that for the case without the IVA, the decay in vibration
amplitude is exponential, whereas for the case with the IVA the decay is linear. It is seen
that a higher mass ratio and higher inifial displacement cause faster decay.
The posifion of a single-unit IVA has been measured experimentally for the first
time, and dynamics of the IVA was shown. The effects of mass rafio, clearance, and
excitation amplitude are studied by dwell and sweep experiments. It has been shown that
a higher mass ratio increases the attenuations, and absorption is best around resonance.
The use of coherence to determine absorption and vibration absorber efficiency is
proposed. It has been confirmed experimentally for the first time that periodic, symmetric
and steady state motion of the IVA enables efficient absorption, while the efficiency
diminishes when the motion is unstable.
4.2 Recommendations
The effect of clearance ratio on system performance may be studied by combining
the clearance and excitation amplitude parameters into a single parameter. The
experimental data obtained from IVA position and coherence measurements may be used
to design and build a feedback-controlled IVA with varying clearance. An IVA
consisting of a hollow outer casing filled partially with a high-density fluid such as
mercury, the impact-sloshing vibration absorber, can be designed and built. The
performance of the abovementioned IVA can be compared with the single-unit IVA.
81

J
REFERENCES
Araki^ Y., Jinnouchi, Y., Inoue, J., and Yokomichi, I., "Indicial Response of Impact Damper With Granular Material," ASME Pressure Vessels and Piping Division (Publication) PVP Seismic Engineering-1989: Design, Analysis, Testing and Qualification Methods, pp. 73-79, 1989.
Babitsky, V. I., Theory of Vibro-Impact Systems and Applications, Springer, Berlin, 1998.
Bailey, T., and Semercigil, S. E., "A Passive Controller For Flexible L-Structures," Journal of Sound and Vibration, Vol. 173, pp. 131-136, 1994.
' Bapat, C. N., "The General Motion of an Inclined Impact Damper With Friction," Journal of Sound and Vibration, Vol, 184, pp, 417-427, 1995.
^ Bapat, C, N., and Sankar, S., "Single Unit Impact Damper In Free and Forced Vibration," Journal of Sound and Vibration, Vol. 99, pp. 85-94, 1985,
Bendat, J. S., and Piersol, A. G., Random Data, Wiley, New York, 1986.
^Cao, S., and Semercigil, S. E., "A Semi-Acfive Controller For Excessive Transient Vibrafions of Light Structures," Journal of Sound and Vibration, Vol. 178, pp. 145-161, 1994.
^Chalmers, R., and Semercigil, S. E., "Impact Damping the Second Mode of a CantilevQrQdBQam,'' Journal of Sound and Vibration, Yo\. 146, pp. 157-161, 1991.
Chapra, S. C , and Canale, R. P., Numerical Methods for Engineers, McGraw, Boston, 1998.
Jchatterjee, S., Mallik, A. K., and Ghosh, A., "Impact Dampers For Controlling Self-Excited Oscillations," Journal of Sound and Vibration, Vol, 193, pp. 1003-1014, 1996.
Chen, L. A., and Semercigil, S. E,, "A Beam-Like Damper for Attenuating Transient Vibrations of Light Structures," Journal of Sound and Vibration, Vol, 164, pp. 53-65,1993.
Jcollette, F. S,, "A Combined Tuned Absorber and Pendulum Impact Damper Under Random Excitafion," Jowr^fl/ of Sound and Vibration, Vol. 216, pp. 199-213, 1998.
Collette, F, S., and Semercigil, S. E., "Response of a Light Secondary System With a Modified Tuned Absorber To Transient Excitation," Proceedings of the 16th International Modal Analysis Conference, pp. 595-601, 1998,
82

Collette, F,, Huynh, D., and Semercigil, S. E., "Further Results With Tuned Absorber-Impact Damper Combination," Proceedings of the 17th International Modal Analysis Conference, San Antonio, TX, February 2000.
Crandall, S. H., "The Role of Damping In Vibrafion Theory," Journal of Sound and Vibration, Vol. 11, pp. 3-18, 1970.
Crossley, F. R. E., "The Forced Oscillafion of the Centrifugal Pendulum With Wide Angles," Transactions of the ASME - Journal of Applied Mechanics, pp. 41-47, 1953.
^'Cuvalci, O., and Ertas, A., "Pendulum as Vibrafion Absorber for Flexible Structures: Experiment and Theory," Journal of Vibration and Acoustics, Vol. 118, pp. 558-566, 1996.
Data Physics Corporation, DP550Win Vibration Controller, San Jose, CA, 1999.
>^l-Sayad, M, A., Hanna, S. N., and Ibrahim, R. A., "Parametric Excitafion of Nonlinear Elastic Systems Involving Hydrodynamic Sloshing Impact," Nonlinear Dynamics, Vol. 18,pp, 25-50, 1999,
>^ma, S., and Marui, E., "A Fundamental Study on Impact Dampers," International Journal of Machine and Tools and Manufacture, Vol. 34, pp. 407-421, 1994.
J *'Ema, S., and Marui, E., "Damping Characteristics of an Impact Damper," International
Journal of Machine and Tools and Manufacture, Vol. 36, pp. 293-306, 1995.
Ertas, A., and Mustafa, G., "Real-Time Response of the Simple Pendulum: An Experimental Technique," Experimental Techniques, Vol. 16, pp, 33-35, 1992.
Frahm, H., Device for Damping Vibrations of Bodies, US Patent No. 989958, 1909.
Fuse, T,, "Prevention of Resonances By Impact Damper," ASME Pressure Vessels and Piping Division (Publication) PVP Seismic Engineering-1989: Design, Analysis, Testing, and Qualification Methods,'p'g. 57-66, 1989.
Grubin, C , "On the Theory of the Accelerafion Damper," Transactions of the ASME-Journal of Applied Mechanics, Vol. 23, pp. 373-378, 1956.
Hoang, P., and Semercigil, S. E., "A Passive Controller For The Flexible Robot Arm," Proceedings of the 1992 Engineering Systems Design and Analysis Conference-ASME, pp. 197-202,1992.
>Jlbrahim, R. A., Evans, M., and Yoon, Y. J., "Experimental Invesfigafion of Random Excitation of Nonlinear Systems With Autoparametric Coupling," Structural Safety, Vol. 6, pp. 161-176, 1989.
83

Ibrahim, R. A., and Sullivan, D. G., "Experimental Invesfigation of Structural Linear and Autoparametric Interactions Under Random Excitation," AIAA Journal, Vol. 28, pp. 338-344, 1990,
lemura, H., "Principles of TMD and TLD-Basic Principles and Design Procedure", Passive and Active Structural Vibration Control in Civil Engineering, Ed. Soong, T. T,, and Costantinou, M, C, Springer, New York, 1994.
Jo, I., Kaneko, T., Nagatsu, S., Takahashi, C, and Kimura, M., "Development of Highway Light Pole woth Resistance to Wind Vortex-Induced Oscillations," Kawasaki Steel Technical Report, No. 21, pp. 86-94, 1989.
Kato, M,, Dazai, M., and Takase, H., "Study on Impact Damper Having a Spring-supported Additional Mass," Transactions of the Japanese Society of Mechanical Engineers, Vol 19, pp, 103-109, 1976.
Korenev, B. G,, and Reznikov, L. M., Dynamic Vibration Absorbers, Wiley, West Sussex, England, 1993.
^'Koss, L. L., and Melbourne, W. H., "Chain Dampers for Control of Wind-Induced Vibration of Tower and Mast Structures," Engineering Structures, Vol, 17, pp. 622-625,1995.
Masri, S. F,, "Analytical and Experimental Studies of Multiple-Unit Impact Dampers," The Journal of the Acoustical Society of America, Vol. 45, pp. 1111-1117, 1968.
Masri, S. F., "General Motion of Impact Dampers," The Journal of the Acoustical Society of America, Vol. 47, pp. 229-237, 1969.
Masri, S. F., "Steady-State Response of a Mulfidegree System With an Impact Damper," Transactions of the ASME-Journal of Applied Mechanics, Vol. 40, pp, 127-132, 1973.
Masri, S. F,, and Caughey, T. K., "On the Stability of the Impact Damper," Transactions of the ASME-Journal of Applied Mechanics, Vol. 88, pp. 586-592, 1966,
Masri, S. F., and Ibrahim, A. M., "Response of the Impact Damper to Stationary Random Excitation," The Journal of the Acoustical Society of America, Vol. 53, pp. 200-211, 1973.
Masri, S. F., Miller, R. K,, Dehghanyar, T, J., and Caughey, T, K., "Active Parameter Control of Nonlinear Vibrating Structures," Transactions of the ASME-Journal of Applied Mechanics, Vol. 56, pp. 658-666, 1989.
Mead, D. J., Passive Vibration Control, Wiley, West Sussex, England, 1998.
84

/
Modi, V. J,, and Seto, M. L., "Passive Control of Flow-Induced Oscillations Using Rectangular Nutation Dampers," Journal of Vibration and Control, Vol, 4, pp. 381-404,1998. ' 'Fi^
L Moore, J. J., Palazzolo, A. B., and Gadangi, R., "A Forced Response Analysis and
Application of Impact Dampers to Rotordynamic Vibration Supression in a Cryogenic Environment," Journal of Vibration and Acoustics, Vol. 117, pp. 300-310, 1995.
^Moore, L J., Palazzolo, A, B., Gadangi, R. K„ Kascak, A. F,, Brown, G., and Motague, G., "Hybrid Friction-Impact Vibration Damper for Cryogenic Rotating Machinery," Journal of Propulsion and Power, Vol. 13, pp. 495-501, 1997.
Mustafa, G., and Ertas, A., "Experimental Evidence of Quasiperiodicity and Its Breakdown I the Column-Pendulum Oscillator," Journal of Dynamic Systems, Measurement and Control, Vol. 117, pp. 218-225, 1995.
Nayfeh, A. H,, and Mook, D. T., Nonlinear Oscillations, Wiley, New York, 1979,
^Ogawa, K., Ide, T., and Saitou, T., "Application of Impact Mass Damper to a Cable-Stayed Bridge Pylon," Journal of Wind Engineering and Industrial Aerodynamics, Vol72, pp. 301-312, 1997.
•<)gawa, K., Sakai, Y., and Sakai, F., "Control of Wind-Induced Vibrations Using an Impact Mass Damper," Journal of Wind Engineering and Industrial Aerodynamics Proceedings of the 8th International Conference on Wind Engineering, Part 3 Vol. 43, pp, 1881-1882, 1992,
Oledzki, A, A., Siwicki, I., and Wisniewski, J., "Impact Dampers In Application For Tube, Rod And Rope Structures," Mechanism and Machine Theory, Vol. 34, pp. 243-253, 1999.
Paget, A. L., "Vibration In Steam-Turbine Buckets and Damping by Impact," Engineering, Vol, 143, pp. 305-307, 1937.
Jpapalou, A. and Masri, S. F,, "An Experimental Investigation of Particle Dampers Under Harmonic Excitation,'' Journal of Vibration and Control, Vol, 4, pp. 361-179, 1998.
Penalba, C , "Vibration Control in Lattice Communication Towers," Proceedings of the 1999 Structures Congress, pp. 983-986, 1999.
Piersol, A. G., "Data Analysis," Noise and Vibration Control Engineering: Principles and Applications, Ed. Beranek, L. L., and Ver, I. L., Wiley, New York, 1992.
J Popplewell, N. and Liao, M., "A Simple Design Procedure For Optimum Impact Dampers;' Journal of Sound and Vibration, Vol 146, pp. 519-526, 1991.
85

Popplewell, N„ and Semercigil, S, E., "Performance of the Bean Bag Impact Damper for a Sinusoidal External Force," Journal of Sound and Vibration, Vol. 133, pp, 193-223, 1989, ' ' t t
Popplewell, N., Bapat, C. N„ and McLachlan, K„ "Stable Periodic Vibroimpacts of an Oscillator," Journal of Sound and Vibration, Vol. 87, pp. 41-59, 1983.
Rao. S. S., Mechanical Vibrations, Addison-Wesley, Reading, MA, 1995.
Reed, W. H.., "Hanging Chain Impact Dampers; A Simple Method of Damping Tall Flexible Structures," Proceedings of the International Research Seminar; Wind Effects on Buildings and Structures, 1967, Ottawa, Vol.2, pp. 283-321.
Roy, R. K., Rocke, R, D., and Foster, J. E., "The Application of Impact Dampers to Continuous Systems," Transactions of the ASME-Journal of Engineering for Industry, Vol. 97, pp. 1317-1324, 1975.
Semercigil, S. E., and Popplewell, N., "Impact Damping of Random Vibrations," Journal of Sound and Vibration, Vol 121, pp. 178-184, 1988.
Sevin, E., "On the Parametric Excitation of Pendulum-Type Vibration Absorber," Transactions of the ASME - Journal of Applied Mechanics, Vol. 28, pp. 330-334, 1961.
Skipor, E. and Bain, L. J., "Application of Impact Damping to Rotary Printing Equipment," Transactions of the ASME-Journal of Mechanical Design, Vol. 102, pp. 338-343, 1980.
Steinberg, D, S., "Snubbers Calm PCB Vibration," Machine Design, Vol, 49, pp 71-73, 1977.
Thomas, M. D., Knight, W. A., and Sadek, M. M., "The Impact Damper as a Method of Improving Cantilever Boring Bars," Transactions of the ASME-Journal of Engineering for Industry, Vol. 97, pp. 859-866, 1975.
Ungar, E. E., "Structural Damping," Noise and Vibration Control Engineering: Principles and Applications, Ed. Beranek, L. L,, and Ver, I, L., Wiley, New York, 1992.
Ungar, E. E,, "Vibration Isolation," Noise and Vibration Control Engineering: Principles and Applications, Ed. Beranek, L, L., and Ver, I. L., Wiley, New York, 1992.
^Ving, Z., and Semercigil, S. E., "Response of a New Tuned Vibration Absorber to an Earthquake-like Random Excitation," Journal of Sound and Vibration, Vol. 150, pp. 520-530, 1991.
86

Yokomichi, I., Araki, Y., Jinnouchi, Y., and Inoue, J., "Impact Damper With Granular Materials for Multibody System," Transactions of the ASME-Journal of Pressure Vessel Technology, Vol. 118, pp. 95-103, 1996.
87

APPENDIX A
TABLE OF EXPERIMENTS Table A. I
EX
PE
RIM
EN
T
1
2 3 4 5 6 7 8 9 10
11
12
13 14
15
16 17
18
19
20
21
22
23
24
25 26
27
28
29
30
MASS
Impact
Mas
s M
2 (k
g)
0.000
0.000
0.000
0.000
0.000 0.000
0.000
0.000
0.000
0.000
0.000
0.000
0.000
0.000
0.000
0.000
0.000
0.000
0.000
0.000
0.000
0.000
0.000
0.000
0.000
0.000
0.000
0.000
0.000
0.000
Mas
s R
atio
n
M2/
M1
0.000
0,000 0.000 0.000 0,000 0.000 0,000 0,000 0.000 0.000 0.000 0.000 0.000 0,000 0,000
0.000 0.000
0.000 0.000
0.000 0.000 0.000 0.000 0.000 0,000 0.000
0.000 0.000
0.000
0,000
FREQUENCY E
xc.
Fre
q.
(Sta
rt F
req.
) W
1 (H
z)
-
8.700
8.800
8.900
9.000
9.050
9.080
9.090
9.100
9.110
9.150
9.220
9.300
8.700
9.300
8.700
8.800
8.900
9.000
9.050
9.080
9.090
9.100
9.110
9.150
9.220
9.300
8.700
9.300
End
Fre
quency
W
2 (H
z)
9.300
8.700
9.300
8.700
Fre
quency
R
atio
r1
-
0,967 0,978 0.989 1.000 1,006 1.009 1,010 1,011 1.012 1.017 1,024 1,033
-
0,967 0,978 0.989 1,000 1.006 1,009 1,010 1,011 1,012 1.017 1.024 1,033
-
-
EXCITATION and CLEARANCE
Exc
itatio
n
Am
pI,
A (
mm
)
-
0.127
0.127
0.127
0.127
0.127 0.127
0.127
0.127 0.127
0.127
0.127
0.127 0.127 0.127
-
0.160
0.160
0.160
0.160
0.160
0.160
0.160
0.160 0.160 0.160
0.160
0.160
0.160
0.160
Initi
al D
ispl.
X1
(mic
str)
256
320
Wall-
to-W
all
Gap
(m
m)
Cle
ara
nce
d
(m
m)
-
-
-
-
-
-
-
-
-
-
-
-
-
-
-
-
-
-
-
Cle
ara
nce
R
atio
d/
A
-
-
-
-
-
-
-
-
-
-
-
-
-
-
-
-
-
-
-
-
-
-
-
-
-
•i- r
y ^/-i - ^
^ Lx2/\'I0
88

Table A. 1 Continued
EX
PE
RIM
EN
T
31
32
33
34
3b 36 37 38 39
40
41
42
43 44
45
46 47
48
49
50
51
52
53
54 55
56 57
58
59
60
MASS
Impact
Mas
s M
2 (k
g)
0.000
0.000
0.000
0.000
0.000
0.000 0.000
0.000
0.000
0.000
0.000
0.000
0.000 0.000
0.000
0.000
0.000
0.000
0.000
0.000
0.000
0.000
0.000
0.000
0.000
0.000
0.000
0.000
0.000
0.000
Mas
s R
atio
n
M2/
M1
0.000
0,000
0,000 0.000 0.000 0,000 0.000 0.000 0.000 0,000 0,000 0.000 0.000 0.000
0.000
0.000 0.000 0.000 0.000 0.000
0.000 0.000 0,000 0.000 0.000 0.000 0,000
0.000 0.000
0.000
FREQUENCY
Exc
. F
req.
(S
tart
Fre
q.)
W1
(Hz)
-
8.700
8.800
8.900
9.000
9.050
9.080
9.090
9.100
9.110
9.150
9.220
9.300 8.700
9.300
8.700
8.800
8.900
9.000
9.050
9.080
9.090
9.100
9.110
9.150
9.220
9.300
8.700
9.300
End
Fre
quency
W
2 (H
z)
9.300
8.700
9.300
8.700
Fre
quency
R
atio
r1
-
0,967
0,978 0.989 1.000 1,006 1.009 1.010 1.011 1.012 1.017 1.024 1.033
-
0.967 0.978 0,989 1.000 1.006 1.009 1.010 1,011 1,012 1,017
1.024 1.033 -
-
EXCITATION and CLEARANCE
Exc
itatio
n
Am
pI,
A (
mm
)
0.202
0.202 0.202
0.202 0.202 0.202
0.202
0.202
0.202
0.202
0.202
0.202 0.202
0.202
-
0.254 0.254
0.254
0.254
0.254
0.254
0.254
0.254
0.254
0.254
0.254
0.254 0.254
0.254
Initi
al D
ispl,
X1
(mic
str)
400
500
Wall-
to-W
all
Gap
(m
m)
Cle
ara
nce
d (
mm
)
-
-
-
-
-
-
-
-
-
-
-
-
-
-
-
-
-
-
-
-
-
-
-
-
-
-
-
Cle
ara
nce
R
atio
d/
A
-
-
-
-
-
-
-
-
-
-
-
-
-
-
-
-
-
-
-
-
-
-
-
-
89

Table A. 1 Continued
EX
PE
RIM
EN
T
61
62
63
64
65
66
67
68
69
70
71
72
73
74
75
76
77
78
79
80
81
82
83
84
85
86
87
88
89
90
MASS
Impa
ct M
ass
M2
(kg)
0.370
0.370
0.370
0.370
0.370
0.370
0.370
0.370
0.370
0.370
0.370
0.370
0.370 0.370
0.370
0.370
0.370
0.370
0.370
0.370
0.370
0.370
0.370
0.370
0.370
0.370
0.370
0.370
0.370
0.370
Mas
s R
atio
n
M2/
M1
0.193
0.193 0,193 0.193 0,193 0.193 0.193
0,193 0.193 0,193 0.193 0.193 0,193 0.193 0.193
0.193 0.193 0,193 0.193 0.193 0.193 0,193 0.193 0.193 0.193
0.193
0,193
0.193
0,193 0,193
FREQUENCY
Exc
. F
req.
(S
tart
Fre
q.)
W1
(Hz)
-
8.700
8.800
8.900
9.000
9.050
9.080
9.090
9.100
9.110
9.150
9.220
9.300
8.700
9.300
8.700
8.800
8.900
9.000
9.050
9.080
9.090
9.100
9.110
9.150
9.220
9.300
8.700
9.300
End
Fre
quency
W
2 (H
z)
9.300
8.700
9.300
8.700
Fre
quen
cy
Rat
io
r1
-
0,967 0.978 0,989 1.000 1.006 1.009 1.010 1.011 1.012 1.017 1.024 1.033
-
0.967 0.978 0.989 1,000 1,006 1.009 1.010 1.011 1.012 1,017 1.024
1.033
-
-
EXCITATION and CLEARANCE
Exc
itatio
n
Am
pI.
A (
mm
)
-
0.127 0.127
0.127
0.127
0.127
0.127
0.127
0.127
0.127 0.127
0.127 0.127 0.127
0.127
-
0.160
0.160
0.160
0.160
0.160
0.160 0.160
0.160
0.160
0.160
0.160
0.160
0.160
0.160
Initi
al D
ispl.
XI
(mic
str)
256
320
Wall-
to-W
all
Gap
(m
m)
40.640 40.640
40.640
40.640 40.640
40.640
40.640
40.640
40.640
40.640 40.640 40.640
40.640 40.640 40.640
40.640
40.640 40.640
40.640
40.640
40.640
40.640
40.640
40.640
40.640 40.640
40.640
40.640
40.640
40.640
Cle
ara
nce
d
(m
m)
3.252 3.252 3.252 3.252 3.252 3,252 3,252 3,252 3.252 3.252 3.252 3.252 3.252
3.252
3.252 3.252 3.252 3.252 3.252 3,252 3.252 3,252 3.252 3.252 3.252
3.252 3.252
3,252
Cle
aran
ce
Rat
io
d/A
25.606 25,606 25.606 25.606 25.606 25,606 25.606 25.606 25.606 25.606 25.606
25.606 25.606 25.606
20.325 20,325 20.325 20.325 20.325 20,325 20.325 20.325 20.325 20.325 20.325
20.325 20.325
20.325
4/UW:
90
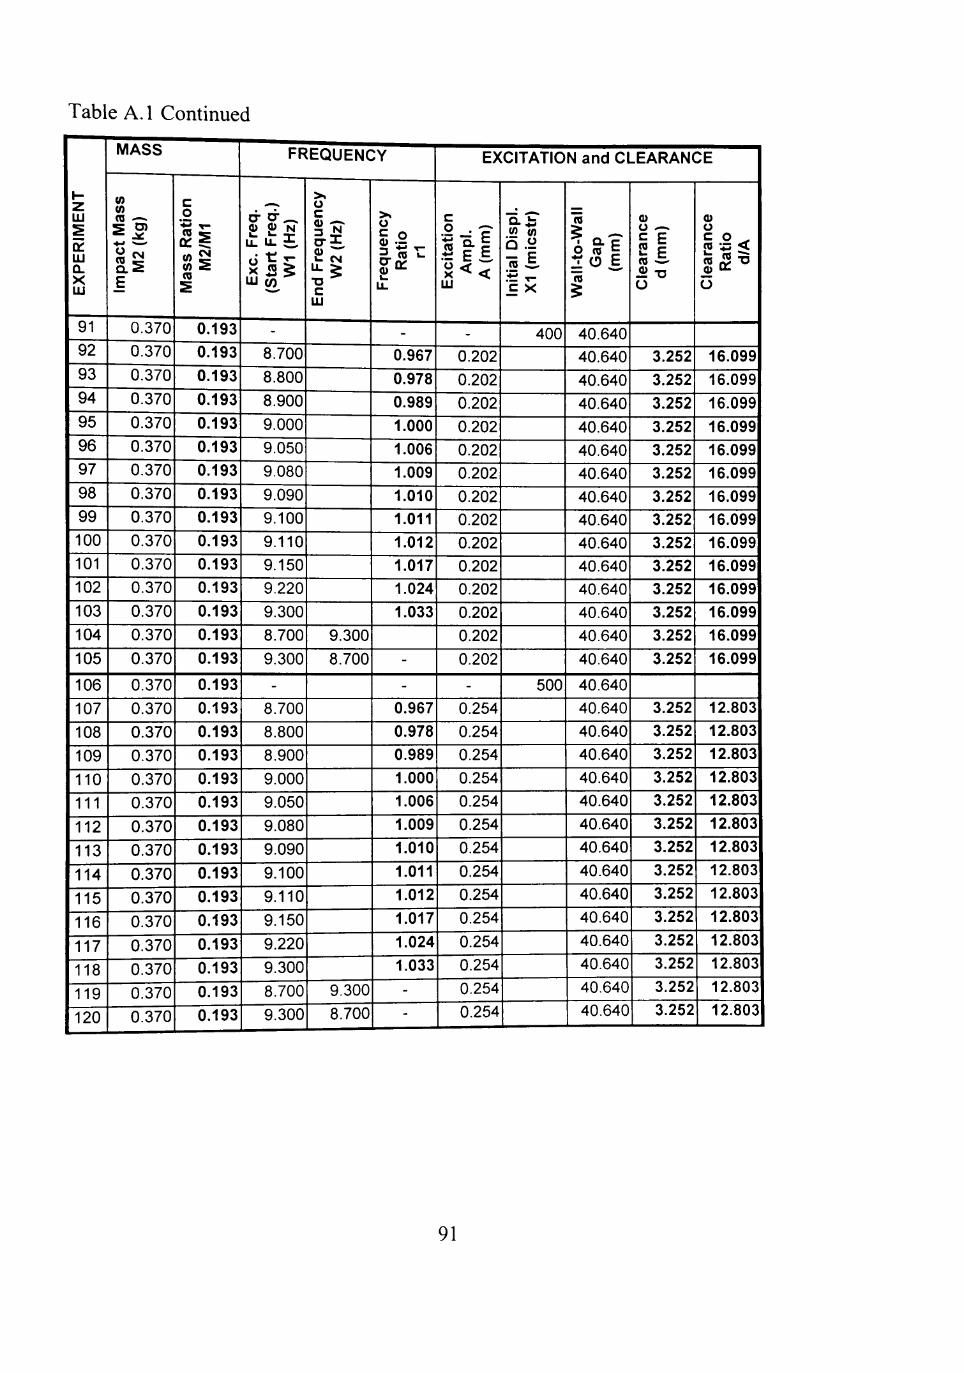
Table A. 1 Continued
EX
PE
RIM
EN
T
91
92
93
94
95 96 97
98 99 100
101
102
103
104
105
106
107
108
109
110
111
112
113
114
115
116
117
118
119
120
MASS
Impact
Mass
M
2 (k
g)
0.370
0.370
0.370
0.370
0.370 0.370
0.370
0.370
0.370
0.370
0.370
0.370
0.370
0.370
0.370
0.370
0.370
0.370
0.370
0.370
0.370
0.370
0.370
0.370
0.370
0.370
0.370
0.370
0.370
0.370
Mas
s R
atio
n
M2/
M1
0.193
0.193 0.193 0.193 0.193 0.193 0.193 0.193 0.193 0.193 0,193 0.193 0.193 0.193 0.193
0.193 0.193 0.193 0.193 0.193 0.193 0.193 0.193
0.193 0.193 0.193
0.193 0.193 0.193 0.193
FREQUENCY
Exc
. F
req,
(S
tart
Fre
q.)
W1
(Hz)
-
8.700
8.800
8.900
9.000
9.050
9.080
9.090
9.100
9.110
9.150 9.220
9.300
8.700
9.300
-
8.700
8.800
8.900
9.000
9.050
9.080
9.090
9.100
9.110
9.150
9.220
9.300
8.700
9.300
End
Fre
quency
W
2 (H
z)
9.300
8.700
9.300
8.700
Fre
quency
R
atio
r1
-
0,967 0.978 0,989 1.000 1,006 1.009 1.010 1.011 1.012 1.017 1.024 1.033
-
-
0,967 0.978 0.989 1.000 1.006 1.009 1.010 1.011 1.012 1.017 1.024 1.033 -
-
EXCITATION and CLEARANCE
Exc
itatio
n
Am
pI.
A (m
m)
-
0.202
0.202
0.202
0.202
0.202
0.202
0.202 0.202
0.202 0.202
0.202
0.202 0.202
0.202
-
0.254 0.254
0.254
0.254 0.254
0.254 0.254
0.254
0.254
0.254
0.254
0.254
0.254
Initi
al D
ispl.
X1
(mic
str)
400
500
0.254
Wall-
to-W
all
Gap
(m
m)
40.640 40.640
40.640
40.640
40.640
40.640 40.640
40.640 40.640
40.640 40.640 40.640
40.640
40.640
40.640
40.640 40.640
40.640
40.640 40.640
40.640
40.640 40.640
40.640
40.640
40.640
40.640
40.640
40.640
40.640
Cle
ara
nce
d
(mm
)
3.252 3.252 3.252 3.252 3.252 3.252 3,252 3,252 3.252 3.252 3.252 3.252 3,252 3,252
3.252 3.252 3.252 3.252 3.252
3.252 3.252
3,252 3,252 3,252 3.252 3.252 3.252 3.252
Cle
ara
nce
R
atio
d/
A
16.099 16,099 16.099 16,099 16.099 16.099 16.099 16.099 16.099 16.099 16.099 16.099 16.099 16.099
12.803 12.803 12,803 12,803 12.803
12.803 12.803
12.803 12.803 12.803 12.803 12.803 12.803 12.803
91

Table A. 1 Continued
EX
PE
RIM
EN
T
213
121
122
123
124
12b
126
127
128
129
130
131
132
133 134
135
136
137
138
139
140
141
142
143
144
145
146
147
148
149
MASS
Impa
ct M
ass
M2
(kg)
0.278
0.278
0.278
0.278
0.278
0.278
0.278
0.278
0.278
0.278
0.278
0.278
0.278
0.278 0.278
0.184
0.184
0.184
0.184
0.184
0.184
0.184
0.184
0.184
0.184
0.184
0.184
0.184
0.184
0.184
Mas
s R
atio
n
M2/
M1
0.145
0.145
0.145 0.145 0.145 0.145 0.145 0.145 0.145 0.145 0.145 0.145
0.145
0.145 0.145
0.096 0,096 0,096 0.096 0.096
0.096 0.096 0.096
0,096 0.096 0.096 0.096 0.096 0.096
0,096
FREQUENCY
Exc
, F
req.
(S
tart
Fre
q.)
W1
(Hz)
-
8.700
8.800
8.900
9.000
9.050
9.080
9.090
9.100
9.110
9.150
9.220
9.300
8.700
9.300
-
8.700
8.800
8.900
9.000
9.050
9.080
9.090
9.100
9.110
9.150
9.220
9.300
8.700
9.300
End
Fre
quen
cy
W2
(Hz)
9.300
8.700
9.300
8.700
Fre
quen
cy
Rat
io
r1
-
0.967
0.978 0.989 1.000 1.006 1.009 1.010 1.011 1.012 1.017 1,024
1.033
-
-
0,967 0.978 0.989 1.000 1.006 1,009 1,010
1,011 1.012 1.017 1.024 1.033 -
-
EXCITATION and CLEARANCE
Exc
itatio
n
Am
pI.
A (
mm
)
-
0.254
0.254
0.254
0.254 0.254
0.254
0.254 0.254
0.254
0.254
0.254
0.254
0.254
0.254
-
0.254 0.254 0.254
0.254
0.254
0.254
0.254
0.254
0.254
0.254 0.254
0.254
0.254
0.254
Initi
al D
ispl.
XI
(mic
str)
400
400
Wall-
to-W
all
Gap
(m
m)
40.640
40.640
40.640
40.640
40.640
40.640 40.640
40.640 40.640
40.640 40.640
40.640
40.640
40.640
40.640
40.640 40.640 40.640
40.640
40.640 40.640
40.640
40.640
40.640
40.640
40.640 40.640
40.640
40.640
40.640
Cle
ara
nce
d (
mm
)
3.252 3.252 3.252 3.252 3.252 3.252 3.252 3.252 3.252 3.252 3.252 3.252 3.252 3,252
3,252 3,252 3.252 3.252 3,252 3,252 3.252 3.252 3,252 3,252 3.252 3,252
3,252 3.252
Cle
aran
ce
Rat
io
d/A
12,803 12,803 12.803 12,803 12.803 12,803 12,803 12,803 12.803 12.803 12.803 12.803 12,803 12,803
12.803 12,803 12.803 12.803 12.803 12.803 12,803
12.803 12.803 12.803 12.803 12.803
12.803 12,803
^NX^f^i^ 1
92

Tabl
EX
PE
RIM
EN
T
IbO
1b1
1b2
1b3
154 155
156
157
158
159
160
161
162
163
164
165
166
167
168
169
170
171
172
173
174
175
176
177
178
179
180
e A. 1 Continue
MASS
Impa
ct M
ass
M2
(kg)
0.086
0.086
0.086
0.086
0.086 0.086
0.086
0.086
0.086
0.086
0.086
0.086
0.086
0.086
0.086
0.086
0.370
0.370
0.370
0.370
0.370
0.370
0.370
0.370
0.370
0.370
0.370
0.370
0.370
0.370
0.370
Mas
s R
atio
n
M2/
M1
0,045
0,045 0.045 0.045 0.045 0.045 0.045 0,045 0.045 0.045 0.045 0.045 0.045 0.045 0.045
0.045 0.193 0.193 0.193
0.193 0.193 0.193 0.193
0.193 0.193 0.193
0.193 0.193
0.193
0.193 0.193
d
FREQUENCY
Exc
. F
req.
(S
tart
Fre
q.)
W1
(Hz)
-
8.700
8.800
8.900
9.000
9.050
9.080
9.090
9.100
9.110
9.150
9.220
9.300 8.700
9.300
-
8.700
8.800
8.900
9.000
9.050
9.080
9.090
9.100
9.110
9.150
9.220
9.300
8.700
9.300
End
Fre
quen
cy
W2
(Hz)
9.300
8.700
9.300
8.700
Fre
quen
cy
Rat
io
r1
0.967 0.978 0.989 1.000 1,006 1,009 1,010 1.011 1.012 1.017 1.024 1.033 -
-
-
-
0.967 0.978 0.989 1.000 1.006 1.009 1.010 1.011 1.012 1.017 1.024
1.033
-
EXCITATION and CLEARANCE
Exc
itatio
n
Am
pI,
A (
mm
)
-
0.254
0.254
0.254 0.254 0.254
0.254
0.254
0.254
0.254
0.254
0.254
0.254 0.254
0.254
-
-
0.254
0.254
0.254 0.254
0.254
0.254
0.254
0.254 0.254
0.254
0.254
0.254
0.254
0.254
Initi
al D
ispl,
XI
(mic
str)
400
400 400
Wall-
to-W
all
Gap
(m
m)
40.640 40.640
40.640
40.640 40.640 40.640
40.640
40.640 40.640
40.640 40.640
40.640
40.640 40.640
40.640
39.500 39.500 39.500
39.500
39.500
39.500
39.500
39.500 39.500
39.500 39.500
39.500
39.500
39.500
39.500
39.500
Cle
ara
nce
d (
mm
)
3,252 3,252 3.252 3.252 3.252 3.252 3.252 3.252 3.252 3.252 3.252 3.252 3.252 3.252
2.112 2.112 2,112 2,112 2.112
2,112 2.112 2,112 2,112 2.112 2,112 2.112 2.112
2.112
Cle
aran
ce
Rat
io
d/A
12,803 12.803 12.803 12.803 12.803 12.803 12.803 12.803 12.803 12.803 12.803 12.803 12.803 12.803
8.315 8.315 8.315 8.315 8.315
8.315 8.315 8.315 8.315 8.315 8.315 8.315 8.315
8.315
WK^AK3 r
93

Table A. 1 Continued
EX
PE
RIM
EN
T
181
182
183
184
18b
186
187
188
189
190
191 192
193 194
195
196
197
198
199
200
201
202
203
204
205
206
207
208
209
210
211 212
MASS
Impact
Mas
s M
2 (k
g)
0.086
0.370
0.370
0.370
0.370
0.370
0.370
0.370
0.370
0.370
0.370 0.370
0.370
0.370
0.370
0.370
0.086
0.370
0.370
0.370
0.370
0.370
0.370
0.370
0.370
0.370
0.370
0.370
0.370
0.370
0.370
0.370
Mas
s R
atio
n
M2/
M1
0.045 0.193 0.193 0.193 0.193 0.193 0.193 0.193 0.193 0.193 0.193 0.193 0.193 0.193 0.193 0.193
0.045 0.193
0.193 0.193 0.193 0.193 0.193 0.193 0.193 0.193
0.193 0.193
0.193 0.193
0.193 0.193
FREQUENCY
Exc
. F
req.
(S
tart
Fre
q.)
W1
(Hz)
-
-
8.700
8.800
8.900
9.000
9.050
9.080
9.090
9.100
9.110
9.150
9.220 9.300
8.700
9.300
-
8.700
8.800
8.900
9.000
9.050
9.080
9.090
9.100
9.110
9.150
9.220
9.300
8.700
9.300
End
Fre
quency
W
2 (H
z)
9.300
8.700
9.300
8.700
Fre
quency
R
atio
r1
-
-
0.967 0.978 0.989 1.000 1.006 1.009 1.010 1.011 1.012 1.017 1.024 1.033
-
0,967
0.978 0.989 1.000 1.006 1.009 1.010 1.011 1.012 1.017
1.024 1.033 -
-
EXCITATION and CLEARANCE
Exc
itatio
n
Am
pI.
A (
mm
)
-
0.254
0.254
0.254
0.254
0.254
0.254
0.254
0.254
0.254 0.254 0.254 0.254 0.254
0.254
-
-
0.254
0.254
0.254 0.254
0.254
0.254
0.254
0.254
0.254
0.254
0.254
0.254
0.254
0.254
Initi
al
Dis
pl.
XI
(mic
str)
400 400
400
400
Wall-
to-W
all
Gap
(m
m)
42.300 42.300 42.300
42.300
42.300
42.300
42.300
42.300
42.300
42.300 42.300 42.300 42.300 42.300
42.300 42.300
41.500 41.500
41.500
41.500 41.500
41.500
41.500
41.500
41.500 41.500
41.500
41.500
41.500
41.500
41.500
41.500
Cle
ara
nce
d
(m
m)
4.912 4.912 4.912 4.912 4.912 4.912 4.912 4.912 4.912 4.912 4.912 4.912 4.912 4.912
4.112 4.112 4.112 4,112 4.112 4.112 4.112 4.112
4.112 4.112
4.112 4.112 4.112 4.112
Cle
ara
nce
R
atio
d/
A
19.339 19.339 19.339 19.339 19.339 19.339 19.339 19.339 19.339 19.339 19,339 19.339 19.339 19.339
16.189 16.189 16.189 16.189 16.189 16.189 16.189 16.189
16.189 16.189
16.189 16.189 16.189 16.189
Ml is the primary mass. M2 is the IVA mass. M2/M1 is the mass ratio. Wl and
W2 are the starting and ending frequencies for frequency sweep experiments. For dwells.
Wl is the excitation frequency and W2 is not defined, rl is the frequency ratio for dwell
94

experiments, corresponding to Wl. Amplitude A is the zero-to-peak excitation amplitude
for forced vibration experiments. A is not defined for free vibration, instead, XI is
defined as the initial excitation. XI is measured in microstrains, using the strain gage, d is
the free clearance between the walls, in which the IVA can move. It is found by
subtracting the IVA diameter from the wall gap. d/A is the non-dimensional clearance,
clerance divided by excitation amplitude A. This quantity is not defined for free
vibration.
95

PERMISSION TO COPY
In presenting this thesis in partial fulfillment of the requirements for a
master's degree at Texas Tech University or Texas Tech University Health Sciences
Center, I agree that the Library and my major department shall make it freely
avaUable for research purposes. Permission to copy this thesis for scholarly
purposes may be granted by the Director of the Library or my major professor.
It is understood that any copying or publication of this thesis for financial gain
shall not be allowed without my further written permission and that any user
may be liable for copyright infringement.
Agree (Permission is granted.)
Student's Signature Date
Disagree (Permission is not granted.)
Student's Signature Date
