an illustrated typology of scientific agglomerations forms in the world, 2000-2010
TRANSCRIPT

An illustrated typology of scientific agglomerations forms in the world, 2000–
2010
Laurent Jégou Marion Maisonobe Najla Touati

Introduction : the geographic visualisation of scientific production
Research group “geography of science” at the LISST, since 2010.
• Objective : to observe and analyse the geography of science at the city scale, worldwide, since a decade.
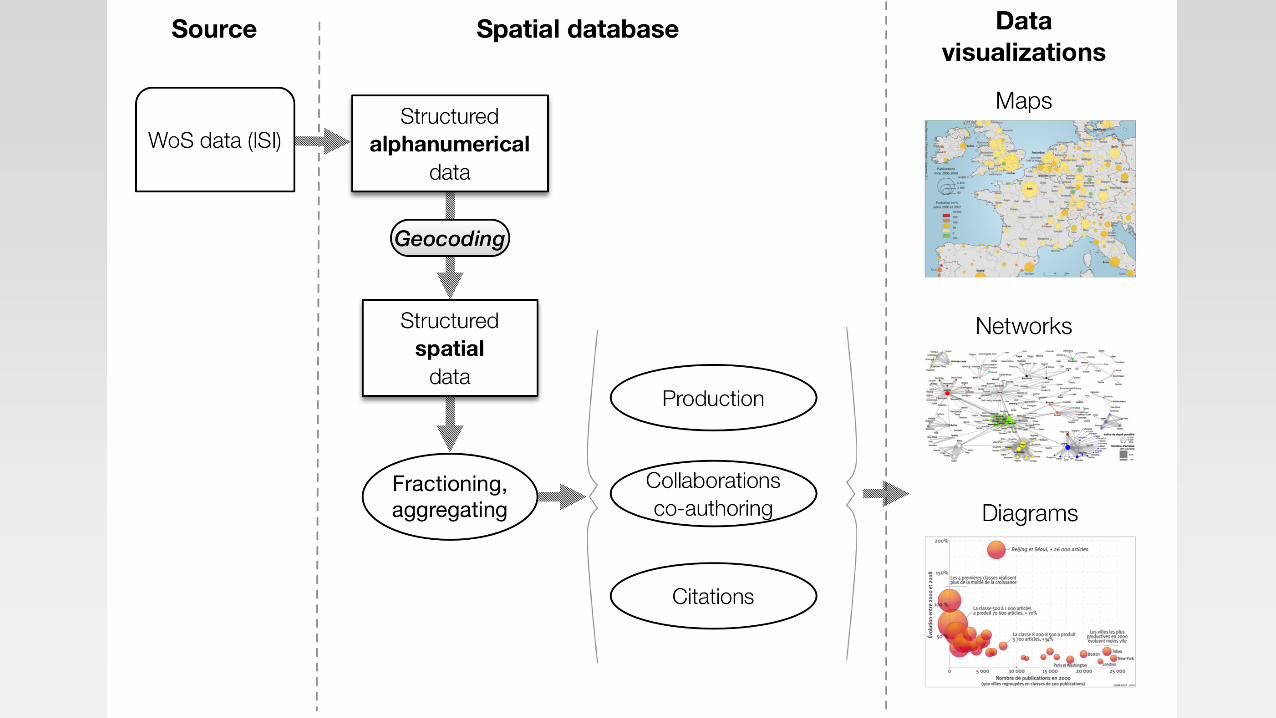
• Sources : The ©Web of Science, 1999-2012, author’s addresses.
• Tools : a geolocalised database with interactive visualisation tools to verify the results, to assess their quality and to represent the data conveniently, on a dynamic map.
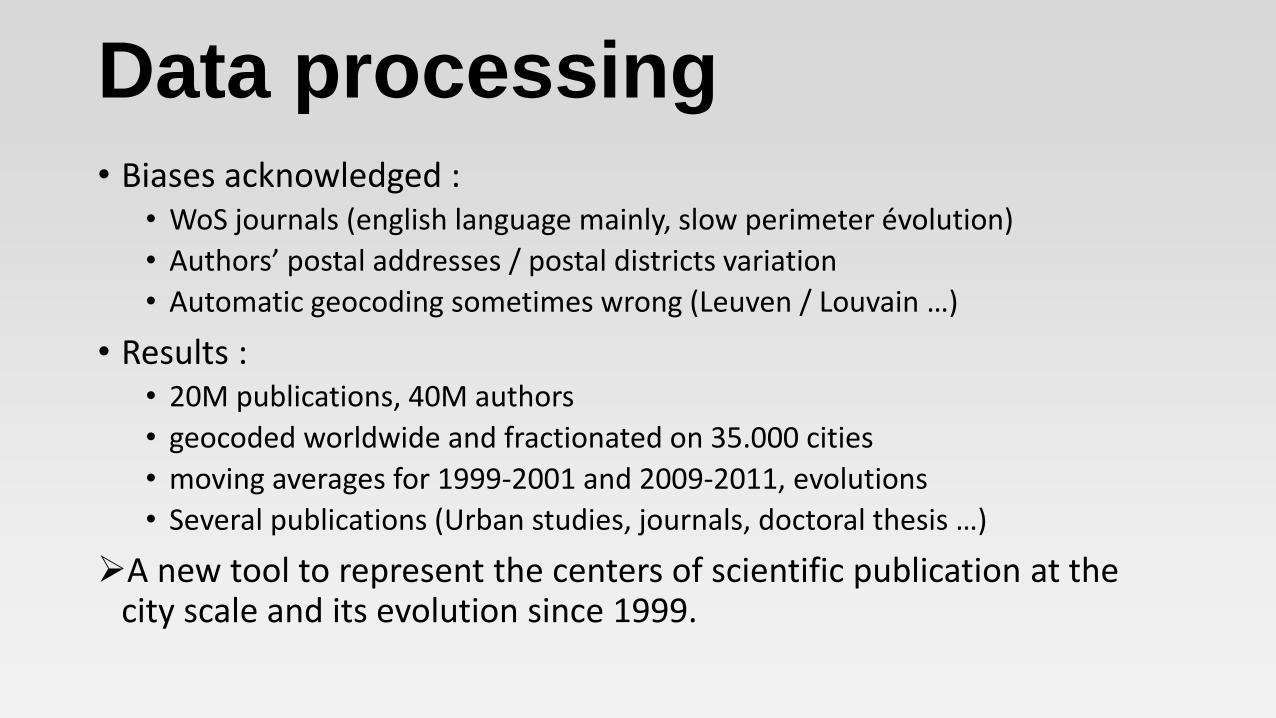
Data processing • Biases acknowledged :
• WoS journals (english language mainly, slow perimeter évolution)
• Authors’ postal addresses / postal districts variation
• Automatic geocoding sometimes wrong (Leuven / Louvain …)
• Results : • 20M publications, 40M authors
• geocoded worldwide and fractionated on 35.000 cities
• moving averages for 1999-2001 and 2009-2011, evolutions
• Several publications (Urban studies, journals, doctoral thesis …)
A new tool to represent the centers of scientific publication at the city scale and its evolution since 1999.

A new dynamic map online tool
(Hopefully soon to be available freely online)

Focus of today’s presentation : agglomerations
• Illustrating the diversity of the spatial configuration of the scientific production.
• A typology of spatial forms taking into account the temporal evolution.

Type 1 : the monocephalic or centralised agglos.
A single centre of publications only, stable in time (no new centres of production in the agglomeration during the period).
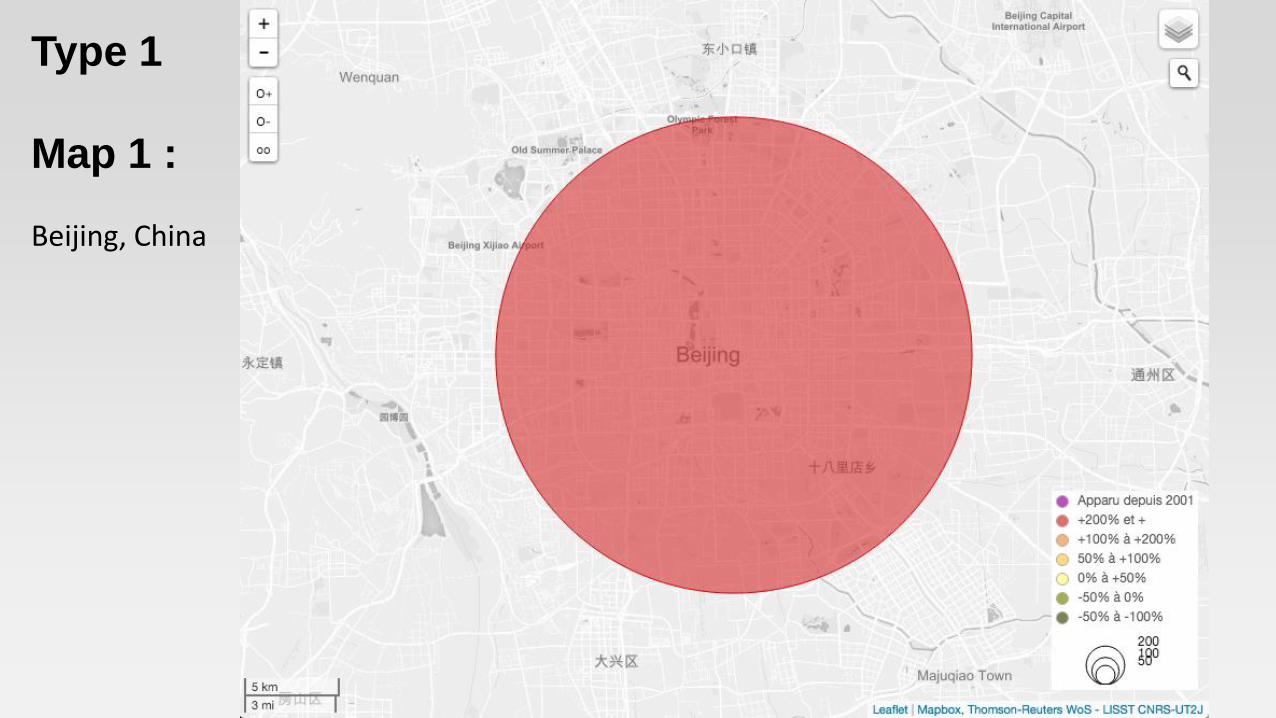
Type 1
Map 1 : Beijing, China

Type 1
Map 2 : Kiev, Ukraine

Type 1
Map 3 : South Spain

Type 2 : agglomerations with a single decentralised scientific centre Subtype 2a : With one suburb more dynamic than the centre Very often, the second centre of scientific production is a university campus, decentralised or delocalised from an old city-centre campus.

Type 2a
Map 4 : Helsinki – Espoo, Finland
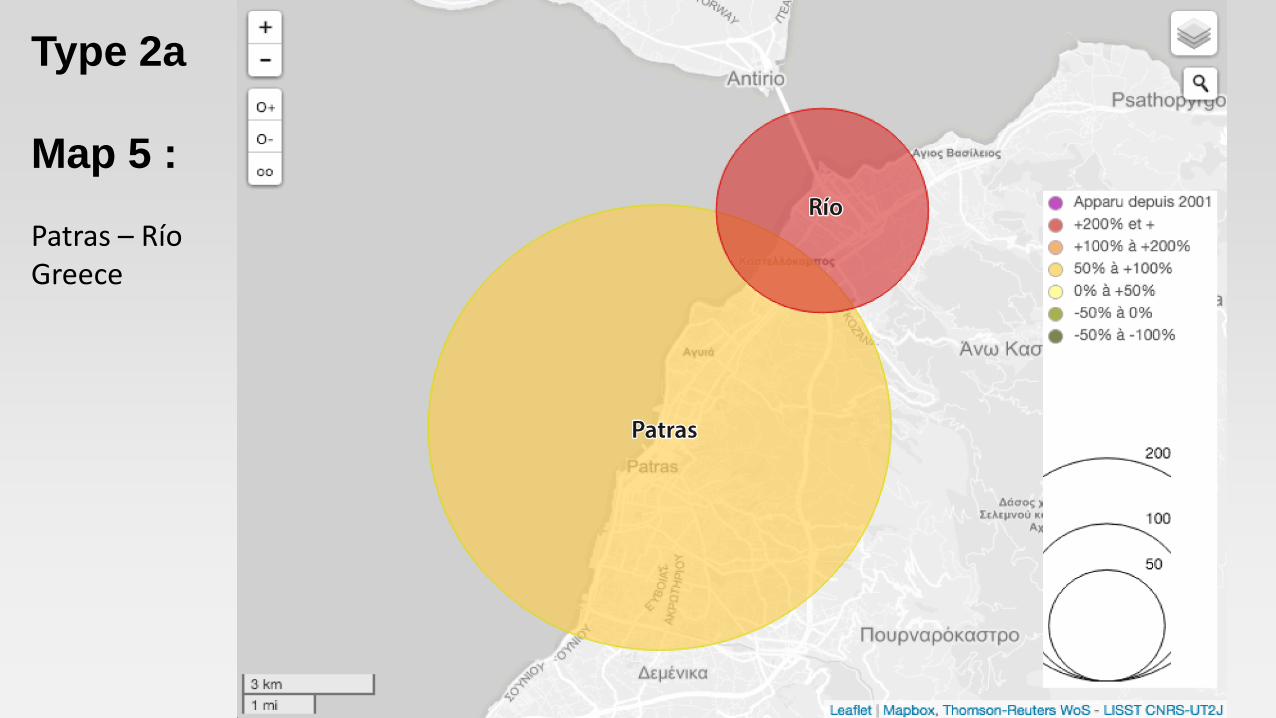
Type 2a
Map 5 : Patras – Río Greece
Type 2 : agglomerations with a single decentralised scientific centre Subtype 2b : With one suburb as dynamic as the centre or less dynamic

Type 2b
Map 6 : Cairo – Giza, Egypt

Type 2b
Map 7 : Dublin, Maynooth Ireland

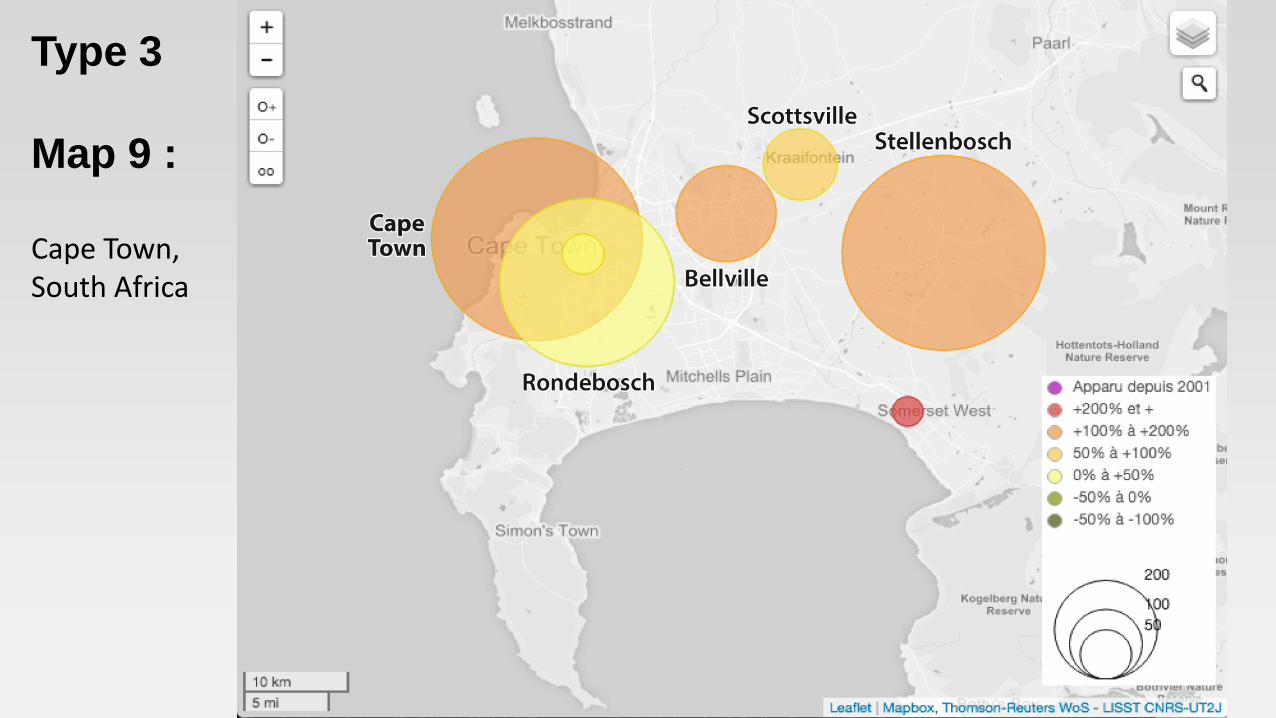
Type 3 : agglomerations with multiples decentralisations

Type 3
Map 8 :
Lyon, France
Type 3
Map 9 :
Cape Town, South Africa

Type 3
Map 10 :
Munchen, Germany

Type 4 : Two close agglomerations Subtype 4a : Inside a country

Type 4a
Map 11 : Bristol, Bath United Kingdom

Type 4a
Map 12 : Pretoria, Johannesburg South Africa

Type 4 : Two close agglomerations Subtype 4b : Separated by a political border

Type 4b
Map 13 : Hong Kong, Shenzhen China

Type 4b
Map 14 : Dubai, Sharjah, United Arab Emirates

Type 4b
Map 15 : Copenhagen, Lund, Malmö Denmark, Sweden

Type 5 : Emergence of new scientific production centres

Type5
Map 16 : Thuwal, Saudi Arabia

Type5
Map 17 : Semenyih, Malaysia