an exploration of state border crossing for mental health and
TRANSCRIPT
AN EXPLORATION OF STATE BORDER CROSSING FOR MENTAL HEALTH AND SUBSTANCE ABUSE TREATMENT
IN COMMUNITY HOSPITALS
Contact Information: Healthcare Cost and Utilization Project (HCUP) Agency for Healthcare Research and Quality
540 Gaither Road Rockville, MD 20850 http://www.hcup-us.ahrq.gov
For Technical Assistance with HCUP Products:
Email: [email protected] or
Phone: 1-866-290-HCUP
Acknowledgements: Collaboration between the Agency for Healthcare Research and Quality (AHRQ) and the Substance Abuse and Mental Health Services Administration (SAMHSA) made this report possible. This work was funded by AHRQ and SAMHSA.
Recommended Citation: Levit K, Stranges E, Coffey RM, Mark T, Kassed C, Vandivort-Warren R, Stocks C. An Exploration of State Border Crossing for Mental Health and Substance Abuse Treatment in Community Hospitals. Online April 13, 2010, U.S. Agency for Healthcare Research and Quality (AHRQ). Available: http://www.hcup-us.ahrq.gov/reports.jsp
An Exploration of State Border Crossing for MHSA Treatment in Community Hospitals April 9, 2010
TABLE OF CONTENTS
EXECUTIVE SUMMARY ................................................................................................. i
BACKGROUND .............................................................................................................. 1
Adjusting for Interstate Border Crossing ...................................................................... 1 SAMHSA State-Level Spending Estimates and HCUP SID ......................................... 2
METHODS ...................................................................................................................... 3
RESULTS ....................................................................................................................... 5
Net Flow Cost Ratios for MH and SA Hospitalizations ................................................. 5 Net Flow Cost Ratios for MH and SA Hospitalizations by Payer ................................. 7 Comparison of Net Flow Ratios for MH and SA Hospitalizations to All-Diagnoses Hospitalizations............................................................................................................ 8 Comparison of HCUP SID and CMS Net Flows .......................................................... 9
DISCUSSION ................................................................................................................ 12
Border Crossing for MHSA Inpatient Treatment ........................................................ 12 HCUP MHSA and All Diagnoses Net Cost Ratios ..................................................... 13 HCUP and CMS All Diagnoses Net Flow Ratios ....................................................... 13 CMS Net Flow Ratios for Non-hospital Services ....................................................... 14
RECOMMENDATIONS ................................................................................................. 14
APPENDIX A: HCUP Partners ............................................................................................... A-1
APPENDIX B: HCUP SID Net Flow Cost Ratios ................................................................... A-3

An Exploration of State Border Crossing for MHSA Treatment in Community Hospitals April 9, 2010
TABLE OF FIGURES
Figure 1. HCUP SID States, 2002 .................................................................................. 5
Figure 2. HCUP SID Net Flow Ratios: Mental Health Treatment Costs*, 2002 ............. 6
Figure 3. HCUP SID Net Flow Ratios: Substance Abuse Treatment Costs*, 2002 ....... 7
Figure 4. Range of HCUP SID Net Flow Ratios for MH and SA Treatment in Community Hospitals, 2002 ............................................................................................ 8
Figure 5. HCUP SID Inpatient Hospital Net Flow Cost Ratios for All Stays and MHSA Stays, 2002 ..................................................................................................................... 9
Figure 6. All Diagnoses Net Flow Ratios from CMS (2004) and HCUP SID (2002) ..... 10
http://www.hcup-us.ahrq.gov/reports.jsp An Exploration of State Border Crossing for MHSA Treatment in Community Hospitals i April 9, 2010
EXECUTIVE SUMMARY The motivation for this paper is SAMHSA’s desire to expand their understanding of spending for and financing of mental health (MH) and substance abuse (SA) treatment services by producing spending estimates at the state level. Because patients may cross state borders to obtain treatment, estimates of expenditures on health care produced in a state and estimates of expenditures on health care consumed by residents of a state can be distinctly different. Therefore, in order to produce accurate state-level estimates of health care spending, state-level accounting must distinguish between spending by location of patient residence and spending by location of provider practice. This distinction also has implications for the selection of data to use in producing state estimates as well as for the eventual application of such estimates. For example, estimates by location of patient residence are needed to generate per capita state estimates; estimates based on location of provider practice cannot be used to create this analytic tool. The approach used by the Centers for Medicare and Medicaid Services (CMS) for producing state estimates involves creating estimates according to the provider state because provider information is readily available by state from sources such as the U.S. Economic Census. Subsequently, this spending by state is adjusted using estimates of border crossing for health care services to create spending based on state of patient residence. This paper explores the spending associated with border crossing for mental health and substance abuse (MHSA) treatment services as a precursor to creating the state spending estimates for MHSA services for SAMHSA. The purpose of this analysis is to determine if interstate border-crossing for MHSA inpatient treatment in community hospitals exists and, if so, its extent; whether the net flow cost ratios for MHSA inpatient treatment in community hospitals (the ratio of costs of hospital care consumed by state residents to those produced by provider practices within a state) are different from those for all-diagnoses treatment; and if the Healthcare Cost and Utilization Project State Inpatient Databases (HCUP SID) would be a good source for generating adjustments to account for flows among states. In particular, we want to determine if HCUP SID can be used to calculate net flow cost ratios for inpatient community hospital treatment. To measure the extent of spending associated with border crossing for hospitalizations for MH and SA treatment, we used the 2002 HCUP SID—hospital inpatient databases from 34 data organizations participating in HCUP in 2002. The analysis reveals several important findings:
• Patients do cross state borders to receive MHSA inpatient treatment in community hospitals.
• The extent of net spending associated with border crossing for MHSA treatment in community hospitals is not large, ranging from net inflows of 5 percent to net outflows of 8 percent.
• The spending associated with those patients with private insurance or self-pay as the primary payer tend to access care in other states proportionately more than those covered by Medicaid or Medicare.
• Spending for MH and SA inpatient hospitalizations is more likely to take place in the state of residence than is spending on other types of hospitalizations.

http://www.hcup-us.ahrq.gov/reports.jsp An Exploration of State Border Crossing for MHSA Treatment in Community Hospitals ii April 9, 2010
Based on this analysis, we recommend that SAMHSA use HCUP SID MHSA inpatient hospitalization net flow cost ratios to adjust state-level estimates of spending on MHSA inpatient hospitalization in states where discharge records from most border states are also available. We also recommend the use of CMS net flows to adjust state-level estimates of spending on other MHSA non-specialty provider types such as physician services.

An Exploration of State Border Crossing for MHSA Treatment in Community Hospitals 1 April 9, 2010
BACKGROUND
The motivation for this paper is SAMHSA’s desire to expand its understanding of spending for and financing of mental health (MH) and substance abuse (SA) treatment services. SAMHSA sponsors an ongoing project that prepares and updates historical and projected national spending for MHSA treatment. SAMHSA would like to expand this project by producing spending estimates for MHSA services at the state level, improving the understanding of capacity differences among states in the provision of MHSA treatment and of the access to care afforded to residents of each state. An essential part of preparing state estimates is understanding the extent to which patients cross state borders to access care. This travel can affect the amount of spending assigned to each state and the interpretation of that spending. Using the approach for producing state estimates created by CMS, this paper explores border crossing for MHSA treatment services as a precursor to creating the state spending estimates for MHSA services.
Adjusting for Interstate Border Crossing Patients may cross state borders to obtain health care. The reasons for this travel can be because they are seeking specialized care available in another state, because the closest provider happens to be across a state border, or because they need care when traveling out-of-state for business or pleasure. As a result, estimates of expenditures on health care produced in a state and estimates of expenditures on health care consumed by residents of a state can be distinctly different. In order to produce accurate state-level estimates of health care spending, state-level accounting for health care spending must distinguish between spending by location of patient residence and spending by location of provider practice.1 State of provider and state of residence spending are both important analytic tools for understanding spending on treatment by state. State of provider estimates are helpful in understanding a state’s capacity to produce services. However, they are not optimal for comparing average spending among states. For this purpose, state of residence estimates are most useful because they can be divided by the population of the state to create per capita estimates—a measure that allows for direct comparison among states. Readily available information by state is often limited to state of provider information; this information is usually the source data used to estimate state spending. To convert state of provider estimates to state of residence estimates, net flow ratios are used. CMS’ State Personal Health Care Expenditures include both state of patient residence and state of provider practice estimates. CMS begins with estimates of spending by state of provider because much of the data used to generate the estimates are collected based on the provider location.2 After developing a complete set of estimates by provider state, CMS makes adjustments to arrive at estimates by state of patient residence. For each state, the adjustments are made by multiplying the more readily-available state of provider revenue times
1 Estimates of spending based on state of patient residence (health care dollars consumed by residents of a state) indicate how many services are consumed by state residents. Estimates of spending by provider location (in other words, the health care dollars produced by providers in the state) describe the capacity of the state to produce services and the types of services available in the state. 2 An example is the Economic Census of health care organizations.
An Exploration of State Border Crossing for MHSA Treatment in Community Hospitals 2 April 9, 2010
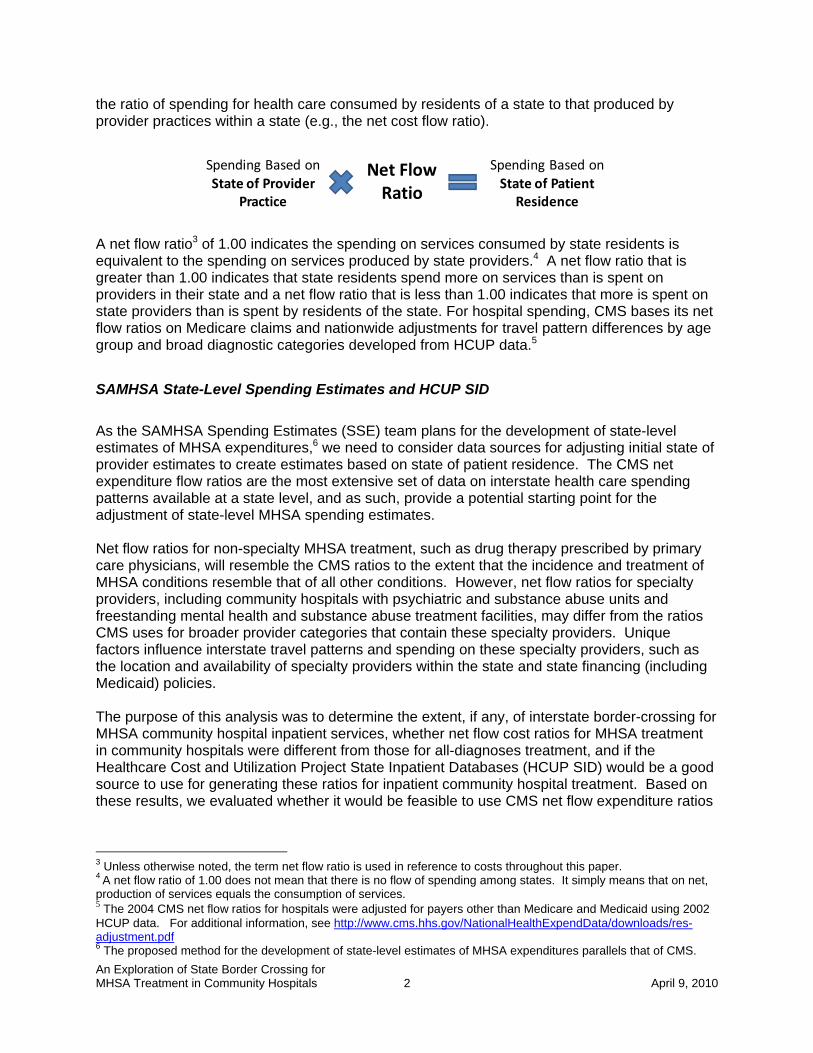
the ratio of spending for health care consumed by residents of a state to that produced by provider practices within a state (e.g., the net cost flow ratio).
Spending Based on State of Patient
Residence
Spending Based on State of Provider
Practice
Net Flow Ratio
A net flow ratio3 of 1.00 indicates the spending on services consumed by state residents is equivalent to the spending on services produced by state providers.4 A net flow ratio that is greater than 1.00 indicates that state residents spend more on services than is spent on providers in their state and a net flow ratio that is less than 1.00 indicates that more is spent on state providers than is spent by residents of the state. For hospital spending, CMS bases its net flow ratios on Medicare claims and nationwide adjustments for travel pattern differences by age group and broad diagnostic categories developed from HCUP data.5
SAMHSA State-Level Spending Estimates and HCUP SID As the SAMHSA Spending Estimates (SSE) team plans for the development of state-level estimates of MHSA expenditures,6 we need to consider data sources for adjusting initial state of provider estimates to create estimates based on state of patient residence. The CMS net expenditure flow ratios are the most extensive set of data on interstate health care spending patterns available at a state level, and as such, provide a potential starting point for the adjustment of state-level MHSA spending estimates. Net flow ratios for non-specialty MHSA treatment, such as drug therapy prescribed by primary care physicians, will resemble the CMS ratios to the extent that the incidence and treatment of MHSA conditions resemble that of all other conditions. However, net flow ratios for specialty providers, including community hospitals with psychiatric and substance abuse units and freestanding mental health and substance abuse treatment facilities, may differ from the ratios CMS uses for broader provider categories that contain these specialty providers. Unique factors influence interstate travel patterns and spending on these specialty providers, such as the location and availability of specialty providers within the state and state financing (including Medicaid) policies. The purpose of this analysis was to determine the extent, if any, of interstate border-crossing for MHSA community hospital inpatient services, whether net flow cost ratios for MHSA treatment in community hospitals were different from those for all-diagnoses treatment, and if the Healthcare Cost and Utilization Project State Inpatient Databases (HCUP SID) would be a good source to use for generating these ratios for inpatient community hospital treatment. Based on these results, we evaluated whether it would be feasible to use CMS net flow expenditure ratios
3 Unless otherwise noted, the term net flow ratio is used in reference to costs throughout this paper. 4 A net flow ratio of 1.00 does not mean that there is no flow of spending among states. It simply means that on net, production of services equals the consumption of services. 5 The 2004 CMS net flow ratios for hospitals were adjusted for payers other than Medicare and Medicaid using 2002 HCUP data. For additional information, see http://www.cms.hhs.gov/NationalHealthExpendData/downloads/res-adjustment.pdf 6 The proposed method for the development of state-level estimates of MHSA expenditures parallels that of CMS.

An Exploration of State Border Crossing for MHSA Treatment in Community Hospitals 3 April 9, 2010
to adjust net flows for MHSA services for other providers. To address these issues, we performed the following activities:
1. Used HCUP SID to calculate net flow cost ratios for mental health (MH) and substance abuse (SA) treatment in inpatient community hospitals to determine the extent of border-crossing.7,8,9
2. Compared the HCUP SID MHSA net flow cost ratios to HCUP SID all-diagnoses cost ratios to determine if these ratios are different.
3. Compared the HCUP SID inpatient all-diagnoses net flow cost ratios to CMS inpatient and outpatient hospital all-diagnoses net flow expenditure ratios to determine their consistency.
If the HCUP SID and CMS net flow ratios for all diagnoses are consistent, and the MHSA and all-diagnoses net flow ratios from HCUP SID are consistent, then the CMS net flows can be used to estimate the MHSA net flows. Otherwise, separate methods must be developed to account for cross-border flow of spending.
METHODS
The names of states participating in HCUP are masked throughout this report and in graphs and tables in order to comply with data use agreements between the HCUP Partner organizations and AHRQ. To measure the extent of cross-border spending for hospitalizations for MH and SA treatment, we used the 2002 HCUP SID—state inpatient hospital databases from data organizations participating in HCUP. The SID contain the universe of the inpatient discharge abstracts in the participating HCUP states, translated into a uniform format to facilitate comparisons and analyses. In 2002, the SID consisted of 35 state databases, encompassing the vast majority of U.S. community hospital discharges. Our analysis was based on 34 of these state databases; Iowa was excluded because it does not submit discharges records with MH and SA diagnoses. For each SID state, we captured the primary payer and state of patient residence for each discharge in community hospitals as we tabulated (1) the number of discharges with a principal MHSA diagnosis and (2) the aggregate charges of these discharges. The hospital-specific HCUP Cost-to-Charge Ratio (CCR) was used to convert the charges available from the SID to costs—a concept much closer to expenditures than are charges.10
7 The Healthcare Cost and Utilization Project (HCUP) State Inpatient Databases (SID) contain information on cost, diagnosis, payer, patient residence and provider location that allows us to generate net flow ratios for one piece of MH and SA treatment—stays in inpatient community hospitals. See Appendix A for a full description of HCUP SID. 8 Given the limited availability of data sets which include information needed to generate net flow cost ratios (that is, records containing cost, diagnosis, provider type, state of patient residence, and state of provider practice), it is not possible to generate ratios for any other provider type at this time. Future work may explore Medicare or Medicaid claims for other provider types, including other professionals and specialty clinics. 9 The community hospital is actually a combination of specialty and non-specialty provider types. The SAMHSA Spending Estimates break community hospital spending into spending in specialty psychiatric/chemical dependency units and spending in all other units (also called scatter beds). In this analysis, we are looking at the two combined. On average nationwide, specialty units provide the majority of MHSA spending in community hospitals. 10 Cost information for the CCR was obtained from the hospital accounting reports (Medicare Cost Reports) collected by the Centers for Medicare and Medicaid Services (CMS). Some imputations for missing values were necessary.
An Exploration of State Border Crossing for MHSA Treatment in Community Hospitals 4 April 9, 2010
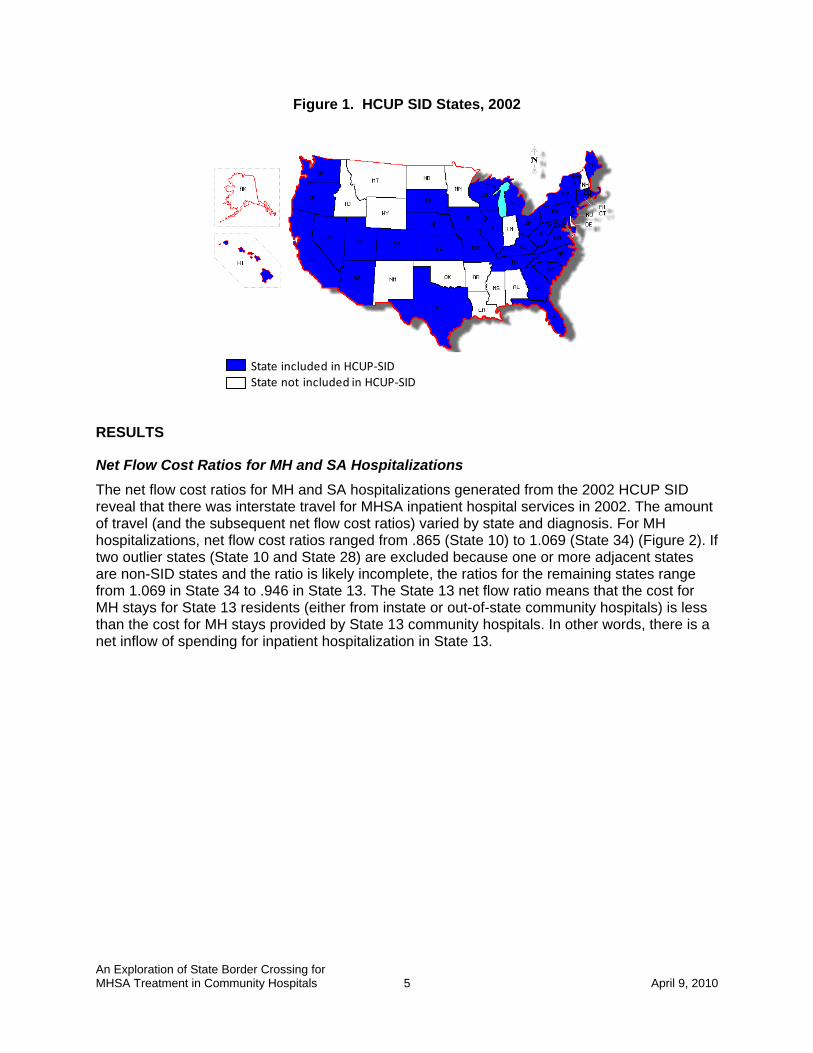
For each combination of payer and MH or SA diagnosis11, we organized the aggregate costs into a 51 by 51 matrix12 according to state of provider practice and state of patient residence. We then calculated the net flow cost ratios for each state and each combination of MHSA diagnosis group and payer by dividing the state costs based on patient residence by state of provider costs. Once we produced net flow cost ratios for MH and SA treatment, we compared them to cost ratios for all-diagnoses inpatient hospitalizations previously produced from 2002-2003 HCUP SID data.13 We also compared the HCUP SID all-diagnoses net flow cost ratios to expenditure ratios from CMS. The CMS data differed in definition from the HCUP SID data in that CMS data covers all states; they were for 2004 rather than 2002; they included both inpatient and outpatient hospital services14; and they comprised expenditures (that include costs plus profit) rather than costs alone. The net flow ratios created by CMS are based on Medicare claims, adjusted for other payers covering younger age groups based on nationwide HCUP travel pattern differences by age group and broad diagnostic categories.15 Because the 2002 HCUP SID include data in all community hospitals in 34 states, we had complete data on the treatment rendered by providers located in those 34 states. However, the data we had on treatment for residents of those 34 states was incomplete, as we could not capture inpatient costs for a resident of a SID state who received treatment in a non-SID state. As a result, although we can be reasonably confident that we are generating accurate net flow ratios for SID states which are adjacent to other SID states,16 we must be more cautious in our interpretation of the net flows generated for SID states which are adjacent to non-SID states. For example, Figure 1 shows SID states in blue and non-SID states in white, with Texas surrounded by non-HCUP states. Net cost flows for Texas will be incomplete because outflow of Texas residents to adjacent states would not be captured. On the other hand, data are much more complete for the New England and Mid-Atlantic states, where only a few states are non-SID states.
11 Examples include discharges with a principal MH diagnosis and an expected primary payer of Medicaid or discharges with a principal SA diagnosis and an expected primary payer of private insurance. 12 50 states plus the District of Columbia. All states plus DC are used even though not all states are available from HCUP SID because states covered by HCUP SID may treat patients from non-SID states. 13 http://www.hcup-us.ahrq.gov/partner/bordercrossing.jsp 14 CMS does not break down the net spending flows for hospitalization into inpatient and outpatient, so CMS net hospital flows for all services were used. 15 The 2004 CMS net flow ratios for hospitals were adjusted for payers other than Medicare and Medicaid using 2002 HCUP data. For additional information , see http://www.cms.hhs.gov/NationalHealthExpendData/downloads/res-adjustment.pdf 16 HCUP data show that 99 percent of costs associated with patients discharged in one state come on average from that state or adjacent “border” states. Of the patients coming from states other than the provider state, over half are residents of adjacent “border” states.
An Exploration of State Border Crossing for MHSA Treatment in Community Hospitals 5 April 9, 2010
Figure 1. HCUP SID States, 2002
State included in HCUP‐SIDState not included in HCUP‐SID
RESULTS
Net Flow Cost Ratios for MH and SA Hospitalizations The net flow cost ratios for MH and SA hospitalizations generated from the 2002 HCUP SID reveal that there was interstate travel for MHSA inpatient hospital services in 2002. The amount of travel (and the subsequent net flow cost ratios) varied by state and diagnosis. For MH hospitalizations, net flow cost ratios ranged from .865 (State 10) to 1.069 (State 34) (Figure 2). If two outlier states (State 10 and State 28) are excluded because one or more adjacent states are non-SID states and the ratio is likely incomplete, the ratios for the remaining states range from 1.069 in State 34 to .946 in State 13. The State 13 net flow ratio means that the cost for MH stays for State 13 residents (either from instate or out-of-state community hospitals) is less than the cost for MH stays provided by State 13 community hospitals. In other words, there is a net inflow of spending for inpatient hospitalization in State 13.

An Exploration of State Border Crossing for MHSA Treatment in Community Hospitals 6 April 9, 2010
Figure 2. HCUP SID Net Flow Ratios: Mental Health Treatment Costs*, 2002
0.85
0.90
0.95
1.00
1.05
1.10
*10
*28
*13 30 *27 *7 31 8 11 *33 4 19 1 18 5 24 20 *6 12 22 17 9
*29 21 2 25 16 15 3 23 32 26 *14 34
MH Inpatie
nt Hospital N
et Flow Cost Ratio
State†
† States are masked to comply with data use agreements between the HCUP Partner organizations and AHRQ.* SID states with missing adjacent states that are most likely to cause incomplete net flow ratios (see Table 1).
For SA hospitalizations, net flow ratios ranged from .912 (State 27) to 1.124 (State 34) (Figure 3).17
17 See Appendix B for tables containing net flow ratios of discharges and costs by state.

An Exploration of State Border Crossing for MHSA Treatment in Community Hospitals 7 April 9, 2010
Figure 3. HCUP SID Net Flow Ratios: Substance Abuse Treatment Costs*, 2002
0.85
0.90
0.95
1.00
1.05
1.10
1.15
*27
11 *10
*28
19 17 8 31 4 18 *7 23 32 *6 5 9*2
9*1
320 30 24 12 25 *33 1 16 22 2 21 26 3 15 *14
34
SA Inpatie
nt Hospital Net Flow Cost R
atio
State†† States are masked to comply with data use agreements between the HCUP Partner organizations and AHRQ.* SID states with missing adjacent states that are most likely to cause incomplete net flow ratios (see Table 1).
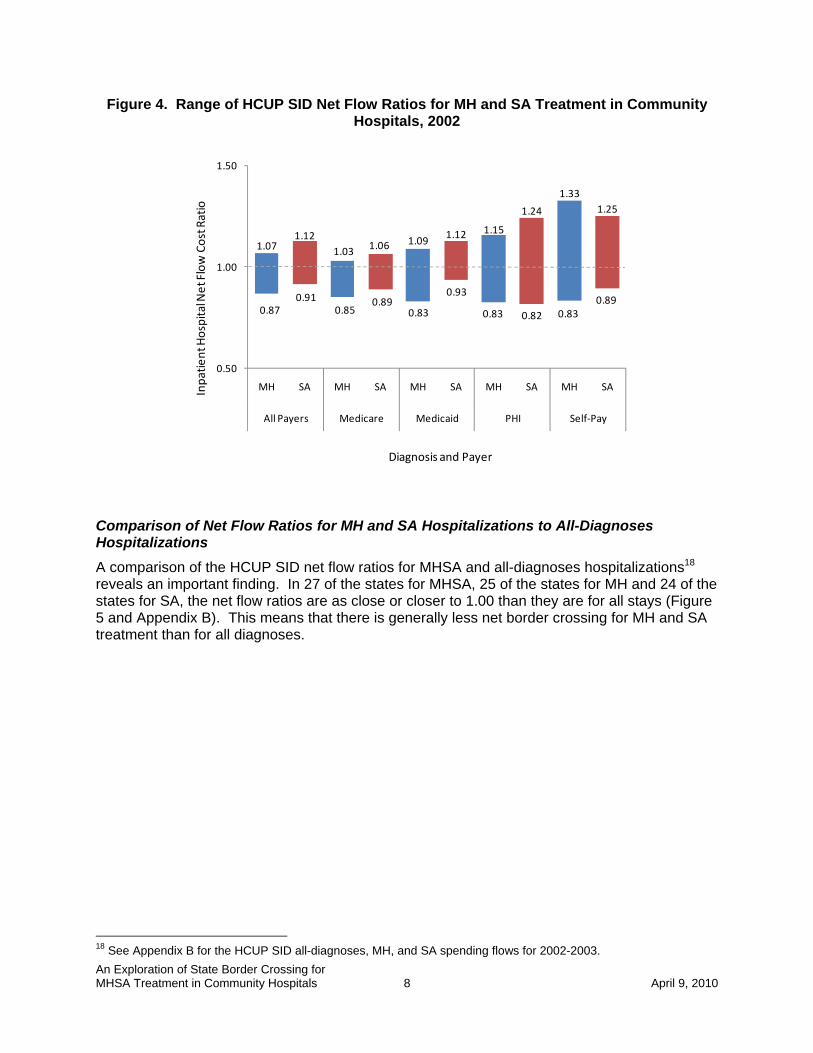
Net Flow Cost Ratios for MH and SA Hospitalizations by Payer Figure 4 illustrates that the net flow cost ratios varied by payer as well as diagnosis. Patients with private insurance or self pay as the primary payer tend to access care in other states proportionately more than those covered by Medicaid or Medicare. Among the states and payers, the net flow ratios for MH inpatient hospitalizations for patients with an expected primary payer of self-pay had the broadest range (from .83 to 1.33), while the net flow ratios for MH and SA inpatient stays with an expected primary payer of Medicare had the narrowest range (.85 to 1.03 for MH and .89 to 1.06 for SA).
An Exploration of State Border Crossing for MHSA Treatment in Community Hospitals 8 April 9, 2010
Figure 4. Range of HCUP SID Net Flow Ratios for MH and SA Treatment in Community Hospitals, 2002
1.071.12
1.03 1.06 1.09 1.12 1.15
1.24
1.331.25
0.50
1.00
1.50
MH SA MH SA MH SA MH SA MH SA
All Payers Medicare Medicaid PHI Self‐Pay
Inpatie
nt Hospital Net Flow Cost Ratio
Diagnosis and Payer
0.870.91
0.850.89
0.83
0.93
0.83 0.82 0.830.89
Comparison of Net Flow Ratios for MH and SA Hospitalizations to All-Diagnoses Hospitalizations A comparison of the HCUP SID net flow ratios for MHSA and all-diagnoses hospitalizations18 reveals an important finding. In 27 of the states for MHSA, 25 of the states for MH and 24 of the states for SA, the net flow ratios are as close or closer to 1.00 than they are for all stays (Figure 5 and Appendix B). This means that there is generally less net border crossing for MH and SA treatment than for all diagnoses.
18 See Appendix B for the HCUP SID all-diagnoses, MH, and SA spending flows for 2002-2003.

An Exploration of State Border Crossing for MHSA Treatment in Community Hospitals 9 April 9, 2010
Figure 5. HCUP SID Inpatient Hospital Net Flow Cost Ratios for All Stays and MHSA Stays, 2002
0.85
0.90
0.95
1.00
1.05
1.10
1.15*2
8*1
0*3
3*1
430 31 *13 4 24 1 *7 12 23 9 17 8 *6 5 22 19 16 20 2 11 32 18 21 25 15 26 34 *29 3
*27
Inpatie
nt Hospital Net Flow Cost Ratio
State†
All Diagnoses MHSA Diagnoses
† States are masked to comply with data use agreements between the HCUP Partner organizations and AHRQ.* SID states with missing adjacent states that are most likely to cause incomplete net flow ratios (see Table 1).
Comparison of HCUP SID and CMS Net Flows We compared the HCUP SID all diagnoses net cost ratios for inpatient hospitalization to CMS all-diagnoses net expenditure ratios for inpatient and outpatient hospitalization19 to see how the HCUP SID data compared to CMS net flows for hospitalization. Table 1 shows the CMS all-payer net flow ratios by state, the HCUP SID all-payer net flow ratios by state, and the absolute difference between the two. For each state, the right-most column indicates whether any adjacent states are not included in the SID. The same information is shown graphically in Figure 6. As the absolute difference between the HCUP SID and CMS net flow ratios increases, the likelihood that a state is adjacent to a non-SID state also increases. Of the 9 states with the greatest difference between the HCUP SID and CMS net flows (0.030 or greater, indicated with a * next to the state number in Figure 6 and Table 1), 8 of them were adjacent to one or more non-SID states. Of the 15 states with the smallest difference between the HCUP SID and CMS net flows, only 3 of them were adjacent to non-SID states. In those states, it is likely that the net flow from the missing states did not have much influence on the overall net flow ratio, either 19 CMS does not break down the net spending flows for hospitalization into inpatient and outpatient, so we had to use the combination of the two for our comparison.

An Exploration of State Border Crossing for MHSA Treatment in Community Hospitals 10 April 9, 2010
because the flows were not substantial or because the spending flowing into the SID state was equal to the spending for inpatient hospitalizations provided to the SID state residents by the non-SID state (resulting in negligible net flows between the two states).
Figure 6. All Diagnoses Net Flow Ratios from CMS (2004) and HCUP SID (2002)
0.85
0.90
0.95
1.00
1.05
1.10
1.15
*10
*28
30 *33 4 31 9 17 24 12 1 16 5 8 2 23 19 22 20 *7 11 *6 18 21 32 *29
15 26 *27
25 *13 3 34 *14
Inpatie
nt Hospital Net Flow Cost Ratio
State†
CMS Hospital Net Flow RatiosHCUP SID Net Flow Ratios
† States are masked to comply with data use agreements between the HCUP Partner organizations and AHRQ.* SID states with missing adjacent states that are most likely to cause incomplete net flow ratios (See Table 1).

An Exploration of State Border Crossing for MHSA Treatment in Community Hospitals 11 April 9, 2010
Table 1. CMS and HCUP SID All Payer and All Diagnoses Net Flow Ratios by State
State†
Personal Health Expenditures for Inpatient & Outpatient
Hospital Services1
(All Diagnoses)
Costs forInpatient
Hospital Services2
(All Diagnoses)
Absolute Difference in CMS and HCUP‐SID
All Diagnoses Net Flows
Adjacent State(s) Missing from
SID?
*10 0.926 0.890 0.036 Yes*28 0.932 0.884 0.048 Yes30 0.937 0.908 0.029 No*33 0.955 0.901 0.054 Yes4 0.962 0.952 0.010 No
31 0.964 0.939 0.025 Yes9 0.967 0.972 0.005 No
17 0.969 0.978 0.010 No24 0.971 0.952 0.019 Yes12 0.976 0.968 0.008 No1 0.977 0.954 0.023 Yes
16 0.983 0.985 0.002 No5 0.984 0.980 0.004 No8 0.988 0.979 0.010 No2 0.991 0.990 0.001 No
23 0.992 0.970 0.022 Yes19 0.993 0.982 0.011 No22 0.995 0.981 0.014 Yes20 0.997 0.988 0.009 No*7 1.000 0.965 0.035 No11 1.007 0.995 0.012 Yes*6 1.010 0.980 0.030 Yes18 1.011 1.007 0.004 Yes21 1.019 1.021 0.002 No32 1.019 1.004 0.015 Yes*29 1.027 1.077 0.050 Yes15 1.031 1.036 0.005 Yes26 1.047 1.053 0.006 No*27 1.049 1.085 0.035 Yes25 1.051 1.030 0.022 Yes*13 1.060 0.943 0.117 Yes3 1.084 1.078 0.006 Yes
34 1.088 1.068 0.020 No*14 1.128 0.902 0.226 Yes
1Centers for Medicare & Medicaid Services, Office of the Actuary, National Health Statistics Group, 2004. (These data were originally produced for 2002, and were held constant for 2004.)
† States are masked to comply with data use agreements between the HCUP Partner organizations and AHRQ.*Absolute difference between CMS and HCUP‐SID net flows is 0.030 or greater. These states are most l ikely to have incomplete net flow ratios.
2AHRQ, Center for Delivery, Organization, and Markets, Healthcare Cost and Utilization Project, State Inpatient Databases, 2002‐2003.

An Exploration of State Border Crossing for MHSA Treatment in Community Hospitals 12 April 9, 2010
DISCUSSION
State of provider and state of residence spending are both important analytic tools for understanding spending on treatment by state. State of provider estimates are helpful in understanding a state’s capacity to produce services. However, they are not optimal for comparing average spending by residents among states. For this purpose, state of residence estimates are most useful because they can be divided by the population of the state to create per capita estimates—a measure that allows for direct comparison among states. Readily available information by state is often limited to state of provider information; this information is usually the source data used to estimate state spending. To convert state of provider spending estimates to state of residence estimates, net flow ratios are used. Specialty providers, including inpatient psychiatric and substance abuse units of community hospitals, are often used to deliver MHSA treatment. However, these facilities may not be located in close proximity to a patient’s home. This study was designed to explore the extent of border crossing for MHSA inpatient hospital services in HCUP SID, one of the few data sets available that provide diagnosis-specific cost information by state of residence and state of provider.20 Because HCUP SID does not cover all states, this study also examined how close MHSA net cost flows are to HCUP SID all-diagnoses net cost flows, and whether HCUP SID all-diagnoses net cost ratios for inpatient hospital treatment are similar to the CMS all-diagnoses net expenditure ratios for inpatient and outpatient hospital care. This examination will help to determine whether the CMS expenditure net flows could be a reasonable proxy spending flows between states for MHSA diagnoses when no other, more specific information exists.
Border Crossing for MHSA Inpatient Treatment The results reveal that patients and their associated spending do cross state borders to receive MHSA treatment in community hospitals. In general, the net flow cost ratios are concentrated in a narrow range—from .95-1.07 for MH and from .91-1.05 for SA treatment when a few outliers (State 10 and State 28 for MH and State 34 for SA) are excluded. The clustering of these ratios around 1.00 suggests that community hospital treatment spending for MH and SA conditions tends to take place in home states. While cross-border travel for hospitalization for MHSA conditions does exist, most spending for inpatient treatment in community hospitals occurs in the home state. The net flow cost ratios vary by payer. Spending associated with those patients for whom the primary payer is private insurance or self-pay tends to occur in other states proportionately more than those covered by Medicaid. Border-crossing for MHSA treatment by Medicaid patients may be influenced by state Medicaid payment policies that may concentrate MHSA treatment to in-state hospitals or may be restricted by travel costs which the Medicaid patient may be unable to pay. Medicare patients, like Medicaid patients, tend to cross borders less frequently for MHSA treatment than private insurance and self-pay patients, possibly because age or disability may inhibit their travel.
20 Other potential sources include Medicare claims and Medicaid claims for FFS.

An Exploration of State Border Crossing for MHSA Treatment in Community Hospitals 13 April 9, 2010
HCUP MHSA and All Diagnoses Net Cost Ratios HCUP SID net flow cost ratios for inpatient hospital services vary between MHSA and all diagnoses. First, the net flow ratios for MH and SA treatment are closer to 1.00 than they are for all diagnoses. This suggests that spending for MH and SA inpatient hospitalizations is more likely to take place in the state of residence than hospitalization spending for other reasons. Second, while there were absolute differences between the net flow ratios for all-diagnoses hospitalizations and MH and SA hospitalizations, in many states those differences were not large. In 26 of the 34 states for MH, and in slightly fewer than half of the states for SA, the differences in net flow ratios between the MHSA and all diagnoses were less than 0.030. While the net flow cost ratios were similar in many states between MH and SA and all diagnoses, this was not true in all states. Given the number of factors which influence interstate travel patterns and spending—including location of community hospitals with psychiatric and substance abuse units and psychiatric and chemical dependency hospitals, and state financing policies—the differences between the all-diagnoses, MH and SA net flow ratios for inpatient hospitalization are understandable.
HCUP and CMS All Diagnoses Net Flow Ratios The comparison of the CMS and HCUP SID all-diagnoses net flow ratios shows relative consistency between the two data sets. Eight of the nine states for which the absolute difference in the ratios is 0.030 or greater are states adjacent to non-SID states. Net flow ratios in states adjacent to non-SID states would be less complete because any health care spending by SID state residents in non-SID states is not being captured. For the remaining states adjacent to non-SID states, it is likely that the net flow from the missing states did not have much influence on the overall net flow ratio, either because the flows were not substantial or because the spending flowing into the SID state was equal to the spending for services provided to the SID state residents by the non-SID state (resulting in negligible net flows between the two states). For states adjacent to SID states, any differences in the net flow ratios are likely due to a variety of factors. First, the CMS net flow expenditure ratios include spending for outpatient services in addition to inpatient spending while the SID include only inpatient services. Patients usually access outpatient services closer to home, so the CMS inpatient-outpatient net flow ratios in many cases are closer to 1.00 than are the SID inpatient only net flow ratios. Second, profit rates of community hospitals could be contributing to the difference: SID ratios are calculated from costs that do not include profits, while CMS ratios are calculated from expenditures that do include profit. Third, costs estimated from SID charges do not include any differentials by type of payer, whereas expenditures used to create the CMS ratios do include Medicare revenues that reflect different payment structures used by this payer. Last, CMS estimates of net expenditure ratios for all payers other than Medicare and Medicaid are based on Medicare net flows that have been adjusted using flow differences between Medicare and patients under 65 years by broad diagnosis group. This estimation process based on nationwide data may introduce variation by state that may over- or under-estimate actual flows in spending.

An Exploration of State Border Crossing for MHSA Treatment in Community Hospitals 14 April 9, 2010
CMS Net Flow Ratios for Non-hospital Services HCUP SID MHSA net flow cost ratios for inpatient hospital services are somewhat different from CMS net flow ratios for all hospital services, even when definitional differences are taken into account. This may be because specialty inpatient psychiatric and substance abuse units are located in only about one-third of all community hospitals, altering border crossing travel patterns for MHSA services from those generally exhibited for community hospital services. For other providers (e.g., outpatient departments of hospitals or primary care physicians), we are unable to assess the adequacy of the CMS all-diagnoses net flow expenditure ratios for our purposes. We suspect that the CMS net flow expenditure ratios would be acceptable because travel patterns to non-specialty providers such as primary care physicians or the emergency department are likely the same as for all diagnoses. The CMS net flow expenditure ratios may also be acceptable because these ratios for non-specialty services are generally closer to 1.00 than ratios for inpatient hospital treatment, potentially minimizing the impact of any differences between the flow ratios for MHSA and all diagnoses treatment if CMS ratios are used.
RECOMMENDATIONS
SAMHSA embarked on this study to determine the need for adjusting state estimates of MHSA treatment spending for interstate flows and to assess the HCUP SID as a possible source for some of these adjustments. HCUP SID provide detailed databases for an adjustment of hospitalization flows because of the availability of cost, payer and patient residence information in addition to the hospital location. Adjustment is important because data for estimating MHSA spending are seldom available by state of residence and because per capita MHSA spending by state of residence is needed as an analytic tool. To avoid distortions in per capita estimates of MHSA spending, state estimates produced by state of provider must be adjusted using net flow ratios before interstate comparisons can be made. Based on the findings presented in this paper, we make the following recommendations:
• Use HCUP SID MHSA inpatient community hospital net flows to adjust state-level estimates of spending on MHSA inpatient community hospitals in states where discharges from most border states are also available.
• Use detailed hospital flows from CMS to estimate flows for states with non-SID border states and for all states not available in SID. This could be accomplished using detailed inpatient hospital net flows from CMS (if they could be obtained) that would show the entire matrix of spending flows into and out of each state. We could use these data to estimate resident flows to these non-SID states, after appropriate adjustments for the difference between travel for MHSA and all diagnoses stays.
• Examine trends in MHSA net cost ratios from more recent HCUP SID years. This is important because the number of hospitals with specialty inpatient MH and SA units has declined over time, potentially altering travel patterns. Additional states added to SID in recent years could also be used to help estimate travel in earlier years.
Additional recommendations based tangentially on this analysis include:
An Exploration of State Border Crossing for MHSA Treatment in Community Hospitals 15 April 9, 2010
• Use CMS net flows to adjust state-level estimates of spending on other MHSA provider types. Net flow ratios for other providers tend to be closer to 1.00 than for inpatient hospitals. Any distortion in the net flows for MHSA treatment would be minimal as a result.
• Develop net flow ratios for all possible provider types using Medicare claims and/or Medicaid fee-for-service claims. Although these net flow ratios would be payer specific, these data would:
o Provide additional evidence of interstate travel for MHSA services. o Help in the estimation of flows for missing HCUP SID states. o Capture information on specialty outpatient providers (e.g., other MHSA
professionals and MH and SA outpatient specialty facilities) that will likely have associated net flow ratios that are different from those measured by CMS.

APPENDICES
An Exploration of State Border Crossing for MHSA Treatment in Community Hospitals April 9, 2010
A-1
APPENDIX A: HCUP Partners
HCUP is a family of powerful health care databases, software tools, and products for advancing research. Sponsored by the Agency for Healthcare Research and Quality (AHRQ), HCUP includes the largest all-payer encounter-level collection of longitudinal health care data (inpatient, ambulatory surgery, and emergency department) in the United States, beginning in 1988. HCUP is a Federal-State-Industry Partnership that brings together the data collection efforts of many organizations—such as State data organizations, hospital associations, private data organizations, and the Federal government—to create a national information resource. HCUP would not be possible without the contributions of the following data collection Partners from across the United States: Arizona Department of Health Services Arkansas Department of Health California Office of Statewide Health Planning and Development Colorado Hospital Association Connecticut Hospital Association Florida Agency for Health Care Administration Georgia Hospital Association Hawaii Health Information Corporation Illinois Department of Public Health Indiana Hospital Association Iowa Hospital Association Kansas Hospital Association Kentucky Cabinet for Health and Family Services Louisiana Department of Health and Hospitals Maine Health Data Organization Maryland Health Services Cost Review Commission Massachusetts Division of Health Care Finance and Policy Michigan Health & Hospital Association Minnesota Hospital Association Missouri Hospital Industry Data Institute Nebraska Hospital Association Nevada Department of Health and Human Services New Hampshire Department of Health & Human Services New Jersey Department of Health and Senior Services New York State Department of Health North Carolina Department of Health and Human Services Ohio Hospital Association Oklahoma State Department of Health Oregon Association of Hospitals and Health Systems Pennsylvania Health Care Cost Containment Council Rhode Island Department of Health South Carolina State Budget & Control Board South Dakota Association of Healthcare Organizations Tennessee Hospital Association Texas Department of State Health Services Utah Department of Health Vermont Association of Hospitals and Health Systems

An Exploration of State Border Crossing for MHSA Treatment in Community Hospitals April 9, 2010
A-2
Virginia Health Information Washington State Department of Health West Virginia Health Care Authority Wisconsin Department of Health Services Wyoming Hospital Association
An Exploration of State Border Crossing for MHSA Treatment in Community Hospitals April 9, 2010
A-3
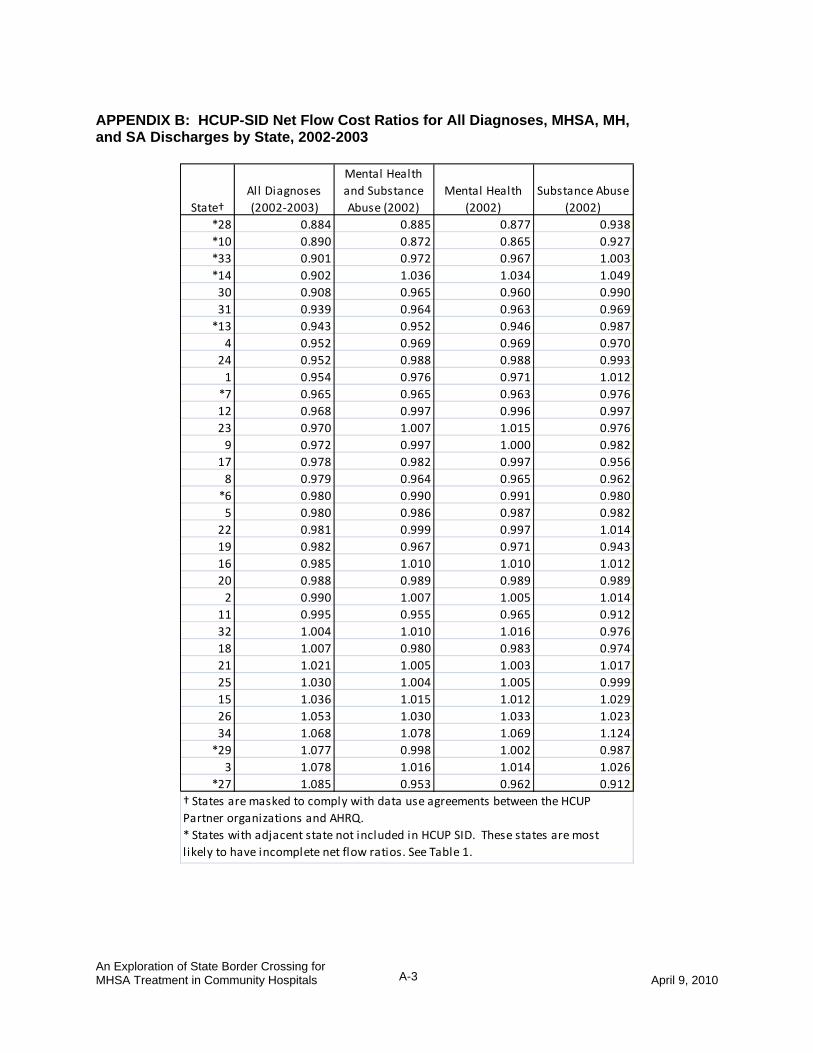
APPENDIX B: HCUP-SID Net Flow Cost Ratios for All Diagnoses, MHSA, MH, and SA Discharges by State, 2002-2003
State†All Diagnoses (2002‐2003)
Mental Health and Substance Abuse (2002)
Mental Health (2002)
Substance Abuse (2002)
*28 0.884 0.885 0.877 0.938*10 0.890 0.872 0.865 0.927*33 0.901 0.972 0.967 1.003*14 0.902 1.036 1.034 1.04930 0.908 0.965 0.960 0.99031 0.939 0.964 0.963 0.969*13 0.943 0.952 0.946 0.9874 0.952 0.969 0.969 0.970
24 0.952 0.988 0.988 0.9931 0.954 0.976 0.971 1.012*7 0.965 0.965 0.963 0.97612 0.968 0.997 0.996 0.99723 0.970 1.007 1.015 0.9769 0.972 0.997 1.000 0.982
17 0.978 0.982 0.997 0.9568 0.979 0.964 0.965 0.962*6 0.980 0.990 0.991 0.9805 0.980 0.986 0.987 0.982
22 0.981 0.999 0.997 1.01419 0.982 0.967 0.971 0.94316 0.985 1.010 1.010 1.01220 0.988 0.989 0.989 0.9892 0.990 1.007 1.005 1.014
11 0.995 0.955 0.965 0.91232 1.004 1.010 1.016 0.97618 1.007 0.980 0.983 0.97421 1.021 1.005 1.003 1.01725 1.030 1.004 1.005 0.99915 1.036 1.015 1.012 1.02926 1.053 1.030 1.033 1.02334 1.068 1.078 1.069 1.124*29 1.077 0.998 1.002 0.9873 1.078 1.016 1.014 1.026
*27 1.085 0.953 0.962 0.912† States are masked to comply with data use agreements between the HCUP Partner organizations and AHRQ.* States with adjacent state not included in HCUP SID. These states are most l ikely to have incomplete net flow ratios. See Table 1.