an expl prog on the monk gold mines ltd prop …
TRANSCRIPT

41N15NEei04 RABAZO 010
An Exploration Program
on the Monk Gold Mines
Limited Property
PHASE II
87
George H. Babcock P.Bigt
March 15, 1984.
RECEIVED.
OCT1GJ984.
MINING LANDS SECTION
r r
41N15NE8184 ee34 RABAZO 010C
- I -
Table of Content*
Psge
Y Introduction l
A Monk Gold Mines Limited - Particulars 2
II Summary and Recommendations. 3
III Location and Access to the Property. J*.
TV PHASE I - Exploration Programs Completed.
A Surface Trenching Program. 4,5
B Geophysical Sunrey. 6C Geochemical Survey. ftD Diamond Drilling Program. 7S Summary of Exploration Programs. 3
V PHASE II - Exploration Program.
1 Surface Exploration Work. 9
2 Surface Diamond Drill Program. 9
2, Underground Exploration Work. 10
VI PH.XSF III - Estimated Cost of Exploration Progra-n. 11
VTI Qualifications. l?

L - n -
Appendices.
A Prospectus - Monk Gold Mines Limited.
B Report of Exploration Work - PHASS l - 19^3 by A. Xusic 3Sc, (under separata cover).
Maps
A Location Maps - Scale l in. - 40 miles.
3 Claim Maps - l, Rabazo Twp.
- 2, Naveau Twp.
(3 Trench Location Map with ramp projection.
- Trench 5 - Plan.- Trench 6 - Plan.
D Magnetometer Survey - Plan.
E Geochemical Survey - Plan.
F Diamond Drill Hole Location - Ma?.

References.
A Summary Report on the Gold Monk Explorations Ltd., property -"" by George H. Babcock - May 28, 1982.
3 Open File Report - 5233 by R.J. Rupert, 1977 on McMurray Twp.~ Ontario Geological Survey.
C Ore Deposits of the Michipicoten Area - 1935 by Froberg Vol. XLIV Part VIII, pages 39 tj 83.
B Precambrian Geology of McKurray Township - Map, p. 24il, 197?"~ Ontario Geological Survey.
E Gold Deposits of Ontario - Part l, 1971 - by Ferguson, Groen" and Haynes.
F Preliminary Report to K. Shortt on Claim 8576~ By A.S. Bayne and Company, 1975'
G Report on Fourteen Mining Claims - (including SSM "5576) by W.K. Miller - from Geological Piles - SSH.

- l -
A Report He; An Exploration Program
on the Monk Gold Hine s; Limited Property,
PHASS II
®.George H. Babcock ?.Shg.
March 15. 1934.
Introduction
The company completed a surface exploration program on their
nine claim gold property near Wawa, Ontario in 19#3* This work
was funded by the initial underwriting and the program -completsd,
generally followed the outline in the original report of May, 1?32,
except that very little underground work was undertaken. The surface
trenching, magnetometer survey, geochemical survey and diamond drill
program showed the existance of tw3 main structures vrith important gold values a north and south zone, within the main shear.
At the present time, the company is seeking a larger underwritin-;
with funds to completely explore the two indicated zones and check
other anomolies indicated by the magnetometer and geochemical surveys
undertaken in 193?.
This new report, must be considered vrith a study on the 1932
Exploration Program for the Monk Gold Mines Ltd. by the geolsgirt A. Kusic and the Summary Report on Gold Monk Explorations Ltd. by
the author in 1982. Included within is a resume for the reralts of
the magnetometer and geochemical surveys undertaken in 190?, vrith o
complete description of the diamond drilling completad to date.
Also a summation of the additional surface ar.d underground exploration
work required to further explore the main shear area for ore t:ones
is shown, along with a cost estimate for these progr-atis.

- 2 -
A ttonk Ciold Mines Ltd. - Particulars.
A complete description of this company is presented in the Prospectus, Appendix A. The company was incorporated on March 9, 1931, as a private company with en authorized capital of 51000,000 shares. The charter was later amended to that of a public company with an additional authorized capital of 2,000,000 special shares.
All of the assets of Gold Monk Explorations Ltd. were sssuned by the now company and this new corporation holds only the nine claims in the Wawa area.
During this recent exploration work, ten trenches were excavated
and fourteen diamond drill holes were drilled to check the two gold bearing structures within the main shear zone. See: the o? mond drill
logs, assay results and plans of the trenches in the report by A. Kusic. The company should undertake an extensive diamond drill program to
completely explore the north and south zones and other anomolies outlined by the various surveys on the claims in Rabazo township.

.- 3 -
II Summary and Recommendations.
The initial exploration programs completed in 1933 indicated
two potential areas, namely the north and south zones within the
320 degree striking, main shear, wherein a sizeable tonnage of gold ore can be possibly developed by future surface and underground
exploration work.
A number of geophysical and geochemical anonolies were outlined by the limited surveys completed to date. Similar surveys should be
undertaken to explore the whole claim block thoroughly in a systematic
fashion. Then all these drill targets can be checked by an I.P. Survey
and the anomolies drilled.
There is every indication that a reasonable sized ore zone can
be developed on the Monk Gold Mines property with an additional
expenditure of S650,000 for both a surface and an underground exploration
program.
After considering the results of the recent exploration work, I
heartily recommend an expenditure of this magnitude for this property.

- 4 -
III Location and Access to the Property.
The company holds the mining rights on two water power leases
9173 and 9179 1 with one small claim 9/47 from the A. C.?., company in
the township of Naveau and six claims of approximately 240 acres,
in the township of Rabazo, namely claims 3576 (patented), 609453 1
692435, 692434, 619706 vand 609454.^ See the location Ma? A
and Claim Maps l and 2 in the Sault Ste. Marie Mining District 3 f
Ontario.
The property is serviced by good gravel roads, running '-rest from
Highway ITS and Wawa, Ontario. Doth water and hydroelectric power
can be easily obtained and good miners are available locally,
|v PHASF I - Exploration Programs. - Completed.
A Surface Trenching.
A base line with a 320 degree strike and crosslines at 100 ft. intervals was cut out by a local bush contractor across five claims
in Rabazo township, north of the Michipicoten River and one small
claim in Naveau Township, to tie in the various exploration surveys
undertaken by the company in 1933. A limited, grid line syston v;es also established by company employees 3n claim 917? of the A. C. P.. ^rou,?
to complete assessment work requirements and two diamond drill holes.
Ten trenches were excavated in 1933, four of these (l,?, 3 and 4) trenches across the North shear zone, outcropping just east of the -.r'it.
Very minor gold values were encountered in the quart?, pod-like structures
exposed with minor amounts of pyrite, chalcopyrite and tourmaline within
the tuff matrix. Two long trenches (3 and 9) were opened up across the
same structures Just west and above the adit within similar rock types,
but snly anomalous gold values were encountered even though free ^old
was observed in hand specimens.
Trenches 5, 6, 7 and 10 were excavated across structures within the south zone. A quartz vein, with gold values Df 3-32 or/ton In
hand specimens was exposed in trench Mo. 5. Trench Ho. 6 showed
inconsistent gold values over a three foot width within sheared tuff.
See trench plans. Visible gold was found in hand specimens from both
trenches. Low grade gold values were encountered in Trench "o. 7
within the sheared tuff, but cgdn individual hand specimer.s shr-:ed

- 5 -
Lhigh grade values of gold. Note Assay results. Trench !Jo. 10 was excavated across the sheared tuff horizon, showing very little sulfide mineralization with no values of gold.
- 6 -
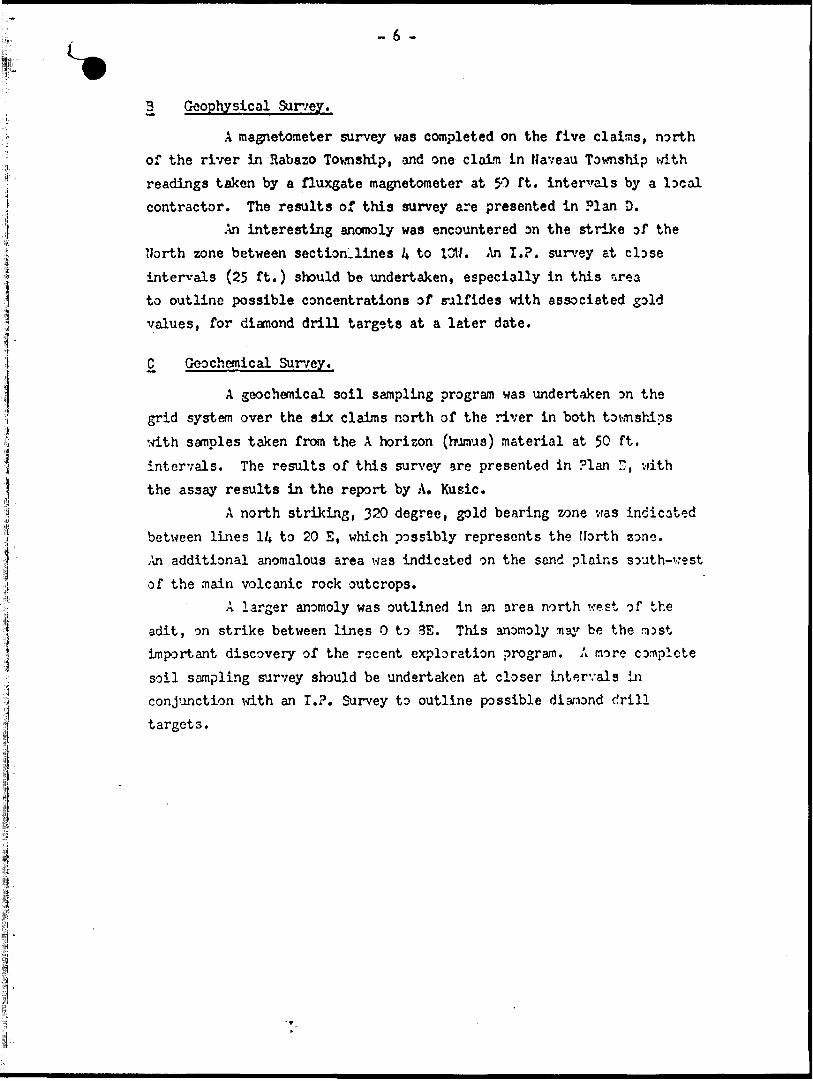
3 Geophysical Survey.
A magnetometer survey was completed on the five claims, north of the river in Rabazo Township, and one claim in Naveau Township with readings taken by a fluxgate magnetometer at 50 ft. intervals by a local contractor. The results of this survey are presented in Plan D.
An interesting anomoly was encountered on the strike of the North zone between section-lines A to 1017. An I.?, survey at close intervals (25 ft.) should be undertaken, especially in this irea to outline possible concentrations of sulfides with associated gold values, for diamond drill targets at a later date.
Q Geochemical Survey.
A geochemical soil sampling program was undertaken on the grid system over the six claims north of the river in both townships with samples taken from the A horizon (humus) material at 50 ft, intervals. The results of this survey are presented in Plan S, with the assay results in the report by A. Kusic.
A north striking, 320 degree, gold bearing zone was indicated between lines H to 20 E, which possibly represents the North sono. /in additional anomalous area was indicated on the sand plains south-west of the main volcanic rock outcrops.
A larger anomoly was outlined in an area north w.st of the adit, on strike between lines O to 3E. This anomoly may be the roast important discovery of the recent exploration program. A more complete soil sampling survey should be undertaken at closer intervals in conjunction with an I.?. Survey to outline possible diamond drill targets.
- 7 -
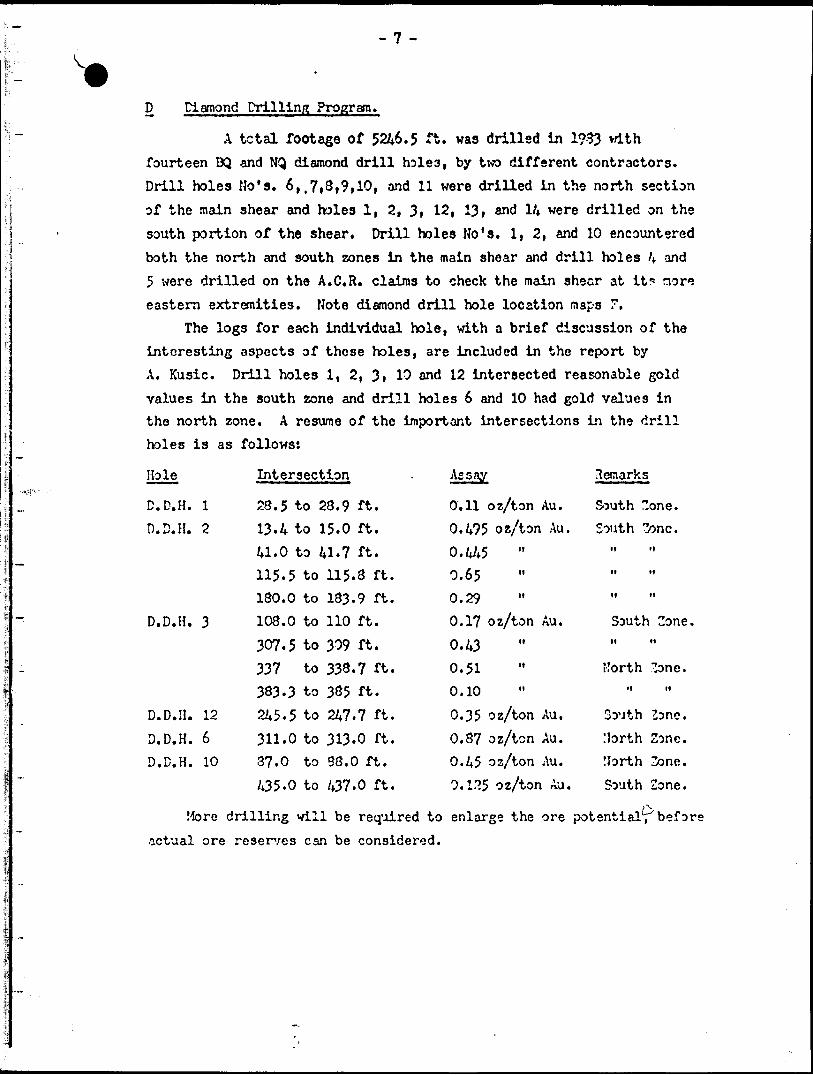
D Diamond Drilling Program.
A tctal footage of 5246.5 rt. was drilled In 1953 vdth
fourteen BQ and NQ diamond drill holes, by two different contractors.
Drill holes No's. 6,.7|3,9,10, and 11 were drilled in the north section
of the main shear and holes l, 2, 3i 12, 131 and l/* were drilled on the
south portion of the shear. Drill holes No's, l, 2, and 10 encountered
both the north and south zones in the main shear and drill holes 4 and
5 vrere drilled on the A.C.R. claims to check the main shear at it* nore
eastern extremities. Note diamond drill hole location maps F.
The logs for each individual hole, with a brief discussion of the
interesting aspects of these holes, are included in the report by
A. Kusic. Drill holes l, 2, 31 13 and 12 intersected reasonable gold
values in the south zone and drill holes 6 and 10 had gold values in the north zone. A resume of the important intersections in the drill
holes is as follows:
Hole
D.D.H. l
D. D. H. 2
D.D.H. 3
D.D.H. 12
D.D.H. 6
D.B.H. 10
Intersection
23.5 to 23.9 ft. 13.4 to 15.0 ft.
41.0 to 41.7 ft. 115.5 to 115.3 ft. 130.0 to 183.9 ft.
108.0 to 110 ft.
307.5 to 309 ft.
337 to 338.7 ft. 383.3 to 385 ft.
245.5 to 247.7 ft.
311.0 to 313.0 ft. 37.0 to 88.0 ft.
435.0 to 437.0 ft.
Assay
0.11 oz/ton Au.0.495 oz/ton Au.
0.4450.65 "0.29
0.1? oz/ton Au.
0.430.51
0.10
0.35 oz/ton Au.
0.8? oz/tcn Au.0.45 oz/ton Au.
0.125 oz/ton Au.
Setaarks
South 2 South Zone.
South Zone, it H
Morth 3one.ri tt
South Zone.
:iorth Zone,north Zone.
South Zone..
More drilling will be required to enlarge the ore potential, before
actual ore reserves can be considered.

- 3 -
2 Summary of Exploration Programs.
Free gold was seen in many hand specimens taken from trenches
on both the north and south zones of the mpin shear, but generally
only traces of gold were obtained from samples taken across these
veins with chip samples. Important gold values were obtained in chip
samples taken across flat veins in trenches, 5 and 6. These are similar
structures to those encountered in the ramp or adit, and all are
important targets for future exploration work.
A magnetometer survey gave indications of an anomoly in an area on strike with the north zone, with a similar geochemical anomoly.
A complete magnetometer survey should be undertaken to cover the
remaining claims, because surface examinations have shown that the main shear -crosses the river into Naveau Twp. and A. C. R. CI. 9173.
An I. P. Survey should be undertaken to outline possible concentrations
of sulfides v/ith gold on all the claims and a geochemical survey should
be completed over the remaining claims to search for gold anomolies.The diamond drill program completed in 1933 indicated two
possible ore zones on the north and south limbs of the main shear.
Additional drilling should be completed to expand this picture.
Recently, the aolit was pumped out and the flat veins in the
ramp were resampled. The results of these samples are presented vdth
those of D.2.H. 2, namely, 3.0 ft. of 0.62 oz/ton Au. and 3.0 ft. of
1.30 oz/ton Au. Riture underground exploration work may develop
more ore on this zone.

- 9 -
0V PHASE II - Exploration Program.
1 Surface Scplpration VJbrk.
The present grid line system should be expanded to cover all of the claims held by the company, both north and south of the river, Only small portions of the property have been mapped. A detailed geological plan should be completed to cover all the claims.
Then, a magnetometer survey should be undertaken (1 miles) over the areas not covered at this time, and an Induced ?olorir.ation Survey
completed over all.the claims (15 miles). Later, an I.?. Survey v.-ith readings at close intervals, should be undertaken to further outline areas with possible high sulfide-gold concentrations.
2 Surface Diamond Drill Program.
An extensive surface diamond drill program should be undertaken to
expand the two known potential ore zones and check all the anomolies outlined by the geophysical and geochemical surveys. The locations for some of these new drill holes are shown on the Diamond frill Hole
Location Map, but many exact locations for holes will depend upon the
results obtained on individual holes and sections, as the drilling progresses.
At least ten, new diamond drill holes of /*600 ft., st 45 and 60 degree angles, on 100 ft. interval section lines should be drilled to completely explore the south zone. Two holes No's 13 and 14 should also be deepened, because a "ein system may occur, just vdthin 100 ft. of their present bottoms.
Section line drilling (4100 ft. nin.) should also be undertaken
to explore the north zone. At least eight, 45 to 60 degros drill holes
on 100 ft. section lines would complete the ore potential picture ir. the
ramp area and at least three vertical holes should be ^ri21ed Just v/est
of the adit to check the flat vein system, now shown in the fac* of the
ranip.
Additional drill holes must be completed to access the main
geochemical anomoly on line 6Z and other areas, even the main rhear
south of the river. Another 5300 ft. of dianond drilling :nsy be
undertaken on these programs.
- 10 -
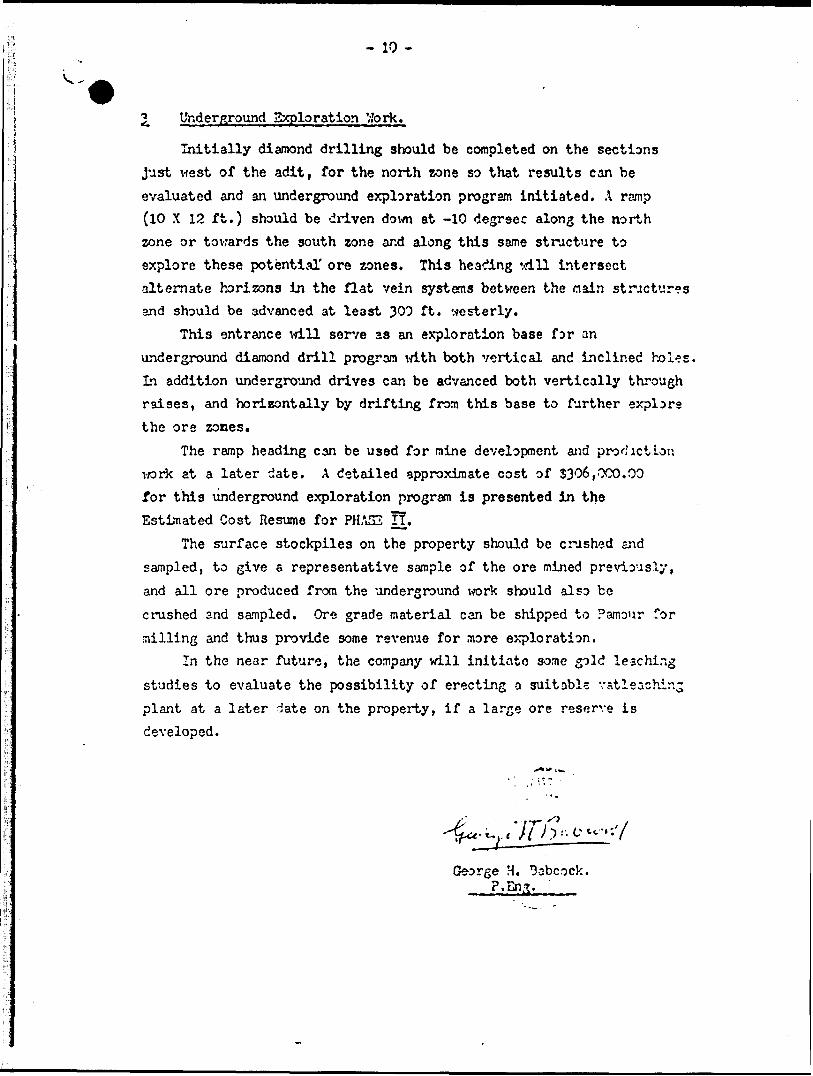
2. Underground Exploration Work.
Initially diamond drilling should be completed on the sections
just west of the adit, for the north zone so that results can be
evaluated and an underground exploration program initiated. A ramp (10 X 12 ft.) should be driven down at -10 degrsec along the north zone or towards the south zone and along this same structure to
explore these potential' ore zones. This heading will intersect
alternate horizons in the flat vein systems between the nain structures and should be advanced at least 300 ft. westerly.
This entrance will serve as an exploration base for an
underground diamond drill program vdth both vertical and inclined holes.
In addition underground drives can be advanced both vertically through raises, and horizontally by drifting from this base to further explore
the ore zones.
The ramp heading can be used for mine development and production work at a later date. A detailed approximate cost of S306,OCO.OO for this underground exploration program is presented in the
Estimated Cost Resume for PHA32 TT.
The surface stockpiles on the property should be crashed and
sampled, to give a representative sample of the ore mined previously,
and all ore produced from the underground work should also bo
crushed and sampled. Ore grade material can be shipped to Pamour for
milling and thus provide some revenue for more exploration.In the near future, the company will initiate some gold leaching
studies to evaluate the possibility of erecting a suitable vatleachin-
plant at a later date on the property, if a large ore reserve is
developed.
George H. Sabcock, P.Eng.

- 11 -
Estimated Cost of the Phase II Exploration Program.
Surface Exploration Program - Phase II
1 Line Cutting, 7 miles at 5350.00/mile
2 Magnetometer survey, 9 miles at SlS
2, I.?. Survey, 15 miles at 51000.00/tnile^ Geochemical survey
l Dia. Drill Program. UOOO' at i-JO.OO/ft.
6 Sampling, assays, etc.
J Engineering and Geological services.
SubTotal
5 2,300.00
1,200.00
15,000.00
5,0^0.00
230,000.00
20,000.00
20.000.00
t 3W.OOO.CC
Underground Exploration Work - Phase II
1 Main Ramp - 300 ft. at 3320.00/ft.
2 Six - X cuts at 50 ft. intervals at 25 ft. at S320.007ft.
^ Sxploration Raises - 2 - 250 ft. at 3140.00/ft.
4 Supplies, pipes, timber, etc,
j5 Geological sendees, assays, etc.
6 Engineering ser\dces.
1 Underground Dia. Drill Program at SIS.OO/ft. - 3300 ft.
Subtotal
S 96,000.00
/*3,000.00
70,000.00
16,000.00
16,000,00
10,000.00
50.000.00S 306,000.00
Total Estimated Cost of Phase II Program. 650.000.00
Georg'6 H. Babcock
- 12 -
George H. Babcock, P.Sng.Mining Engineer
605 Imperial St.,Ma?sey, Ontario
Canada.
Certificate of Qualification^
I, GEORGE H. Babcock of the Town of Massey, in the Province of
Ontario, Canada, do hereby certify:
1 THAT I am an honour graduate (B.A.Se) of the University Df Toronto 1951, in Mining Engineering:
2 THAT I have practised the Mining profession for thirty-three years:
^ THAT I am a Member of the Professional Engineers of Ontario and Quebec.
^ THAT I am a Member of the Canadian Institute of Miring and
Metallurgical Engineers and the American Institute of
Mining Engineers:
^ THAT I have no personal interest, nor do I expect to have an
interest in the properties involved in this report:
6 THAT this report is based upon a study jf reports and msps on
the claims, plus various visits to the property.
George H. 3abcock
Massey, Ontario March 15, 193/+.

\ //V lf*n^. V. , f i '
location Mapo
'
Honk Gold Ltd.
J V .bTiHi
i '-T\ 4.

'.TP. (fyi.15'47) . "' * * t ' '
t *'n ; *'i**o '*n"i * *'*i l
""1 -^
'B-1
RABAZO(TP.30 R.22)
A r r
DISTRICT OFALGOMA
\SECTION Or NAVEAU TOWNSHIPCLAW MAP -
SAULT STE. MARIEMINING DIVISION
SCALE: 1-INCH-4O CHAINS
f LEGEND
PATfNTED LAND CROWN LAND SALE LEASES
'LOCATED LAW LICCMSC OF OCCUPATK)N MININO RtGHTJ ONLY .
RIGHTS
KIND'S Hl&HW
RAILWAYS ^
POWER LINES
MARSH O*
UiMCS
CANCELLED

SECTION OF MM/EM; TOWNSHIP &.AIM M*P
N
'-
O--'
;
^*
f "-*
*^ i^A^-R-
V
S v-\
i
1
"i- *\* '*- -"is
t
1^ " 'l
l V""t — s- -\1 4^ii,? ;
'v,
\fc\" '^ .- "~rc•..',;..;- : - . ^AC." - ^M^ ^ __ .JN
.^^ r"^
S "-"f... 1S ^ -'' ''- ' 1
^ IIIIL rN ? JIv^r^ 1
K O * vj '-fi*m *r""
^ ^ X v\s
xl -—
\ \ 7^--^ x
L* ^\ 1 T^ \ ^ ^
-^:vv
^\
\
U'c, M H
P- — . ___
v
i " : , -." ;m ' :' ^ -f . i . v. ——— 'I--.' -^- — " ' 'J - ,- : ---,— - .., *, *, tA x * j
! , /''^: 0" 1^-A *.4.n v*r\ ' V " sv^ ;X ,
' : .. ——————— * ————————————— ..,....———— —————— \
-v.v.. *- i,. . . . ^ j L'- - -1
m~m~~ 1 ' -. *,, , , ;z^ — l ^~±-^A.C \5. .-*\\\* 1"xr- -..L*--' V-
\ -^. .-- ' pr i'*.- .. .r : '~^- —— -' ' - "
'i - -i- ' .M ^-- '^ vj"^ " -.^
'/v q THIS TW? OWMEJ) BNJ FOK STAK.1^^ ort^tR. OUT
fior

GOLD
o.t't
fJI
A.I
H.O"

PLAN GF TRtNCHcS C

i !H*'1^ - *.i~n..jup a i: m^imi.f.i-.aif.^ili, , f,^, J , , yimpar-

N
LOCMIOM WAP F
SCALE \"--100'

S^ IV Vt\ r \ \v X vs. \ S•J\"?
•??i, Peril
AONIlMfNTLEASE NO. 11(Sil *l Ik* IF.ffi.
O*-,/ 7

REPORT ON INDUCED POLARIZATION SURVEYS CONDUCTED IN THE WAWA AREA OF NORTHERN ONTARIO
41N15NE8104 C034 RABAZOOSO
On Behalf of
Monk Gold Mines Ltd. 206 Bertie Street Fort Erie, Ontario
RECEIVEDOCT l f, 1984
MINING LANDS SECTION
By
JVX Limited 27 Blue Spruce Lane Thornhill, Ontario L3T 3W8
D. Marcotte May, 1984

la l
l l l l ll l lf lllili l ll l
hi' :
f
4IN15NEIIM M34 RABAZO
TABLE OF CONTENTS
1. INTRODUCTION
2. LOCATION AND ACCESS
3. GRID DESCRIPTION
4. PERSONNEL
5. SURVEY PROCEDURES5.1 Instrumentation5.2 Procedures5.3 Data Processing
6. SURVEY RESULTS6.1 Data Presentation6.2 Anomaly Summary
7. CONCLUSIONS
APPENDICES
APPENDIX 1: Instrument Specification Sheets
APPENDIX 2: Survey Data
020C

REPORT ON AN INDUCED POLARIZATION SURVEY IN THE WAWA AREA OF NORTHERN ONTARIO
On Behalf of MONK GOLD MINES LIMITED
1. INTRODUCTION
An induced polarization and resistivity survey was conducted in the Wawa area of Northern Ontario, on behalf of Monk Gold Mines Ltd. The survey wao conducted over 6 miles of cut line, covering 6 contiguous mining claims held by Monk. The field work was conducted between March 23 and March 29, 1984.
The pole-dipole induced polarization array was employed with an 'a 1 spacing of 100 feet and with 'n' values of l to 5 (see Figure 2). The survey identified several areas of anomalous chargeability, of uncertain geological significance.
This report will outline survey methods and statistics and summarize the position and character of chargeability and resistivity anomalies that have been identified as a consequence of this survey.
2. LOCATION AND ACCESS
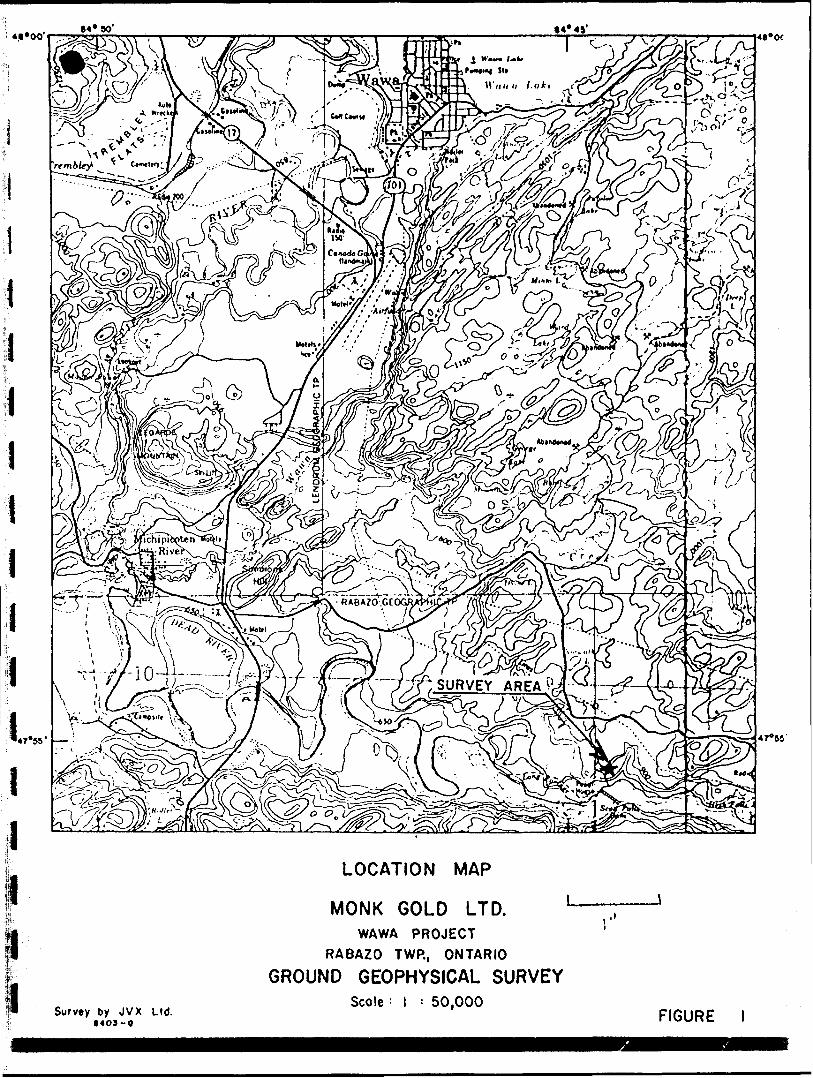
The survey area is located 12 miles southeast of Wawa Ontario. Access to the survey area is gained by the Scott Falls Road which in turn may be accessed from Highway 17, five miles south of Wawa Ontario (see Figure 1).
3. GRID DESCRIPTION
The survey grid is established on the property with imperial measures. Survey lines have been cut and picketted at 200 foot intervals along the baseline between 18W and 20E for a total of 20 lines. However, at the request of Monk Gold Mines Ltd., only lines 10W to 20E were surveyed. On all of the lines, stations are picketted at 100 foot intervals. The Baseline Azimuth is 140 0 .
To the north of the baseline all survey lines terminate at the edge of the Monk claim group, which lies between stations 5N and 15N. The survey lines extend south to the Michipicoten River where they are terminated at station 5S in the east to station 17S in the western part of the grid.
4. PERSONNEL
The following personnel contributed to the field work and to the subsequent interpretation of the data.
•4*4S'
47*M
Survey by JVX Uld.•4O3-0
LOCATION MAP
MONK GOLD LTD.WAWA PROJECT
RABAZO TWP., ONTARIO
GROUND GEOPHYSICAL SURVEYScole i l i 50,000
FIGURE l
l*
m
il lll
l ll
l ll
i 1 .. - f
l li l
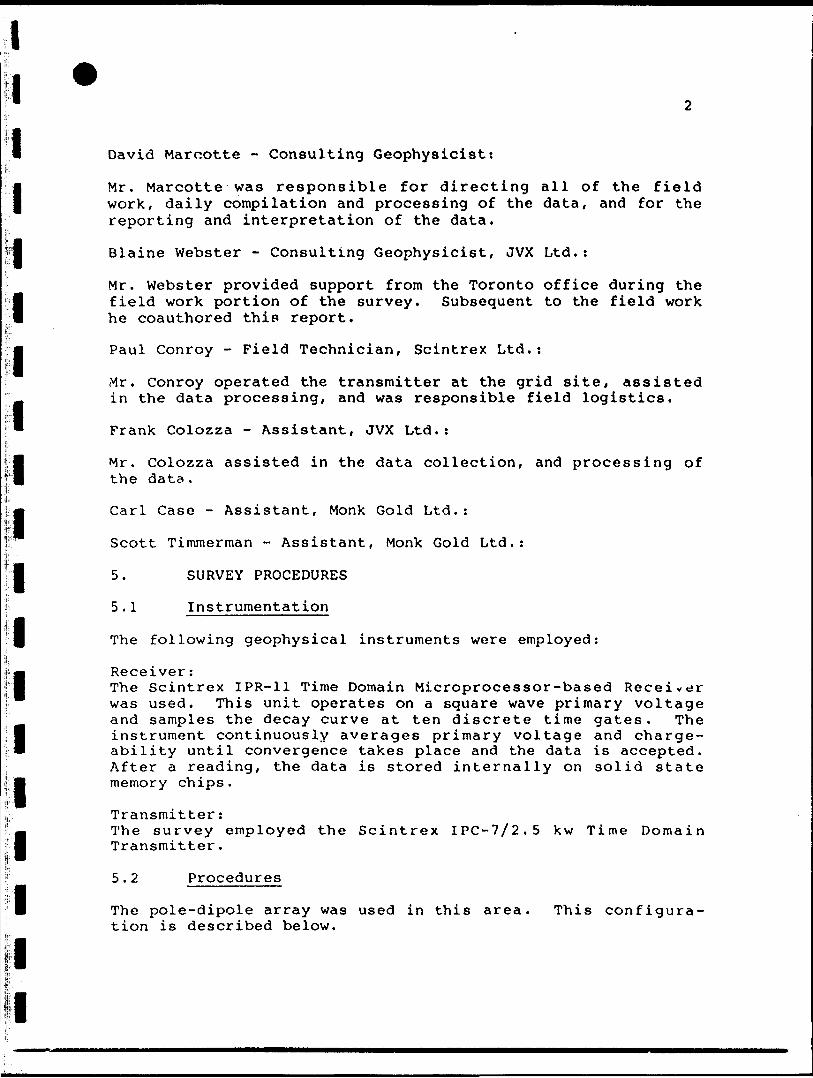
David Marcotte - Consulting Geophysicist:
Mr. Marcotte was responsible for directing all of the field work, daily compilation and processing of the data, and for the reporting and interpretation of the data.
Blaine Webster - Consulting Geophysicist, JVX Ltd.:
Mr. Webster provided support from the Toronto office during the field work portion of the survey. Subsequent to the field work he coauthored this report.
Paul Conroy - Field Technician, Scintrex Ltd.:
Mr. Conroy operated the transmitter at the grid site, assisted in the data processing, and was responsible field logistics.
Frank Colozza - Assistant, JVX Ltd.:
Mr. Colozza assisted in the data collection, and processing of the data.
Carl Case - Assistant, Monk Gold Ltd.:
Scott Timmerman - Assistant, Monk Gold Ltd.:
5. SURVEY PROCEDURES
5.1 Instrumentation
The following geophysical instruments were employed:
Receiver:The Scintrex IPR-11 Time Domain Microprocessor-based Receiver was used. This unit operates on a square wave primary voltage and samples the decay curve at ten discrete time gates . The instrument continuously averages primary voltage and charge ability until convergence takes place and the data is accepted. After a reading, the data is stored internally on solid state memory chips.
Transmitter:The survey employed the Scintrex IPC-7/2.5 kw Time DomainTransmitter.
5.2 Procedures
The pole-dipole array was used in this area. This configura tion is described below.

Pole-Dipole Array:The pole-dipole array was employed for all lines/stations. For this current configuration one current electrode is located at infinity while the other is situated on the survey line. The potential dipole is moved away from on-line current electrode at multiples (n values) of the 'a' spacing. This configuration is illustrated in Figure 2.
n -. 5 ——-————.-.- ——^: fi ..____._ _ __ . .—...
Figure 2Pole-Dipole Array (Multiple a Spacings)
The apparent resistivity is given by
- 21T naCn+1) YP
where/^a is in ohm-meters Vp is in millivolts I is in milliamperes
This equation includes a geometry dependent factor and a fact6r dependent on ground resistivity. The geometry dependent factors are listed in Table 1.
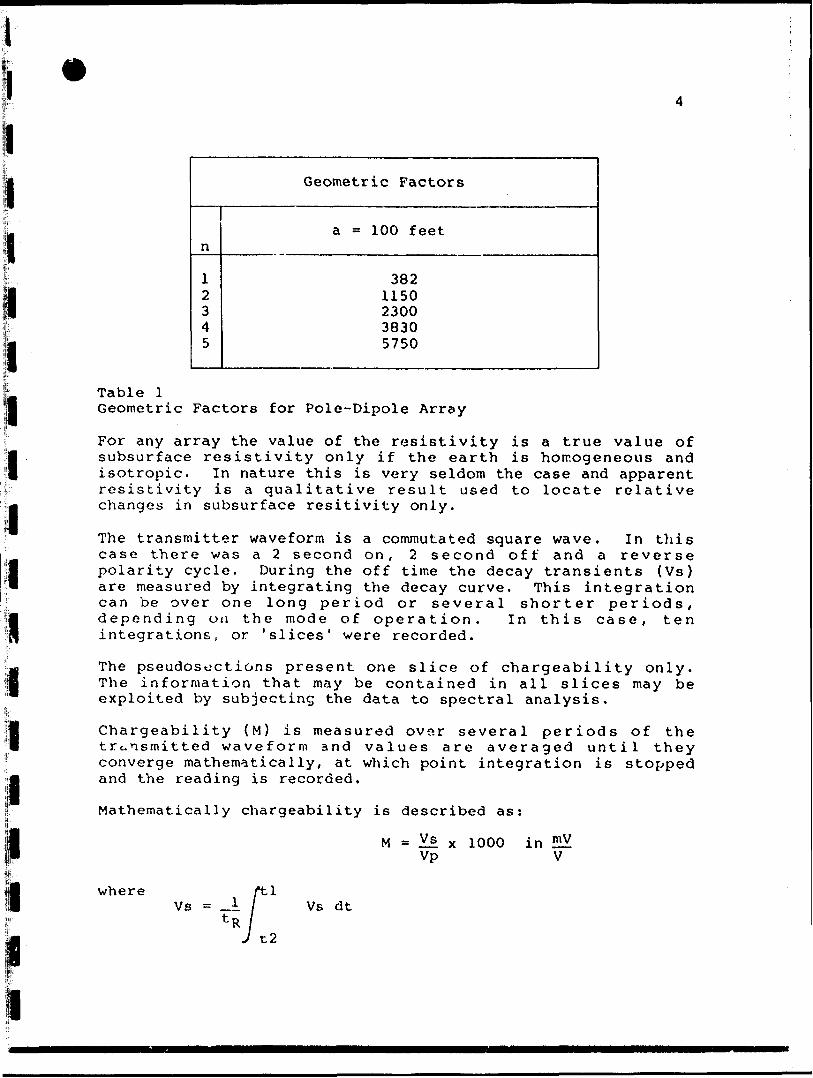
Geometric Factors
n
12345
a s 100 feet
3821150230038305750
l
i
Table lGeometric Factors for Pole-Dipole Array
For any array the value of the resistivity is a true value of subsurface resistivity only if the earth is homogeneous and isotropic. In nature this is very seldom the case and apparent resistivity is a qualitative result used to locate relative changes in subsurface resitivity only.
The transmitter case there was polarity cycle, are measured by
waveform isa 2 secondDuring theintegrating
a commutated square wave. In this on, 2 second off and a reverse off time the decay transients (Vs) the decay curve. This integration
can be over one long period or several shorter periods, depending on the mode of operation. In this case, ten integrations, or 'slices' were recorded.
The pseudosections present one slice of chargeability only. The information that may be contained in all slices may be exploited by subjecting the data to spectral analysis.
Chargeability (M) is measured over several periods of the transmitted waveform and values are averaged until they converge mathematically, at which point integration is stopped and the reading is recorded.
Mathematically chargeability is described as:
M S x 1000 in ™ Vp V
whereVs = - Vs dt

Vp s primary steady state voltage tR = integration interval (t2-t^) ti s time at beginning of integration 12 - time at end of integration
5-3 Data Processing
Subsequent to the field work, the data were processed in order to extract spectral information. Spectral analysis in time domain induced polarization utilizes all points on the I.P. decay curve in order to determine some of the characteristics of the chargeable source. In fact, the information gained from spectral analysis may be of some use in source discrimination. It has been shown {Pelton et. al. 1978) that in some Cases it is possible to discriminate between anomalies due to disseminated sulphides and those due to graphite.
In the present case, the spectral data is useful in attempting to correlate responses from known geology with responses due to unknown sources.
The two spectra] parameters that have been plotted are:
1. Time Constant - tau (seconds)This is the time constant of the I.P. decay curve. It is thought to be indicative of grain size, i.e. as grain size increases tau increases.
2. Curve Sphape Parameter - c {dimensionless)This parameter is the dimensionless exponent to the Cole- Cole impedence model, and is considered to be an indication of population distribution (c s 0.5) results from a single grain sized source, and c = 0.1 represents a mixed population.
The spectral data have been plotted in pseudosection form. Like the chargeability and resistivity data, each line has been plotted on one plate but each parameter has been plotted on a separate pseudosection.
In practice there is always a greater range of values in spec tral parameters than in the corresponding I.P. parameters. Consequently, contouring the spectral values at a fixed contour interval is an ineffective practice. In view of this, the spectral parameters (both tau and c) have been contoured at irregular intervals. In effect, the contour lines have been drawn only where it was thought there was some relevance to the data .

6. SURVEY RESULTS
6. .1 Data Presentation
For each survey line, apparent resistivity and chargeabilityhas been plotted as pseudosections. The plotting conventionfor pseudosections is defined in Figure 2.
As many of the survey lines on the Monk Gold property are short (less than 1000 feet), and since it is difficult to correlate responses on a line to line basis for short discontinuous lines, the data have also been plotted in plan view. In this case the ns4 values of apparent resistivity and chargeability were plotted and contoured. The selection of an 'n 1 value for this exercise depends on the effective minimum observable depth of the response. With increased 'n 1 value, greater depth of investigation is achieved at the expense of lost resolution. To partially offset this disadvantage the locations of charge ability and resistivity anomalies interpreted from the pseudo sections have been identified on a separate contoured inter pretation plan. The locations of the anomalies are identified by means of a bar code that is defined on the interpretation plan .
On the pseudosections, chargeability anomlies have been identified and classified according to the following scheme:
— — — — — - weak (1.5 x Background)—.—.— moderate (1.75 x Background)—————— strong ^2.0 x Background)
Resistivity anomalies have been identified when they are limited in areal extent, or where there exists a restivity contrast that correlates with a chargeability anomaly. (The resistivity data set finds more utility in extending geological boundaries from areas of known geology to areas obscured by overburden.) The zones of clearly anomalous resistivity, have been identified by a symbol (—— — — — ——) if the resistivity islow, and a solid line (——————) if the resistivity is high.
The data and interpretation are presented on 35 plates numbered and named according to the scheme defined in the followingtable.

Table 2
PLATE SUMMARY
Plate Number Contents
123456789
1011121314151617181920212223242526272829303132333435
Chargeability Contour MapResistivity Contour MapInterpretation MapChargeability and ResistivityChargeability and ResistivityChargeability and ResistivityChargeability and ResistivityChargeability and ResistivityChargeability and ResistivityChargeability and ResistivityChargeability and ResistivityChargeability and ResistivityChargeability and ResistivityChargeability and ResistivityChargeability and ResistivityChargeability and ResistivityChargeability and ResistivityChargeability and ResistivityChargeability and ResistivitySpectral PseudosectionSpectral PseudosectionSpectral PseudosectionSpectral PseudosectionSpectral PseudosectionSpectral PseudosectionSpectral PseudosectionSpectral PseudosectionSpectral PseudosectionSpectral PseudosectionSpectral PseudosectionSpectral PseudosectionSpectral PseudosectionSpectral PseudosectionSpectral PseudosectionSpectral Pseudosection
PseudosectionPseudosectionPseudosectionPseudosectionPseudosectionPseudosectionPseudosectionPseudosectionPseudosectionPseudosectionPseudosectionPseudosectionPseudosectionPseudosectionPseudosectionPseudosection
L10WL8WL6WL4WL2WLOWL2EL4EL6EL8EL10EL12EL14EL16EL18EL20EL10WL8WL6WL4WL2WLOL2EL4EL6EL8EL10EL12EL14EL16EL18EL20E
Scale
11111111111111111111111111111111111
:2400:2400:2400:1550:1550:1550:1550:1550:1550:1550:1550:1550:1550:1550:1550:1550:1550:1550:1550:1550:1550:1550:1550:1550:1550:1550:1550:1550:1550:1550:1550:1550:1550:1550:1550

e
6.2 Anomaly Summary
A zone of highly resistive rock is spatially related to the adit nearline 16E. Specifically, an envelope of high resistivity was measured between L10E and L18E, from the base line to station 800N. Within this body of highly resistive rock, zones of moderate to high chargeability were identified (see interpretation plate no. 3).
From a geophysical standpoint the source of these anomalies is conjectural, however a geologic model that includes excess silica (quartz viening) and disseminated sulphides (or graphite if it is known in the area) would account for the anomalies.
The spectral data from this area is characterized by short time constants and c values of approximately 0.3. This suggests that the chargeable mineralogy (i.e. source of the charge ability anomaly) is fine grained and fairly homogenous in composition. It should be stressed, however, that the study of spectral characteristics of time domain I. P. responses is in its infancy, and that it is difficult to determine with any certainty the mineralogy of the I.P. anomaly source from these data.
Another area of high resistivity and moderately high charge ability was mapped on line 20W at stations 400N and 700N. Here also the spectral data point to a fine grained chargeability source. These areas are identified on the interpretation plate No. 3.
Also identified on this plate are interpreted contacts and faults of unknown significance.
Other chargeability and resistivity anomalies have been identi fied, characterized and listed in Table 3.

l17 1
ll
Table 3
ANOMALY SUMMARY
1l1
1:1111
,1141
LINE
10W
6W
4W
2W
2W
0
2E
4E
6E
8E
8E
POSITION (CENTER) EXTENT RESISTIVITY
440N 100 ft. Area of very high resis tivity
SOON 50 ft. Sharp contrast(open) high resis
tivity
1150S 100 ft. low
1150S 125 ft. Broad lowarea
700S 100 ft. At contract;high to north low to south
750S 100 ft. Flank of lowarea (to south
800S 200 ft.
975S 50 ft. Low-Moderate
850S 100 ft. Low
775S 150 ft. Low
1350N 100 ft.
CHARACTER COMMENTS
Weak anomaly end of line
No charge abilityAnomaly
Weak-moderate
Strong-moderate
Moderate tohigh with depth-deepsource
Moderate
Weak
Moderate-weak
Moderate
Weak
Weak
SPECTRAL RESPONSE
0=0.2? tau*0.01
0=0.3-0.4;tau-0.030.1
0=0.2-0.4tau*0.030.01 Adjacentto hightau at1000S
0=0.4-0.7;tau*100
0=0.03-0. 1;tau"0.3
0=0 . 3 ;tau-erratic
0=0.2-0.3;tau^O-100
0=0.4;tau"0. 03-0.1
0=0 . 2 ;
0=0 . 5 ;tau^.3
0=0 . 2 ;tau*l-10
10
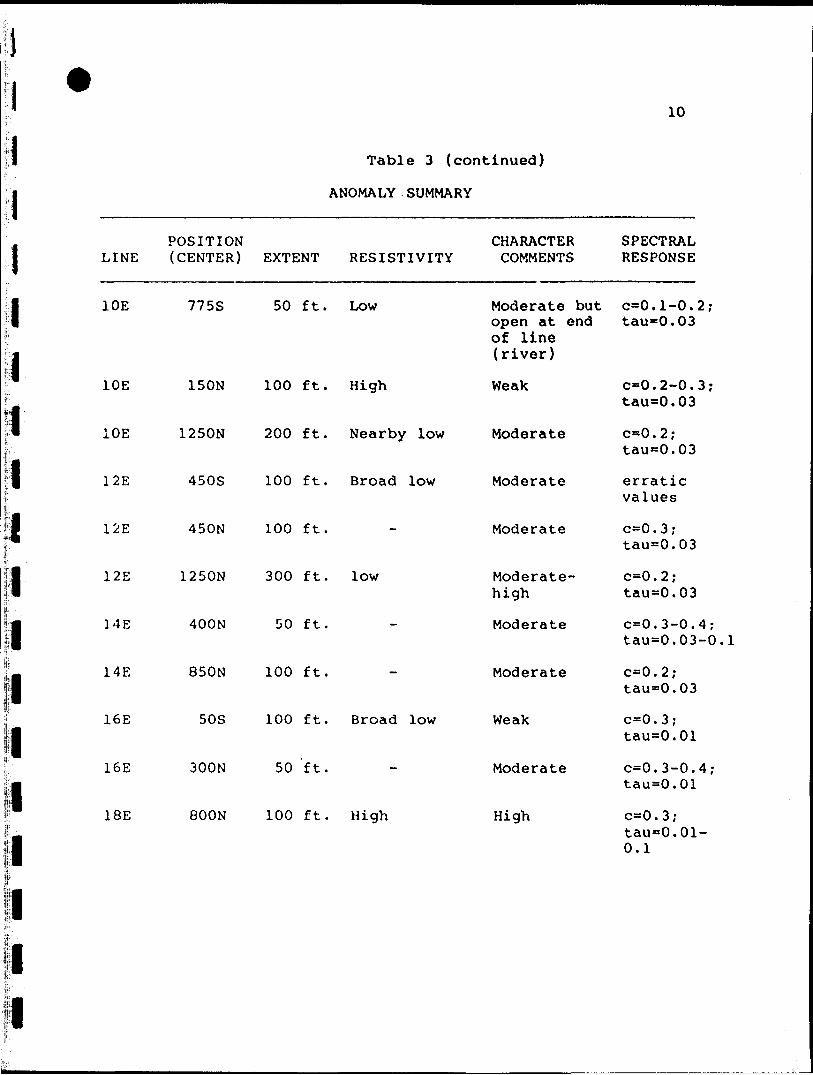
Table 3 (continued)
ANOMALY SUMMARY
li
POSITION CHARACTER SPECTRAL LINE (CENTER) EXTENT RESISTIVITY COMMENTS RESPONSE
IDE
10E
10E
12E
12E
12E
14E
14E
16E
16E
18E
775S
400N
50 ft. Low
150N 100 ft. High
450S 100 ft. Broad low
450N 100 ft.
1250N 300 ft. low
50 ft.
850N 100 ft.
SOS 100 ft. Broad low
300N 50 ft.
SOON 100 ft. High
Moderate but 0=0.1-0.2; open at end of line (river)
Weak
1250N 200 ft. Nearby low Moderate
Moderate
Moderate
Moderate- high
Moderate
Moderate
Weak
Moderate
High
0=0.2-0.3; tau*0.03
0=0.2;
erratic values
0=0.3; taus0.03
0=0.2; tau^.03
0=0.3-0.4; tau*0.03-0.l
0=0.2; taus0.03
0=0.3;
0=0.3-0.4; tau s0.01
0=0.3;
0.1
l

ll
l l l l l
J!
l
l
l
l
l
l
l
l
l
l
11
7. CONCLUSIONS
A number of chargeability anomalies have been identified on the Monk Gold Wawa property and are listed in this report. The chargeability anomalies are summarized as chargeability zones A to F on plate 3.
Zone A (6E to 16E/1N); Zone B (12E to 16E/4N); Zone C (14E to 18E/9N).
Zones A, B and C are weak to moderate chargeability anomalies associated with high resistivities that may be caused by disseminated sulphides within a highly silicified lithologicuni t .
Zone A has been drilled and the associated sulphides contain gold. Zone B and C therefore should be classified as high priority for follow-up due to their association with the same resistivity high.
The western end of zones A and B correlate to a geochemicalgold anomaly. The southern contact of Zone A is on a resistivitylow that could be a geologic contact and is so indicated onplate 3 .
Zone D (8E - 12E/12 * SON)
Weak to strong chargeability anomalies are associated with a resistivity low. The time constants are short and indicate a fine grained sulphide source.
The overburden appears to be thin in the vicinity of zones B, C and D; therefore, these anomalies should be examined by trenching .
Zone E (4E - 4W/7S)
Weak to medium strength chargeability anomalies are located in moderate resistivities on the northern flank of a resistivity high. The short time constants indicate a fine grained source.
Due to deeper overburden drilling may be necessary. A possible collar location woulT be at 2W/6S drill -45 0 to south. The target should be intersected vertically below station 7 4- SOS to 8S. The drill could be moved up to station 10S on line 2W to test the single strong anomaly between 11 and 12S.
Geological and geochemical field work should be conducted over these anomalies prior to drilling to explain the anomaly and confirm geological dip.

12
Zone P (4E - 12E/7S - 10S)
The chargeability anomalies are weak to medium and are coincident to a resistivity low. The short time constants indicate a fine grained source.
A weak geochemical anomaly is located just south of the zone; the displacement could be caused by moving of the overburden by glaciation .
A possible drillhole collar location would be on line 8E at 5 + 505 drilling -45" to the south.
Other Observations
(1) A strong isolated chargeability anomaly at 2W/11 * SOS has a distinctly different spectral character than other anomalies observed on the property. The tT s 100 second time constant indicates the sulphides/graphite source to be coarse grained and the accompanying resistivity low demonstrates the source to be electrically interconnected.
(2) The weak chargeability anomaly at 10W/440N may be the western extension of chargeability zones A and B. However, there is not enough survey coverage to conclusively demonstrate this. Also, the resistivity high associated with zon s A, B and C may be of a different geologic origin than the h^gh resistivities observed on the northern ends of lines 6W to 10W. These questions must be answered by geological mapping if outcrops are available.
(3) A geological contact, along the baseline, inferred from the magnetics data (previously collected by Monk) is also confirmed by the resistivity data and identified on plate No. 3.
(4) The geologist should colour all plan maps and pseudosections and correlate the features he observes to known geology .
It must be stressed that the gold bearing pyrite may give a very weak induced polarization response and that responses from barren pyrite will hide the exploration target. All of the IP and resistivity data must be studied and used as exploration guides in conjunction with all ancillary information.

13
The recommendations contained herein are only a starting point in evaluating the IP and resistivity results.
Respectfully submitted,
JVX LIMITED.-7
Dave Marcotte, B. Se. Consulting Geophysicist
A
Slaine Webster, B. Se. Consulting Geophysicist

FINAL ANOMALY CLASSIFICATION
Strong Chargeability j High Resistivity
Medium Chargeability . . . . . . . . .
Weak Chargeability f Low Resistivity .
rr rrr
KMTREX
r
L L
L L'
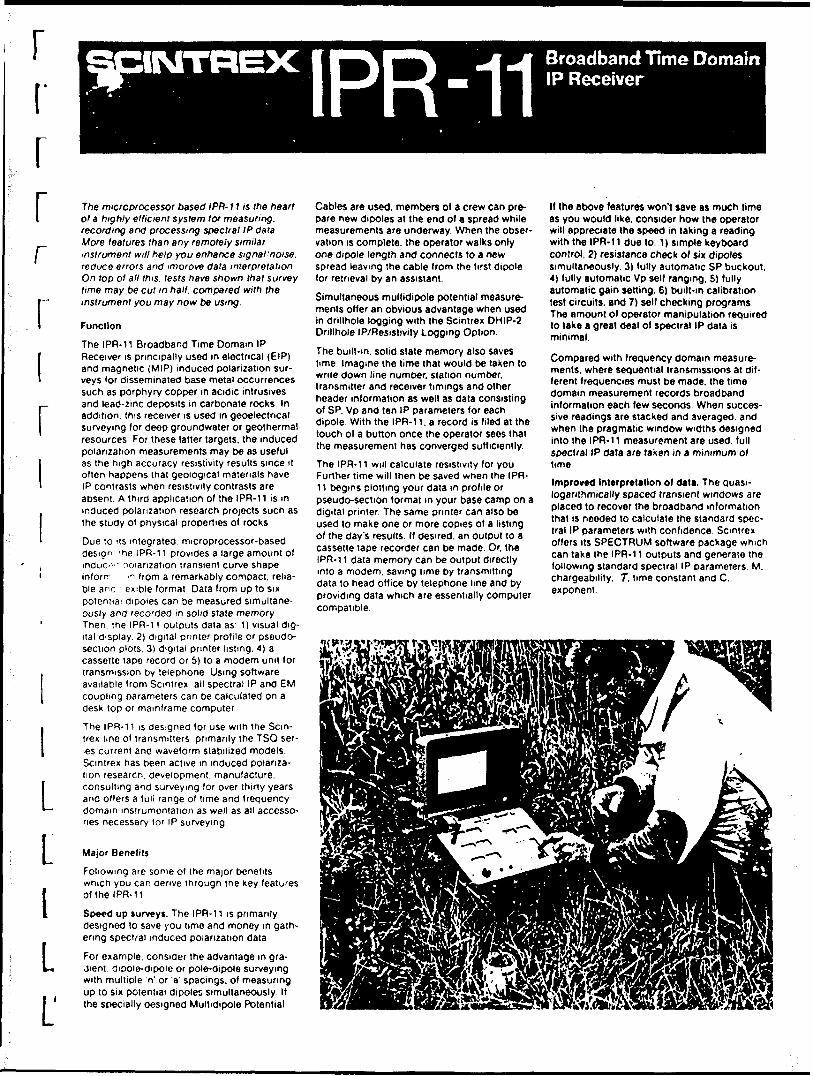
The microprocessor based l PR- J f is the heart o! a highly elticient system lor measuring, recording and processing spectral IP data More features than any remotely similar instrument will help you enhance signal'noise. reduce errors and imorove data interpretation On top ol all this, tests have shown that survey time may be cut m hall, compared with the instrument you may now be using.
FunctionThe IPR-11 Broadband Time Domain IP Receiver is principally used m electrical (EIP) and magnetic (MIP) induced polarization sur veys for disseminated base metal occurrences such as porphyry copper in acidic intrusives and lead-zinc deposits in carbonate rocks In addition, this receiver is used in geoelectrical surveying for deep groundwater or geothermal resources For these latter targets, the induced polarization measurements may be as useful as the high accuracy resistivity results since it often happens that geological materials have IP contrasts when resistivity contrasts are absent A third application of the IPR-11 is m induced polarization research projects such as the study of physical properties of rocks
Due !o its integrated microprocessor-based design 'he IPR-11 provides a large amount of induo'"' "loianzation transient curve shape mforrr :i Irom a remarkably compact, relia ble anc ' exible format Data from up to six potential dipoies can be measured simultane ously and recorded in solid state memory Then, the IPR-11 outputs data as: 1) visual dig ital display. 2) digital printer profile or pseudo- section plots. 3) digital printer listing. 4) a cassette tape record or 5) to a modern unit for transmission by telephone Using software available from Scmtrex. all spectral IP and EM coupling parameters can be calculated on a desk top or mainframe computer
The IPR-11 is designed for use with the Scm trex line of transmitters primarily the TSO ser ies current and waveform stabilized models. Scmtrex has been active m induced polariza tion research, development, manufacture, consulting and surveying for over thirty years and of'ers a full range of time and frequency domain instrumentation as well as all accesso ries necessary lo' IP surveying
Major BenefitsFollowing are some of the maior benefits which you can derive through tne key features of the IPR-11
Speed up surveys. The IPR-11 is primarily designed to save you lime and money in gath ering spectral induced polarization data
For example, consider the advantage m gra- Jient, dipole-dipole or pole-dipole surveying with multiple n' or 'a' spacmgs. of measuring up to six potential dipoies simultaneously If the specially designed Multidipole Potential
IPR-11 Broadband Time Domain IP Receiver
Cables are used, members ol a crew can pre pare new dipoies at the end of a spread while measurements are underway. When the obser vation is complete, the operator walks only one dipole length and connects to a new spread leaving the cable from the first dipole lor retrieval by an assistant.
Simultaneous multidipole potential measure ments offer an obvious advantage when used in drillhole logging with the Scmtrex DHIP-2 Drillhole IP/Resistivity Logging Option
The built-in, solid state memory also saves time. Imagine the time that would be taken to write down line number, station number, transmitter and receiver timings and other header information as well as data consisting of SP. Vp and ten IP parameters for each dipole With the IPR-11. a record is filed at the touch ol a button once the operator sees that the measurement has converged sufficiently.
The IPR-11 will calculate resistivity for you Further time will then be saved when the IPR- 11 begins plotting your data in profile or pseudo-section format in your base camp on a digital printer The same printer can also be used lo make one or more copies of a listing of the day's results If desired, an output to a cassette tape recorder can be made Or. the IPR-11 data memory can be output directly into a modern, saving time by transmitting data to head office by telephone line and by providing data which are essentially computer compatible.
If the above features won't save as much time as you would like, consider how the operator will appreciate the speed in taking a reading with the IPR-11 due to: 1) simple keyboard control, 2) resistance check of six dipoies simultaneously. 3) fully automatic SP buckout. *) fully automatic Vp self ranging. 5) fully automatic gain setting. 6) built-m calibration test circuits, and 7) self checking programs The amount of operator manipulation required to take a great deal of spectral IP data is minimal.
Compared with frequency domain measure ments, where sequential transmissions at dif ferent frequencies must be made, the time domain measurement records broadband information each few seconds. When succes sive readings are stacked and averaged, and when the pragmatic window widths designed into the IPR-11 measurement are used, full spectral IP data are taken in a minimum of time
Improved Interpretation of data. The quasi- logarithmicaliy spaced transient windows are placed to recover the broadband information that is needed to calculate the standard spec tral IP parameters with confidence Scmtrex offers its SPECTRUM software package which can take the IPR-11 outputs and generate the following standard spectral IP parameters: M. chargeability: T, time constant and C. exponent

IPR-11 Broadband Time Domain ~] IP Receiver
Interpretability of spectra! IP data are improved since time domain measurements are less affected by electromagnetic coupling effects than either amplitude or phase angle frequency domain measurements, due to the relatively high frequencies used in the latter techniques. In the field, coupling free data are nearly always available from the IPR-11, by simply using chargeability data from the later transient windows Then, in the base camp or office, the Scintrex SPECTRUM computer program may be used to resolve the EM com ponent for removal from the IP signal. The electromagnetic induction parameters may also be interpreted in order to take advantage of the information contained in the EM componentA further advantage of the IPR-11 in interpret ing spectral IP responses is the amount of data obtainable due to the ability to change transmitted frequencies (pulse times) and measurement programs by keypad entry.
Enhance (Ignal/noitt. In the presence of ran dom (non-coherent) earth noises, the signal /noise ratio of the IPR-11 measurements will be enhanced by fi where N is the number of individual readings which have been averaged to arrive at the measurement. The IPR-11 automatically stacks the information contained in each pulse and calculates a running aver age for Vp and each transient window. This enhancement is equivalent to a signal increase Of 1ft. or a power increase of N. Since N can readily be 30 or more (a 4 minute observation using a 2 second on/off waveform), the signal /noise improvement realized by the IPR-11 cannot be practically achieved by an increase in transmitter power. Alternatively, one may employ much lower power transmitters than one could use with a non-signal enhancement receiver.The automatic SP program bucks out and cor rects completely tor linear SP drift, there is no residual offset left in the signal as in some pre vious time domain receivers. Data are also kept noise free by: 1) automatic rejection of spheric spikes. 2) 50 or 60 Hz powerline notch filters, 3) low pass filters and 4) radio fre quency (RF) filters !n addition, thf- operator has a good appreciation of noise levels since he can monitor input signals on six analog meters, one for each dipole Also, with the Optional Statistical Analysis Program, he can monitor relative standard error continuously on the digital display and then file these calcu lations in the data memory when the observa tion is complete.Noise free observations can usually be made using the self-triggering feature of the IPR-11. The internal program locks into the waveform of the signal received at the first dipole (near est a current electrode) and prevents mistrig- gering at any point other than within the final 2.5 percent of the current on time. In particu larly noiiy areas, however, synchronization of
l
the IPR-11 and transmitter can be accomp lished either by a wire link or using a high sta bility. Optional Crystal Clock which fits onto the lid of the instrument.
Reduce Errors. The solid state, fail-safe memory ensures that no data transcription errors are made in the field. In base camp, data can be output on a digital printer or a read-after-write cassette tape deck and played back onto a digital printer for full verification. The (act that the IPP-11 calculates resistivity from recorded Vp and l values also reduces error.
Tho self check program verifies program integrity and correct operation of the display, automatically, without the intervention of the operator. If the operator makes any one of ten different manipulation errors, an error mes sage is immediately displayed.The Multidipole Potential Cables supplied by Scintrex are designed so there is no possibility of connecting dipoles to the wrong input ter minals. This avoids errors in relating data to the individual dipoles. The internal calibrator assures the operator that the instrument is property calibrated and the simple keypad operation eliminates a multitude of front panel switches, simplifying operation and reducing errors.
Feature*Six Olpolt* Simultaneously. The analog input section of the IPR-11 contains six identical dif ferential inputs to accept signals from up to six individual potential dipoles. The amplified analog signals are converted to digital form, multiplexed and recorded with header infor mation identifying each group of dipoles. Custom-made multidipole cables are available for use with any electrode array.
Memory. Compared with tape recording, the IPR-11 solid state memory is free from prob lems due to dirt, low temperatures, moving parts, humidity and mechanical shock. A bat tery installed on the memory board ensures memory retention if main batteries are low or if the main batteries are changed. The following df.la are automatically recorded in the memory lor each potential dipole: 1) receiver timing used. 2) transmitter timing used. 3) number of cycles measured. 4) self potential (SP). 5) primary voltage (Vp) and 6) ten transient IP windows (Mj). In addition, the operator can enter up to seventeen, four digit numerical headers which will be filed with each set of up to six dipole readings. Headers can include, for example, line number, station number, operator code, current amplitude, date. etc.In the standard data memory, up to 200 poten tial dipole measurements can be recorded. Optional Data Memory Expansion Blocks can be installed in the IPR-11 to increase memory capacity in blocks of about 200 dipoles each to a total of approximately 600 dipoles. Memory capacities will be reduced somewhat if the Optional Statistical Analysis Program is used.
J
J

rr
L L
Memory Recall. Any reading in memory can be recalled, by simple keypad entry, for inspection on the visual display. For example, the operator can call up sequential visual dis play of all the data filed for the previous obser vation or for the whole data memory.
Carefully Chown Transient Window*. TheIPR-11 records all the information that is really needed to make full interpretations of spectral IP data, to remove EM coupling effects and to calculate EM induction parameters. Ten quasi- logarithmically spaced transient windows are measured simultaneously lor each potential dipole over selectable total receive times of 0.2.1.0. 2.0 or 4.0 seconds.
After a delay from the current off time of t, the width of each of the first four windows is t. of the next three windows is 6t and of the last three windows is 121 The t values are 3,15,30 or 60 milliseconds. Thus, for a given dipole, up to forty different windows can be measured by using all four receive times. The only restric tion is. of course, that the current off time must exceed the total measuring time. Since t is as low as 3 milliseconds and since the first tour windows are narrow, a high density of curve shape information is available at short limes (high frequencies) where it is needed for confident calculation of the EM coupling parametersCalculates Resistivity. The operator enters the current amplitude and resistivity geometry (K) factors in header with each observation. If the K factors remain the same, only a code has to be entered with each observation. Then, using the recorded Vp values, the IPR-11 calculates the apparent resistivity value which can be output to the printer or cassette tape recorder.
Normalizes for time and Vp. The IPR-11 divides the measured area in each transient window by the width of the window and by the primary voltage so that values are read out in units of millivolts/volt (mils).Signal Enhancement. Vp and M values are continuously stacked and averaged and the display is updated for each two cycles. When the operator sees that the displayed values have adequately converged, he can terminate the reading and file all values in memory.
Vp Integration. The primary voltage can be sampled over 50 percent or more of the cur rent on (T) time, depending on the transmit and receive programmes selected. The inte grated result is normalized for time. Long Vp integration helps overcome random noise.
Digital Display. Two, four digit LCD displays are used to display measured or manually entered data, data codes and alarm codes.Automatic Profit* Plotting. When connected to a digital printer such as the Scintrex OP-4 hav ing an industry standard RS-232C, 7 bit ASCII serial data port, data can be plotted in a base camp. The IPR-11 is programmed to plot any selected transient window and resistivity In pseudo-section or profile form. Line orienta tion is maintained consistent, that Is station numbers on profiles are sorted in ascending number. In the profile plot the scale for resis tivity is logarithmic with 10 to 100,000 ohmme- ters in four decades with another four decades of overrange both above and below. The char geability scale is keypad selectable. In the pseudo-section plot, any one chargeability window can be presented in conventional pseudo-section form.
Printed Data Listing. The same digital printer can be used to print out listings of all headers and data recorded during the day's operation. Several copies can be made for mailing to head office or for filing in case copies are lost. Baud rate is keypad selectable at 110.300 or 1200 baud, depending on the printer used.Cassette Tape Output. A cassette recorder having an industry standard RS-232C. 7 bit ASCII serial interface may be used for storing data directly from the IPR-11. If all six d i poles are used, then 16,60 character blocks of data per observation are transferred at a rate of 1200 c-aud. The storage capacity of one side of cassette tape is approximately 1400 blocks or about 90 six dipole observations. The MFE Model 2500 is recommended since it has a read-atter-write feature for data verification.The recording format is compatible with the Texas Instruments 'Silent 700' terminals and records are made on standard digital grade cassettes. Once a cassette tape record is made, the tape can be played back onto the DP-4 Digital Printer for an additional verifica tion that the data on tape are correct.
Time domain IP transmitted wavelorm
Pseudo-section printout on DP-4 Digital Printer. Chargeability dal t are shown lor the sixth transient window (Mi) lor the dipole-dipole array and tit 'n' spacing* Line number and station number are also recorded. The contours have been hand drawn. Resistivity results can be plotted in a similar manner.
n i: i' n
l' !4

IPR-11 Broadband Time Domain IP Receiver
SENS: 8.2JWMV CH:3 S.C:5-e*
t*;
: R 6: R 8: R 6
R e p g
: F; e: R 8. R 8: R 6: R 8
4. er*?
er
P ef e :
R e
8.8LINE iT*i
l l1. 2
3 4.(L
l 16.l 17.i is.l 15.l 29.
Prolilt printout on DP-4 Digital Printer. R is resistivity on t logarithmic sale while 9 is one transient window (M.,! on a linear scale
H: i 3. 88. 6282 m "?; 6?s: ?422 1^4 ?2?214.
l 82 g. 2 5.2 4.6 3' 2? i? l? 85 e. 728.2 -l 5.71E+3
2. 8.5 E .4 52 46 33 23 l 7 I: ft? ??2816 S. 4.7E+3
3- ?.9 6.6 5.8 4.4 3.3 2.2 17 32 8.9 8.7?: 55 -4 14SW
4: 7.7 5. S 45 4.3 3.2 22 17 1.2 8.5 9.?44.5? 4. 149Et3
5: 7. i 58 4.1 3.5 25 16 11 19 12 162242 -2 264E+3
6: 5.5 7.8 58 5.1 37 27 2? 15 66 84O 4c 8. Z 2E*3
Modem. Data in the IPR-11 memory can be output directly into a modern near the field operation and transmitted by telephone through a modern terminal in or near head office, where data can be output directly onto a digital printer or tape recorder. In this way a geophysicist in head office can receive regular transmissions of data to improve supervision and interpretation of the data from field pro jects and no output device other than the modern is required in the field.External Circuit Check. Six analog meters on the IPR-11 are used to check the contact res istance of individual potential dipoles. Poor contact at any one electrode is immediately apparent. The continuity test uses an AC sig nal to avoid electrode polarization.Self Check Program. Each time the instrument is turned on. a check sum verification of the program memory is automatically done. This verifies program integrity and if any discre pancy is discovered, an error signal appears on the digital display. Part of the self check program checks the LCD display by displaying eight ones followed sequentially by eight twos, eight fours and eight eightsManipulation Error Checks. Alarm codes appear on the digital display if any of the fol lowing ten errors occur: tape dump errors, illegal keypad entry, out of calibration or failed memory test, insufficient headers, header buffer full, previous station's data not filed, data memory full, incorrect signal amplitude or excessive noise transmit pulse time incorrect and receiver measurement timing incorrect.Internal Calibrator. By adjustment of the func tion switch, an internal signal generator is connected across the inputs to test the calibra tion of all six signal inputs for SP. Vp and all M windows simultaneously. Then the software checks all parameters. If there is an error in one or more parameters, an alarm code appears on the display. The operator can then push a key to scan all parameters of all input channels to determine where the error is.
Data listing output on DP-4 Digital Printer. Header information is shown m the lirsl two lines In this cast, data art lor Lint l. Station 3. Transmitted cur rent is 80 mA Neat art the rttiltivity K lectors lor the sit dipoles 8i9i indicates that receive and transmit times art each l seconds Jht last header item records that tact thai H cycles wen tiackM. Following the header art the geophysical data lor si* dipolts which wert measured simultaneously. For each dipole, the values lor the 10 transient windows are snown on ont line. The neat line shows Vp and Sp in mV and nativity 571 f * 3 indicates that the calculated resist*:, f is S.71 * HP ohm-metres
]

rc .
r
c
Automatic SP Correction. The initial self potential buckoul is entirely automatic - no adjustment need be made by the operator. Then, throughout the measurement, the IPR- 11 slope correction software makes continual corrections, assuming linear SP drift during a transmitted cycle. There is no residual SP offset included in the chargeability measure ment as in some previous time domain receivers.
Automatic Vp Self Ranging. There is no man ual adjustment for Vp since the l PR-11 auto matically adjusts the gain of its input amplifi ers for any Vp signal in the range 100 microvolts to 6 volts.Spheric NoiM Refection. A threshold, adjusta ble by keypad entry over a linear range of O to 99, is used to reject spheric pulses. If a spheric noise pulse above the set threshold occurs, then the IPR-11 rejects and does not average the current two cycles of information. An alarm code appears on the digital display. If the operator continues to see this alarm code, he can decide to set the threshold higher.
Powertlne and Low Pass Filter, An internal switch is used to set the IPR-11 for either 50 or 60 Hz powerline areas. The notch filter is automatically switched out when the 0.2 second receive time is used since the filters would exclude EM signals.RF Filter. An additional filter in the input cir cuits ensures that radio frequency interference is eliminated from the IPR-11 measurement.Input Protection. If signals in excess of 6 V and up to 50 V are applied to any input circuit, zener diode protection ensures that no dam age will occur to the input circuits.
Synchronization. In normal operation, the IPR- 11 synchronizes itself on the received wave form, limiting triggering to within Z.5% of the current on time. However, for operation in locations where signal/noise ratios are poor, synchronization can be done either by running a cable from the transmitter or by using the Optional Crystal Clock which can be installed in the lid of the IPR-11Optional Statistical Analytl*. As an option, the IPR-11 can be provided with software to do statistical analysis of some parameters. The relative standard error is calculated, displayed on the CCD display and may be recorded in data memory. The total dipole capacity of data memory will be reduced, depending on the extent of statistical data recorded. If the Optional Statistical Analysis Program is chosen, some thought should be given to pur chasing one or more blocks of Data Memory Expansion.Software for EM Coupling Removal, In tran sient measurements, the EM coupling compo nent occurs closest to the current off time (i.e. It is primarily in the early windows). Thus, it is
usually possible to obtain corpiing-free IP data simply by using the later windows of the IPR-11 measurement program. If. however, full spectral information is desired, the data from the early windows must be corrected for the EM component. This can be done with confi dence using a desk top of mainframe compu ter and the Scintrex SPECTRUM program.
Software lor Spectral IP Parameter*. Using the chargeability data from the ten quasi* logarithmically spaced IPR-11 windows, a desk top or mainframe computer and the Scin trex SPECTRUM program, spectral IP parame ters can be calculated. The basis for this calcu lation as well as for the EM coupling removal calculation is discussed In a technical paper by H.O. Seigel. R. Ehret and l. Brcic. given at the 1980 Society of Exploration Qeophysicists Convention, entitled 'Microprocessor Based Advances in Time Domain IP Data Collection and In-Field Processing".
OperationIn relation to the efficiency with which it can produce, memorize, calculate and plot data, the IPR-11 is quite simple to operate, using the following switches and keypad manipulations.
Power On-Olt. Turned on to operate the instrument.Reset. Resets the program to begin again in very poor signal/noise conditions
Function Switch. Connects either the potential dipoles or the in'^rnal test generator to the
input amplifier} or connects the external cir cuit resistance check circuitry to the potential dipoles.
Keypad. The ten digit and six function keys are used to: l) operate the Instrument. 2) enter Information, 3) retrieve any stored data item for visual display, and 4) output data on to a digital printer, cassette tape deck or modern. Examples of some of these manipulations, most of which are accomplished by three key strokes, follow. E is the general entry key.A concise card showing the keypad entry codes is attached inside the lid of the IPR-11
Example 1. Keying 99E commands the battery test. The result is shown on the digital display.
Example 2. Keying 90E tells the IPR-11 to use the 0.2 second receive time..91, 92 and 94 cor respond to the three other times.
Example 3. Keying 12M results in the display of the chargeability of the first dipole, window number 2, during the measurement. Similarly, 6SP or 4 Vp would result in the display of the SP value in the sixth dipole or Vp in the fourth dipole respectively.Example 4. Keying NNNNH. where N is a vari able digit, records an item of header informa tion. Seventeen such items can be entered with each file of up to six dipoles of data.Example 5. 73E. 74E or 75E are used to output the data from the memory to the digital printer or modern at 110,300 or 1200 baud respectively
Nominal total receive time: 0.2.1,2.4 sec
11111 6t 6t A Delay
IPR-1 J trtnsient windows
6t Window Width

IPR-11 Broadband Time Domain ~j IP Receiver
IPR-11 Options
The following options are available for pur chase with the IPR-11.
Multidlpote Potential Cables. These cables are custom manufactured for each client, depend ing on electrode array and spacmgs which are lo be used. They are manufactured in sec- lions, with each section a dipole in length and terminated with connectors For each observa tion, the operator need only walk one dipole length and connect a new section, in order to read a new six dipole spread There is no need to move the whole spread. The connectors which join the cables are designed so that there is no possibility of connecting the wrong dipole to the wrong input amplifier The out side jacket of tnese cables is flexible at low temperatures About 6 percent extra length is added to each section to ensure that the cable reaches each station
Data Memory Expansion Blocks. The standard data memory of the IPR-11 allows for data (or up to 200 dipole measurements to be recorded, assuming a common header lor six dipoies Up to three ad Jitionai memory blocks can be installed in the instrument, each ol about 200 dipole capacity
Statistical Analysis Program. Scintrex can pro vide, in EPROM. a statistical program to give real time calculations of relative standard error of the 10 IP windows in a selected dipole II this option is chosen, one or more Data Memory fcxpansion Blocks may be warranted
Crystal Clock, Scintrex can provide a high Stability clock to synchronize the IPR-11 with a similar clock in the transmitter This option is. however, only required lor work in extremely noisy and'or low signal environments
The takeouts ot the Multidipoie Potential Cables allow tor connection to a porous pot o' other elec trode as well as lor connection ol the ne f t section ol cable usually one dipole in length
Software. Scintrex offers its SPECTRUM pro grams for EM coupling removal, calculation of EM induction factors and calculation ol the same spectral IP parameters as are in com mon use in frequency domain IP measurements
Digital Printer. The Scintrex DP-4 Digital Prin ter is a modified Centronics Microprinter with an RS-232C. 7 bit ASCII serial port It is a self contained module, including 110/230 V power supply, control electronics and printing mech anism. It produces copy on aluminum coated paper by discharging low voltages through tungsten styli Characters are formed from the appropriate dots of a 5 x 7 dot matrix All 96 standard ASCII characters are available, the paper width is 120 mm and 80 characters can be printed per line at a rate of up to 150 lines per minute
Cassette Tap* Recorder. The MFE Model 2500 with read-after-write verification is recom mended It has an RS-232C. 7 bit ASCII serial interface with a recording format compatible with the Texas Instruments 'Silent 700' terminals
Modern. A number ot modern units are available on the market which are compatible with the IPR-11. Scintrex would be pleased to recom mend or supply such equipment if required.
T.ie cassette Itpe recording format ol the IPR-1 1 is compatible with the Texas Instruments 'Silent 700 terminals which can be used lor printing out. editing, copying tapes or transmitting data lo a simiia' termi nal using telephone lines
Data can be transferred directly from the \PH-11 into tn inexpensive persona' computer such K this Apple II model which can use (n* SPECTRUM Programme to calculate spectral IP parameters, carry out other cal culations, ditolay data graphically on a video display and plot data

Technical Description oithelPR-11 Broadband Time Domain IP Receiver
Indusiiy standard cassefle recorders such as mis MF f 7500 can be connected directly to the IPR- 11
DP-4 Digital Printer
Input Potential DlpotetInput ImpedanceInput Voltage (Vp) Rang*
Automatic SP Bucking Rang*Chargeability (M) Rang*Absolute Accuracy of Vp. SP and M
Resolution of Vp, SP and M
IP Transient Program
Vp Integration Time
Transmitter Timing
Header Capacity
Data Memory Capacity
External Circuit Check
Filtering
Internal Calibrator
Digital Display
Analog Meters
Digital Data Output
1 to 6 simultaneously4 megohms100 microvolts to 6 volts (or measurement. Zener diode protection up to 50 Vt1.5VO to 300 mV/V (mils or 0/00)
Vp; i3* ol reading lex Vp *. *00 microvoltsSP; *3C* of SP bucking rangeM; t3H of reading or minimum tO 5m V/V
Vp; 1 m V above 100 m V approaching 1microvolt at 100 microvoltSP; 1 m VM; 0.1 m V/V except for M0 to M, in 0.2 secondreceive time where resolution is 0.4 m V/V.
Ten transient windows per input dipole. After a delay from current off of t. first four windows each have a width of t. next three windows each have a width of 6: and last three windows each have a width of 12t. The total measuring time is therefore 58t. t can be set at 3.15.30 or 60 milliseconds for nominal total receive times of 0.2.1,2 and 4 seconds.In 0.2 and 1 second receive time modes; 0.51secIn 2 second mode; 1.02 secIn 4 second mode; 2.04 secEqual on and off times with polarity change each half cycle. On/off times of 1.2.4 or 8 seconds with i2.5% accuracy are required.Up to 17 four digit headers can be stored with each observation.
Depends on how many dipoles are recorded with each header If four header items are used with 6 dipoles of SP. Vp and 10 M windows each, then about 200 dipole measurements can be stored. Up to three Optional Data Memory Expansion Blocks are available, each with a capacity of about 200 dipolesChecks up to six dipoles simultaneously using a 31 Hz square wave and readout on Iron! panel meters, in range ol O to 200 k ohms.RF filter, spheric spike removal; switch ible 50 or 60 Hz notch filters, low pass filters which are automatically removed from the circuit in the 0.2 sec receive time1000 mV of SP. 200 mV of Vp and 24.3 mV/V of M provided in 2 sec pulsesTwo. 4 digit LCD displays. One presents data, either measured or manually entered by the operator. The second display; 1) indicates codes identifying the data shown on the first display, and 2) shows alarm codes indicating errors.Six meters for; 1) checking external circuit res istance, and 2) monitoring input signals.
RS-232C compatible, 7 bit ASCII, no parity, serial data output for communication with a digital printer, tape recorder or modem.

Technical Description ofthelPR-11 Broadband Time Domain IP Receiver
T
Standard Rechargeable Power Supply
Ditpotabfc Batlery Power Supply
Optional Items
Shipping Weight
SCIMTREX?Z2 Snidercrolt Road Concord Ontario Caiada UK 1B5
Telephor,o:(416)669-2280 Cable: Geoccmt Toronto Telex 06-96^570
Geophysical t no Geochemical Instrumentatioi. aixl Services
DATA
Eight Eveready CH-i rechargeable NiCad D cells provide approximately 15 hours ot con tinuous operation at 25*C Supplied with a battery charger, suitable tor 110/230 V. 50 to 400 Hz. 10 W.
At 25* C. about 40 hours of continuous opera tion ere obtained from 8 Eveready E95 or equivalent alkaline D cells.
At 25* C, about 16 hours of continuous opera tion are obtained from 8 Eveready 1150 or equivalent carbon-zinc D cells.
Olmendont
WeightOperating Temperature RangeStorage Temperature Range
Standard Item*
345 mm x 250 mm x 300 mm. including lid.
105 kg. including batteries.-20 to *55*C. limited by display-40to*60'C
Console with lid and set ot rechargeable bat teries. 2 copies of manual, battery charger.Muitidipoie Potential Cables. Data Memory Expansion Blocks. Statistical Analysis Pro gram. Crystal Clock. SPECTRUM Program. Digital Printer, Cassette Tape Recorder, Modem.
IPR-TI L CD displays,
25 kg includes reusable wooden shipping case.
INDEX (VARIABLE
l
l 3
J

SCIIMTREX lpQ^T " ^lnduced Polanzatronand commutated DC Resistivity Transmitter System
Funclion
'""t: 'PC 7
Features
"\'J is j medium power S! o (T1 oesignec tor tu'ie do
;'.'!: roianjation or commuialfCiu .•.of. it 'S 'ne stanco'C po/.e' g s,'Ste"i i, sea on most surveys
T f 3
meo* ;
cyc .he put
s.sisrr coi'jisti. 'it ihree moouies A:stT ''!!tj r CvJnf,o ( e -IcniaininQ a s' vrriC-r a r (! f.'ior''onics a Motorif-iatoi a ri O a Dunifi^ Loaa mounteo in Trar.sniiiter Console cover The purpose re Dummy toad is to accept tne Moto'
o' output aunng tncse pans o! the le //nee current is not transrnittea into ground in oidor to improve power out ana prolong engine lile.
The (svouraDio power-weight ratio ana com pact design ot iriis system make i! portable ano highly versatile tor use with a \ iOe variety ot electroOe arrays
f'i motor generator outpul 2 5 '\'J fi porter Ou
Technical Description of IPC-7/2.5 kW Transmitter System
) systemws wiift we too'
b 5-'."i.,.','iro' ore,,"' roDW suipnatf -\e' a^^'^iv iO3C t'fsvi'it
,- S* W .•.•d p i:."i..'.v tcr'fve Ann lie ana
l—L.
Transmitter Console
Maximum Output Power
Output Current
Output Voltage
Automatic Cycle Timing
Automatic Polarity Change
Pulse Durations
Voltage Meter
Current Meter
Period Time Stability
Operating Temperature Range
Overload Protection
Open Loop Protection
Undervoltage Protection
Dimensions
Weight
Shipping Weight
Motor Generator
Maximum Output Power
Output Voltage
Output Frequency
Motor
1.85 kW maximum, defined as VI when cur rent is on. into a resistive load
10 amperes maximum
Switch selectable up lo 1210 volts DC
T:T T;T; on:ott:on:oft
Each2T
Standard: T z 2.4 or 8 seconds, switchselectableOptional: T r 1.?.4 or 8 seconds switchselectableOptional T r 8.16.32 or 64 seconds, switchselectable
1500 volts full scale logarithmic
Standard 10.0 A lull scale logarithmic Optional 0.3. 1 0. 3.0 or 10 O A lull scale linear, switch selectable
Crystal controlled lo better than 01 w c
-30 0 C to *5S'C
Automatic shut-oil at output current above 100 A
Automatic shut-otl at current below 100 mA
Automatic shut-otl at output voltage less than 95 V
280 mm x 460 mm x 310 mm
30kg
41 kg includes reusable wooden crate
Weight
Shipping Weight
2.5 kVA. single phase
110 V AC
400 Hz
t stroke. 8 HP Briggs S Stratton"59 kg" —~--.-
90 kg includes reusable wooden crate
222 Snidercrolt Road Concord Ontario Canada L4K 1B5
Telephone: (416)669-2280 Cable: Geoscint Toronto Telex: 06-964570
Geophysical and Geochemical Instrumentation and Services

ii iif.ii
i l• m
l
l
Preprint subject to later revision, for information of delegates to the 53rd SEG Annual Meeting Only
SPECTRAL IP PARAMETERS
AS DETERMINED THROUGH TIME DOMAIN MEASUREMENTS
by
lan M. JohnsonScintrex Limited
Toronto, Ontario, Canada
Prepared for Presentation Society of Exploration Geophysicists
Annual Meeting Las Vegas, Nevada
September 11-15, 1983

,*
l l l l l l l fi l ll™
liljj.
'iiy
l
l
II,
,i,
l
SPECTRAL IP PARAMETERS AS DETERMINED THROUGH TIME DOMAIN MEASUREMENTS
l. INTRODUCTION
The induced polarization phenomenon was first observed as a relaxation or decay voltage as a response to the shut-off of an impressed DC signal t This decay was seen to be quasi-exponential with measureable effects several seconds after shut-off. Differences in the shape of decay curves seen for different polari- zable targets have been recognized from the start (Wait, 1959). A systematic method of analyzing time domain responses in order to generate an unbiased measure of source character has, until recently, been lacking. Developments in the frequency domain have been more pronounced.
Although the time domain and frequency domain measurements are in theory equivalent, the frequency domain analysis procedures have proved more manage able. This results from the fact that frequency domain data measure the complex impedance of the earth directly. Not only is the impulse response not measured directly in time domain, but it cannot be fully resolved using an input of transmitted pulses of finite duration. As a result, the theoretical framework and analysis procedures for time domain measurements have been underdeveloped. This is despite the fact that the time domain method is in common usage and the measurement is potentially more efficient as a more complete description of the system characteristics is possible from measurements made at the same time.
In an attempt to improve our understanding of time domain IP phenomenon, the Cole-Cole impedance model, developed and tested in the frequency domain, is used to generate the equivalent time domain responses. Time domain field data is then analyzed for Cole-Cole parameters and the results used to interpret differences in source character.
The theoretical basis for the work will be presented. The instrumentation required to effect the measurement and analysis will be described. Field examples will be discussed.
2. SPECTRAL IP
Much has been said over the recent past about "spectral IP". The term has been used to title a variety of methods which look beyond the familiar resistivity and chargeability (or percent frequency effect) as measured in electrical surveys. A number of geophysical instrument manufacturers/contractors have developed instrumentation and methodologies which in essence collect and analyze electrical survey data at a number of frequencies or delay times. The analysis produces a set of quantities (labelled according to the method involved) which characterize the information gained. These quantities or parameters are promoted by the sponsor for application in a variety of search problems for

mineral and hydrocarbon resources. There remains, however, little or no agree ment on quantities to be measured or parameters generated. Indeed, proponents use the same terminology to describe parameters which are defined differently and vice versa.
It is understandable therefore that some confusion exists and users are wary of applying the new methods available. Probably in excess of 95Z of all IP/ resistivity surveys currently undertaken for mineral targets are of the conventional type. That is, data is presented in pseudosections of resistivity and chargeability (preferred slice) or percent frequency effect. Spectral information (the shape of the decay curve or the response with varying frequency) is not measured, retained or analyzed.
In the interest of encouraging a degree of standardization and in recognition of the pioneering work of Pelton (Pelton et al, 1978), the Cole-Cole impedence model is herein adopted. The model has been extensively field tested and found to be reliable. Other models have been and will continue to be proposed. Given our current level of understanding and the practicalities of most IP/resistivity surveys, it is possibly more important at this point to amass field experience with spectral IP where the parameters measured are independent of the method employed (time vs frequency). Situations can then be compared and the benefits agreed upon.
The use of spectral IP is far short of routine for reasons more fundamental than impedance mode standardization. In general, spectral IP surveys have been done only at extra cost. Field production rates have been markedly slower due to the need to scan over a range of frequencies. The data is often analyzed much later than and far removed from the field work; again at an additional charge. Both extra cost and time delays are virtually eliminated in the method described herein.
3. THE COLE-COLE IMPEDANCE MODEL
The work in the frequency domain by Pelton et al (1978) suggests that the complex impedance (transfer function) of a simple polarizable source is best expressed as
O)Z (w) - RO I l - m
where
Z(u) " complex impedance (in ohm-meters)R 0 - the DC resistivity (in ohm-meters)m " the chargeability amplitude (in mV/V)T " the time constant (in seconds)w " the angular frequency (in seconds ~*)c - the exponent (or frequency dependence) (dimensionless)

The DC resistivity (Ro ) is related to and in most situations approximated by the apparent resibtivity given by conventional electrical methods. The chargeability amplitude (m) is the residual voltage which would be seen immediately after shut-off of an Infinitely long transmitted pulse (Seigel, 1959). It is related to the traditional chargeability as measured a finite time after shut-off of a pulse of finite (usually 2 seconds) duration. The time constant (T) and exponent (c) are those newly measureable physical properties which describe the shape of the decay curve in time domain or the phase spectrum in frequency domain. The time constant has been shown to range from approxi mately 0.01 seconds to greater than 100 seconds and is thought of as a measure of grain size. The exponent has been shown to have a range of interest of from 0.1 to 0.5 and is thought of as a measure of the uniformity of the grain size of the target. A good review of the current understanding of the meaning of variations in T and c has been written by Hallof (1983).
The selection of the Cole-Cole model is the primary step in simulating the spectral response of a single polarizable target. A number of other effects are present to greater or lesser extent depending on the geoelectric environment. Multiple targets of differing characteristics will cause overlapping effects and may confuse the method. All measurements will contain a component due solely to electromagnetic Induction. In very conductive terrain, this contribution may be large enough to dominate and thus mask the IP effects (Hallof et al, 1980). The EM effect itself may be a valued measurement in its own right (Zonge et al, 1980).
As a minimum, therefore, spectral IP methods should be capable of generating the Cole-Cole parameters of a polarizable target and some measure of the electro magnetic effects.
4. SPECTRAL IP IN THE TIME DOMAIN
The most extensive attempts at spectral IP in the time domain appear to have been made by Halverson et al (Halverson et al, 1978). Their work, although extensive, is of limited use as much remains unpublished.
The first studies of the shape of the time domain decay given a Cole-Cole impedance model have been made by Jain (1980) and Tombs (1981). Both authors show a number of numerically generated decay curves, each of which corresponds to a particular Cole-Cole parameter set. Both authors match measured decays to those numerically generated to give a preferred set of Cole-Cole parameters (principally T and c). In both cases the method is neither developed to full potential ror completely exercised and their conclusions are limited. In their numerical modelling, Jain uses the infinite sum expansion developed by Pelton et al (1978). Tombs uses the a Fourier Series expansion. The latter is both mathematically simpler and conceptually easier to relate to to the frequency domain and has been used in our approach.
From Tombs (1981), the *, O, -, O transmitted current of unit amplitude and of pulse time T seconds used in conventional time domain IP may be expressed in Fourier Series form as:

Kt) - Ln-l
cos nn — cos 3mi mi t(2)
The steady-state voltage as measured at the receiver dipole pair given a Cole-Cole impedance of Z(w) is given as:
V(t) - Iml
Z 2 Icos n* ^\ T
cos 3nu
n-lH*) 2T (3)
From the above expressions, a few comments on the frequency content of the input (I(t)) are useful. From equation (2), the lowest frequency contained is the fundamental (e.g. fo - .125 Hz for a pulse time of 2 seconds). Higher frequencies appear in decreasing amplitudes. The output (V(t)) contains only those frequencies of the input but modified in amplitude and phase by Z(w).
It is often remarked at this point that the "effective" frequency range of the traditional time domain measurement with a 2 second on-off waveform is too limited to conduct meaningful spectral discrimination. Altering the duration of the primary pulse is suggested as a way to overcome the problem. Our experience with the method outlined herein would indicate otherwise. Indeed, the 2 second pulse is quite sufficient for routine Spectral IP under normal conditions.
The most practical method of extracting Spectral IP parameters is to compare measured decays with a suite of master curves. The master curve set is numeri cally generated assuming a reasonable range of time constant and exponent values. The master curve set includes the effects of integration and normali zation by the primary voltage (Vp).
Developments from here on are dictated in large part by the characteristics of the IP receiver used. A full discussion of the Scintrex IPR-11 Time Domain Receiver may be found in Seigel et al (1980).
5. THE IPR-11 SPECTRAL IP METHOD
The spectral IP approach used for IPR-11 type data may be summarized as follows:
1. Sets of master curves for particular Cole-Cole parameters (tau, c) for particular pulse time and receive time windows are calculated.
2. The measured curve is compared against all master curves. The best fit gives preferred values for m, tau and c.
3. If early time (i.e. high frequency) data has been collected (i.e. less than 100 ms after shut-off), a residual EM curve is analyzed and fitted to a decaying exponential (c-1).

4. The IP and EM parameters as well as "goodness of fit" measurements are listed or plotted in pseudosectlon form.
Numerically simulated decay curves are shown in Figures l and 2. Figure l shows decay curves as seen in amplitude-time space and as seen in log (amplitude) - log (time) space. Both IP and EM effects are shown. The pulse length is 2 seconds. The IPR-11 sample points are shown as x'e (2 second receive mode) and dots (0.2 second receive mode). Information describing both IP and EM components is distributed non-linearly in time and the log (time) axis is preferred. The chargeability ampliti.de is a frequency/time independent multiplier and may be removed from curve shape considerations when data is viewed in with a log (amplitude) vertical axis. The log-log presentation is therefore used.
Figure 2 shows simulated IP decays for varying time constant (fixed c) and varying c (fixed f). The IPR-11 sample points for a (T - 10 sec., c - 0.2) are shown assuming both 0.2 (dots) and 2 (x's) second receive modes have been used. The IP decays shown are well resolved by the 2 second data alone. The inadequacy of linear sampling is shown in a simulated Huntec-type 10 point decay. The c, T values used are those as for the IPR-11 curve shown. The amplitude has been reduced for illustration purposes.
The lower figure shows the Newmont standard curve (Dolan et al, 1967). This curve was based in part on the average of many measured time domain decays. It has been found to fit best to the master curve given by a time constant of l second and c value of 0.2. These values are as expected, they being the average of those values seen elsewhere (Hallof, 1983).
The range of tau values in the master curve set for the IPR-11 are as follows:
Pulse Time Receive Window Tau Range (sec.) (sec.) ————(sec.)—^—-
0.2 0.001 -* 10 sec.1 l 0.005 -* 50 sec.2 2 0.01 -* 100 sec.4 4 0.02 -* 200 sec.8 8 0.04 -* 400 sec.
The c values range from 0.1 to 1.0 in steps of no less than 0.1.
The ranges shown span those regions of both c and tau which are currently of interest in spectral IP work. The ranges are limited at the bottom end (high c, small tau) by what may be realistically isolated from inductive effects and at the upper end (low c, high tau) by what curve shape differences can reasonably be resolved given the pulse length.
Curve shape differences are quantified using the root mean squared deviation in percent. This is defined as:
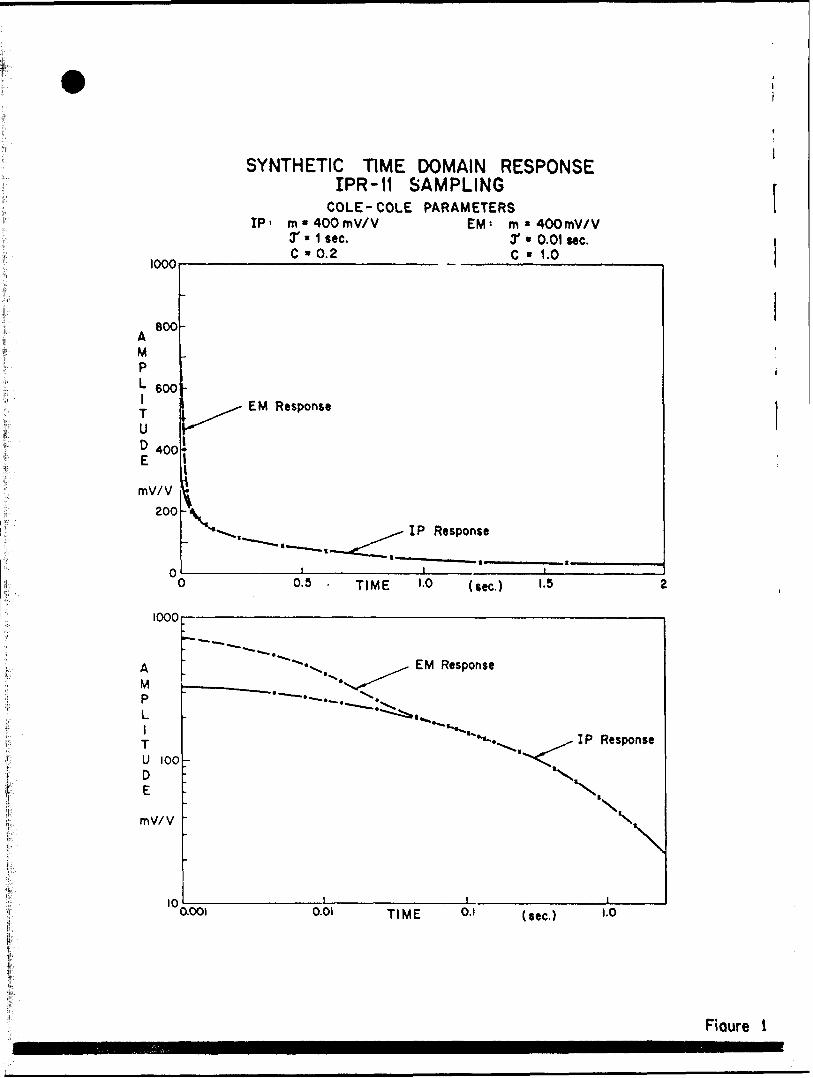
1000
. 800 AM PL 600
T UD 400
mV/V 200
SYNTHETIC TIME DOMAIN RESPONSE IPR-11 SAMPLING
COLE-COLE PARAMETERSIP' m-400mV7V EM' m * 400mVXV
y * 1 sec. T - 0.01 sec.C * 0.2 C " 1.0
EM Response
IP Response
0.3 . TIME LO (sec.) '-S
IOOO
AMPLlTU 100DE
mV/V
10aooi
EM Response
o.oi TIME O.I
IP Response
X.
(sec.)
\i.o
Fiaure l

1000
100
10
TIME DOMAIN COLE-COLE MASTER CURVES
IPR-tlMEASURED DECAY CIP * 0.2rJP - io*ec.
HUNTEC MKE 10-PT.- td ' 40 , tp - 160
. x*
9 V
10 KX) TIME (mi) 1000
1000
>
TIME DOMAIN COLE-COLE MASTER CURVES
Tx ' 2 **c.f ' l MC.
100
K)
NEWMONT STANDARD
C-0.2 T* i.Owe
10 KX) TIME (mt) tooo
Figure 2

- curveaicurveb
where
curvea^ * i* n window (or slice or sample point) of the measured curve- curvebi * i tn window of the selected master curve (multiplied by the
fitted chargeabiltiy amplitude)
Numerical experiments have been conducted to examine the stability of the curve matching process. A selected master curve has been compared against all other master curves. The results arranged in order of increasing rms deviation are shown in Figure 3. Two starting points have been used; viz. (c"0.2, tau-1 sec.) and (c-0.5, tau-1 sec.). A number of points are clear from this work.
- As c is reduced from 0.5 to 0.2, the curve shape differences are reduced and the confidence in the time constant is lessened. This is no more than the familiar result obtained in the frequency domain. That is, as c approaches 0.1, the phase spectral flattens, the peak in the phase spectra is less distinct and the time constant is more poorly determined.
- As you move away from the best fit curve, second and third best fits etc. are reasonably close in c, tau to the best fit. The time constant, for the examples shown, is particularly stable.
- Given a 2 second pulse time the decay curves for time constants of 30 and 100 seconds are not of identical shape. Actual curve shape differences (D) are 3.06X (c-0.5) and C.12% (c-0.1).
- Figure 3 gives an indication of the order of rms deviation required to achieve reasonably reliable spectral parameters. If the rms deviation between the decay measured by the IPR-11 and the closest master curve is of the order of 0.5X (for the 10 point decay, 2 second pulse and receive times), the calculated spectral parameters should be treated with confidence.
The chargeability amplitude is given by the shift in log (amplitude) - log (time) space of the measured to the master curves. The master curves are generated assuming a chargeability of 1000 mV/V. The chargeability amplitude is then corrected by a factor which is related to the fact that the measured primary voltage (Vp) is itself a function of the chargeability. The distortion in the measured waveform due to chargeability effects can be severe in some environments and the apparent resistivity so determined is artificially depressed from the true value. The excursion is a function of the Cole-Cole parameters. Tabled below are the Vp values as measured by the IPR-11 for an earth of unit resistivity, a-1000 mV/V and variable c and tau.

h i i il
i i i i i i ii i i il
O n
R
M
S
D
EVlA
T
lO
N
( 0Xo)
l-
c, ru.c.).2 1 i
f -1 * .1 t
.1 3:f A.t .t.t 30
i ft2 3
4 1i !ot
i.2 tO
J .5 1 .2 .1
li
.3 3 t.3 .3
i
\
c , r (.. c.).8 1
.4 1
.e i
.3 1
.2 3
.2 t.1 100 .1 tO
1 .1 30' '? l
•\ li.1 1
.1 .3
1 " JTIME DOMAIN COLE-COLE DECAYS (I PR-11 lOpt., 2 sec. on -of f)
MINIMUM CURVE SHAPE DIFFERENCES NOISE-FREE DATA
Figure 3

tau (seconds)
0.01 0.1 1.0 10 100
c - 0.1 0.623 0.569 0.512 0.454 0.397c - 0.5 0.944 0.830 0.564 0.257 0.091c - 1.0 1.000 1.000 0.676 0.042 0.001
As m is lowered, the effect is proportionately less.
Although an understanding of theoretical curve shape differences is important, the effectiveness of the method is best determined by the routine treatment of real data. Random noise in the recordings will confuse the search procedure and the master curve selection process will be less predictable.
6. IPR-11 SPECTRAL IP - EQUIPMENT
Time Domain Spectral IP measurements as defined herein rely upon the following equipment
- a suitable transmitter producing an interrupted alternating square wave current, e.g. the Scintrex TSQ-3
- an IPR-11 receiver- an Vpple Ile microcomputer- the IPR-11 Soft II software package
The last three items are as shown in Figure 4,
The IPR-11 and Apple He are well understood commodities. The IPR-11 Soft II is a short form title for IPR-11 Time Domain Induced Polarization Data Processing and Spectral Analysis Package. This is a set of programs designed to run on the Apple lie. Each program is identified by a 5 or 6 letter code word and their function is summarized as follows:
Normal Processing
Program Name: Function;-——,—————-—-—-—-.—————-———i————,—-——
IPRLD Copies the data from the IPR-11 to the Apple He micro computer.
EDITA To correct any header errors in the raw data.
IPRCON Converts corrected data file into two, compressed files.
SPCTRM Computes Cole-Cole parameters for each dipole (IP and EMComponents).

Figure 4 * TIME DOMAIN SPECTRAL IP - IPR-11 RECEIVER and MICROCOMPUTER HARDWARE l SOFTWARE.

Program Name;
PSEUDO
IPRMAK
MFELD
EDITB
IPRPi/T
Function:
Plots data in pseudosection form.
To enter IPR-11 data manually through the Apple lie's keyboard.
Copies IPR-11 data stored on MFE cassette tapes into the Apple's memory.
To edit line/station numbers, reorder for plotting, change K-factors, printer listings of corrected data.
Plots IP data in decay-curve form.
Programs are written and documented in a form that is usable by a field operator. No programming knowledge is required.
Most of the programs deal with accepting, correcting, reordering, listing, plotting and archiving the data. The spectral IP function, although complex, occupies only one program block. This balance is considered reasonable given the IPR-ll's ability to collect large volumes of IP data in a normal surveyday.
7. FIELD TECHNIQUES
Spectral IP in the time domain with the system so described need be no different in terms of field procedures from conventional IP. It should be noted here that experiments in which decay curve data is manually plotted and compared visually with a set of template master curves have been less than successful. The method is tedious (for typical survey volumes), subject to recording errors and prone to human bias in comparing curve shapes. The curve shape matching should be done in an unbiased way and with a numerical resoluticn equal to the task. Analyses of individual decays may be of passing interest. The real pay-off is in using spectral IP to routinely map two new physical properties - tau and c.
The field practices could be summarized as follows:
1. Conduct the field survey with the IPR-11 receiver much as would be done normally (i.e. pulse time - 2 seconds, receive time - 2 seconds).
The IPR-11 is set up to collect data amenable to spectral analysis. Repeat readings may be taken at the 0.2 second receive time (with the same 2 second pulse time) if it is thought that the inductive response is impor tant. There is little strong argument at this time to use pulse times longer than 2 seconds (i.e. 4 or 8 seconds). Such pulse times may be of use where resolution amongst populations of long time constant (i.e. 10 to 500 seconds) is required.
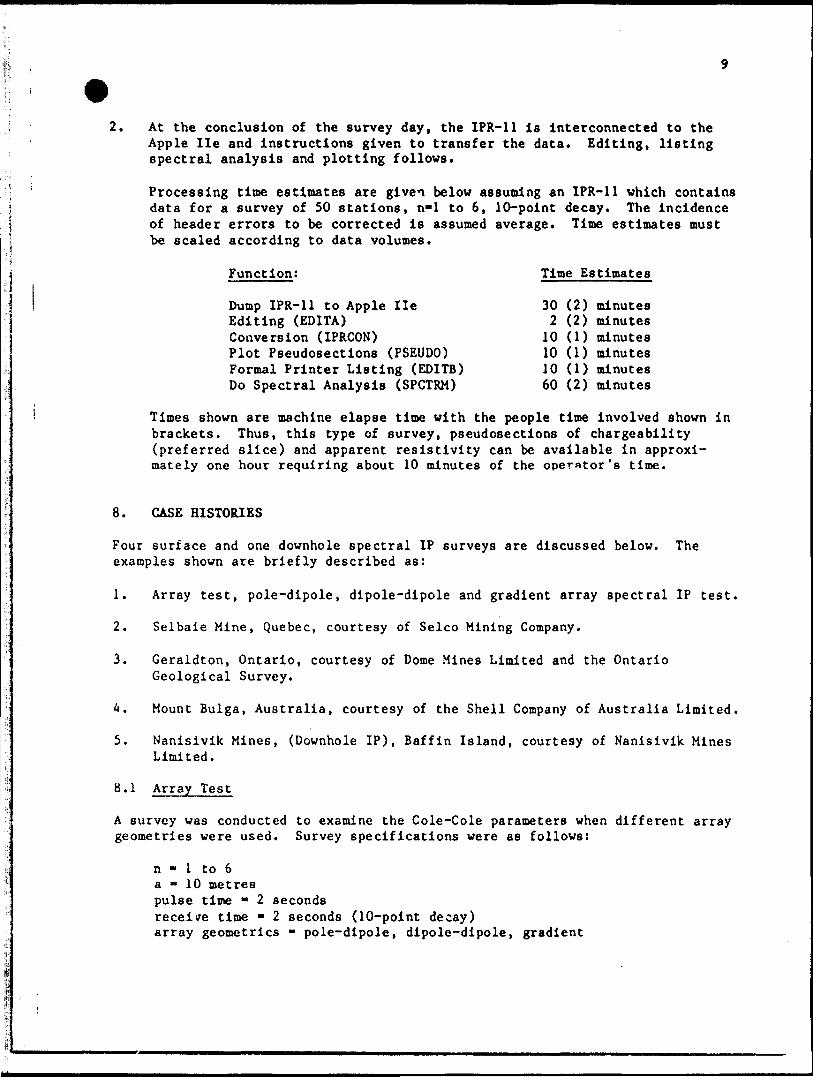
2. At the conclusion of the survey day, the IPR-11 is interconnected to the Apple Ile and instructions given to transfer the data. Editing, listing spectral analysis and plotting follows.
Processing time estimates are given below assuming an IPR-11 which contains data for a survey of 50 stations, n-1 to 6, 10-point decay. The incidence of header errors to be corrected is assumed average. Time estimates must be scaled according to data volumes.
Function; Time Estimates
Dump IPR-11 to Apple Ile 30 (2) minutesEditing (EDITA) 2 (2) minutesConversion (IPRCON) 10 (1) minutesPlot Pseudosections (PSEUDO) 10 (1) minutesFormal Printer Listing (EDITB) 10 (1) minutesDo Spectral Analysis (SPCTRM) 60 (2) minutes
Times shown are machine elapse time with the people time involved shown in brackets. Thus, this type of survey, pseudosections of chargeability (preferred slice) and apparent resistivity can be available in approxi mately one hour requiring about 10 minutes of the operator's time.
8. CASE HISTORIES
Four surface and one downhole spectral IP surveys are discussed below. The examples shown are briefly described as:
1. Array test, pole-dipole, dipole-dipole and gradient array spectral IP test.
2. Selbaie Mine, Quebec, courtesy of Selco Mining Company.
3. Geraldton, Ontario, courtesy of Dome Mines Limited and the Ontario Geological Survey.
4. Mount Bulga, Australia, courtesy of the Shell Company of Australia Limited.
5. Nanisivik Mines, (Downhole IP), Baffin Island, courtesy of Nanisivik Mines Limited.
8.1 Array Test
A survey was conducted to examine the Cole-Cole parameters when different array geometries were used. Survey specifications were as follows:
n " l to 6a * 10 metrespulse time " 2 secondsreceive time * 2 seconds (10-point decay)array geometrics - pole-dipole, dipole-dipole, gradient
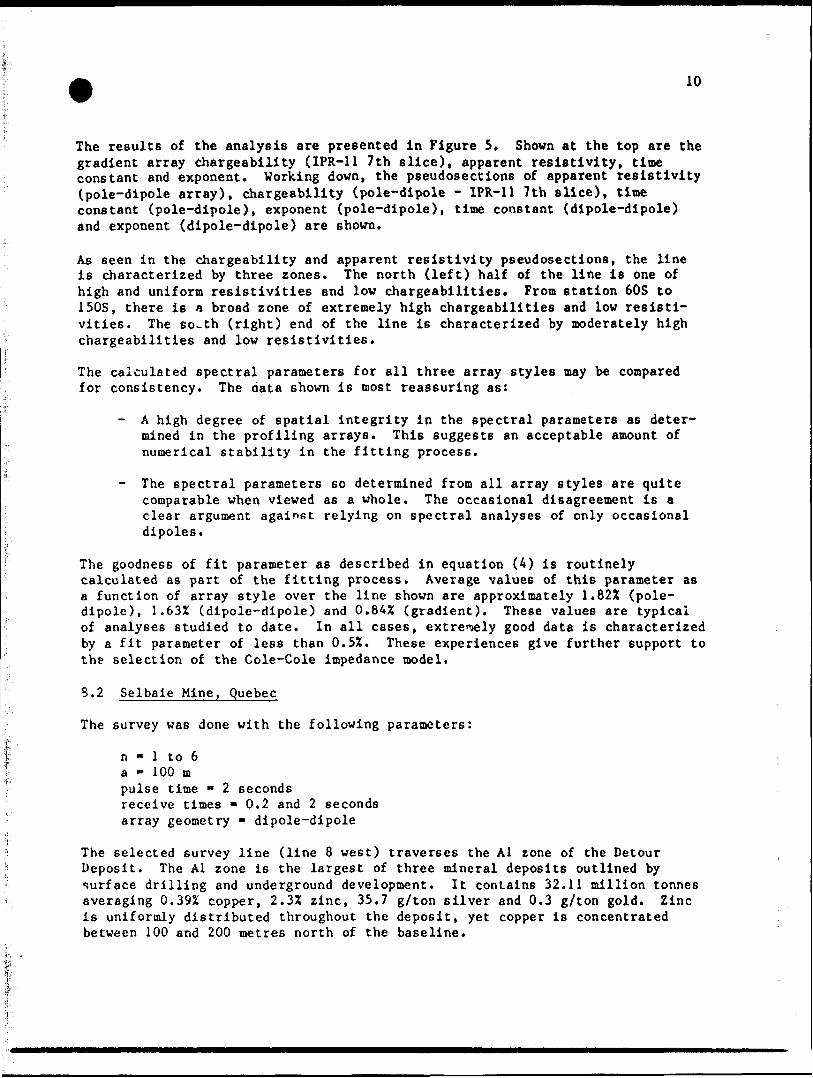
10
The results of the analysis are presented in Figure 5. Shown at the top are the gradient array chargeability (IPR-11 7th slice), apparent resistivity, time constant and exponent. Working down, the pseudosections of apparent resistivity (pole-dipole array), chargeability (pole-dipole - IPR-11 7th slice), time constant (pole-dipole), exponent (pole-dipole), time constant (dipole-dipole) and exponent (dipole-dipole) are shown.
As seen in the chargeability and apparent resistivity pseudosections, the line is characterized by three zones. The north (left) half of the line is one of high and uniform resistivities and low chargeabilitiee. From station 60S to 150S, there is a broad zone of extremely high chargeabilities and low resisti vities. The 6o-th (right) end of the line is characterized by moderately high chargeabilities and low resistivities.
The calculated spectral parameters for all three array styles may be compared for consistency. The data shown is most reassuring as:
- A high degree of spatial integrity in the spectral parameters as deter mined in the profiling arrays. This suggests an acceptable amount of numerical stability in the fitting process.
- The spectral parameters so determined from all array styles are quite comparable when viewed as a whole. The occasional disagreement is a clear argument against relying on spectral analyses of only occasional dipoles.
The goodness of fit parameter as described in equation (A) is routinely calculated as part of the fitting process. Average values of this parameter as a function of array style over the line shown are approximately 1.82Z (pole- dipole), 1.632 (dipole-dipole) and 0.842 (gradient). These values are typical of analyses studied to date. In all cases, extremely good data is characterized by a fit parameter of less than 0.52. These experiences give further support to the selection of the Cole-Cole impedance model.
B.2 Selbaie Mine, Quebec
The survey was done with the following parameters:
n " l to 6a - 100 mpulse time - 2 secondsreceive times * 0.2 and 2 secondsarray geometry - dipole-dipole
The selected survey line (line 8 west) traverses the Al zone of the Detour Deposit. The Al zone is the largest of three mineral deposits outlined by surface drilling and underground development. It contains 32.11 million tonnes averaging Q.39% copper, 2.3Z zinc, 35.7 g/ton silver and 0.3 g/ton gold. Zinc is uniformly distributed throughout the deposit, yet copper is concentrated between 100 and 200 metres north of the baseline.

DIPOLE-DIPOLE POLE - DIPOLE POLE - DIPOLE GRADIENT
3!(O
5 en
H l
O
T)mqrM"D
5
i
,* ,*
-ft .ft
-m ft .ft
9 . .ft
ft .ft ft
ft .ft
ft ft ft.ft .ft -ft
ft ft .ftft .ft p
ft ft -ft
.ft -ft .ft
ft ft ftR .ft ft
ft ft .ft
.ft .ft .ft
t ,n t
,* B K
K R .B
* R ft
H B B
-ft -ft *
ft ft .ft
ft -ft -ft
li .ft *
1 ft .ft
K*
ft W
l R ft
M -ft -ft
ft ft .ft
ft ft ft
l ft
ft M
-ft ft .ft
l ft W*
ft ft M *ft
• M H*
B ft* ft*
ft* M *)
R H M ft*
^
tm i •* i i i i i i
i*•j
i**ft i*
•ii* i ft
i* i.* a*1*
i*. i* IK1ft Ift IB
4ft•ft 4* *ft
tft Ift Iftft)
4ft IV tft
Ift Ift H ftIft
t* 1* 1*
1* 'ft 1**ft
Ift *l 1*ft
1* t* 1ft
1 ft I. ft ft **
t* M Ift
1 * 1 ft 1.4
tft Ift 1*
tm i* i**
ift M ft ift'ft ** tft
mL ft li ft 4 ft
M-* ftft **tft Mft H ft
ift H* mmm
.m i •x-xj1 * .y/ * ft ^v*-*
^fy**\. ** \^ ' *-\ mm 4
" ^~^v 1** \ *1* *\ \ * *
m \ Y• * K* X^~^\v*-J" * ftl ft \ ."^ V' 'w*\
ft ftl *,ft,,jL ^"/HV'blift Ift V l M ft V1^
l ^~vkA f m \ t* a rt)- -*-\ *\ — -^b ft X n mjS^m ft
X^ ^— *0• *i/ *ft /^ B ft
rt* y^ /^1" ft/ tt M /B ft
j/ l) ft ft* ft ft
it M jii^nm H ft
1 ft ft 41 ft fi ft M
ft * \ k ft *ft ^^ AX *0
nft X,** * *
m\*mH tnmt • - i 1 t lil
4 **fti
ft. mturn - MI ft
H•3* M ft
m* fti ft MB•' * mm ("*
k** mm hi ft•t
•l * ft' B *.*
ft* ft M* ft**Ml
4* mm fti*m* M* i**
•tMft W* Ml*
M* M ft ftl ftm
*h* ft k* c m*
mMM* ft) ft Pi ft
ft* H M m i* *•l
fttft fti* M*
* ft ft" B m*•i
ft** f m mfM
k* * H * mmb* ft K* ft**
•1*H* M* IP ft
M). x-- - --* * ) m* h * ^ w m j m. 9\im mM* /** fm ^^/. /tr^ B . \
" 7 7 \7V" "\' ' i* t* * .x— s.
(^ ft X ** K \
S~*. .*\ *.m* ^ i\ L.-* \ . ft
•\ \ t-mm A\
.m \'\*] i*
. l \. .1 . " l J" ' y*/ x
.w y /i.. o•i 7 s S
w .m i A* Si*,S im f ** 1
N ft y L MB X i* \ * *
Mft. jT \
*f * * * **1/^ ift * ft f i* 0 :
HI \ 7i ft i ft y w Bi ft /li * ft H !
o ^ q
•t.1 .01
l*
J .W•t -
.1 .01M .
.1 .01W
.1 .10l*
.1 .01m
.1 .30*
.1 .03H
.1 .03Ift —
.1 .01•1
.1 .30H
.t .30m
.1 l.OO
1.00
.1 1.00•1
.1 30.00M
.1 10.00•ft
.1 100.00Ml
. 1 100.00•1 ~
t 1M
.t 10.00|4ft
.t 100.00nft
.9 .10m
.1 1.00
.t 3.00MM
5 ^- TON
tl.t II. 1- (ON
t*t n.o- V)H
til tl.t- 4ON
IT.T T*tXH
in to. i- 20N
Jit 13. T- ION
tt.O 501- IN
tt3 *2 S- IOS
30.1 4T.OJOS
t(3 34.4- MS
Ml M*-40S
30.1 It. tMS
31.0 31.1 60S
31.9 tt. 3ros
tt.) T.IT SOS
43.3 ,T390S
41.1 .tl DOS
48. S .TTno S
•0.0 .1*120 S
1 1I30S
34.* .11I40S
4T.I .10IMS
II* .10(60S
19.8 .01 I70S
44.4 .13ISO S

11
Sulphide veins are most abundant in the center of the Al zone. These veins consist of alternating laminations of very fine to medium grained quartz, sphalerite and pyrite with minor inclusions of chalcopyrite, carbonate and chlorite. A massive pyrite unit with a relatively high silver content is located to the north of the silicified zone. The geometry and mineralogy of the deposit is quite complex and the spectral IP method was undertaken in part to see if it could help in sorting out a complex exploration problem.
Selected survey lines were run with both Time and Frequency domain methods, spectral parameters determined from both methods are shown in Figure 6.
The
In both presentations, tl.e Al zone is characterized by moderate to long time constants, moderate to high c values and high chargeabilities. By current thinking this region would be interpreted as a coarse grained metallic material with a narrow grain-size distribution. It is consistent with Pelton's findings for copper and pyrite veinlet mineralization in porphyry deposits.
This zone is flanked to the south (area of stations 2S-3S) by a region of moderate to high chargeabilities which exhibits much shorter time constants and smaller c values likely indicating marked reduction in grain size but with a very broad particle size distribution. This apparently reflects sulphide mineralization of non-economic interest.
In general, the IP spectral parameters derived by Phoenix Geophysics Limited, operating in the frequency domain, are comparable with those obtained by Scintrex in the time domain. Examination of both presentations reveals minor differences. Whereas the Time Domain method uses a master curve set with a maximum time constant of 100 seconds, the Frequency Domain method allows this parameter unlimited range. A time constant of 32,000 seconds is shown in the Phoenix presentation. Whereas the Time Domain method allows free reign in the selection of the c value; the Frequency Domain method occasionally fixes the c value at 0.25.
8.3 Geraldton, Ontario
Survey specifications were:
n - l to 5a - 25 mpulse time " 2 secondsreceive time * 2 secondsarray style - pole-dipole
The survey site is located near Geraldton, Ontario and is presently under investigation by Dome Mines Limited. The deposit was mined in the late 1930's by Jellicoe Consolidated Gold Mines Limited.
The property is underlain by metasediments including iron formation, arkose and greywacke. The gold production came from a sheared silicified and brecciated zone of quartz stringers and veinlets hosted by arkose. Mineralization consists

SCINTREX SPECTRAL IP PSEUDOSECTIONS
LINE No. 8 WSPECTRAL l* T*X DOMAIN SuftVtY
• l BO*, K l, I.M.I. l MM M t W
i"* MI -i toooi
VTU l MOKXWW "* VtCTKV
SCALC I'ZJOO
•t *i tt t
t. * . * l* -
— ' ' ///Zi^JX?" .i( r. " " . \V^MWS?\ .W. ^^"li:-c •^V*m
..0=3)
PHOENIX SPECTRAL IP PSEUDOSECTIONSPxOt'll" SPtCTRPn. I.P.
scuco sci. e* it 'OSVCCflBtLITY (Vl^Vp in X)
:B OufBCC tint ix 108- tS'l'i! 1.311 (x IOO. ll/l'tl LIIIli''
i.is c.i i.0.1*^1 'j^rx'ji
PMOCTTlK SPCCTRfX. l.P. rRCOUCNCT OCPtNDCNCC ICJ SCLCO StLt*!C rix (we* OUCKC UIX (i* toe- H/l/il Li; l ^^ L INC IM tKV* ll'l/ll 1.JJI
.n .n ^ ti.n n .n it .n
.tt .n .n .n .li .li
.11 .11 -M .r* .M
* .n ,n.i' \.n ,n n .n n .n .n .n
. .14^ -n .n .n .11 .n .n .n • i .n .n .11 .o ,n .n .n n .n .n
i .11 " .tt .11 .n .n .M .t) ,n .it .li .4J .n TT* .'t .11 'TT* .n
Figure 6

12
of native gold, pyrite, arsenopyrite and some sphalerite. Narrow quartz feldspar porphyry dikes which support anomalous gold mineralization are known to exist throughout the property. In general, the gold values are irregular within the dikes and none have sustained production.
The Time Domain IP results over one survey line are shown in Figure 7. Shown are pseudosections of apparent resistivity, chargeability (IPR-11 7th slice), chargeability amplitude, time constant and exponent.
The data showa a broad chargeability anomaly centered around station 4+50S. The amplitude of the chargeabilities over the anomalous zone is 4-8 mV/V, while the background chargeability is 1-4 mV/V. In the area of the chargeability high, the resistivity pseudosection shows little excursion from a horizontally layered earth response.
Available drill results suggest a single source at a depth of 50-100 metres located at station 4+75S and another less extensive source at a depth of 100 metres located at station 4+30S. According to drill records, both sources are gold-bearing with disseminated sulphides including pyrite, arsenopyrite and minor pyrrhotite.
The spectral data highlight the anomalous zone around station 4+50S. In the area of the anomalous zone, the chargeability amplitudes peak at 275 to 300 mV/V. The background values are in the order of 25 to 100 mV/V. The contrast in this fitted chargeability is markedly better than that seen with the raw data. Furthermore, time constants that are associated with the anomaly are longer than the background time constants, by a factor of 1-2 orders of magni tude. This pattern is repeated on neighbouring survey lines.
The iron formation at the north end of the line is similarly indicated on the chargeability amplitude and time constant pseudosectione. It is interesting to note that the time constants in the area of the iron formation are appreciably larger than those seen over the deposit. A different mineralogy is suggested.
Time domain spectral IP would be a most useful adjunct to conventional IP in any exploration program over areas suspected of hosting deposits of this type.
8.4 Mount Bulga, New South Wales, Australia
The survey parameters were:
n " l to 6a B 50 mpulse time - 2 secondsreceive time " 2 secondsarray style * dipole-dipole
The target is a steeply dipping rhyolite with disseminated and massive sulphides. Ore minerology consists of pyrite and sphaleritre with lesser chalcopyrite, galena and pyrrhotite. Host rock is an electrically neutral siltstone (or variations thereof).
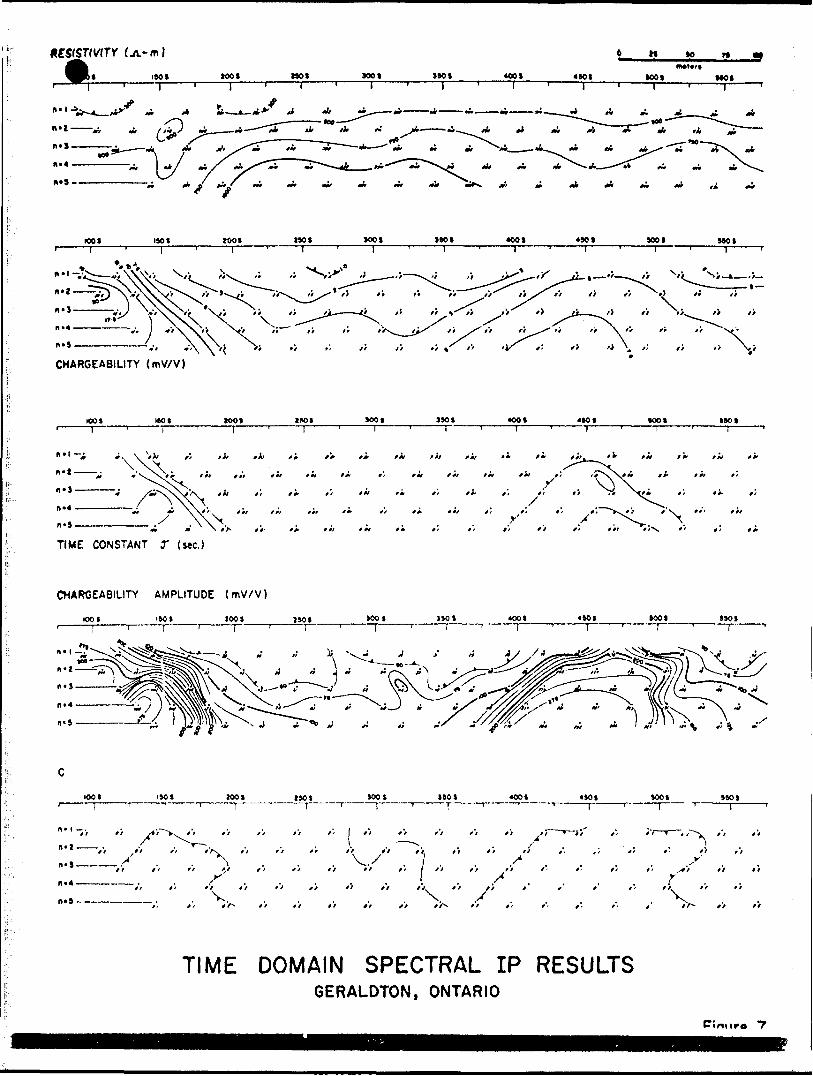
KSISTMTY (.n.-m)"0 *
v ~/
1001 1*01
CHARGEABILITY (mV/V)
IOCS—l— too t—I— IQOl J JO t—i— 400*—l— 4 JO I—l— IOOI—l—
fft i* fft f*
"\ *w "' 'f '* " ** f " " " " *' ~^^ # t f \ "'N s ^TIME CONSTANT T (sec.)
CHARGEABILITY AMPLITUDE (mV/V)
tOOt iMt 1001 JCOI J 50 J IOOI
IOCS 1101 4 JO i 1901
BJJ " " x'~^;B ., " x . .n 1 4 i
n- s ~ ———————— f .
\
), ,; .-t f, S-/ ,. f f, f, ^ ,f f** ft t't It 91 ft fjf** ft f'r fi
r** /' /' t'f^ tt ,.
TIME DOMAIN SPECTRAL IP RESULTSGERALDTON, ONTARIO

13
Figure 8 shows the contoured pseudosectione of apparent resistivity, charge ability (M7), Cole-Cole time constant and c value.
The deposit gives an apparent resistivity low and chargeability high centered near stations 50E and 100E. The time constant is markedly higher in those areas of the pseudosection outlined by the chargeability high.
A few comments may be noteworthy.
- The very highest time constants correspond to areas of low exponent (c) value. The time constants determined for such areas of the pseudo section should be treated with caution as more than one population is indicated. It is encouraging however that neighbouring sample points which show reasonable c values, show as well a consistently large time constant. A degree of numerical stability is indicated.
- The high i region is almost a duplicate in shape of the chargeability anomaly. Differences in pseudosection pattern may be significant in terms of variations in mineralogy of the target.
8.1* Nanisivik Mines (DHIP), Baffin Island
The Nanisivik mine is a carbonate hosted lead/zinc deposit located on the northern end of Baffin Island. A downhole induced polarization/resistivity survey was undertaken primarily to measure near and far hole IP responses from known sulphide zones. A secondary aim was to exercise the Time Domain Spectral IP method when working in a downhole mode.
Both the near and the far hole IP/resistivity logs gave moderate chargeability responses at the 120 and 150 metre hole depths. These responses correlate well with known Pb/Zn ore lenses. At the bottom of the hole (465 metres) a known pyrite zone gives high chargeability and low resistivity responses. All downhole IP data was collected with a transmitted waveform with a 2 second pulse time and the IPR-11 receiver. Ten points (2 second receive mode) on the decay were measured.
In situ spectral IP surveys were conducted at surface using small "a" spacings over exposures of a mineralogy sinilar to that encountered downhole. This was in essence an attempt to calibrate the spectral parameters seen in the downhole survey. The results of this work are tabled below.

- t
t r t
5 .M
l g t X " X I
S I S * S I l
. *rr^*o.j - y l - J^—^ Y i
TIME DOMAIN SPECTRAL IP RESULTSMT. BULGA, AUSTRALIA
Figure 8
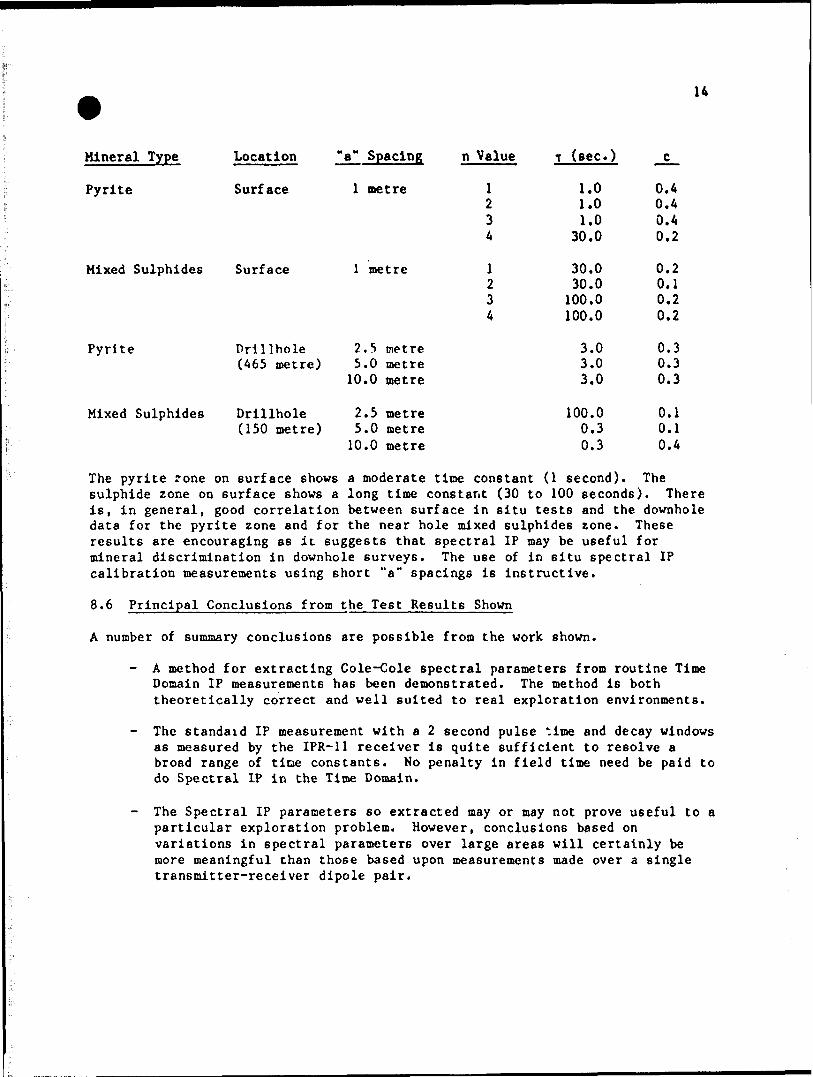
Mineral Type
Pyrite
Location
Surface
"a" Spacing
l metre
Mixed Sulphides Surface l metre
n Value
1234
1234
T (sec.)
1.01.01.0
30.0
30.030.0100.0100.0
Pyrite
Mixed Sulphides
Drillhole (465 metre)
Drillhole (150 metre)
2.5 metre5.0 metre10.0 metre
2.5 metre5.0 metre10.0 metre
3.0
100.00.30.3
0.4 0.4 0.4 0.2
0.2 0.1 0.2 0.2
0.3 0.3 0.3
0.1 0.1 0.4
The pyrite rone on surface shows a moderate time constant (l second). The sulphide zone on surface shows a long time constant (30 to 100 seconds). There is, in general, good correlation between surface in situ tests and the downhole data for the pyrite zone and for the near hole mixed sulphides zone. These results are encouraging as it suggests that spectral IP may be useful for mineral discrimination in downhole surveys. The use of in situ spectral IP calibration measurements using short "a" spacings is instructive.
8.6 Principal Conclusions from the Test Results Shown
A number of summary conclusions are possible from the work shown.
- A method for extracting Cole-Cole spectral parameters from routine Time Domain IP measurements has been demonstrated. The method is both theoretically correct and well suited to real exploration environments.
- The standaid IP measurement with a 2 second pulse time and decay windows as measured by the IPR-11 receiver is quite sufficient to resolve a broad range of tine constants. No penalty in field time need be paid to do Spectral IP in the Time Domain.
- The Spectral IP parameters so extracted may or may not prove useful to a particular exploration problem. However, conclusions based on variations in spectral parameters over large areas will certainly be more meaningful chan those based upon measurements made over a single transmitter-receiver dipole pair.

9. CONCLUSIONS
A method using well known and available Time domain IP hardware/software to determine spectral IP parameters has been developed and demonstrated. No clear case has yet been presented in which an IP target has been found on the basis of spectral signature alone, i.e. which does not respond as an anomalous IP target on the basis of simple IP measurements. It has been shown, however, that targets which are identified by a subtle IP response may be better outlined/ differentiated/isolated by using one or other spectral parameter.
Hore widespread use of spectral Induced Polarization surveys is encouraged. Spectral parameters so determined are independent of method, be it Time or Frequency domains. Experiences gained can only improve our understanding of how best to apply the method in different exploration environments.

16
10. REFERENCES
Dolan, V.M. and McLaughlin, G.H., 1967; Considerations concerning measurement standards and design of IP equipment; Proceedings of the Symposium on Induced Electrical Polarization, Berkeley, University of California, pp 2-31.
Hallof, P.G., 1983; An introduction to the use of the spectral induced polarization method; Publication of Phoenix Corporation.
Hallof, P.G. and Pelton, W.H., 1980; The removal of inductive coupling effects from spectral IP data; Presented at the 50th SEG annual convention, Houston, Texas.
Halverson, M.O., Zinn, W.G., McAlister, E.O., Ellis, R. and Yates, W.C. , 1978; Some results of a series of geologically controlled field tests of broadband spectral induced polarization; Presented at the 48th SEG annual convention, New Orleans, Louisiana.
Jain, S.C., 1981; Master curves for derivation of Cole-Cole parameters from multichannel time domain data; Report No. IND/74/012-20, NGRI Hyderabad, India.
Pelton, W.H., Ward, S.H., Hallof, P.G., Sill, W.R. and Nelson, P.H., 1978; Mineral discrimination and removal of inductive coupling with multifrequency IP; Geophysics, Vol. 43, pp 588-609.
Seigel, H.O., 1959; Mathematical formulation and type curves for induced polarization; Geophysics, Vol. 24, pp 547-565.
Seigel, H.O., Ehrat, R., and Brcic, I., 1980; Microprocessor based advances in time domain IP data collection, in-field processing and source discrimination; Presented at the 1980 SEG, Houston.
Tombs, J.M.C., 1981; The feasilibity of making spectral IP measurements in the time domain; Geoexploration, Vol. 19, pp 91-102.
Wait, J.R. (editor), 1959; Overvoltage research and geophysical applications; Pergamon Press.
Zonge, K.L. and Van Reed, E., 1980; The complex resistivity method; Presented at the 50th SEG annual convention, Houston, Texas.

I. P. DATA
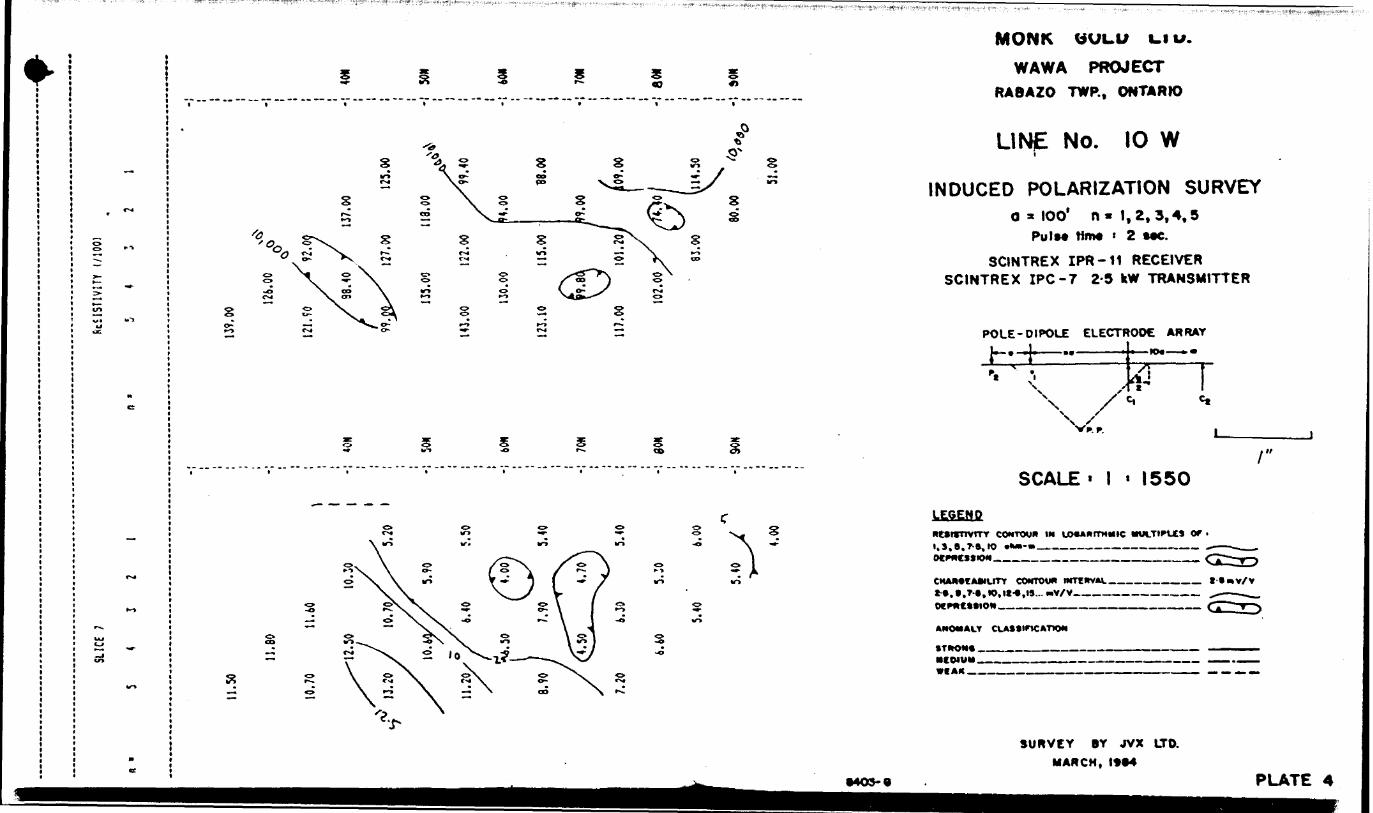
gU-I
S
sW*
MONK ttULU 1.1 v.WAWA PROJECT
RABAZO TWP., ONTARIO
LlNjE No. IO Wt
INDUCED POLARIZATION SURVEY a * lOO* n* 1,2,3,4,5
Pu l M ttm* ' 2 MC.
SCINTREX IPR-11 RECEIVER SCINTREX IPC-7 2-5 kW TRANSMITTER
POLE-DIPOLE ELECTRODE ARRAYh-
NV. —— lo* —— **
/] t
/"SCALE' l ' 1550
LEscttanesisnvrrr CONTOUR IM LOMwtTMMic MWTIMJES or t
CONTOUR IMTEWVW————————————— t-l ).*.T-*,IO.It4,t9.-oV/V____———————____
AMOHALT
BTKON* _____——•C WWW ———————•t A* —————————
SURVEY BY JVX LTD. MARCH, IM4
•405-0 PLATE 4

l
l
l
l
l
l
l
l
l
l
l
l
l
RES 3
MONK GOLD LTD.WAWA PROJECT
RABAZO TWP., ONTARIO
LINE No. 8 W
INDUCED POLARIZATION SURVEYO s IOO1 n* 1,2,3,4,5
Pu Ut tilTM i 2 MC.
SCWTREX IPR-11 RECEIVER SCINTREX IPC-7 2-5 kW TRANSMITTER
POLE-DIPOLE ELECTRODE ARRAY
-t
*
SCALE ' l ' 1550
LEGEND newwivrrr
NAMCAMimr COMTOUH WTCMVAI—————————————— H.V/V
ANOMALY CUkSSinCATION
•TKOMV . MCWVM.
SURVEY BY JVX LTD. MARCH, 1*04

n
iiiiiiiiiiiiii
4i
i it
)
1~*
r*4
^>c? T
s*-
^
int/* *-t tAjac
H
e
-*
c**
t-*
wu ^
V*
v^
ffi•s
MONK GOLD LTD., WAWA PROJECT
f* ^^ ^^ 5? 55~ ,. RABAZO TWP.. ONTARIO
*
—— LINE No. 6 WS 2 S S
vi**- —— SX c \ s j INDUCED POLARIZATION SURVEY2 S S ; 8s s s y i 0 = 100' n- 1,2, 3, 4. 5
,, \ o. o. .0*5 PulM Mm* t 2 MC.K \ -o o V .
S -\0* Z SS y S. 1 SCINTREX IPR-11 RECEIVER? sV S yS SCINTREX IPC -7 2-5 kW TRANSMITTERm ^ ^v aS f r^to. K -o \ "*- f 2
^ \ jf55 \ 5 ^ \ X^ 5 \ 5 ^ ' n POLE-DIPOLE ELECTRODE ARRAY
t. | T n . ____ . * — 10*- — **•^r
\ x,'" L\v/555s lie-* r-'* ^ "^ * ———————————————— '
T ^....— - v .—— v — --— r - - -, , SCALE' 1 ' 1550 '
LEGENDS 2 2 S MUwnvfTT CONTOUN m uD**wcniiiic iwtTi^Lct oc -
^ \ " ~ MrawT "*" " ————————— ^r^-'•f* o o \ S S\ "- ^ I ' ^ ^ CMAMCAWUTT COWTOOW WTtffVM. ——— - - l-t-V/V
i IT- ortMtcttion' * ^ A w ~^S l S l 2 ro "* V-* ——— — '
•" l "* Vli-—— " 7. r-^T~ MWMAI.T CLAStmCATIOM
S l^f /^"V ~ ^- iri Ti^X X- - WCWUM ____________________________ ——— ——— - ———
S\ 2 S \ S
SURVEY BY JVX UD.
MARCH, 19*4
1 Mos-a PLATE 6
[ji
i
.
f-

- fff*
s
LEGEHP
SCALE* l ' 1550
carrou* m IOMHITWIIIC tmnrmu or -
COWTOWM mn***. —.-——..f,T-*,IO.H-*,ri.- -V/V____——————-
MCMVMwe**
SUH YE Y BY 4VX UO. MARCH, 19*4
•403-0 PLATE 7
MONK GOLD LTD.WAWA PROJECT
RABAZO TWP., ONTARIO
LINE No. 4 W
INDUCED POLARIZATION SURVEYO " lOO1 fi* 1,2,3,4,5
Pu!** Mm* i Z MC.SCINTREX IPR-11 RECEIVER
SCINTREX IPC-7 2-5 kW TRANSMITTER
POLE-DIPOtE ELECTKOOE AHMAY

fffi
MS a
V
SCALE ' l ' 1550
LE9ENPm io**i"Tmiw vutrt*ic* or i
* t. to .*— . ————————————————— .
CK***t*Mirrr t-*.t.r*,w.it-*.i*.- -v/vMMCMIOtt
M WU*.WCAR—,
•409-9
SURVEY BY JVX LTD. MARCH,
.i.PLATE 7
MONK GOLD LTD.WAWA PROJECT
RABAZO TWP., ONTARIO
LINE No. 4 W
INDUCED POLARIZATION SURVEYO - lOO' n* 1,2,3,4,3
PwlM HIM ' 2 MC.
3CINTREX IPR-M RECEIVER SCIHTREX IPC-7 2-5 kW TRANSMITTER
FOLK-DIPOLE ELECTRODE ARRAY

S ' S
•4O3-*
SCALE' l '1550LEO EN P
i, s. t.MtnPtn or i
•CVIVM. WtM ——
•ufiveY tv jvx aaMARCH, l**4
PUTE 8
MONK GOLD LTD.WAWA PROJECT
RABAZO TWP., ONTARIO
LINE No. 2 W
INDUCED POLARIZATION SURVEY0-100* n- l,2,3,4,5
PwlM Mm* i 2 MC.SOMTREX IPR-11 RECEIVER
SCIMTREX XPC-r 2-5 HW TRANSMITTER
•.-tv---'?,.i

S 5- uri*^^^i^*^4^^ayfcBSiTOj. jtfa^^.;^^^^^^-^ -| jjjg
m i"S
I
SCALE i l ' 1550LEOENOWCSf*iiTiTV CONTQMA IN
rMucnnn or i
ewnww nm*v*c. .w-*,it- -v/v-———
tTMM.
SURVEY BY JVX 170. MARCH, I*M
MOS-t PUTE 9
MONK GOLD LTD.WAWA PROJECT
RABAZO TWP., ONTARIO
LINE No. -O
INDUCED POLARIZATION SURVEY0-100* n-1,2,3,4,5
Pol** Mm* i 2 MC.SdNTREX IPR-11 RECEIVER
SCINTREX XPC-7 2-5 kW TRANSMITTER
POLE-DIPOLE CLECmODC AMfUCrJ~-t
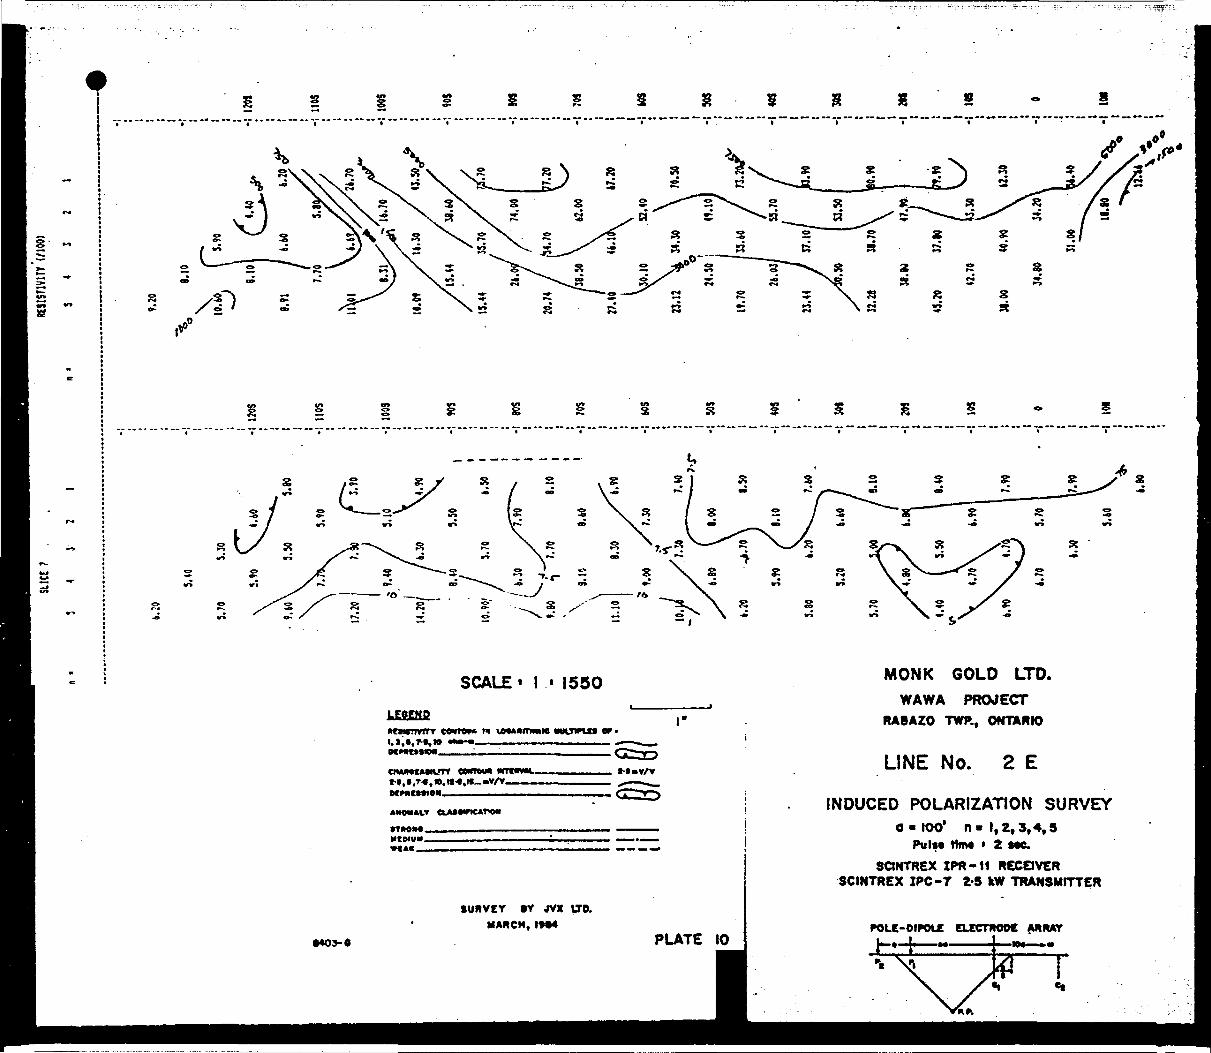
s ~
s
SCALE ' l ' 1550
LEQENO•nmmrr ee*tov* n vM**iTNMie MMTIMJU or i i.*.*.rt,io **--- ————— . —— ~— ——— . .
COHTMM wm t-*.T/Y
tTMOM. ttttXVM.WtM-~
SUKVEY SY JVX IJO. MARCH, IM4
•4O9-0 PLATE 10
MONK GOLD LTD.WAWA PROJECT
RABAZO TWP., ONTARIO
LINE No. 2 E
INDUCED POLARIZATION SURVEYO -100* n* l. Z, 3, 4, 5
PulM tin* ' 2 MC.SONTREX IPR-11 RECEIVER
SCINTREX IPC-r 25 kW TRANSMITTER
POLE-DIPOLE CLCCTftOOe AMMAY

8 ~
•n "i Sg
\ XsCD X rt \ V*
- K ~ \ ~-x 2 \ s
S
SCALE i l * 1550
LEOENPMCnmvrrr terrain M UMAIKTMHM micnnn or i t.*;*.
l"
TtDVM l-f nV
AMOMM.T
f THOU*. •f MUM.
MONK GOLD LTD.WAWA PROJECT
RABAZO TWP., ONTARIO
LINE No. 4 E
INDUCED POLARIZATION SURVEY 0*100* n-l, t, 3,4,5
Pu It* time i 2 MO.
3ONTREX IPR-11 RECEIVER SCINTREX IPC-T 2-9 kW TRANSMITTER
SUHVEY BY JVX LTD. MAKCM, 1*94
M03-0
AMIWY

s*3
x -
IcJ
SCALE ' l ' 1550LE9EMP
COHTOWI Mi, l, k. r t, to •*—-——
Kttf
OtMCMIOM
MCMIKI.
SUKVEY *Y JVX MAMCH, IM4
•409-* PLATE 12
MONK GOLD LTD.WAWA PROJECT
RABAZO TWP., ONTARIO
LINE No. 6 E
INDUCED POLARIZATION SURVEY a * 100* n - i, 2,3*4, a
PulM Mm* ' 2 MC.saNTREX IPR-11 RECEIVER
SCINTREX t PC-7 2-5 HW TRANSMITTER
POLE-DIPOLE ELECntOCZ ARRAY

t sis t tt o rt-:
S f- 1
/?, /y, /s
- 0031-

s ~
s
SCALE ' l ' 1550LEaEMP
rnTT eawTwm M UMAMTMMC Mcn*u*r
t-tw/v
r
MMIMMt
MONK GOLD LTD.WAWA PROJECT
RABAZO TWP., ONTARIO
LINE No. 14 E
INDUCED POLARIZATION SURVEYO - 100' n* 1,2,3,4,5
Pulse HIM ' 2 t*e.8QNTREX IPR-11 RECOVER
. SCINTREX IPC-7 2-5 kW TRANSMITTER
SUMVCY IY JVX LTD. M AU CM, 1914
•405-0 PLATE 16POLE-DIPOLE ELECTHOOf ARRAY
Jrd:

S ~
li
SCALE ' l t 1550
lEOEHO•MrtTTvrnr eofrov* M t. s. t. x, w o. a
•vtnnn e*.
CMAMCAMUTT f-tvr/v
AWOHAIY
•THOitt..•CDIVM .
SURVEY tY JVX MARCH, lt*4
•409-9 PLATE 17
MONK GOLD LTD.WAWA PROJECT
RABAZO TWP., ONTARIO
LINE No. 16 E
INDUCED POLARIZATION SURVEYa-loo' n-i, 2,3,4,3
PvlM Mm* t 2 MC.SQNTREX XPR-H RECOVER
SCINTREX IPC-r 2-S HW TRANSMITTER
fRRAY

m^m
l
l
l
l
l
l
l
l
l
l
l
l
l
l
s ~
i
SJ)\3^ st X
i)
- fo
MONK GOLD LTD.WAWA PROJECT
RABAZO TWP., ONTARIO
LINE No. 18 E
INDUCED POLARIZATION SURVEYO * 100* n- 1,2,3,4,3
Pu It* Tim* i 2 ste.
SCINTREX IPR-11 RECEIVER SCIKTREX IPC-T 2-5 kW TRANSMITTER
POLE-DIPOLE ELECTRODE ARRAY-••-
r r*, r.
SCALE* l i 1550LEGEND L. mtsmrrr COWTOW m tMAnmtiiic wnTWJts or i
MMttMION_____~I.I' ""
•CMiurr eowrowiM. t.T-t, IO.lt4.M-
t-t.v/v
ANOMALY
•mow*.•CMVM.
SURVEY 1Y JVX UO. MARCH, 19*4
PLATE

1 pxp
8 Sw* on
S R
SS
S
MONK GOLDWAWA PROJECT
RABAZO TWP., ONTARIO
LINE No. 20 E
INDUCED POLARIZATION SURVEYO - 100' n- 1,2,3,4,5
Pu l tt time t 2 MC.SCWTREX IPR-11 RECEIVER
SCINTREX IPC-r 2-5 kW TRANSMITTER
POLE-DIPOLE ELECTRODE ARRAY
ff. f.
LEGEND
SCALE ' l t 1550
COWTOW* M bMAHrTMMtC MWLTIPUt OF i1. 1, t. r-n, to
CMM*C*MUTY eOOTOVN WCTTWVM.. i-t.t.T-*. tt. tt4.lt-. MV/V-^^™
••••v/v
•TWOH4 .
ft
MOO
SURVEY BY JVX LTD. MARCH, 1984
PLATE 19

"PECTRAL DATA
f L ATS. 35

LINE NO. : 104 ( L.IOW)
AREA : BOW EOLB MM PROJECTl
'A' : 31i li- 1,2,3,4,5
PULSE TIME : 2.0 SK
11ili1
— —— - —— j
SCIIIKEI I PR- 11 REC1EVER 1 POLE-DIPOLE ARRAY
SCALE : l: 1550
IB
I1 x
1i11m ~
'1
11IB
iB '
IBB
COLE-COLE 'C' IP TAD (SEC)
54321 n ' 3 (
-
.20
.20
.20 .20
.20 .20
.10 Jh .30
/' .30 .30
.30 .30
.4C I
.20 .30 .30
.50 .30
.30 .30 .30
.40 .30
12 C .30 .70
m - - 300
8*
.03
.03
40*
.30
SO*
.03
40N
.03
m
.03
ew
SON
\
! !
3 2 1
-
01
.01
^01 .01
\01 .01
.03 \
.01
.03
.03
.03
.01
.03
.03
01
.01
;o3
01
.01
.1.01
01
.03
————
40N
SON
ION
m
BON
JO*

r
LINE NO. C BOO4 l L 8 W)
ARE* : KM SOLD KAMA PMJECT
•A* : 3!i t R * 1,2,1,4,5
PULSE TIRE : 2.0 tec
SCINIREI lPR-11 RECIEVER t POLE-DIPOLE ARRAY
SCALE l: 1550
COLE-COLE 'C'
5 4 " 3 2 l n *
IP TMJ (SEC)
54321
JO
.20
.20
.20
.20
.30 .20
.30
oo
.20
.20
.20
.20 .30
.30'y .30
30W
40N
50H
.03
.01
.01 .03
.01 .03
.01 .03 .01
.03 .01
.01 .10
.03
.01
30N
40N
SON

p
LINE NO. ; 6004 11.6 W)
AKA : HOIK SOU KMA PROJECT
'A' : 3U IR* 1,2,1,4,5
PULSE T1HE : 2.0 SK
SCIITREI 1PB-11 RECUVER 7 POLE-DIPOLE ARRAY
SCALE : l: 155O
OHI-COLE 'C'
5^321
IP TAU (SEC)
54321
mra ra
z m
.20
.20
.40
.30 .40
.40 .JO
.30 .JO
.30
.30
20*
30N
40N
SON
.03
.01
.03 .03
.03
.03
20N
30N
40*
.03 .01
.03 30*
.03

s .v-r-^s^S \ S
LINE 4 W
PLATE 23
LINE NO. ; 4004 ( L. 4 W
AREA : ItfMK SOLD KAMA PROJECT
'A' : 31i ; ft * 1,2,1,4,5
PULSE TIME : 2.0
SCIMIREI IVR-11 RECIEVER 7 POIE-8!PHE BRRAT
SCALE : i: 133O

, .-w-
-s
f ft
•3o
J*
/.o*
o/
/e*-* *ot "f o-^ -
O ' IO -/O
•re .o/
/O of
5 I S - X S
.1*
VO -/d
-io
0*
.t" .10
3.0 -/O .10
.x*
./O .fO .It, .3*
.3*
,2o
.3*
.30
.iff
LINE 2 W
PLATE Z4
LINE NO. : 2004 ( L. 2W
AREA : MW SOLD VAMA PROJECT
•A* : 31a ; a * 1,2,3,4,3
PULSE I1HE : 2.0 sec
r
SCIHTREI IPS-11 RECIEVER l POLE-DIPOLE flftRAl
SCALE : *i: 135O

'';-'-:** -ylS'S*
c*
s
1.0 —
S s s
8
s
X 2
LINE 2 E
PLATE 26
LINE NO. : 2002 ( L.2 E
iSEfi : rev SOLD *;KA PPOJECT
PULSE lift : :.) SE:
SCIMIFEI IFP-11 POLE-DIPOLE SfiRAT
SCALE : i: 155O

;"*\-^- -t?3^' ?"- ' ,- K?#i: -sr :..- : r\v"-i--^rtf"'**W?i*y;'^-^^f)5 V - y5--V"'^
O.3 O./
/aa*' 10.0
-'0
/O-O /Ctf-0 d./ O./•A *4 M M
S 5 S 8 8 S-
s
•to jo *20 .2.0
-Z*
.2.0
.to .2.0 ./o .y*
S S 8 S
*3O -JO
.s* ***** **
-*^ .10
S 8
./O
./o
ZO
.3*
10
-3*
8 8
-/* ./O ./O ./O .lo*****4***4
-3* ./O .2.0 .to "*w**** ^**
./o ,iu? -/d ./o -2.O
^X* .2.0 ./o .io -30
./o -/O .j.. * a .-,oM M M M M
88888
* -2.0*4
'Z*
-30 -30
3
PL
LINE NO.
AREA : ROW 6(0 HAM PROJECT
Jl ( L. O )
•A* : 3it
PttSF IINF : 7.0
1,2,3,4,3
int-ii RccievER ; POLE-BIPOU MMT
SCALE : l: 1350

s l f
8
ng*s
SS
rf
R
— O. •e* ~.
-.i- ''-:*?
LINE 4 E
PLATE 27LINE NO. : 4002 ( L.4E
•fi- : :ii : n * 5.2.3.4.5
'•JISE HUE.: :.0 sec
SCiSrrci IPR-1I eECIEVS? ' POLE-DIPOLE AfiRAT
SCALE : l: 1550

so
LINE NO. : oOO2 ( L.6 E
AREA : B:RK sa.fi *A** PROJECT
LINE 6 E
PLATE 28
?'JLiE II* : 2.0 sec
SCIHIEEX IPR-ll RECIE^R ; POLE-DIPOLE
SCALE : i: 155O- -..vr^x^Q^i^

NOTE:: so, 3/
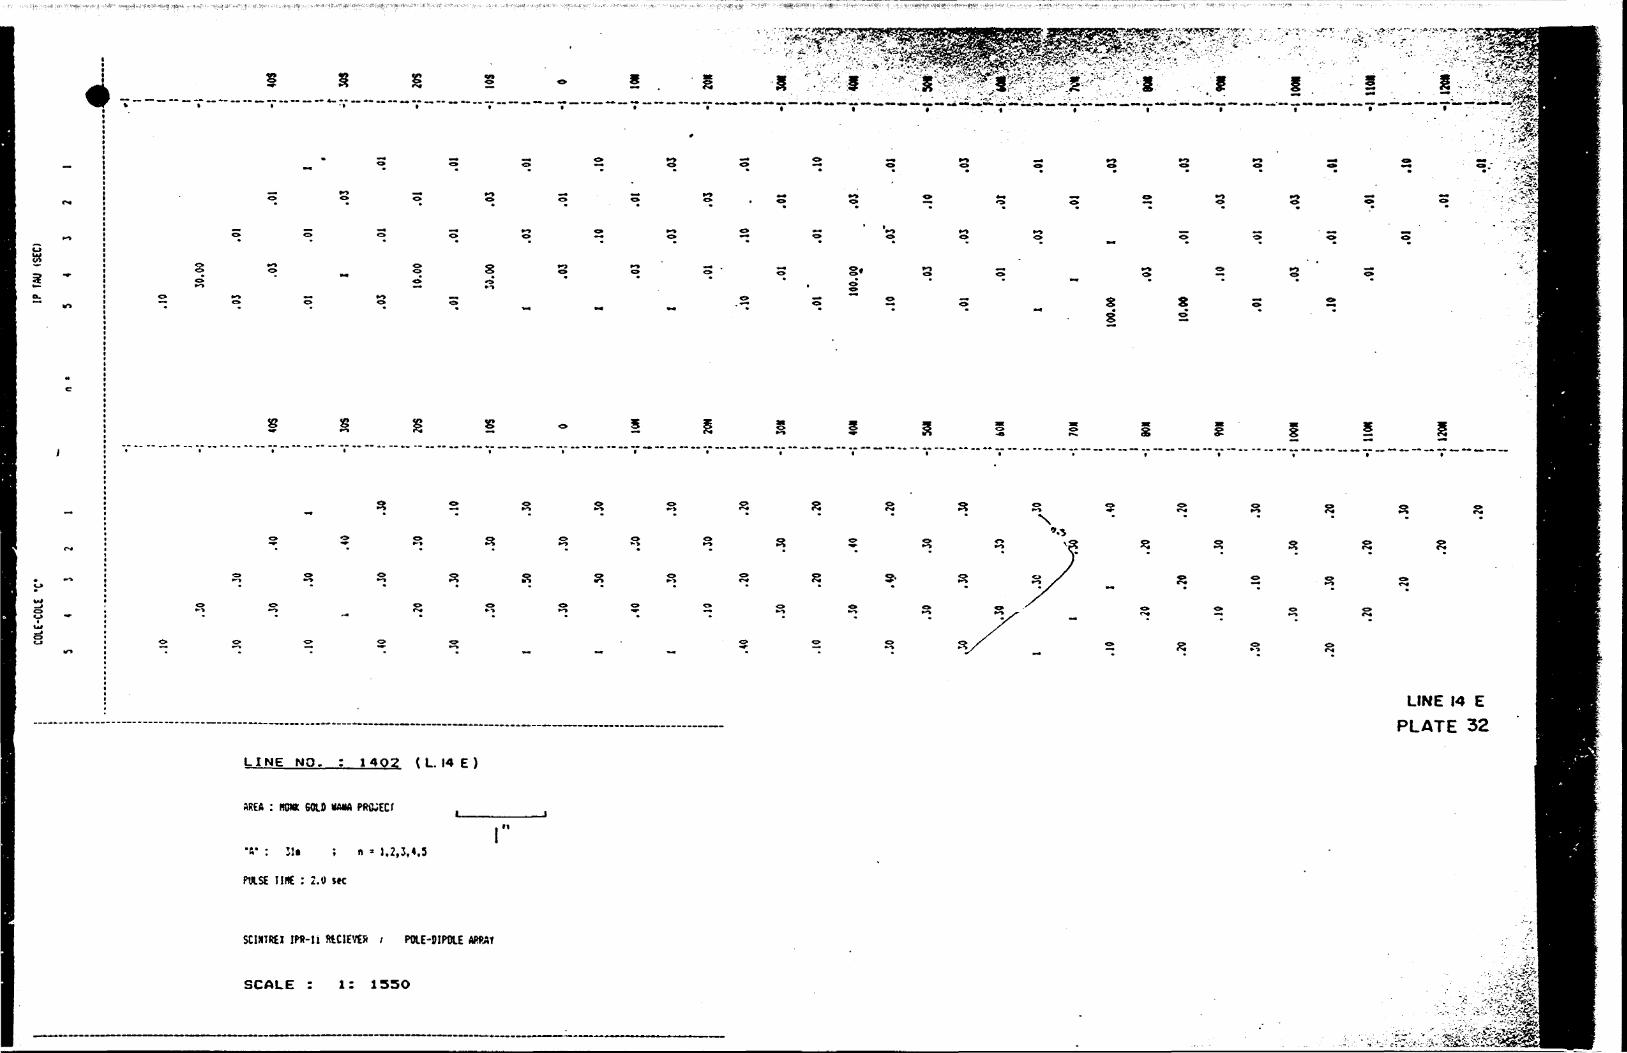
s s
y^^-^'v^^^. 'S'z.-^^ff^^v^-'
*
n X
g
S g
o '->
s
LINE 14 E PLATE 32
LINE NO. : 14O2 ( L. 14 E
AREA : HONK 6010 VMM PRWECf
•6' : IU ; n * 1,2,3,4.5
PW.SE II* : 2.0 SK
SCIMTREI IMMl fttCIEVE* ; POIE-DIPW.E
SCALE : l: 155O

Sr^ 5
5?
s a
S5
a s
LINE 16 E
PLATE 33
LINE NO. : 1&02 ( L.I6 E
AREA : ROW SOLO HAM PfitUECT
•ft" : 31* ; a - l,2,M,5
PW.SE IIHE : 2.0 sec
SC:II:SEI JPSMI RECIEYER ; POLE-BIPOLE
SCALE : l: 1530

LINE NO. ; 18O2 t L 18 E
Mttt : MM WU HMA PWUEC1*
•ft* : 31* li- 1,2,3,4,3
.PULSE UHE : 2.0 (K
SC1IIREI 1PI-11 l POLHHPOLf WHM
SCALE : i: isso
COLE-COLE 'C 1
5 4 J 2 l
If IAU (SEC)
5 4 J 2
Dr" C^ 2H mm ^w *4^ m
.10
.10
.30
.JO
.20
.20
50N
bON
ton
.10
.10
I .01
l .03
.01 l .10
100.00 .03
.01 .10 .01
.01 .01
.01 .01 .01
.01 .10
.10 .01
.01
.OJ
SON
60*
704
BON
tOH

LINE NO. ; 20O2 ( L. 20 E
AREA : HOW GOLD KAMA PROJECT
'A* : 31i J l * 1,2,3,4,5
-t PULSE 11HE : 2.0 SK
SCUIREI IPR-lt RtClEVEft l POLE-DIPOLE ARRAf
SCALE : i: isso
COLE-COLE 'C*
n * 51321
m i
.30
.30
.20 .30
.20 .20
.30 .20 .20
.20 .20
.20 .20 .20
? i '* 'aJ* m .20 .20 rn ro01 0 - 20to m
i
IP iwj TSEO -n * 54321
-J
3.00
.01
.10 .03
0 .10 .01
.10 .03 .01
ION .10 .01
.01 .01 .01
20* .30 .01
.01 .01
30* .03
1l
0
ion
20*
30*
41NI5NE0104 0034 RABAZO 030S.T.S.LatLong
41N-1S 47 0 55' 84 045'
Geophysical Addendum(to Report, submitted by A. Kusic)
on the
Michipicoten PropertyRobazo and Naveau Townships
Sault Ste. Marie Mining DivisionOntnri e
for
Monk Cold Minos Ltd, Toronto , Onl.ar i o RECEIVED
\\\m lAliOS SECTION
i 984 Doc. i 5Ci] oba l Goose i enco Const) l t.ant.s l t.d. Wawa , (Hit ar i o
J.T. Nee lands Geo log i st

- l -
Summary -
The property is located 10 kms south of Wawa, Ontario, Figs l
and 2. The property which is traversed by the Michipicoten River-
consists of 9 claims, Fig 4. A VI.F electromagnetic and
magnetometer survey wore completed over 5-9 miles (0.5 kms) of cut
lines on a grid with the base line orientated at 13 S0 . Cross
lines were cut every 200 feet and the lines picket.ed ever\ 100
feet. One long VI.F conductor' was located which parallels the base
line and on L l OW at 4-*OON coincides with a magnetic high. Another
magnetic anomaly occurs at. l, l OW, 3*00\. These may relate to iron
sulphide (pyrite and pyrrhotite) formation in t ho dacitic tuff.
Geology -
The property is underlain by intermediate to felsic
pyroclastics which strike between 130 and 1400 and dip vertically.
The area underlying the geophysical conductor is heavily
carbonat i x.ed and silicified. Secondary pyrite is associated w i t.h
the quartv. ve i n i ng .

- 2 -
HUDSON BAY
H U ND ER
KENORA I nipigon':) /BAY
PROPERTY LOCATION
MONK GOLD MINES LTD.
REGIONAL LOCATION MAP
FIGURE 1

- 3 -
SUPERIOR
PROPERTY LOCATION MONK GOLD MINES LTD
LOCATION MAP
MMR GEOLOGICAL COMPILATION SERIES
MAP — 2220DATE
Oct. 30, 1984

- 4 -
RABAZO TWP. NAVEAU TWP
SAULT STE MARIE, MD
MNR MAPS-M 1556, G-2480
SCALE l" * 1/2 MILEMONK GOLD MINES LTD.
CLAIM MAPDATE
Ocl 31, 1984DRAWN BY
S. CASE
FIG

- s -
VLF Survey -
The VLF electromagnetic survey was completed over tlie grid
with readings every 15m (50ft) with a Geonirs KM- 1 . See Drwg
84M-5 i'1 pocket. The in-phase and out of phase readings art;
plotted to the left and right of the lines respectively and the
in- phase lias been profiled, Drwg. 5. Mr. A. Kusic completed the
survey utilizing Annapolis. Maryland as the transmi t. ter . The
survey located a moderately strong VI, F conductor that flanks and
parallels the l . P . Zone A. DDII 84-1 intersected 5-10?' bedded
pyrite in t, he vicinity of the conductor which probably explains
i t s cause .
Magnetometer Survey -
The Magnetometer survey was completed by d. longhurst of Wawa
wit. h a fluxgate l . J . Sharpe MF-1. A base station was set-up at
1201 . .itOOS with a reading of 500 gamma. s. The base line 'as read
t. w ice- for control and corrected t fi the base slat ion. Lines w*: re
then read and t i cd into the base line. Since t. here was very
l it t le vai" i at ion ( 10-50 gammas) overal l , no correct ions were made.
The results were plotted and contoured by Data Plot, l ing of
Toronto. Ontario. Drwg. ^M-o. I he magnetic- relief varies between
l!00 and 3200 gammas, but. general l y averages close to 400 gammas.
l wo magnet i e anomalies occur north of the base- line at 1.IOW, ,1'OON
and I.6W, 4000N. l he one on LOW, 4-OON coincides with the VI l
conductor .

- 6 -
Reference:
1983. A. Kusic, Report on Exploration Work.
1984. July 20; G.H. Babcock, An Exploration Program on the
Monk Gold Mines Ltd. Property, Phase III, (In house
report of Monk Gold Mines Ltd.)
Respectfully submitted
1984 December 15
/ J. T. Neel ands

- 7 -
Qualifying Statement
I, J.T. Neelands, of the town of Wawa, in the Province of Ontario,
hereby certify that:
1. I am a geologist and reside at, 11 Mission Road, Wawa,
Ontario. Though I did not supervise the work described T ran
vouch for the accuracy of the results.
2. l am a graduate of Carleton University with a B.S.c. in
geology
3. T have practised my profession as a Geologist since 1971.
4- I am a follow of the Geological Association of Canada and an
Associate" Member os the Association of Kxp l oration
Geoehemi sts.
S- Tliis report, dated l 084 December IS is based on work completed
in 10^3 and 1084 by Monk Gold Mines Ltd.

Geochemical Sampling
A geochemical soil sampling program was carried out along
cut lines on MonU u^ld Mines Ltd. property. Intervals of SO 1
were used along the base line and lines north and south of the
base line. 50' intervals between sample points were carried
out for 300' north and south of the base line. Distances further
than 3O0 1 north or south of tho base line \vere sampled at 100'
intervals. Lines were cut at 200' intervals north and south
along the base line. Soil samples contained "A" horizon material
(humus). A gold (l.-14e,16c) beuring zone into which Lhe adit
was driven out crops between 165' - 185' north of the base lino.
Another gold bearing /.one was outlined from (L-14e,16e) 0-50'
south o/' the baseline througli trenching. These xoncs strike
from 3180-3li00 N.W.. The base line was cut at a bearing of
3L'O0 N.W. and a SO' sampling interval would outline an anomalous
icone more readily in crucial areas of overburden that would
be along strike of these gold bearing zones. Assayers Limited
(Rouyn, Quebec) performed the analysis. All samples are done
by F. A. Samples arc screened at -80 mesh to give /-j A. T. or 14.5IJ
grams. If unsufficient amount of sample was rccicved, the surnpl':
was screened at -20 mesh.
r
Through geochemical analysis a background of "O" was ob
tained. "O" meaning none detected (Au).
l.
(continued)
A good geochemical anomaly was outlined this coincides
with an anomaly detected through a magnetometer survey performed
earlier in 1983. This anomaly is approximately 400' wide and
has a strike length of approximately 550*. The location of
the geochemical anomaly would make it along strike of the adit
gold bearing zone. This anomaly should be soil sampled at 50'
intervals between lines and sampled at footage different than
samples taken on the line. Through this method there should
be a better spatial relationship of gold values within the geo
chemical anomaly.
The anomaly, if proven up by further geochemical sampling
should have 3 holes (l)DM) to test for a gold bearing horizon.
This anomaly offers yet another target on the Monk Gold Mines Ltd,
property.

/v^j^'f)"iJ:^ ^••'•y-'^vS." "/.v\ ,^ Vy' -^—.v-- ~\
MC MURRAY TP. (|VLi547).i M
' ' :-#Jtt^S?^ft*,:'seg,:\

f41N1SNE0104 0034 RABAZO
Mining Lands Section
Control Sheet
900
File No ?. 7J/ J
TYPE OF SURVEY GEOPHYSICAL
GEOLOGICAL
GEOCHEMICALX
i/ EXPENDITURE
MINING LANDS COMMENTS:
7
If
''Ci /'t'/ : L-
A
//'?//' X
Signature of AssessorBSE
Date

Onlaiio
Report of WorkNBlufBl ,- . . , f. . . ,Resource* (Geophysical. Geological,
Geochemical and Expenditutet) jn3'3Mining Act
A A?.Plr.'isr Ivfir* O' pnni. ' II nurnbri O' mining * J,,'iris it ..-, MCPCils stint" on ihn toini, nit.K li .. 'i-'
Mole; - Only days (itdils CiilculnU'il in Hi" "E upcnd'lu'CS" section m^ hr i fn!' ini m the "Expend. Days Ci." columns.
•- Do not usfr shaded l'ens below.
ma 1 H j\o.r
laim hWdtr(
^.C'ML&r^lIl'Qjg^
' or Al "
..ACM..M ^m-t C
...EABAZO,...... N.-._|pfoip*ctof * L'Ctncc No.
^.lNlO,LT-J.!i^L-.-..-..... ..uM"v company o.r io... .
....rtf *nd Add'tii o* Author (of Gto Ttchrvcil rtport
"tc"" M'"" 0( '"" Cul
•A i c* Ile rtRcqueitcd per Each Claim in Columns at right
Ho.. LoAuv\ On t arm.rfSpec. li Provisions
Fof first suivcy:Enter 40 days. (Thisincludes line cutting)
F ri each additional survey:u'.ing the same grid:
Enter JO days ((or each)
Man Oiyi
Co Tiplete r'.ntrse sideand enter '.clallsl here
Airborne C'ldits
Note: Special provisionscredits do not applyto Airborne Surveys.
Geophysical
- Elictromagnei.
- Magnalomltar
. Radiomat'ic
- Oihir I. p
Geological
O.och.mle.i
Geophysical
' ElectromatmHc
- O'hir
Geological
Giochimica'
Electromagnitic
Magnatometar
Hadiomitrlc
Days par Claim~r~~
*^oJiOj-
30'
3O-Days pir
Clain^
Days puClaim
————— -
Mining CUimt Travefscd (Us! in nurnencal seqtioncc)
Expenditurei (excludes power stripping)Typaol WorV P*rtoim*d
\f*Jrr\ A 5)S AU *kPartormid on ClaimUt o
:ulaiion ol Expandilura Days Credits
Total Expenditures
+Z-3-Z
Tottl Dayi Otditi m* y bt tpponiontd *t tht cl*im ho dtr't cHo'ct, Enttr numbtf of d* y* C'tdHt per cl*im ttltcttd in column* tt fiyht.
__ K
s^m
R
A.M.7i9i9
fining Claim
(~f^d Li .5.3.
... ————
. —— ,. —— —
————————
R-
A.M.•{161
— —
—— ~- —— —— — - -
SAULT STE. MARWININO ay,LQJLUL
JU.UL.3J9&!
i
Dtyi O.
^3:^f
. . -,—
GAULTMil
E.-C..
.I'M
?,!W---- —
E. ....
E-D-
P.M.
ill CM?
M
STENO
X
'2
k
Mini^Q C '••'rv
^"u-,..,uj Sa7
, . . ,. -....-. .-} MARIE ---. - ——
V f * ***V L:.. {j .,. .
11984' P.M.
"
—
•--— -- -
i
Tola! nuMihiti ol fnininp c'*imi CO. 'to by Ihil lepO'l ol work.
C.ri-i.i. Di,' C-
--
..-.— -. ——
J
Oil* Rtcortltd
Certification VtfHying Report of Work
*i Of Afl*m (Siently'*' Ir
l hereby certily (ho i have i penon*! *^d intimate knowledge ol the licli let forth in the Repon ol Wo'K in or witnetted tame during and/or alter ill completion and the annexed report it true.
lo, having ptilo'mtd the v.oik
Nimt and Point AdcJrcti ol P*non Ctnllymo
QMo-nft . pQ5- Up.-Car l il ild
1362 IB 1/91- , k e rt

Ministry* Order ofthe Minister
OntarioThe Mining Act
Room 6450. Whitnty Block Ourtn't P*rk t Toronto. Onltito M7A1W3 416/965-1380
In the matter of mining claims:
SSM 609453-54
in the Township of Rabazo.
On consideration of an application from the recorded holder.._..Mojlk^ Go] 0^ JMineS
"pa/rGecrcnpmJrjrTTand-Assaying- —7^7—-^—--——-a"*be extenBeo until and mcTuOifig .......JQ.CtQDeiLJsu__.19_o^..
work recorded on.a/ft lans in suppog of
i. __i9.JL:L
Copin:
Monk Gold Mines Limited 402 - 27 Queen Street East Toronto, Ontario M5C 2M6
Mining RecorderSault Ste. Marie, Toronto
Oiitcloi, Linct Mtntptmini
1333 (82/1) l

October 5* 1984
REGISTERED
File: 194*84
net United
fear Sirs:
Enclosed Is a copy of a Report of Work for Magnetometer, Electromagnetic, Induced Polarization, geochemical assessment work credits and Data for Assaying that was recorded by the recorder on July 20, 1984 on Mining Claims SSM 609453-54 In the Township of Rabazo.
We have no record that you provided the full reports and maps to the Minister within the sixty day period provided by Section 77 of the Mining Act.
Unless you can provide evidence by OctoUeTT57T984 that the reports and maps were submitted as required, the mining recorder will be directed to cancel the work credits recorded on July 20, 1984.
Yours sincerely
S.E. YundtDirectorLand Management Branch
Whitney Block. Room 6643 Queen's Park Toronto, Ontario M7A 1W3 (416)965 -4888
A. Barr:sc
Ends:
cc: AleVs* Kuslc ?cx 40Wawa, Ontario POS 1KO
cc: Mining REcorderSault Ste. Marie, Ontario

October 16, 1984.
This is to certify that S2,085.00 was spent by Monk Gold Mines Limited for assaying of samples taken from mining claims SSM 609453 and 54 in the Township of Rabazo.
Name:
Company Name:
RECEIVEDGC i li, 1984
MINING LANDS SECTION
i

November 28. 1984 Mining Recorder*File: 194-84 Our File: 2.7313
Honk Gold Nines Ltd Suite 40227 Queen Street E*jt Toronto. Ontario H5C 2M6
Attention: H. Monk
Bear Sir:
RI: Geophysical (Electromagnetic, Magnetometer, Induced Polarization) and Geochemical Survey and Data for Assaying filed under Section 77(19) of the Mining Act RSO 1980 submitted on Mining Claims SSM 609453 and SSM 609454 In the Township of Rabazo
We received reports and Maps for the Induced Polarization and one copy of the magnetometer and geochemistry report* on October 16, 1984.
To complete your submission for assessment credit please provide the following:1) Report and maps, In duplicate, for the Electromagnetic
(VLF) survey. '2. One copy of the report on the magnetometer survey.3. A description of how the geochemical survey was performed
and the method of assaying, In duplicate
Please forward the above Information to this office quoting file 2.7313.
Enclosed for your Information Is a copy of the booklet "Requirements for Subra1tt1i'j Geophysical. Geological, Geochenlcal .Survey Reports" and two copies of Technical Data Statement.
For further Information, please contact Doug Isherwood at (416)965-4888.
Yours sincerely,
S.E. YundtDirectorLand Management BranchWhitney Block, Room 6643Queen's ParkToronto, OntarioM7A 1U3 4Phone:(416)965-4888 N cc: Mining Recorder
Sailt Ste. Marie, Ontario End.

FORMATION
M/-
i i

EM Tfi
A Era 16 VLP -Emvwas completed on Monk Gold I/lines Ltd.
in Hay 1984. She survey was done by Aleksa Kucio, Monk
Gold Mines Ltd. consulting geologist.
Readings were taken at iJO' intervals along cut lines.
The instrument used for the survey ^yas a Geonlcs Em 16 VLF-Em.
Measured uantities being Ih-phase and Quad-phase
components of vertical magnetic field as a percentage of
horizontal primary field, (ie. tangent of the tilt angle
and ellipicity)
Sensitivity of the In-phase component being i I50#.
Sensitivity of the Quad-phase component beingi40Jj. Resolution
The operating frequency of this instrument is from
I5-25KHZ VLP Radio Band. The station selection is done by
means of plug in units. The station used for the Bm survey
being Annapolis Maryland.
A good conductive body was found to be situated on
A. O.K. claim #9417. The conductive axis is located approxraittly
at I2t75' north of the base line, (see fig II) The In-phase
readings of this conductor are as high as 4-55/i. The lateral
extent of the anomaly has been traced for 800* from line OK
I2t75lf to line 1413 I2t75 north. The conductor tha^. passes
into claim D, Y. 65. This claim is presently being optioned

to Monk Gold Mines Ltd. It is the geologist belief that the
Em conductor on claim #9417 is the same conductor (zone D)
outlined by the I.P. ourwey.
Through geophysical interpretation, this conductor
appears to be of sulphide origin. It also must be noted that
the minor Au geochemical anomaly-is on the periphery of this
conductor, Zone D is a prime drill target area due to the
fact of the geochemical and geo physical data compiled recently
on claim j?94I7.
The total amount of assessment work completed with ,the
Em 16 survey on A.C.R. claim #9417 being as follov/s:I day 8hrs s 7days. /--^ I day 4hrs * Jdays. f
Total days for Km survey being 10 day's.
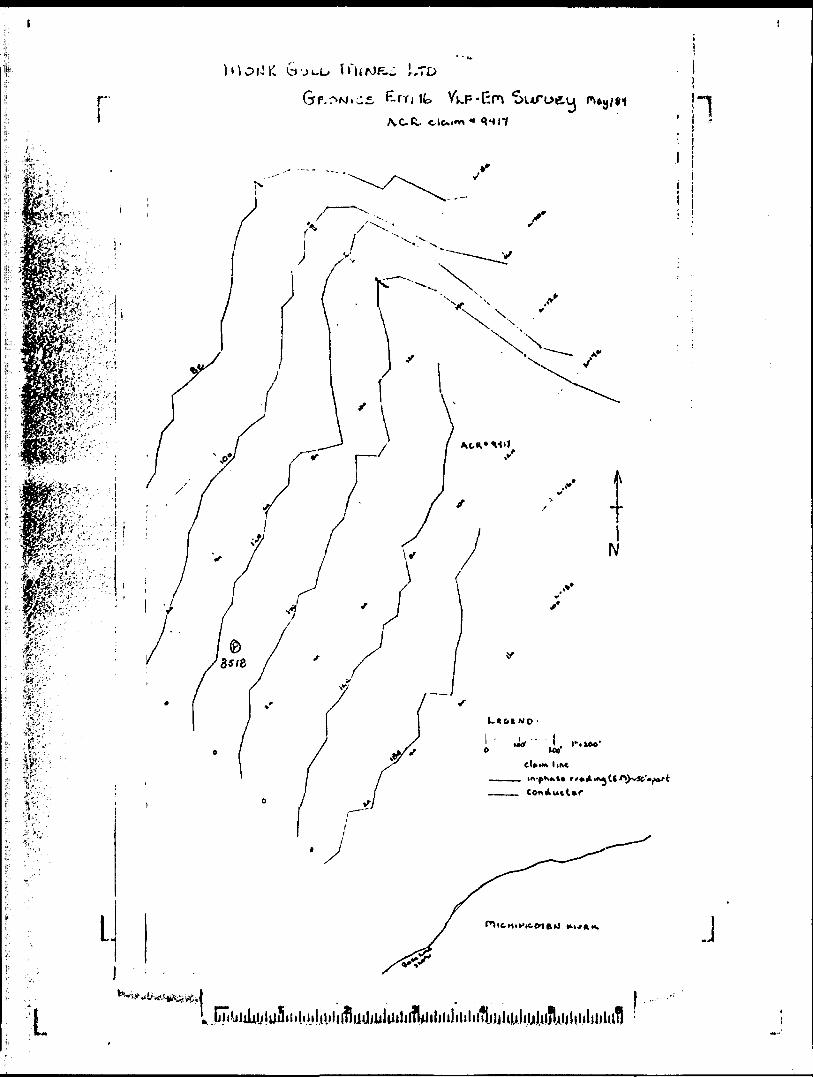
rLTD
YkF-Em
j

AGRE3HKJrP LEASE ?JO. TT f A.O.ft. 1)
A drill hole was collared on the ./ator Power Agreenent
Leaoe in 1903. (see Assessnent Report Mon'r f-old Mine B Aug.
31 1903) Due to the fact that approx. ^ of the clnin is flooded
by the Scott Palls Hydro Dam and the other half having
topographical N-S relief (^32*slope) the cutting of grid
lines would be' too ranch of an undertaking, (see Topographic
sheet inclosed)
Drill hole 11-4 will be extended to test the extention
of the two gold bearing zones of the weot side of the Mich-
ipcoten River. Yhe hole will be extended for 350*. Mapping
is difficult on this claim due to overburden. The over
burden being comprised of steep glacifluvial Michipicoten
River terraces and raised Lake Superior beach deposits.

"t r .. * * * '
tvlcMURRAY TWP.

V

VI SUM1IARY
To date vrith geochemical and geophysical surveys
completed on A.C.R. claim #9417 a prime drill target area
has been outlined. The claim is maximum of 650* across and
1000* long. Even though the claim is of limited size ( -J-
regular claim ), the claim be very important in outlining
a geologically significant deposit due the large conductor
which is located with in the claim boundaries.
VII GOMCLUSinN
Two drill holes will be collared on A.C.R. claim
//94I7 to test the gold bearing potential of the conductor
outlined in 1984. The holes will be collared 4-00' apart.
Location of these holes is yet undeterraind . One hole
will be collared at an angle of 50* the other being collared
at an angle of 60! Location of the holes will be L-Be and
L-I2E. The drilling of the two holes will commence during
the summer of 1984.

JVX LTD.27 Blue Spruce Lane Thornhill, Ontario L3T 3W8
Invoice: No. 37A Job 8403-GInvoice Date: April 5, 191 Payable 'upon receipt,
Client: MONK GOLD MINES LTD. 206 BERTIE STREET FORT ERIE,'ONTARIO
REVISED SECOND PROGRESS INVOICE WAWA INDUCED POLARIZATION PROJECT Period March 21 to.April 2, 1984
.11.1.;?'. EQUIPMENTi . ( i . i 11 .. . ,
/':t;^i Preparation 500.00
' '. n 't2.:VV, PERSONNEL (Daily Rates)
. .-.'•'•'•ii .';,,^ V *:V(a) ' Technician at S150 .00/day. '"'•''fv1 . f'^^'^V''' 9 days -- Thur. March -22 tto Fri, March 30 ,,1,350.00
; ; Party- Leader at $250.00/day ' . ' ' " .!' '' '';^' : 9 days ~~ Thur - March 22 to' Fri, March 30 2,250.00 .
'' W :,\''•i'-;:'.i-VM'v(c):-. Geophysicist at S250.00Xday: .V/'V^lV&y'il;';:' - !':.. 9 days ,— Thur - March 22^to Frr,"March 20 2,250.00' "
3,323.90
750.00
• •..••,.11'yVVV EQUIPMENT•'' ' s ; -: '- Vf viV'""'.', p '- ' : '
•'; '?'v (a) ',,IBR-11 etc. at S332.39Xday ;;-': ^ :.; j:!';'',' ; ' (10. days — March 21 to March 30" ^'•' :'(b) Soft II Package at S75.00/day ,. , V/ 10 days -- March 21 to March 30
11,4 'CONSUMABLES
- Diskettes, . - oas and oil
. ' . - Batteries'
Plus
S 149.80431.6919.53
601.0290.15
S 691.17 691.17
* \

• f* -
Invoice: Job 8403-0 Page 2.
No, 37A
From page l
li .5 OUT-OF-POCKET' EXPENSES (Mobilization A . , . Demobiliza'tion)
- i , , . Food Allowance March 22, 25, 30 ; ' ;, 4 days .x 3 men @) S30 .00/day/man S270.00
' Vi j . 'Telephone . 30.00 1 : " . Motel - '36.70
: :.;--;', ./Truck ' 663.81; . FM radios, at cost , 304.95
, 115. 07
,
; ^;;V.^!/Report drafting .••••; ; -t' !^f'i U Geophysical, report
--- . ' ' ! $l f 305.46'
-v, Total fieldphase ;^ ' i
S 800.00 2.000.00
1 ' S2,800.00
Total .
Less down payment. •'.- '••••. ;
- Balance
1.305.46 .'
12,420.53'- ' ' '
. i, :
"2 s. 800. 00'''
S15,220.53
6,000 .00
S 9,220.53
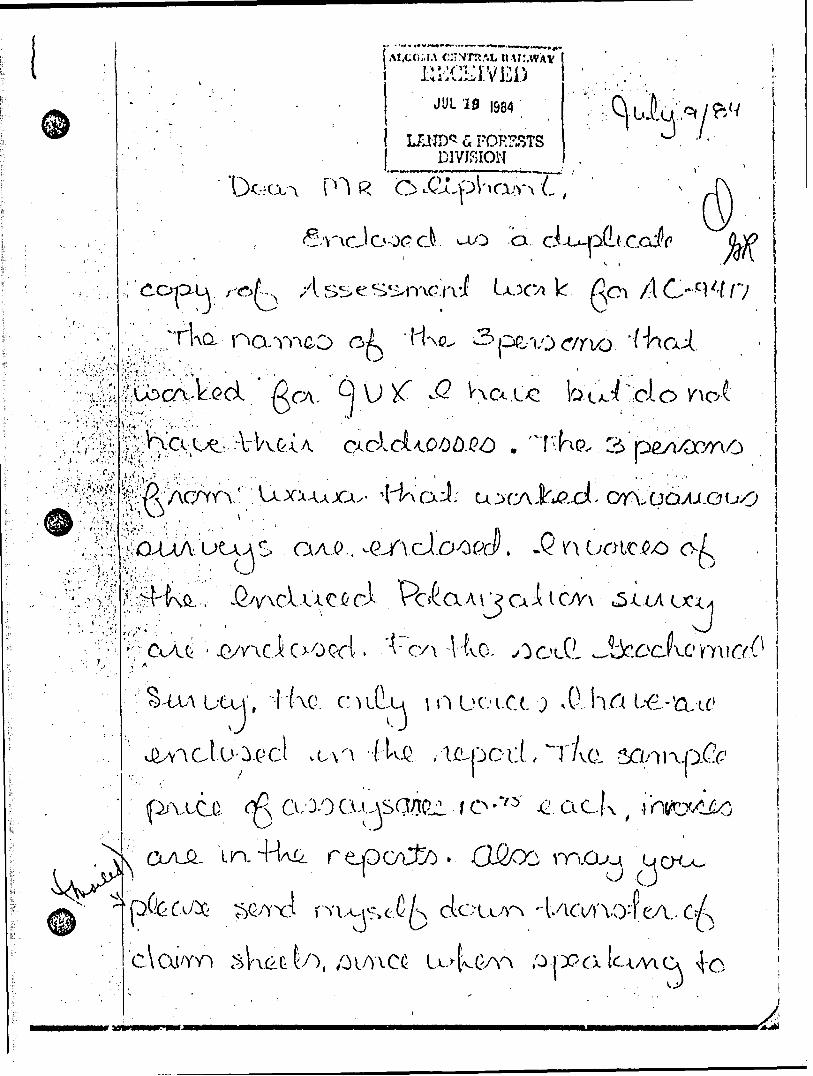
' ' -'' '.'Vi ' *- ., - f, , ,V. . r ." -" -'-' X'•-'•i
"* * -' ~t''-' -' i
•' 'I.,
tt \lr.WAV
JUL '19 J984
LflHD* ci FORSSTS DIVISION
o.
vi k.
Q U VT ^l:v . '
. 'l^Ko, 3
S OA..O.., ,
.t H\cL,-
. . Y\
? al t CM
,'
/i^pout.T'/va
U(jUuvr\0'feA..oA
C\aum

l L
not- k a c -c /rxci o
V ' LiCvu L.'VV\

1984 06 14
:,Mr.( Aleksa Kus1c, j 121 Churchill Avenue,
reviewing the work report submitted by you on behalf of, |MohkVGold;M1nes, f the .following Information 1s required 1n order to ^finalize;Assessment-Work for the above noted claim. : - 't^^H'"'-''v '-,-.,V; :V-.: : " jJi?:-iM?;--\-'.- :. .- - ,- .11
;^:' We shouldalso point but that claim AC 9417 1s held with Monk and. not .Monk Gold Mines Ltd. ' '
We are enclosing your Permit #194 valid until March 31, 1985.
"':^XMSSP^W^: -In. revlewlr•* * \ f^i^^T'VjrJ^ff- k'tf *- ' t ? "**' 'm ** : B*a . i
.7,.".?..- a statement of expenditures 1s required for the
you have any.questlons concerning the above please feel free this Division.- Maybe some of the problems could be cleared up
^telephone.. ; . c; ' ; :
; Yours very truly,
Manager -. Lands, Forests A Mines Division,•^..•Ktr^-'-j,-- '.•^"hV"
1 - ' ' '. . V ''•*'* ' -
''•" . \ Vr. \

'1/77
t i k 67
1 i. o,
c L / /VN /;y/
-i /c/
,'

;- T.VvPS^.Or- 29' fe RAM''-.^O . -* - -" "-o RUI4 .
^^^^P'-^^^l
POST 5
If i
v

o-p People, Fmplouedi Tim
emploueci 0i A
,
UaAUoA
nr) \x
oMcdL -fer * vi 8,5- Krs
O
xn
rsc PQ x.l Conrot i
KrsCoe 1. Case. :
O
O
- T raa lor
(TiaroK
O
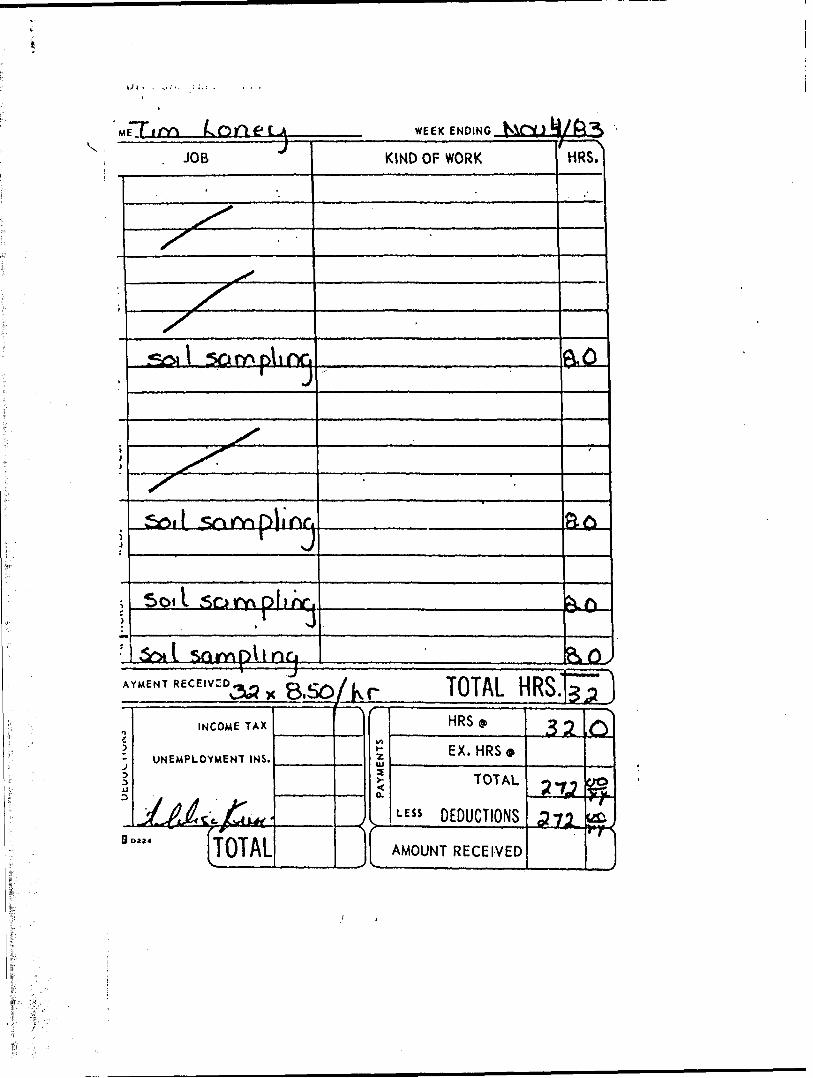
JOB
WEEKENDING
s
Soi l
KIND OF WORK HRS.
AYMENTRECEIV^^ X 8,50/Kr TOTAL HRS.'
UtL/uv. i iur-0 jINCOME TAX
UNEMPLOYMENT INS.
(TOTAL
s
j
r PAYMENTS ")
HRS 9
EX. HRS 9
TOTAL
LE" DEDUCTIONS
II AMOUNT RECEIVED
1 III "
32
2V37^
"l
g?ua
f-f.

Cose WEEK ENDING
JOB
*
Cw
X
'
1
sJ
1
I,P suroa-
\*P surucx
ioy l, P ^ur(.y surue
l. P suru*
1 Y7/i K 50^^
liP Surue
KIND OF WORK fi
j /Cfcoer/cta3 7 '
J ————————————
uex-\u-^
uD ————————————
-Mj
MJ
MRS.
1 ^
U
l-o(.0
l-o
1*0
I'O
AYMENT RECEIVED TOTAL HRS.rssi/
INCOME TAX
UNEMPLOYMENT INS.
[TOTAL fClf\ ' VOfV,/ ^)
EX. MRS®
TOTAL
LE" DEDUCTIONS

9 *EEK ENDING
JOB KIND OF WORK HRS.
T^OY ut.
icVlM————Ug-S I-&l. p .s. 1^-0
/.P J/l iP
^ u^44i
JAYMENT RECEIVED
DEDUCTIONS
INCOME TAX
UNEMPLOYMENT INS.
D- (TOTAL'^ )-o } V j

41 KM SfCe 104 0934 RABAZO040
MONK GOLD MIWB8
ASSBSSftffiNT REPORT IQQ4.
ALGOMA GENTRAT. RAILWAY
CLAIMS 9417WATER POWER AGREEMENT LEASE NO.II
(A.C.R.)
BY:ALEKSA KUSIC
GEOLOGIST B.SO. MONK GOLD WINES LTD.
1984.

l ' tJ
41N15NE0104 8834 RABAZO 040C
TABLE OP CONTENTS
I. Location A Access.
II. Surveys.
III. Geochemical.
IV. Induced Polar iz at ion.
V. GeonioB Em 16 VLP-J3ra Survey.
VI. Summary.
VII. Conclusion.

3. LOCATION AND ACCESS
The Monk Gold Mines Limited Property is located 12.miles
South East of Wawa, Ontario. This property consists of l*M(1
patent claim (#8758), 3 Algoma Central Railway claims CL.&9&47.,
9176, 9179 and claims registered with the Ontario Ministry
•of Department of Mines. (Claim #C\^TOS,C09M53,
The property is accessible by a secondary road that is
open year round which leads to High Falls and Scott Falls (Hydro
Electric Generating Stations) is located 5 miles south of
Wawa on Highway 17.
The Monk Gold Mines Ltd. gold prospect is located approx.
500' north west of the Scott;Falls Hydro Electric Generating
Station.
If an economically viable size deposit l- outlined on
Monk Mines Ground, hydro-electric power can be bought cheaply
because of the property's {Location to the Hydro-Electric plant.
'Large reserves of well sorted river gravels are also avai
lable on the property to be used for the development of an
effective ponding system to contain, mill .ing and mine wastes.

ALGOMA CENTRAL RAILWAYMINES DEPARTMENT
REPORT OF ASSESSMENT WORKTO THE RECORDER OF ALGOMA CENTRAL RAILWAY
(Norn .t Utard*) M*U*0 .(rwpKtor*! f*fmh H.J
......__.-..l&cjsaxA jiAau. Au C- loai ntV-Q MT A fi. ta......O (Nil Office AcMrtil)
do hereby report the performance of ~CUTOJQ.** -r\—— ——-—......... Joys of .
not before reported to be applied on the following contiguous claims.Note: All claim numbers must b* shown In full.
Claim No. Days Claim No. Days Claim No.
All of the work wo* performed on Mining Clolm(i) ..————.......——.———.——— ...... —.___ ____.(In the cot* of geological or geophysical turvey(t) where more than i B clalmi ore Involved thow oddl-llonol clolmi and respective "Dayi" on bock of (Ml iMet)Read Corefvillyi The Following Information li Required By The Mining Recorder.I For Manual Work, Stripping, Opening up of Mine*, Sinking Shafts or Other Actual Mining Opera
tion! — Nomet and addresses of the men who performed the work end the dotei and hour* of their employment. Detailed sketches of all work mutt be lubmltted In duplicate.
II For Diamond and Other Core Drilling — Total Footage, Number of holei. Diameter of core. Name and address of owner or operator of drill. Datet when drilling woi done. Signed core log and profile •ketch In duplicate for each hole. Alio tketch plan in duplicate ihowlng drill hole locatloni with ret- pect to claim posts, direction of hole, length, etc.
III For Compretted Air or Other Power Driven or Mechanical Equipment — Type of drill or equipment. Namei and addresses of men employed to operate equipment and the dolei and hourt of their emp loyment. Detailed sketches In duplicate ihowlng the work performed.
IV For Power Stripping — Type of equipment. Nome and addreti of owner or operator. Amount of money expended. Doles on which work wai done. Proof of actual cost mutt be lubmitied to Mining Recor der within 30 dayt of recording work. Detailed sketches In duplicate ihowlng extent and dimeniloni of work performed and Its location with respect to claim posts.
With each of the above types of work (l, II, III i IV) duplicate tkelches or legible prints thereof ore re quired and they must show detailed measurements In feel of the work completed and Its location to the nearest claim pott.For Geological, Geophysical and Geochemical Surveys, Soil Sampling, Assaying, Metallurgical Tests — The names and addresses of the men employed with doles and hours worked. (Technical work to Include report preparation, drafting and typing os well os field work when calculating Assessment credits). Type of Instrument used In the case of geophysical survey.Properly signed rep'.rls and mops In duplicate (prints) together with qualifications of oulhor(s) must be filed with the Mining Recorder within 60 days of record ing the work.for Land Survey - The name and address of Ontario land Surveyor together with certificate of qualifica tions. The work requirements, descriptions, necessary drawings, etc, must comply with Algoma Central Rail way and Ontario Government Regulations.
The Required Information is os follows: (Attach o list if this space Is not sufficient).
Date
ALGOMA CENTRAL RAILWAYMINES DEPARTMENT
CERTIFICATE VERIFYING REPORT OF WORK
AQ.OI)
..-AijiEUJO C"' OfflM Adiktii)
hereby certlfyi1. That l have a personal and Intimate knowledge of the facts set fort S In the report of work an
nexed hereto, having performed the work or witnessed same during and/or cfter Us completion.1. That the annexed report Is true.
Doted ,CO.CUJ...2.O..................... ISO (Staftotvr** *r Agvnl]
.C . ^

S. if"
II SURVEYS 2.
'S-I-
t*)-
A Geochemical and two Geophysical Surveys (Induced
Polarization Era.16) were performed on the A.C,R. claim
#9417. This claim is presently held by Monk Gold Mines
LTD. of Toronto,These surveys were carried out on out lines with a
200* interval spacing between out* lines. The asrairth of
the cut lines is 50 degrees and also the lines were pick
eted at 100* Intervals, Lines numbered 8 east, IOE, I2E,
I4E, I6E and 18 east traverse A.C,R. claim# 9417. The total amount of assessment work performed on A.C.R*-
/ \ #9417 from the above mentioned surveys is 92.9 (93) days i
•
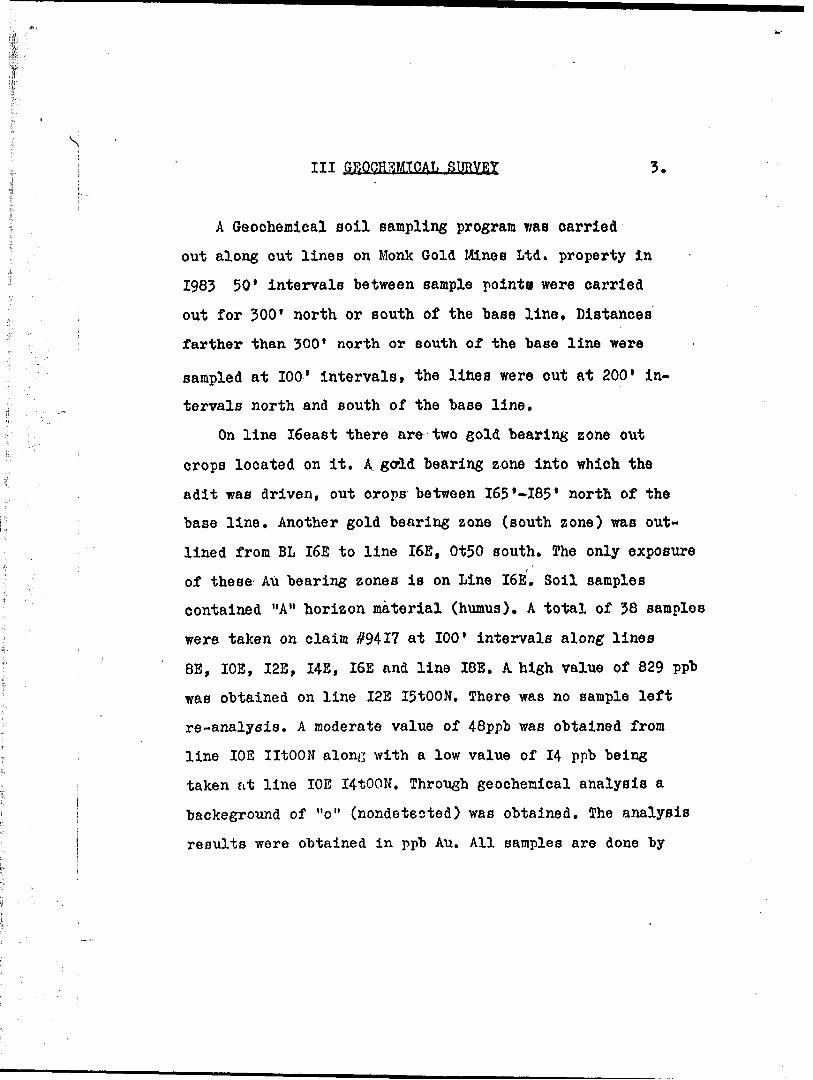
III GEOCHTiMICAL SURVEY 3.
A Geochemical soil sampling program was carried
out along cut lines on Monk Gold Mines Ltd. property in
I98J 50' intervals between sample points were carried
out for 300* north or south of the base line. Distances
farther than 300' north or south of the base line were
sampled at 100' intervals, the lines were out at 200' in
tervals north and south of the base line.
On line I6east there are two gold bearing zone out
crops located on it. A. goid bearing zone into which the
adit was driven, out crops between 165'-185* north of the
base line. Another gold bearing zone (south zone) was out
lined from BL I6E to line I6E, Ot50 south. The only exposure
of these Au bearing zones is on Line I6E. Soil samples
contained "A" horizon material (humus). A total of 38 samples
were taken on claim #9417 at 100' intervals along lines
8E, IOE, I2E, I4E, I6E and line I8E. A! high value of 829 ppb
was obtained on line I2E I5tOON. There was no sample left
re-analysis. A moderate value of 48ppb was obtained from
line IOE IltOON alone with a low value of 14 ppb being
taken fit line IOE I4tOON. Through geochemical analysis a
backeground of "o" (nondetected) was obtained. The analysis
results were obtained in ppb Au. All samples are done by

F,A. (fire assay). Samples are screened at -80 mesh to give
i A.T. or 14.58 grams. If unsuffioient amount of sample
was recieved the sample was screened at -20 mesh, (see II-I)
Soil sampling was performed by RaymondjZorzi^ of Sault ate Marie and Tim Loney of Wawa Ont, in November 1985,
The days assessed f or "geochemical j^il sampling analysis
are as follows: c y iln o- (38 samplesx 10.75ft) *J5reOfc::-2?72-days
assessment. *note man hrs. not included.
A new soil sampling grid system has been established
on A,C.R. claim #9417. Samples were taken at 25' intervals
along cut lines and between cut lines 8E - I4E from IJtOOH
- I6t50 north. This survey was performed the IO-IIth of
May 1984. Samples will not be sent out for analysis till
mid July. •:,f

r
r
MS:
m?
K -,
lL
S? f'-'-^rffcf'Jrv'V ."/.'^ -' ~ ' :
/
70
\
G-OU.D W W 6. S
j, .
V
V
*CororouA rrjftJ? A- C. R.
j'
V
LEGEWO
?'eoart
Au. p.p.b.
lin*. wiH\ clcuwi
^
!-

[ Assayers LimitedV S*
* xj!/ Monk Gold Mines
V \^
'"MESSAGE
Dear Mr. Kusic:
.... . _ ............All samples are dor
give 1/2 A. T. or 14.58 |
-—. . . ' ". screened at -20 mesh.
1 - - .
*
.- .....,-..-.~ -.— .... ——— . — .... ... ..
f*mt cu us roun K''oxit — ost ion 1 1 roinoN rot otrit
OJrAIITCHCNT.DIPAIITMINT - ^\
DATE ' S
. . -- . .January 9, 1984 . .• UJCT.IUCJtCT
J. S
le by.. P. A... Samples are screened at .-80 mesh to
[rains^.Jf. insufficient amount of sample, it is
- - - -'
Yours truly,
ASSAYERS LIMITED
........ - '.. ..- . - .....- . yjUtQ&T*-- rf Q<&CO .S.- L. Brosko
*
-— ----.. ~— - - - - -- . — -.... — . ; .. ..^,... . ... .. ^ .
BcVoNfC oc-ntriY m ox DATE

QU E8ECi 183 RUE GA./.ULE O.. C.P. 66- ROUVi ...X 2R8 - TEL: (819) 762-3010
ONTARIO: 20 VICTORIA STREET, SUITE 606 - TORONTO. MBC 2N8-TEL: {416) 366-3100
GiOCHEMICAL ASSAYSMonk Gold Mines September 1983
impltfof: eh.ntlllontd.:
S*mplt Dtcompoiltlon Dicompoiltlon d'ichmtlllon
LAB NO.
CUSTOMER'S9 AMr k t
NUMBER
. 7138
9
7140
1
2
3
4
5
6
7
8
9
7150
1
2
3
4
S
7156
COPPER
L-Ue- '
L-IOr.
L-iOr-
l
XINC
\5*.
I"4n
ion
PLEAD
* No samp
ARTS PER
NICKEL
'
le left f o;
MILLION
MOLYBDENUM
checking nirposes
GOLDPPB
N.D.
N.D.
N.D.
* 829
N.D.
13
N.D.
N.D.
N.D.
48
N.D.
N.D.
N.D.
N.D.
11
N.D.
N.D.
N.D.
18
^
ASSAYERS LIMITED
January 9. 1984 PAR,————— ^ .——,—.——^^ANALYTICAL CHEMISTS - ASSAYERS - SHIPPERS' REPRESENTATIVES - CONSULTANTS J
"AU SERVICE DE L'lNDUSTRIE DEPUIS PLUS DE 40 ANS" "SERVING INDUSTRY FOR OVER 40 YEARS"

2707ASSAYERS (ONTARIO) LIMITED33 CHAUNCEY AVENUE, TORONTO, ONTARIO M8Z2Z2 . TELEPHONE (416) 239-3527
Monk Gold Mines Limited/ . .. ?* Li .'^ i' 'Attention: Mr. A. Kusic, ^Bovarian Inn/ Room 10 - 1-Mission Road/WAWA, Ontario. POS 1KO a
s i MIC (wpKovUT ' IIED uciNcTSS ~~ PAOV HCENCINO VOUOOHOCRNO ouAonoiRio HAMS' IAIUMP.' "\
Dec 9/83 L , . -. . - N .L?0., ___ .-l
81 Assays Au S 8.00 5648.00 81 Sample Handlings -. "2.75 "229.75
Cert. No. MI-510 December 9/ 1983 -
J.xPTess ..Ch^arges . .. .,.
Purolator Courier ^..79444264 -.11/23/83 S;16.01- to deliver plastic bags
J893.~76l v l A LB Fviwfw ** rv r* ** i
*tW\V*l-MOOM4^bMiMWlMt|Ml|*iltt IMI TOtOt ' 1104

IV IWn.UCqi) POLAR T?. AT TON
A Induced Polarization v;as carried out on Honk
Gold Mines Ltd, property in late March. This survey was
done "by J.V.X Limited and included A.C.ft. claim /r'9417.
These I.r. anomalies are named Zone C and Zone D in the
I.r. report. It must "be noted that Zone D is the large
anomaly noted on the Era 16 survey and is a priorit target
for diamond drilling. Diamond drilling will commence during
the field season of 1984. A 50 degree hole will be collared
to a depth of 400' to test this structure for its gold
bearing potential. This structure is a highly conductive
zone, (sulphide?)
Zone C is a zone of resistivity which indicates a
sill fied or a qtz. rich zone. The two gold bearing zones
on Monk Gold Mines Ltd. property are composed of -40# -50#
qtz. This ie also a priority target zone. A shallow 45 degree
hole will be collared for 300' to test the gold bearing
potential of this zone.
The days assessment performed on A.C,R. claim #9417
from the I.P. survey are as follows,* 'io y' '-' :Jb
5 men xIOr5~ days' r.52.-5' days,
(

- o o lo
sO*

QO
QO
O.O'4-
QQ O0
QO'4- o0
o.
Q \/Q o0
o. V
Oa OO
txxOO
Qv OD
O\/
Q OO
O
QO
QOxo
QO
o.o,
'o,
QO,x
QO,
'X
41N15NEd104 0034 RABAZO 200
OO
OO
\\/
xODLEGEND
CONDUCTOR (VLF ANOMALY)
IN PHASEPROFILED
5 OUT OF PHASE
C+) 20 10 O 10 20 (-)
INSTRUMENT-GEONICS EM - 16OPERATOR -A. KUSICTRANSMITTER- ANNAPOLIS, MARYLAND
RABAZO TWP NAVEAU TWP
SCALE - l" s 4O CHAINS
CLAIM MAP
TYPE OF WORK Very Low Frequency
ELECTROMAGNETIC SURVEY J?CLIENT
MONK GOLD MINES LIMITEDPROJECT
MICHIPICOTEN PROPERTY RABAZO-NAVEAU TWPS
Global Geoscience Cosultants Ltd.
AREASAULT STE. MARIE
MINING DIVISION
SCALE
DRAWN BY
JTN
DATE1984 April
DRAWING NO.
84M-5
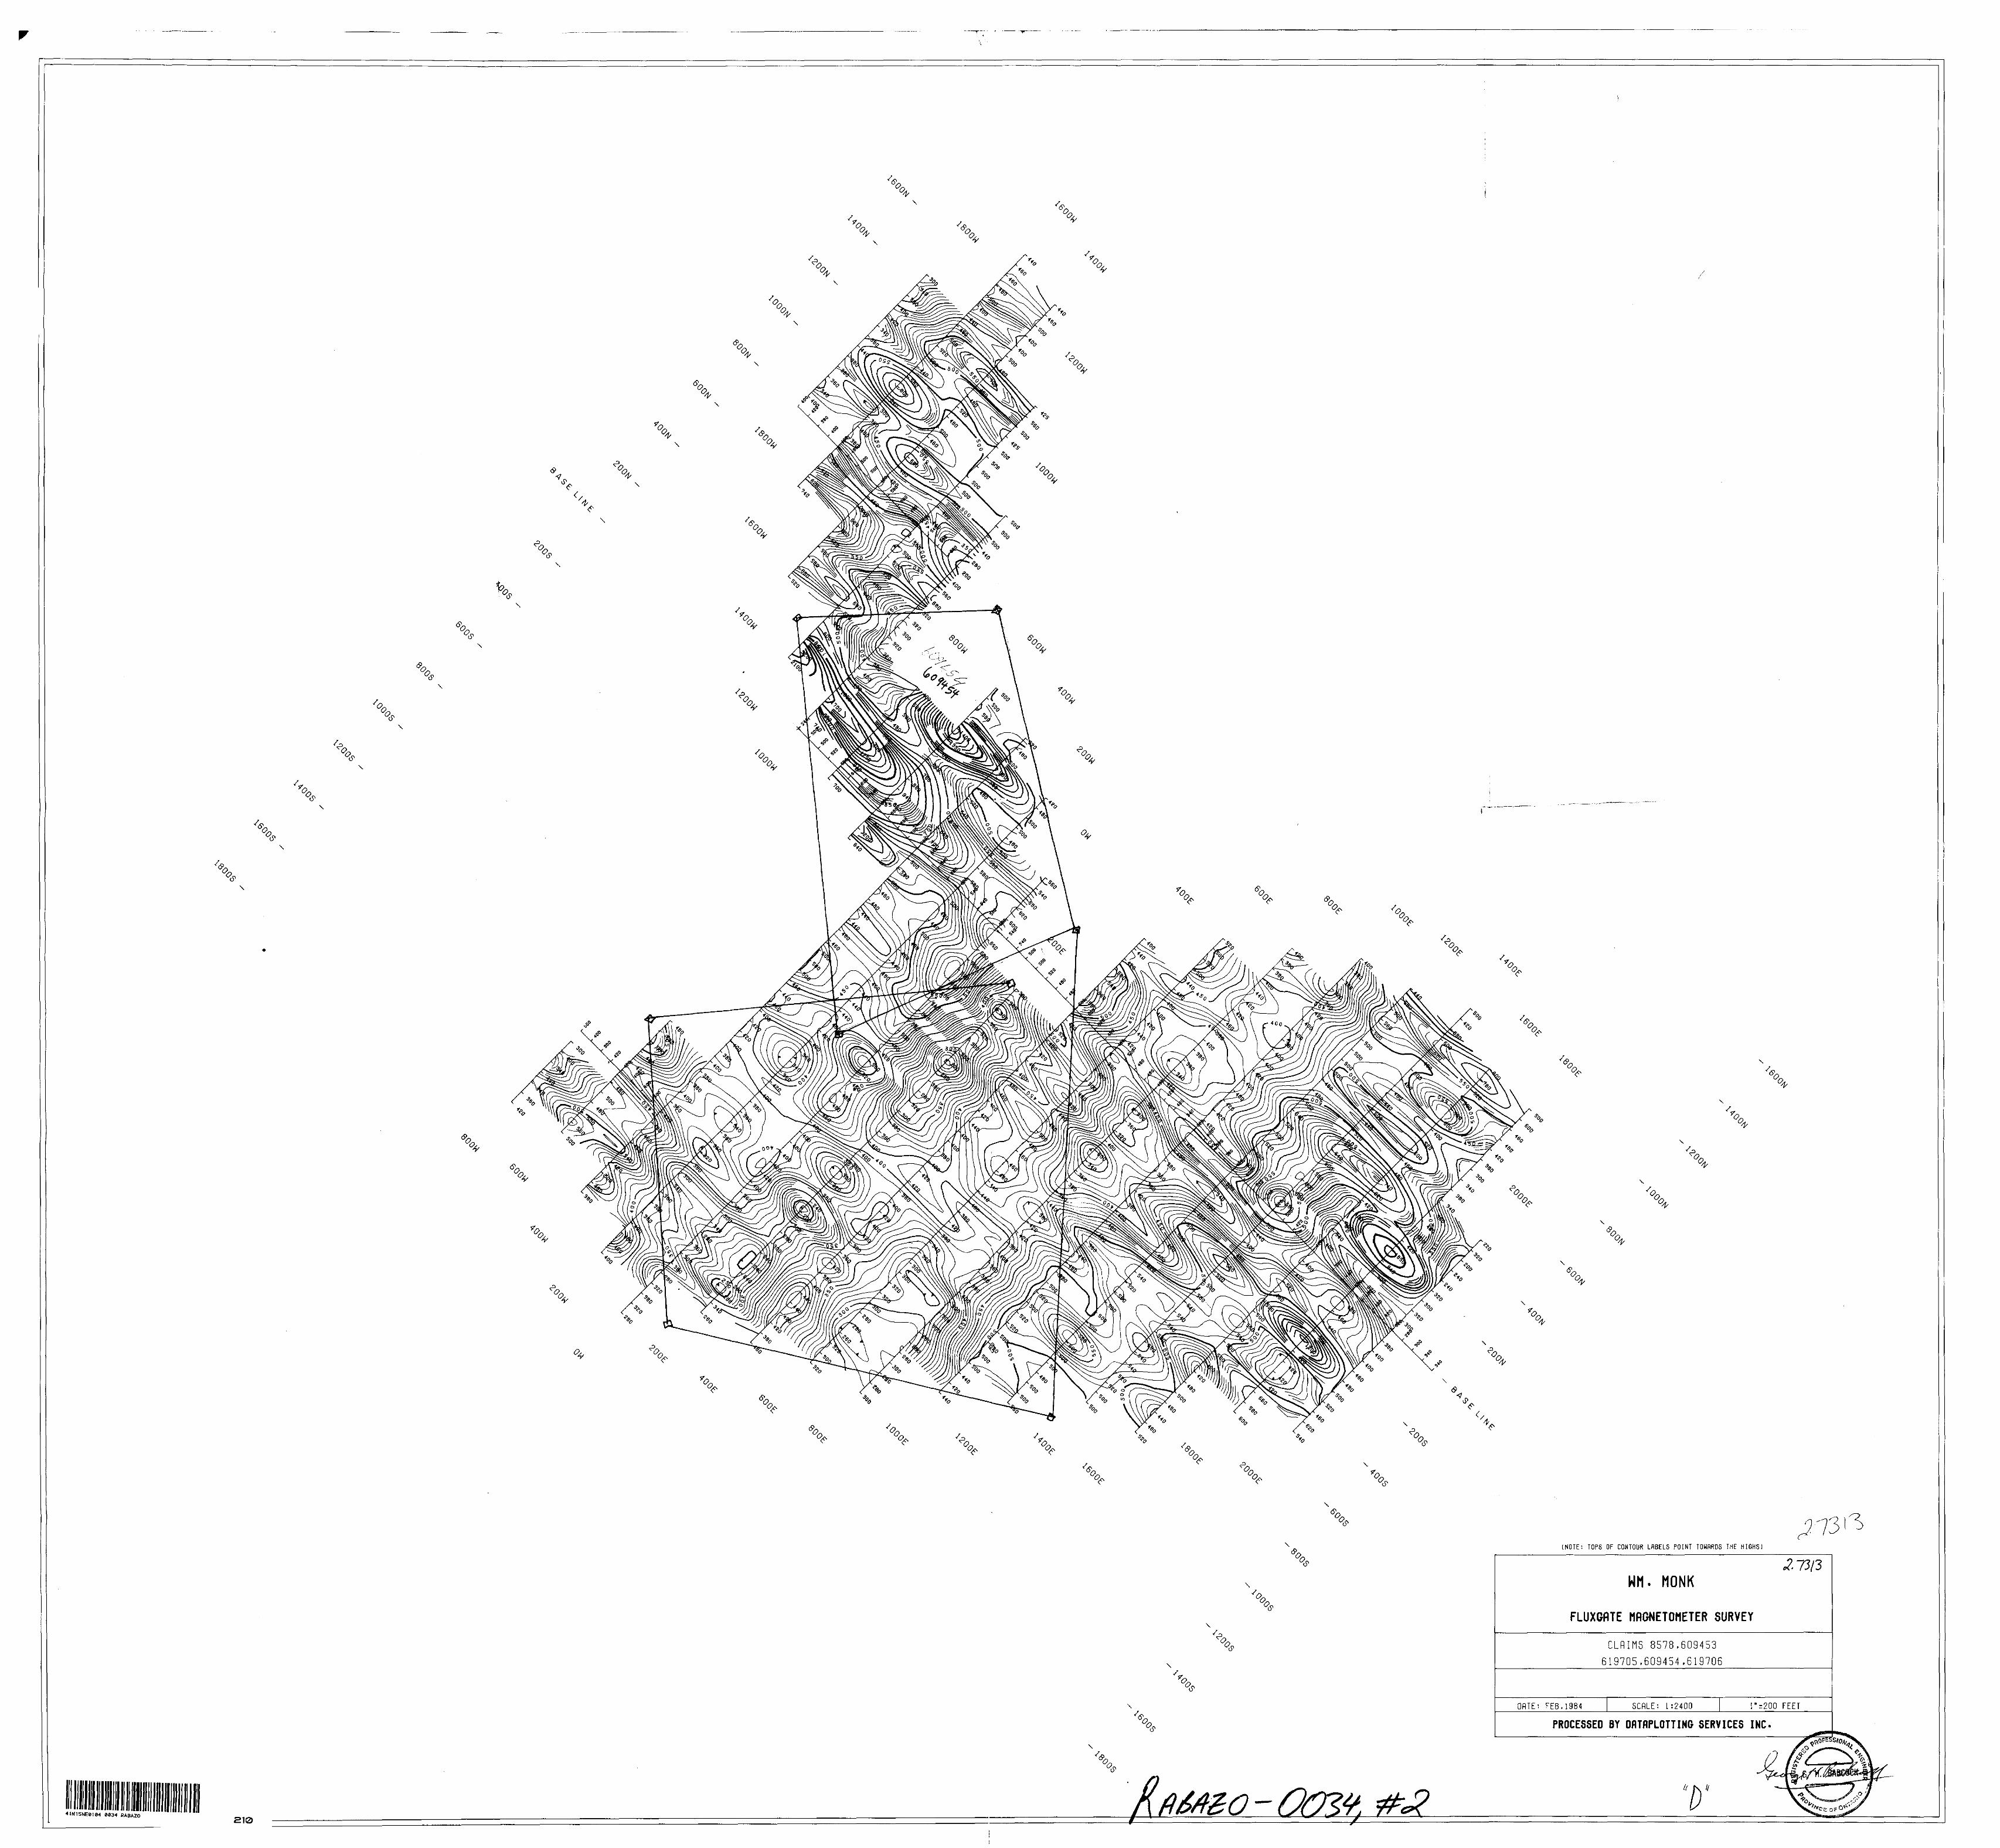
A\"o. 'G, \
\
Vs\\
\
\
\
\
/.
\
d1.
\
/.
\
\
\
\
\dV
4IN15NE9104 0834 RABAZO210
A
"c? r
\
\
\
^?r
\5'?:
[NOTE: TOPS OF CONTOUR LflBELS POINT TOHflRDS THE HIGHS)
NM. MONK
FLUXGflTE MflGNETOMETER SURVEY
^73/3
CLfllMS 8578,609453 619705,609454,619706
DflTE: FEB.1984 SCflLE: 1:2400 T-200 FEET
PROCESSED BY DflTflPLOTTING SERVICES INC.
D

BW
41N15NE0ie4 0934 RABAZO 220
-~l L.-
G^Sfffl
) -ZO PARTS PER
^rf-'
-l OD
en |o(-2co
SCALE 1- I-
He
Se
-OOJt

o
7 5-
1C
o CO (D
LEGEND
CHARGEABILITY CONTOUR10, 20 mV/V . ,... ,.^ - .. - . ..
25,5, 75, 12-5,15,17-5 mV/V
DEPRESS'OM
CM O
LU
CJ
LJ LU LU
00
BASE LINE
25 mV/V
MONK GOLD LTD.
WAWA PROJECT RABAZO TWP., ONTARIO
4INI5NE01C4 0034 RABAZO
a ~ 31 m n - 4
CHARGEABILITY CONTOUR MAPPOLE-DIPOLE ELECTRODE ARRAY
IPR- H RECEIVER J. -7 25 kW TRANSMITTER
SCALE l -- 2400
SURVEY BY jv* Liwnt'jMARCH 1984
PLATE l
840? -
230

BASE LINE
KFSISTIVJTV CONTOUR INTERVAL IN MULTIPuE OF ,A
IO -.-.— -. ....... — . ....-.— .. - - ............^- -,.-,,-.
b JJ, 5 7-5 .. ^..,. - ^. - _____ ^ _ ^
DEPRESSION -.-. .-. ....^-,. .-.-......,-...,--.___ C
U)
MONK GOLD LTD.
WAWA PROJECT RABAZO TWP., ONTARIO
RESISTIVITY CONTOUR MAPPOLE-DIPOLE ELECTRODE ARRAY
SCINTREX iPR - :t RECtlVERIPC -7 ?D kW TRANSMITTER
SCALE ' l : 2400
41N15WEaHC4 0*34 RABAZO 240
SURVEY BYJV'X LIMITED MARCH 1984
PLATE 2
8403 - 6
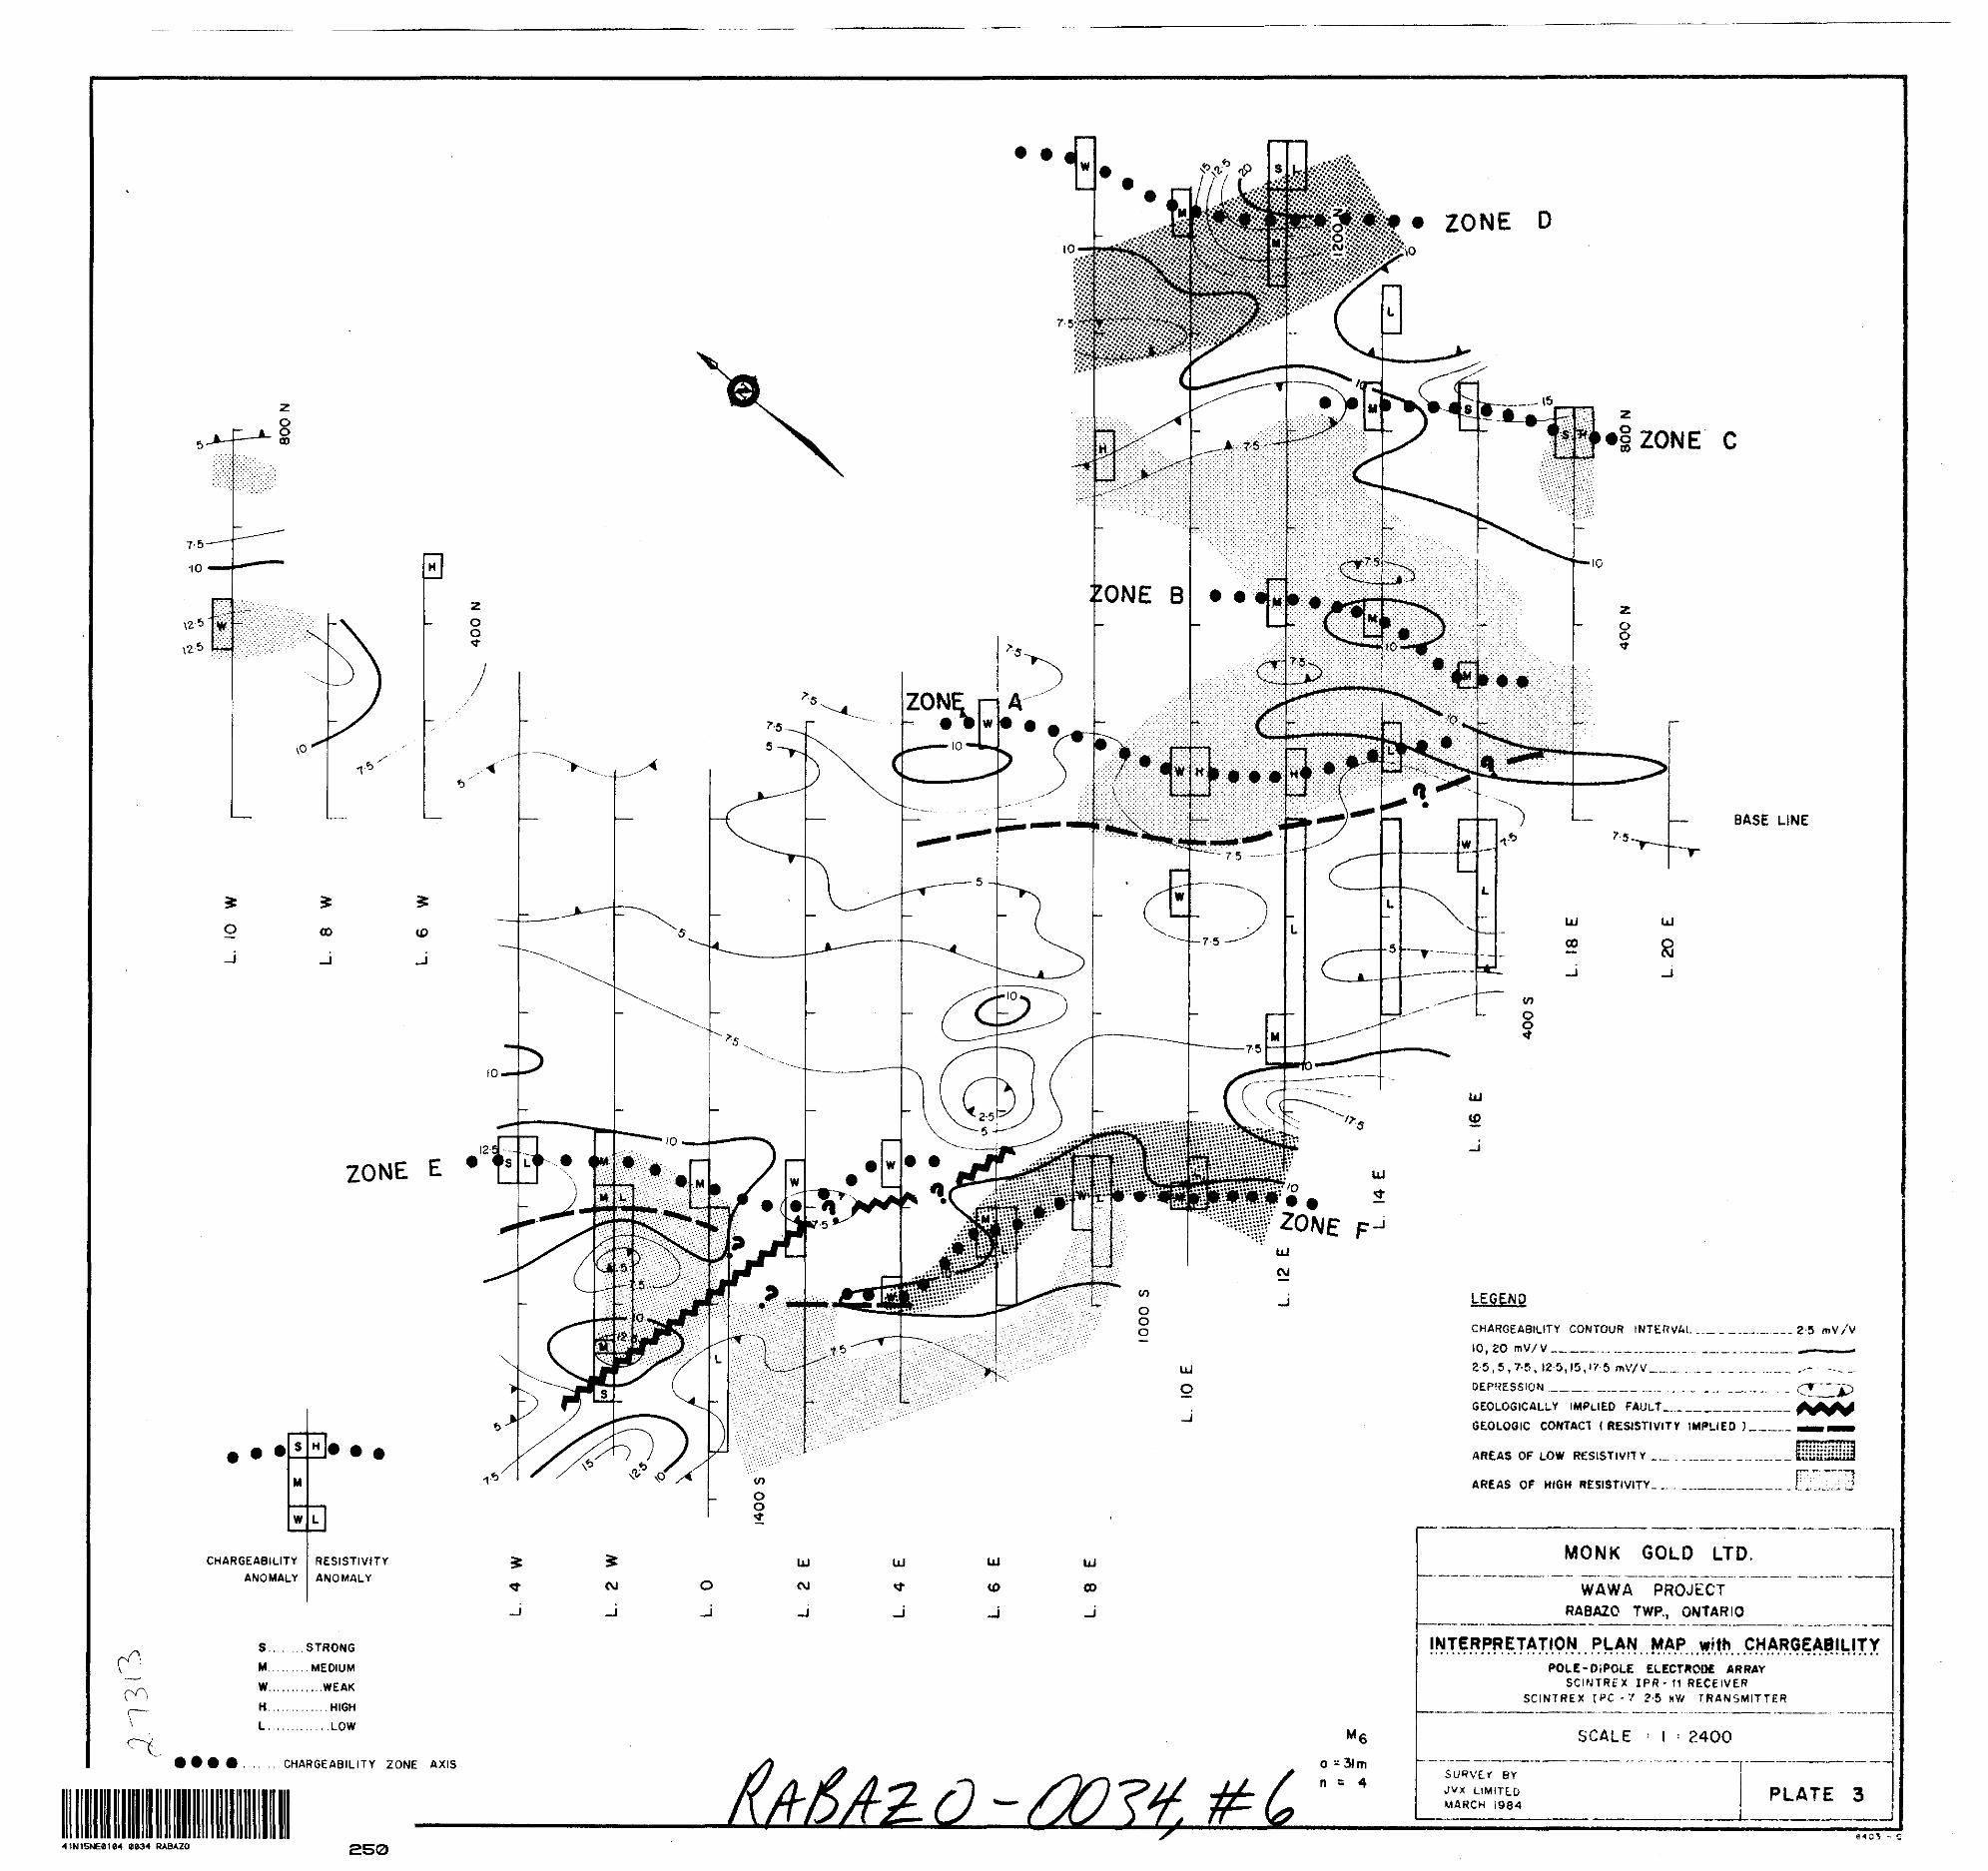
* ZONE D
7-5-
•10
•S ZONE C
-H-.
iiiK
O
J
at
co
ZONE E *
CHARGEABILITY ANOMALY
-- BASE LINE
LESEMO
CHARGEABILITY CONTOUR INTERVAL.^--.....^..^ 2-5 mV/V10,20 mV/V—————.- — ..-™,.... ..........^.25,5, 7-5, 12-0,15,1/5 mV/V_... .. ^..... ...^DEPRESSION .-.^. ..... .... ..^ . ,....__...,...GEOLOGICALLY IMPLIED FAULT...._________.^.GEOLOGIC CONTACT l RESISTIVITY IMPLIED )___-.
AREAS OF LOW RESISTIVITY_.
AREAS OF HIGH RESISTIVITY. .. . .
RESISTIVITY ANOMALY
UJ UJ UJ
CJ
UJ
CO
r
S........STRONG
M.........MEDIUM
W..,.........WEAK
H.............HIGH
L.............LOW
.....CHARGEABILITY ZONE AXIS
MONK GOLD LTD.
WAWA PROJECT RABAZO TWP., ONTARIO
INTERPRETATION . PLAN ..MAP with . CHARGEABILITYPOLE-DIPOLE ELECTRODE ARRAY
SCINTReX IPR - 11 RECEIVER SCINTREX IPC-7 2-5 hV; TRANSMITTER
SCALE : l ' 2400
SURVEY ev jvx LIMITEDMARCH I984
PLATE 3
8105 -C
250

to in
O
•o
MONK GOLD LTD.WAWA PROJECT
RABAZO TWP., ONTARIO
LINE No- 8 E
INDUCED POLARIZATION SURVEYO* 100* n- 1,2,3,4,5
Pulst tlmi t 2 ste.
SCINTREX IPR-11 RECEIVER SCINTREX IPC-7 2-5 kW TRANSMITTER
POLE-DIPOLE ELECTRODE ARRAY
SCALE' l t 1550
RMitnvmr CONTOUR IN to warm m c MULTIPLES OF1,1,1.7-1,10 " DEMCItK)N ——
CHAIUEAMUTY CONTOUR INTERVAL. 11,1,T *, n*IM,ig~. .V/V————
M m V/V
ANOMALY CUtMIFICATKM
IT (ION*.MEDIUM.
SURVEY BY JVX MARCH, 19*4
S403-6 PLATE 13
g ~
en•—t en
COs gCD
ftOD
S Sm - r*. S•o stn S CA
S S 2 0 * S f1 fO 10 I s ar-. ai i s9 O- o
S s(M
O M
r
S A
SOD
Or*.
in tn 55 KQ o e* CS -e "f* t*1 EA *S' S o o
! 1 1 '
P-. l1
r ^* S
K:•E9 UT
•-1•oC* -i^ \3 Ci -^ir^. .CD tr- o -^
gOD
t—
rsi
MONK SOLD LTD.WAWA PROJECT
RABAZO TWP., ONTARIO
LINE No. Ip E
INDUCED POLARIZATION SURVEYO" I001 n* 1,2,9,4,5
Pwlti HIM ' Z we.SCINTREX IPR-11 RECEIVER
SCINTREX IPC-7 2-5 HW TRANSMITTER
POLE-DIPOLE ELECTRODE ARRAY
SCALE ' l i 15501-EBEMD
•CSltnVfrY CONTOUR W IMAMITHMtG MVLTIPtn OP'
CMAMf ABLfTT CONTOUR
AHOMAtY CUMmCATKW
•TftOHfl. MCOtUH.
SURVEY BY JVX LTD.
PLATE 14MONK COLD LTD.
WAWA PROJECT RABAZO TWP., ONTARIO
LINE No. 12 E
INDUCED POLARIZATION SURVEY0*100' n- l, 2, S, 4,5
Pu 11* time i 2SCINTREX IPR-11 RECEIVER
SCINTREX IPC-7 2-5 kW TRANSMITTER
POLE-DIPOLE ELECTRODE ARRAY
h
LESEND
M, i. r*, w
SCALE' l * 1550
COMTOUH w lotARmwic micnncfl OP
CHANtCAHUTT ODNTOUft WTMVAL, M t I,T l. W,(t-t.H- -V/V————
n.v/v
ANOMALY OMIIPICAT10N
STROM* .. —————^—
SURVEY BY JVX UD. MARCH, |*S4
•405-0 PLATE 15

lil CO
M O O CO
OZ
UJz
CJ UJ*"*O
C-*UJcc
Oin in
LU-lCu w
ct
Q-
inc* -o
g
rsio o
ozLUZ
Oinin
UJ-i a u in
t-JLU LO
LINE 10 E
PLATE 30
UJ
-i
RABAZO
O lil UT
LJ -ld u en
270
enOh- )
trjC.-r -i
- no?y LINE 12 E PI ATF ^l

** i.;
1, c i -rJ Altered
*:, *-o ' ^Q r c. J tetlcX^ uatU -iHejcxrea,rr\\V\6rod i XG-A-i ors
pu .pod -^ j p^ re.
. of cob i c
loci lda-sA\r\a
i cio^V ll uJ'i d (LvU J/JL. r"J*ty
j—— -rttTt 0-02
1UJ15NE0104 0034 RABAZO