an expert system for protection system design of
TRANSCRIPT

AN EXPERT SYSTEM FOR PROTECTION SYSTEM DESIGN OF
INTERCONNECTED ELECTRICAL DISTRIBUTION CIRCUITS
by
Jeffrey Craig Thompson
Dissertation submitted to the Faculty of the
Virginia Polytechnic Institute and State University
in partial fulfillment of the requirements for the degree of
DOCTOR OF PHILOSOPHY
in
ELECTRICAL ENGINEERING
APPROVED:
llet L hvodlle Robert P. Broadwater, Chairman
Lak ura bef, , YY rs
Saifur Rahman Arun G. Phadke
Scott F. Midkiff Terry L. Herdman
November 1993
Blacksburg, Virginia

LD
SoSs
VOS\o
(AQ%
TS35
C.%

AN EXPERT SYSTEM FOR PROTECTION SYSTEM DESIGN OF
INTERCONNECTED ELECTRICAL DISTRIBUTION CIRCUITS
by
Jeffrey Craig Thompson
Robert P. Broadwater, Chairman
ELECTRICAL ENGINEERING
(ABSTRACT)
As necessity for improvement in system operation demands the implementation of
distribution automation, design of the protection system becomes more involved. Several
goals of distribution automation -- improved customer reliability, reduced systems losses,
and balancing of substation loading -- are dependent on the ability to perform automatic
circuit reconfigurations. A prerequisite for implementing automatic circuit reconfiguration
is that the protection system design must operate properly for all configurations.
An integrated expert system for the protection system design of interconnected
distribution circuits has been developed using the DANE engineering workstation. The
expert system incorporates the basic requirements and guidelines as specified by IEEE for
protection system design. The expert system uses a relational database management
system, integrates system data, and provides a graphical user interface. The expert system
incorporates both procedural and declarative, or query, operating modes. Rules dealing with
the coordination, placement and selection of protective devices are presented that are used
to dynamically, incorporate expert knowledge into the knowledge base. The protection
system designer controls which rules are implemented in the design.
An example protection system design is presented using the integrated expert
system developed for DANE. The example problem consists of three interconnected

distribution circuits. Dynamic knowledge, created by the expert system from the rules and
system data, is used in the design. System data is presented pertaining to the circuits along
with the created dynamic knowledge. The implemented rules dealing with the coordination,
placement and selection of protective devices are presented, along with all associated
parameter values. The final protection system design and results are presented in a
research report.

_ ACKNOWLEDGMENTS
The completion of this research would not have been possible without the guidance,
assistance, and support of many people. I will always be indebted to my advisor Dr. Robert
Broadwater, more commonly referred to as Dr. 'Bob', for his help. I will always consider Dr.
'Bob' as a mentor and friend. I want to express my sincere thanks and appreciation to my
committee members, Dr. Saifur Rahman, Dr. Arun Phadke, Dr. Terry Herdman, and Dr.
Scott Midkiff. They have always been willing to forfeit their time to provide assistance
whenever it was ask of them.
During the course of this research, I have also relied on the knowledge and
experience of two distribution systems power engineers. Mr. Al Sargent, a senior engineer at
the Hot Springs Division of Arkansas Power and Light, has been invaluable with his timely
input and assistance. Mr. Robert Lee, a division management engineer for Pennsylvania
Power and Light in Allentown, Pennsylvania, provided guidance and expert knowledge
concerning the modeling and operations of protective devices. The advice and service offered
by Al and Bob was readily accepted by this novice engineer.
Words alone will never be able to express the thanks I owe my parents. Their endless
support and love have, and will always, be an inspiration to me. In this chaotic world in
which we live, I am reminded, almost daily, that I am truly blessed. I am thankful that God
provided me with such wonderful parents.
This research could not have been completed with the understanding support from
my dearest friend, Kathy and my two pals - Tasha and TaiPan. TaiPan was always there
during those the late night vigils and provided constant companionship. Kathy understood
that I needed to work late and that some things might not get done until tomorrow. The
completion of this research is largely attributable to the support of Kathy.
iv

TABLE OF CONTENTS
Chapter
1. Introduction 2.2... ccc ccc cece eee eee eee e eee ee eee nee eee e seen eee eneeeeees 1
1.1. General Design Process ........ cee cece cece cece e nee e nen e tees eeteeeeeeneee 4
1.2. Factors Influencing Protection System Design ................ cece cece cece cence eees 6
1.3. High Impedance Faults ....... 0... cece cece cee eee ence nent eee neeeeeeeeeees 7
1.4. Scope of Dissertation ....... 0. ccc cece cece etree eee eee ener teen nents eee ee eneeees 7
2. Background Terminology ........... cece ccc e eee ee eter nett teeter nee ee eens en eeeeeees 11
2.1. Device and Time Current CharacteristicS ....... 0... ccc cece e cece eet eee eetees 13
2.2. Abbreviations and Symbol Definitions ........... 0... cece ccc e ee ec cnet eee eeneeennes 16
3. Literature Review ......... ccc cece eee eee eee eee entre nett eens eee e tee eeeeeee 19
3.1. General Principles .......... cc cece cece cece eet eee n eee e eee e ee neee ee eeenees 19
3.1.1. Fault Analysis 0.0.00... ccc ccc ccc cece eee e ccc een e eee e eee t eee eeeeenaeees 20
3.1.2. Placement of Devices ........... cece ccc ee cece eee eee e eee eter e eee ne eens 21
3.1.3. Device Selection and Coordination ............. ccc ccc cece e cence eee neees 21
3.2. Computer Algorithms and Software ............ cece eee cece eee e cece neces areas 22
3.3. Expert System Applications .......... ccc cece cece eee e eee e nee eeneeeeseeeees 24
3.4. General Integrated Solutions ............ ccc cece cee ee eect eee teen ene e eens 26
4. The DANE Engineering Workstation ............ 0. cece cece cece reece eee e een ee cease 27
4.1, OvErVieW 22... ccc ccc cece ee eter ee teen ee eee teen etn seen tees ten ee eeeee 27
4,2. Data Sharing Between Functions .............. ccc cece eee cee ene ete e ee eeeeeeees 28
4.3. Relevant Engineering Functions ......... 0... cece cece erence renee eee e eee eee eens 30
4.3.1. System Data Input and Data Manipulation Using Pointers ............... 30

4.3.2. Fault Analysis ............ cece cece eect eect ene eet e eee e eee e nee eeeeeeeeees 34
4.3.3. Power Flow ...... ccc ccc cc cece ce cece eee e cece neces ee eneeseceecececes 40
4.3.4, Circuit Configurations ........... ccc cece eee ence eee e eee eeneneeenees Al
4.4, Testing of DANE Workstation Functions ............. 0. cece cece eee eee ten eeneees 44
4.5. Key Features Summary of Fault Analysis Function ............... cece cece eee eees 45
5. Modeling of the Protective Devices ......... ccc cece cece eee eee eee ene eee ee eeeeeeseaee 46
5.1. Introduction ........ 0. ccc ccc eee cee eee ee ee eee eee eee n eset ee tenn eeeees 46
5.2. Relational Database Model ............. ccc cece eect eee eee e eee e eee e er eeneeees 47
5.2.1. Key Issues Effecting Model Development ............. 0... cece eee eee ees 47
5.2.2. The DANE Relational Protective Device Model .................... 000 eee 50
5.3. Key Features Summary of Relational Protective Device Model ................... 56
6. Expert System Design ......... cece cece ec cece eee neon eee tenn renee e eee eeeeeeees 57
6.1. Introduction 2.0.6... cee cee eee eee een eee eee tent eeeeeeeeneees 57
6.2. Evaluation of Prolog Versus C/ESQL Language Platforms ...................605. 62
6.2.1. Evaluation Conclusions ............. cece cece eee eee cece cence teen eeeenes 64
6.3. Dynamic Data Creation ......... ccc ccc cece ener e ence eee eeeeneeeeseeeeeseees 66
6.4. Influencing Design Rules ........... cece cece cece cece eee ete e cece en eeeseeeesctees 67
6.4.1. Coordination Design Rules .............. cece cece eee eee cence eeeeeees 70
6.4.2. Placement Design Rules .......... 0... ccc cece eee cece cece e eee eeeeeeees 72
6.4.3. Selection Design Rules ....... 0... cece cece eee tee e ee eee eee e eee enone 76
6.5. Knowledge Base .......... cece cece cece erence ence eee eee ee eee seen eee eeeeeeees 80
6.6. Sharing Of Data Among Functions ........... 0... cece eee e cece eee eee e eee eeeeeeee 84
6.6.1. Accessing Part Objects Data ......... ccc eee eee c eee n teen eee eeeneees 84
6.6.2. Accessing Engineering Analysis Function Data ..............ceeeeeee wees 87
vi
6.7. Inference Engine ........... 0 cece eee ec e eee eeeeeen eee ee eee tenet e seen eee eeees 90
6.7.1. Coordination Rule Processor ......... cc cee ccc cc ce ce cee teen ceteeeeaees 90
6.7.2. Fuse and Recloser Coordination ............ 0. ese eee eee eee e eee e eee eeees 98
6.7.3. Placement Rule Processor ............ 0... cece ence cece eee e et eeeeeeeeees 100
6.7.4. Selection Rule Processor .......... 0. escent cere e cnet eees 106
6.8. Key Features Summary of the Expert System ............ 0. ccc c eee cence eeeee 114
7. Design Example Circuit And Results ......... cc ccc cece cece eee cece tee e cence enaeee 115
T.1. Introduction 2.2.2.0... 0. cece cece cece eee een cence eens ener tenes ee eeeaeenes 115
7.2. Background Circuit Information ............. ccc ccc eee ene cence eee eee eaeees 117
7.3. Protective Device Data And Coordination Table .................. cece cece eee eee 118
7.4, Placement Rule Processor Data ............. 0 cece e eee e eee entree cence enneeas 122
7.5. Selection Rule Processor .......... 0... cece cece eee e eee e eee ee eee eens nents eneees 128
7.6. ConclusionS 2.0... . ccc cece cece eee eee ee eee nent eee ene eee tener eee eee eeesees 134
8. Conclusions and Recommendations ........... ccc cece eee eect e eee renee eeerenees 136
8.1. Contributions 2.0... . ccc ccc eee eee ee eee eee eee e eee eee e eee ene een eens 136
8.2. Future Recommendations ............ 2. cece cece ee eee ee eee tee e nee e eens ee eeeees 138
References 2.0.0.0... ccc ccc cee eee ee eee ee eee eee eee ene e eee e eens eee een eeeee 139
vil
List of Figures
Figure 2.1. Fuse Time Current Characteristic Curve ............. ccc sc ee eee e eee ee ennes 15
Figure 4.1. Example of Part Objects in DANE ........... cece eee ccc eee eet eee eees 29
Figure 4.2, Example Circuit Schematic ........... 0... cece cece cece cence eee eteneeees 36
Figure 5.1.‘ Effects of Trip Coil Rating on a Recloser's TCC Curves .................06. 49
Figure 6.1. Creation of Circuit Data 2.0.0... 0... cece eee eee eee tenet ee eee eees 59
Figure 6.2. Protection System Design Functions ..............cececee cee ee eee e nena eees 60
Figure 6.3. | Created Data Flow and Interactions Among Functions .................... 61
Figure 6.4. Final Expert System Design ............ ccc ccc cece eee eee eee ee eee e ee eees 65
Figure 6.5. Dynamic Circuit Data Interface Using DANE ................. cece eee ees 68
Figure 6.6. Inference Engine Functions With Applied Design Rules ................... 69
Figure 6.7. Effects of Coordination Parameter
Value on Device Pair Coordination ............... 0. eee e eee cece aee 73
Figure 6.8.a. Three Component Tie-Line Section With SW1 Closed ..................0.. 81
Figure 6.8.b. Three Component Tie-Line Section With SW1 Opened .................... 81
Figure 6.9. Tree Structure of Information Stored in Relational Database .............. 83
Figure 6.10. Sharing of Data Among Engineering Analysis Objects .................0005 88
Figure 6.11. Inference Engine Rule Processors and Interfaces ..................0.000eee 91
Figure 6.12. Four Possible Cases for the Coordination of TCC Curves .................. 96
Figure 6.13. Primary Fuse and Backup Recloser Coordination ...............eeseeeeeee 99
Figure 6.14. Selection Rule Processor Flow Diagram ...............ccee seen cece eens 107
Figure 6.15. Example SQL Select Statement ........... ce cece cece eee e teen tenons 111
Figure 6.16. Example SQL Select Statement for PO_Flag Set to NO ................... 113
Figure 7.1. Three Interconnected Design Circuits ............... cece eee eee eee e ences 116
Figure 7.2. Placement Locations for Three Circuits ............... ccc cece eee eee ence 121
vill
Figure 7.3.
Figure 7.4.
Figure 7.5.
Figure 7.6.
Figure 7.7.
Figure 7.8.
Dynamic Knowledge Base for Selection Processor .................eeeeees 126
SQL Fuse - Fuse Select Statement ........... ccc ccc cece eee cette ences 127
SQL Recloser - Fuse "Phase" Select Statement ............... ccc ccc ee eee 130
SQL Recloser - Fuse "Ground Pickup" Select Statement .................. 131
SQL Backup Recloser - Recloser/Fuse Select Statement .................. 132
Final Protection System Design For The Circuits .....................0055 133

Table 2.1.
Table 2.2.
Table 4.1.
Table 4.2.
Table 4.3.
Table 5.1.
Table 5.2.
Table 5.3.
Table 5.4.
Table 6.1.
Table 6.2.
Table 6.3.
Table 6.4.
Table 6.5.
Table 6.6.
Table 6.7.
Table 7.1.
Table 7.2.
Table 7.3.
Table 7.4.
Table 7.5.
Table 7.6.
Table 7.7.
Table 7.8.
List of Tables
Symbol Definitions .......... 0c ccc cece cece eee e eee ee ee eee cence 17
Abbreviation Definitions .......... 0. ccc ccc cece cece tent ne ccceeeaeeeseeusees 18
Relevant Data in the Component
Data Structure to Fault Analysis ........... cece cece eee e eens 33
Type of Fault Conditions Considered by Fault Analysis ................... 39
Switching Configurations Patterns .......... 0... . ccc cece cece eect ete eeenes 42
Device Table 20... . ccc cece cece erence eee e nent ene eens eeeseereeeees 51
Curve Table ..... ccc ccc ccc cece eee teen eee eee e ne eeeeeeeeeeeeeenrs 52
Row Relationships Between Device and Curve Tables .................005: 55
Keys for Device and Curve Tables ........... ccc ccc cece nec ce eee eee eeeeaes 55
Coordination Rules 2.0.0... 0... ccc cece cee cece cee eee e ete etet ee eteeees 71
Placement Rules ......... 2 ccc ccc cece cece cece tee eeeeee eens ee eeeesees 75
Selection Rules .......... ccc cece cece eee eee eee e eee e en eeteeeeeteseenees 78
Chapter 6 Symbol Definitions ............ cece cece cece ccc t eee e eee eetees 86
Variables in Fault Analysis Objects ........ cc cece cece eee eee e ee eenes 89
Coordination Table 2.0... . ccc cece ccc eect eee e rene tect nee ne eeteeeeenes 93
Description of Protection Objects ....... cece cee ee eee e eee e teen eens 105
Chapter 7 Abbreviation Definitions ........... 2. c cece cece eee een eenees 119
Example Line Types Shown in Figure 7.1 ........... cc cece sec eee eeceees 119
Implemented Coordination Rules ............ cc cece ccc cette tee eeeeenenees 120
Switching Patterns for Circuits .......... 0. cece eee eee eee teen eeeees 124
Implemented Placement Rules ............ ccc ccc cc eect eee tent neee 124
Protection Objects for Circuit 1.1.0.0... cece cece eee eee rene eeeneee 125
Implemented Selection Rules ........... ccc cece cece eee eee eee eee nee es 129
Protective Devices Selected for Circuit 1 .......... cece cece eee eee nee 135

CHAPTER 1
Introduction
Electricity is supplied to a variety of customers via a complex network. The majority
of electricity is produced at large generation plants by various methods with the most
common methods being fossil, nuclear and hydro. These generation plants are centrally
located along major waterways and fuel sources. Electricity must be supplied from these
generation sites to customers by way of the electric network. The overall electric network is
generally viewed as two distinct operational systems.
A portion of the network transfers electricity from the generation sites to substations
that are dispersed locations in the network. This part of the electric network is commonly
referred to as the transmission operation level. The transmission level is characterized by
the two features of high voltage levels, from 135 KV up to 765 KV, and meshed, or looped,
circuits. The high voltage levels tend to reduce systems losses, and the meshed circuits
facilitate multiple paths to supply loading at substations.
From the dispersed substations the electrical system supplies electricity to the
customers. This portion of the network is commonly known as the distribution operation
level. Two distinct features of a distribution system are lower voltage levels, usually from
135 KV down to 4 KV, and radial circuits. Conductor sizes and safety concerns mandate
lower voltages at the distribution level. Distribution circuits are radial in nature which
implies no loops are present in the system. During operation only a single source at the
substation supplies all customers attached to a radial circuit. This radial structure of the
circuits is primarily due to the costs and load dynamics. The construction costs for radial
circuits are much cheaper than those for meshed circuits.
The reliability of supply to a customer is of major importance, since the industry is a
service oriented sector. Reliability is a qualitative measure of how efficient the utility is in

maintaining a constant power supplied to its customers. The electric power system network
in United States has been rated the most reliable worldwide [1].
The reliability of the power industry to supply electricity is due in large part to the
performance at the distribution level. Most end-use customers are supplied through local
distribution systems or utilities. These utilities are responsibility for maintaining a reliable
supply of electricity to its customers over its distribution circuits.
The reliability of any electrical power system is dependent largely on the proper
operation of its overcurrent protection system [2]. The proper operation of the protection
system is dependent upon its overall design [3]. For example, if a fuse blew every time a
temporary fault occurred on a line then customers would experience longer outages, and
reliability would be worse due to an improperly designed protection system. The planning
process involved in the protection system design ultimately determines how effectively the
protection system design responds and operates during periods of overcurrents on the
system.
The designers of overcurrent protection systems for electrical distribution circuits
confront numerous problems. These problems must be addressed if the design is to properly
function. Reference 4 notes this design process "is part science and part art." Numerous
decisions and tradeoffs exist in the process which leads to the artwork in the design. For an
electrical circuit, multiple protection system design schemes will exist that perform the
intended function.
The design of the protection system involves both the collection and analysis of
various data about the distribution circuits. Data from fault analysis, power flow, and
protective devices along with the circuit configurations of the distribution system must all be
collectively used in this design. Manuals on standard practices and approaches have been
written by both organizations and manufacturers that address the design process [1,5,6,7]. A

wide variety of workshops are conducted to assist and educate the protection system design
engineer. These workshops provide background notes, standard practices among utilities,
and typical device operational data to use as reference data by the engineer [4].
It is not uncommon, particularly among the smaller utilities, for a single person to be
solely responsible for designing protection systems. This type of situation produces human
experts in protection system design purely from their experience gained over the years. The
major disadvantage of this arrangement is when the human expert retires or leaves the
company.
The function of a protection system is to protect both the general public and the
electrical system equipment [8]. When faults occur on the electrical system, the protection
system must be able to take corrective actions. This prevents both damages to the electrical
equipment and human exposure to dangerous conditions. If overcurrent system faults are
not cleared, tremendous damage can be inflicted on the electrical equipment components of
the circuit, or worse human fatalities may result from contact with faulted circuit
components, such as fallen, energized conductors.
The majority of fault conditions are characterized by current flows on the circuit that
are significantly above the normal current flow due to system loading. Fault conditions are
caused by a wide array of factors. The vast majority of faults are temporary in nature such
as when high winds cause bare conductors to come into contact momentarily [8]. This
creates a transient fault condition that will correct itself when the conductors separate.
However, a fault current is generated from the temporary short circuit between the bare
conductors which must be corrected by the protection system.
During fault conditions, excessive current may flow through several protective
devices in the system. Upon sensing the overcurrent the affected devices will operate based
on their operating characteristics. Initially, the protection system should treat the fault as
temporary in nature. Therefore, the protection system should perform some automatic
circuit reclosing in an attempt to clear the fault.
If the fault persists and the automatic circuit reclosing operations do not clear the
fault, the situation is handled as a permanent fault. At this point, the closest protective
device to the fault location should operate to clear the fault before any other affected devices
perform permanent fault clearing operations. The closest protective device is defined here as
that protective device that is encountered first when going from the fault location back along
the circuit towards the substation.
A protection system is composed of strategically located protective devices throughout
the system of distribution circuits. The basic protective devices consist of breakers with
attached relays, automatic reclosers, sectionalizers, and fuses. Relay controlled breakers and
reclosers have automatic circuit reclosing capabilities. At the distribution substation, either
a breaker or recloser is used as the main circuit protection. Reclosers, sectionalizers, and
fuses are primarily utilized for protection out on the circuit. The basic intent of the
protection design scheme is for breaker controlled relays and reclosers to provide total system
coverage to clear all temporary faults, and only have fuses operate for permanent faults [1].
1.1 General Design Process
A general description is given for the steps in the design process. The fault currents
must be known for each component on the circuit. This mandates that some type of fault
analysis, or short circuit calculations, must be performed for the circuit under study. The
fault analysis considers various fault types such as 3-phase bolted, 3-phase-to-ground,
2-phase bolted, and 1-phase-to-ground faults. A set of maximum and minimum fault
currents is calculated that each circuit component could experience when considering all of
these different fault types.

Using the calculated fault currents, the designer must decide at which circuit
locations to place protective devices. The placement of devices is based on such
considerations as the type of devices available, circuit length, cost, and customer loading.
Some common rules of thumb are used in the placement of devices. The placement of
protective devices at the start of all lateral line sections and relay controlled breakers or
reclosers at the substation are both examples of common rules of thumb.
After determining placement of devices, the final step is the selection of coordinated
devices. Any device selected must meet required circuit specifications, such as device
voltage, load flow current, and fault current interrupting ratings. Simultaneously, any
selected device must be coordinated with all other relevant devices. Coordination implies
that only the closest upstream protective device should operate during any permanent fault
condition.
The coordination of the selected protective devices is typically performed using data
from Time Current Characteristic curves associated with the devices. This can be a
laborious, time-consuming process as numerous devices are checked against each other [9].
Some manufacturers supply tables showing device coordination among devices that they
produce to aid in this process. These tables give the device combinations and the range of
fault currents over which they coordinate together.
Often more protective devices may have to be placed on the circuit to achieve
coordination among devices. This addition of more protective devices may occur during the
planning stages or in later years. Over time as circuits expand, an upgrade of existing
protective devices will be necessary to maintain proper operation of the protection system due
to load growth on the circuit.
Unexpected load growth accounts for as much as 50 percent of improper protection
system operations [1]. This occurs because normal current flow to supply circuit loading

increases to the point that it equals the minimum fault current levels calculated in the
original design. Thus, the protection system mistakenly senses the new load current as an
overcurrent fault and performs clearing operations on the circuit. At this point the
protection system must be updated to handle the increased loading.
1.2 Factors Influencing Protection System Design
Utilities are implementing distribution automation features that among other things
strive to reduce system losses, to balance loading among substations and to decrease peak
loading conditions. The ability to perform reconfiguration of interconnected circuits in the
distribution system has been shown to achieve some of these results [10]. For interconnected
radial circuits the actual configuration of the system will affect the calculation of both fault
currents and load flows. A protection system designed for solely one configuration of the
distribution system becomes invalid when the system undergoes reconfiguration.
Customer reliability is improved when outaged customers are re-supplied by
alternative routes [11]. Reliability can be improved if the utility is able to perform automatic
reconfiguration of the distribution circuits following outages. However, a proper protection
system design is a prerequisite for being able to perform reconfiguration.
Another recent trend of concern for local utilities is cogeneration. Cogeneration is
broadly defined here as some industry that generates a surplus of electricity at its facility.
This energy surplus may be continuous or only for certain periods of time. By law the utility
must allow the cogeneration facility access to the distribution system to sell surplus power.
The problem is what affect the cogeneration has during faults on the distribution system [12].
The cogeneration source contributes to the induced fault current on the system. The
cogeneration source will amplify the magnitude of the fault current flowing by some factor.

1.3 High Impedance Faults
It should be stated at this stage that even the most rigorously developed protection
system will, unfortunately, not provide absolute protection for every type of fault on the
system. Human fatalities still occur from human contact with energized downed conductors.
Under certain conditions when electrical conductors break and fall to the earth the
impedance is such that the protection system is unable to detect the generated fault current.
This phenomenon is commonly referred to as high impedance faults. Because of the high
impedance, the induced fault current is significantly below the minimum fault detection level
of the protection system. Numerous research projects have been conducted to develop
strategies to overcome this problem, as evident from a recent IEEE tutorial [13]. The study
of high impedance faults is beyond the scope of this research.
1.4 Scope of Dissertation
As necessity for improvement in system operation demands the implementation of
distribution automation, design of the protection system becomes more involved. Several
goals of distribution automation -- improved customer reliability, reduced systems losses, and
balancing of substation loading -- are dependent on the ability to perform automatic circuit
reconfigurations. A prerequisite for implementing automatic circuit reconfiguration is that
the protection system design must operate properly for all configurations.
Before reconfiguration occurs on the system, the utility must be confident that the
protection system is adequate for the new circuit configurations. If the protection system has
been designed to function solely for a given configuration of the distribution system, the
protection system design becomes invalid whenever the configuration is changed for the
system. The implementation of circuit reconfiguration often causes the protection system to
operate incorrectly during faults. Thus, for interconnected circuits, multiple fault analysis

and power flow studies must be conducted that encompass all feasible configurations of the
system.
For interconnected radial circuits utilizing reconfiguration, certain line sections,
referred to as tie-lines, will experience bi-directional current flows. Fault analysis will need
to produce two sets of maximum and minimum fault currents for each such tie-line
component. One set of maximum and minimum fault currents will be for the forward
direction of current flow on the tie-line. Forward current flow is defined here as the current
flow direction on the tie-line during the normal] configuration of the circuit. The second set of
maximum and minimum fault currents will be when the current flow reverses from the
normal flow direction on the tie-line.
The design of the protection system for automated electrical distribution systems is
the backbone for both improved customer reliability and implementation of circuit
reconfiguration. An IEEE Committee Report concerning the design of protection systems
stresses the importance of an integrated approach to the solution [15]. Numerous software
packages exist that perform fault analysis for distribution circuits. Other software packages
have been developed for the computerized coordination of protective devices. However, the
majority of the software makes the designer responsible for interfacing data that is produced
by disjoint software algorithms. An example would be coordination software that calculates
the range of currents over which two devices coordinate, but is unable to utilize the
previously calculated circuit's fault currents in determining if the devices can be placed at
locations on the circuit.
The research work of Maghdan in protection system design was for distribution
system applications; Maghdan's work used a relational database system scheme for data
integration [16]. However, Maghdan's work did not address the critical issues of circuit

reconfigurations, or the impact of cogeneration during fault conditions on the distribution
system.
The goal of this research is to develop a totally integrated computer-aided approach to
protection system design for electrical distribution systems. The key elements in the new
approach are as follows:
(1) All of the pertinent data are both generated and stored for interconnected
radial distribution circuits utilizing reconfiguration.
(2) The issues of cogeneration sources in the system during faults are taken into
account.
(3) The methods for modeling and managing the data associated with protective
devices are addressed.
(4) The performance testing of the developmental expert system implementation
on interconnected distribution circuits.
An overview is presented for the remaining chapters. Chapter 2 provides a review of
common terminology in the area of protection system design. An example of a time current
characteristic curve for a protective device is given to graphically illustrate some of the
terminology. Additionally, tables of symbols and abbreviations are presented for later
reference purposes.
Chapter 3 is a review of previous works in the area of protection systems. As the
literature indicates, the area of protection system consists of many facets that includes
protective devices, fault studies and calculations, coordination studies, and computer
algorithms.
Chapter 4 pertains to the DANE workstation. The key components of the
workstation are presented which are critical to protection system design. In particular, a

discussion is presented concerning the Fault, Power Flow, and Circuit Configurations
analysis functions.
Chapter 5 deals with both the modeling and the management of the data associated
with protective devices. The relational model used for the protective devices is presented.
The modeling techniques developed are presented and an example is given which
demonstrates the data management realized when implementing the developed modeling
techniques.
Chapter 6 deals with the overall design of the developmental expert system. A
discussion about the expert system implementation is presented concerning the computer
language platform. The topics of and relationships between dynamic data creation, static
data, influencing rules, and rule processors are discussed concerning how each affects the
knowledge bases.
Chapter 7 provides a design example circuit pertaining to three interconnected
distribution circuits. This data was supplied by Arkansas Power and Light from its Hot
Springs Division in Arkansas. The expert rules associated with the Coordination, Placement,
and Selection Rule Processors are described, which were implemented in the design. The
results from the expert system design study are presented for the interconnected circuits.
The locations for which protective devices were selected are graphically shown in the
examples. The dynamically created protection object data is given that is utilized by the
Selection Rule Processor. Example SQL Select statements are given that were utilized by the
Selection Rule Processor, and the protective device data is presented regarding the selected
devices.
Chapter 8 gives the conclusions and recommendations concerning the developmental
expert system. The contributions are presented regarding this research along with
suggestions that could be undertaken in the future to improve the work.
10

CHAPTER 2
Background Terminology
Some basic terminology is commonly used concerning the overall performance and
operation of radial distribution protection systems. Some of the terminology concerns the
radial circuits. Terms such as downstream and upstream are used when referring to device
locations on a circuit. This terminology is used to identify device locations relevant to the
substation source. The relevance to the substation or voltage source is due to the design of
radial circuits. In general, upstream implies that the location is toward the substation while
downstream is toward the end of the circuit away from the substation.
Primary and backup terminology are related to protective devices and protection
zones. Unlike transmission level power systems, the zones of protection are not clearly
definable for distribution power systems. This is due mainly to the dynamics involved in the
expansion of the distribution circuit to supply new customer loading. The protective zones at
the distribution level are loosely defined by the placement of the protective devices on the
circuits during the design process. This device placement is based on common practice from
experience with a particular protective device type.
Devices provide protection coverage for specific zones, or regions, of the electrical
distribution circuit. The device that protects a particular zone is known as the Primary
protective device for that zone. The purpose of the Primary device is to protect all
components in the zone against permanent and temporary faults, unless the Primary device
is a fuse. For fuses all temporary faults should be handled by automatic circuit reclosing
devices [4]. This prevents unnecessary circuit outages due to blown fuses for temporary
faults.
When looking from the substation out into the distribution system, the Primary
device will have at least one Backup protection device; unless the Primary device is located at
11

the substation. One purpose of the Backup device is to provide protection should the Primary
Device fail to operate for a fault. All Backup devices associated with a given Primary device
must be selected such that they allow ample time for the Primary device to clear all faults
within its specific zone of protection. Additionally, the Backup device must serve as the
Primary device for its primary zone of coverage. Thus, a protective device must functionally
serve as both a Primary and Backup device, unless it is the last protective device on a lateral.
The last protective device on any lateral serves as only a Primary device.
The topics of Sensitivity and Selectivity define the ability of the protective devices to
detect faults on the circuit and operate to clear the faults. The operation of a protective
device in clearing permanent faults, for only those permanent faults within its primary
protection zone, refers to its Selectivity. A device's Selectivity must be such that for all
permanent faults within its protection zone the device operates to isolate the faulted zone.
The Sensitivity of a device concerns its ability to sense and to operate as a Backup device for
a fault when the Primary device has been given ample time to operate but fails to clear the
fault. Thus, a particular device must have Selectivity in clearing all faults within its primary
protection zone, yet not normally operate for faults in its backup protective zones. However,
its Sensitivity as a Backup device must be such that should any Primary device fail to
operate, then the Backup device must operate to clear any fault.
A key topic involved in protection system design deals with Coordination between
devices. Device Coordination is achieved when only the Primary Device operates for faults in
its zone of protection. Coordination between the Backup and Primary protective devices
must be achieved by proper selection of devices. The device selection criteria are based on
several factors. A primary factor in device selection is the anticipated levels of fault current
at a given protective device location. Protective devices are manufactured such that at a
given current the device operates within a specific time. Manufacturers typically supply
12
what are commonly known as the Time Current Characteristic curves describing the
operational characteristics of devices.
2.1 Device and Time Current Characteristics
Time Current Characteristic, or TCC, curves are used to describe the operational
characteristics of protective devices. TCC curves show the relationship for time versus
current of the protective device. Using the TCC curve the engineer can determine the time
necessary for a device to start operating or totally clear a given value of fault current.
Relays are used to control the operation of circuit breakers. Current Transformers
are the most widely used method of physically connecting the relays to the actual electrical
circuit. Relays are built to sense low current levels, between 5 and 100 amperes, and as such
require some type of transformer to step down the actual fault currents [14].
A variety of relay types such Inverse, Very Inverse and Differential relays are
available from manufacturers. These different relay types describe the operational
relationship of the TCC curve. Ifa given fault persists for enough time the relay will initiate
breaker operation. The relay sends a signal to the breaker causing the breaker to perform
the fault clearing operation.
A relay will have multiple Time Dial Settings associated with it. A single Time Dial
Setting must be chosen for the relay. In general, the Time Dial Setting linearly scales the
time axis on the TCC curve. Thus, as the relay's Time Dial Setting increases, the operational
time required for the relay also increases to clear a given value of fault amperes.
The TCC curve for a fuse involves two separate curves. When dealing with fuses, the
Melting / Pickup and Total Clearing curves are synonyms, for the lower and upper TCC
curves, respectively. The lower curve specifies the time required for the fuse to detect a
given value of current. This detection of overcurrent is more commonly referred to as the
13
fuse's pickup. When the fuse pickups on the fault current, it begins to melt which causes
damage to the fuse. Thus, the lower curve is often referred to as either the Melting or Pickup
Curve. Using the TCC data, the time that a temporary fault is allowed to persist before any
fuse damage occurs can be determined using the lower curve of the TCC. A typical fuse TCC
curve is shown in Figure 2.1.
The upper curve, or Total Clearing curve, for the fuse specifies the total time required
for the fuse to completely melt at a given value of current. Using the TCC data, a designer
can determine the time necessary for the fuse to completely clear for a permanent fault. This
is accomplished by taking the given fault current and using the Total Clearing curve of the
TCC to determine the time required for the fuse to melt.
In conjunction with automatic reclosers, the terms Instantaneous / Fast Trip and
Lockout / Delayed Trip curves are used for the lower and upper TCC curves, respectively.
Additionally, the total number of operations on the lower and upper curves is encountered in
the literature concerning automatic reclosers. The TCC curve for an automatic recloser also
involves two separate curves. Reclosers have a family of operational curves from which two
curves may be chosen for implementation. The utility has the option of setting which two
curves to implement. The arrangement of the hardware wiring configuration, internal to the
recloser, determines which two curves are utilized during fault operations. When the
recloser performs a fault induced operation the recloser remains open for brief time intervals.
The lower curve, or Fast Trip, is used to perform fast, or Instantaneous, operations
during faults. The lower curve is used to clear temporary faults. The upper curve, or
Delayed Trip, provides a longer operation time period to clear persistent, or longer duration,
temporary faults.
14

na 0M
oak,
—_h,
=
l pa?
a |
Ltitirt
ss il
Loi
o ok.
at
1 tLe
0.01 500 4000 1500 2000 2500
Figure 2.1. Fuse Time Current Characteristic Curve
_— 3000
15

The recloser also has a total number of operations sequence on each curve before it
eventually Lockouts, or remains open, for a fault. A typical number of operations sequence is
"2A - 2C." This implies that the recloser will operate twice on the lower curve, the "A" curve,
and twice on the upper curve, the "C" curve, before the recloser lockouts. A recloser lockout
occurs during permanent faults after cycling through its entire operating sequence on the
lower and upper curves.
Line sectionalizers do not have any TCC curves associated with them. They are used
in conjunction with automatic reclosers. Sectionalizers are switching devices that count the
number of recloser operations. They are preset to open prior to a recloser lockout operation.
This arrangement minimizes customer outages during faults.
2.2 Abbreviations and Symbol Definitions
This section presents definitions concerning symbols and abbreviations that are
commonly used throughout this report. Table 2.1 contains symbol definitions, and Table 2.2
contains abbreviation definitions. Note that special typeface is used to denote symbols which,
in general, have bold, italicized typeface. Abbreviations are given in all capital letters.
16

Table 2.1 Symbol Definitions
Symbol Definition of Symbol
Ci
Pi
Si
Curve_Offset,;
Device_Offset,
Sptr_Curve
Sptr_Device
pCmp
pFa
FAi
pPo
POi
SubVoltVary
ZtoG
A logic variable that represents coordination rulez, z = 1, 2,... .
A logic variable that represents placement rulez, z = 1, 2,... .
A logic variable that represents selection rule i, i = 1, 2,... .
A data structure member of the component object which is used in conjunction with the pointer to the Curve portion of the protective device Parts object. It is associated with each protective device component:,z:=1,2,3... .
A data structure member of the component object which is used in conjunction with the pointer to the Device portion of the protective device Parts object. It is associated with each protective device component 7,2=1,2,3... .
Starting pointer to an object of type protective curve that is also the first object in the linked list of objects of type protective curve.
Starting pointer to an object of type protective device that is also the first object in the linked list of objects of type protective device.
Pointer to a Component object.
A data structure member of the Component object that is a pointer
to a Fault Analysis Object, i.e. FAI, FA2,..., FA14.
Fault Analysis data objects that are attached to every component that is processed, z = 1, 2, ... 14.
A data structure member of the Component object that is a pointer
to a Placement Object, i.e. POI, PO2, ..., POS.
Placement Objects that contain data results from placement function and are attached to every component that is a protective device location ,i = 1, 2,... 8.
The percentage value, that is specified by the designer, by which the substation source voltage is varied by Fault Analysis.
The value for ground impedance, that is specified by the user which is typically set at 40 ohms, used by Fault Analysis.
17

Table 2.2. Abbreviation Definitions
Abbreviation Definition
CONF ID
DPIM
GRD
MAX
MIN
TCC
Configuration Index for the interconnected circuits
Driving Point Impedance matrix
Ground
Maximum
Minimum
Time Characteristic Curve
18
CHAPTER 3
Literature Review
A literature search has been conducted in areas related to the design of protection
systems. The literature has been grouped in the areas of General Principles, Computer
Algorithms and Software, Expert System Applications, and General Integrated Solutions.
3.1 General Principles
The general principles involved in protection system design are presented in
numerous manuals and texts. Standard practices have evolved from years of experience in
the design and operation of protection systems. These references broadly cover the entire
range of concepts and aspects behind protection system design. The work and cooperation
between numerous engineers and professionals from industry, academia, and manufacturers
have been responsible for the creation of a comprehensive knowledge base that presently
exists for protection system design engineers. A chronological listing of these references
follows with some brief discussion of their context.
In the 1950's the AIEE, a precursor of the modern day IEEE, produced two committee
reports dealing with the usage of protective devices and some coordination principles [5, 6].
The reports detailed survey results from various electric utilities across the United States
concerning common practices involving how they utilized and coordinated protective devices.
The reports also listed problems that the utilities were experiencing with their protection
system designs. Discussions and solutions for overcoming these problems were given in these
reports.
In the late 1950's and early 1960's two technical papers described the protection
system design practices of two utilities and their overall performance. Guenzel and Morris
related the operation of the protection system design at Texas Electric Service Company.
19
Guenzel and Morris linked the operation of the protection system to the reliability of
customer service [17]. Johnson and Meler described the protection system philosophies of
American Electric Power Company, AEP, which discussed the practices observed when
performing coordination between Breaker-Fuse, Recloser-Recloser, and Fuse-Fuse [18].
An IEEE Committee report in 1964 contained survey results from more than two
dozen responding utilities [7]. Protection problems and discussions concerning methods for
correcting these problems were presented in the report. The problem of blown fuses on
feeders for temporary faults was presented in the report. Of special note was the reported
problem of high impedance fault phenomena.
The common rules of thumb that presently exist for protection system design are
attributable to work performed in the 1950's - 1960's era. The cooperation among multiple
organizations during the time period lay the foundation for development of references that
consolidated extensive information about designing protection systems. These reference
sources provide proven techniques for overcoming a wide array of protection system
problems. The most comprehensive of these reference sources are [1, 4, 8, 19].
3.1.1 Fault Analysis
One of the first steps in the design process is calculation of anticipated fault current
levels. The classical method for calculation of fault currents is discussed by Gonen [14].
References [1] and [8] also give fault calculation examples using the classical approach. A
somewhat different approach is presented by Kersting [20]. The major difference is that
Kersting's approach uses actual system impedances and substation voltages to calculate the
fault currents; whereas the classical approach uses sequence impedances and substation
voltages to calculate the fault currents for the system.
The general purpose of the fault analysis study is to calculate fault currents due to
different types of conditions. An example would be the fault current produced by a 3-phase
20

bolted fault condition. For all different fault types considered a maximum and minimum
fault current value is calculated for each circuit component. These values of maximum and
minimum fault currents are utilized in conjunction with the operating characteristics of the
protective devices.
3.1.2 Placement of Devices
At some point the designer must decide which locations need protective devices. The
location of some protective devices is based on experience. To provide automatic reclosing
capabilities either a breaker or recloser device is placed at all substations. All branching
lateral line sections have fuses placed at their start. These two placement locations on the
circuit are noted in all general protection system design references.
The presence of transformers on the main circuit, such as auto-transformers and tap
changing types, creates havoc when performing device coordination. The problems of cold
load pickup and inrush current are inherent problems with transformers, especially during
restoration after circuit outages. Also, the type of transformer connection, such as wye-delta,
can produce larger than expected fault currents due to phase shifting of faults currents
passing through them [8]. These factors lead to the practice of effectively making all
transformers located on the main circuits a protection zone boundary. Therefore, all power
transformers on the main circuit typically have protective devices placed on both the
primary, or source, and secondary, or load, sides. References 21, 22, and 23 discuss the
merits and advantages of using current-limiting fuses with transformer applications.
3.1.3 Device Selection and Coordination
After calculating the fault currents for the circuit components and locating devices,
the next step is to select protective devices. The type of device selected is dependent on
various conditions such as the number of customers protected by the device, cost for the
21

device, and circuit location. Fuses are the most widely used type of protective device due in
large part to their cost and reliability [8]. For example, if the primary device's zone coverage
is entirely underground service then a fuse would be selected for the device location. The
reason is simple, underground circuits rarely experience temporary faults, and the cost of
fuses is minimal when compared to the cost of reclosers.
All selected protective devices must coordinate with existing devices. Various
approaches are utilized at this stage of the design process. Early protection system designers
relied exclusively on light tables and transparencies of Time Current Characteristics curves
for protective devices at this stage of the design. This manual coordination method is quite
tedious and prone to human error. Numerous rules of thumb are often used to assist and
speed up the process of device coordination [1]. The focus of most software applications
involves this area. For example, Arkansas Power and Light uses an internally produced
software package called PlotLog to check protective device coordination.
3.2 Computer Algorithms and Software
The computer as an aid to the process was quickly envisioned by protection system
design engineers. One of the pioneering applications utilizing the computer for device
coordination is presented by the paper of Albrecht et al. [24]. The paper shows how the
computer can be used to relieve the designer of numerous calculations and aid the process.
The approach is aimed at transmission relaying applications. A wide array of work and
associated articles concerning computer-aided relay coordination followed Albrecht's paper.
Program logic was implemented to allow interaction from the relay engineer in the approach
used by Gastineau et al. [25]. The interaction from the relay engineer as the expert kept the
program simple, and the size of the software manageable, for coordinating the relays. The
work of Schultz and Waters showed that computer coordination enhances operation of the
22
protection system [26]. The protection system performance improved when the relay
engineer was allowed to analyze the protection scheme more thoroughly with the aid of
computer generated calculations about different designs.
The work of Damborg and Ramaswami et al. in the area has included many facets
connected with the coordination of transmission system relays as evident from References 27,
28, 29, and 30. Although the primary focus of the work was transmission relay coordination,
the problems addressed are relevant to coordination of distribution devices. The problems of
many simple calculations, very large data sets that need formal data management and
algorithms that perform fault analysis and check coordination between devices are all
necessary to protection system design work for distribution circuits. The approach used
algorithms written in FORTRAN and relational database management to organize data.
Protection system design studies can require enormous amounts of data about the
system. Data organization and handling can become a severe problem. The problems with
the data handling of relay device setting files are presented by Zimering and Allen [31]. The
approach was to computerize the relay setting file into a database so that pertinent data
could be readily accessed by users.
Cauthen and McCannon provide information about using computer-aided protection
engineering referred to as the CAPE System [82]. The CAPE System was a joint venture
among a consortium of utilities in developing a protection engineering workstation
environment. The software incorporates a database for handling the TCC curves associated
with the protective devices. Additionally, the software performs fault calculations and
provides graphical displays concerning device coordination.
Langhans and Ronat developed a graphical computer system for coordinating
protective devices [9]. The system utilized the TCC curves of the devices to achieve
coordination. Brown and Parker also used the TCC curves of the devices for coordination
23

using a computer [83]. Brown and Parker modeled the TCC curves as piecewise linear
curves consisting of a maximum of 20 data points. They concluded that the equation
modeling of the TCC curves was not as practical or efficient as the piecewise linear curve
method. The application of equation curve fit modeling of TCC curves is outlined by
Smolleck [34]. The major advantage of this modeling approach is the computer disk storage
space savings.
The topic of evaluating or qualitative measuring the performance of a protection
system design has been suggested using a Figure of Merit by Juves, et al. [35]. The basic
intent is to objectively evaluate different protection system design schemes by assigning a
weighting factor or Figure of Merit to key operating features about the system. Some of
these key operating features involve clearing speed during faults and customers or
components effected during fault clearing operations. These key Figure of Merits serve as an
alternative method that numerically evaluates device coordination.
The approach of Juves et al. somewhat parallels an issue raised in the work of
Matulic and Lubkeman [2]. Matulic and Lubkeman addressed the problem of voltage flicker
which is caused by the instantaneous operations of reclosers during temporary faults. Some
customers were critical of system voltage flicker. Matulic and Lubkeman concluded that
voltage flicker could be used in determining the reliability of the protection system design.
In fact, some utilities have taken the instantaneous trip operations out of their reclosers on
the circuit due primarily to customer complaints over this issue.
3.3 Expert System Applications
Expert systems are a subset of what is commonly referred to as Artificial Intelligence
[386]. Expert systems can be programmed on a computer using knowledge from human
experts in a given subject area. The created expert system can then be copied onto other
24

computers and function without the assistance of the human experts. A human, on the other
hand, requires an extended time period to become an expert on a subject, such as human
experts in the area of protection system design.
An Expert System uses knowledge and rules to solve problems [87]. A typical
knowledge base is a database that stores information. The inference engine uses rules and
information to reach a conclusion about a problem [86]. Expert systems are increasingly
utilized to solve complex problems in the area of electrical distribution systems, as noted by
Kezunovic, et al. [88]. Kezunovic indicates that expert systems can easily be developed using
computer languages such as Lisp and Prolog, but their execution speed is inherently slower
than expert systems developed using C or FORTRAN. Hursch and Hursch explain that
expert systems can be implemented using the interface between SQL and the associated
relational database management system [89]. But, as Taylor and Lubkeman point out,
"Expert Systems are not a panacea for every type of problem" [40]. They stress that only
specific problems justify the effort and expense necessary to develop an expert system
application. Protection system design problems warrant an expert system application.
Human experts with valuable experience and knowledge are lost annually to retirement and
job transfers in the protection system design area.
Pacific Gas and Electric implemented an expert system for coordinating protective
devices [41]. Distribution engineers were interviewed to acquire knowledge for the expert
system database. The expert system has over 300 rules implemented and uses 14 knowledge
bases. The expert system software is used as a planning tool by design engineers.
A rule based coordination software system to evaluate protection schemes is
presented by Mendis et al. [42]. The system's coordination rules can be modified to reflect
the user's commonly implemented principles and practices. A library of TCC curves is
25

provided to the user to facilitate graphical device coordination. Common device coordination
such as Recloser - Fuse device coordination is checked by the software.
3.4 General Integrated Solutions
The protection system design requires analysis and access to enormous quantities of
data. In order to relieve the engineer of handling redundant data elements the design needs
to integrate various functions. This integration should transfer data output from one
function into another function as input data. The necessary software functions are outlined
that require an integrated solutions approach in the IEEE tutorial on protection system
design [15].
The key elements are a relational database management system and the ability of
algorithms to share data. The relational database stores circuit, protective device, and
analysis data. The management system is used to control] data flow. The sharing of relevant
data among algorithms promotes easier software development and faster design of the
protection system. The graphical display capability fosters friendly user interfaces and more
understandable interpretation of results. Maghdan's approach is highly integrated as noted
by references [16] and [43] and parallels the method outlined by IEEE. Maghdan
implemented rule based algorithms for placement of devices, building a table of coordinated
devices, and selection of coordinated devices based on the fault currents at circuit locations.
26

CHAPTER 4
The DANE Engineering Workstation
4.1. Overview
The goal of this chapter is to briefly review those DANE engineering functions that
are used in conjunction with protection system design work. The intent is not to completely
review the DANE engineering workstation. An in-depth overview of the DANE engineering
workstation is provided by References 44 and 45. Thus, only a brief review of the relevant
DANE engineering functions is presented in this research report.
The DANE workstation has been designed to study electrical power distribution
systems. The DANE workstation has been developed under the OS/2 operating system. C is
the standard software language in which all engineering functions are written for the DANE
workstation. The power of the C Language is derived from its data structures and pointers
[46]. DANE uses the pointers to efficiently manipulate the data in memory.
DANE uses a relational database management system for data storage. SQL,
Structured Query Language, statements are used in conjunction with relational database
management system. SQL statements facilitate relational database transactions [89]. SQL
statements may also be embedded inside software written in the C language forming what is
referred to as ESQL, or Embedded SQL, software.
DANE presently has engineering functions that, to name a few, perform fault
analysis, power flow calculations, circuit reconfigurations, reliability analysis and restoration
operations. DANE provides graphical input and output capabilities for both the software
developer and user. The user is able to graphically construct engineering schematics that
represent electrical distribution circuits. The user may graphically display output results
obtained from the DANE engineering functions.
27

4.2. Data Sharing Between Functions
In the DANE workstation each piece of distribution equipment, or part, is stored in
an appropriate database table. For example, all various transformer type parts are stored in
the Transformer table. Each row in the Transformer table row represents a distinct
transformer type; and the columns, that comprise a row, contain data describing the
transformer type. All of the parts associated with the distribution system collectively form
the Part objects of DANE. These Part objects are utilized by DANE when circuit schematics
are graphically constructed by the user.
When DANE is activated pertinent data, stored in numerous database tables, is
loaded into various data structures, that are created and reside in computer memory, i.e.
RAM. This process, of loading the data structures residing in the RAM, emulates an
in-memory database while DANE is running. These data structures are accessible and
shared by all software developers and functions in the DANE environment. It also greatly
enhances the execution speed of the software. The sharing of data also promotes faster
software development.
The sharing of data among functions is implemented via the linking of objects. An
object is a particular instance of a data structure that exists in memory, whereas a data
structure is a specification describing a set of related variables [48]. In other words, a data
structure is a template that is used to form an object at a location in computer memory.
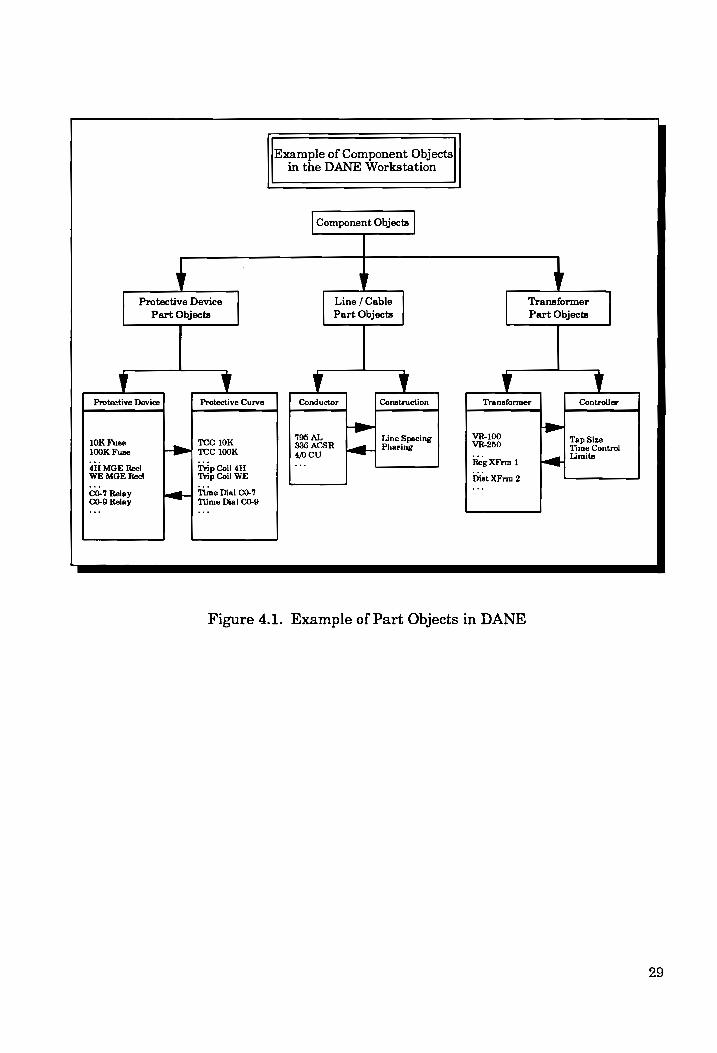
Component objects contain information common among distribution equipment and
are linked via pointers to Part objects [47]. A separate component object exists for each piece
of distribution equipment that is modeled in a circuit schematic. Thus, circuits are built in
computer memory with component objects. Examples of the different types of Part and
Component objects are shown in Figure 4.1. As illustrated in Figure 4.1, a Line / Cable
Component object is created from two Part objects, the Conductor and Construction Part
28
Example of Component Objects
in the DANE Workstation
Component Objects
r
Protective Device
Part Objects
— __Y
Y
Line / Cable
Part Objects
yy
y
Transformer
Part Objects
— _!
Protective Device Protective Curve Conductor Construction Transformer Controller
795 AL VR-100 Line Spacing Tap Size 10K Fuse TCC 10K 836 ACSR : VR-250 Pp
100K Fuse TCC 100K 40 CU peg Phasing . Time Control
4H MGE Rec! Trip Coil 4H a Reg XFrm 1 <a WE MGE Reel Trip Coil WE Dist XFrm 2
CO-7 Relay Time Dial CO-7 vee CO-9 Relay Tiime Dial CO-9
Figure 4.1. Example of Part Objects in DANE
29

objects. The Conductor Part objects contain information describing the properties associated
with the line and cable conductors, and the Construction Part objects contain information
regarding items such as the line spacing between conductors, the phasing of the conductors,
overhead or underground line construction, etc.
DANE manages the data associated with distribution circuit models. The circuit data
changes dynamically whenever the user makes graphical modifications to existing circuit
schematics. The software developer has access to the circuit data. Yet, the management of
the integrity of this data is the not the responsibility of the software developer. The
management approach DANE utilizes, regarding the data associated with the distribution
system, allows software developers to share common data among engineering functions [47].
4.3. Relevant Engineering Functions
This section presents an informative discussion concerning those engineering
functions that are critical to protection system design. During the design of a protection
system, data is required from several engineering functions. In particular, the data from
fault analysis, power flow, and circuit configurations must be obtained during the initial
phases of the design process. Thus, the key functions of fault analysis, power flow, and
circuit configurations are discussed regarding how they supply the necessary data to the
protection system designer.
4.3.1. System Data Input and Data Manipulation Using Pointers
The starting point for most protection system designs is the data from a fault analysis
study. At this juncture some background information is presented regarding the necessary
input system data required by the fault analysis function. The fault analysis function must
have access to the impedance data associated with each circuit component. Additionally, the
30

operating voltage level data of the substation supplying the circuit components must be
available to the fault analysis function.
In the DANE workstation, the majority of the input data for the fault analysis
function are contained in the Component object. Table 4.1 shows the relevant data elements
associated with a Component object that are utilized by the fault analysis function. Table 4.1
gives data elements and a brief definition concerning their usage by the fault analysis.
The Substation data structure contains data about the operating voltage level of
substations. Additionally the internal impedance data of the substations, as seen by feeder
circuits, is contained in the Substation data structure. Note that data contained in the
Substation data structure may be accessed by using pointer manipulation together with
associated data from the Component object. The procedure involves using the Offset data
from the Component object defined in Table 4.1 and, the starting pointer associated with the
Substation data structure.
The remainder of this section presents two examples that demonstrate how DANE
functions use pointers and data from Component objects to access data within other data
structures. The specific examples presented illustrate how functions in DANE use pointers
to manipulate data structures. One example shows how substation voltage levels are
determined, and the other example shows how breaker current ratings are obtained using
pointers.
The first example illustrates how to determine the operating voltages for a
substation, defined as SubVolts. Note that SubVolts is a 3-element array that represents
the per phase voltage at the substation. The data for all substations is stored in the
Substation Table. Each substation has a unique order number associated with it. The data
from the Substation Table is loaded into the Substation data structure when DANE is
activated. Additionally, a pointer to the start of the Substation data structure is set which is
31

defined here as SpirSub, that points to the starting location of the Substation data structure
in memory.
When a circuit schematic is built a substation must be selected to supply power for
the circuit. Upon selection, the only information concerning the substation that is stored in
the associated Component object is its unique order number. This unique order number is
stored as Offset in the Component object. Using Offset from the Component object together
with SptrSub, the correct substation can be located in the Substation data structure.
SubVolts can then be determined using the arrow operator, ->, to the Voltage data. The C
language code necessary to determine SubVolts is given as
SubVolts = (SptrSub + Offset ) -> Voltage . [4.1]
The last example shows how to determine the amperes rating for a breaker defined as
BrkAmps. Similar to the discussion presented in the first example, all the data associated
with breakers is stored in Breaker Table and loaded into a Breaker data structure. A
starting pointer is set to locate the start of the Breaker data structure, which is defined as
SptrBrk .
Using SptrBrk and Offset in the Component object, the value for BrkAmps is
determined using the arrow operator, ->, to the Amps Rating data. The C language code
required to find BrkAmps is given as
BrkAmps = (SptrBrk + Offset )-> Amps_Rating . [4.2]
As demonstrated by the discussion and examples presented in this section, the
strategic usage of pointers and Component object data enable DANE software functions to
readily access pertinent data.
32

Table 4.1. Relevant Data in the Component Data Structure to Fault Analysis
Variable Definition of Usage in Fault Analysis
CmpType
CxMZ
DPIM
ITap
MaxFaultTyp
Phases
Offset
TieFlow
Bptr
Fptr
FPptr
pCmp
identifies the type of component, such as line or capacitor, and is used to search the appropriate data structure.
contains the 3 by 3 complex matrix impedance representation for each component. This matrix is used in the calculation of the DPIM from the substation for each component.
represents the 3 by 3 complex Driving Point Impedance Matrix calculated for a component by the fault analysis function in DANE.
is an array of 3, that represents the value for a component's impedance reflection coefficient per phase. It is used to reflect the impedance from any location back to the substation. The value is determined by the ratio between the primary and secondary transformer windings that exists between a component and the substation. Note, that if no transformers exist on a circuit then all
components would have a value of 1.0 for each element in the ITap array.
indicates which fault condition produced the maximum fault current through a component; the value is set by Fault Analysis
during the calculations when considering the substation.
indicates the number of phases present and their arrangement for a component.
is the value that represents the offset in the appropriate data structure. The value corresponds to the row number in the part database table. For similar devices, such as capacitors, the row
number is unique in the database table.
indicates the direction of current flow through a component.
is a pointer from the active component to its Backward component in the circuit topology.
is a pointer from the active component to its Forward component in the circuit topology.
is a pointer from the active component to its Feeder Path component in the circuit. The Feeder Path is based upon the physical connections of the circuit. The Feeder Path component is defined here to be that component which supplies power, or is the feeder, for the active component.
is a pointer to a Component Object.
33

4.3.2. Fault Analysis
In general, fault analysis calculates anticipated fault current levels throughout the
distribution circuits involved in the study. A brief review is provided of the fault analysis
developed in conjunction with this research for the DANE workstation. The methodology
and approach used by the fault analysis developed for DANE in calculating fault currents is
similar to that described in the work of Kersting [20]. A major difference however is that
Kersting’s approach uses FORTRAN, while the fault analysis for DANE, uses C. However in
both methods, the general approach is to develop an impedance matrix that is used in
conjunction with the substation voltage level in determining the anticipated fault current
levels. Unless otherwise noted, all future references to fault analysis will imply the fault
analysis function developed for the DANE workstation.
The impedance matrix represents the impedance that exists from the substation
source to any component location on the circuit that is supplied by the substation. An
impedance matrix must be calculated for each circuit component. The impedance matrix
used in DANE is a 3-by-3 complex matrix. The impedance matrix calculated at a given
circuit component in effect determines, or drives, the fault current level, and is referred in
the remainder of this report as the DPIM, Driving Point Impedance Matrix.
To determine the DPIM of each circuit component the fault analysis function must
process the topology of the circuit using Component objects. The pointers in the Component
objects, that are described in Table 4.1, are used to analyze the topology of the circuit. The
process, of using pointers associated with component objects to analyze the topology of a
circuit, implements what is referred to as a circuit trace [47]. The type of pointer used
determines the nomenclature for the circuit trace.
34

For example, if the Feeder Path pointer is used to analyze the Component objects
associated with the circuit, then a Feeder Path circuit trace is implemented by the process.
The last component encountered in a Feeder Path circuit trace is always a substation
component. An example of Feeder Path circuit trace, FPCT, is given using the circuit
schematic shown in Figure 4.2. Note that the example presented is defined in shorthand
notation by referring to the component numbers of Figure 4.2. Using the circuit diagram
shown in Figure 4.2, a FPCT from component 12 back to the substation, or component 0,
would yield
{FPCT : 12} ={11, 9, 7,6,2,1,0} . [4.3]
Similarly, a Forward circuit trace, FCT, implemented from component 2 to the ending circuit
component, component 14, is given as
{FCT : 2} ={3, 4,5, 6, 7,8, 9,10, 11, 12, 18,14} . [4.4]
Fault analysis uses Forward and Feeder Path pointers to calculate the DPIM. All
circuit components are analyzed using a FCT. To determine each component's DPIM, the
impedance value for the component is added to the DPIM of its feeder path component
during the FCT. The impedance value of a component, referred to here as Zcomp, is
calculated as shown
Zcomp = (pCmp -> CxMZ ) * ( Ptr -> ITap ) [4.5]
where Zcomp is a 3-by-3 complex matrix, and the variables pCmp, CxMZ and ITap are
defined in Table 4.2.
35

Figure 4.2. Example Circuit Schematic
36

The DPIM of the feeder path component is determined using the Feeder Path pointer
for the component as shown
ZFPcomp = pCmp->FPptr -> DPIM [4.6]
where ZFPcomp is a 3-by-3 complex matrix.
The value of the component's DPIM is determined from the results obtained in [4.5]
and [4.6] as shown
DPIM = Zcomp + ZFPcomp . [4.7]
The calculations shown in Equations [4.5], [4.6] and [4.7] involve complex matrices; thus the
addition shown by [4.7] indicates complex matrix addition operations.
After determining the DPIM for all circuit components, fault analysis calculates the
induced faults currents basically using Ohm's Law, J = V/Z, as shown:
I, = [DPIM]* * SubVolts [4.8]
where J, is the array of calculated fault currents. SubVolts is the array of substation
voltage given by Equation 4.1 and, DPIM is defined by Equation 4.7. All of the quantities
shown in Equation 4.8 are complex values.
The FPptr of all substations is NULL and, the DPIM for a substation is equal to
CxMZ of the substation. However, the CxMZ for a substation component may be zero since
an impedance value for the substation is unknown. In this case, the DPIM for the substation
component would be zero, and fault analysis would not attempt any calculations and proceed
to the next component; but, if the DPIM of any component other than a substation is zero,
37
fault analysis halts execution and sends the user appropriate error messages. This prevents
software crashes due to division by zero errors in later fault current calculations.
Eleven different type of fault conditions are considered by fault analysis as shown in
Table 4.2. The number of phases and their arrangement, such as ABC or BC phases, is
determined for a component object using pointer access to the variable Phases. The value of
Phases determines which of the eleven types of fault conditions indicated in Table 4.2 need to
be analyzed. If, for instance, Phases indicates an A-Phase line section, then only one fault
condition is analyzed -- the A-phase ground fault. All eleven types of fault conditions are
evaluated only for 3-phase line components.
Some component types do not have fault calculations performed for them and are
skipped over by fault analysis. Fault calculations are only performed for line, cable,
transformer, cogenerator, and substation components in the circuit. When a component is
skipped, fault analysis sets the value of its fault currents equal to the value of its feeder path
component's fault currents. The type of component is determined using pointer access to the
variable CmpType, where the value indicates the type of component.
The calculated fault currents for a component are effected by two other global,
variable parameters. One is the voltage variance percentage at substation source, referred to
as SubVoltVary. The user is able to set the value for SubVoliVary. If the value of
SubVoltVary is non-zero, fault analysis will use the value to vary the substation voltage.
Thus, fault analysis essentially calculates fault currents for two substation operating
voltages, which are the maximum and minimum operating ranges. This feature permits the
user to model voltage variations at the substation.
The second global, variable parameter is the ground impedance , referred to as ZtoG,
and is typically set at 40 ohms. However, the user may specify a different value for this
parameter. The value of ZfoG is added to the diagonal elements of the component's DPIM
38

when considering line-to-ground type of faults. The value of ZtoG significantly affects the
calculated magnitude of fault current. As noted previously in Chapter 3 of this report, high
impedance faults are of special concern and occur when the value of impedance to ground, as
seen by a fallen energized conductor, is extremely large in magnitude; the value of ZtoG will
have a profound effect on the value of impedance to ground seen by a fallen line conductor.
As each component is being processed by fault analysis, a set of maximum and
minimum fault currents is developed for the component. Additionally, on all tie-line
components, the value of TieFlow is checked to determine current flow direction. If the
component is not a tie-line or the direction of current flow is normal, the set of maximum and
minimum fault currents developed is referred to as the FORWARD set; otherwise, the
direction of current flow is reversed, and the set is referred to as the REVERSE set. Thus,
two sets of maximum and minimum fault currents exist for tie-line components.
Table 4.2. Type of Fault Conditions Considered by Fault Analysis
Fault Type Description
ABC-Bolted Three Phase Bolted Fault
ABC-to-Ground Three Phase Fault to Ground
AB-Fault A Phase to B Phase Fault
AC-Fault A Phase to C Phase Fault
BC-Fault B Phase to C Phase Fault
A-to-Ground A Phase to Ground Fault, with ZtoG non-zero value
B-to-Ground B Phase to Ground Fault, with ZtoG non-zero value
C-to-Ground C Phase to Ground Fault, with ZtoG non-zero value
A-Fault A Phase Fault, with ZtoG zero value
B-Fault B Phase Fault, with ZtoG zero value
C-Fault C Phase Fault, with ZtoG zero value 39
During fault conditions, cogeneration sources contribute to the induced fault currents
on circuit components. If any cogeneration source exists, fault analysis calculates fault
currents for the circuit components due to the cogeneration source. For this case, the
cogeneration voltage source is the reference for the DPIM. The DPIM must be re-evaluated
based upon the circuit location of the cogeneration source. The procedure uses the existing
value of each component's DPIM that has been calculated previously when considering the
substation voltage source.
Only the fault condition, specified by MaxFaultTyp, is considered during the
calculation of fault current due to the cogeneration source. The calculated fault current
contributions are added to the existing maximum fault current values; this assumption is
based on the fact that most utilities do not allow cogeneration sources to remain online
whenever the substation is offline.
4.3.3. Power Flow
Data is also necessary concerning the power flow, or load current, on the circuits
involved in the protection system design study. The value of peak load current must be
taken into account by the protection system design. As Reference 1 indicates, the
predominant cause of improper protection system operation is due to load growth.
A load growth factor parameter is associated with every circuit object and is used to
compensate for future load growth of the circuit. The load growth factor parameter is used to
scale, or multiply, the value of peak load current. The scaled value of peak load current is
theoretically its maximum attainable value. Thus, the peak load current is never expected to
exceed this value during the lifetime for the given circuit construction.
Since a fault may occur during a peak load condition on the circuit, the value of peak
load current must be added to the maximum fault current level of the component objects.
40
The value for peak load current is also crucial concerning two other aspects of the protection
system design. First, the minimum pickup, of both the primary and backup protective
devices protecting a zone, must always be above the peak load current level threshold within
that protection zone. Second, if the peak load current exceeds the minimum fault current
level within a protection zone, a ground sensing device must be used to provide minimum
fault current level protection within that zone. The topic of ground sensing devices for
minimum protection, is more thoroughly examined and discussed later in Chapter 6 of this
report.
A detailed explanation about the power flow function developed for the DANE
workstation is provided by references [10], [50].
4.3.4. Circuit Configurations
To properly design the protection system for interconnected circuits, data must be
obtained concerning their circuit configurations. The different circuit configurations are due
to different switching configurations among the interconnected circuits involved in the study.
All the different circuit configurations must be analyzed during the initial phases of the
design. This analysis must include a fault analysis and power flow study for each
configuration of the interconnected circuits.
It is during this stage of the design that tie-line data is developed for the circuits. As
noted previously, tie-lines are those sections of the interconnected circuits that experience
bi-directional current flows which consist of both fault and load current flows. The
terminology of Forward and Reverse current flow is used to account for this bi-directional
current flow. Thus, tie-lines will have both a Forward and Reverse set of Maximum and
Minimum fault currents that they may experience.
41

From these two sets of Maximum and Minimum fault currents an Absolute set of
Maximum and Minimum fault currents are developed during the design. The Absolute
Maximum fault current is defined as the maximum value obtained when comparing the
Forward and Reverse Maximum. Similarly, the Absolute Minimum fault current is derived
from the Forward and Reverse Minimum fault currents. The Absolute - Maximum and
Minimum, Forward - Maximum and Minimum, and Reverse - Maximum and Minimum sets
of calculated fault currents are stored with every component object. This data is accessible
for other software applications.
In DANE, the circuit configurations may be developed by two methods. The first
method is to use the switching patterns developed by the reconfiguration function for the
interconnected circuits. These switching patterns simply depict which switches should be
opened and which switches should be closed thereby creating the configuration for the
interconnected circuits. The reconfiguration function determines both seasonal and daily
switching patterns [10].
Table 4.3. Switching Configurations Patterns
CONF_ID SW 117 SW 234 SW 354 SW 789 SW 857
-1 Closed Opened Opened Closed Opened
1 Closed Closed Opened Closed Closed
2 Opened Closed Closed Closed Opened
3 Opened Closed Closed Opened Closed
4 Closed Opened Closed Closed Closed
42
The second method uses the data existing in the Switching Configurations Table.
The Switching Configurations Table is an individual database table within the DANE
workstation. Table 4.3 shows a representation of the Switching Configurations Table with
typical data. The first column indicates the configuration number. All of the remaining
columns indicate the status of the switch, either opened or closed.
The first row of the Switching Configurations Table is used as a label by DANE to
manage the switches within the distribution system. For the example shown in Table 4.3 as
indicated in columns two through six of row one only five switches, i.e. SW117, SW234,
SW354, SW789, and SW857, exist in the system. For the example given in Table 4.3, four
switching configurations exist as denoted by rows two through five. For each of these
configurations the status of the switches is indicated in columns two through six. The first
column of the table, labeled CONF _ID, is used to identify the configuration. Note that for the
first row in Table 4.3, the CONF _ID is set to -1.
A CONF _ID of -1 indicates that this is the normal, or base, configuration for the
circuits. Note that when developing tie-line fault current data the base configuration is used
to determine the Forward fault current directional flow. When other circuit configurations
are analyzed, the direction of fault current flow on all tie-lines must be checked against the
direction established by the base configuration. The Reverse fault currents occur when the
directional fault current flow reverses from that of the Forward fault current.
Using DANE the switching patterns for a given configuration of interconnected
circuits may be developed and stored in the database for later reference. Using the data from
the Switching Configurations Table the protection system design study is able to analyze all
possible circuit configurations. This method is more attractive since it has a much faster
execution speed -- once the Switching Configurations Table is built analysis time by the
reconfiguration function is not required -- and it is possible to develop circuit configurations
43
that the reconfiguration function would not develop during its analysis. Thus, the
designer/user has the option of using either configuration data created by the reconfiguration
function or data from the Switching Configurations Table.
4.4, Testing of DANE Workstation Functions
Arkansas Power and Light has modeled over 100 distribution circuits at its Hot
Springs Division using the DANE workstation. Most of the relevant parts data concerning
the Hot Springs Division distribution circuits have been loaded into the DANE database.
The power flow and reconfiguration functions developed for DANE have been tested and
utilized by the engineering personnel at Hot Springs, Arkansas. Arkansas Power and Light
has used the results from DANE to perform seasonal reconfigurations of some of the
interconnected circuits at its Hot Springs Division.
As part of this research, data from fault analysis has been compared to data obtained
from the software developed in-house by Arkansas Power and Light called DFA (Distribution
Feeder Analysis). A comparison was made using the calculated fault currents from DANE
and DFA. This comparison included five distribution circuits from the Hot Springs division.
The comparison of the calculated fault currents from DFA against those from fault analysis
yielded results that indicated the values of fault currents from Fault Analysis were within
5% of those from DFA.

4.5. Key Features Summary of Fault Analysis Function
A summary of the keys features incorporated by the fault analysis function include
the following --
* Fault current calculations are performed in memory without any
database queries which enables the function to perform much faster
execution.
* Fault analysis is able to manage bi-directional fault current flows.
* Affects of cogeneration sources are considered by fault analysis
* Actual system impedances utilized to determine fault currents.
* The eleven different fault conditions that are described in Table 4.2.
are used in developing the ABSOLUTE, FORWARD and REVERSE
sets of Maximum and Minimum fault currents.
* The user is able to select and vary earth impedance value.
* The user is able to model variations of the substation voltage levels.
* Power flow results are incorporated in calculated fault currents.
* Multiple configurations of interconnected circuits are evaluated from
switching data that is either derived by the reconfiguration function
or from the switching configurations table.
* The fault analysis function developed for DANE is a dual purpose
function in that it may be accessed by other analysis functions or it
may be run as a stand alone analysis function.
45

CHAPTER 5
Relational Modeling of Protection Devices
5.1 Introduction
Protection systems are designed, primarily, using three type of protective devices,
namely fuses, reclosers and relays. There is, of course, auxiliary equipment used in
conjunction with some of these protective devices, such as current transformers with relays,
breakers with relays and sectionalizers with reclosers. But only fuses, reclosers and relays
have TCC curves associated with them. As noted in Chapter 2 TCC curves define the
operating characteristics of protective devices. However, additional data is required to
adequately model protective devices.
Since a protective device is an integral component of the circuit, it must be capable of
withstanding the operating conditions imposed by the circuit environment. A protective
device must operate at the circuit voltage level; it must be capable of interrupting the
maximum fault current within its protection zone, and if the protective device is a fuse or
recloser, the load current must flow through it without damaging the device or creating false
operations by the device. A protective device must be rated based on both circuit constraints
and anticipated fault currents. The costs associated with protective devices are based on
their withstand ratings. Obviously, for a given class of protective devices the costs increase
as the withstand ratings increase. Thus, it is necessary to consider more then merely the
TCC curves data associated with protective devices when designing a protection system.
Data pertaining to ratings and costs as well as TCC curves must be incorporated and
examined by the designer.
Most utilities have built-up a vast collection of protective device data that must be
maintained. Quite often utilities acquire and install protective devices from various
manufacturers. The eventual result is a diverse assortment of protective devices scattered
46

throughout the electrical system. While some of these protective devices may be
discontinued or replaced with improved device types, the utilities must nevertheless
maintain the data concerning those that are still in service. Most electric utilities have a
wide assortment of protective device data to manage.
To manage and maintain its protective device data, most utilities have implemented
some type of computerized data storage. The size of this data can be enormous and require
large amounts of computer storage. A main goal of the protective device model developed as
part of this research is to compact the data, thereby reducing its storage requirements. The
next section presents the methodology used in developing the protective device model.
5.2. Relational Database Model
DANE utilizes a relational database management system for data storage. Relational
databases tend to compact data and reduce the amount of storage space required on
computer hard-disk. However, hard-disk access to retrieve data stored in a relational
database can be time consuming for software applications [47]. Thus, it is necessary to
optimally compact the data required to model protective devices. This will facilitate the
loading of the protective device data into main memory when DANE is activated by the user.
The relational database model developed as part of this research incorporates the
pertinent data associated with protective devices. However, before the relational database
protective device model is presented, some of the key underlying issues that were considered
during the development of the model are presented.
5.2.1. Key Issues Effecting Model Development
The first issue deals with the modeling of the dissimilarities between the TCC curves
associated with the protective devices. Fuses have only one set of TCC curves that are used
in describing their operation, the Pickup and Clearing Curves. Reclosers have multiple TCC
A7
curves from which the designer may pick a set for the Fast Trip and Lockout/Delayed Trip
curves. Different recloser classes from a single manufacturer will have vastly different
possible combinations. For instance, a type "H" class recloser may have 4 possible
Fast-Lockout combinations; yet a type "WE" class recloser may have 20 possible
combinations. Relays have a family of TCC curves associated with them, but they operate
based upon a single TCC curve within this family. This single TCC curve is affected by the
time dial setting chosen for the relay. Research by engineers involved in protection system
design indicates that the time dial setting does not linearly scale the time portion of the TCC
curves associated with a relay. Furthermore, for a specific relay type multiple "Styles" will
exist, and each "Style" will have a different family of TCC curves associated with it. Thus,
the TCC curve of a relay is dependent on both its time dial setting and "Style."
Another issue to consider is the relationship between recloser trip coil ratings and
relay tap settings in regards to their effect on the TCC curves. The trip coil rating of a
recloser in effect linearly scales the amperes values of the TCC curves associated with it. A
specific recloser will have numerous possible trip coil ratings. As the recloser's trip coil
rating is increased so does the value for amperes, but the operational time value is
unaffected. Thus, the TCC curves are moved to the right along the amperes axis as
illustrated in Figure 5.1. Figure 5.1 shows this effect on a typical recloser's TCC curves; as
the trip coil rating is doubled the recloser's operational amperes value is doubled. This is
illustrated in Figure 5.1 which shows that A2 is double value of Al. As the value ofa relay's
tap setting is increased, the same effect is exhibited on its operational characteristic. The
relay's family of TCC curves are shifted right, increasing only its amperes value.
As demonstrated by these underlying issues, the method of modeling protective
devices is not straightforward, and various factors must be taken into consideration. While
all of the protective devices have TCC curves describing their operation only fuses have a
48

Tl
nao
mM
edueses
Suparensaceenesneannnen
TCC Curves For Trip Coil 1
A2 = Al * 2.0 Amperes
Figure 5.1. Effects of Trip Coil Rating on a Recloser's TCC Curves
49

single set. If all of the protective device data was stored in a single table, the size of the table
would be enormous due to the redundancy in the data. This approach is very inefficient and
unacceptable in the DANE environment.
5.2.2. The DANE Relational Protective Device Model
For this research, two relational database tables were implemented in DANE to
model protective devices. The method eliminates redundant data and compacts the data.
One table is referred to as the Curve Table and contains the TCC curves associated with a
protective device, and the other table is referred to as the Device Table and contains the
remaining pertinent data. Tables 5.1 and 5.2 present the variable names of the column data
and their associated definitions for the Device and Curve Tables, respectively. Data for
fuses, reclosers, and fuses are stored in each of these two tables. Storing all device types
together simplifies both database queries and the organization of data when it is loaded into
computer memory by DANE.
Splitting the data between the Device and Curve Tables significantly reduces the
data storage for reclosers and relays. Since recloser trip coil ratings and relay tap settings
only linearly scale the amperes values of their associated TCC curves as discussed
previously, the model exploits this assumption to compact the data. The model compacts the
data by storing all trip coil ratings or tap settings for a single recloser or relay, respectively,
in the Scale array as a single entry in the Device Table. For example, consider a recloser
with 12 trip coil ratings and 4 sets of operating TCC curves. If the data for the recloser was
stored in a single table it would require 48 entries, 4 x 12 entries, but using two tables it
requires 4 entries in the Curve Table and only a single entry in the Device Table. In the
case of a relay with 5 styles, 8 tap settings, and 11 time dial settings for the TCC curve, the
storage required in a single table would be 440 entries, 5 x 8x 11; yet split between two
50

‘Table 5.1. Device Table
Variable Definition of Column Contents
Code
Style
Device
Type
Family
Curve
Volt_Rating
Amps_Rating
Interrupt
Scale[j]
Cost
Maint_Cost
Failure
Repair
The user defined name for the protective device.
The user defined name for family of curves associated with a relay or recloser class.
A unique number associated with the device which is the row number of the device in the Device table.
Indicates whether the protective device is of type fuse, recloser, or relay and if it is a phase or ground type device.
A number associated with family of curves which applies to a relay or a recloser.
The number for the starting row in the Curve Table that contains all curves associated with a protective device.
The specified operational voltage range value for the protective device.
The continuous current rating value of the protective device, if it is a fuse or recloser.
The interrupting rating value of the protective device, if it is a fuse or recloser.
An array containing either the trip coil ratings for reclosers or the tap settings for relays: where Scale[j] = jth value in the array.
The purchase cost for the protective device.
The annual maintenance cost associated with the protective device.
The annual statistical failure rate for this type of protective device.
The average time required to either repair or replace a protective device of this type.
51

Variable
- Table 5.2. Curve Table
| Definition of Column Contents
Selector
Curve
Type
Family
Lower
Upper
CTIi, i)
The name used in the curve selection for a relay or recloser.
A unique number associated with the curve which is the row number of the curve in the Curve table.
Indicates whether the protective device is of type fuse, recloser, or relay and if it is a phase or ground type device.
A number associated with a family of curves which applies to relay or recloser.
The number of points stored for the first TCC curve in the CT array.
The number of points stored for the second TCC curve in the CT array.
Two dimensional array of points from the TCC curves: where CT[0, j]
= jth current value and CT[l1, j] = jth operation time value.
* For each element of the array, a separate column is implemented in the table.
52

tables the required storage is only 11 entries in Curve Table and 5 entries in the Device
Table.
The Curve and Device Tables are relational linked together using "Keys" in the
tables. The Device variable in Table 5.1 and the Curve variable in Table 5.2 are unique
keys [89]. These variables are vital to in-memory management of data. The Curve and
Family variables in the Device Table are foreign keys into the Curve Table.
In the Curve Table the array CT is used to store the TCC curves associated with a
device. Depending upon the type of protective device, the array CT that is stored in each
row of the Curve Table contains either one or two TCC curves. For fuses and reclosers two
curves are stored, whereas for relays only a single curve is stored. The Pickup and Clearing
curves are stored for fuses. The Fast Trip and Lockout/Delayed Trip curves are modeled for
reclosers.
The Faymily variable is applicable to both relays and reclosers. A given class of relay
may have multiple families of curves. A given recloser has multiple pairs of operating
curves. A unique integer is assigned to Family for each different family of curves that may
be associated with a relay. For a specific class of relay, Family may have several different
values, but, for a given recloser, Family has only a single value.
For fuses there is a one-to-one relationship between rows in the Device Table and
rows in the Curve Table. Only the fuse Code and Type are needed to uniquely specify a
fuse. Given a fuse Code and Type its corresponding Curve variable may be determined
from the Device Table. For fuses the Curve and Family variables are set equal. The
Family variable may then be used as a foreign key into the Curve Table to select the
Melting and Clearing curves for the fuse.
For reclosers, there is a one-to-many relationship between rows in the Device Table
and rows in the Curve Table. To select a specific recloser, the recloser Code, trip coil rating ,
53

and a pair of operating curves (i.e., AB, AC, etc.) must be specified. For a specific type
recloser such as "H", all of the trip coil ratings are stored in the Scale array variable.
With reclosers, the variables Code, Type, and Scale may be used as a unique group
key for the Device Table. Given a recloser Code and Scale, its corresponding Family value
may be obtained. Utilizing the Family value, all pairs of curves stored in the Curve Table
may be obtained that are associated with the given recloser. The Selector variable may then
be used to choose a particular pair of operating curves.
For relays, there is a many-to-many relationship between rows in the Device Table
and rows in the Curve Table. To select a specific relay the Code, Style, tap setting, and
time-dial setting must be specified. The relay Code selects a given class of relay. The Style
variable is unique for each different family of curves. The value for tap settings are stored in
the Scale array variable. The Selector variable specifies the time-dial setting.
With relays, the variables Code, Type, Scale, and Style may be used as a unique
group key for the Device Table. Given the Code, Scale, and Style for a relay, its
corresponding Family value may be determined from the Device Table. Having the Family
value, all curves stored in the Curve Table that are associated with the given relay Style
may be obtained. The Selector variable may then be used to specify a particular curve.
Tables 5.3 and 5.4 summarize information concerning row relationships and keys for
the Device and Curve Tables.
It should be noted that the Cost and Main_Cost data contained in the Device Table,
presented in Table 5.1, contain information that can be used for economic evaluations of
protective devices. The Failure and Repair data in the Device Table can be used when
considering circuit reliability and restoration functions.
54

Table 5.3. Row Relationships Between Device and Curve Tables
eee ee
Row Relationships Table
Fuses Reclosers Relays
Device One One Many
Curve One Many Many
Table 5.4. Keys for Device and Curve Tables
Keys for Rows and Devices Table
Row Key Fuse Key Recloser Key Relay Key
Device Device Code, Type Code, Type, Scale Code, Type, Scale, Style
Curve Curve Family Family, Selector Family, Selector
55

5.3. Key Features Summary of Relational Protective Device Model
The key features of the relational protective device model are summarized below --
* The model uses two database tables, the Curve and Device Tables, to
store the protective device data. Using relational links between these
tables the model is able to significantly reduce the amount of required
data storage.
* Since the protective device data is compacted it can be loaded into
computer memory by DANE, and no hard-disk accesses are required
to retrieve this data. Thus, software applications that utilize
protective devices execute faster.
* The protective device data storage is centralized and more manageable
in a relational database system.
* The writing of database queries is simplified for future work, as
illustrated later in Chapter 7 of this report.
56

CHAPTER 6
Expert System Design
6.1. Introduction
The stated objective of this research is an expert system implementation for
protection system design. Expert system applications are considered a subset of Artificial
Intelligence [86]. The goal of an expert system is to mimic human expertise in some
application. An expert system must be loaded with knowledge or information concerning the
subject area. This knowledge forms the knowledge base for the expert system. As more
knowledge becomes available it may be used to update and expand the knowledge base.
For a given problem the expert system searches its knowledge base to reach a
decision. The most prominent search methods are forward chaining, backward chaining, and
rule based searches. Typically, expert systems use a combination of search method
techniques [51].
The knowledge base information is usually stored in some form of lists. These lists
contain related information or data. The search methods process the information in the
relevant lists. Thus, the search does not examine all information in the knowledge base.
The search methods and information lists are often grouped together and referred to as the
Inference Engine of the expert system. A typical expert system should consist of knowledge
bases, search methods, and information lists. A programming language to implement an
expert system must facilitate these basic requirements.
In order to accomplish an integrated approach for protection system design, basic
data, or knowledge, must be used to create more knowledge. The basic knowledge is referred
as static data, and the created knowledge is referred to as dynamic data. Expert knowledge
is incorporated into the protection system design knowledge base via implemented rules.
57
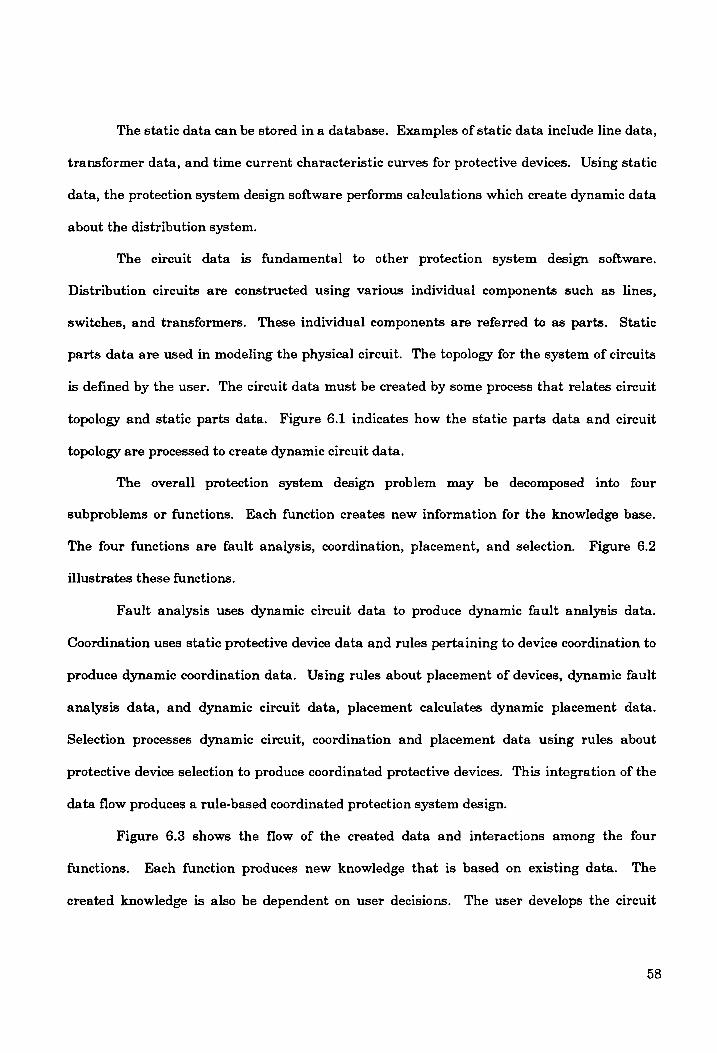
The static data can be stored in a database. Examples of static data include line data,
transformer data, and time current characteristic curves for protective devices. Using static
data, the protection system design software performs calculations which create dynamic data
about the distribution system.
The circuit data is fundamental to other protection system design software.
Distribution circuits are constructed using various individual components such as lines,
switches, and transformers. These individual components are referred to as parts. Static
parts data are used in modeling the physical circuit. The topology for the system of circuits
is defined by the user. The circuit data must be created by some process that relates circuit
topology and static parts data. Figure 6.1 indicates how the static parts data and circuit
topology are processed to create dynamic circuit data.
The overall protection system design problem may be decomposed into four
subproblems or functions. Each function creates new information for the knowledge base.
The four functions are fault analysis, coordination, placement, and selection. Figure 6.2
illustrates these functions.
Fault analysis uses dynamic circuit data to produce dynamic fault analysis data.
Coordination uses static protective device data and rules pertaining to device coordination to
produce dynamic coordination data. Using rules about placement of devices, dynamic fault
analysis data, and dynamic circuit data, placement calculates dynamic placement data.
Selection processes dynamic circuit, coordination and placement data using rules about
protective device selection to produce coordinated protective devices. This integration of the
data flow produces a rule-based coordinated protection system design.
Figure 6.3 shows the flow of the created data and interactions among the four
functions. Each function produces new knowledge that is based on existing data. The
created knowledge is also be dependent on user decisions. The user develops the circuit
58
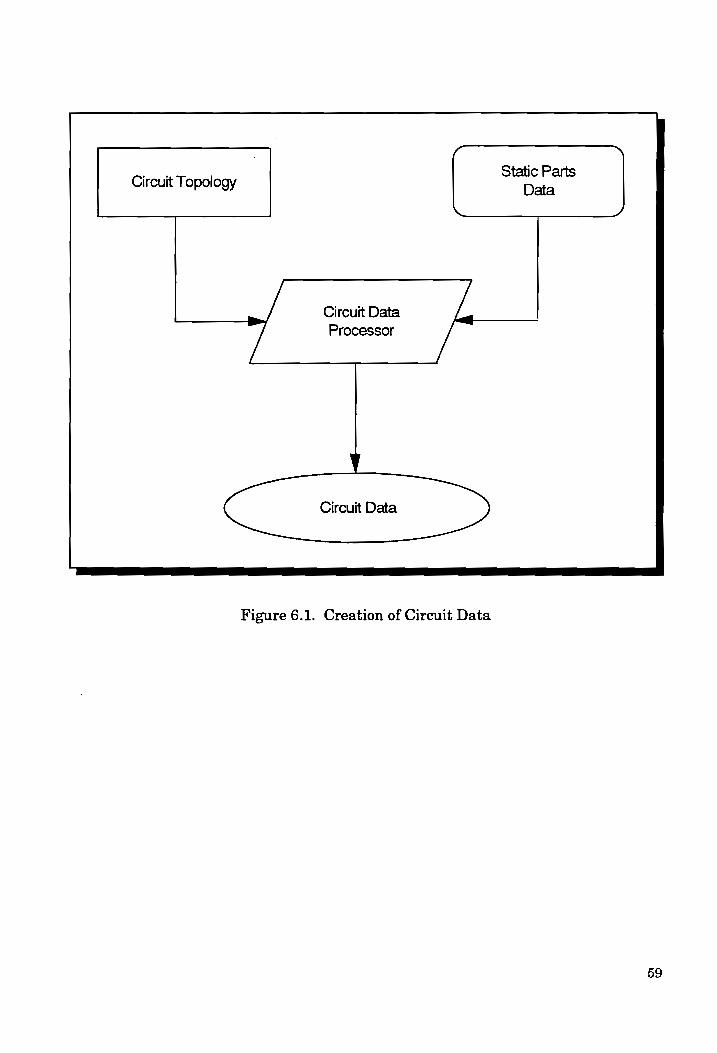
Circuit Topology
Static Parts
Data
Circuit Data
Processor
Figure 6.1. Creation of Circuit Data
59

Protection System Design
Functions
Fault Analysis Coordination
Placement Selection
Figure 6.2. Protection System Design Functions
60

C Greuit Data > User Protective Device pata |
Y Fault Analysis Rules Coordination
Fault Analysis Data
Placement << —_—__——_ Selection ——
!
Placement Data v
Protection System Design
Figure 6.3. Created Data Flow and Interactions Among Functions
61

model representations for the system of physical circuits. The user controls variable rules
that influence the coordination, placement, and selection functions. The protection system
design knowledge base consists of both static and dynamic data, where the dynamic data is
influenced by user decisions.
During the initial phases of this research alternative programming language
platform developments were considered for the expert system. The process evaluated two
routes for the development. One platform involved the Prolog environment, and the other
platform considered a combination of the C and Embedded Structure Query Language
(ESQL) languages. The evaluation process is presented in the next section.
6.2. Evaluation of Prolog Versus C/ESQL Language Platforms
Both Prolog and C/ESQL programming languages are capable of supporting expert
system development. However, the languages tend to be at opposite ends of the
programming language spectrum. Prolog is a declarative language that tells the computer
WHAT task to perform while C is a procedural language that tells the computer HOW to
perform the task [36].
A crucial factor in the implementation of an expert system is the application criteria.
The application of the expert system for this research involves protection system design for
electrical distribution systems. Therefore, the evaluation process encompasses aspects
pertaining to protection system design.
Three metrics considered during the evaluation of the suitability for a programming
language to implement the expert protection system design are as follows:
1) Knowledge Base Capabilities,
2) Search Methods, and
3) Information Lists.
62
The decision regarding which programming language platform to use for the implementation
is based on the evaluation of these three metrics.
Knowledge Base Evaluation: A relational database system is used in protection
system design for efficient storage and manipulation of data. Prolog supports relational
databases. C/ESQL also supports relational databases. However, the knowledge base for the
protection system design application is incomplete. As such the programming language
implementation must support arithmetic calculations to complete the knowledge base.
Prolog was not designed with the intent of supporting arithmetic calculations.
Inference Engine Evaluation: Search Methods and Information Lists are combined
and referred to as the Inference Engine. The combination of ESQL and C provides two
operating modes for the inference engine. Linked lists of data structures are formed using
pointers in C. The information in these data structures is processed, or searched, in order to
implement expert rule-based requirements. Pointers in C serve a dual function, the
formation of information in linked lists and also searching through the information in the
linked lists. C provides what is referred to here as a procedural operating mode for the
inference engine. The fault analysis, placement and coordination functions can be
implemented using a procedural type inference mode.
ESQL is a declarative language which, much like Prolog, tells the computer WHAT
task to perform. The declarative code necessary to perform a complex task is very simple.
ESQL can be used to implement rule-based expert systems [39]. By querying the database,
ESQL can retrieve data that satisfy rule requirements. The ESQL provide what is referred
to here as a declarative operating mode for the inference engine. The declarative inference
operating mode, using ESQL, can efficiently facilitate complex device selection logic.
63

Both Prolog and the combination of C/ESQL provide good inference engine support.
Prolog's declarative statements provide excellent inference engine capabilities that are easily
implemented, provided the knowledge base is complete.
6.2.1. Evaluation Conclusions
Expert systems applications with complete knowledge bases are implemented using
Prolog, but far more computer users are familiar with C [86]. The expert system application
for protection system design requires dynamic knowledge creation that is heavily dependent
on arithmetic calculations. These arithmetic calculations are more easily implemented using
C as opposed to using Prolog. The implementation of the arithmetic calculations for the
protection system design application is more complicated with Prolog then with C/ESQL.
The expert system implementation could use a combination of C and Prolog. The
arithmetic calculations could be handled by C coded functions, and the inference engine
could be coded using Prolog. However, the mixing of two programming languages is complex
and creates problems [36], and the problems created by mixing two programming languages
can be avoided in this research application. Using C/ESQL the inference engine can be
effectively implemented with two modes of operation. The execution speed of C/ESQL will be
faster than a Prolog version [38].
The evaluation of the three metrics - knowledge base, search methods and
information - for the protection system design application has demonstrated the difficulties
involved in using a Prolog expert system implementation. Thus, the final expert system for
protection system design has been implemented using C and ESQL.
Figure 6.4 shows the final expert system design using C/ESQL as the development
platform. Figure 6.4 depicts the static and dynamic data parts of the knowledge base.
Inference modes and rules use knowledge from the static data together with knowledge form
the dynamic data to create more dynamic data for the knowledge base. Inference modes use
64

Knowledge Base
Static Data
Parts Data
Protective Device Data
Dynamic Data
Circuit Data
Fault Analysis Data
Coordination Data
Placement Data
Inference Engine
Modes
y Rules
4
Protection System Design
Figure 6.4. Final Expert System Design
65

both C and ESQL capabilities. The C language uses lists of data structures, or information
lists, with pointers to created linked lists that functions may rely on to provide procedural
inference by pointer manipulation. The ESQL implements declarative inference using SQL
Select Statements. The rule-based expert system inference engine has two operating modes,
procedural and declarative. The procedural inference mode is used to create new knowledge
while the declarative inference mode is used on existing knowledge.
The remaining sections of this chapter present specific topics related to the functional
components that create the expert system for protection system design. The expert system is
implemented in the DANE workstation environment. DANE provides many key features
that are necessary for the expert system development. DANE provides a relational database
management system, manages complicated data and topological relationships using pointers,
and provides a graphical user interface (GUD).
6.3. amic Data Creation
The data associated with a system of interconnected distribution circuits can often be
overwhelming for the protection system design engineer. Vast quantities of data must be
manipulated and interchanged by the engineer. As noted previously in Chapter 4 of this
report, whenever the configuration for a system of interconnected circuits changes the values
from fault analysis will also change. Additionally, on tie-line components the flow of current
may reverse during changes in configurations.
The circuit data, as referred to in this report, includes both the configuration and
component types for a circuit For distribution circuits this data is rarely stable and more
often than not in a state of flux due to various factors -- such as circuit reconfigurations,
circuit expansion, or circuit construction modifications. Thus, circuit data is dynamic in
nature. The Circuit Data Processor shown in Figure 6.1 is implemented by the core of
DANE. The dynamic circuit data is managed for application users by DANE. As illustrated
66

in Figure 6.5, functions in DANE are provided access to circuit topology as well as access to
the parts data that is associated with the circuit components. This data is contained in
Component objects as discussed in Chapter 4 of this report. Workstation applications can
process circuit topology or utilize parts data in calculations using the available pointers
provided by DANE. These pointers are managed by DANE. The pointers which define the
topology are reset by DANE whenever the circuit configurations change. The pointers
associated with the type of component only change if a component is replaced in the circuit.
Fault analysis utilizes this feature in DANE during circuit reconfigurations to
determine tie-line data. For interconnected circuits this is a key feature -- the ability to
establish and determine the magnitudes of bi-directional fault current flows. The pertinent
data is integrated by fault analysis and used by other protection system design functions.
For example, the placement of protective devices by the Placement function is determined
from the fault analysis data and user implemented control rules.
The relationship between fault and load currents is another key issue during the
design of a protection system. If the load current flow through a component is greater than
the minimum fault current then a fuse type device cannot be used for protection at that
location. For each circuit configuration examined by fault analysis a load flow analysis is
also performed. This procedure is used to develop a maximum load current flow through a
circuit component based on all configurations that have been analyzed by the design study.
6.4. Influencing Design Rules
The developed rules that apply to the three functions for the expert system are
presented in this section. Protection system designers apply rules to the coordination,
placement, and selection of protective devices. Figure 6.6 shows those functions which have
rules that influence their decisions. As illustrated in Figure 6.6 the user controls the rules
67

Static Parts Circuit Topology USER Data
FUNCTIONS
Figure 6.5. Dynamic Circuit Data Interface Using DANE
68

Coordination
User
Rules
Placement
Selection
<a
----
;
Protection System
Design
Figure 6.6. Inference Engine Functions With Applied Design Rules
69

associated with these functions. ‘To determine whether or not a rule is to be considered, the
inference engine processes user defined logic variables, and any of the associated rules that
are described may be turned on or off by the user. Some of the rules also have associated
parameter values.
6.4.1. Coordination Design Rules
Basic design philosophy is that the protective device closest to a permanent fault
should operate to clear the fault before any upstream protective devices operate to clear the
fault and before any damage is inflicted on upstream devices. However, if the closest
protective device fails to clear the fault within a given time period, the next upstream device
should be capable of sensing and clearing the fault. The device closest to the fault is referred
to as the primary device, and the upstream device is referred to as the backup device. In a
case where the next upstream device cannot sense the minimum fault current, then a
recloser ground trip is used as backup protection.
Table 6.1 presents the rules for coordination in terms of the primary device curve, the
backup device curve, and the coordination parameter. The fault type is indicated with a "P"
for Permanent fault and a "M" for Momentary fault. An additional coordination rule that is
applied which does not appear in Table 6.1 is as follows:
Rule C13 = Devices are considered to coordinate only if the current range
over which they coordinate execeeds a user defined parameter.
Note that typical coordination parameter values are given in Table 6.1. The designer
sets the coordination parameter value associated with every rule that is implemented in
Table 6.1. The coordination parameter applies to the minimum time distance between the
primary and backup curves for the current range over which the curves coordinate. The
value of the coordination parameter effects both the range of fault amperes over which a
device pair coordinate and the number of device pairs that coordinate.
70

Table 6.1. Coordination Rules
[rue |Fut | | | 4 Label | Type Primary Curve Backup Curve Parameter
Cl P Fuse Clearing Fuse Melting 15%
C2 M Fuse Melting Fast Recloser Trip 75%
C3 Pp Fuse Clearing Delayed Recloser Trip 95%
C4 Pp Fuse Clearing Relay Trip 95%
C& P Delayed Recloser Trip Fuse Melting 715%
C6 M Fast Recloser Trip Fast Recloser Trip 95%
C7 Pp Delayed Recloser Trip Delayed Recloser Trip 60%
C8 P Delayed Recloser Trip Relay Trip 95%
cg P Relay Trip Fuse Melting 75%
C10 P Relay Trip Fast Recloser Trip 95%
Cil P Relay Trip Delayed Recloser Trip 90%
C12 Pp Relay Trip Relay Trip 90%
71

The intent of the coordination parameter is to provide some safety margin between
device pair coordination and also model the time delay of operations in certain devices. For
instance, note the typical coordination parameter given for rule C7 is 60%. The intent is to
model the time delay involved with delayed recloser trip curve operations.
The effects of varying the coordination parameter value is illustrated by the example
presented in Figure 6.7 which involves the coordination of two fuses as controlled by rule Cl.
Figure 6.7 graphically demonstrates the effects as the value of the coordination parameter is
changed from 80% to 60%. The range of fault amperes over which the two fuses coordinate
decreases from about 1025 to 350 amperes as the coordination parameter is decreased from
80% to 60%, respectively. If the parameter value associated with rule C13 was set at 400,
the two fuses would not be considered as coordinating, when the coordination parameter
value is set at 60% for rule C1. Thus, the value of the coordination parameter associated
with each implemented coordination rule has a profound impact device coordination.
The Coordination Rules are processed by the Coordination function of the Inference
Engine. The Coordination function processes the designer implemented Coordination Rules
and builds a table of coordinated primary and backup protective device pairs. The
Coordination Rule Processor is described in Section 6.7.1 of this report, during the discussion
of the Inference Engine.
6.4.2. Placement Design Rules
Placement design rules are used to establish protection zones on the system of
distribution circuits. At the distribution level, zones of protection are not easily identified by
any standard procedure. This is due in large part to the dynamics of the customer loading on
the system. The establishment of the protection zones is dependent almost exclusively to
designer decisions. In this research, the placement design rules reflect common practice
72

| Coordination Range For C1 = 80%
80% Backup Melting Coordination Range
For C1 = 60%
~~ c ° © ® T
Pe
60% Backup Melting
Primary Clearing
Figure 6.7. Effects of Coordination Parameter Value on Device Pair Coordination
73
among protection system design engineers in this decision making process. The placement
design rules implemented in this research in no way represent an inclusive set of common
practices among protection engineers. They do however represent some of the prevalent
rules concerning the placement of protective devices.
Table 6.2 presents the placement rules implemented by the expert system. In the
rule descriptions, terms used in Table 6.2 are defined as follows:
device zone = __ that portion of the circuit in which if a fault occurs the
device is the first line of defense .
tie-line a section of feeder in which the flow of current may
reverse due to switching operations.
The placement rules fall into two categories. For the first category, the rules are
inflexible and user specified parameters do not exist. Specific examples of this first category
are placement design rules P1, P2, and P3 as shown in Table 6.2. In the second category
user specified parameters exist which influence the placement of devices and consist of the
remaining placement rules P4, P5, P6, P7, and P8.
The application of placement rules may depend upon having results from
engineering analysis functions. If a rule needs data from an engineering analysis function,
then the function that is needed is indicated at the end of the rule description in Table 6.2.
All of the designer activated Placement Rules are processed by the Placement
function of the Inference Engine. The Placement function processes the Placement Rules to
evaluate circuit locations for the establishment of new protection zones. For such an
evaluation at a given location, the potential new zone will depend upon previous downstream
placements of devices. The Placement Rule processor is described in Section 6.7.2 of this
report, during the discussion of the Inference Engine.
74
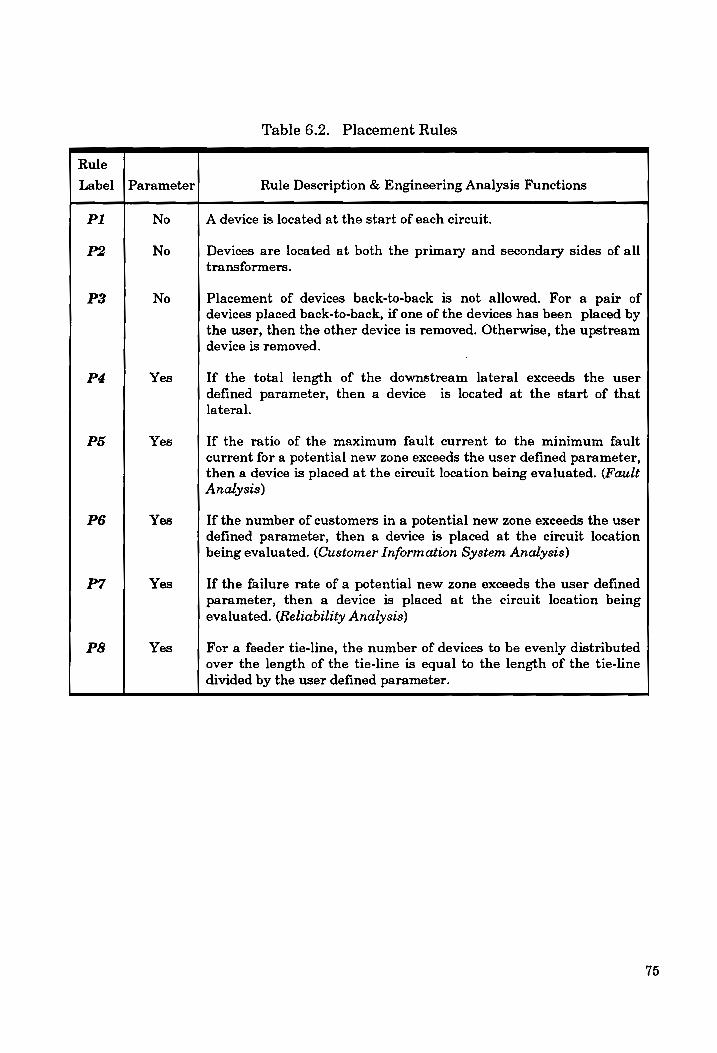
Rule
Label Parameter
Table 6.2. Placement Rules Lee eee ee eee eee eee ee
Rule Description & Engineering Analysis Functions
Pi
P2
P3
P4
P5
P6
P7
P8 Yes
Yes
Yes
Yes
Yes
A device is located at the start of each circuit.
Devices are located at both the primary and secondary sides of all transformers.
Placement of devices back-to-back is not allowed. For a pair of devices placed back-to-back, if one of the devices has been placed by the user, then the other device is removed. Otherwise, the upstream device is removed.
If the total length of the downstream lateral exceeds the user defined parameter, then a device is located at the start of that lateral.
If the ratio of the maximum fault current to the minimum fault current for a potential new zone exceeds the user defined parameter, then a device is placed at the circuit location being evaluated. (Fault Analysis)
If the number of customers in a potential new zone exceeds the user defined parameter, then a device is placed at the circuit location being evaluated. (Customer Information System Analysis)
If the failure rate of a potential new zone exceeds the user defined parameter, then a device is placed at the circuit location being evaluated. (Reliability Analysis)
For a feeder tie-line, the number of devices to be evenly distributed over the length of the tie-line is equal to the length of the tie-line divided by the user defined parameter.
75

6.4.3. Selection Design Rules
Once the location of protective devices have been specified, devices that will protect
and coordinate for all envisioned faults must be selected. Selection Design Rules are used to
control this decision making process. The Selection Design Rules implemented by the expert
system are based on standard procedures involved with protection system design. Table 6.3
presents the selection rules applied by the expert system. In the rule descriptions, terms
used in Table 6.3 are defined as follows:
pickup minimum fault current which a device will sense and
protect against.
device backup zone that portion of a circuit for which a protective device
is the second line of defense.
However, the implemented rules, presented in Table 6.3, are not intended to
represent any standardized set of operating guidelines or practices concerning the area of
protection system design. The purpose for most of the implemented Selection Design Rules is
quite obvious to a protection system design engineer. For instance, Selection Design Rule S2
indicates that any protective to be selected at a given location must be capable of operating at
the system voltage level at that location. The other more obvious Selection Design Rule is S7
which to summarize simply indicates that if a given device type will not coordinate then
attempt coordination using another device type until all device types have been examined.
The Selection Design Rules also fall into the same two categories as Placement
Design Rules, which are rules without parameters and rules with user specified parameters.
The Selection Design Rules without parameters, i.e. SI - S8, impose fundamental constraints
on those protective devices that are to be selected, and the constraints force the selected
76

protective device to meet certain basic requirements. The basic requirement are based on
data involved with the protection system design.
The remaining Selection Design Rules are intended to provide for some flexible and
design preferences during the selection process. For example, all utilities do not use a relay
controlled breaker at the start of the circuit in the substation; some prefer a recloser instead.
Rule S10 incorporates this knowledge with its implementation and provides the flexible to
allow the designer to make this choice. The other Selection Design Rules with parameters
allow the designer to provide for some safety margin in the design. The parameters are used
to scale certain values to insure that the protective device will operate properly. For example
Rule S12 permits the designer to multiple, or scale, the peak load current through a
protective device by the value of the parameter. This parameter is used to reflect a load
growth factor on the circuit. The scaling factor insures the designer that the selected device
will be able to operate without damage, as long as the load current does not exceed the
expected load growth factor specified by the parameter associated with Rule S12.
The application of selection rules may depend upon having results from engineering
analysis functions. For example, feeder tie-lines must be switched and analyzed for different
circuit configurations to insure proper tie-line protective device selection and operation. The
engineering analysis of the different circuit configurations are implemented using the
reconfiguration function [50]. If a rule needs data from an engineering analysis function,
then the function that is needed is indicated at the end of the rule description.
The activated Selection Design Rules are processed by the Selection function. The
Selection function is the final processing step in the design of the protection system and is
dependent on data from several sources and other functions. The Selection Rule processor is
described in Section 6.7.3 of this report, during the discussion of the Inference Engine.
77

Rule
Label Parameter
Table 6.3. Selection Rules
eee ee eee eee
Rule Description & Engineering Analysis Functions
S1
S2
S3
S4
S6
S7
S8
S9
S10
No
Yes
Yes
For a set of devices, which satisfies all constraints, the device is first
selected based upon having the smallest continuous current rating and then is selected based upon being the fastest operating device. An exception to this rule occurs when a device is being selected at the end ofa branch. In this situation the device DOES NOT serve as backup for any other protective device. The device, which is typically a fuse, is selected as LARGE as possible to detect the minimum fault current in its protection zone.
The voltage rating of the circuit must fall within the operating voltage range for the protective device.
Unless at the start of a circuit or if there are downstream fuses, then
reclosers are selected at three-phase locations.
The pickup of a device must be less than the minimum of the primary and backup zone fault currents. For a tie-line, this rule applies to both directions. (Fault and Reconfiguration Analysis)
The pickup of a device must be less than the minimum of the equipment damage curves over the actual fault current range. Fora tie-line, this rule applies to both directions. (Equipment Rating and Reconfiguration Analysis)
The fast trip curve of the first recloser selected must coordinate to the end of the circuit.
If a fuse is being selected and coordination fails, then select a
recloser; if coordination fails using recloser selection, then select a
relay.
Use a ground trip if coordination cannot be achieved for minimum downstream currents, and also when the user defined parameter for S9 times peak load current exceeds minimum fault current .
The pickup of a device must be greater than the user defined parameter times cold load inrush or peak load current at the given circuit location. For a tie-line, this rule applies to both directions.
(Power Flow and Reconfiguration Analysis)
Depending upon the user defined parameter, either a relay or a recloser is selected at the start of the circuit.
78

Label Parameter
Table 6.3. (cont'd) Selection Rules
Rule
Rule Description & Engineering Analysis Functions
S11
S12
S13
Yes
Yes
Yes
If a relay or recloser does not need to be selected, then select a fuse until the number of fuses in series in a feeder path trace[47] exceeds
the user defined parameter, then select a recloser.
The continuous current rating of a device must be equal to the user defined parameter times the peak load current at the given circuit location. For a tie-line, this rule applies to both directions. (Power
Flow and Reconfiguration Analysis)
The interrupting rating of the device must be greater than or equal to the user defined parameter times the sum of the maximum primary zone fault current and the peak load current. For a tie-line, this rule applies to both directions. (Power Flow, Fault, and Reconfiguration Analysis)
79

6.5. Knowledge Base
The knowledge base contains both the data and protection system rules that can be
implemented by the designer as shown in Figure 6.4. A large portion of the knowledge base
for the expert system is contained within the relational database of DANE. One type of data
contained in the knowledge base is referred to as Static data. The Static data consists of the
Parts data and Protective Device data. The Parts data represent tables that contain
information about equipment that is used to build distribution circuits such as line
conductors, transformers, and switches. The Device and Curve tables discussed in Chapter 4
are examples of Protective Device Data. All of the Static data is stored in relational
database tables. The most distinguishable feature regarding the Static data is its relative
stability.
The other data type contained in the knowledge base is referred to as Dynamic data.
The reference to Dynamic data is attributably to the characteristic of this data type to change
based upon information from other sources. Dynamic data in most instances is derived from
Parts data, but the most critical factor in the determination of the dynamic data is due to the
influence of other controlling factors. For example consider two cases involving a tie-line
section of circuit that consists of three parts: a line conductor, a switch and another line
conductor. For case one presented in Figure 6.8.a, the configuration of the circuit is such
that all of the tie-line components are fed by a single substation. In Figure 6.8.b the switch,
SW 1, is opened, and the tie-line component of Line 2 is fed from another substation. The
data results from Fault Analysis will be vastly different between the two cases illustrated in
Figures 6.8.a and 6.8.b. The most obvious being that the current flow has reversed on Line 2
after SW I is opened in Figure 6.8.b. For the example given the Static data remains fixed;
yet the impact of information regarding the circuit configuration has a profound impact on
the fault analysis data.
80

SW 1 Line 1 i _ Line 2
Figure 6.8.a. Three Component Tie-Line Section With SW1 Closed
Line 1 4 Line 2
Figure 6.8.b. Three Component Tie-Line Section With SW1 Opened
81
Dynamic data consists of circuit configuration data, GUI input data for the inference
engine, and data created by the inference engine. Figure 6.9 presents a tree structure of
information stored in the knowledge base of the relational database.
Circuit configuration data is stored in the switching configuration table of the
database. Two methods are available to create circuit configuration data. One method
allows the designer to arbitrarily specify the switching patterns of the interconnected circuits
that are to be considered during the design of the protection system. The second method
allows a reconfiguration function to specifies the switching configurations of the
interconnected circuits, that are derived from improved efficiency among various loading
conditions [50]. Each configuration of circuits, that is based on the switching configurations
table, must be considered by the integrated protection design system. An example of a
typical switching configurations patterns is given by Table 4.3.
The GUI interface is used to build, modify, and store circuit data. The GUI input
data for the inference engine consists of engineering analysis parameters, rule parameters,
circuit data, and rules to apply. The engineering analysis parameters affect the results of
the engineering functions that provide data used by the placement and selection processes.
Such parameters include load growth assumptions that affect power flow results and
impedance values to be used for non-bolted fault calculations, i.e. ZfoG as defined in Chapter
4, Section 4.3.2. The rule parameters associated with the coordination, placement, and
selection rule processors are given in Section 6.3. The designer utilizes the GUI to store
decisions concerning which rules are to be applied by the inference engine. The discussion of
the inference engine functions is presented in Section 6.7.
82

Relational Database
1. 1
1
wat GUI Input Data Parts Circuit Data Configurations Data for Created By
Inference Inference
Engine Engine
Protective Equipment Coordination Device Data Data Data
Engineering Circuit Rule Rules Analysis Data Parameters to Parameters Apply
Figure 6.9. Tree Structure of Information Stored in Relational Database
83

6.6. Sharing Of Data Among Functions
Data is shared among functions using objects. Two types of shared objects are Part
and Analysis objects which are linked to a Component object via pointers. Data within the
Part and Analysis objects is accessed using the appropriate pointer contained in the
Component object.
The most common type of object is the Part object. An example of a Part object is a
protective device. The data associated with a protective device is contained in two separate
Part objects that are linked via pointers to a component object. The pointers contained in
these protective device component objects are used to access the required data.
The other type of object is an Analysis object. Analysis objects are created by
functions and attached to component objects using data from Part objects. For instance, the
fault analysis function relies on Part objects to create a data object of results that is linked to
every component that is processed. The Placement function utilizes Fault Analysis objects
and Part objects to create Placement objects. Thus, Analysis objects are created using both
Part and existing Analysis objects.
6.6.1 Accessing Part Objects Data
A data structure defined according to the columns of the Device Table is used to
create a Part object in memory of type protective device. The entire Device Table is
implemented in memory as a linked list of type protective device Part objects. The linked list
is ordered according to Device number. Similarly, the Curve Table is also implemented in
memory as a linked list of type protective curve Part objects, and ordered according to Curve
number.
84

If a component is a protective device then it will two Part objects, which are the
Device and Curve objects, attached to the Component object that is defined as pCmp. Device
and Curve objects are attached to a Component object using the value of the Device_Offset
and Curve_Offset from the Device and Curve tables, respectively. Specific Device and Curve
objects stored in pCmp can be accessed using pointer operations to this information as shown
by
Device [6.1] pCmp->Device_Offset;
pCmp->Curve_Offset; Curve [6.2]
where C language notation “->" is used for the member access operator for protective
device z and Table 6.4 contains definitions for the symbols.
The device Part object contains information such as the interrupting rating for a
device. To obtain the interrupting rating for a device, the starting pointer to the device part
object, Sptr_Device, is used in conjunction with the device number, Device_offset, stored in
the Component object, pCmp. The protective device interrupting rating, interrupt, is
obtained by
(Sptr_Device + (pCmp->Device_Offset; ))->interrupt . [6.3]
Similarly, the ijth point of the time current characteristic curve, CT/i, j/, for the device may
be obtained by
(Sptr_Curve + (pCmp->Curve_Offset, ))->CTfi, j] . [6.4]
85

Table 6.4. Chapter 6 Symbol Definitions
Device_Offset,
Sptr_Curve
Sptr_Device
pCmp
pFa
FAi
PpPo
POi
Symbol Definition of Symbol
Ci A logic variable that represents coordination rule z, z = 1, 2,... .
Pi A logic variable that represents placement rule J, i = 1, 2,... .
Si A logic variable that represents selection rule 2, i = 1, 2,... .
L Logic flag used during the evaluation of designer implemented rules.
Curve_Offset, A data structure member of the component object which is used in conjunction with the pointer to the Curve portion of the protective device Parts object. It is associated with each protective device component ,z=1,2,3... .
A data structure member of the component object which is used in conjunction with the pointer to the Device portion of the protective device Parts object. It is associated with each protective device component z,z2=1,2,3... .
Starting pointer to an object of type protective curve that is also the first object in the linked list of objects of type protective curve.
Starting pointer to an object of type protective device that is also the first object in the linked list of objects of type protective device.
Pointer to a Component object.
A data structure member of the Component object that is a pointer
to a Fault Analysis Object, ie. FAI, FA2,..., FA14.
Fault Analysis Objects that contains results from fault analysis and are attached to every component that is processed, i = 1, 2, ... 14.
A data structure member of the Component object that is a pointer to a Placement Object, i.e. POI, PO2, ..., POS8.
Placement Objects that contain data results from placement function and are attached to every component that is a protective
device location ,i = 1, 2,... 8.
A data structure member of the Component object that is a pointer to a Reliability Object that is defined as RA.
Reliability Object that contain data results from reliability analysis and are attached to Component Objects.
86

6.6.2 Accessing Engineering Analysis Function Data
As indicated in Section 6.3, the application of placement and selection rules depends
upon interfaces to engineering analysis functions. Similar to the linking of Parts data to
components, engineering analysis objects are linked to component objects for which they
apply. Figure 6.10 illustrates the links between engineering analysis objects and the
component object to which they apply. Not every component object has a link to every type of
analysis object. For instance, capacitors objects are linked to the power flow analysis, but
they are not linked to the fault analysis. The sharing of data among the different
engineering functions is implemented through the links to the common component object.
Every component object of type line section is linked to a fault analysis object. Table
6.5 illustrates example information stored in a fault analysis object. Al] configurations are
considered in deriving the information shown in Table 6.5. If pCmp points to a component
object of type line section. Then, after fault analysis has run, the absolute maximum phase
fault current associated with a component object pCmp may be obtained by
pCmp->pFa->FA13 . [6.5]
In an interconnected system of radial distribution circuits, the position of the
switches within the system determines its configuration at any given time. The
Configuration object shown in Figure 6.10 is attached to component objects of type switch.
The Configuration object stores the switch position for each configuration to be considered by
the analysis. If the switching data presented in Table 4.3 represents all the switches in an
interconnected system of radial circuits, five Configuration objects exist for the system, i.e.
SW 117, SW 234, SW 354, SW 789, and SW 857; and each Configuration object will contain
the switch position for five configurations that represent five distinct time points as defined
by CONF _ID of-1, 1, 2, 3, and 4.
87
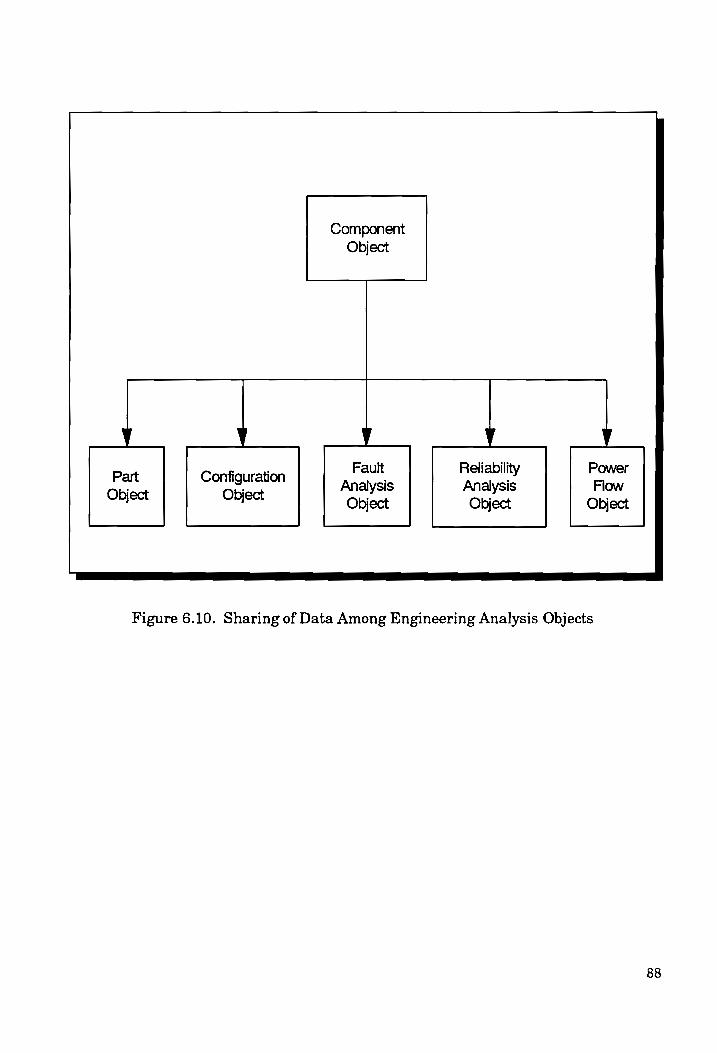
Component
Object
y
Part Configuration AL ault eee Power
Object Object alysis alysis Flow Object Object Object
Figure 6.10. Sharing of Data Among Engineering Analysis Objects
88

Table 6.5. . Variables in Fault Analysis Objects
Variable Description of Variable
FAI
FA2
FA3
FA4
FA5
FA6
FA7
FA8
FA9
FA10
FAI1
FA12
FAI3
FA14
Maximum Forward direction Phase fault current calculated by Fault Analysis through a circuit component.
Maximum Forward direction Ground fault current calculated by Fault Analysis through a circuit component.
Maximum Forward direction fault current calculated by Fault Analysis through a circuit component, based on values of FAI and FA2.
Minimum Forward direction Phase fault current calculated by Fault Analysis through a circuit component.
Minimum Forward direction Ground fault current calculated by Fault Analysis through a circuit component.
Minimum Forward direction fault current calculated by Fault Analysis through a circuit component, based on values of FA4 and FAS.
Maximum Reverse direction Phase fault current calculated by Fault Analysis through a circuit component.
Maximum Reverse direction Ground fault current calculated by Fault Analysis through a circuit component.
Maximum Reverse direction fault current calculated by Fault Analysis through a circuit component, based on values of FA7 and FA8.
Minimum Reverse direction Phase fault current calculated by Fault Analysis through a circuit component.
Minimum Reverse direction Ground fault current calculated by Fault Analysis through a circuit component.
Minimum Reverse direction fault current calculated by Fault Analysis through a circuit component, based on values of FA10 and FA11.
Absolute Maximum fault current calculated by Fault Analysis through a circuit component. The value is determined from the Maximum value
of FA3 and FAY.
Absolute Minimum fault current calculated by Fault Analysis through a circuit component. The value is determined from the Minimum value
of FA6 and FA12.
89

6.7. Inference Engine
A block diagram of the inference engine rule processors and interfaces is shown in
Figure 6.11. The Coordination, Selection, and Placement rule processors are run as separate
functions. The Selection Rule Processor depends upon having the Coordination data
produced by the Coordination Rule Processor. However, the Coordination Rule Processor
does not need to be run each time the Selection Rule Processor is run.
In selecting locations for the placement of devices, the designer may perform any
combination of the following: let the Placement Rule Processor select locations; select
locations himself via the GUI; or let the Placement Rule Processor select locations and then
use the GUI to modify locations selected by the Placement Rule Processor. The Selection
Rule Processor needs locations specified at which devices are to be selected. However, the
Placement Rule Processor does not need to be run to select those locations.
Rule processors in the inference engine are implemented with two modes which are a
procedural mode and a declarative, or query, mode. The terminology "procedural mode"
implies that a function is implemented with a series of steps. The procedural mode is
implemented in the C language. With the query mode functions are implemented with a
single high level computer language statement. The query mode is implemented using the
Structured Query Language (SQL) [89].
6.7.1 Coordination Rule Processor
Coordination data is created by the Coordination Rule Processor of the inference
engine from protective device data stored in the Device and Curve tables, shown in Tables
5.1 and 5.2, respectively. The Coordination Rule Processor applies the rules from Table 6.1
to protective device data stored in the Device and Curve tables and produces a Coordination
Table. The Coordination Table is stored in the relational database of DANE. The
90

Inference Engine
q ' Procedural Procedural Engineering B Procedural
Mode Mode ~ Analysis Mode Coordination Selection Functions GUI Interface Placement
Rule Rule y For Designer Rule
Processor Processor Placement Processor
Engineering 1 ' ' Analysis
Objects
Coordination | | Query y Placement of Table Mode Dummy Devices
Selection Protection Rule t+ Objects ——_j—_—_—_—_—_——_———— ’
Processor
y GUI Interface
For Designer
( Selected Devi
That Coordinate 2h Selection and
Placement
Figure 6.11. Inference Engine Rule Processors and Interfaces
91

information contained in the Coordination Table is given by Table 6.6. As illustrated later in
this chapter, the data from the Coordination Table is utilized by the query mode of the
Selection Rule Processor. The Coordination Rule Processor is written entirely in the C
language.
During its analysis, the Coordination Rule Processor examines two TCC curves. As
indicated by the column headings in Table 6.1, one curve is referred to as the Primary curve
and the other is referred as the Backup curve. The nomenclature used in conjunction with
the two curves essentially represents the physical circuit location of two protective devices --
the Primary and Backup protective devices. Thus, some portion of the Primary curve should
always lie below the Backup curve if the devices are to coordinate with each other. The only
exception to this rule occurs for C2 , which is addressed in the next section of this report.
The TCC curves used in this research were modeled from a series of digitized x,y
points where x represented amperes and y represented time in seconds. A maximum of 40
points was used in the modeling of each TCC curve. Thus, a TCC curve is represented by a
series of piecewise linear lines. However, when the various TCC curves were digitized, the
points were chosen at random. Thus, there was no pattern of alignment between the
different TCC curves. As a result the Coordination Rule Processor aligns the two curves that
are being processed. The alignment is along the x-axis such that the value for amperes
match on both TCC curves. The alignment of the TCC curves alignment must be performed
at every x,y point of a TCC curve that is analyzed by the Coordination Rule Processor.
The Coordination Rule Processor uses the Primary curve as the basis for checking
coordination between device curves. For a given value of amperes on the Primary curve, the
Backup curve is interpolated along such that its new value for amperes matches that
specified by the Primary curve. For the new value of interpolated amperes the Backup curve
will also have a new corresponding operational time.
92

V. ariable
Table 6.6. Coordination Table
Definition of Column Contents
Backup_Device
Backup_Curve
Backup _Type
Backup_Amps_Rating
Backup_Volt_Rating
Primary_Device
Primary_Curve
Primary_Type
Primary_Amps_Rating
Primary_Volt_Rating
Min_Coord_Amps
Max_Coord_Amps
Max_Time_Diff
Key into Device Table that identifies the Backup device. Using the
Backup's Device object, the value is obtained from Device->Device.
Key into Curve Table that identifies all curves associated with the Backup device. Using the Backup's Curve object, the value is determined from Curve->Curve.
Identifies the type of Backup device. Using Backup's Device object, the value is obtained from Device->T ype.
The continuous amperes rating for the backup device. Using the Backup's Device object, the value is determined from Device->Amps_Rating.
The voltage rating for the backup device. Using the Backup's Device object, the value is obtained by Device->Volt_Rating.
Key into Device Table that identifies primary device. Using the
Primary's Device object, the value is obtained by Device->Device.
Key into Curve Table that identifies all curves associated with the primary device. Using the Primary's Curve object, the value is determined from Curve->Curve.
Identifies for the type of primary device type. Using the Primary's Device object, the value is obtained from Device->T ype.
The continuous amperes rating for the primary device. Using the
Primary's Device object, the value is determined from Device->Amps_Rating.
The voltage rating for the primary device. Using the Primary's
Device object, the value is obtained from Device->Volt_Rating.
The minimum amperes for which the Backup and Primary curves coordinate, determined by Coordination Rule Processor.
The maximum amperes for which the Backup and Primary curves
coordinate, determined by Coordination Rule Processor.
The maximum time separation between the Backup and Primary curves, determined by Coordination Rule Processor.
93

If CT_Primary[tAmps] and CT_Backup{iAmps] represent the operational time of the
Primary and Backup devices, respectively, for a specific value of amperes, the difference
between the operational times of the Primary and Backup curves, Delta_Time, is given by
Delta_Time = CT_Backup[tAmps] - CT_Primary[iAmps] . [6.6]
A positive value for Delta_Time implies that the device pair coordinate at the given value of
amperes. The Coordination Rule Processor repeats the interpolation procedure on the
Backup curve using the next value of amperes specified by the Primary curve. The
Coordination Rule Processor stops checking the pair of device curves whenever the value for
Delta_Time becomes negative.
The Coordination Rule Processor performs an initial check to alleviate part of its
processing load. By initially checking the endpoints of the Primary and Backup curves,
numerous Primary and Backup curve combinations can rapidly be eliminated from
consideration. Additionally, if a pair of curves require further analysis by the Coordination
Rule Processor, the optimal starting point for the analysis is defined at this juncture.
The Coordination Rule Processor initially examines the endpoints of the Primary and
the Backup curves. Device coordination is not checked if the Primary curve's maximum
amperes are less than the Backup curve's minimum amperes, or the Primary curve's
minimum amperes are greater than the Backup curve's maximum amperes. For these two
conditions no overlap exists between the Primary and Backup curves and no coordination
exists, and the new Backup device is checked against the Primary. Assuming that some
overlap exists between the Primary and Backup curves, the Coordination Rule Processor
calculates their time difference, i.e. Delta_Time, at the two endpoints of the Primary curve
and the Backup curve.
94
Four possible cases exist at this stage of the comparison as illustrated in Figure 6.12.
In CASE 1, the Backup and Primary curves coordinate at the minimum amperes value of the
Primary curve. The Coordination Rule Processor begins its analysis at the optimal starting
location, the minimum amperes value on the Primary curve. The analysis for the curve pair
concludes when Delta_Time becomes negative. For CASE 2, the Backup and Primary curves
coordinate at the maximum amperes value of the Primary curve and the analysis starts at
the maximum amperes value on the Primary curve. The analysis continues along the
Primary curve until Delta_Time becomes negative. Notice that the value of amperes is
constantly decreasing in CASE 2 as opposed to constantly increasing in CASE 1. The
Coordination Rule Processor is able to process the device curves in either direction.
For CASE 3 , the Backup and Primary curves coordinate at both the endpoints.
However, the Coordination Rule Processor starts at the minimum value of amperes and
checks device coordination. It was observed during this research that even though both
endpoints of the Primary and Backup curves coordinated there were some rare instances in
which the Primary and Backup curves failed to coordinate at the center portion of their
curves. Recloser device curves were involved in all of these occurrences . For CASE 4, the
Primary and Backup curve fail to coordinate at either endpoint, and the Coordination Rule
Processor get a new Backup device from the table.
Based upon the rules being processed, for each device in the Device Table the
corresponding curve from the Curve Table is compared with all other device curves. If Rule
C13 is turned on and Rule Ci is also turned on, then a logical AND condition is used to
determine if coordination is satisfied, as given by
E=C13 ANDGM . [6.7]
If ZL evaluates to TRUE, then a new row is added to the Coordination Table.
95

Figure 6.12. Four Possible Cases for the Coordination of TCC Curves
96

The only data in the Coordination Table that is developed by the calculations of the
Coordination Rule Processor are the values for Min_Coord_Amps, Max_Coord_Amps, and
Max_Time_Diff. The remaining data for the Coordination Table is determined by accessing
the Device and Curve objects. For instance, to obtain the value for Backup_Amps_Rating the
Device object is access as shown by
(Sptr_Device + (pCmp->Device_Offset, )) ->Amps_Rating [6.8]
where Device_Offset; is the row number of the Backup device in the Device Table. The
specific data objects, that are used in the development of the Coordination Table data, are
shown in Table 6.6,
The Coordination Table can become very large due to numerical combinations of the
protective devices stored in the two tables. To illustrate this point, consider the following:
Assume that there are three classes of relays stored in the Device Table, that each class has
three styles, and that there are eight taps and twelve Time Dial curves for each style.
Hence, there are seventy-two rows in the Device Table and thirty-six rows in the Curve
Table associated with relays. However, there are a total of 864 different curves that may be
selected for relays. Also assume that there are six reclosers, and that each recloser has six
trip coils and three curves. Hence, there are 108 different curves that may be selected for
reclosers. Finally, assume there are 200 fuses stored in the Device Table, and thus 200
curves that may be selected for fuses. If all curves would coordinate, these numbers would
lead to 1.37E6 rows for the Coordination Table.
Any of the rules processed by the inference engine may be turned on or off. Turning
off coordination rules will affect the data contained in the Coordination Table, and hence the
data available to the selection process. For instance, if the designer did not wish to have
coordination between relays and fuses considered, then rules C4 and C9 would be turned off.
97

The Coordination Table only needs to be updated when data is modified in the Device
or Curve tables, or when the designer changes any of the coordination parameters or rules to
apply, described in Table 6.1. The Coordination Rule Processor is part of the integrated
expert system, but it can also be run as an independent workstation application. Thus, a
user can used it independently to check the coordination among various protective devices .
6.7.2 Fuse and Recloser Coordination
The coordination between a fuse and recloser is a special condition when a recloser is
serving as the backup device. The Fast Trip curve of the recloser should react to clear all
transient fault conditions within the fuse's primary protection zone. This prevents needless
damage to the fuse. The recloser must perform a fast trip operation before any operation
occurs on the Melting curve of the fuse. However, if the fault is permanent in nature, the
fuse must still react as the primary device and clear the fault within its protection zone.
The TCC curves for a fuse and recloser are illustrated in Figure 6.13. The example
presented in Figure 6.13 depicts both the Clearing and Melting curves for the fuse and the
Fast Trip and Delayed Trip curves for the recloser. The TCC curves shown in Figure 6.13
should coordinate over the entire range of expected fault currents for the fuse. The range of
expected fault currents is labeled on the x-axis in the diagram. Coordination rules C2 and
C3 apply to the time separation between the different pairs of curves shown in Figure 6.13.
To prevent fuse damage and permanent outages due to momentary faults, a recloser
typically performs multiple operations on its Fast Trip curve before it “lockouts". For this
situation, the recloser's Fast Trip curve should lie below the fuse's Melting curve over the
range of expected fault currents. Thus, if a fuse is the primary device, the recloser will
initially operate on its Fast trip curve and attempt to clear the fault. C2 controls the
separation between the fuse and recloser curves by scaling the fuse Melting curve.
98

1003 . 7 Coordination Range > ; || Fuse Clearing _ For Devices
104 NV ; 3 + | Fuse Melting : 2
S , e 43 “\ :
C | 75% Fuse LT 13 S 4! Melting —_
0.15
4] Recloser Trip 7
~ a “seal
" — 5
0.01 a 100
a = Range for Fault Current Amps
Figure 6.13. Primary Fuse and Backup Recloser Coordination
99

The effect of setting the coordination parameters for C2 at 75% and C3 at 80% is
shown graphically in Figure 6.13. The time points of the fuse's Melting curve are scaled by
75% due to C2. The recloser's Fast Trip curve intersects with the fuse's Melting curve at
approximately 750 amperes. This point of intersection sets the value of Max_Coord_Amps.
The time points of the recloser's Delay Trip curve are scaled by 80% due to C3. The
recloser’s Delay Trip curve intersects with the fuse's Clearing curve at approximately 150
amperes. This determines the value of Min_Coord_Amps. As shown in Figure 6.13, the
coordination range between the fuse and recloser is capable of providing the required
protection for the expected range of fault current amperes.
6.7.3 Placement Rule Processor
Every component in the system of interconnected circuits is evaluated by the
Placement Rule Processor for possible protective device locations. Locations for the
placement of devices are determined based upon the topology of the interconnected circuits.
The topology of the circuits is processed by working from the ending branches of each circuit
toward the substation. Circuit traces, which process the linked list of components that
comprise the circuit, are used in this process of analysis [47]. The Placement Rule Processor
inserts a “dummy device" at a circuit location whenever any of the activated placement rules,
except P3, are satisfied during the analysis.
To determine locations for protective devices, the Placement Rule Processor uses a
logical OR condition in evaluating all activated placement rules. For example, if placement
rules PI, P2, P3, P5, P6, and P&8, defined in Table 6.2, are activated, then the logic
evaluated is given as
L=PI1 OR P2 OR P3 OR P5 OR P6 OR P8& . [6.9]
If L is evaluated TRUE , a dummy device is graphically inserted at the circuit location.
100
The evaluation of the placement rules by the Placement Rule Processor involves
every component in the circuit, but many of the activated placement rules only apply to a
specific type of component. For instance, PI is only evaluated if the component is the start of
the circuit. Similarly, P2 is only checked when the component is some type of transformer.
P4 is only valid during the analysis process if the component is the start of a lateral, and P8
is only applicable to tie-line sections of the circuit.
Only P5, P6, and P7 are applicable to all circuit components. As indicated in Table
6.2, P5, P6, and P7 use external data produced by other analysis functions during the
evaluation process. P5 uses the Fault Analysis objects FA5 and FA6 to determine if a
protective device is required at given component location. If P5_Paramter_Value defines the
parameter value associated with P5, then the relational equation to determine device
placement is given by
L = {P5_Paramter_Value < pCmp->pFa->FA5 / pCmp->pFa->FA6} [6.10]
and if EL evaluates TRUE, a dummy device is placed at the circuit location.
P6 uses available customer information data in evaluating device placement. The
customer information data contains the number and type of customers attached to a specific
line section. As shown in Figure 6.10, a Reliability Analysis object, i.e. RA, is attached to
circuit Component objects. RA objects are used by P7 during the placement analysis. If
P7_Paramter Value defines the parameter value associated with P7, then the relational
equation used to evaluate device placement is given by
L = {P7 Paramter Value < pCmp->pRa->Failure_Rate } [6.11]
where PRA is defined in Table 6.4 and Failure_Rate is a data structure member of the RA
object. A device is placed at the circuit location if L evaluates TRUE.
101

Although P3 is shown in Table 6.2 as a placement rule, its function is to remove
unnecessary protective devices from the circuit.
After the Placement Rule Processor completes the analysis of the circuits, the
placement of the dummy devices is graphically displayed to the designer. The designer may
also use the GUI to insert and delete dummy devices. After the locations for the dummy
devices have been finalized, the Placement Rule Processor creates the data for the Protection
Objects shown in Table 6.7.
For each protective device location, a Protection Object is created and attached to the
protective device. Data contained in Fault Analysis and Power Flow Objects are used in the
creation of the Protection Objects. PO1 is formed by considering the FA13 of all components
within a primary protection zone. For instance, consider a primary zone comprised of n
components and let j represents a component in the protection zone such that j= 1, 2, ... 7.
The value of PO1 can be determined using the following relationship
POI = MAX { pCmp,->pFa->FA13, j=1,2,...n} . [6.12]
Within a given protection zone, a set of calculated peak load currents and cold load
inrush currents will exist for each component. The Power Flow object, defined as PF,
contains the peak load current, Peak_Load_Amps and the cold load inrush current,
Cold_Load_InRush. For a protection zone consisting of » components, PO2 is derived from
the Power Flow objects associated with the group of m components. If j represents a
component in the protection zone such that j= 1, 2, ... n, the value of PO2 is determined by
PO2 = MAX {pCmp,->pPf->PF->Peak_Load_Amps ,
pCmp, ->pPf->PF->Cold_Load_InRush } [6.13]
where pPf is a component pointer to the Power Flow object and / = 1, 2,... n.
102
The method in which PO3 is determined parallels the previous discussion concerning
PO2. The only difference being that PO3 is determined from FA4and FA7, i.e. the
minimum Forward and Reverse Phase fault currents, of all the components within a primary
protection zone. Similar to Equation 6.10, the value of PO3 is given by
PO3 = MIN {pCmp,->pFA->FA4 ,
pCmp,->pFA->FA7 — } [6.14]
where = I, 2,... n.
The intent behind the formulation of the data stored in PO4 seeks to provide
additional protection. In the event that a primary protective device fails to operate for a
fault, it is necessary that its backup protective device operate to clear the fault. Thus, the
information stored in PO4 is based on two protection zones, the primary and backup
protection zones. PO4 stores the minimum value for FAl4 within a protective device's
primary and backup zones. Ifa device's primary and backup zones consist of m components,
the expression for determining PO4 is given by
PO4 = MIN { pCmp,->pFa->FAl4, j=1,2,...m} . [6.15]
The purpose for POS is related to the same principle as PO4 -- additional protection.
PO5 contains the minimum equipment amperes rating of all components within a protective
device's primary and backup zones. POS is determined from Power Flow objects using the
equipment amperes rating, defined as Equip_Amps_Rating. For m components that exist
within a device's primary and backup zones, the value of POS is determined using
POS = MIN { pCmp,->pPf->PF->Equip_Amps_Rating } [6.16]
where pPf is a component pointer to the Power Flow object and j = 1, 2, ...m
103
At each protective device location, PO6 contains the minimum from the set of values
for downstream PO4 and POS. The reference to downstream implies that all protection
zones are included until the ending zone is reached during the analysis. Thus, the last zone
always includes an ending branch component. If all of the downstream protection zones
consist of m components andj is a component within the protection zones, PO6 is determined
using Equations 6.13 and 6.14 and is given by the following relationship
PO6 = MIN { pCmp,->pFa->FAl4 ,
pCmp,->pPf->PF->Equip_Amps_Rating } [6.17]
where pPf is a component pointer to the Power Flow object and j = 1, 2, ... m.
A relationship exists between PO2 , PO3, PO4, and PO6 that pertains to the topic
of ground tripping devices. Consider the following example based on the data in the
Protection Objects. If a fuse device is chosen based solely upon the information stored in
PO4, the fuse may not operate properly. If the value of PO2 exceeds PO4, the fuse will
incorrectly sense load current as a fault and improperly operate. As indicated earlier in the
report, the condition -- of improper protective device operations due to load currents -- is the
predominant cause of false operations and mis-coordination in existing protection system [1].
Whenever the value of PO2 exceeds PO4 a fuse device is not capable of providing total fault
current protection. For this situation what is referred to as ground trip reclosers are utilized
in conjunction with fuses to provide fault protection. If a recloser ground trip is used , the
data in PO3 is crucial to the fuse selection. The phase device must still interrupt the
minimum phase fault current. The data in PO6 dictates the setting for minimum pickup on
the ground trip of the recloser. Thus, the data from PO2, PO3, PO4, and PO6 must be
examined and special conditions exist whenever PO2 exceeds PO4. As indicated in Table
6.7, the data contained in the Protection Objects is utilized by the Selection Rule Processor.
104

Table 6.7. Description of Protection Objects
Variable Description of Information Rules
PO1
PO2
PO3
PO4
POS
PO6
Stores the Absolute Maximum fault current in a protective device's primary zone. The informational data is based on each component's Fault Analysis object value for FAI3.
Defines the Maximum between the peak load and the cold load inrush current in a protective device's primary zone. The value stored is based on each component's Power Flow
object values of Peak_Load_Amps and Cold_Load_InRush.
Contains the Minimum phase fault current in a protective
device's primary zone. The informational data is based on
each component's Fault Analysis object values for FA4 and FA7.
Defines the Minimum between the Primary and Backup zone Absolute Minimum fault currents. The informational] data is based on each component's Fault Analysis object value for FAI14.
Defines the Minimum between the Primary and Backup zone equipment current ratings. The value stored is determined based on each component's Power Flow object value for
Equip_Amps_Ratings.
Contains the downstream minimum value of Absolute Minimum fault current or equipment current rating that must be protected by a recloser. The informational data is determined from the set of each component's Fault Analysis object value for FAI4 and each component's Power Flow
object value for Equip_Amps_ Ratings.
S13
S9, S12, S13
S8
S4Z
S5
S8
105

6.7.4 Selection Rule Processor
The Selection Rule Processor has two modes of operation, a query mode and a
procedural mode. The procedural mode is implemented using the C programming language,
and the query mode is implemented with ESQL statements. The logic flow diagram for the
Selection Rule Processor is presented in Figure 6.14. The goal of the Selection Rule
Processor is to select protective devices that coordinate at all placement locations. The
dummy protective devices inserted by either the Placement Rule Processor or the designer
act as place holders. For each dummy device, the Selection Rule Processor attempts to select
an actual device to replace the dummy device.
The concept of protective device level is used by the Selection Rule Processor, where
level is defined as follows:
The level of a given protective device is the maximum number of protective
devices between the given protective device and an ending branch of the
circuit.
As shown in Figure 6.14, the first task that the Selection Rule Processor must
perform is the determination of each device's level. en performing a reverse trace from an
ending branch, the first device encountered, whethér it be an actual or dummy device, is
marked as level zero. As the reverse trace continues,|the next device encountered is marked
as a level one device, and so forth. In tracing from one ending branch a device may be a level
two device, but in tracing from another ending branch the same device may be a level three
device. In such a case the device is labeled as a level three device.
Protective devices are selected for one circuit at a time. For each circuit that is being
processed the Selection Rule Processor initializes program variables. Additionally, as shown
in Figure 6.14, the value for PO Flag is set to YES to indicate that the Selection Rule
Processor use fault current data from the Protection Objects. If PO_Flag is set to NO, the
106

Set the Device Level Initialize Variables en Set PO_Flag = YES on Dummy Devices Determine Max_Level
Select_Level != Max_Level Ze i) Tp»
pam
Form Linked List of
All Downstream Devices
| Create Selection Objects |
Set Determine the Type of
PO Flag = NO Device for Selection
Select_Level = 0 iy Use FORWARD MAX and MIN Dynamically Create SQL
Fault Currents SELECT Statements
Get Next
Dummy Device
Device Level ! =
Select_Level
Increment
Select_Level
sailare of Device
Figure 6.14. Selection Rule Processor Flow Diagram
107

fault currents are obtained from Fault Analysis objects. The purpose in PO_Flag will become
evident in the preceding discussion of this section. The value of Max Level is initialized to
the maximum protective device level in the circuit being processed.
The Selection Rule Processor works from the ending branches of each circuit toward
the substation. The selection rule processor begins selecting devices at level zero. Thus, the
variable Select_Level starts at zero. As shown in Figure 6.14, the selection process continues
for a given circuit until Select Level reaches Max_Level. Each time an actual device is
selected, it must selected such that it coordinates with all downstream devices. In order to
accomplish this coordination, the Selection Rule Processor forms a linked list of all
downstream devices. If the device being selected has Select_Level equal zero, the linked list
will contain devices, only if the selected device is a tie_line component, and actual protective
devices exist in adjacent tie_line connecting circuits. Tie_line protective devices at level zero,
that may be switched to an adjacent circuit, must be checked for coordination with the
corresponding level zero devices in the adjacent circuit.
A Selection Object is created from this linked list of devices. The Selection Object is
developed at the selected device location based on information from the linked list of
downstream devices, activated selection rules, previously selected devices, and the value of
PO_Flag. The Selection Object only contains information that is valid and must be processed
at the given device location. For example, if the device being selected is a recloser and only
fuses have been selected at downstream locations, all of the data in the linked list would
apply to the device's selection. Recall that a recloser must provided backup protection to all
downstream fuse protected zones as discussed previously in Section 6.7.2 and illustrated by
Figure 6.13. However, if the device being selected is a fuse, then the only downstream
devices in the linked link that would be valid and contained in the Selection object would be
108

those that are one protection zone below the fuse being selected, since a fuse must only serve
as backup for one protection zone beyond its primary protection zone.
Information about previously selected devices and designer implemented Selection
Rules also determine valid data for the device's Selection Object. If number of downstream
selected fuses equals the designer's specified value contained in the parameter of S11, the
Selection Object must contain information for a backup recloser device selection. Ifa recloser
exist downstream, the device's Selection Object does not need information to provide for
backup recloser selection. The Selection Object also contains circuit criteria data such as the
operating voltage at the selected device's location, the number of phases, and the type of
line construction, either underground or overhead.
Selection Object information is used to dynamically create SQL Select statements.
The query mode of the Selection Rule Processor uses SQL Select statements which query the
Coordination Table. When performing device selection, the selected device must serve as the
backup device for all devices specified by the device's Selection Object. As such, the selected
device may serve as the backup protective device for one or several downstream protective
devices.
Rules S1, S3, S7, S8 and S10 are implemented by the procedural mode, and the
remaining rules are implemented with the query mode. The procedural mode determines
which query mode select statement needs to be utilized by the Selection Rule Processor. For
example, if rule S10 is activated and its selection parameter is set to select relays at the start
of the circuit, the procedural mode activates a select statement for this rule. Thus, when the
Selection Rule Processor analysis reaches the start of the circuit the select statement used
will only select relays.
When evaluating possible devices to select from the Coordination Table, all of the
activated selection rules must be satisfied. Thus, the Selection Rule Processor uses a logical
109

AND condition for the evaluation. The AND condition is implemented in the conditional
portion of the SQL Select statement, as indicated in Figure 6.15.
To distinguish between different portions of the Select statement in Figure 6.15 the
following format for the font typeface is used:
bold words indicate SQL Select statement qualifiers; underlined words indicate from
which table to select data; italics words indicate specific columns in the selected table; and all
other words indicate variable data values. The Selection Rules and data objects that are
used are indicated as Si, Pi and FAi , respectively.
Coordination is possible if the select statement returns rows from the Coordination
Table. Multiple rows, or device pairs, may exist in the Coordination Table which satisfy the
selection rules. In this case the procedural mode is used to implement rule S1.
When coordination fails (i.e. no rows selected from coordination table), selection rule
S7 allows the Selection Rule Processor to attempt coordination by using other device types.
For example, if fuse device types are being selected as governed by rule S11] and coordination
fails, then the procedural mode implements selection rule S7. Thus, rule S7 overrides S11
and forces the Selection Rule Processor to use an alternate select statement which considers
recloser or relay type devices. Whenever coordination fails due to an activated selection rule
the goal is to insure that all possible device types have been utilized in attempting
coordination . This implements a consistency check to avoid coordination failure due to
activated rules.
As indicated in Figure 6.15, the Selection Rule Processor uses data from the
Protection Objects that are defined in Table 6.7. A Protection Object is linked to every
dummy protective device. PO_Flag is initially set to YES and the Selection Rule Processor
attempts to coordinate the interconnected circuits using the values of Absolute Maximum
and Minimum fault currents that are stored in POI and PO4, respectively. These are the
110

SELECT (Backup_Device )
FROM Coordination Table WHERE
Primary_Device = Primary Device # AND
Backup _Type = Device Type AND
Backup_Volt_Rating >= Circuit Voltage AND
Backup_Amps Rating >= (PO2* S12 parameter) AND
Max_Coord_Amps >= (PO1 * S13 parameter) AND
Min_Coord_Amps >= (PO2 * S9 parameter) AND
Min_Coord_Amps <= PO3 AND
Min_Coord_Amps <= PO4 AND
Min_Coord_Amps <= PO5 AND
Min_Coord_Amps <= PO6
ORDER_BY Backup_Amps_ Rating, Max_Time_Diff
Figure 6.15. Example SQL Select Statement
111
fault currents developed by considering all circuit configurations for the interconnected
system of circuits. If coordination fails, i.e. SQL Flag is not Success as shown in Figure 6.14,
for the Absolute Maximum and Minimum fault currents and all alternate device types have
been checked for possible coordination, PO_Flag is set to NO, and Select_Level is reset to
zero. For the condition of PO_Flag set at NO, only the Forward Maximum and Forward
Minimum fault currents, i.e. FA3 and FA6, respectively, are used when attempting device
coordination. Thus, FA3 and FA6 replace POI and PO4, respectively, when PO_Flag is
changed from YES to NO. The required changes to the SQL Select statement are shown by
Figure 6.16. However, if coordination fails again when PO _Flag is set to NO, device
coordination is not possible by the Selection Rule Processor. The designer is notified by the
Failure of Device Coordination as indicated is Figure 6.14.
All the dummy protective devices at a given protection level of Select_Level are
processed as shown in Figure 6.14. If all the devices at a given Select_Level have been
processed, the value of Select_Level is incremented, and all devices at that Select_Level are
processed. The selection process continues until the Select Level for the devices being
selected equals the value of Max Level. Fora given circuit, the Selection Rule Processor is
successful and reaches DONE when all of the dummy protective devices are replaced with
actual protective devices.
112
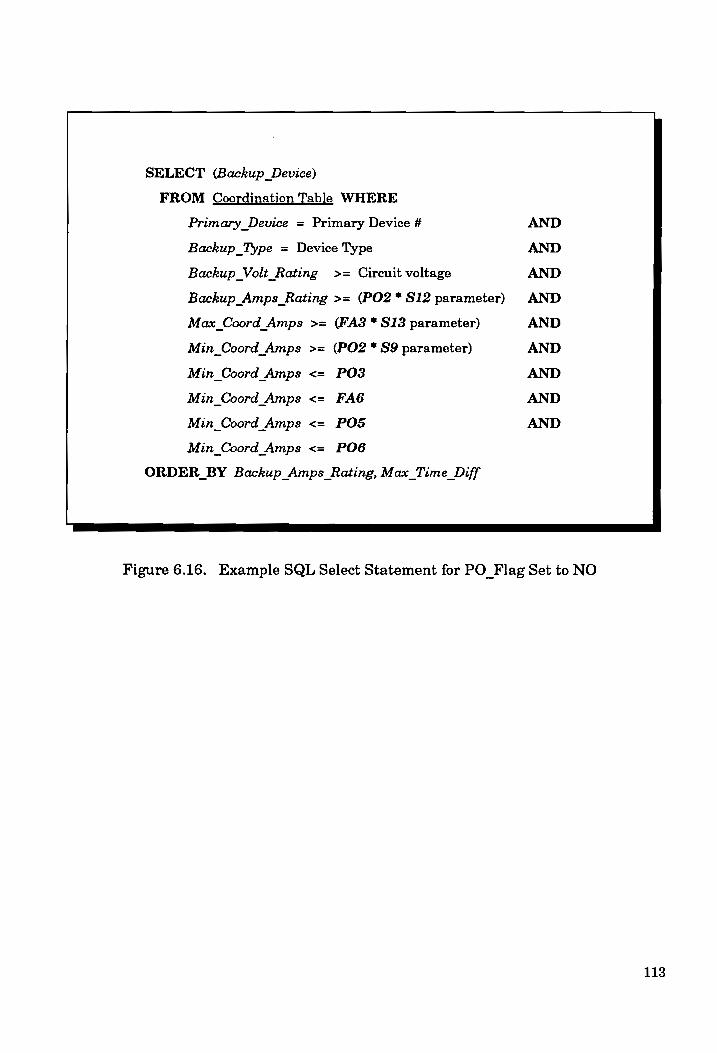
SELECT (Backup_Device)
FROM Coordination Table WHERE
Primary_Device = Primary Device # AND
Backup_Type = Device Type AND
Backup _Volt_Rating >= Circuit voltage AND
Backup_Amps_Rating >= (PO2* S12 parameter) AND
Max_Coord_Amps >= (FA3 * S13 parameter) AND
Min_Coord_Amps >= (PO2 * S9 parameter) AND
Min_Coord_Amps <= PO3 AND
Min_Coord_Amps <= FA6 AND
Min_Coord_Amps <= PO5 AND
Min_Coord_Amps <= PO6
ORDER_BY Backup_Amps_ Rating, Max_Time_Diff
Figure 6.16. Example SQL Select Statement for PO Flag Set to NO
113

6.8. Key Features Summary of the Expert System
A summary of major features incorporated by the expert system for protection system
design include the following --
* The expert system incorporates the key elements and requirements
outlined by IEEE in Reference 15 which consist of:
Data Integration,
Relational Database Management System, and
A Graphical User Interface, GUI, that is provided by DANE.
* Data integration is achieved by the relational database system and by
the sharing of in-memory created data objects that include:
Component Objects, and
Fault Analysis Object,
Protection Objects,
Selection Objects.
* The Inference Engine consists of four functions, Fault Analysis,
Coordination Rule Processor, Placement Rule Processor and Selection
Rule Processor, that dynamically create data for the Knowledge Base .
* Influencing Expert Rules controlled by the designer are associated with
three functions as shown below:
Coordination Rule Processor Function -13 Rules,
Protection Rule Processor Function - 8 Rules, and
Selection Rule Processor Function -13 Rules.
* The Expert System is programmed using the C language and ESQL
statements.
114
CHAPTER 7
Design Example And Results
7.1. Introduction
An example protection system design is presented using an integrated expert system
developed for the DANE engineering workstation. The example problem consists of three
interconnected distribution circuits. Dynamic knowledge created by the expert system from
the rules and system data is used in the design. System data is presented pertaining to the
circuits along with the created dynamic knowledge. The implemented rules dealing with the
coordination, placement and selection of protective devices are presented along with all
associated parameter values. The final design and results are shown.
The modeling techniques for protective devices were presented in Chapter 5 of this
report. In Chapter 6 various aspects were presented concerning the development of the
integrated expert system for protection system design, as well as the design rules pertaining
to coordination, placement and selection. Chapter 6 also presented the overall expert system
design and rule processors. This chapter presents the pertinent data involved in a protection
system design using the expert system developed under DANE. The focus for this chapter is
on the data -- both data that exists and data that is created and utilized -- and the overall
results using the expert protection system design system.
The focus of the expert system is dynamic data, or knowledge, creation via data
integration. Dynamic knowledge, as defined here, is dependent upon both existing data that
remains fixed and influencing data that is changeable. Equipment data pertaining to
conductors, transformers and protective devices are examples of fixed, or static, data; while
circuit configurations, rule processors and associated rule parameters are examples of
influencing data.
115
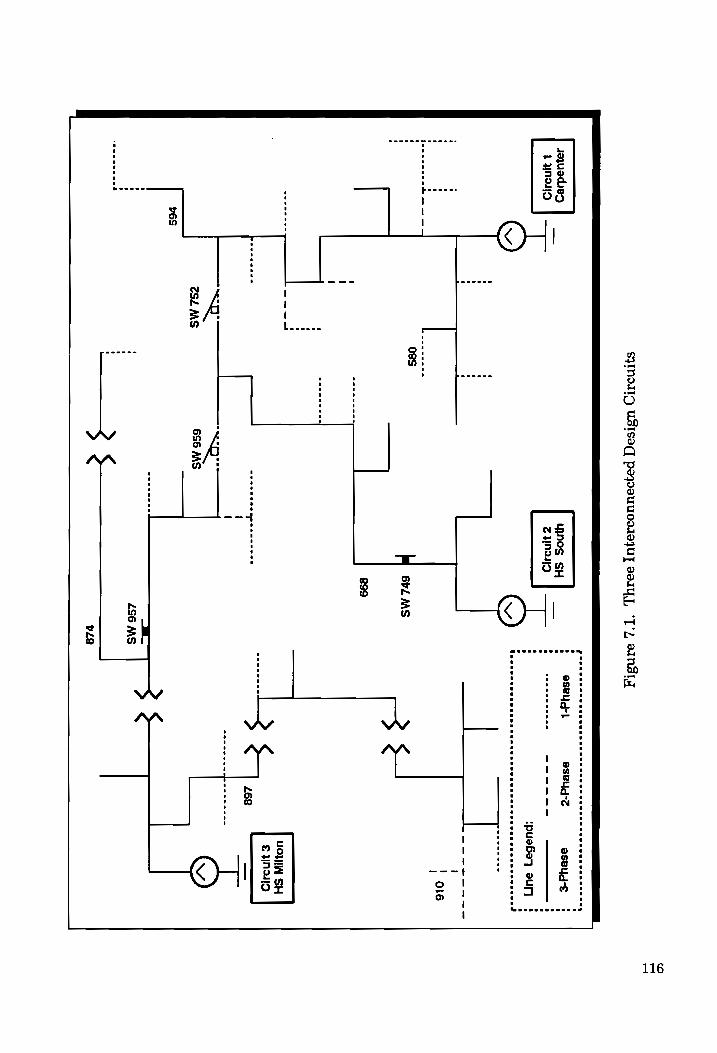
SHINDIID USISEq
payauUOdIEqU] sary,
“Ty, eandiy
f
dajuadieg unos
SH :
L aynsajD
ZyNaD
: teeeeeeeeee
2 ee
we eee
:
—_—_e oe
ge ee
ee ee
! i
OLG meme
eke
om oe
oe
oe
_
:
penn n ne
UO}IIN SH
£ INDO
VV
“WN
256 MS
a
Vv
< SC Z8
116

The expert system utilizes engineering functions, such as fault analysis, power flow,
and reconfiguration together with the coordination and placement rule processors to create a
dynamic knowledge base from the fixed data. The selection rule processor utilizes the
dynamically created knowledge to design a protection system. As such, the knowledge base
for the expert system is not a conventionally programmed one using solely rule knowledge
bases.
The engineering workstation used for this design example consisted of the following
hardware: A 25MHz IBM PS/2 Model 70/886 machine with 8Mb of RAM, 64Kb cache
memory and 120 Mb hard disk. The operating system for the software was OS/2 version 1.3.
7.2 Background Circuit Information
An expert system design study is presented involving the protection system for three
interconnected distribution circuits. The interconnected circuits are from the Hot Springs
Division of Arkansas Power and Light in Hot Springs, Arkansas. Arkansas Power and Light
has been intensively involved in working with the engineering workstation developed at
Virginia Tech. Over 100 interconnected circuits from the Hot Springs Division have been
modeled in the workstation.
The engineering schematics for the three circuits are shown in Figure 7.1. The
engineering schematics in Figure 7.1 are not drawn to scale and some circuit components are
not shown by the schematics. In particular, the 15 existing capacitor banks located on the
circuits are not shown. Figure 7.1 shows substations, lines, switches and transformers.
The three circuits originate from three separate urban 115 - 13.8 KV substations in
the area south of Hot Springs, Arkansas and span out to serve rural customers. The three
circuits are interconnected by two switches, namely SW 959 and SW 752, as shown in Figure
7.1. The other switches utilized by the design study are shown in Figure 7.1.
117

The customers supplied by the three circuits consist of 1 industrial , 700 commercial
and 4650 residential. The customers served are predominantly rural residential customers.
The 1 industrial customer is supplied by Circuit 1 from the Carpenter substation. The
commercial customers are located in the urban areas along the three circuits. The three
circuits consist of approximately 110 line section components which total about 84 miles of
conductors.
For future reference, a table of abbreviations used throughout this chapter are
presented in Table 7.1. Table 7.2 presents example line types by circuit location as shown in
Figure 7.1.
The remaining chapter sections present data used during the design study. Data
concerning the protective devices utilized to build the Coordination Table for the design are
presented in the next section. The Placement Rule Processor and associated engineering
functions are presented in Section 7.4. The Selection Rule Processor analysis for the circuits
and final design results are presented in Section 7.5. Conclusions are presented in Section
7.6.
7.3. Protective Device Data And Coordination Table
The protective device data utilized for the design consisted of 20 fuse, 90 recloser,
and 145 relay curves. From these device curves the Coordination Rule Processor built the
Coordination Table used by the Selection Rule Processor. The coordination principles and
corresponding parameter values that were adopted for the design are shown in Table 7.3.
The implemented coordination rules produced approximately 15,000 device coordination
pairs. Thus, the Coordination Table built contained 15,000 rows. The minimum coordination
range, or C13, was set at 400 amperes.
118

Table 7.1. Chapter 7 Abbreviation Definitions
Abbreviation Definition of Symbol
CLI Circuit Location Index - used to reference a location in a given circuit schematic.
CONF_ID Configuration Identification for the interconnected circuits
MAX IR Maximum Interrupting Rating for a protective device
MIN PU Minimum Pickup for a protective device
GRD Ground
Table 7.2. Example Line Types Shown in Figure 7.1
CLI Line Types and Construction Description
910 #4 ACSR, 2-Phase, Cross Arm Construction
897 795 AL, 3-Phase, Vertical Construction
874 336 ACSR, 3-Phase, Vertical Construction
668 336 ACSR, 3-Phase, Cross Arm Construction
594 #4 ACSR, 3-Phase, Cross Arm Construction
580 #6 CU, 1-Phase, Vertical Construction
119

Table 7.3. Implemented Coordination Rules
R Fault
ule
Label | Type Primary Curve Backup Curve Parameter
C1 P Fuse Clearing Fuse Melting 75%
C2 M Fuse Melting Fast Recloser Trip 75%
C3 P Fuse Clearing Delayed Recloser Trip 95%
C4 P Fuse Clearing Relay Trip 95%
C5 Pp Delayed Recloser Trip Fuse Melting 80%
C6 M Fast Recloser Trip Fast Recloser Trip 95%
C7 Pp Delayed Recloser Trip Delayed Recloser Trip 65%
C8 p Delayed Recloser Trip Relay Trip 95%
C9 P Relay Trip Fuse Melting 75%
C10 P Relay Trip Fast Recloser Trip 95%
C11 Pp Relay Trip Delayed Recloser Trip 90%
C12 P Relay Trip Relay Trip 95%
120

S}IMIIID BaIU,],
Jo} suUOIZBIOT
JUSUIADBIg °*Z'L
BANS
Jayuadiey
wnos
SH
: :
LYNDIID % ND
: :puebe7y
oS
ee ee
bas S69
en of,
sts UO}
SH € UNDAD
121

7.4. Placement Rule Processor Data
The Placement Rule Processor utilizes workstation analysis functions which include
fault analysis, power flow, and switching configurations. These analysis functions have been
checked against those used by Arkansas Power and Light, DFA[53].
For a given set of interconnected circuits, the Placement Rule Processor performs
switching operations based on the switching configurations. The switching configurations
used in the design example are shown in Table 7.4, where only those switches that change
position are shown. In Table 7.4, the CONF_ID of -1 represents the normal, or base,
operating configuration for the circuits. The base configuration determines the normal
direction of current flow through each component. For each configuration, fault analysis
calculates fault currents, and power flow determines the load current at peak circuit loading
for each component of the interconnected circuits involved in the design.
The data from fault analysis and power flow are used to update individual component
values. The current values of maximum fault, maximum load, minimum phase fault,
minimum fault and equipment ratings are examined for each component as well as the
direction of current flow. For each configuration, the Placement Rule Processor determines
if the existing values for each component need to be updated. For example, if a component's
value for maximum load amperes is set at 200 from previous configurations analyzed and
power flow yields a value of 245 for the present configuration of the circuits, then placement
sets the component value for maximum load amperes at 245. Thus, after all configurations
have been analyzed the Placement Rule Processor has determined at each component the
appropriate values, either a maximum or minimum, that a particular component may
experience for the possible switching configurations defined by the designer.
After all switching configurations have been analyzed, the Placement Rule Processor
must use designer activated placement rules together with data from fault analysis and
122
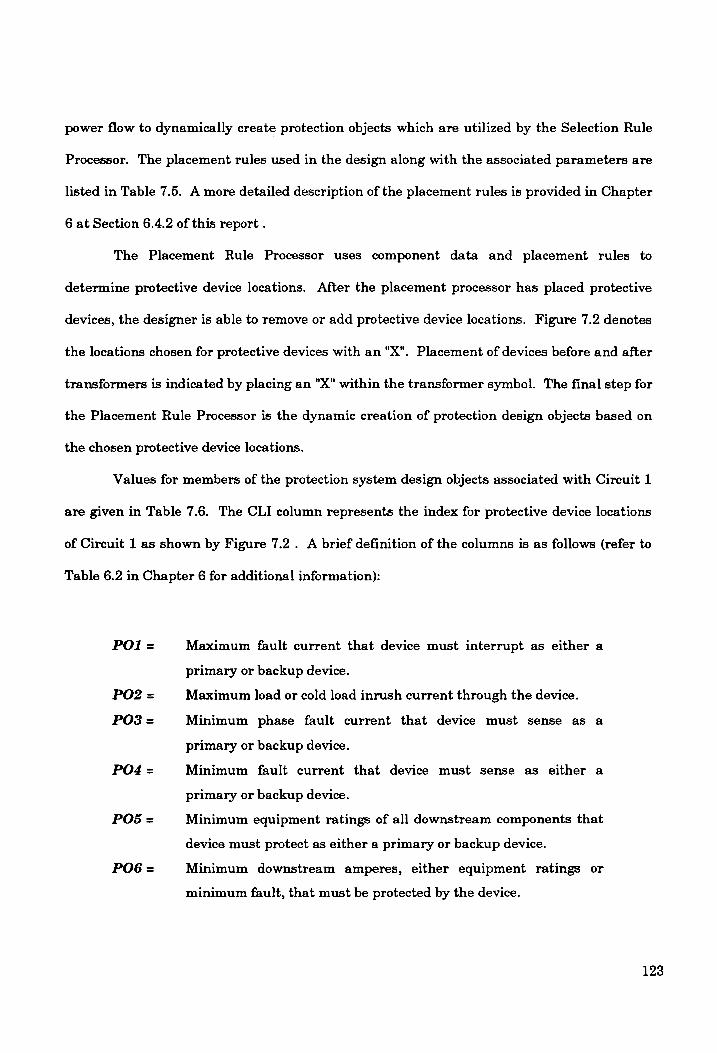
power flow to dynamically create protection objects which are utilized by the Selection Rule
Processor. The placement rules used in the design along with the associated parameters are
listed in Table 7.5. A more detailed description of the placement rules is provided in Chapter
6 at Section 6.4.2 of this report .
The Placement Rule Processor uses component data and placement rules to
determine protective device locations. After the placement processor has placed protective
devices, the designer is able to remove or add protective device locations. Figure 7.2 denotes
the locations chosen for protective devices with an "X". Placement of devices before and after
transformers is indicated by placing an "X" within the transformer symbol. The final step for
the Placement Rule Processor is the dynamic creation of protection design objects based on
the chosen protective device locations.
Values for members of the protection system design objects associated with Circuit 1
are given in Table 7.6. The CLI column represents the index for protective device locations
of Circuit 1 as shown by Figure 7.2. A brief definition of the columns is as follows (refer to
Table 6.2 in Chapter 6 for additional! information):
PO1= Maximum fault current that device must interrupt as either a
primary or backup device.
PO2 = Maximum load or cold load inrush current through the device.
PO3 = Minimum phase fault current that device must sense as a
primary or backup device.
PO4 = Minimum fault current that device must sense as either a
primary or backup device.
POS = Minimum equipment ratings of all downstream components that
device must protect as either a primary or backup device.
PO6= Minimum downstream amperes, either equipment ratings or
minimum fault, that must be protected by the device.
123

Table 7.4. Switching Patterns for Circuits
CONF_ID SW 752 SW 749 SW 959 SW 957
-1 Opened Closed Opened Closed
1 Opened Closed Closed Opened
2 Closed Opened Opened Closed
Table 7.5. Implemented Placement Rules
Rule
Label | Parameter Rule Description & Engineering Analysis Functions
P1 -- A device is located at the start of each circuit.
P2 -- Devices are located at both the primary and secondary sides of all transformers.
P3 -- Placement of devices back-to-back is not allowed.
P4 1 If the total length of the downstream lateral exceeds the value of this parameter, then a locate a device at the start of the lateral.
P5 26 If the ratio of the maximum fault current to the minimum fault current for a potential new zone exceeds the value of this parameter, then a place a device at the circuit location being evaluated.
P6 750 If the number of customers in a potential new zone exceeds the value of this parameter, then a place a device at the circuit location.
P8 1 For a feeder tie-line, the number of devices to be evenly distributed over the length of the tie-line is set at the value of this parameter.
124

Table 7.6. Protection Objects for Circuit 1
eee ee ee
CLI PO! PO2 PO3 PO4 POS PO6
572 10,536 645 4,060 169 725 107
608 3,361 70 2,820 170 107 107
610 1,332 62 170 170 115 107
605 2,066 28 834 169 107 107
584 2,875 456 1,615 170 725 107
604 1,596 15 1,140 164 107 107
602 1,395 30 150 150 107 107
589 2,115 394 1,147 147 725 107
592 1,732 43 637 124 430 107
596 659 20 124 124 115 107
573 5,107 108 4,148 179 402 107
581 1,618 18 181 181 107 107
576 3,733 42 2,370 179 402 107
579 3,430 30 183 183 201 107
125

Placement Rule. Coordination Rule
Processor Processor
3 ; 7 3 ! Protecti Dy namic Coordinatio ! rotection oordination !
Objects Knowledge Table Base
' ' Lee eee deen i
Selection Rule
Processor
Y Selection Results
Y Designer Decision
Figure 7.3. Dynamic Knowledge Base for Selection Processor
126

SELECT (Backup_Device)
FROM Coordination Table WHERE
Primary_Device = Primary Device # @ 596 AND
Backup_Type = Fuse AND
Backup_Volt_Rating >= 13800.0 AND
Backup_Amps_Rating >= 43*1.2 AND
Max_Coord_Amps >= 17382 * 1.5 AND
Min_Coord_Amps >= 43 * 1.75 AND
Min_Coord_Amps <= 124 AND
Min_Coord_Amps <= 115 AND
Min_Coord_Amps <= 107
ORDER_BY Backup_Amps_Rating, Max_Time_Diff
Figure 7.4. SQL Fuse - Fuse Select Statement
127

7.5. Selection Rule Processor
The device locations in the interconnected circuits shown in Figure 7. 2 are analyzed
by the Selection Rule Processor. Table 7.7 shows the selection rules and their associated
parameters used in the design (refer to Table 6.3 in Chapter 6 for additional information).
As illustrated in Figure 7.3, the Selection Rule Processor uses data from the
Protection Objects together with the Coordination Table to interactively Select Coordinated
protective devices. The Protection Objects associated with each device location determine
the operating conditions that must be satisfied by the selected device from the Coordination
Table. The Selection Processor uses SQL Select statements which query the Coordination
Table. Four specific Select statements used for Circuit 1 device locations are shown in
Figures 7.4, 7.5, 7.6 and 7.7.
Figure 7.4 shows the Select statement used to perform a Backup Fuse - Primary Fuse
selection for CLI 592 and CLI 596. At this juncture in the design, at CLI 596 a fuse has
already been selected and the device at CLI 592 is being selected from the Coordination
Table. Thus, the device at CLI 592 must serve as the Backup device for CLI 596.
The SQL select statement used in Figure 7.4 produced a coordinating backup fuse
device from the coordination table. Preceding in a similar manner toward the substation the
Selection Rule Processor must select a device at CLI 589.
The SQL select statement shown in Figure 7.4 has four qualifiers on the value for
Min_Coord_Amps. However, if the value qualifier for Min_Coord_Amps associated with
(PO2 * S9 parameter) exceeds the value qualifier for Min_Coord_Amps associated with PO6
then the Selection Rule Processor uses a "Ground Pickup" and sets all "Phase" protective
devices based on the value of PO3. This occurs when the peak load current is such that the
"Phase" protective device cannot be set to detect the minimum fault current as the peak load
current would be detected as a fault. Ground pickups are available on reclosers and relays.
128

Table 7.7. Implemented Selection Rules
Rule
Label | Parameter Rule Description & Engineering Analysis Functions
SI No Select the fastest operating device.
S2 No The voltage rating of device at the circuit location.
S3 No Reclosers are selected at all three-phase locations.
S4 No Pickup less than the minimum of primary and backup fault currents
S5 No Pickup less than the minimum of primary and backup equipment ratings
S6 No Use recloser to protect for transient faults.
S7 No Try all devices if coordination fails.
S8 No Use recloser ground trip when coordination fails or when (PO2 * S9 parameter) exceeds PO6
S9 1.75 Pickup scaling factor for load current
S10 0 Breakers at start of circuits
S11 3 Number of fuses in series
S12 1.2 The continuous current rating scaling factor for devices.
S13 1.5 The interrupting rating scaling factor for devices.
129

SELECT (Backup_Device)
FROM Coordination Table WHERE
Primary_Device = Primary Device # @ 592 AND
Backup_Type = Recloser AND
Backup_Volt_Rating >= 13800.0 AND
Backup_Amps Rating >= 394*1.2 AND
Max_Coord_Amps >= 2115*1.5 AND
Min_Coord_Amps >= 394* 1.75 AND
Min_Coord_Amps <= 1147 AND
ORDER_BY Backup_Amps_Rating, Max_Time_Diff
Figure 7.5. SQL Recloser - Fuse "Phase" Select Statement
Figure 7.5 shows the Select statement used to perform a Backup Recloser - Primary
Fuse selection. CLI 592 had a fuse selected for it, and a recloser device is being selected at
CLI 589 from the Coordination Table. Note that at CLI 589, PO2 is such that the "Phase"
protective device must be set above PO6. Therefore, a ground pickup must be used to
protect for PO6.
130

SELECT (Backup _Device)
FROM Coordination Table WHERE
Backup_Device = Backup Device # @ 589 AND
Primary_Device = Primary Device # @ 592 AND
Backup Type = Recloser AND
Min_Coord_Amps <= 107 AND
ORDER_BY Backup_Amps_ Rating, Max_Time_Diff
Figure 7.6. SQL Recloser - Fuse "Ground Pickup" Select Statement
The SQL select statement used in Figure 7.5 produced a coordinating backup recloser
device that had available ground pickups from the coordination table. For the recloser
selected, the Selection Rule Processor then used a SQL select statement, as illustrated in
Figure 7.6, to select the ground pickup for the recloser at CLI 589. At this point the
Selection Rule Processor knows that all protective device locations upstream will have to
utilize ground pickups to sense and protect minimum fault currents.
131

SELECT (Backup_Device)
FROM Coordination Table WHERE
Primary_Device = Primary Device # @ 589 OR
Primary_Device = Primary Device # @ 602 OR
Primary_Device = Primary Device # @ 604 AND
Backup_Type = Recloser ' AND
Backup_Volt_Rating >= 13800.0 AND
Backup_Amps Rating >= 456*1.2 AND
Max_Coord_Amps >= 2875 * 1.5 AND
Min_Coord_Amps >= 456 * 1.75 AND
Min_Coord_Amps <= 1615 AND
ORDER_BY Backup_Amps_Rating, Max_Time_Diff
Figure 7.7. SQL Backup Recloser - Recloser/Fuse Select Statement
Preceding in a similar manner toward the substation the Selection Rule Processor
must select a device at CLI 584. Figure 7.7 shows the Select statement used to perform a
Backup Recloser - Primary Recloser/Fuse selection. CLI 589 had a recloser selected for it,
and a "Phase" recloser device is being selected at CLI 584 from the Coordination Table.
However, at CLI 584 the recloser device must serve as backup for fuses that have been
selected at CLI 602 and CLI 604. Thus, the recloser must coordinate with 3 downstream
devices. The Select statement shown in Figure 7.7 uses an OR condition to reflect this
requirement on the recloser device.
132
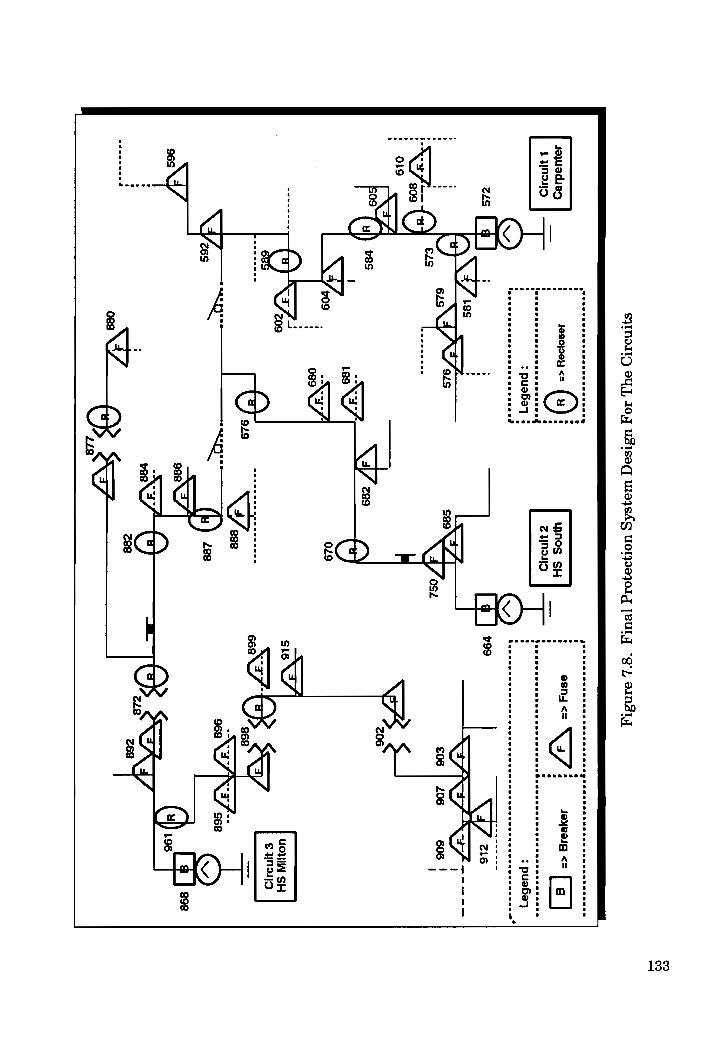
SPINIIID OY],
10. USIsaq
Uleyshg UOTJDa40Ig
[BUI *g*),
ens
UOMIIN SH
€ WNWID
133

In a similar fashion, the Selection Rule Processor analyzes each Protective Object
that is associated with each device location. The Selection Rule Processor then uses the
appropriate SQL Select statement to query the Coordination Table. For this example the
Selection Rule Processor was able to design a coordinated protection scheme from the
Coordination Table for the given switching configurations of the circuits.
The final protection system design for the interconnected circuits is shown in Figure
7.7. Table 7.8 contains relevant data concerning those protective devices that were selected
for Circuit 1 in the final design.
7.6. Conclusions
Chapter 6 of this report presented an expert system for protection system design
applications. In Chapter 7 of this report a specific protection system design for three
interconnected circuits is presented using the developed expert system.
The expert system is able to fully integrate the pertinent data involved in the
protection system design for interconnected radial distribution circuits. The designer is able
to concentrate on the more relevant issues of the overall design, and delegate the
management of large quantities of data to the computer. While it may be an expert system,
the designer must be familiar with the numerous aspects entailed in designing protection
systems. The intent behind the developed expert system is as a planning tool. A tool to
improve the productivity of the protection engineer, not a replacement for the engineer.
134
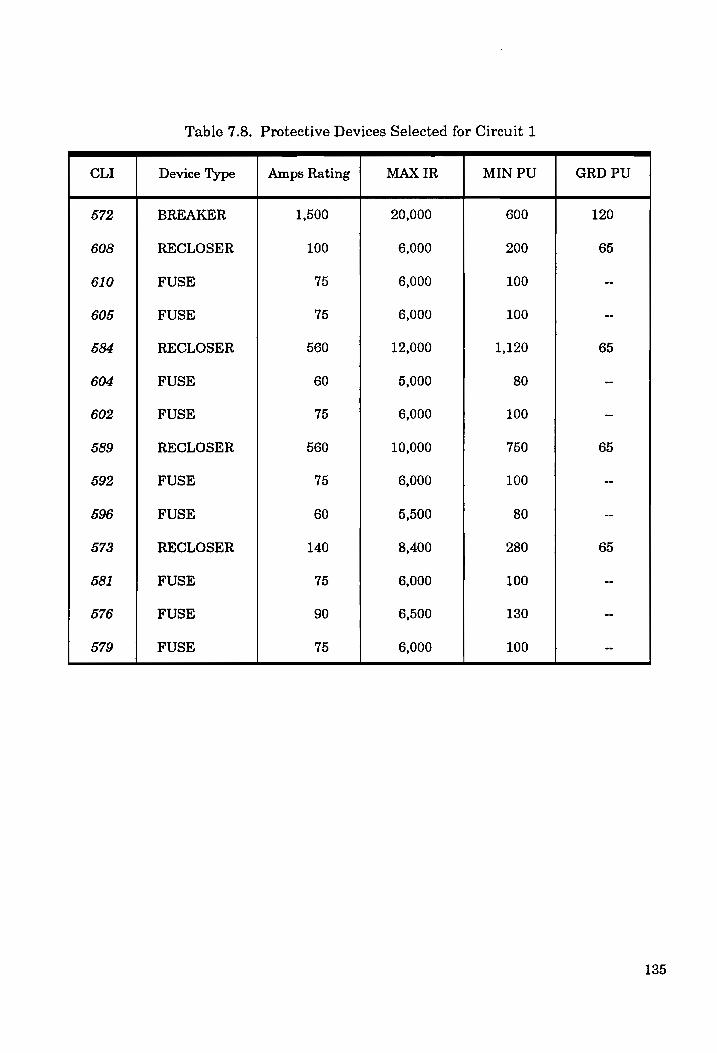
Table 7.8. Protective Devices Selected for Circuit 1
CLI Device Type Amps Rating MAX IR MIN PU GRD PU
572 BREAKER 1,500 20,000 600 120
608 RECLOSER 100 6,000 200 65
610 FUSE 75 6,000 100 --
605 FUSE 75 6,000 100 --
584 RECLOSER 560 12,000 1,120 65
604 FUSE 60 5,000 80 --
602 FUSE 75 6,000 100 --
589 RECLOSER 560 10,000 750 65
592 FUSE 75 6,000 100 --
596 FUSE 60 5,500 80 --
573 RECLOSER 140 8,400 280 65
581 FUSE 75 6,000 100 --
576 FUSE 90 6,500 130 --
579 FUSE 75 6,000 100 --
135

CHAPTER 8
Conclusions and Recommendations
8.1 Contributions
The foundation for this research was based on an IKEE Committee Report
concerning the need for an integrated software system for protection system design that is
clearly stated in Reference 15. Thus, one goal of the research was the design of an expert
system that fulfills, as much as possible, the general requirements and guidelines concerning
protection system design as specified by [15]. The stated general requirements as specified
by the IEEE Committee are as follows:
1) Integrated software system approach,
2) Data stored in a Relation Database Management System, and
3) Graphical User Interface.
This research work has built upon and expanded the research work of Maghdan in
protection system design [16]. However, the research has addressed three critical issues that
were not addressed by Maghdan's work which are given below.
1) The impact of the multiple circuit configurations when considering an
interconnected system of circuits.
2) A method for modeling protective devices that reduces data storage.
3) The impact of cogeneration on the system of interconnected circuits
during fault conditions.
This research has implemented a rule based expert system for protection system
design. The intent was to provide the architectural structure for a software system that
provided the protection system design engineer with the capabilities as outlined by IEEE.
136

The expert system is a design tool not a replacement for the engineer. The major points of
this research were presented to the IEEE PES at the 1993 Summer Meeting [53] and [54].
The main contributions of the research work are summarized below:
* The expert system is an integrated software system . The four functions
in the Inference Engine share data and also produce knowledge for the
Knowledge Base. The Rule Base of the expert system is relatively small
and simple.
* The software system fulfills the three general requirements as outlined
by IEEE in Reference 15.
* The expert system is able to handle multi-directional current flows for a
system of interconnected radial circuits.
* The effects of cogeneration during fault conditions is taken into
consideration by the expert system.
* The protective device model developed for the research is able to
significantly reduce the amount of required data storage by utilizing
two database tables, the Curve and Device Tables, to store the
protective device data.
* The method of implementation of the expert system using C and ESQL
is new approach in the area.
* Since the protective device data is compacted it can be loaded into
computer memory by DANE, and no hard-disk accesses are required to
retrieve this data. Thus, software applications that utilize protective
devices execute faster.
137

* The designer can evaluate alternative design schemes that utilize
various combinations of protective devices by adding and/or removing
devices from the Protective Device and Curve Tables.
8.2. Future Recommendations
Future work pertaining to this research may wish to consider the following areas of
suggestions:
* The modeling of TCC protective device curves as equations that
parallels the method presented in Reference 55. This approach should
reduce the amount of required data storage. In the future, the TCC
data may be more readily available from manufacturers in this form.
An expansion of the Rule Bases, that is based on a conducted survey
involving protection system design engineers from a broad base of
electrical utilities, may lead to more standardized practices in protection
system design.
Methods to address the building the Coordination Table, that reduce the
data storage size requirements.
The effects of permanent faults on the remaining unfaulted portions of
the system when the fault is cleared by a protective device. Ifa single
phase lateral section has a fault cleared, will the unfaulted portion of
the circuit be so severely unbalanced that other protective devices begin
to sense unbalanced load flows as faults? What methods are needed to
correct this situation? The solution to this problem may imply smaller
protection zones, more protective devices in the circuit , or designer
programmable "smart" protective devices.
138
10.
11.
12.
13.
REFERENCES
Distribution-System Protection Manual, McGraw-Edison Power Systems Division, Bulletin 71022, 1971.
I. Matulic and D. Lubkeman, "A Decision Support Approach Considering Reliability Criteria in the Protective Coordination of Distribution Feeders," Electrical Power
Systems Research, 19(1990), pp. 47-56.
J. E. McNabb, "Analysis of Feeder Service Continuity," AIEE Trans. Power Apparatus and Systems, Vol. 80, Part III, August 1961, pp. 458 - 462.
"Distribution System Overcurrent Protection Workshop", Course Notes, McGraw-Edison Power Systems Division, 1979.
AIEE Committee Report, "Reclosing Fuses, Automatic Oil Circuit Reclosers, and
Automatic Reclosing Circuit Breakers in the Distribution Substation," AIEE Trans. Power Apparatus and Systems, Vol. 72, Part III, October 1953, pp. 901 - 911.
AIEE Committee Report, "Co-ordination of Protection and Construction of Distribution Circuits," AIEE Trans. Power Apparatus and Systems, Vol. 73, Part III-B, February 1955, pp. 1609 - 1627.
IEEE Committee Report, "Application of Protective Relays and Devices to Distribution Circuits," IEEE Trans. on Power Apparatus and Systems, Vol. 83, No. 10, October 1964, pp. 1034 - 1040.
IEEE Tutorial Course, "Application and Coordination of Reclosers, Sectionalizers, and Fuses," IEEE Power Engineering Education Committee, Report #80 EH0O157-8-PWR, 1980.
J. D. Langhans and A. E. Ronat, "Protective Devices Coordination via Computer Graphics," IEEE Trans. on Industry Applications, Vol. LA-16, No. 3, May/June 1980, pp. 404 - 412.
A. Khan, "Analysis of Time Varying Load for Minimum Loss Distribution Reconfiguration", Ph. D. Dissertation, Virginia Polytechnic Institute and State University, Blacksburg, VA, 1992.
A. Oka, "Reliability and Restoration Algorithms for Electrical Distribution Systems", Ph. D. Dissertation, Virginia Polytechnic Institute and State University, Blacksburg, VA, 1992.
IEEE, "Intertie Protection of Consumer-Owned Sources of Generation 3 MVA or Less,"
IEEE Power Relaying Committee, Draft Report , 1988.
IEEE Tutorial, "Downed Power Lines Why They Can't Always Be Detected", IEEE Power Engineering Society, Report #PES-DPL3, February 1989.
139

14.
15.
16.
17.
18.
19.
20.
21.
22.
23.
24.
20.
26.
T. Gonen, Electric Power Distribution System Engineering, McGraw-Hill, New York, 1986.
IEEE, "Computer Aided Coordination of Line Protection Schemes," JEEE Power Relaying Committee, Report #90TH0285-7 PWR, 1989.
H. Maghdan-D, "Computer-Aided Protection System Design for Electrical Distribution Systems with Automatic Switches," Ph. D. Dissertation, Tennessee Technological University, Cookeville, TN, 1989.
E. L. Guenzel and W. T. Morris, “Distribution Circuit Protection," AIEE Trans. Power
Apparatus and Systems, Vol. 78, Part III-B, December 1959, pp. 1064 - 1071.
W. H. Johnson and T. J. Meler, "Distribution Circuit Protection for the American
Electric Power Company System," AIEE Trans. Power Apparatus and Systems, Vol. 78, Part III-B, February 1960, pp. 1833 - 1839.
Electrical Transmission and Distribution Reference Book, Westinghouse Electric Corporation, Pittsburgh, PA, Fourth Edition, 1964.
W. H. Kersting, "Distribution System Short Circuit Analysis", paper 900700, Proceedings of the 25th Intersociety Energy Conversion Engineering Conference, Reno, NV, August 1990.
H. W. Mikulecky, "Current-Limiting Fuse with Full-Range Clearing Ability," IEEE Trans. on Power Apparatus and Systems, Vol. PAS-84, No. 12, December 1965, pp. 1107-1116.
R. G. Drawe et al., "The Application of Current-Limiting Fuses to Pad-Mounted URD Systems," JEEE Trans. on Power Apparatus and Systems, Vol. PAS-91, No. 3, May/June 1972, pp. 946-951.
W. H. Huber, "Selection and Coordination Criteria for Current-Limiting Fuses," IEEE Trans. on Industry Applications, Vol. [A-18, No. 6, November/December 1977, pp. 523 - 527.
R. E. Albrecht et al., "Digital Computer Protective Device Coordination Program I - General Program Description," IEEE Trans. on Power Apparatus and Systems, Vol. 83, No. 4, April 1964, pp. 1048-1053.
R. B. Gastineau et al., "Using the Computer to Set Transmission Line Phase Distance and Ground Backup Relays," IEEE Trans. on Power Apparatus and Systems, Vol. 96, No. 2, March/April 1977, pp. 478-484.
D. E. Schultz and S. S. Waters, "Computer-Aided Protection Device Coordination, A Case Study," [EEE Trans. on Power Apparatus and Systems, Vol. PAS-103, No. 11,
November 1984, pp. 3298-3301.
140

27.
28.
29.
30.
31.
32.
33.
34.
35.
36.
37.
38.
39.
M. J. Damborg et al., "Computer Aided Transmission Protection System Design, Part I: Algorithms," IEEE Trans. on Power Apparatus and Systems, Vol. PAS-103, January 1984, pp. 51-59.
M. J. Damborg et al., “Application of Relational Database to Computer-Aided-Engineering of Transmission Protection Systems," IEEE Trans. on Power Systems, Vol. PWRS-1, No. 2, May 1986, pp. 187 - 193.
R. Ramaswami et a]l., "Computer Aided Transmission Protection System Design, Part II: Implementation and Results," IEEE Trans. on Power Apparatus and Systems, Vol. PAS-103, January 1984, pp. 60-65.
R. Ramaswamiet al., “Enhanced Algorithms for Transmission Protection Relay Coordination," JEEE Trans. on Power Delivery, Vol. PWRD-1, No. 1, January 1986, pp. 280-287.
R. Zimering and R. Allen, "Computerization of a Large Relay Setting File," JEEE Trans. on Power Delivery, Vol. PWRD-1, No. 1, January 1986, pp. 135 - 141.
R. H. Cauthen and W. P. McCannon, "The CAPE System: Computer-Aided Protection Engineering," IEEE Computer Applications in Power, Vol. 1, No. 2, April 1988, pp. 30 - 34.
K. A. Brown and J. M. Parker, "A Personal Computer Approach to Overcurrent Protective Device Coordination," IEEE Trans. on Power Delivery, Vol. 3, No. 2, April
1988, pp. 509 - 513.
H. A. Smolleck, "A Simple Method for Obtaining Feasible Computational Models for the Time-Current Characteristics of Industrial Power-System Protective Devices," Electrical Power Systems Research, 2(1979), pp. 65-69.
J. A. Juves et al., "The Concept of Figure of Merit Applied to Protective System Coordination," IEEE Trans. on Power Delivery, Vol. PWRD-1, No. 4, October 1986, pp.
31 - 40.
H. Schildt, Artificial Intelligence Using C, McGraw-Hill, New York, 1987.
R. P. Schulte et al., "Artificial Intelligence Solutions to Power Systems Operating Problems," IEEE Trans. on Power Systems, Vol. PWRS-2, No. 4, November 1987, pp. 920-926.
M. Kezunovic et al., "Expert System Applications to Protection, Substation Control and Related Monitoring Functions," Electrical Power Systems Research, 21(1991), pp.
71-86.
C. J. Hursch and J. L. Hursch, SQL: The Structured Query Language, Tab Books Inc., Blue Ridge Summit, PA, 1988.
141

40.
41.
42.
43.
44.
45.
46.
47.
48.
49
51.
51.
52.
53.
T. Taylor and D. Lubkeman, "Applications of Knowledge-Based Programming to Power Engineering Problems," JEEE Trans. on Power Systems, Vol. 4, No. 1, February 1989, pp. 345-352.
H. W. Hong et al., "Protective Device Coordination Expert System," JEEE Trans. on Power Delivery, Vol. 6, No. 1, January 1991, pp. 359 - 365.
S. R. Mendis et al., "Rule-Based Coordination Program Evaluates Protective Schemes," IEEE Computer Applications in Power, Vol. 4, No. 2, April 1991, pp. 31-36.
R. P. Broadwater et al., “Computer-Aided Protection System Design With Recon- figuration," IEEE Trans. on Power Delivery, Vol. 6, No. 1, January 1991, pp. 260 - 266.
J.C. Thompson and R. P. Broadwater, "Distribution Automation Analysis and
Economic Evaluation Software System," paper 9007001, Proceedings of the 25th Intersociety Energy Conversion Engineering Conference, Reno, NV, August 1990.
R. P. Broadwater et al., "A Distribution Engineering Workstation For Undergraduate and Graduate Education", presented at 1993 IEEE / PES Winter Power Meeting, Columbus, Ohio.
B. W. Kernighan and D. M. Ritchie, The C Programming Language, Prentice Hall, Englewood Cliffs, NJ, 1988.
R. Broadwater, J. Thompson, and T. EB. McDermott, "Pointers and Linked List in
Electric Power Distribution Circuit Analysis," Proceedings of 1991 IEEE PICA Conference, Baltimore, Maryland, May 1991, pp. 16-21.
S. Prata, C++ Primer Plus, Waite Group Press, Mill Valley, CA, 1991.
H. Shaalan, "An Interval Mathematics Approach To Economic Evaluation of Power Distribution Systems", Ph. D. Dissertation, Virginia Polytechnic Institute and State University, Blacksburg, VA, 1993.
R. P. Broadwater et al., "Time Varying Load Analysis To Reduce Distribution System Losses Through Reconfiguration", IEEE Trans. on Power Delivery, Vol. 8, No. 1, January 1993, pp. 294-300.
A. Walker, Knowledge Systems and Prolog, Addison-Wesley, Reading, MA, 1987.
DFA - "Distribution Feeder Analysis" , Arkansas Power and Light Software System (in
house software used by AP&L).
R. P. Broadwater, J. C. Thompson, S. Rahman, A. Sargent, "An Expert System For Integrated Protection Design With Configurable Distribution Circuits: Part I", Paper # 93SM408-5PWRD, presented at 1993 IEEE /PES Summer Power Meeting, Vancouver, B.C., Canada, July 18-22.
142

54.
55.
J.C. Thompson, R. P. Broadwater, S. Rahman, A. Sargent, "An Expert System For Integrated Protection Design With Configurable Distribution Circuits: Part II", Paper # 93SM409-3PWRD, presented at 1993 IEEE /PES Summer Power Meeting, Vancouver,
B.C., Canada, July 18-22.
IEEE Committee Report, "Computer Representation of Overcurrent Relay Characteristics", IEEE Trans. on Power Delivery, Vol. 4, No. 3, July 1989, pp.
1659-1667.
143