an experiment evaluating architectures of software … · 2013-04-24 · an experiment evaluating...
TRANSCRIPT

Master thesis in Applied Information Technology
REPORT NO. 2008:013
ISSN: 1651-4769
Department of Applied Information Technology
An Experiment Evaluating Architectures of
Software Measurement Systems
EVGENY V. SIDENKO
IT University of Göteborg
Chalmers University of Technology and University of Gothenburg
Göteborg, Sweden 2008

An experiment evaluating architectures of software measurement systems
Master thesis
EVGENY VLADIMIROVICH SIDENKO
© EVGENY VLADIMIROVICH SIDENKO, 2008
Report no 2008:013
ISSN: 1651-4769
Department of Applied Information Technology
IT University of Göteborg
Göteborg University and Chalmers University of Technology
P O Box 8718
SE – 402 75 Göteborg
Sweden
Telephone + 46 (0)31-772 4895
Göteborg, Sweden 2008

ABSTRACT A software measurement process helps to collect data in order to
evaluate a software product on a continuous basis. However, the
process can take a considerable amount of time. Project
managers are faced with a decision how many measurements they
can get in a certain amount of time, i.e. performance of a
software measurement tool. This thesis describes a controlled
experiment in academia that was aimed at evaluating
performance of a software measurement tool. The results show
how the architecture of a measurement system affects its
performance. Finally, we can use several architectural strategies
described in the thesis to minimize decrease in performance.
Keywords Software Metrics, Software Measurement Process, Quality
Management, Software Architecture
1. INTRODUCTION A software development company in the telecom domain should
provide competitive products to customers. The main challenges
in the domain are high software quality, cost optimization in
dynamic business environment and acceleration of software
development [1]. From another point of view, increasing demands
for reliability and new services cause constant increases in the
software complexity. In general, software projects are becoming
larger and more complex. Companies should use effective
development and management tools in order to achieve the goals
described above. A unit of a global software/hardware
development company from the Gothenburg region, later on
referred as the company, designed and implemented their
proprietary software measurement systems for project planning
and monitoring purposes. The implementation of software
measurement standards in software applications were investigated
from perspectives of different technologies in [2] and [3]. The
performance and maintainability perspectives of the software
measurement systems have not been investigated in the context of
software architecture.
The master thesis is a part of a software measurement project at
the company. The thesis describes the software measurement
standards and addresses the questions of performance of software
measurement systems at the company.
From a number of interviews with a stakeholder we have found
that the company will structure the measurements and files for the
software measurement system. Software architects are faced with
two decisions: a single file that has as many measurements as
possible or a bundle of measurement files that have one or small
amount of measurements inside. Following these architectural
decisions we have addressed the following research question in
this thesis:
RQ1 How is the performance of a measurement system affected
by the number of files and measurements used?
The research question was posed in the context of the software
architecture of software measurement systems at the company.
Since project managers use the variant number of measurements
and measurement files in the software measurement system, we
divided this research question into two sub-questions:
RQ1.1 How will the increased number of measurements in the
single file affect the system performance?
RQ1.2 How will the increased number of files affect the system
performance?
The structure of the paper is as follows. First, in Section 2 this
thesis describes relevant literature such as measurement standards
and state-of-the-art of software architecture. Next, in Section 3 we
present a measurement information model defined by the
International Organization for Standardization (ISO). Afterwards,
in Section 4 we describe the research method we used in the
thesis. The experiment design is described in Section 5.
Additionally, Section 6 describes the results of the experiment
and Section 7 discusses the results. Finally, Section 8 presents
conclusions.
2. RELATED WORK Software architecture was defined by several sources. In this
thesis we use Fowler’s definition [4]: “Software architecture is the
highest-level breakdown of a system into its parts that is hard to
change late in the project”. Sommerville [5] supplements this
definition as “styles covering the overall system organization,
decomposition and control”.
Software metrics have been analyzed in different contexts in a
theoretical way by Basili [6], Allen [7] and Pfanzagl [8], where
the authors discuss and analyze software metrics as an instrument
for evaluation and estimation in software development process.
Therefore, project managers can use these instruments in their
software projects in order to build a high quality software product.
Woodside [9] investigated the performance changes that occur
when a small-size system is scaled up. The experiment design in
this thesis uses the experiences described by Woodside [9].
The experiment presented in this thesis follows an approach
similar to other studies in software engineering and architecture.
For example, Liu [10] evaluates the performance based on its
architecture and technology analysis. Similar to our experiment, it

is an evaluation of the performance changes that occur in the
software systems with different software architectures.
Basili [11] evaluates measurements in the software development
process and how the measurements help to monitor the quality of
the final product. The question of the quality of software process
was recognized by the International Organization for
Standardization (ISO). The organization published a set of related
standards. We use these standards as a reference architecture of
measurement systems in this thesis.
Following the international standards, Marzullo and Xexeo [3]
described a project assessment and tracking tool. The latter is
based on automation of software measurement process for project
managers. Additionally, Johansson et al. [2] described the
software measurements system at the company based on the
standard ISO/IEC 15939:2002 [12].
The papers above describe how different data sources can be
integrated together and how visualize the results. However, the
papers [2], [3] do not cover performance perspective of the
software measurements systems. Following the research question
of software measurements system at the company, we conducted
a study in order to measure the performance of the software
measurements system under an increased number of
measurements and measurement files.
2.1 Software measurement The area of software engineering is related to other disciplines.
The Institute of Electrical and Electronics Engineers (IEEE)
described professional development activities of software
engineers in the “Guide of the Software Engineering Body of
Knowledge” [13]. Following this guide, a successful software
engineer should have knowledge in eight related disciplines.
Figure 1. Disciplines related to the Software Engineering [14].
Each related discipline is depicted in Figure 1. Three of them,
namely, project management, quality management and systems
engineering have related standards described below.
2.2 Project management According to the Project Management Institute [15], a project
management is the application of knowledge, skills, tools, and
techniques to project activities in order to meet project
requirements. The IEEE has recognized the importance of project
management and published the standard adopted for the Software
Engineering discipline – IEEE Standard 1490:2003 [16]. The
IEEE 1490:2003 standard requires an experience in project
management, i.e. managers are responsible to choose what
process is appropriate for any given project [17].
2.3 Quality management An international standard in quality management, ISO 9001 is not
aimed at software development, but specifies general principles
that can be applied for different industries that design, develop
and maintain products. The quality assurance procedures are
documented in quality manual that defines the quality process in
an organization. The manual is used to develop a quality plan for
every project. However, the standard does not define the quality
processes in a company. Sommerville [5] argues that the standard
is not concerned with ensuring that the processes reflect the best
practice, but gives the definition of processes to be used.
2.4 Software engineering The two organizations most relevant to software engineering, the
International Electrotechnical Commission (IEC) and the
International Organization for Standardization (ISO), formed a
Joint Technical Committee (JTC). The latter published the
standard of the processes used across the entire life cycle of
software – ISO/IEC 12207.0 [18]. Although many researches
spoke of the need for quantitative measurement of software
processes, measurement was not yet widely described in the
standard [14].
In 1991, ISO has published the standard on the terminology for
the quality characteristics for software products – ISO/IEC 9126
[19]. It presents a common lexicon and guidance for:
1. Quality models – ISO/IEC 9126-1 [20];
2. External metrics – ISO/IEC TR 9126-2 [21];
3. Internal metrics – ISO/IEC TR 9126-3 [22];
4. Quality in use metrics – ISO/IEC TR 9126-4 [23].
ISO has now recognized a need for further improvement, as a
result of changes in the field of information technology [24].
Finally, in 2002 JTC produced the fundamental standard in
software measurement field: ISO/IEC 15939:2002. The latter
complements the ISO/IEC 12207.0, ISO/IEC 9126 standards and
owes much from Goal-Quality-Metric framework [6].
2.5 Goal Question Metric framework GQM approach is a mechanism for defining and interpreting
operational, measurable goals [25]. It is based on the assumption
that measurement process should be a goal-oriented that helps to
decide what to measure. The GQM approach implies that the
process is defined from the top to the bottom and has a
hierarchical structure. The top of the structure is a goal. The latter
is refined in set of questions that result into metrics (Figure 2).
Figure 2. GQM framework, adapted from [26].
2.6 Life cycle process Shewhart [27] described a life cycle process as a four step newer
ending cycle (Figure 3). Since the cycle has no end, it can be
considered as a model for continuous improvement.
ISO adapted the life cycle process for software quality
improvement in ISO/IEC 12207.0. Whereas the standard ISO/IEC

15939:2002 supplements ISO/IEC 12207.0, it uses the process
depicted in Figure 4.
Figure 3. Plan-Do-Check-Act cycle, adapted from [27].
The life cycle process is a set of activities and tasks. Moreover,
ISO defines a process for defining measures appropriate to the
information needs of a particular project [14]. Figure 4 discloses
the relationships of the activities and depicts the process in the
form of “Plan-Do-Check-Act” (PDCA) cycle.
Figure 4.The life cycle process, adapted from [13].
The activities (ovals) form a never ending cycle for improvement.
The activity “Establish Process Infrastructure” involves the
following actions: gaining management commitment, identifying
resources, and designating responsibilities. The objective point of
the “Planning” activity is to identify the business goals.
Afterwards, an improvement plan can be established. The
objective of the “Process Implementation” activity is the plan,
that includes tool deployment and staff training [14]. The
“Process Evaluation” activity is a set of actions in order to adjust
the plans. The last element in the figure is the “Process
Experience Base” rectangle. This is a repository of the best
practices from improvement activities.
3. MEASUREMENT INFORMATION
MODEL A measurement information model ISO/IEC 15939:2002 [12]
depicted in Figure 5 provides a framework for the software
measurement system at the company. Firstly, the model specifies
a conceptual model, where the process of the measurement is
driven by an information need. The information need is what the
stakeholder of the measurement system wants to know [2]. A
stakeholder is an individual or an organization that sponsors
measurements and provides data or is a user of the measurement
results [12]. Taking into the account the information needs, we
can form a measurement plan, where measurement is a set of
operations in order to determine the value of the measured entity
[12]. The measurement plan helps us to answer the following
questions: (a) what to measure, (b) where the objects to be
measured are, (c) how to measure these objects, (d) to where
results must be delivered and (e) when measures might be done
[28]. The plan should be provided by measurement tools in order
to collect and present data to the stakeholders. Section 3 covers
the measurement system at the company, whereas in this section
we describe the standard ISO/IEC 15939:2002, a basement for the
software measurements tool.
The standard ISO/IEC 15939:2002 describes the measurement
process. The first step in the measurement process is a choice of
the information needs. Based on the information needs, we can
form the problem domain and choose the set of entities to
measure, such as a software project or a development process.
Each entity has one or several attributes, i.e. time and cost. The
standard ISO/IEC 15939:2002 defines an attribute as a property
or characteristic of an entity that can be distinguished
quantitatively or qualitatively by human or automated means [29].
Hence, using a scale and a measurement unit, we could assign a
value for each attribute and establish a base measure.
Consequently, we obtain a base measure (BM) which is a result
of quantification of an attribute.
Figure 5. The measurement information model ISO/IEC
15939:2002, adapted from [14].
Moreover, we can create mathematical formulas and establish
high-level measures. The formula is specified in the ISO/IEC
15939:2002 standard as a measurement function. Each
measurement function is a calculation, where an input is several
base measures and the result of the calculation is a derived
measure (DM).
Finally, we use a quantitative interpretation in order to present the
results of the measurement to the stakeholders. The interpretation
is based on decision criteria where intervals of values are defined.
Based on the discrete value from a derived measure and decision
criteria, an indicator can be calculated. An indicator is a visual
interpretation of results to the user. For instance, first interval of
values set a “low level” indicator, the second interval establishes
an “acceptable level” indicator, whereas the third interval assigns
a “high level” indicator. The “low level” indicator shows a bad
result, whereas the “high level” indicator stands for a good result.
3.1 Defect report example The text below provides a defect report example suggested by
Johansson et al. [2]. The defect report example is based on the
ISO/IEC 15939:2002 software measurement model and the
measurement process defined above. The measurement process is
driven by an information need of software quality. A stakeholder
is interested in a proportion between development and debugging
costs. If the error recovery cost exceeds a threshold, the project

needs to take an action. Table 1 presents concepts of the example
adapted from [2].
The measurement process is driven by stakeholders. The
stakeholders in the example are project managers, who are
interested in the cost of defect reports. The entity and measurable
concept in the example are the budget deviation, whereas
attributes are: a number of defect reports, the average cost of the
single defect report and budget of the project. The attributes are
chosen by experienced developers of the measurement system at
the company. We converted the attributes to the quantitative
values in order to used the values in mathematical calculations.
Further, we use multiple quantitative values in calculations for an
acquisition of derived measures. The measurement function in the
example is a percentage of defects in the project. Finally,
applying an analysis model the following indicators are collected
from the derived measures:
• a green indicator - for values of derived measures below
1%;
• a yellow indicator - for values in the interval between
1% and 3%;
• a red indicator - for the remaining data [2].
Table 1. A defect reports measurement system [2]
Concept Definition
Information
Need
How much is the cost of defect reports
related to the project budget?
Measurable
Concept
Budget deviation (budget is fixed,
project cost on the other hand is
dynamic)
Entity Budget deviation
Attributes 1. The project related defect reports
2. Cost of one defect report in the project
3. Budget of the project
Measurement
Method
1. Count total number of defect reports
2. Calculate the number of hours per
defect report based on data from
previous projects [cost]
3. State the budget of the project (no
need to calculate, it’s only a number)
Base measures 1. NoD – Number of Defects
2. DC – Defect Cost
3. PB – Project Budget
Measurement
Function
((NoD times DC) divided by PB) in
percent
Indicator Red/Yellow/Green
Interpretation 1. Red indicator: Situation is critical.
An action is necessary.
2. Yellow indicator: “Moderate”
actions are necessary to avoid
budget overrun and time plan
delays.
3. Green indicator: The situation is in
accordance with a plan. No action is
necessary.
The example demonstrates that indicators could be concerned
with several measurements. The measurements should be
carefully selected with project managers in order to reach a high
accuracy in estimations.
From the example above we could conclude that the measurement
process answers the stakeholder’s question related to the cost of
the defect reports. For instance, if the cost is higher than planned,
the indicator would inform project managers about budget
problems in the project. As a result, the project managers could
take an action on the early stage in order to remain within a
budget.
4. RESEARCH METHOD In this section we describe the research method we used. Research
strategies for the master thesis are an exploratory single case
study and an off-site experiment.
The case in the case study is measurement files that are used in
the software measurement process. In the case study we use an
assumption that the software measurement system at the company
uses multiple files in the measurement process.
We use several sources in the data collection process:
documentary information, physical artifacts and hand-written
notes from meetings with a stakeholder.
Documentary information is based on the published paper form
Johansson et al. [2]. The paper described the current software
measurement systems at the company.
Another important component of the case study is the physical
artifact. It is a prototype of a software measurement system. The
prototype has the same functionality and is built on the same
principles as the measurement systems used at the company. The
compiled code has been prepared specially for the master thesis.
Finally, notes were collected from a number of meetings with the
stakeholder. The notes are a result of the investigator’s interview.
Every note is a handwritten list with a summary from the meeting.
Afterwards, the notes were assembled in the diary. The notes
helped to pose the study question. This strategy gave an important
feedback from the stakeholders and formed future steps in the
research.
Several sources estimated performance of software systems.
According to a set of experiments performed by Woodside [9],
increased workload results in a drop of system performance. We
executed an experiment with a prototype system in order to verify
it.
5. EXPERIMENT DESIGN In this chapter, we present a description of the experiment in the
laboratory environment. According to Wohlin [30], the objective
of the experiment is a manipulation of one or more variables in
order to control all other variables. Section 5.1 covers the design
of the experiment. Sections 5.2 and 5.3 cover independent and
dependent variables accordingly. Section 5.4 describes how the
experiment was performed. Section 5.5 describes hypothesis in
the experiment. Section 5.6 covers measurement instruments we
used in the experiments. Additionally, Section 5.7 describes
measurement objects. Section 5.8 presents treatments in the
experiment. Section 5.9 covers methods of statistical data
analysis. Finally, Section 5.10 describes an experimental setup.
5.1 Definition of the experiment The objective of the experimental study is the differences in the
system performance for different system configurations (Section
5.4). In order to support the improvement in the best possible
way, it is important to know what system performance we could
expect. Hence, the experiment is motivated by a need to
understand how the software measurement system could be scaled
in the future.
In the laboratory experiment we increased the number of
measurements and measurement files. Afterwards, we measured
performance of the software measurement system for:
• a growing number of measurements in the single file;
• a growing number of measurement files.
Analyzing the results of the experiment, we can conclude if the
increased number of measurements and measurement files affects
the system performance.
We defined the goal of the experiment in compliance with
Goal/Question/Metric template [31]. According to this template,
we summarized the experiment in the following way: “The goal is
to analyze a prototype of software measurement systems for the
purpose of evaluation with respect to its performance from the
point of view of software architect in the context of software
architecture”.
The experiment was done off-line at IT University because the
company infrastructure is closed for the experiments. Moreover,
using industry professionals at the industry is impossible in the
current master thesis. We expect that the result of the experiment
will demonstrate the prototype performance of the software
measurement system. The prototype has the same core
functionality and is build on the same principles as the software
measurement systems at the company, which makes the general
results valid to industrial contexts.
5.2 Independent variables The independent variables are those that I can control in the
experiment [30]. The independent variables are the following:
ni – the number of indicators
fi – the number of files in which the indicators are defined
ndm – number of derived measures
fdm – the number of files in which the derived measures are
defined
nbm – number of base measures
fbm – the number of files in which the base measures are defined
5.3 Dependent variables Dependent variable is one that we want to study to see the effect
of changes in the independent variables [30]. The dependent
variable for the experiment is calculation time (CT).
5.4 Description of the experiment The stakeholder emphasized the importance of CT for the
growing number of measurements and measurement files. From
the interview with a stakeholder we agreed on two sections of the
experiment.
First section
In the first section of the experiment, we measured calculation
time for a growing number of measurements in a single file.
Measurements in the experiment are base measures (BMs) and
derived measures (DMs). Base measures are obtained in
accordance with the measurement information model described in
Section 3. Derived measures are calculated based on
mathematical formulas where arguments are base measures. An
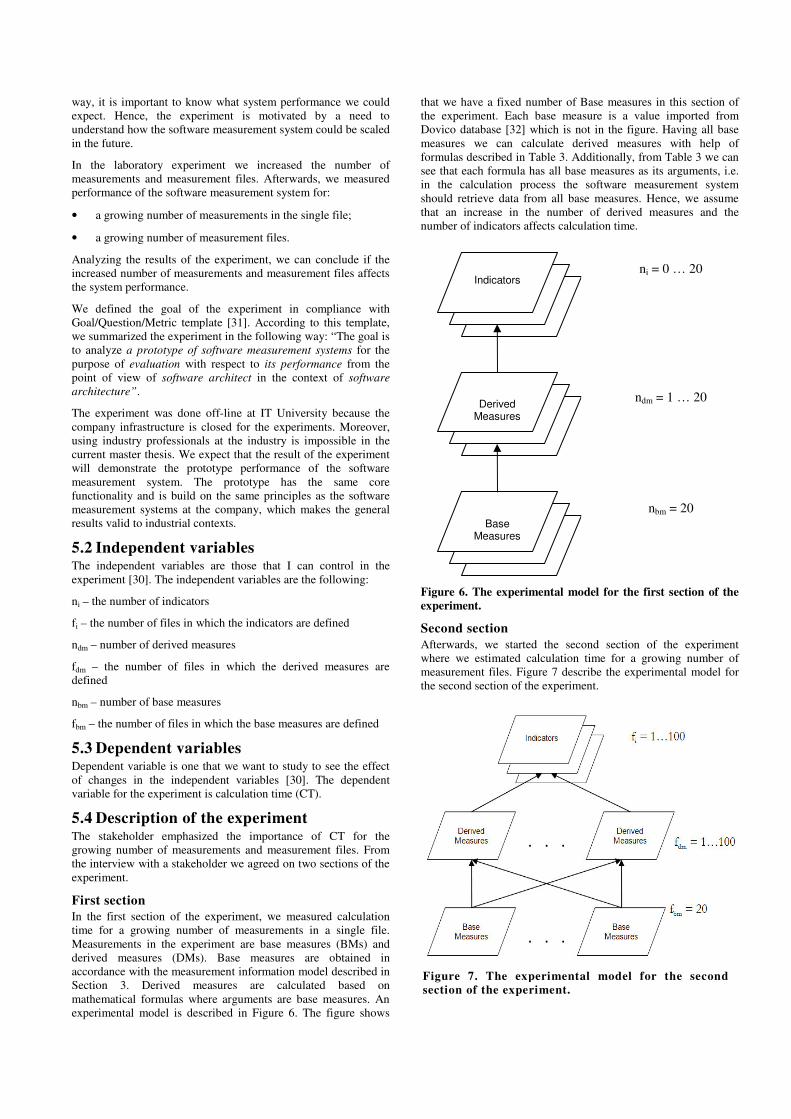
experimental model is described in Figure 6. The figure shows
that we have a fixed number of Base measures in this section of
the experiment. Each base measure is a value imported from
Dovico database [32] which is not in the figure. Having all base
measures we can calculate derived measures with help of
formulas described in Table 3. Additionally, from Table 3 we can
see that each formula has all base measures as its arguments, i.e.
in the calculation process the software measurement system
should retrieve data from all base measures. Hence, we assume
that an increase in the number of derived measures and the
number of indicators affects calculation time.
Figure 6. The experimental model for the first section of the
experiment.
Second section
Afterwards, we started the second section of the experiment
where we estimated calculation time for a growing number of
measurement files. Figure 7 describe the experimental model for
the second section of the experiment.
Indicators
Derived Measures
Base Measures
ni = 0 … 20
ndm = 1 … 20
nbm = 20
Figure 7. The experimental model for the second
section of the experiment.

In the first step of the experiment we made 20 files with base
measures. Each file has a single base measure.
In the second step of our experiment we produced 100 files with
derived measures. Each file with derived measures has a single
derive measure. Moreover, each derived measure is calculated
based on 20 base measures. Table 3 shows calculation formulas
for the first 20 derived measures.
In the third step of our experiment we built 100 files with
indicators where the first file has only one indicator. The last file
with indicators has all 100 indicators.
Finally, in the fourth step of our experiment we estimated
calculation time for each file with indicators.
Since we have a direct dependence between a number of
indicators and a number of derived measurement files, the first
file with an indicator opens only a single file with derived
measures. However, the last file with indicators opens 100 files
with derived measures. Therefore, from the second section of the
experiment we can measure how the number of files affects CT.
5.5 Hypothesis A null hypothesis, H0: Mean time for calculations is the same for
all configurations. We divided this hypothesis in three sub-
questions:
H0A: µ1 = µ 2 = ... = µ 100, i.e. mean calculation time is the same
for different number of files.
Where µ 1… µ 100 are mean calculation time for treatment 1 to
100.
H0B: µ 101 =… = µ 140, i.e. mean calculation time is the same for
different number of measures.
Where µ 101 … µ 140 are mean calculation time for treatment
101 to 140.
H0C: µ 141 = … = µ 160, i.e. mean calculation time is the same
for different number of indicators.
Where µ 141 … µ 160 are mean calculation time for treatment
141 to 160.
H1A: µ 1 ≠ µ 2 ≠ ... ≠ µ 100, i.e. mean calculation time varies for
different number of files.
Where µ 1… µ 100 are mean calculation time for treatment 1 to
100.
H1B: µ 101 ≠… ≠ µ 140, i.e. mean calculation time varies for
different number of measures.
Where µ 101 … µ 140 are mean calculation time for treatment
101 to 140.
H1C: µ 141 ≠ … ≠ µ 160, i.e. mean calculation time varies for
different number of indicators.
Where µ 141 … µ 160 are mean calculation time for treatment
141 to 160.
5.6 Measurement instruments Calculation time has been calculated with help of Visual Basic for
Applications. Figure 8 shows a fragment of the worksheet with
different configurations. Each row presents CT of the single
configuration. We calculated CT five times for each
configuration. Afterwards, mean time is calculated based on ten
measurements (T1, … , T10) for the first section of the
experiment and five measurements (T1, … , T5) for the second
section of the experiment.
5.7 Measurement objects The following measurement objects are specified in the current
experiment:
• A base measure is an amount of hours specified for the task.
The data are derived from Dovico Timesheet database [32].
Dovico Timesheet is a project management application.
Managers can control tasks assigned for projects, time of
each task and expense of projects with Dovico Timesheet
application. Dovico Timesheet is based on MSSQL database.
Figure 9 presents a screenshot of the database. We use the
standard Excel data integration, an active link, in order to
build a real-time automated data synchronization between
Excel tables and MSSQL database. Table 2 shows all base
measures we used in the experiment from Dovico Timesheet
database.
Table 2. The base measures from Dovico Timesheet database
Number ID Value
BM1 DataEntry 22
BM2 Specifications 21
BM3 ConceptPlans 21
BM4 InitialDesign 22
BM5 WebMeeting 7
BM6 Email 7
BM7 Teaching 5
BM8 Installation 13
BM9 Development 10
BM10 Filing 24
BM11 Phone 10
BM12 PM 2
BM13 SickTime 32
BM14 Vacation 80
BM15 Implementation 8
BM16 Surveying 16
BM17 GraphicDesign 15
BM18 ProcessValidation 64
BM19 Research 7
BM20 Assessment 15
• A derived measure is calculated with help of mathematical
formula in MS Excel. Table 3 describes all 20 derived
measures and their mathematical formulas.
Table 3. The derived measures and formulas
ID Formula
DataEntryRate (BM1/(BM1+...BM20))*100
SpecRate (BM2/(BM1+...BM20))*100
ConceptPlansRate (BM3/(BM1+...BM20))*100
InitialDesignRate (BM4/(BM1+...BM20))*100
WebMeetingRate (BM5/(BM1+...BM20))*100
EmailRate (BM6/(BM1+...BM20))*100
TeachingRate (BM7/(BM1+...BM20))*100
InstallationRate (BM8/(BM1+...BM20))*100
DevelopmentRate (BM9/(BM1+...BM20))*100
FilingRate (BM10/(BM1+...BM20))*100
PhoneRate (BM11/(BM1+...BM20))*100
PMRate (BM12/(BM1+...BM20))*100
SickTimeRate (BM13/(BM1+...BM20))*100
VacationRate (BM14/(BM1+...BM20))*100
ImplementationRate (BM15/(BM1+...BM20))*100
SurveyingRate (BM16/(BM1+...BM20))*100
GraphicDesignRate (BM17/(BM1+...BM20))*100
ProcessValidationRate (BM18/(BM1+...BM20))*100
ResearchRate (BM19/(BM1+...BM20))*100
AssessmentRate (BM20/(BM1+...BM20))*100

An indicator is a color visualization of a derived measure. Each
indicator is corresponded to the single derived measure and
calculated based on the Table 4.
Table 4. The calculation table for indicators (analysis model)
Color Lower bound Upper bound
Red 5 10
Yellow 3 5
Green 1 3
White 10 100
Black -100 -10
Orange -1 0
Magenta -5 -1
Cyan -10 -5
Figure 9. A screenshot from Dovico Timesheet.
5.8 Treatments We use the following treatments in the experiment:
• the number of base measures = 1…20;
• the number of derived measures = 1…20;
• the number of indicators = 0…100;
• the number of files with base measures = 1…20;
• the number of files with derived measures = 1… 100;
• the number of files with indicators = 0…100.
Appendix A presents the subset of tested combinations in the first
section of the experiment. In order to minimize an experimental
error, each experiment setting has been measured ten times for
statistical accuracy.
Afterwards, we measured calculation time with an increased
number of measurement files, see Section 5.3. Appendix B
demonstrates the subset of tested combinations in the second
section of the experiment. We measured calculation time for each
experiment setting five times in the second section of the
experiment. The results of the trial are described in Appendix C.
5.9 Methods of data analysis In the first section of the experiment we measured each system
configuration ten times and calculated the arithmetic mean as:
∑=
=
10
1
*10
1
i
ixx
In the second section of the experiment we measured each system
configuration five times and calculated the arithmetic mean as:
∑=
=
5
1
*5
1
i
ixx
Additionally, we use analysis of variance method (ANOVA) [33]
and SPSS tool [34].
5.10 Experimental setup The following hardware configuration is used during the
experiment:
CPU: Intel Core Duo 1.6 GHz;
RAM: 2 GB;
From a task manager we measured the CPU load on the
experiment system.
Base CPU load (average over 10 minutes): 5%; measured when
the system is idle;
Peak CPU load (peak over 10 minutes): 20%; measured when the
system is idle;
The system CPU utilization under the experiment in the peak is
40%.
Figure 8. A screenshot with results in MS Excel.
6. RESULTS For the first section of the experiment we show the dependency
between variables: calculation time vs. number of derived
measures/indicators.
Time vs. derived measures Figure 10 shows how calculation time depends on the number of
derived measures. Additionally, Table 5 shows minimal, maximal
and mean value for each measurement. From Figure 10 and Table
5, we could see that calculation time grows from 9 seconds for a
single derived measure up to 12 seconds for twenty derived
measures. Hence, whereas the number of derived measures is
increased by 2000%, calculation time is enhanced by 33%.
Table 5. Minimum, maximum and mean values
Number of
DMs
Min value Max value Mean value
1 00:09 00:11 00:09
2 00:09 00:13 00:11
3 00:10 00:15 00:11
4 00:10 00:11 00:10
5 00:11 00:15 00:13
6 00:12 00:17 00:14
7 00:11 00:18 00:13
8 00:10 00:12 00:11
9 00:11 00:13 00:12
10 00:11 00:12 00:11
11 00:11 00:16 00:13
12 00:11 00:12 00:11
13 00:11 00:12 00:12
14 00:11 00:12 00:11
15 00:11 00:14 00:12
16 00:11 00:13 00:12
17 00:11 00:13 00:12
18 00:11 00:13 00:12
19 00:11 00:14 00:12
20 00:11 00:17 00:12
The results of Anova test (Table 6) show that we can reject the
H0B hypothesis.
Table 6. Anova test for time vs. number of derived measures
Variable df F Significance
level
H0B accepted
Number of
derived
measures
19 6.234 p<0.0001 No
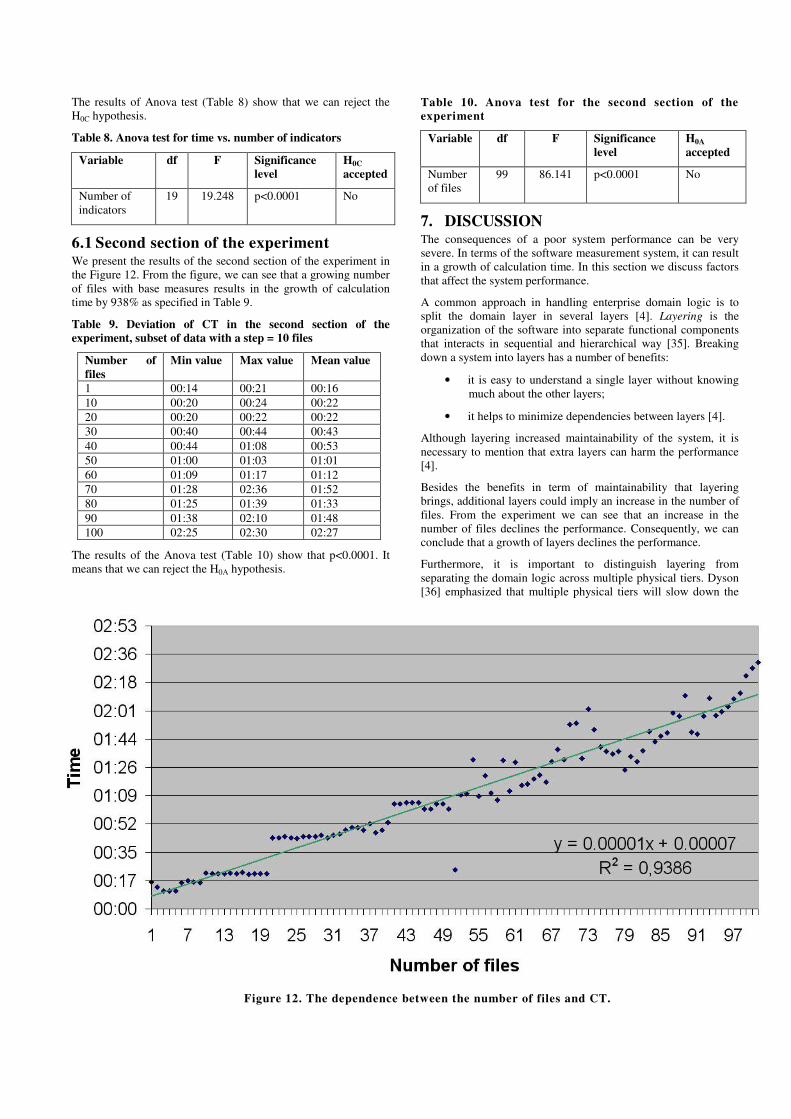
Time vs. indicators The second section of the experiment shows how calculation time
depends on a number of indicators. Table 7 shows minimal,
maximum and mean values for each measurement. As we
mentioned earlier, each measurement of calculation time was
done by 10 times. Figure 11 shows that calculation time grows
from 13 seconds for a single indicator up to 18 seconds for 20
indicators.
Figure 11. The dependence between the number of indicators
and CT.
The figure shows that since the number of indicators in the single
file is increased by 2000%, calculation time went up by 38%.
Table 7. Minimum, maximum and mean values
Number of indicators Min value Max value Mean value
1 00:11 00:15 00:13
2 00:13 00:17 00:15
3 00:14 00:15 00:14
4 00:14 00:15 00:14
5 00:14 00:15 00:14
6 00:14 00:16 00:15
7 00:14 00:17 00:15
8 00:14 00:15 00:14
9 00:14 00:16 00:15
10 00:14 00:17 00:15
11 00:14 00:16 00:15
12 00:14 00:17 00:16
13 00:15 00:16 00:16
14 00:15 00:17 00:16
15 00:15 00:16 00:16
16 00:14 00:17 00:16
17 00:15 00:17 00:16
18 00:15 00:19 00:17
19 00:17 00:19 00:18
20 00:12 00:18 00:14
Figure 10. The dependence between the number of
derived measures and CT.
The results of Anova test (Table 8) show that we can reject the
H0C hypothesis.
Table 8. Anova test for time vs. number of indicators
Variable df F Significance
level
H0C
accepted
Number of
indicators
19 19.248 p<0.0001 No
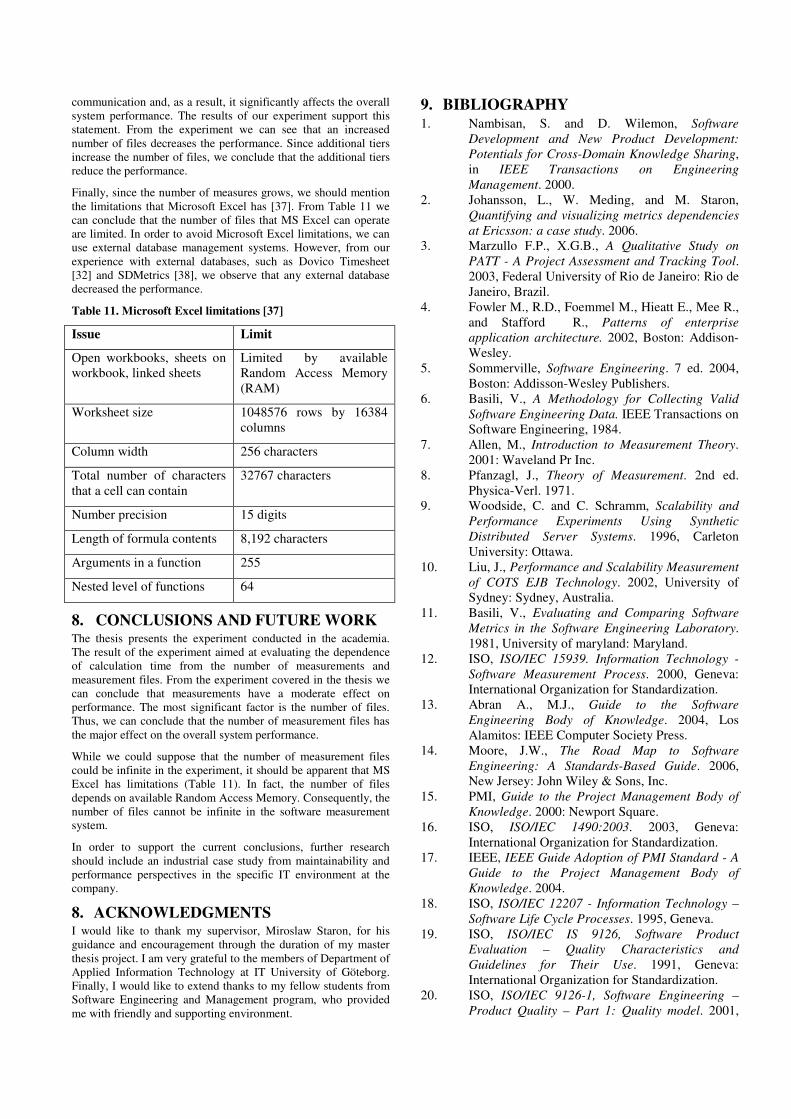
6.1 Second section of the experiment We present the results of the second section of the experiment in
the Figure 12. From the figure, we can see that a growing number
of files with base measures results in the growth of calculation
time by 938% as specified in Table 9.
Table 9. Deviation of CT in the second section of the
experiment, subset of data with a step = 10 files
Number of
files
Min value Max value Mean value
1 00:14 00:21 00:16
10 00:20 00:24 00:22
20 00:20 00:22 00:22
30 00:40 00:44 00:43
40 00:44 01:08 00:53
50 01:00 01:03 01:01
60 01:09 01:17 01:12
70 01:28 02:36 01:52
80 01:25 01:39 01:33
90 01:38 02:10 01:48
100 02:25 02:30 02:27
The results of the Anova test (Table 10) show that p<0.0001. It
means that we can reject the H0A hypothesis.
Table 10. Anova test for the second section of the
experiment
Variable df F Significance
level
H0A
accepted
Number
of files
99 86.141 p<0.0001 No
7. DISCUSSION The consequences of a poor system performance can be very
severe. In terms of the software measurement system, it can result
in a growth of calculation time. In this section we discuss factors
that affect the system performance.
A common approach in handling enterprise domain logic is to
split the domain layer in several layers [4]. Layering is the
organization of the software into separate functional components
that interacts in sequential and hierarchical way [35]. Breaking
down a system into layers has a number of benefits:
• it is easy to understand a single layer without knowing
much about the other layers;
• it helps to minimize dependencies between layers [4].
Although layering increased maintainability of the system, it is
necessary to mention that extra layers can harm the performance
[4].
Besides the benefits in term of maintainability that layering
brings, additional layers could imply an increase in the number of
files. From the experiment we can see that an increase in the
number of files declines the performance. Consequently, we can
conclude that a growth of layers declines the performance.
Furthermore, it is important to distinguish layering from
separating the domain logic across multiple physical tiers. Dyson
[36] emphasized that multiple physical tiers will slow down the
Figure 12. The dependence between the number of files and CT.
communication and, as a result, it significantly affects the overall
system performance. The results of our experiment support this
statement. From the experiment we can see that an increased
number of files decreases the performance. Since additional tiers
increase the number of files, we conclude that the additional tiers
reduce the performance.
Finally, since the number of measures grows, we should mention
the limitations that Microsoft Excel has [37]. From Table 11 we
can conclude that the number of files that MS Excel can operate
are limited. In order to avoid Microsoft Excel limitations, we can
use external database management systems. However, from our
experience with external databases, such as Dovico Timesheet
[32] and SDMetrics [38], we observe that any external database
decreased the performance.
Table 11. Microsoft Excel limitations [37]
Issue Limit
Open workbooks, sheets on
workbook, linked sheets
Limited by available
Random Access Memory
(RAM)
Worksheet size 1048576 rows by 16384
columns
Column width 256 characters
Total number of characters
that a cell can contain
32767 characters
Number precision 15 digits
Length of formula contents 8,192 characters
Arguments in a function 255
Nested level of functions 64
8. CONCLUSIONS AND FUTURE WORK The thesis presents the experiment conducted in the academia.
The result of the experiment aimed at evaluating the dependence
of calculation time from the number of measurements and
measurement files. From the experiment covered in the thesis we
can conclude that measurements have a moderate effect on
performance. The most significant factor is the number of files.
Thus, we can conclude that the number of measurement files has
the major effect on the overall system performance.
While we could suppose that the number of measurement files
could be infinite in the experiment, it should be apparent that MS
Excel has limitations (Table 11). In fact, the number of files
depends on available Random Access Memory. Consequently, the
number of files cannot be infinite in the software measurement
system.
In order to support the current conclusions, further research
should include an industrial case study from maintainability and
performance perspectives in the specific IT environment at the
company.
8. ACKNOWLEDGMENTS I would like to thank my supervisor, Miroslaw Staron, for his
guidance and encouragement through the duration of my master
thesis project. I am very grateful to the members of Department of
Applied Information Technology at IT University of Göteborg.
Finally, I would like to extend thanks to my fellow students from
Software Engineering and Management program, who provided
me with friendly and supporting environment.
9. BIBLIOGRAPHY 1. Nambisan, S. and D. Wilemon, Software
Development and New Product Development:
Potentials for Cross-Domain Knowledge Sharing,
in IEEE Transactions on Engineering
Management. 2000.
2. Johansson, L., W. Meding, and M. Staron,
Quantifying and visualizing metrics dependencies
at Ericsson: a case study. 2006.
3. Marzullo F.P., X.G.B., A Qualitative Study on
PATT - A Project Assessment and Tracking Tool.
2003, Federal University of Rio de Janeiro: Rio de
Janeiro, Brazil.
4. Fowler M., R.D., Foemmel M., Hieatt E., Mee R.,
and Stafford R., Patterns of enterprise
application architecture. 2002, Boston: Addison-
Wesley.
5. Sommerville, Software Engineering. 7 ed. 2004,
Boston: Addisson-Wesley Publishers.
6. Basili, V., A Methodology for Collecting Valid
Software Engineering Data. IEEE Transactions on
Software Engineering, 1984.
7. Allen, M., Introduction to Measurement Theory.
2001: Waveland Pr Inc.
8. Pfanzagl, J., Theory of Measurement. 2nd ed.
Physica-Verl. 1971.
9. Woodside, C. and C. Schramm, Scalability and
Performance Experiments Using Synthetic
Distributed Server Systems. 1996, Carleton
University: Ottawa.
10. Liu, J., Performance and Scalability Measurement
of COTS EJB Technology. 2002, University of
Sydney: Sydney, Australia.
11. Basili, V., Evaluating and Comparing Software
Metrics in the Software Engineering Laboratory.
1981, University of maryland: Maryland.
12. ISO, ISO/IEC 15939. Information Technology -
Software Measurement Process. 2000, Geneva:
International Organization for Standardization.
13. Abran A., M.J., Guide to the Software
Engineering Body of Knowledge. 2004, Los
Alamitos: IEEE Computer Society Press.
14. Moore, J.W., The Road Map to Software
Engineering: A Standards-Based Guide. 2006,
New Jersey: John Wiley & Sons, Inc.
15. PMI, Guide to the Project Management Body of
Knowledge. 2000: Newport Square.
16. ISO, ISO/IEC 1490:2003. 2003, Geneva:
International Organization for Standardization.
17. IEEE, IEEE Guide Adoption of PMI Standard - A
Guide to the Project Management Body of
Knowledge. 2004.
18. ISO, ISO/IEC 12207 - Information Technology –
Software Life Cycle Processes. 1995, Geneva.
19. ISO, ISO/IEC IS 9126, Software Product
Evaluation – Quality Characteristics and
Guidelines for Their Use. 1991, Geneva:
International Organization for Standardization.
20. ISO, ISO/IEC 9126-1, Software Engineering –
Product Quality – Part 1: Quality model. 2001,

Geneva: International Organization for
Standardization.
21. ISO, ISO/IEC TR 9126-2, Software Engineering –
Product Quality - Part 2: External Metrics. 2003,
Geneva: International Organization for
Standardization.
22. ISO, ISO/IEC TR 9126-3, Software Engineering –
Product Quality - Part 3: Internal Metrics. 2003,
Geneva: International Organization for
Standardization.
23. ISO, ISO/IEC TR 9126-4, Software Engineering –
Product Quality – Part 4: Quality in Use Metrics.
2004, Geneva: International Organization for
Standardization.
24. Azuma, M., SQuaRE: The next Generation of
ISO/IEC 9126 and 14598 International Standards
Series on Software Product Quality, in
Proceedings of the European Software Control
and Metrics Conference. 2001: London.
25. Basili V., R.H., The TAME project: Towards
improvement –oriented software environments.
IEEE Transactions on Software Engineering,
1988.
26. Basili V., R.H., The Goal Question Metric
Approach, in Department of Computer Science.
1994, University Of Maryland.
27. Shewhart, W., Statistical Method from the
Viewpoint of Quality Control. 1939, New York:
Dover.
28. I. Caballero, E.V., A Data Quality Measurement
Information Model Based on ISO/IEC 15939.
2006.
29. ISO, ISO/IEC 15939. Information Technology -
Software Measurement Process. 2002, Geneva:
International Organization for Standardization.
30. Wohlin, C. and P. Runeson, Experimentation in
Software Engineering: An Introduction. 2000,
Boston: Kluwer Academic Publishers.
31. Solingen, R.v., The Goal/Question/Metric
Method: A practical Guide for Quality
Improvement and Software Development, ed. M.-
H. International. 1999.
32. Dovico. Dovico Timesheet. [cited 2008 2008-02-
12]; Dovico Timesheet]. Available from:
www.dovico.com.
33. Wilcox, R., Applying Contemporary Statistical
Techniques, ed. U.o.S. California. 2002, Southern
California: Academic Press.
34. SPSS. SPSS for Windows. 2008 [cited 2008-04-
14]; Available from: www.spss.com.
35. TechTarget. Search Software Quality. [cited
2008 05.16]; Available from:
http://searchsoftwarequality.techtarget.com/sDefin
ition.
36. Dyson, P. and A. Longshaw, Architecting
Enterprise Solutions: Patterns for High-
Capability Internet-based Systems. 2004: John
Wiley & Sons.
37. Microsoft. Microsoft Office Online. 2008 [cited
2008 02.20]; Available from:
http://office.microsoft.com/en-
us/excel/HP100738491033.aspx?pid=CH1010306
21033.
38. SDMetrics. The Software Design Metrics tool for
the UML. [cited 2008 03.05]; Available from:
http://www.sdmetrics.com/.

APPENDIX A. TREATMENTS – THE FIRST SECTION OF THE EXPERIMENT
The treatment
ID
The number of
base measures
The number of
derived measures
The number of
indicators
The number of
files
1 20 1 0 1
2 20 2 0 1
3 20 3 0 1
4 20 4 0 1
5 20 5 0 1
6 20 6 0 1
7 20 7 0 1
8 20 8 0 1
9 20 9 0 1
10 20 10 0 1
11 20 11 0 1
12 20 12 0 1
13 20 13 0 1
14 20 14 0 1
15 20 15 0 1
16 20 16 0 1
17 20 17 0 1
18 20 18 0 1
19 20 19 0 1
20 20 20 0 1
21 20 1 1 1
22 20 2 2 1
23 20 3 3 1
24 20 4 4 1
25 20 5 5 1
26 20 6 6 1
27 20 7 7 1
28 20 8 8 1
29 20 9 9 1
30 20 10 10 1
31 20 11 11 1
32 20 12 12 1
33 20 13 13 1
34 20 14 14 1
35 20 15 15 1
36 20 16 16 1
37 20 17 17 1
38 20 18 18 1
39 20 19 19 1
40 20 20 20 1

APPENDIX B. RESULTS, THE FIRST SECTION OF THE EXPERIMENT
The treatment
ID
The number of
base measures
The number of
derived
measures
The number of
indicators
The number of
files Mean calculation time
1 20 1 0 1 00:09
2 20 2 0 1 00:11
3 20 3 0 1 00:11
4 20 4 0 1 00:10
5 20 5 0 1 00:13
6 20 6 0 1 00:14
7 20 7 0 1 00:13
8 20 8 0 1 00:11
9 20 9 0 1 00:12
10 20 10 0 1 00:11
11 20 11 0 1 00:13
12 20 12 0 1 00:11
13 20 13 0 1 00:12
14 20 14 0 1 00:11
15 20 15 0 1 00:12
16 20 16 0 1 00:12
17 20 17 0 1 00:12
18 20 18 0 1 00:12
19 20 19 0 1 00:12
20 20 20 0 1 00:12
21 20 1 1 1 00:13
22 20 2 2 1 00:15
23 20 3 3 1 00:14
24 20 4 4 1 00:14
25 20 5 5 1 00:14
26 20 6 6 1 00:15
27 20 7 7 1 00:15
28 20 8 8 1 00:14
29 20 9 9 1 00:15
30 20 10 10 1 00:15
31 20 11 11 1 00:15
32 20 12 12 1 00:16
33 20 13 13 1 00:16
34 20 14 14 1 00:16
35 20 15 15 1 00:16
36 20 16 16 1 00:16
37 20 17 17 1 00:16
38 20 18 18 1 00:17
39 20 19 19 1 00:18
40 20 20 20 1 00:14

APPENDIX C. RESULTS, THE SECOND SECTION OF THE EXPERIMENT
The treatment
ID
The number
of base
measures
The number
of derived
measures
The number
of indicators
The number
of files with
base measures
The number
of files with
derived
measures
The number
of files with
indicators
Mean
calculation
time
1 20 1 1 20 1 1 00:16
2 20 2 2 20 2 2 00:13
3 20 3 3 20 3 3 00:11
4 20 4 4 20 4 4 00:11
5 20 5 5 20 5 5 00:11
6 20 6 6 20 6 6 00:16
7 20 7 7 20 7 7 00:17
8 20 8 8 20 8 8 00:16
9 20 9 9 20 9 9 00:16
10 20 10 10 20 10 10 00:22
11 20 11 11 20 11 11 00:22
12 20 12 12 20 12 12 00:22
13 20 13 13 20 13 13 00:22
14 20 14 14 20 14 14 00:22
15 20 15 15 20 15 15 00:22
16 20 16 16 20 16 16 00:22
17 20 17 17 20 17 17 00:21
18 20 18 18 20 18 18 00:22
19 20 19 19 20 19 19 00:22
20 20 20 20 20 20 20 00:22
21 20 21 21 20 21 21 00:43
22 20 22 22 20 22 22 00:43
23 20 23 23 20 23 23 00:44
24 20 24 24 20 24 24 00:43
25 20 25 25 20 25 25 00:43
26 20 26 26 20 26 26 00:44
27 20 27 27 20 27 27 00:44
28 20 28 28 20 28 28 00:44
29 20 29 29 20 29 29 00:45
30 20 30 30 20 30 30 00:43
31 20 31 31 20 31 31 00:45
32 20 32 32 20 32 32 00:46
33 20 33 33 20 33 33 00:48
34 20 34 34 20 34 34 00:50
35 20 35 35 20 35 35 00:50
36 20 36 36 20 36 36 00:48
37 20 37 37 20 37 37 00:52
38 20 38 38 20 38 38 00:46
39 20 39 39 20 39 39 00:48
40 20 40 40 20 40 40 00:53
41 20 41 41 20 41 41 01:04
42 20 42 42 20 42 42 01:04
43 20 43 43 20 43 43 01:05
44 20 44 44 20 44 44 01:05
45 20 45 45 20 45 45 01:05
46 20 46 46 20 46 46 01:01
47 20 47 47 20 47 47 01:01
48 20 48 48 20 48 48 01:04

49 20 49 49 20 49 49 01:04
50 20 50 50 20 50 50 01:01
51 20 51 51 20 51 51 00:24
52 20 52 52 20 52 52 01:10
53 20 53 53 20 53 53 01:10
54 20 54 54 20 54 54 01:31
55 20 55 55 20 55 55 01:09
56 20 56 56 20 56 56 01:21
57 20 57 57 20 57 57 01:11
58 20 58 58 20 58 58 01:07
59 20 59 59 20 59 59 01:31
60 20 60 60 20 60 60 01:12
61 20 61 61 20 61 61 01:30
62 20 62 62 20 62 62 01:16
63 20 63 63 20 63 63 01:16
64 20 64 64 20 64 64 01:19
65 20 65 65 20 65 65 01:22
66 20 66 66 20 66 66 01:18
67 20 67 67 20 67 67 01:30
68 20 68 68 20 68 68 01:37
69 20 69 69 20 69 69 01:31
70 20 70 70 20 70 70 01:52
71 20 71 71 20 71 71 01:53
72 20 72 72 20 72 72 01:32
73 20 73 73 20 73 73 02:02
74 20 74 74 20 74 74 01:49
75 20 75 75 20 75 75 01:39
76 20 76 76 20 76 76 01:36
77 20 77 77 20 77 77 01:35
78 20 78 78 20 78 78 01:36
79 20 79 79 20 79 79 01:25
80 20 80 80 20 80 80 01:33
81 20 81 81 20 81 81 01:30
82 20 82 82 20 82 82 01:36
83 20 83 83 20 83 83 01:48
84 20 84 84 20 84 84 01:42
85 20 85 85 20 85 85 01:45
86 20 86 86 20 86 86 01:48
87 20 87 87 20 87 87 02:00
88 20 88 88 20 88 88 01:58
89 20 89 89 20 89 89 02:10
90 20 90 90 20 90 90 01:48
91 20 91 91 20 91 91 01:47
92 20 92 92 20 92 92 01:58
93 20 93 93 20 93 93 02:09
94 20 94 94 20 94 94 01:58
95 20 95 95 20 95 95 02:00
96 20 96 96 20 96 96 02:03
97 20 97 97 20 97 97 02:08
98 20 98 98 20 98 98 02:12
99 20 99 99 20 99 99 02:22
100 20 100 100 20 100 100 02:27