an example using pet for statistical parametric...
TRANSCRIPT

An Example Using PET for An Example Using PET forStatistical Parametric MappingStatistical Parametric Mapping
Jack L. Lancaster, Ph.D.
Presented to SPM class 2008

Example PET Study• Interest in brain areas active in stutters• Stuttering can be quantified using stuttered
interval count or SI count• SI count is the # of 4-second intervals containing
stuttered speech• SI count can serve as an external measure for
correlation with CBF in PET study• Need group design study to see subtle effects

Example Study PET Acquisition• CTI/Siemens scanner• Attenuation correction using Ge-68/Ga-68 rod transmission
source• 10-min interval between scans• Head immobilized to reduce motion• 40 second uptake phase initiated when tracer enters the
brain followed by 50 second initial washout phase• Images were of the combined 90 second period which
represents CBF with good SNR• Text for reading presented on video monitor• Reading started at time of injection and lasted for 60
seconds• Six scans each task repeated twice

Example PET Study Design
• oral - solo reading of text passage• mono - spontaneous monologue (speaking without text passage)• ECR - eyes closed rest
monooralmonoScan 6oralmonooralScan 5ECRECRECRScan 4oralmonooralScan 3ECRECRECRScan 2monooralmonoScan 1
Subject 3Subject 2Subject 1
Full study had 12 subjects.

FAST for bias fieldcorrection
3
Original 3-D MRI1
1
BET toremove non-brain tissuesand Mango tocleanup
2
Adjust to 2 mm,spatiallynormalize, andvalue normalizeto supportaveraging.
4
Preprocessing ofMRI for PETstudies is similarto fMRI, but mostPET studies usegroup analyses soaverage MRIimages arecreated, often atthe lower pixelspacing seen withPET studies.
Group SPMs areoverlaid onto thegroup averageMR images.

PET O-15 water Scans 1-62 - Monolog2 - Solo Reading2 - Eyes Closed Rest
Raw group average ofsix scans after correctionfor movement
• ROI delimiting braintissue is defined usingthe raw group averageimage
• Each scan adjusted tothe same averagevalue within the brain(often 1000)
3102.43850.33293.33768.22928.83480.4
ROI Mean beforevalue normalization
Value Normalizationrequired for PET studies(deals with scans andsubject differences inradiotracer levels).

Fitted AC-PC LineFitted AC-PC Line
CCCC TNTN SCSC CBCB
Spatial Normalization MRI
Manual(landmarkbased)approachwith highresolutionMRI
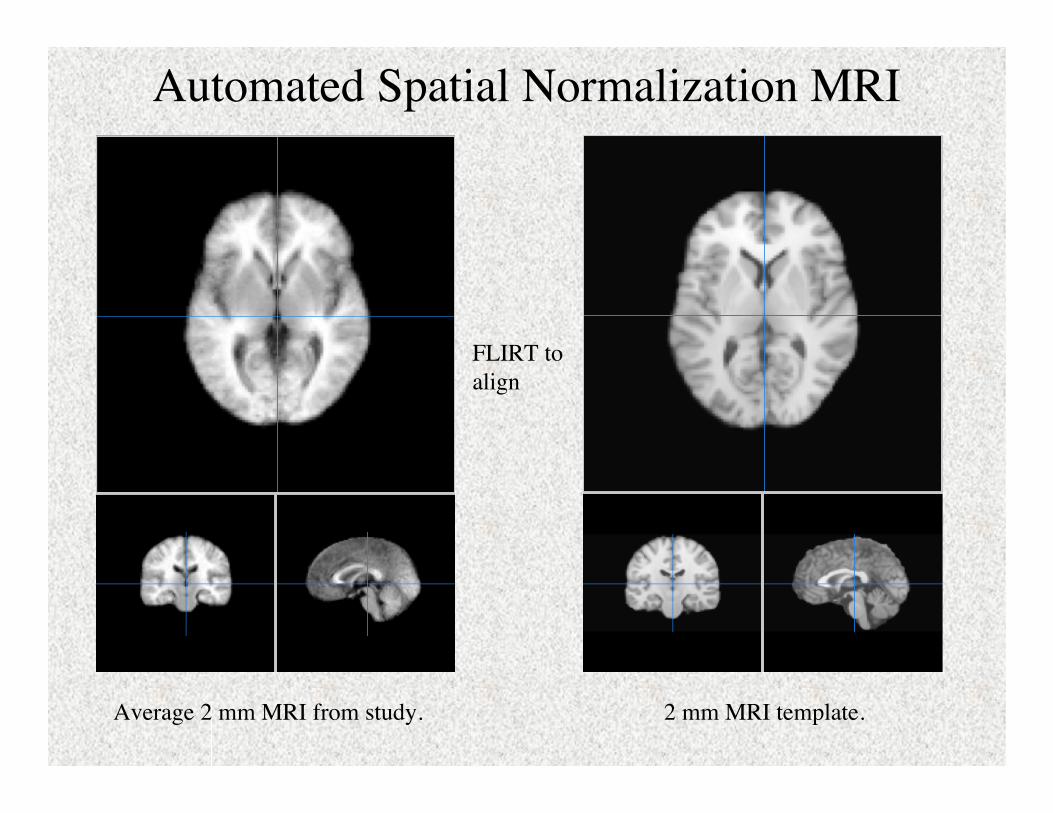
Automated Spatial Normalization MRI
Average 2 mm MRI from study.
FLIRT toalign
2 mm MRI template.

PET Spatial Normalization
Before After
•• All subjectAll subject’’s PET scans are corrected for motion and averageds PET scans are corrected for motion and averaged•• Dotted outline is from the average PET scanDotted outline is from the average PET scan•• Solid outline is from spatially normalized MRI of the subjectSolid outline is from spatially normalized MRI of the subject•• A 4x4 affine transform is iteratively adjusted to seek best fit between theA 4x4 affine transform is iteratively adjusted to seek best fit between the
two outlines (minimum mean square error)two outlines (minimum mean square error)•• Alternatively can use FLIRT with normalized correlation cost functionAlternatively can use FLIRT with normalized correlation cost function•• Resulting transform is applied to all PET scans for the subjectResulting transform is applied to all PET scans for the subject•• Repeat for all subjects fitting a common templateRepeat for all subjects fitting a common template
Convex Hull surfaces similar for MRI and PET images.

Subject 1 - red Subject 3 -blueSubject 2 - green
Overlays of PET from individual subjects onto the average MRI for the studydemonstrates how well fitting of PET images to MR images works. All imagesare now spatially normalized and Talairach coordinates can be used to providecandidate labels from coordinates.

Simple Contrast
• After value and spatial normalization• All subject’s solo reading minus all
eyes closed rest as simple contrast.• Pool the SD from this subtraction to
estimate z-score• Voxel-by-voxel z-score ~ (reading -
rest)/SD

Reading 1
Reading 1-Reading 2
Reading 2
Task-Taskprovides estimateof SD

Rest 1
Rest 2
Rest 1- Rest 2
Task - Taskprovides estimateof SD

• Image thresholded toillustrate large changes
• Poor SNR• Does not deal with task
performance variability(single trial)
• Doesn’t address issue ofwhere in brain (singlesubject)
• Poor estimate of standarddeviation for subtraction
Single-subject single-trialcontrast of Solo reading vs.Eyes closed rest

Simple Group ContrastSolo reading vs. Eyes closed rest twotrials per task and n=12 subjects.Thresholded at z-score > 3.

Table Used for Correlation
40eyes closed rest3
20eyes closed rest3
50solo reading3
317solo reading3
40eyes closed rest2
20eyes closed rest2
689solo reading2
183solo reading2
40eyes closed rest1
20eyes closed rest1
57solo reading1
310solo reading1
ScanSI CountTaskSubject
• Four SI count samples per subject and full study was of 12 subjects.• Voxel-by-voxel correlation with the SI count pattern• Correlation coefficients converted to z-scores for use as SP maps

Simple Contrast Compared With PerformanceCorrelation
Images at Talairach coordinate z = 56.
Reading vs. Eyes closed rest Voxel-by-voxel correlationwith SI count.
SPI threshold z > 2.5.
SMA

Simple Contrast Compared With PerformanceCorrelation
Images at Talairach coordinate z = 38.
Reading vs. Eyes closed rest Voxel-by-voxel correlationwith SI count.
SPI threshold z > 2.5.
M1

For More Details on PET Processing similarto what was used in this example see
• Fox et al., A PET study of the neural systems of stuttering,Nature, 1996, pp 158-162.
• Fox et al., Functional-lesion investigation of developmentalstuttering with positron emission tomography, Journal of Speechand Hearing Research, 1996, 1208-1227.
• Ingham et al., Brain correlates of stuttering and syllableproduction: Gender comparison and replication, Journal ofSpeech, Language and Hearing Research, 2000, pp 321-341.
• Fox et al., Brain correlates of stuttering and syllable production:A PET performance-correlation analysis, Brain, 2000, pp 1985-2004.