an examination of the uncertainty of global lng supply and
TRANSCRIPT

1
An Examination of the Uncertainty
of Global LNG Supply
and Demand
23October 2015
CRICOS Provider Code Curtin 00301J; UWA 00126G
The Australian Centre for Natural Gas Management
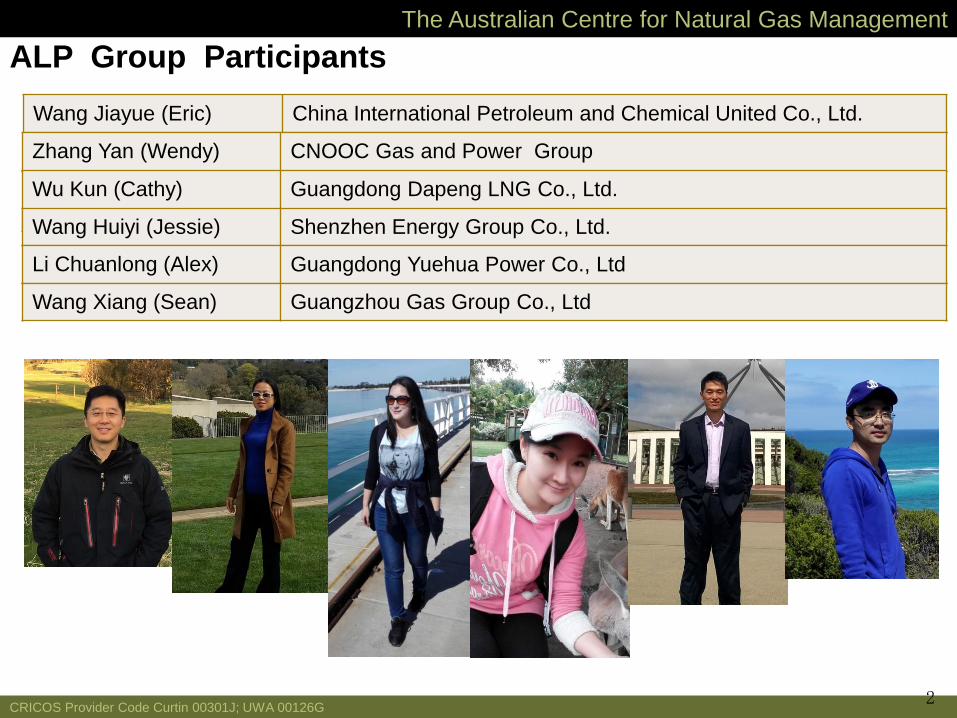
ALP Group Participants
2
Wang Jiayue (Eric) China International Petroleum and Chemical United Co., Ltd.
Zhang Yan (Wendy) CNOOC Gas and Power Group
Wu Kun (Cathy) Guangdong Dapeng LNG Co., Ltd.
Wang Huiyi (Jessie) Shenzhen Energy Group Co., Ltd.
Li Chuanlong (Alex) Guangdong Yuehua Power Co., Ltd
Wang Xiang (Sean) Guangzhou Gas Group Co., Ltd
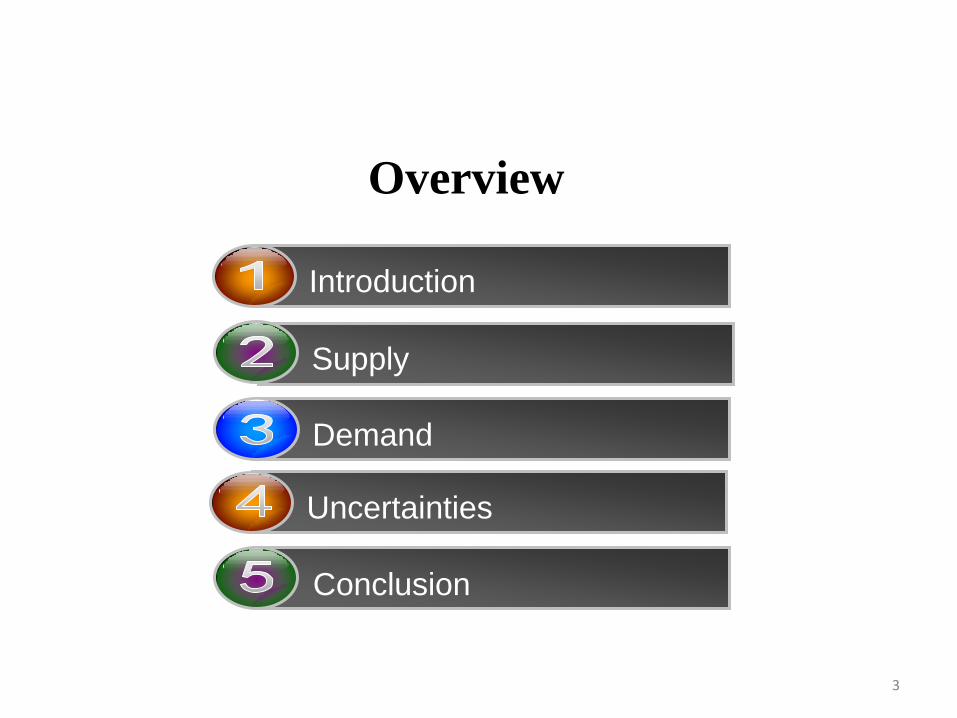
Overview
3
Introduction
Supply
Demand
Conclusion
Conclusion
Uncertainties

4
Market research / analysis reports
I. Introduction

Main data of NG in 2014 by region unit : billion cubic meter
Region Proved
reserves R/P ratio Production LNG
imports Pipeline imports
Total North America 12,146.9 12.8 948.4 11.6 116.9
Total S. & Cent. America 7,663.5 43.8 175.0 21.4 17.8
Total Europe & Eurasia 58,034.2 57.9 1,002.4 52.1 435.7
Total Middle East 79,813.9 >100 601.0 5.4 27.2
Total Africa 14,151.8 69.8 202.6 8.5
Total Asia Pacific 15l263.5 28.7 531.2 242.7 57.8
Total World 187,073.8 54.1 3,460.6 333.3 663.9
5
II. Supply
Source: BP statistical review of world energy 2015
6
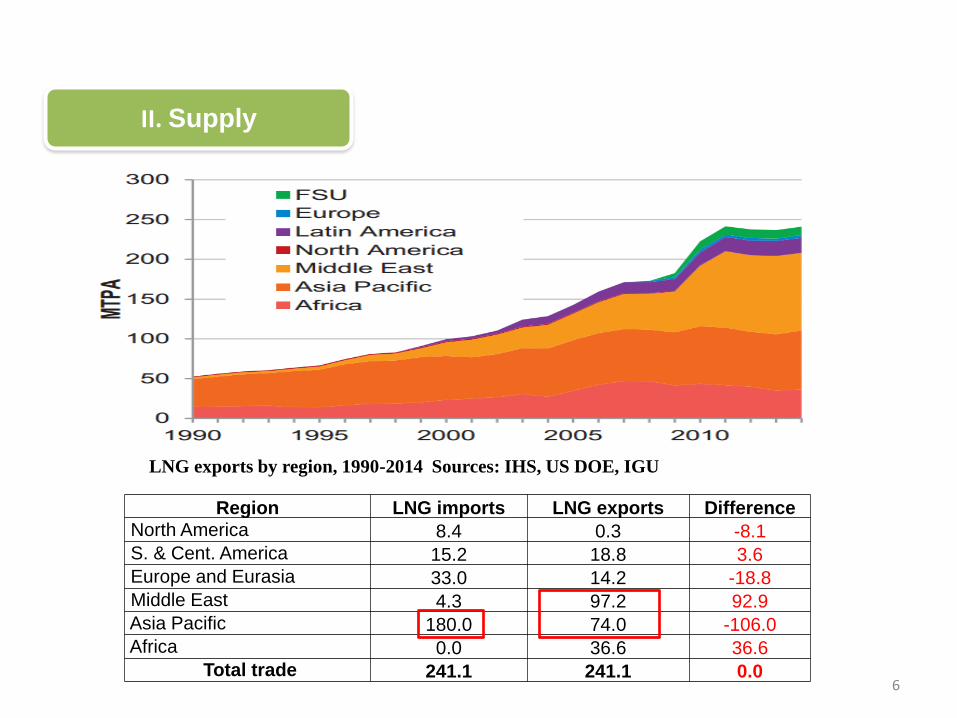
II. Supply
Region LNG imports LNG exports Difference North America 8.4 0.3 -8.1
S. & Cent. America 15.2 18.8 3.6 Europe and Eurasia 33.0 14.2 -18.8
Middle East 4.3 97.2 92.9
Asia Pacific 180.0 74.0 -106.0
Africa 0.0 36.6 36.6
Total trade 241.1 241.1 0.0
LNG exports by region, 1990-2014 Sources: IHS, US DOE, IGU
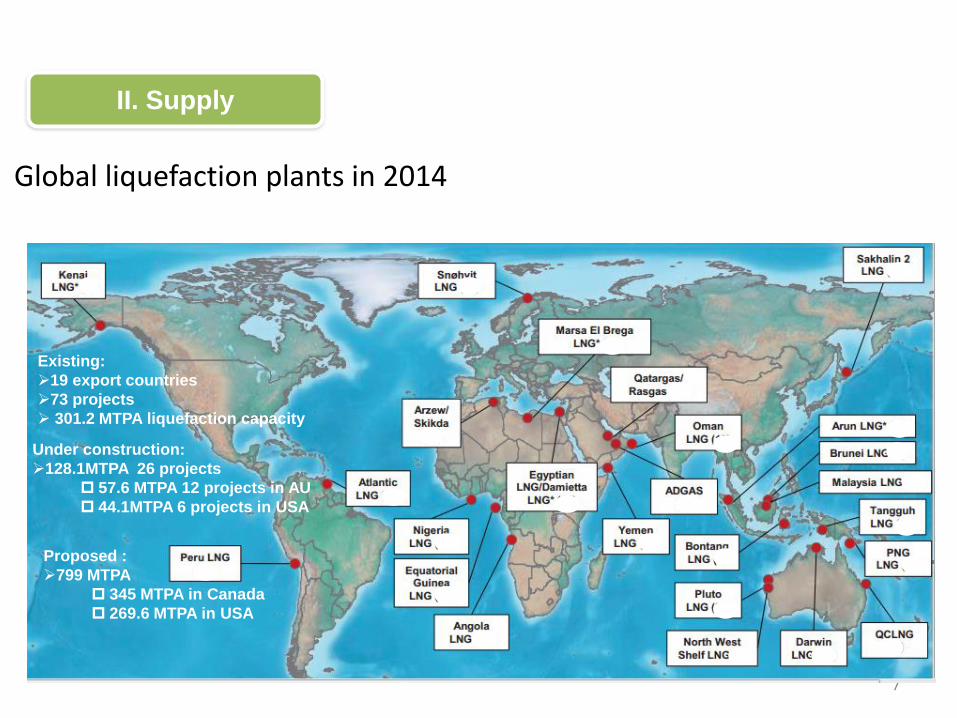
Global liquefaction plants in 2014
7
II. Supply
Existing:
19 export countries
73 projects
301.2 MTPA liquefaction capacity
Under construction:
128.1MTPA 26 projects
57.6 MTPA 12 projects in AU
44.1MTPA 6 projects in USA
Proposed :
799 MTPA
345 MTPA in Canada
269.6 MTPA in USA

8
II. Supply
Global Liquefaction Capacity
Build-Out,1990-2020 Liquefaction capacity by region in 2008,
2014 and 2020
Note: liquefaction capacity only refers to existing and under construction projects.
Sources: IHS, Company Announcements
Region 2008 2014 2020
(anticipated)
% growth
2008-2014
(actual)
%growth
2014-2020
(anticipated)
North
America 1.5 1.5 44.1 0 2840
S. & Cent.
America 15.5 20 20.5 29 3
Europe and
Eurasia 3.4 13.8 30.3 306 120
Middle East 46.8 100.8 100.8 115 0
Asia Pacific 81.2 95.3 158.1 17 66
Africa 58.7 69.9 69.9 19 0
Total 207 301.3 423.7 45 41
9
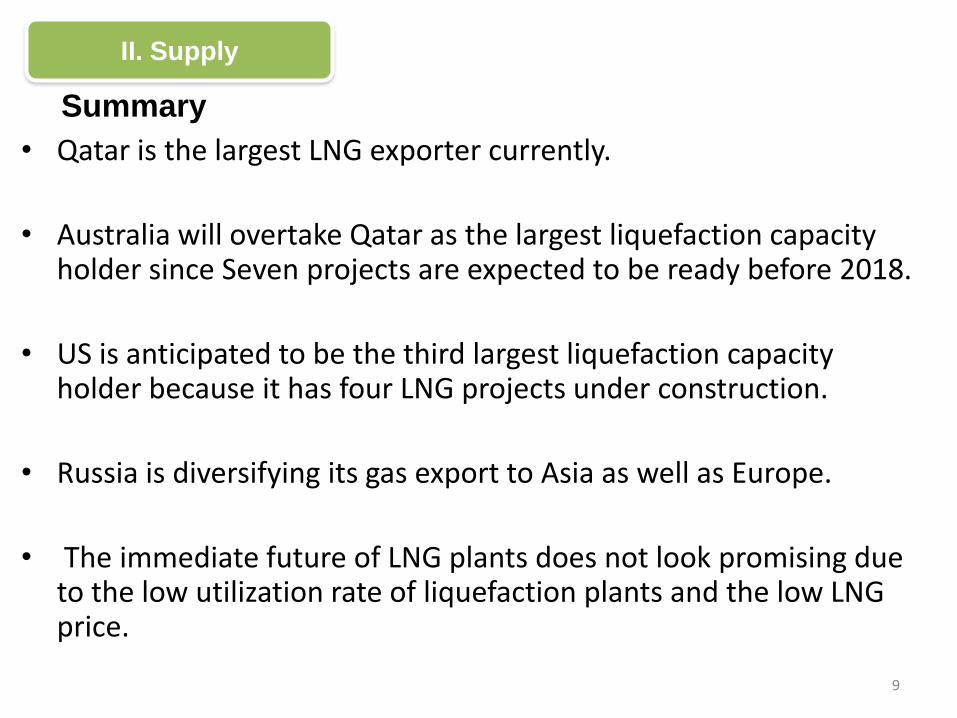
Summary
• Qatar is the largest LNG exporter currently.
• Australia will overtake Qatar as the largest liquefaction capacity holder since Seven projects are expected to be ready before 2018.
• US is anticipated to be the third largest liquefaction capacity holder because it has four LNG projects under construction.
• Russia is diversifying its gas export to Asia as well as Europe.
• The immediate future of LNG plants does not look promising due to the low utilization rate of liquefaction plants and the low LNG price.
II. Supply

III. Demand
Primary energy world consumption Million tonnes oil equivalent
• Natural gas :1/4 of global energy demand
• LNG:10% of natural gas

• Three main LNG demand regions: Asia Pacific, Europe and South &
Central America
III. Demand
Major gas trade movements 2014
Trade flows worldwide (billion cubic metres)
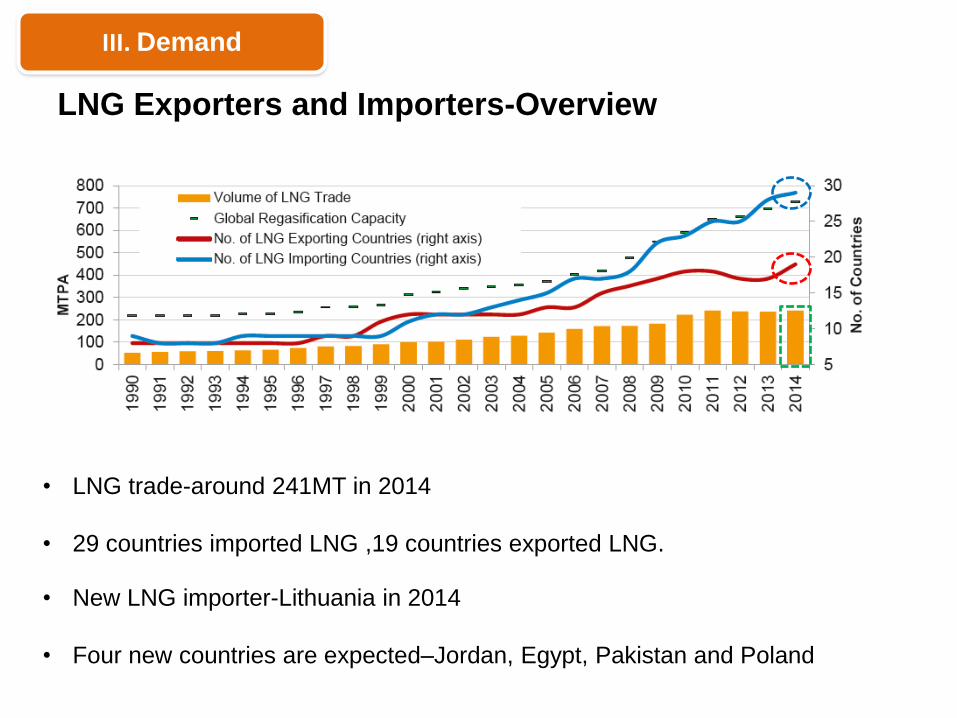
LNG Exporters and Importers-Overview
• LNG trade-around 241MT in 2014
• 29 countries imported LNG ,19 countries exported LNG.
• New LNG importer-Lithuania in 2014
• Four new countries are expected–Jordan, Egypt, Pakistan and Poland
III. Demand
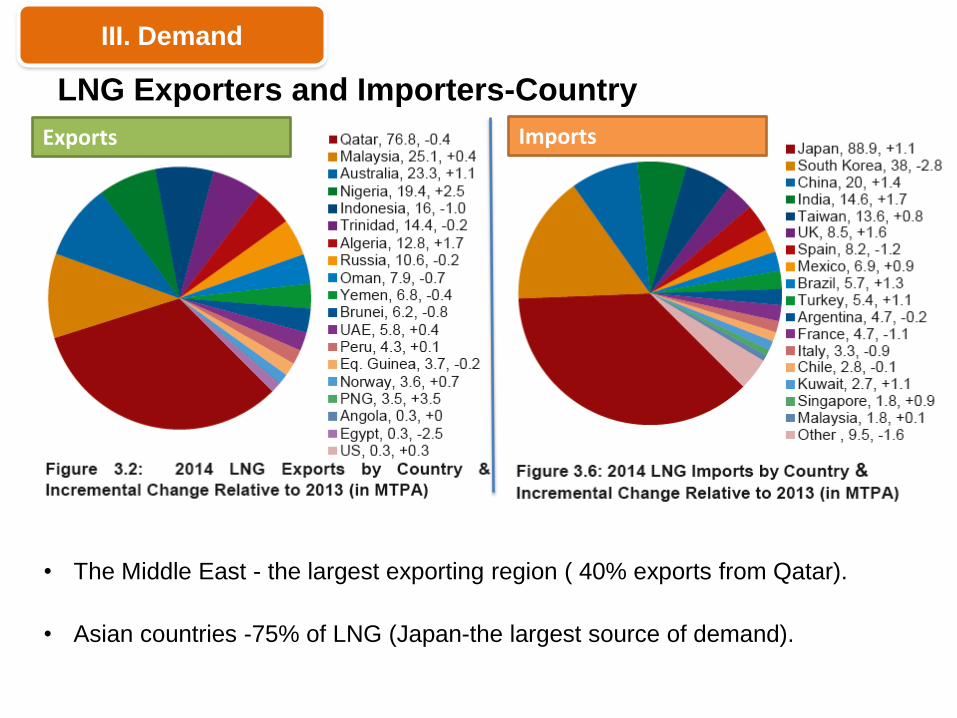
LNG Exporters and Importers-Country
• The Middle East - the largest exporting region ( 40% exports from Qatar).
III. Demand
Exports Imports
• Asian countries -75% of LNG (Japan-the largest source of demand).
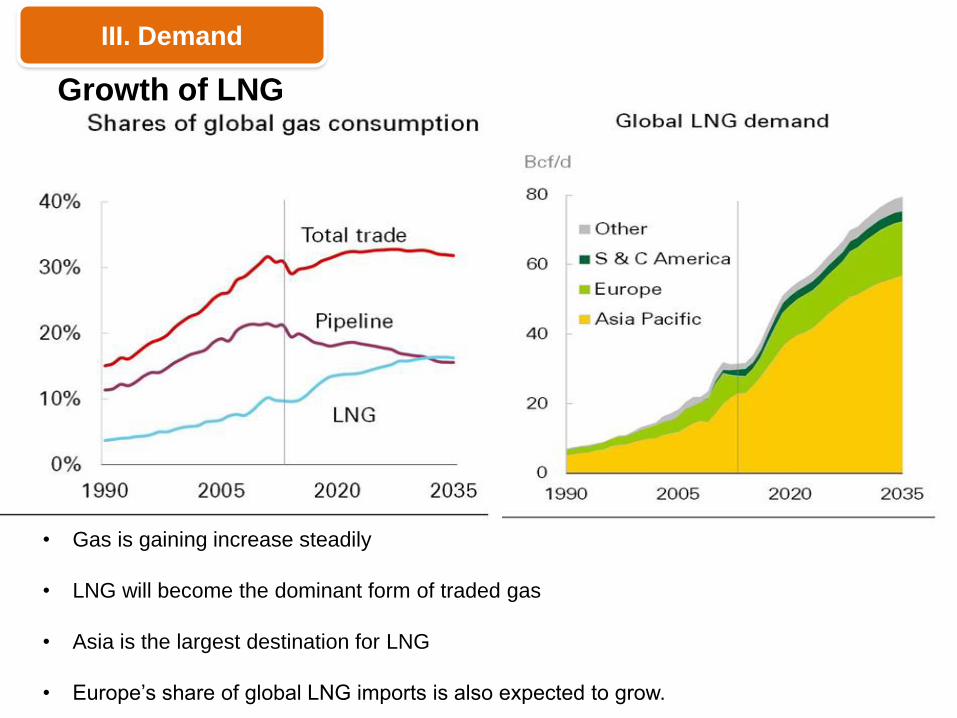
Growth of LNG
• Gas is gaining increase steadily
• LNG will become the dominant form of traded gas
• Asia is the largest destination for LNG
• Europe’s share of global LNG imports is also expected to grow.
III. Demand

New Projects are at risk of delivering inadequate returns
IV. Uncertainty
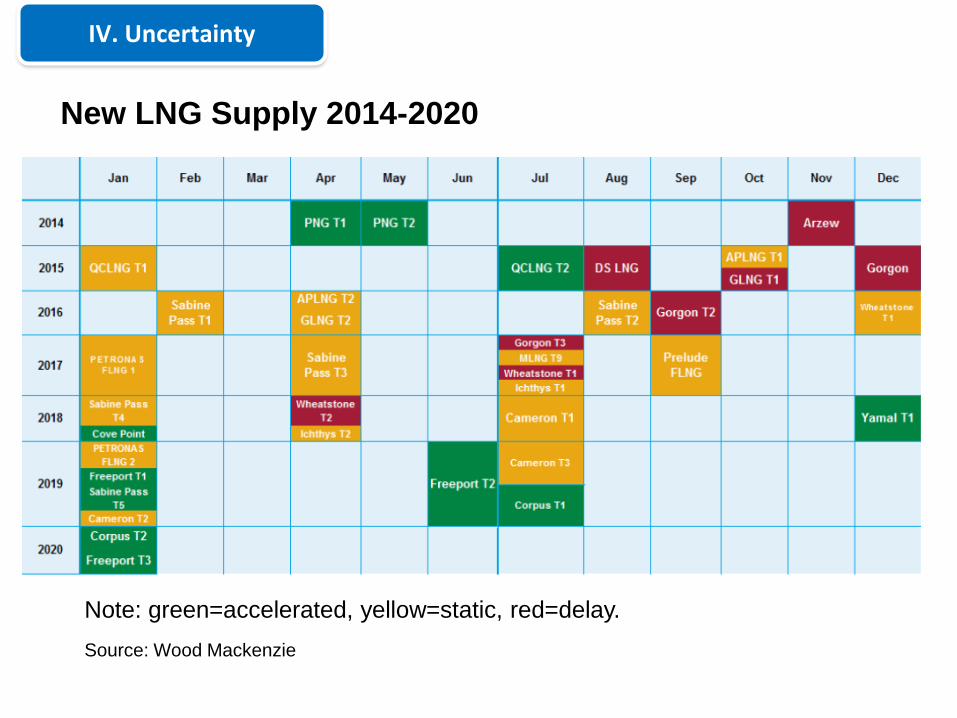
New LNG Supply 2014-2020
Note: green=accelerated, yellow=static, red=delay.
Source: Wood Mackenzie
IV. Uncertainty
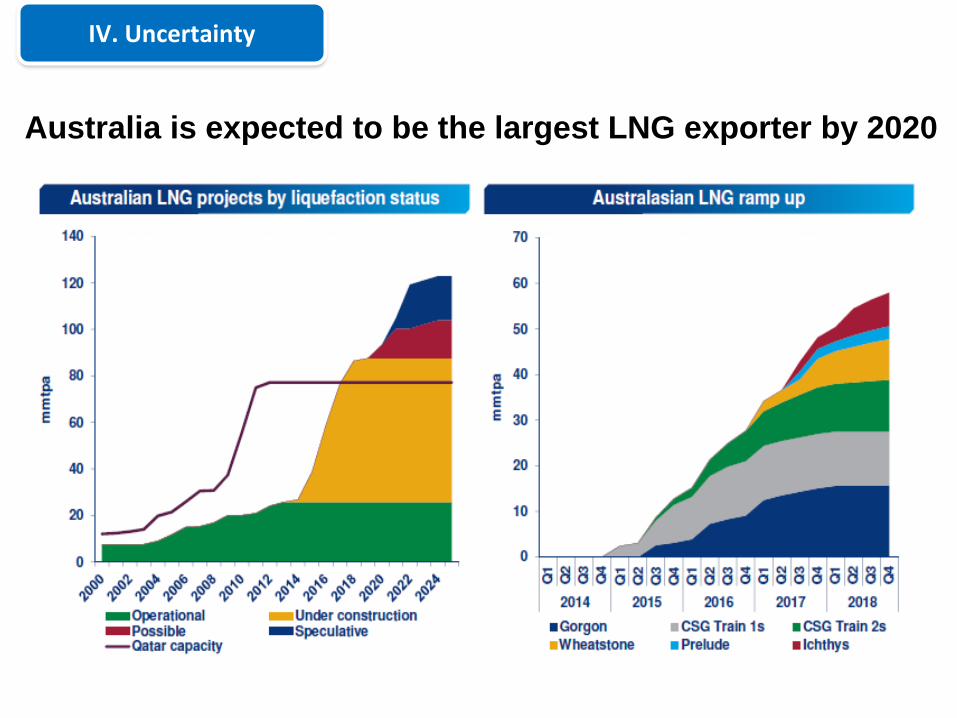
Australia is expected to be the largest LNG exporter by 2020
IV. Uncertainty
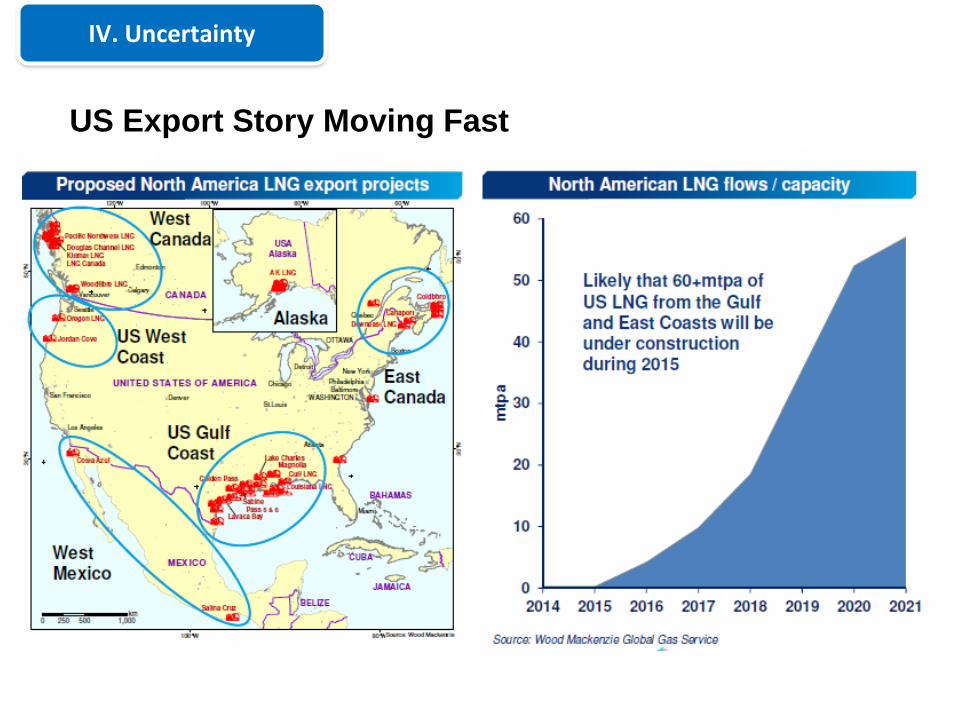
US Export Story Moving Fast
IV. Uncertainty

Challenges for Greenfield LNG
IV. Uncertainty

LNG Demand Growth Uncertainties
IV. Uncertainty

• LNG industry, Supply growth, next five years
• Worldwide, 122 mtpa
• LNG export from the US Gulf of Mexico
• Five new trains, 21 mtpa
• Six new markets; Egypt, Jordan, Pakistan, Philippines,
Poland, Uruguay.
21
VI. Conclusion

• Uncertainties on the demand side, Japanese , Chinese
economy, etc.
• Volatile, uncertain.
22
VI. Conclusion