an examination of the predictive power of financial market indicators in trinidad …€¦ · ·...
TRANSCRIPT

1
An Examination of the Predictive Power of Financial Market Indicators in
Trinidad and Tobago
Alon Dhanessar1
Abstract In small-open economies such as Trinidad and Tobago, economic challenges pose significant risks to the development of
the nation. As such, there is growing demand for economic forecasting tools which can assist in the goal of maintaining
economic stability. This paper seeks to investigate the performance of major financial market indicators as predictors of
recessions and inflation in the local economy. Specifically, the paper utilizes a Probit model, complemented with Receiver
Operating Characteristic (ROC) analysis and sensitivity and specificity classification, to examine the predictive abilities of the
sovereign yield curve spread between the 3-month and 10-year rates and the domestic stock market All T&T Index (ATI).
The results indicate that the yield curve spread is shown to be a strong predictor of recessions and is moderate in
forecasting inflation while the stock market index, however, is reasonable in anticipating recessions while weak in its inflation
foretelling abilities.
JEL Classification Numbers: C25, E43, E44, and E47.
Keywords: Probabilities, Interest Rates / Term Structure, Financial Markets and the Macroeconomy, and Forecasting
Models.
1 The author is an economist in the Research Department of the Central Bank of Trinidad and Tobago. The views expressed in this paper are those of the author and not necessarily those of the Central Bank of Trinidad and Tobago.

2
Introduction Over the past decade, Trinidad and Tobago has experienced many economic challenges; the most recent has been the
significant terms of trade shock experienced in 2015 and thus far in 2016 due to low energy prices. To deal with an ever
changing economic climate, forecasting is becoming increasingly important. As such, the Central Bank of Trinidad and
Tobago (CBTT) has been paying attention to all variables and indicators that may be useful tools in forecasting exercises.
Although a variety of complex economic and financial models are often used to forecast macroeconomic conditions such as
business cycles2 and price levels, simpler financial market indicators are becoming increasingly popular in the arsenal of
economists and analysts. There is considerable evidence stemming from advanced economies which show that the yield
curve and stock market indices contain predictive information on economic activity. For example, Estrella and Hardouveils
(1991) found that the slope of the yield curve can successfully predict looming recessions, while Estrella and Mishkin (1995)
found that the steepness of the yield curve can also provide insight into expectations of future inflation. Stock market indices
are also thought to contain pertinent information about the state of the economy. Considering that stock prices reflect firms‘
expected future earnings, a change in expectations can occur as a result of the anticipation that the economy will be slowing
in the future.
Given the success of financial market indicators in advanced economies, this paper seeks to determine if domestic financial
indicators - yield curve and stock market indices, possess the ability to predict future macroeconomic events such as a
recession or inflation. Specifically, this paper examines the usefulness of the spread3 between the 3-month Treasury bill
(short-term) and the 10-year Central Government bond rate (long-term), in addition to the Trinidad and Tobago Stock
Exchange (TTSE) All T&T Index (ATI)4 in predicting a recession and swings in inflation.
The structure of the paper follows the following format. The following section discusses a variety of literature on the
predictive abilities of yield curves and stock prices, followed by the trends in macroeconomic and financial indicators in
Trinidad and Tobago. In this section the paper describes the movements in economic output as represented by annual GDP
at constant prices and the Central Bank of Trinidad and Tobago Quarterly GDP (QGDP) index, inflation represented by
headline and core inflation, yield curve interest rates and spreads, and lastly the trends in the stock market index. This will
be followed by an explanation of the variables used in this analysis and a discussion of the chosen methodology employing
probit models. The final section provides the results and concludes on the usefulness of financial market indicators as
predictors of macroeconomic conditions in Trinidad and Tobago.
2 ―Business cycles refer to the irregular pattern of expansions and contractions that characterize the time path of aggregate economic activity. The end of
an expansion and start of a contraction is the cycle peak, while the end of a contraction and start of an expansion is the cycle trough‖ (Pearce, 1983). 3 In this case, the spread is defined as the difference in yield between two fixed income securities, specifically, a short-term and long-term treasury
security. 4 The All T&T Index (ATI), according to the Trinidad and Tobago Stock Exchange is a ―market-value weighted index (which) collectively measures the
price movements of the ordinary shares for Trinidadian companies listed on the First Tier Market of the Exchange‖ (Annual Report 2015).

3
Literature Review
Yield Curve Spread
Interest rate spreads and the slope of the treasury yield curve are believed to forecast future macroeconomic conditions.
According to Stock and Watson (1989),‖it is generally recognized that an inverted yield curve5 signals a future slowdown in
economic activity‖. Furthermore, ―an alternative interpretation would emphasize the allocative role of interest rates: an
increase in the spread, all else equal, might induce some firms to postpone investment, resulting in a decline in aggregate
demand‖ (Stock and Watson, 1989).
On examining whether the spread between the 3-month and 10-year forward interest rate is a useful predictor of future
recessions, and comparing the spread to traditional macroeconomic indicators, Estrella and Mishkin (1995) determine that
―the significance and fit of the yield curve spread increase up to the fourth quarter, in which they peak‖, furthermore,
―between quarters 2 and 6, the Treasury spread is more significant than other variables‖. Based on the encouraging results
of their comparative analysis, Estrella and Mishkin conclude that the yield curve spread can have a useful role in
macroeconomic forecasting. In another study, Estrella (2005) further explores the depth of the yield curve‘s predictive
powers and investigates why empirical results show that the slope of the yield curve predicts output and inflation. Estrella‘s
analysis shows that under most conditions, the yield curve is a good predictor of output and inflation; however, Estrella
mentions that ―the extent to which the yield curve is a good predictor depends on the form of monetary policy reaction
function, which in turn may depend on explicit policy objectives‖ therefore, the foretelling relationships in yield curves ―are
not structural, but are instead influenced by the monetary policy regime‖ (2005)6. This finding suggests that efficiency and
accuracy of a yield curve as a predictor of the economy can be affected by monetary policy strategies.
In an effort to determine how best to construct the yield curve indicator, Estrella and Trubin provide an analysis offering
practical guidelines. In their analysis, they first considered two explanations of the predictive power of the yield curve that
would substantiate the use of the yield curve as an operational indicator. The first explanation considers that ―monetary
policy can influence the slope of the yield curve‖ (Estrella and Trubin, 2006). This account specifies that tightening of
monetary policy results in an increase in short-term rates while relaxing of monetary policy results in a fall in short-term
rates. While monetary policy tightening increases short-term rates, ―long-term rates tend to reflect longer term expectations
and rise by less than short-term rates‖ and therefore ―monetary tightening both slows down the economy and flattens (or
even inverts) the yield curve‖ (Estrella and Trubin, 2006). The second explanation reflects the fact that the slope of the yield
curve is also influenced by changes in investor expectations. The authors stipulate that the future real demand for credit and
future inflation are related to future short-term interest rates. Monetary policy tightening and a subsequent rise in short-term
rates can therefore result in a ―slowdown in real economic activity and credit demand, putting downward pressure on future
real interest rates‖ (Estrella and Trubin, 2006). Furthermore, slower economic activity is expected to reduce inflationary
pressures and increase the prospect of an impending ease in monetary policy. ―The expected declines in short-term rates
5 Demonstrated by the 1-year and 10-year Treasury bond spread inverting in most cases roughly twelve months prior to a cyclical peak and six to twelve
months prior to a cyclical trough as dated by the National Bureau of Economic Research (NBER) (Stock and Watson, 1989). 6 Estrella (2005) provides two extremes, the first ―when monetary policy reacts only to output fluctuations and focuses on the change in the interest rate,
rather than its level, the yield curve is the optimal predictor of future output, and second, if the policy reactions to both inflation and output deviations approach infinity, the predictive power of the yield curve disappears‖.
4
would tend to reduce current long-term rates and flatten the yield curve (and) this scenario is consistent with the observed
correlation between the yield curve and recessions‖ (Estrella and Trubin, 2006).
Subsequent to considering these explanations on the predictive power of yield curves, Estrella and Trubin (2006) employ a
probability model in which the steepness of the yield curve is used to predict subsequent recessions. In their model, they
use the short-term 3-month Treasury rate as the monetary policy influencer, and the long-term 10-year Treasury rate as the
effect of investor expectations. Estrella and Trubin (2006) establish that ―tracking the level of the ten-year to three-month
Treasury spread is useful in predicting recessions‖ and that ―the consistency with which these explanations relate a yield
curve flattening to slower real activity provides some assurance that the indicator is valid‖. Their analysis therefore
concludes that the slope of the yield curve is proven to be a predictor of real economic activity and inflation. In a previous
paper, Estrella specifies that ―the spread between long-term and short-term government bond rates appears frequently in
the literature as a significant regressor in equations that predict inflation – particularly with long horizons – and in equations
that predict various measures of future economic activity‖ (2005). Furthermore, ―earlier research suggests that the 3-month
Treasury rate, when used in conjunction with the 10-year Treasury rate, provides a reasonable combination of accuracy and
robustness in predicting US recessions over long periods‖ (Estrella and Trubin, 2006).
In another study, Wright (2006) discusses that ―growth, recessions, and interest rates are all endogenous and any
association among them is purely a reduced form correlation. However, historically, the three-month less ten-year term
spread has exhibited a negative statistical relationship with real GDP growth over subsequent quarters, and a positive
statistical relationship with the odds of a recession‖. Similar to Estrella and Mishkin (1995) and Estrella and Trubin (2006),
Wright utilizes probability models using the yield curve to forecast recessions, however, the author includes the US Federal
Funds rate as a way for accounting for the expectations hypothesis in addition to the term premium components of the yield
curve slope7. The probability model by Wright discovers that the shape of the yield curve, in conjunction with the Federal
Funds rate, provides more information on the likelihood of a recession. Wright (2006) concludes that, ―probit models
forecasting recessions that use both the level of the federal funds rate and the term spread give better in-sample fit, and
better out-of-sample predictive performance, than models with the term spread alone‖. On examining the predictive power of
interest rates, Bernanke (1990) determines that ―both the levels and the spreads between interest rates can be extremely
informative for forecasting the economy‖. Given these investigations, analysing the spreads between various interest rates
can prove to be useful for forecasting domestic economic conditions8,9.
Most of the literature testing the probability of recessions in the US uses the standard business cycles dating chronology
provided by NBER. Since the recession indicator takes the form of a binary variable, and the leading indicators are in the
form of continuous data, most empirical literature utilize a probability or probit model to plot changes in the leading indicators
with the binary recession variable. Liu and Moench (2014) explain that since the probit model is hardly ever exactly one or
zero, a cut-off range is generally assumed, and any calculated probability above the assumed cut-off value is classified as a
7 According to Wright (2006), ―neglecting term premiums seems inappropriate, as it is clear that term premiums exist, and are time-varying, and are
typically increasing in the maturity of the bond, complicating the interpretation of spreads between short- and long-term Treasury yields‖. 8 Stock and Watson (1989) found that ―the difference between the six-month commercial paper rate and the six-month Treasury bill rate, and the
difference between the ten-year and one-year Treasury bond rates outperformed nearly every other variable as forecasters of the business cycle‖. 9 A theoretical reason why the yield curve spread can be a useful predictor is that based on the expectations hypothesis, the yield curve spread measures
the differentials between current short-term rates influenced by monetary policy, and future short-term rates expected by markets. Wright (2006) explains that ―the term spread is thus a measure of the stance of monetary policy (relative to long-run expectations). The higher is the term spread, the more restrictive is current monetary policy, and the more likely is a recession over the subsequent quarters‖.

5
predicted recession. Moreover, ―in order to objectively evaluate the model's ability to categorize future time periods into
recessions versus expansions over an entire spectrum of different cut-offs, one needs to complement the probit model with
a classification scheme… that has long been used in the statistics literature but has only recently found its way into
economic research is the receiver operating characteristic (ROC) curve‖ (Liu and Moench, 2014).
Stock Market Indices
Stock prices and stock market indices have long been thought of as indicators of future economic turning points. One reason
for this relationship has to do with the wealth effect. Mills (1988) explains that falling stock prices decrease the financial
wealth of stockholders which intern causes them to reduce spending and consumption. Pearce (1983) explains that with no
change in consumer prices, an increase in stock prices will increase the wealth of households, and as wealth changes,
consumption changes. In studying the life-cycle theory of saving by Ando and Modigliani, Pearce (1983) asserts that
―households project their resources over their expected lifetimes and decide on the consumption flows that best suit their
preferences‖. Therefore, holding all else constant, a decrease in stock prices will lessen household wealth and shrink the
available income for consumption. Furthermore, consumers who do not hold equity are also negatively affected by falling
stock prices. In this scenario, falling stock prices results in firm‘s valuations and profitability declining and as a result they
may seek to reduce expenses, which may come in the form of downsizing. Mills (1988) clarifies that during periods of falling
stock prices, consumers ―lose confidence in the economy and feel their own income prospects are dimmer‖. As a result,
stockholders and non-stockholders may see falling stock prices as a downturn in the financial state of corporations and by
extension the economy.
Estrella and Mishkin (1995) discuss that financial variables such as stock prices are regularly linked to forecasts of future
economic events and that stock prices can be used to determine future profitability of firms. It can therefore be assumed that
the major stock market indices can conceivably be used to form expectations of future economic occurrences. In predicting
real output growth and recessions using financial and macroeconomic leading indicators, Liu and Moench (2014) follow the
guidance of Estrella and Mishkin (1995), and include the S&P 500 common stock price index for its ability to signal peaks
and troughs in the business cycle. Their results show that with the inclusion of the S&P 500 index, the model exhibited
significant recession predicting ability both in the in-sample analysis and out-of-sample analysis 3-months ahead.
Furthermore, Estrella and Mishkin (1995) conclude that ―stock prices provide information that is not contained in the yield
curve spread and which is useful in predicting future recessions‖. This indicates that stock market data can be used as a
leading indicator based on its ability to adjust to investors‘ perceptions on future performance of markets and the economy.
Mills (1988) states that ―for businesses, lower stock prices raise the cost of acquiring equity funds to purchase new plant and
equipment‖ resulting in reducing corporate investment expenditure10. The ‗q-theory of investment11‘ set out by James Tobin,
demonstrates the link between investment and the stock market. For firms that possess a ‗Tobin‘s q‘ greater than one (stock
market valuation greater than the replacement cost of the firm‘s capital), the firm should issue more equity in order to
undertake investment projects. According to Miles et al (2012), the q-theory of investment notes that ―if the value of a
10 Considering that a firm‘s stock market valuations reflects the return shareholders might earn on funds, a link between levels of investment by a firm and
its stock market valuation can be expected (Miles et al, 2012). 11 Tobin‘s q-theory suggests that for values of q above one, investment should be stimulated in excess of requirements for replacement and normal growth
while values of q below one should discourage investment (Tobin and Brainard, 1977).

6
company on the stock market was substantially more than the replacement cost of the assets that the firm employs, then in
principle that company has a major incentive to increase investment‖. Likewise Pearce (1983) discusses that there are two
main theoretical views on corporate investment and stock prices, the ―market-valuation approach (Tobin‘s q approach) and
the cost-of-capital approach‖. In the market-valuation approach ―there is a simple relationship between stock price and
investment‖, and in the cost-of-capital approach ―stock prices affect investment indirectly by changing the cost of financing
new capital expenditures‖ (Pearce, 1983). A fall in stock prices therefore causes a loss of wealth, an increase in the cost of
capital, and a reduction in consumption and investment. As a result of these effects, an economy can experience a
slowdown in economic growth and even slip into a recession.
Bosworth (1975) argues that consumer demand and by extension economic growth are affected by the stock market through
the wealth effect, in addition to a ―proxy of optimism and pessimism (consumer sentiment)‖. Furthermore, the author
explains that the distinction between these mechanisms is ―central to an evaluation of the impact on consumption of
changes in monetary policy‖ (Bosworth, 1975). Since the demand for stocks is dependent on expectations of future earnings
and the rate of return on substitutable assets, Bosworth illuminates that monetary policy can affect the price and demand for
stock by influencing rates on competing assets. Therefore, if the relation between consumption and stock prices
characterizes a wealth effect, Bosworth (1975) states that ―an explanation for the behaviour of stock prices that includes a
link to monetary policy becomes crucial‖. In understanding this concept, one must rationalize that the cost of capital and
expected future earnings are affected by changes in the interest rate environment. As such, monetary policy can exert
influence on these factors and result in altering the demand for equities as opposed to alternative instruments such as
bonds. It stands to reason therefore, that in terms of transmission mechanisms and the predictive power of financial market
indicators, monetary policy actions will first affect the yield curve and interest rates, which then lead to changes in factors
affecting the demand for equities. However, alternatively, changes in stock prices due to perceptions of future economic
downturns can essentially forecast changes in monetary policy.
Trends in Macroeconomic & Financial Indicators
Economic Output & Financial Indicators
Over the 40 year period from 1975 to the end of 2015, the domestic economy experienced two notable recessions in
addition to being on the verge of a an economic downturn at the end of 2015 (Chart 1). Following the nation‘s first oil boom
spanning the mid-1970s and early 1980s, the economy suffered a complete reversal of fortunes resulting in a major
recession lasting eight years from 1983 to 1990. Given the rapid turn from boom to bust, protecting the foreign reserves
became a major concern to local policy makers. However, the fall in oil prices and production caused Government foreign
revenues to plummet leading to an exhaustion of the country‘s foreign currency savings and a 33.3 per cent devaluation of
the Trinidad and Tobago dollar in the fourth quarter of 1985. In order to facilitate government budget financing, the
Government became a net borrower in an already restricted and depleted financial system. Compounding the problem was
the financial difficulties experienced by commercial banks and non-bank financial institutions (NFIs) which eroded the
public‘s confidence in the banking system.
The deteriorating economic conditions of the 1980s resulted in the Central Government acquiring a significant amount of
short and medium term debt. As a percentage of GDP, total public debt increased from 18.2 per cent in 1982 to 55.3 per

7
cent in 1990. Facing a series of deficits, and depleted foreign currency savings, the Government sought to reschedule its
debt by engaging in a Standby Agreement with the International Monetary Fund (IMF) in January 1989. Through the second
half of the recession and into the Structural Adjustment period from 1987 to 1991, Central Government yield curve spreads12
remained high, displaying a steepening trend. During this period the spread between the 3-month and 10-year rates
averaged roughly 384 basis points, and peaked at 520 basis points by the end of 1991.
Economic activity seemed to be at a turning point in 1991 and 1992 as the economy registered positive growth of 3.1 per
cent and 10.1 per cent real GDP, respectively. The decline in the petroleum sector was brought to an end by a resurgence
of activity in exploration, production, and refining. Although this revival assisted the nation in regaining some level of foreign
currency savings, the recovery however was uncertain due to the current external deficit as well as conditions in the credit
market. The vagueness in the nature of the economic recovery resulted in the Central Bank undertaking contractionary
monetary policy in an effort to curb a sharp acceleration in credit markets, growing liquidity, and increasing pressures on
foreign exchange reserves. This policy change inadvertently introduced credit rationing, accompanied by a steep rise in
interest rates. Furthermore, due to the imbalances in the foreign exchange market, the Structural Adjustment Programme
enforced the liberalization of the foreign exchange market in April 1993, which involved the removal of all exchange controls
and the floatation of the exchange rate. During this period, the yield curve exhibited mixed periods of flattening and
inversions as spreads fell into negative territory. Although the economy was at a turning point, the yield curve could have
been displaying the sentiment of economic uncertainty influenced by the recent recession and the foreign exchange market
shock. However, this signal of a possible continuation of the recession did not materialize as a result of the measures and
policies implemented by the fiscal and monetary authorities which laid the foundation for economic growth.
Chart 1
Trinidad and Tobago – Real GDP (YoY %) & Yield Curve Spread (Basis Points)
12 In constructing an analytical rational expectations model, Estrella (2005) explains that ―the slope of the yield curve is empirically a significant predictor of
inflation and real economic activity‖. The spread according to Estrella, between short-term and long-term interest rates can provide deductions about the slope of the yield curve and from previous literature, the curvature of the slope can be a clear indication of future macroeconomic activity.
-300
-200
-100
0
100
200
300
400
500
600
-5%
0%
5%
10%
15%
Basis
Poin
ts
Source: Central Bank of Trinidad and Tobago and Central Statistical Office (CSO).
GDP at Constant (Real) YoY% (Left Axis) 3-Month 10-Year Spread (Basis Points) / (Right Axis)

8
As comprehensive policy reforms were now completed, the successful stabilization and structural adjustment policies drove
the economy into a new age of prosperity starting in 1994 and lasting roughly 15 years. During this period, the economy
benefitted from increasing energy commodity prices in addition to diversification of the energy sector through investments in
petrochemicals such as Liquefied Natural Gas, Ammonia, Urea, and other Natural Gas liquids. Despite these improvements,
the sovereign yield curve displayed a negative spread until 2000 when it finally began to trend upwards. Following this, the
treasury spread remained relatively stable averaging 158 basis points over the next seven years from the end of 2001 to the
end of 2007. In terms of the other financial markets indicators, the new expansionary cycle boosted the domestic stock
market, allowing the All T&T Index (ATI) to climb by roughly 169 per cent over the five year period ending December 2005
(Chart 2). The performance of the Exchange during this period was supported by the addition of 5 new company listings
adding more depth to the market, in addition to trading becoming fully automated in 2004, allowing investors to participate in
exchange more efficiently. Furthermore, the economy was in a phase of buoyancy aided by low interest rates and excess
liquidity.
Chart 2
Trinidad and Tobago – Real GDP (YoY %) & TTSE All T&T Price Index (ATI)
Following this, over the four year period from the end of 2005 to the end of 2009, the ATI dropped by 17 per cent. Although
the economy was exhibiting strong growth, stock market activity weakened due to a new regulatory requirement that
required pension funds which exceeded the 50 per cent limit on equity assets to reduce their equity holdings to within the
statutory limits13. This, in addition to the opinion that the market was becoming overheated, resulted in the decline in the
major stock market indices.
In 2008 as the US sub-prime mortgage crisis and subsequent turmoil in global financial markets intensified, domestic
economic activity began to show signs of a decline brought on by a fall in commodity prices and reduced external demand
for energy and non-energy exports. The following year, weighed down by depressed performances in the energy and non-
energy sectors, the economy witnessed the first annual contraction since 1993 with real GDP falling by 4.4 per cent. As a
13 In the 2005 Stock Exchange Annual Report, then Chairman Mc Eachrane mentioned that, ―the limits were exceeded mainly (but not only) by robust
increases in market values in recent years. The effect is dramatic, because institutional investors represent some 80 per cent of the investor market, who are now sellers rather than buyers‖ (2005).
0
500
1,000
1,500
2,000
2,500
-10.0%
-5.0%
0.0%
5.0%
10.0%
15.0%
Index V
alu
e
Source: Trinidad and Tobago Stock Exchange (TTSE) and Central Statistical Office (CSO).
All T&T Index (ATI) (Right Axis) GDP at Constant (Real) YoY% (Left Axis)
9
result, the Central Bank of Trinidad and Tobago adopted an accommodative monetary policy stance by reducing the Repo
Rate14 in order to stimulate credit and investment demand. This policy position reduced short term rates on the Central
Government yield curve; however, long-term rates continued to be elevated. This resulted in the yield curve displaying a
new steepening trend with the spread between the 3-month and 10-year rates increasing from 218 basis points in December
2008 to 491 basis points by the end of 2010. From the end of 2010 to mid-2013, the spread began to drop as economic
growth stabilized, albeit at much lower levels when compared to before the financial crisis. Simultaneously, as international
stock markets experienced record falloffs associated with the global financial crisis, conditions in the domestic market
remained strained. The turbulence in the domestic market resulting from the continued absence of major institutional
investors, the lack of investor enthusiasm, and the decline in performance of domestic energy and non-energy sectors
precipitated in the second stock market ‗crash‘ within the decade. During this fall, the domestic financial markets were also
affected by the adverse effects of the CLICO and CL Financial collapse.
Following two major declines in one decade, the stock exchange once again recovered lost ground as the ATI jumped by 70
per cent during 2010 – 2013. However, during this period, the economy was relatively flat. The energy sector, although
benefitting from strong energy prices, experienced a gradual decline as a result of lower output due to higher maintenance-
related downtime in the industry. The non-energy sector attempted to pick up the slack. During this period, the Trinidad and
Tobago Stock Exchange was recognised as the fifth best performing market in the world and one of only eleven markets to
end the year in positive territory (Platt, 2011). In 2013, the market was also boosted by the listing of 19.3 per cent
shareholding of state owned First Citizens Bank. This in addition to the support of a low interest rate environment and
excess liquidity in the system allowed the domestic stock market to perform favourably over the four year period ending
2013 period.
Subsequent to this period of low economic growth, the Central Bank adopted a tightening monetary policy position in
anticipation of higher interest rates in the US and to suppress rising inflationary pressures. As a result, treasury spreads
began to rise as financial markets anticipated higher interest rates. Unexpectedly however, another sharp drop in
international energy prices, combined with low domestic energy production ushered in another period of weak economic
growth. As these unforeseen conditions once again negatively affected the short term output and medium term outlook for
the domestic economy, the domestic stock market began to display signs of another turning point. Consequentially, over the
next two and a half years (January 2014 to June 2016) the ATI fell by roughly 10.0 per cent.
Inflation & Financial Indicators
During the slump in economic conditions from 1983 to 1990, inflationary pressures were present due to the reduction of local
petroleum and other subsidies; however during the first half of the recession headline and core inflation would have been
relatively weak as a consequence of the overall economic contraction. Following this, unification of the exchange rate in
1987 together with higher indirect taxes resulted in headline inflation increasing to 8.3 per cent year-on-year (Chart 3). This
continued throughout the remainder of the recession period as the social cost of the currency adjustment and the price
displacement effects of VAT in 1990 spurred inflationary pressures. Throughout this period, the spread between the 3-month
14 ―In May 2002, the Central Bank introduced a new framework for the conduct of monetary policy which focuses on adjustments in its benchmark ‗repo‘
rate. The ‗repo rate‘ is the rate at which the Central Bank provides temporary financing to commercial banks. It provides a signal of the Bank‘s observed monetary stance and is a means of influencing both short- and long-term market rates‖ (Central Bank of Trinidad and Tobago – 2002 Annual Economic Survey – Review of the National Economy).
10
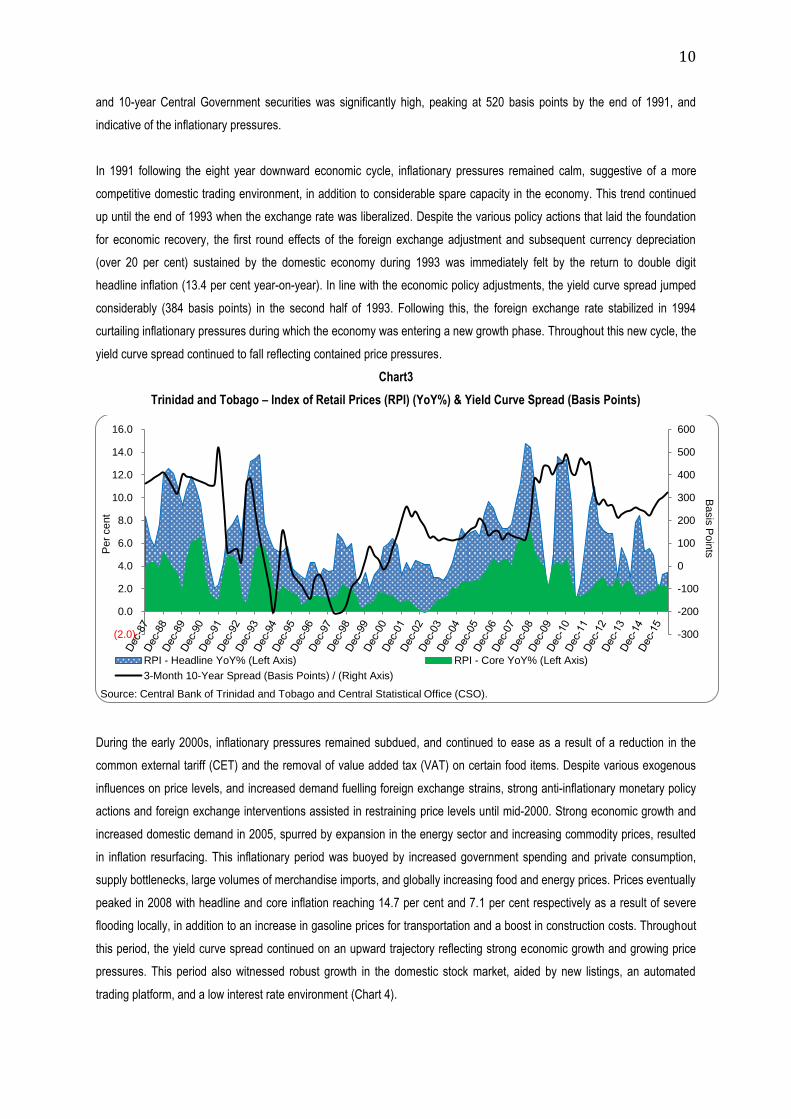
and 10-year Central Government securities was significantly high, peaking at 520 basis points by the end of 1991, and
indicative of the inflationary pressures.
In 1991 following the eight year downward economic cycle, inflationary pressures remained calm, suggestive of a more
competitive domestic trading environment, in addition to considerable spare capacity in the economy. This trend continued
up until the end of 1993 when the exchange rate was liberalized. Despite the various policy actions that laid the foundation
for economic recovery, the first round effects of the foreign exchange adjustment and subsequent currency depreciation
(over 20 per cent) sustained by the domestic economy during 1993 was immediately felt by the return to double digit
headline inflation (13.4 per cent year-on-year). In line with the economic policy adjustments, the yield curve spread jumped
considerably (384 basis points) in the second half of 1993. Following this, the foreign exchange rate stabilized in 1994
curtailing inflationary pressures during which the economy was entering a new growth phase. Throughout this new cycle, the
yield curve spread continued to fall reflecting contained price pressures.
Chart3
Trinidad and Tobago – Index of Retail Prices (RPI) (YoY%) & Yield Curve Spread (Basis Points)
During the early 2000s, inflationary pressures remained subdued, and continued to ease as a result of a reduction in the
common external tariff (CET) and the removal of value added tax (VAT) on certain food items. Despite various exogenous
influences on price levels, and increased demand fuelling foreign exchange strains, strong anti-inflationary monetary policy
actions and foreign exchange interventions assisted in restraining price levels until mid-2000. Strong economic growth and
increased domestic demand in 2005, spurred by expansion in the energy sector and increasing commodity prices, resulted
in inflation resurfacing. This inflationary period was buoyed by increased government spending and private consumption,
supply bottlenecks, large volumes of merchandise imports, and globally increasing food and energy prices. Prices eventually
peaked in 2008 with headline and core inflation reaching 14.7 per cent and 7.1 per cent respectively as a result of severe
flooding locally, in addition to an increase in gasoline prices for transportation and a boost in construction costs. Throughout
this period, the yield curve spread continued on an upward trajectory reflecting strong economic growth and growing price
pressures. This period also witnessed robust growth in the domestic stock market, aided by new listings, an automated
trading platform, and a low interest rate environment (Chart 4).
-300
-200
-100
0
100
200
300
400
500
600
(2.0)
0.0
2.0
4.0
6.0
8.0
10.0
12.0
14.0
16.0
Basis
Poin
ts P
er
cent
Source: Central Bank of Trinidad and Tobago and Central Statistical Office (CSO).
RPI - Headline YoY% (Left Axis) RPI - Core YoY% (Left Axis)
3-Month 10-Year Spread (Basis Points) / (Right Axis)

11
Declining economic conditions and lower domestic demand eventually restrained inflationary pressures during 2009,
however over the following six years, both headline and core inflation were moderate with some volatility due to fluctuating
weather conditions, private demand, and the reduction of the premium gasoline subsidy. Over this period, sluggish
economic growth and restricted inflationary pressures resulted in the yield curve flattening somewhat with a lower but stable
spread. Additionally, during this time, the All T&T Index (ATI) displayed notable growth until 2014 where it remained
relatively flat.
Chart4
Trinidad and Tobago – Index of Retail Prices (RPI) (YoY%) & TTSE All T&T Price Index (ATI)
By the end of 2015, the Central Government further reduced fuel subsidies and reduced VAT from 15.0 per cent to 12.5 per
cent while excluding some commodities from the zero-rated VAT list. These actions may have impelled inflationary
pressures in RPI sub-indices, however, as a result of a falloff in economic activity, increasing levels of job-loss, and reduced
business and consumer confidence, constrained aggregate demand would have kept headline and core inflation contained.
During this time, the yield curve spread was growing mainly on account of a series of tightening monetary policy actions
undertaken at the end of 2014. Furthermore, the deteriorating economic conditions would have also placed downward
pressures on the performance of locally domiciled firms thereby resulting in the ATI index tumbling during the first six
months of 2016.
0
500
1000
1500
2000
2500
-2.0
0.0
2.0
4.0
6.0
8.0
10.0
12.0
14.0
16.0
18.0
Index V
alu
e
Per
Cent
Source: Trinidad and Tobago Stock Exchange (TTSE) and Central Statistical Office (CSO).
RPI - Headline YoY% (Left Axis) RPI - Core YoY% (Left Axis) All T&T Index (ATI) (Right Axis)

12
Methodology & Dataset
Methodology
In order to examine the predictive abilities of the financial market indicators the paper employs a three (3) step method
designed to estimate the financial indicators predictive probabilities with respect to recession and inflation, followed by
statistical evaluations of the probabilities which will determine their success in forecasting macroeconomic conditions. The
first step utilizes the probability (probit) model as employed by Estrella and Trubin (2006). This maximum likelihood
estimation of a binary choice enables the paper to establish if each financial variable would have predicted a particular
macroeconomic condition throughout the period being examined. The second step evaluates the results of the probit model
by graphing and calculating the area under the receiver operating characteristic (AUROC) discussed by Liu and Moench
(2014). The ROC graphs the sensitivity (portion correctly predicted) versus 1-specificity (portion incorrectly classified), while
the AUROC is a measure of the performance of the model. The third and final step conducts a diagnostic sensitivity and
specificity analysis explained by Altman and Bland (1994) which provides the overall rates of correct classification, the
sensitivity, and the specificity. The following section further describes the methods.
Probability (Probit) Model
The probability model is determined via a probit equation of the form
Where the is the probability15 of a discrete binary proxy represented by a Recession
Proxy and Inflation Proxy occurring in t+x periods from the viewpoint of information available in period t. For probit models,
the dependent variables can take the form of only two variables. As such, the discrete binary proxies which are discussed in
more detail in the dataset section will follow the following form:
Recession_Proxy = 1, if the country is in a recession and 0 otherwise,
RPI_Headline = 1, if the country is experiencing a headline inflationary period and 0 otherwise, and
RPI_Core = 1, if the country is experiencing a core inflationary period and 0 otherwise.
Estrella and Trubin (2006) describe as the cumulative normal distribution function represented by:
∫
√ (
⁄ )
While α and β are constants in the form of the regression residual coefficient and the independent variable coefficient
respectively. The dependent variable lead times represented by t+x periods are conditional on the time series of the
independent variables. As such, the quarterly yield curve spread data is tested with x = 2 quarters and x = 4 quarters lead
times in the dependent variables. Additionally, the monthly stock market index data is tested with x = 6 months and x = 12
months lead times in the dependent variables. The paper examines out-of-sample since it ―provides a much truer test of an
indicator‘s real-world forecasting ability‖ (Estrella and Mishkin, 1996). In conducting the probit model, robust standard errors
15 In calculating the probability of a recession for a specific value of the term spread, Estrella and Trubin (2006) explain this can be easily calculated using
standard spreadsheet programs such as Microsoft Excel®. The probability is computed using the formula .

13
were included in the specification. This was used as a cautionary tool in order to guard against the possible presence of
heteroscedasticity and possible misspecification of the variance.
Receiver Operating Characteristic
In discussing the computation and comparison of the ROC16 curves, Liu and Moench (2014) mentioned that ―one method of
comparing the predictive ability of classifiers across a spectrum of cut-off values is to integrate the area under the ROC
curve, creating the AUROC‖. A probit model that results in perfect classification and prediction of recessions across time
would ―only have true positives and no false positives and an AUROC equal to one‖. On the other end, a probit model ―which
is the equivalent of a random guess would have on average an equal number of true and false positives, which corresponds
to an AUROC equal to 0.5‖ (Liu and Moench, 2014). In order to determine if the domestic financial market indicators have
any predictive power whatsoever, this paper assumes a cut-off point of an AUROC equal to 0.5.
Sensitivity and Specificity Classification
Altman and Bland (1994) explain that sensitivity determines ―the proportion of true positives that are correctly identified by
the test‖ while specificity determines ―the proportion of true negatives that are correctly identified by the test‖. These tests
also scan for Type I errors (false positives) and Type II errors (false negatives). The diagnostic tests will therefore determine
how successful the financial market indicators are in predicting macroeconomic conditions given by the recession and
inflation proxies. The probit model and diagnostic analysis will be conducted using STATA statistical software, and the
results discussed in the following sections.
Dataset - Macroeconomic Variables
The first step is to define a binary proxy for recession from December 1987 to December 2015. Considering that Trinidad
and Tobago does not possess a formal system for indicating a recessionary period, the quarterly proxy for a recession was
established by reviewing CBTT Annual Economic Surveys - Review of the Economy from 1987 to 2015 in addition to yearly
constant and current GDP and quarterly CBTT QGDP data. If the publications and data exhibited a recessionary period,
then the binary proxy reflected this outcome. The binary recession proxy is used in the probit models to examine the powers
of the financial variables in predicting recessions (Table 1).
The second macroeconomic indicators utilized are binary proxies for inflation from December 1987 to June 2016 determined
from domestic Retail Price Index (RPI). The first RPI proxy is based on year-on-year headline inflation, and the second
proxy is based on year-on-year core RPI inflation. Considering that Trinidad and Tobago lacks a formal inflation targeting
strategy, in order to determine an inflationary period an examination of historical RPI data was conducted. Based on the
analysis, the paper assumes that an inflationary period was one where the respective year-on-year RPI data point was
higher than the long run average of the corresponding RPI variable. In the case of headline inflation, this threshold point was
estimated to be 6.6 per cent while the core inflation threshold point was assessed to be 2.6 per cent. The resulting inflation
proxies were then substantiated by reviewing inflation reports from the CBTT Annual Economic Surveys and semi-annual
Economic Bulletins.
16 The receiver operating characteristic (ROC) is commonly used to evaluate the recession predicting ability of numerous leading indicators since it
calculates the ability of each probit model to accurately predict economic cycles. Liu and Moench (2014 ) summarize that ―the ROC curve pinpoints the percent of false negatives one would have to trade for one additional percent of true positives. A model with 100% accuracy would draw a ROC curve hugging the top left corner. A model which is the equivalent of a random guess would follow a 45% diagonal that runs from the bottom-left corner to the top-right corner‖.

14
Dataset – Financial Variables
The various literatures on the yield curve‘s predictive power differ in terms of the selection of the short-term and long-term
rate17, however in this analysis the paper will examine the spread between the 3-month and 10-year Treasury rate. Given
the data limitations with respect to historic treasury yields in the domestic economy, the paper utilizes a number of sources
for the yield curve spreads in order to maximize the length of the time series being analysed18. Quarterly data on the short-
term 3-month treasury rate from December 1987 to December 2015 was sourced via the Central Bank of Trinidad and
Tobago debt management and open market operations data. Whereas quarterly data on the long-term 10-year Central
Government of Trinidad and Tobago bond yield for the same period was sourced from various issues of the Central Bank of
Trinidad and Tobago Annual Economic Survey publications (December 1987 to March 2002), in addition to the CBTT
Central Government Yield Curve19,20.
Table 1
Financial and Macroeconomic Variables
Name Description Type Frequency Period
3_10_Spread Spread between the 3-month and
10-year rates Financial Quarterly
Dec 1987 to
June 2016
ATI_MoM_% All T&T Index (ATI) month on month
per cent change Financial Monthly
Dec 2000 to
June 2016
Recession_Proxy Binary recession variable Macroeconomic Quarterly and
Monthly
Dec 1987 to
June 2016
RPI_Headline Binary Headline Retail Price Index
variable Macroeconomic
Quarterly and
Monthly
Dec 1987 to
June 2016
RPI_Core Binary Core Retail Price Index
variable Macroeconomic
Quarterly and
Monthly
Dec 1987 to
June 2016
The paper also examines the link between stock prices and forecasts of future macroeconomic changes. For this analysis,
monthly data21 on the All T&T Index (ATI) from the Trinidad and Tobago Stock Exchange (TTSE)22 was accessed for the
period December 2000 to December 2015. The ATI index represents ordinary shares of only locally listed companies on the
domestic Exchange and would therefore be the most appropriate to gauge its predictive power of local macroeconomic
variables.
17 Estrella and Trubin (2006) explain that ―in choosing the most appropriate rates, one should consider a number of criteria, including the ready availability
of historical data and consistency in the computation of rates over time‖. 18 Due to the lack of a standardized yield curve throughout the period being analyzed, actual historic treasury rates were obtained from various sources.
For periods with unknown rates, a linear interpolation method was implemented in order to complete the series. 19 The standardized TT Treasury Yield Curve Is constructed by the Central Bank of Trinidad and Tobago and utilizes domestic market operations data,
TTSE Secondary Central Government Bond trade data, and market reads from institutional players. 20 The 15-year Central Government of Trinidad and Tobago bond yield was also examined with very similar results to the 10-year Central Government
bond yield. 21 Monthly ATI data was used for this analysis due to the shorter time period (2000-2016) available. 22 Additionally the major Composite Price Index (CPI), which is comprised of all the ordinary shares listed on the domestic Exchange, was examined with
similar AUROC results to the ATI Index.

15
Model Specifications
Due to the multiple dependent and independent variables being analysed, the ordering and discussion of the models will be
as follows
1. Model 1: Recession Proxy versus Yield Curve Spread
A.
B.
2. Model 2: Recession Proxy versus ATI Index
A.
B.
3. Model 3: Inflation Proxy versus Yield Curve Spread
A.
B.
C.
D.
4. Model 4: Inflation Proxy versus ATI Index
A.
B.
C.
D.
Results
Model 1: Recession Proxy versus Yield Curve Spread
The first model examines if the domestic yield curve spread between the 3-month treasury rate and the 10-year Central
Government bond rates displayed any prophetic capabilities in historical recessions. The two models (1A and 1B) tests the
predictive power of the 3-month to 10-year spread against a proxy for recession two quarters (t+2) and four quarters (t+4)
ahead respectively. The results of the probit model (Table 2), show an AUROC greater than 0.80 for both models indicating
that they are significant and perform well in predicting recessions two and four quarters ahead. The AUROC curves for all
models can be seen in Appendix 1. However, model 1A examining the predictive capabilities two quarters ahead appears to
be stronger with an overall rate of correct classification estimated to be 82.3 per cent with 68.9 per cent (sensitivity) of
recessionary periods and 86.9 per cent (specificity) of non-recessionary periods correctly classified. Additionally, the margin
analyses for both models indicate that a one unit or one basis-point increase in the spread increases the probability of a
recession by roughly 0.001 per cent both two and four quarters ahead. Therefore in terms of a one percentage point
increase in the spread (100 basis points), the probability of a recession will rise by roughly 0.1 per cent.
Chart 5 plots the probability of a recession, two and four quarters ahead as predicted by the spread between the 3-month
and 10-year treasury rates. In both models, the probability of a recession follows a very similar trend, however, the
magnitude of the probabilities seem to be stronger two quarters ahead rather than four quarters ahead. Although the data
set starts from 1987, the probit model shows an average of 58.1 per cent chance of a recession two quarters ahead, and

16
49.2 per cent chance of a recession four quarters ahead during the 1983 to 1990 recession. Following this the economy
enters a growth cycle; however the probability of a recession climbs to almost 90.0 per cent and 80.0 per cent respectively in
both models during 1991, coinciding with the period of Structural Adjustment and accompanied by economic uncertainty, a
growing external deficit, dwindling foreign exchange reserves and the presence of credit rationing. Again in 1993, the
probability of a recession leaps to over 50 per cent in both models, which was perhaps reflective of the significant structural
changes to the financial and foreign exchange market being undertaken at the time.
Table 2
Model 1 – Recession Proxy versus Yield Curve Spread – Probit Results Analysis
Model Dependent Variable Independent
Variable AUROC Sensitivity Specificity
Correctly
Classified Margin
1.A. Recession Proxy (t+2) 3_10 Spread 0.8828 68.97% 86.90% 82.30% 0.0013972
1.B Recession Proxy (t+4) 3_10 Spread 0.8137 40.74% 89.29% 77.48% 0.0011316
Source: STATA 11.1 Statistics / Data Analysis Software (2009)
In the midst of the global financial crisis both models revealed a jump in the probability of a recession, averaging 70.3 per
cent two quarters ahead and 58.5 per cent four quarters ahead, over the second period of economic weakening in early
2009 to late 2011. Following this, economic activity remained relatively flat. However, from mid-2015, on the heels of
weakening conditions in the energy sector and a new economic downturn, both forward looking models peak at roughly 30.0
per cent chance of a recession.
Chart 5
Probability of Recession Two and Four Quarters Ahead, as Predicted by the 3-Month and 10-Year Treasury Spread
0
0.1
0.2
0.3
0.4
0.5
0.6
0.7
0.8
0.9
1
Pro
babili
ty
Recession ProxyProbability Model 1A: (Recession +2Q vs 3_10_BP_Spread)Probability Model 1B: (Recession +4Q vs 3_10_BP_Spread)

17
Model 2: Recession Proxy versus ATI Index
The following probit model examines if the All T&T Index (ATI) reveals any forewarning of recessions six months and twelve
months ahead. Although some false positives are observed in the probabilities, the AUROC results of the probit models
(Table 3) indicate that the predictive abilities of the stock market indices are moderate at best, however, still slightly better
than a random guess scenario. Model 2A examining the predictive capabilities six months ahead seems to be marginally
better with an AUROC of 0.65 and the overall rate of correct classification assessed to be 71.67 per cent. However, with 2.0
per cent (sensitivity) of recessionary periods and 98.46 per cent (specificity) of non-recessionary periods correctly classified,
the strength of the stock market accurately predicting recessions are diminished. The margin analysis shows that a one
percentage point increase in the index value decreases the probability of a recession by roughly 3.1 per cent and 2.5 per
cent respectively. This conforms to the notion that improving stock market performance generally coincides with a growing
economy and therefore a reduced chance of an economic downturn.
Chart 6 plots the probability of a recession, six months and twelve months ahead against the All T&T Index (ATI). In this
case the models are tested for the 15 year period from December 2000 to December 2015, and as such, only two
recessionary periods are noted. In both models, the probability of a recession follows a very similar trend with marginal
differences in magnitudes. The first uptick in the probability of a recession occurred in late 2000, likely due to the economy
experiencing a slowdown in real GDP growth from 6.9 per cent in 2000 to 4.2 per cent at the end of 2001. The second jump
occurred in the second half of 2005 due to the pension fund regulatory requirement reducing equity holdings and resulting in
a stock market shock. The third and largest leap in the probability of a recession as predicted by the ATI (78.7 per cent six-
months ahead and 70.7 per cent twelve-months ahead) occurred in October 2008, prior to the 2008 to 2011 recessionary
period. This was likely due to the domestic stock market anticipating a major decline in stock prices, coinciding with the
deteriorating conditions in international stock markets.
Table 3
Model 2 – Recession Proxy versus ATI – Probit Results Analysis
Model Dependent Variable Independent
Variable AUROC Sensitivity Specificity
Correctly
Classified Margin
2.A. Recession Proxy (t+6) ATI_MoM_% 0.6497 2.00% 98.46% 71.67% -3.082976
2.B Recession Proxy (t+12) ATI_MoM_% 0.6398 2.00% 98.39% 70.69% -2.51711
Source: STATA 11.1 Statistics / Data Analysis Software (2009)
In the 2015 recession spurred by falling energy-commodity prices, the ATI seems to be somewhat ineffective in predicting a
downturn, showing an average of around 30.0 per cent chance six-months and twelve-months ahead respectively during
2015. The limited performance of the ATI in predicting this economic turning point could be due to the effect of the
exogenous variable, declining international energy prices, not being anticipated by stock market investors and therefore not
being accurately picked up in price changes. However, the probability of a recession jumps to over 40.0 per cent in early
2016 as a result of the transmission of reduced energy revenues displaying a greater effect on domestic firms and
subsequently causing the ATI to fall by 9.0 per cent over the first six months of 2016.

18
Chart 6 Probability of Recession Six and Twelve Months Ahead, as Predicted by the All T&T Index (ATI)
Model 3: Inflation Proxy versus Yield Curve Spread
Model 3 evaluates the abilities of the spread between the 3-month treasury rate with the 10-year Central Government bond
rate in predicting periods of strong inflation as defined by headline and core inflation exceeding its long run average, both
two quarters and four quarters ahead. The AUROC results indicate that the models perform reasonably well in predicting
inflation two and four quarters ahead. Furthermore, the AUROC and classification analysis shows that the 3-month and 10-
year spread predicts core inflation more accurately than headline inflation. This could be due to the fact that headline
inflation is influenced by volatile food prices, which are essentially exogenous influences not easily detected. Additionally,
the marginal effects indicate that the yield curve spreads exerts a small but positive influence on the probability of headline
and core inflation.
Table 4
Model 3 – Inflation RPI Proxy versus Yield Curve Spread – Probit Results Analysis
Model Dependent
Variable
Independent
Variable AUROC Sensitivity Specificity
Correctly
Classified Margin
3.A. RPI Headline (t+2) 3_10 Spread 0.6995 48.00% 69.84% 60.18% 0.0009754
3.B RPI Headline (t+4) 3_10 Spread 0.6935 48.98% 72.58% 62.16% 0.0009978
3.C RPI Core (t+2) 3_10 Spread 0.7688 54.55% 82.61% 71.68% 0.0012335
3.D RPI Core (t+4) 3_10 Spread 0.7271 52.38% 84.06% 72.07% 0.0010822
Source: STATA 11.1 Statistics / Data Analysis Software (2009)
0
0.1
0.2
0.3
0.4
0.5
0.6
0.7
0.8
0.9
1
Pro
babili
ty
Recession_ProxyProbability Model 2A: (Recession +6M vs ATI Index)Probability Model 2B: (Recession +12M vs ATI Index)

19
Chart 7 shows the probability of headline inflation, two and four quarters ahead as predicted by the spread between the 3-
month and 10-year treasury rates. In both models, the probability of a recession follows almost the same path with minute
differences. During the beginning of the economic downturn in 1983 to 1990, inflationary pressures were present due to the
reduction of local petroleum and other subsidies. Additionally, the social cost of currency adjustment and the price
displacement effects of VAT resulted in headline inflation remaining high. Both probit models (3A and 3B) showed an
average of 64.5 per cent and 65.0 per cent probability of headline inflation during this period. Following this, in 1991, the
probability of headline inflation jumped to 77.7 per cent and 78.6 per cent two quarters and four quarters ahead respectively,
however inflationary pressures remained subdued and well below the long run average. This false positive could be as a
result of the domestic treasury yield curve still exhibiting steepness and not accurately adjusting to economic conditions. In
1993 however, the probability of headline inflation in both models jumped to roughly 65.0 per cent as a result of foreign
exchange demand pressures, and subsequent system adjustment causing a major TT dollar depreciation. During this time,
headline inflation reached double digits and peaked at 13.4 per cent by the end of the year. Subsequent to this, robust anti-
inflationary monetary policy actions and the stabilization of the exchange rate assisted in curbing inflationary pressures,
however, various exogenous influences during this time would have resulted in the probability models exhibiting some false
negatives.
Chart 7
Probability of Headline Inflation Two and Four Quarters Ahead, as Predicted by the 3-Month and 10-Year Treasury
Spread
During mid-2005 to mid-2008, headline inflation was higher than its long run average as a result of strong economic growth
and expansion in the energy sector. However, the probability models did not reflect this until the end of 2008 to early 2009
when they jumped to over 60.0 per cent, coinciding with the leap in headline inflation to over 14.0 per cent. Over the next
three years ending March 2012, the probability of headline inflation averaged roughly 70.0 per cent in both models as the
continued effects of high fiscal expenditure and consumption, along with volatile weather conditions and the reduction in fuel
subsidies continued to introduce inflationary pressures. The probability and occurrence of headline inflation subsided
somewhat over 2012 to 2015, however a slight uptick in the likelihood of headline inflation resurfaced at the end of 2015 and
0.0
0.1
0.2
0.3
0.4
0.5
0.6
0.7
0.8
0.9
1.0
Pro
babili
ty
RPI Headline Proxy
Probability Model 3A: (Headline Proxy +2Q vs 3_10_BP_Spread)
Probability Model 3B: (Headline Proxy +4Q vs 3_10_BP_Spread)

20
early 2016. This false positive was likely due to tightening monetary policy actions and changing economic conditions
steepening the domestic yield curve.
The second part of model 3 examines the abilities of the 3-month treasury rate and 10-year bond rate spreads in forecasting
core inflation two quarters (t+2) and four quarters (t+4) ahead (Chart 8). Core inflation averaged 4.5 per cent from 1987 to
1990, 190 basis points above its long run average, and as a result of the exchange rate adjustment, price displacement
effects of VAT, and correlation with higher headline inflation. The probit models (3C and 3D) seemed to accurately forecast
this event, with the probability of core inflation averaging above 60.0 per cent in both models. At the end of 1991, the
probability models jumped to 83.5 per cent and 77.4 per cent chance of core inflation, anticipating the resurgence of core
inflation in 1992. Furthermore, in 1993 the first round effects of the Structural Adjustment Programme and subsequent
currency depreciation added significant inflationary pressures to the domestic economy. Prior to this, the probability models
again displayed a strong upswing to around 60.0 per cent, both two quarters and four quarters ahead. The following period
with low and contained core inflation, the models seem to exhibit some volatility and false negatives, however by 2008, the
rate spreads would have picked up on inflationary stresses caused by stronger economic growth and higher fiscal and
domestic spending. Following this, both the probability and occurrence of core inflation subsided over 2012 to 2015, until a
slight uptick was observed at the end of 2015 and early 2016 similar to that models 3A and 3B.
Chart 8
Probability of Core Inflation Two and Four Quarters Ahead, as Predicted by the 3-Month and 10-Year Treasury
Spread
Model 4: Inflation Proxy versus ATI Index
The final model tests the effectiveness of the stock market‘s All T&T Index (ATI) in predicting inflationary outcomes six and
twelve months ahead. As seen Table 5, headline inflation as predicted by the ATI index, resulted in lower AUROC values
which can be considered closely aligned with a random guess. Furthermore, overall correct classification of headline
inflation periods recorded lower values than that of the corresponding core inflation classification. In terms of core inflation
probit analysis, although the AUROC and overall classification values were higher than headline, the lower sensitivity
classification (17.14 per cent and 1.43 per cent) suggests that the ATI does not effectively predict high core inflation periods.
0.0
0.1
0.2
0.3
0.4
0.5
0.6
0.7
0.8
0.9
1.0
Pro
babili
ty
RPI Core Proxy
Probability Model 3C: (Core Proxy +2Q vs 3_10_BP_Spread)
Probability Model 3D: (Core Proxy +4Q vs 3_10_BP_Spread)

21
Overall, the probit results seem to be varied, however the ATI seems to predict headline and core inflation marginally better
six months ahead.
Table 5
Model 4 – Inflation RPI Proxy versus CPI – Probit Results Analysis
Model Dependent Variable Independent
Variable AUROC Sensitivity Specificity
Correctly
Classified Margin
4.A. RPI Headline (t+6) ATI_MoM_% 0.5876 38.82% 78.95% 60.00% -2.463537
4.B RPI Headline (t+12) ATI_MoM_% 0.5112 15.66% 91.21% 55.17% 0.7016989
4.C RPI Core (t+6) ATI_MoM_% 0.6256 17.14% 96.36% 65.56% -3.222407
4.D RPI Core (t+12) ATI_MoM_% 0.5755 1.43% 98.08% 59.20% -1.543152
Source: STATA 11.1 Statistics / Data Analysis Software (2009)
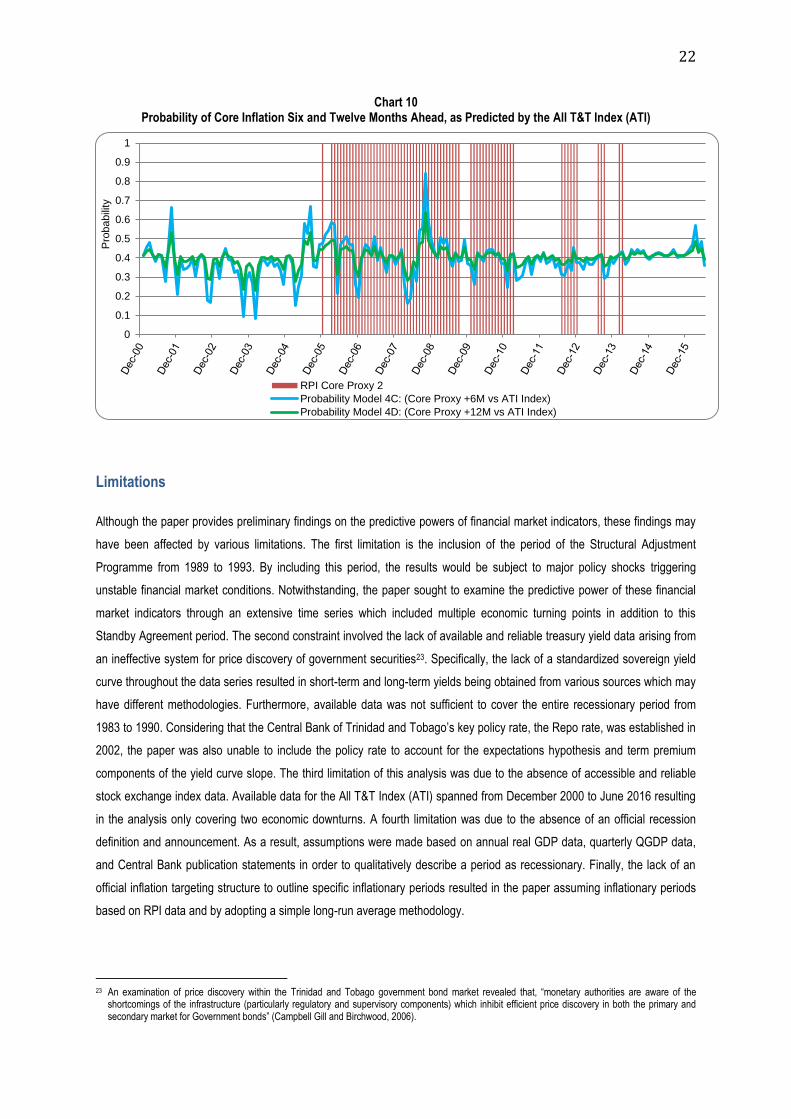
Chart 9 and 10 illustrates the probabilities as given by model 4. As seen, the volatile nature of the probabilities suggests that
the model may not be effective in predicting headline or core inflation. The only noticeable peak in likelihood occurred in the
second half of 2008, six months ahead for both headline and core inflation. During this time, the domestic stock market
experienced robust growth, aided by strong economic expansion in the energy and non-energy sectors. This period also
witnessed significant price pressures as headline and core inflation peaked at 14.4 per cent and 7.1 per cent at the end of
2008. During other periods of inflationary pressures, the probit model displays false negatives in the predictive abilities of the
All T&T Index.
Chart 9
Probability of Headline Inflation Six and Twelve Months Ahead, as Predicted by the All T&T Index (ATI)
0
0.1
0.2
0.3
0.4
0.5
0.6
0.7
0.8
0.9
1
Pro
babili
ty
RPI Headline Proxy 1
Probability Model 4A: (Headline Proxy +6M vs ATI Index)
Probability Model 4B: (Headline Proxy +12M vs ATI Index)
22
Chart 10 Probability of Core Inflation Six and Twelve Months Ahead, as Predicted by the All T&T Index (ATI)
Limitations
Although the paper provides preliminary findings on the predictive powers of financial market indicators, these findings may
have been affected by various limitations. The first limitation is the inclusion of the period of the Structural Adjustment
Programme from 1989 to 1993. By including this period, the results would be subject to major policy shocks triggering
unstable financial market conditions. Notwithstanding, the paper sought to examine the predictive power of these financial
market indicators through an extensive time series which included multiple economic turning points in addition to this
Standby Agreement period. The second constraint involved the lack of available and reliable treasury yield data arising from
an ineffective system for price discovery of government securities23. Specifically, the lack of a standardized sovereign yield
curve throughout the data series resulted in short-term and long-term yields being obtained from various sources which may
have different methodologies. Furthermore, available data was not sufficient to cover the entire recessionary period from
1983 to 1990. Considering that the Central Bank of Trinidad and Tobago‘s key policy rate, the Repo rate, was established in
2002, the paper was also unable to include the policy rate to account for the expectations hypothesis and term premium
components of the yield curve slope. The third limitation of this analysis was due to the absence of accessible and reliable
stock exchange index data. Available data for the All T&T Index (ATI) spanned from December 2000 to June 2016 resulting
in the analysis only covering two economic downturns. A fourth limitation was due to the absence of an official recession
definition and announcement. As a result, assumptions were made based on annual real GDP data, quarterly QGDP data,
and Central Bank publication statements in order to qualitatively describe a period as recessionary. Finally, the lack of an
official inflation targeting structure to outline specific inflationary periods resulted in the paper assuming inflationary periods
based on RPI data and by adopting a simple long-run average methodology.
23 An examination of price discovery within the Trinidad and Tobago government bond market revealed that, ―monetary authorities are aware of the
shortcomings of the infrastructure (particularly regulatory and supervisory components) which inhibit efficient price discovery in both the primary and secondary market for Government bonds‖ (Campbell Gill and Birchwood, 2006).
0
0.1
0.2
0.3
0.4
0.5
0.6
0.7
0.8
0.9
1
Pro
babili
ty
RPI Core Proxy 2
Probability Model 4C: (Core Proxy +6M vs ATI Index)
Probability Model 4D: (Core Proxy +12M vs ATI Index)

23
Conclusions This paper provides a preliminary examination of the performance of the domestic sovereign yield curve and the All T&T
Index (ATI) in predicting recessions and inflationary periods in the Trinidad and Tobago economy. The results obtained from
the probit models testing the yield curve spreads are encouraging and suggest that the term spread can be useful in
predicting possible recessions and inflationary outcomes two to four quarters ahead. Conversely, the models examining the
ATI seem to be average at best in forecasting future recessions, and weak in forecasting inflation.
The yield curve spread exhibits robust recession predicting abilities both two and four quarters ahead. However, the
magnitude of the probabilities and diagnostic statistics suggests that the spread is better at predicting a recession two
quarters ahead. The results also indicate that the yield curve spread is most effective in predicting core inflation, two
quarters ahead, however still fairly strong four quarters ahead. Conversely, the yield curve spread‘s power in predicting
headline inflation is somewhat weaker, likely due to the volatile nature of food prices which can be difficult to predict. The
ATI demonstrated varying performances in its macroeconomic predictive abilities. The ATI was marginally stronger in
predicting a recession six months compared to twelve months ahead. However, the results indicated a low true positive or
sensitivity score, undermining the overall performance of the index. Additionally, the stock market index also proved to be
weak in predicting inflation six months ahead and closer to a random guess twelve months ahead. These results suggest
that the stock market index may only be partially effective as leading indicator in predicting recessions, however weak in its
ability to predict inflation.
The results of this investigation correlate with evaluations performed by other studies. For example, Mills (1988) found that a
―casual observation of stock prices over the post-war period reveals that they do seem to be a leading indicator of
recessions, though an imperfect one‖. Furthermore, on comparing the potentials of bond and stock markets in forecasting
economic growth, Harvey (1989) shows that the stock return model has ―substantially less explanatory power‖24 when
compared to the yield curve spread model that possesses ―substantial out-of-sample forecasting power‖. Since variations in
stock price can contain information about future changes in economic conditions in addition to changes in cash flow risks,
forecasting using stock prices may be less accurate when compared to that using government bond and yield curve
information.
Given that the domestic yield curve spread appears to be a strong predictor of future economic downturns and inflation, it
can be adopted as a supplemental forecasting tool. The yield curve simplicity makes it valuable in double-checking25 major
macroeconomic models and even providing preliminary forecasts while major models are being estimated. Furthermore, if
the yield curve signals a change in macroeconomic conditions, analysts can then look deeper into major forecasting models
for clues on forthcoming changes. As such, in a growing energy-economy subject to external shocks, utilizing the yield curve
as an indicator can be a valuable tool in the monetary policy arsenal.
24 Harvey explains that although earnings are generally positively related to economic growth, fluctuations in stock prices can reflect investors‘ views about
the future performance of firms, and ―investors‘ changing perceptions about the riskiness of cash flows can confound the information about expected economic growth‖ (Harvey, 1989).
25 Estrella and Mishkin (1995) mention that ―if forecasts from an econometric model and the yield curve agree, confidence in the model‘s results can be enhanced. In contrast, if the yield curve indicator gives a different signal, it may be worthwhile to review the assumptions and relationships that lead to the prediction‖.

24
Appendix
Appendix 1: Area Under Receiver Operating Characteristic (AUROC)
Chart 1.A: Recession Proxy (t+2) and 3-10 Spread Chart 1.B: Recession Proxy (t+4) and 3-10 Spread
Chart 2.A: Recession Proxy (t+6) and ATI MoM% Chart 2.B: Recession Proxy (t+12) and ATI MoM%
Chart 3.A: RPI Headline (t+2) and 3-10 Spread Chart 3.B: RPI Headline (t+4) and 3-10 Spread
0.0
00
.25
0.5
00
.75
1.0
0
Se
nsitiv
ity
0.00 0.25 0.50 0.75 1.001 - Specificity
Area under ROC curve = 0.8828
0.0
00
.25
0.5
00
.75
1.0
0
Se
nsitiv
ity
0.00 0.25 0.50 0.75 1.001 - Specificity
Area under ROC curve = 0.8137
0.0
00
.25
0.5
00
.75
1.0
0
Se
nsitiv
ity
0.00 0.25 0.50 0.75 1.001 - Specificity
Area under ROC curve = 0.6497
0.0
00
.25
0.5
00
.75
1.0
0
Se
nsitiv
ity
0.00 0.25 0.50 0.75 1.001 - Specificity
Area under ROC curve = 0.6398
0.0
00
.25
0.5
00
.75
1.0
0
Se
nsitiv
ity
0.00 0.25 0.50 0.75 1.001 - Specificity
Area under ROC curve = 0.6995
0.0
00
.25
0.5
00
.75
1.0
0
Se
nsitiv
ity
0.00 0.25 0.50 0.75 1.001 - Specificity
Area under ROC curve = 0.6935

25
Chart 3.C: RPI Core (t+2) and 3-10 Spread Chart 3.D: RPI Core (t+4) and 3-10 Spread
Chart 4.A: RPI Headline (t+6) and ATI MoM% Chart 4.B: RPI Headline (t+12) and ATI MoM%
Chart 4.C: RPI Core (t+6) and ATI MoM% Chart 4.D: RPI Core (t+6) and ATI MoM%
0.0
00
.25
0.5
00
.75
1.0
0
Se
nsitiv
ity
0.00 0.25 0.50 0.75 1.001 - Specificity
Area under ROC curve = 0.7688
0.0
00
.25
0.5
00
.75
1.0
0
Se
nsitiv
ity
0.00 0.25 0.50 0.75 1.001 - Specificity
Area under ROC curve = 0.7271
0.0
00
.25
0.5
00
.75
1.0
0
Se
nsitiv
ity
0.00 0.25 0.50 0.75 1.001 - Specificity
Area under ROC curve = 0.5876
0.0
00
.25
0.5
00
.75
1.0
0
Se
nsitiv
ity
0.00 0.25 0.50 0.75 1.001 - Specificity
Area under ROC curve = 0.5112
0.0
00
.25
0.5
00
.75
1.0
0
Se
nsitiv
ity
0.00 0.25 0.50 0.75 1.001 - Specificity
Area under ROC curve = 0.6256
0.0
00
.25
0.5
00
.75
1.0
0
Se
nsitiv
ity
0.00 0.25 0.50 0.75 1.001 - Specificity
Area under ROC curve = 0.5755
26
References
Altman, Douglas G, and Martin J Bland. "Diagnostic Tests 1: Sensitivity and Specificity." British Medical Journal (BMJ) 308
(June 1994): 1552.
Bernanke, Ben S. "On the Predictive Power of Interest Rates and Interest Rate Spreads." New England Economic Review,
November / December 1990: 51-68.
Bosworth, Barry. "The Stock Market and the Economy." Brookings Papers on Economic Activity (Brookings Institution) 2
(1975): 257-300.
Campbell Gill, Michelle, and Anthony Birchwood. "Price discovery in the Trinidad and Tobago fixed-rate Government bond
market: a preliminary study." 38th Annual Monetary Studies Conference. Caribbean Centre for Money & Finance,
2006.
Central Bank of Trinidad and Tobago. "Review of the National Economy." Annual Economic Survey, 1987-2015.
—. Economic Bulletin, 1987-2015.
Estrella, Arturo. "Why Does the Yield Curve Predict Output and Inflation?" Economic Journal 115.505 (2005): 722-744.
Estrella, Arturo, and Frederic S Mishkin. "Predicting U.S. Recessions: Financial Variables as Leading Indicators." National
Bureau of Economic Research - Working Paper Series, 1995.
Estrella, Arturo, and Gikas A Hardouvelis. "The Term Structure as a Predictor of Real Economic Activity." The Journal of
Finance XLVI, no. 2 (1991).
Estrella, Arturo, and Mary R. Trubin. "The Yield Curve as a Leading Indicator: Some Practical Issues." Current Issues in
Economics and Finance (Federal Reserve Bank of New York) 12, no. 5 (2006).
Harvey, Campbell R. "Forecasts of Economic Growth from the Bond and Stock Market." Financial Analysts Journal,
September - October 1989: 38-45.
Liu, Weiling, and Emanuel Moench. "What Predicts U.S. Recessions?" Federal Reserve Bank of New York - Staff Reports,
no. No. 691 (2014).
Miles, David, Andrew Scott, and Francis Breedon. Macroeconomics: Understanding the Global Economy. Third. NY: John
Wiley & Sons Ltd., 2012.
Mills, Leonard. "Can Stock Prices Reliably Predict Recessions?" Business Review (Federal Reserve Bank of Philadelphia),
Septembe 1988.
Modigliani, Franco, and Albert Ando. "The 'Life Cycle' Hypothesis of Saving: Aggregate Implications and Tests." American
Economic Review, March 1963: 55-84.
Pearce, Douglas K. "Stock Prices and the Economy." Economic Review - Federal Reserve Bank of Kansas City, 1983.
Platt, Eric. "The 11 Best Performing Stock Markets of the Year." Business Insider. December 2011.
http://www.businessinsider.com.au/11-best-performing-stock-markets-2011-2011-12#iceland-icex-up-26-1.
StataCorp LP. "STATA Statistics / Data Analysis Software." 2009.
Stock, James H, and Mark W Watson. "New Indexes of Coincident and Lending Economic Indicators." NBER
Macroeconomics Annual (MIT Press) 4 (1989): 351-409.
Tobin, James, and William C Brainard. "Asset Markets and the Cost of Capital." Cowles Foundation Discussion. 1977.
Trinidad and Tobago Stock Exchange. "Stock Exchange Annual Report." 2005, 2015.
Wright, Jonathan H. "The Yield Curve and Predicting Recessions." Finance and Economics Discussion Series. Washington,
D.C.: Divisions of Research & Statistics and Monetary Affairs - Federal Reserve Board, 2006.