an examination of the internal consistency and structure
TRANSCRIPT

RESEARCH ARTICLE
An examination of the internal consistency
and structure of the Statistical Anxiety Rating
Scale (STARS)
Peter K. H. Chew1*, Denise B. Dillon1, Anne L. Swinbourne2
1 College of Healthcare Sciences, James Cook University, Singapore, Singapore, 2 College of Healthcare
Sciences, James Cook University, Townsville, Queensland, Australia
Abstract
The purpose of the current study was to examine the internal consistency and structure of
the English version of the Statistical Anxiety Rating Scale (STARS). Participants were 202
(79% females) psychology undergraduates was recruited from James Cook University’s
Singapore (71%) and Australia (29%) campuses. Acceptable internal consistency reliabili-
ties, ranging from .81 to .94, were found in this sample. Approximate fit indices suggest that
a correlated six first-order factor model best describes the data in contrast to theoretical con-
siderations suggesting that a six factor model with two correlated superordinate factors (i.e.,
statistics anxiety and attitudes toward statistics) best describes the data. Researchers are
recommended to use part one of the STARS to assess statistics anxiety and part two to
assess attitudes toward statistics.
Introduction
Cruise, Cash, and Bolton [1] defined statistics anxiety “as the feelings of anxiety encountered
when taking a statistics course or doing statistical analyses” (p. 92). Cruise et al. developed the
Statistical Anxiety Rating Scale, commonly known as the STARS, to measure statistics anxiety.
An initial 89-item pilot instrument was completed by 1150 participants in the USA and the
data subjected to factor analysis using the Principal Components Method with varimax rota-
tion. Results indicated that the rotation of 51 items on six factors yielded the most interpretable
structure. The six factors were: (a) Interpretation Anxiety, (b) Test and Class Anxiety, (c) Fear
of Asking for Help, (d) Worth of Statistics, (e) Computation Self-Concept, and (f) Fear of Sta-
tistics Teachers.
‘Interpretation Anxiety’ refers to the feelings of anxiety encountered when interpreting sta-
tistical data. The ‘Test and Class Anxiety’ factor encompasses the anxiety involved when
attending a statistics class or when taking a statistics test. ‘Fear of Asking for Help’ assesses the
anxiety experienced when seeking help. ‘Worth of Statistics’ relates to an individual’s percep-
tion of the relevance of statistics to the individual. ‘Computation Self-Concept’ relates to an
individual’s self-perception of his or her ability to understand and calculate statistics. Lastly,
‘Fear of Statistics Teachers’ refers to an individual’s perception of the statistics teacher.
PLOS ONE | https://doi.org/10.1371/journal.pone.0194195 March 14, 2018 1 / 12
a1111111111
a1111111111
a1111111111
a1111111111
a1111111111
OPENACCESS
Citation: Chew PKH, Dillon DB, Swinbourne AL
(2018) An examination of the internal consistency
and structure of the Statistical Anxiety Rating Scale
(STARS). PLoS ONE 13(3): e0194195. https://doi.
org/10.1371/journal.pone.0194195
Editor: Susan Dana Einbinder, California State
University Dominguez Hills, College of Health,
Human Services and Nursing, Social Work
Department - MSW Program, UNITED STATES
Received: March 20, 2017
Accepted: February 18, 2018
Published: March 14, 2018
Copyright: © 2018 Chew et al. This is an open
access article distributed under the terms of the
Creative Commons Attribution License, which
permits unrestricted use, distribution, and
reproduction in any medium, provided the original
author and source are credited.
Data Availability Statement: The data of the study
has been made available here: https://figshare.
com/articles/An_examination_of_the_internal_
consistency_and_structure_of_the_Statistical_
Anxiety_Rating_Scale_STARS_/5544883.
Funding: The author(s) received no specific
funding for this work.
Competing interests: The authors have declared
that no competing interests exist.

The 51-item STARS consists of two parts [1]. Part one consists of 23 items which assess sta-
tistics anxiety associated with situations where students have contact with statistics and it
includes the following factors: (a) Interpretation Anxiety, (b) Test and Class Anxiety, and (c)
Fear of Asking for Help. Individuals respond on a 5-point Likert scale that ranges from 1 = NoAnxiety to 5 = Strong Anxiety. Part two consists of 28 items that measure the level of agreement
with various statements about statistics and statistics teachers and it includes the following fac-
tors: (d) Worth of Statistics, (e) Computation Self-Concept, and (f) Fear of Statistics Teachers.
Responses are made on a 5-point Likert scale that ranges from 1 = Strongly Disagree to 5 =
Strongly Agree.
Despite the existence of newer measures of statistics anxiety, such as the Statistical Anxiety
Scale [2], the STARS [1] has been used extensively by researchers due to the superiority of its
reliability and validity data as compared with other measures [3]. The psychometric properties
of the STARS have been examined and empirical support has been found for the six-factor
structure in several studies using student populations in the South Africa [4], the UK [5],
China [6], Austria [7], and the USA [8]. The internal consistencies of the STARS reported by
these studies are summarized in Table 1. Furthermore, Keeley, Zayac, and Correia [9] reported
two-week test-retest reliabilities that ranged from .76 to .87 and four-months test-retest reli-
abilities that ranged from .41 to .74 (n = 83). More recently, Papousek et al. [7] reported five-
month test-retest reliabilities that ranged from .49 to .78 (n = 89). With regard to validity,
despite providing support for the six-factor structure, several researchers have argued that the
STARS assesses both statistics anxiety and attitudes toward statistics rather than only statistics
anxiety [5,7,8].
Hanna et al. [5] examined the structure of the STARS with a sample of 650 undergraduate
psychology students in the UK and reported that a correlated six first-order factor model
explained the data better than a six factor model with one superordinate factor. The results
were unexpected because the latter model should be a better model if all six factors of the
STARS assess statistics anxiety alone. For example, all six factors should load on a single super-
ordinate factor (i.e., statistics anxiety) if the STARS assesses statistics anxiety only. Instead, the
results suggest that while the six factors are correlated, they might assess a construct more mul-
tifaceted than statistics anxiety. Furthermore, Hanna et al. noted that many items and factors
of the STARS appear to assess related concepts of statistics anxiety, such as attitudes toward
statistics. Based on these findings, Hanna et al. suggested replacing the term “statistics anxiety”
with a more appropriate label such as “statistical attitudes and anxiety”.
Table 1. Internal consistency reliability coefficients (Cronbach’s alpha) of the STARS among six studies.
Factors USA [1] South Africa [4] UK[5] China [6] Austria [7] USA [8]
(n = 1150) (n = 169) (n = 650) (n = 201) (n = 400) (n = 517)
Interpretation .89 .77 .87 .86 .88 .92
Test .91 .77 .87 .85 .87 .90
Fear .85 .68 .83 .72 .86 .88
Worth .94 .86 .94 .91 .94 .95
Self-Concept .88 .81 .87 .74 .86 .89
Teachers .80 .74 .83 .69 .80 .82
Total Scale - .92 - .94 .96 -
Interpretation = Interpretation Anxiety; Test = Test and Class Anxiety; Fear = Fear of Asking for Help; Worth = Worth of Statistics; Self-Concept = Computation Self-
Concept; Teachers = Fear of Statistics Teachers.
https://doi.org/10.1371/journal.pone.0194195.t001
Statistics anxiety
PLOS ONE | https://doi.org/10.1371/journal.pone.0194195 March 14, 2018 2 / 12

Subsequently, Papousek et al. [7] translated the STARS to German and examined its struc-
ture with a sample of 400 undergraduate students in Austria. Papousek et al. argued that the
two-part nature of the STARS, as well as the different labels assigned to the Likert scales (anxi-
ety vs. agreement), suggests that part one of the STARS assesses statistics anxiety and part two
assesses attitudes toward statistics. Papousek et al. extended the work of Hanna et al. [5] by
including a six-factor model with two superordinate factors representing three factors each:
statistics anxiety (Interpretation Anxiety, Test and Class Anxiety, and Fear of Asking for Help)
and attitudes toward statistics (Worth of Statistics, Computation Self-Concept, and Fear of Sta-
tistics Teachers). Due to the use of multiple fit indices, two models were found to be equally
acceptable: a modified correlated six first-order factor model (13 error correlations were speci-
fied and item 47 was reassigned to load on another factor) and the modified six factor model
with two superordinate factors. However, Papousek et al. provided support for the latter
model by demonstrating differential validity between statistics anxiety and attitudes toward
statistics in subsequent validation studies. Nevertheless, it should be noted that the conclusions
were based on the German adaptation of the STARS.
Finally, DeVaney [8] examined the structure of the STARS with a sample of 517 graduate
students enrolled in online introductory statistics course in the USA. Three models were speci-
fied: An uncorrelated six first-order factor model (Model 1), a correlated six first-order factor
model (Model 2), and a six factor model with two correlated superordinate factors (i.e., statis-
tics anxiety and attitudes toward statistics; Model 3). The results provided support for the use
of both Model 2 and Model 3, with the latter model performing slightly better on the parsi-
mony fit indices. Despite using the English version of the STARS, it should be noted that a six
factor model with one superordinate factor (i.e., statistics anxiety only) was not examined in
the study. This exclusion precluded a comparison of the constructs assessed by the instrument
(i.e., statistics anxiety only or statistics anxiety and attitudes toward statistics).
Given the popularity of the STARS, it is important for researchers to be aware of the con-
structs assessed by the instrument. A clarification of the structure of the STARS and a distinc-
tion between statistics anxiety and attitudes toward statistics offers researchers two major
advantages. First, researchers can gain more insights into their data. For example, Bell [10]
reported that non-traditional university students (defined as students aged 25 years and
above) scored higher on the Test and Class Anxiety factor whereas traditional students (below
the age of 25 years) scored higher on the Worth of Statistics factor of the STARS. As high
scores indicate higher anxiety, the results suggest that both groups of students experience sta-
tistics anxiety, but that anxiety appears to be associated with different factors. However, if the
STARS assesses both anxiety and attitudes (with high scores on Worth of Statistics indicating
more negative attitudes), this finding could be reinterpreted to mean that non-traditional stu-
dents had higher statistics anxiety but understood the importance of statistics than did tradi-
tional students. Second, researchers can prevent multicollinearity when both variables are
studied concurrently. For example, Nasser [11] removed statistics anxiety from a model of sta-
tistics achievement due to multicollinearity with attitudes toward statistics. This precluded an
investigation on the relative importance of each variable in predicting statistics achievement.
Although a few studies have utilized confirmatory factor analysis to examine the construct
validity of the STARS, there are limitations associated with these studies [5,7,8]. Both Hanna
et al. [5] and DeVaney [8] used the English version of the STARS. However, Hanna et al. did
not include a six factor model with two correlated superordinate factors whereas DeVaney did
not include a six factor model with one superordinate factor. In contrast, although Papousek
et al. [7] examined both models concurrently, the study used a German adaptation of the
STARS and the conclusions might not generalize to the English version of the STARS. Accord-
ingly, the purpose of the current study is to bridge the research gap by examining the internal
Statistics anxiety
PLOS ONE | https://doi.org/10.1371/journal.pone.0194195 March 14, 2018 3 / 12

consistency and structure of the English version of the STARS. Three models are specified and
evaluated: a correlated six first-order factor model (Model 1), a six factor model with one
superordinate factor (i.e., statistics anxiety only) (Model 2), and a six factor model with two
correlated superordinate factors (Model 3). For Model 3, it is hypothesized that part one of the
STARS (Interpretation Anxiety, Test and Class Anxiety, and Fear of Asking for Help factors)
will load on one superordinate factor (i.e., statistics anxiety) and part two of the STARS
(Worth of statistics, Computation Self-Concept, and Fear of Statistics Teachers factors) will
load on another superordinate factor (i.e., negative attitudes toward statistics). It is hypothe-
sized that Model 3 will best represent the data from the current sample.
Method
Participants
A convenience sample of 202 (79% females) psychology undergraduates was recruited from
James Cook University’s Singapore (71%) and Australia (29%) campuses. Their ages ranged
from 17 to 54 years (M = 23.72, SD = 7.18). The predominantly female sample was consistent
with the gender distribution of the psychology undergraduate population in Singapore and
Australia. Participants were either currently enrolled in a statistics course (74%) or had com-
pleted at least one statistics course but were not currently enrolled in a statistics course (26%).
Barrett [12] recommends a minimum sample size of 200 for Confirmatory Factor Analysis/
Structural Equation Modelling.
Instruments
STARS. The basic structure and response format of the STARS have been described ear-
lier. Appropriate item scores are summed for each factor, with higher scores indicating higher
levels of statistics anxiety.
Statistical anxiety scale (SAS). The SAS is a 24-item instrument designed to assess three
factors of statistics anxiety: (a) Examination Anxiety, (b) Asking for Help Anxiety, and (c)
Interpretation Anxiety [2]. Individuals respond on a 5-point Likert scale that ranges from 1 =
No Anxiety to 5 = Considerable Anxiety. Appropriate item scores are summed for each factor,
with higher scores indicating higher levels of statistics anxiety. Vigil-Colet et al. [2] reported
internal consistency ranging from.82 to .92 for the subscales and .91 for the total scale
(n = 159). The three-factor structure has been confirmed in at least one psychometric study
[13].
Attitudes toward statistics scale (ATS). The ATS is a 29-item instrument designed to
assess two aspects of an individual’s attitudes toward statistics: (a) Attitudes toward Field and
(b) Attitudes toward Course [14]. Responses are made on a 5-point Likert scale that ranges
from 1 = Strongly Disagree to 5 = Strongly Agree. Fourteen negatively worded items are reverse
scored and the appropriate item scores are summed for each factor and for the total scale.
Higher scores indicate higher levels of positive attitudes toward statistics. Wise [14] reported
internal consistency of .92 and .90, and two week test-retest reliability of .82 and .91, for the
Attitudes toward Field subscale and the Attitudes toward Course subscale, respectively
(n = 92). The two-factor structure has been confirmed in other factor-analytic studies [15,16].
Procedure
A link to the online study was made available to potential participants. Participants were pre-
sented with an information page which describes the study and the type of information being
requested from them. Subsequently, participants provided informed consent by clicking ‘Next’
Statistics anxiety
PLOS ONE | https://doi.org/10.1371/journal.pone.0194195 March 14, 2018 4 / 12
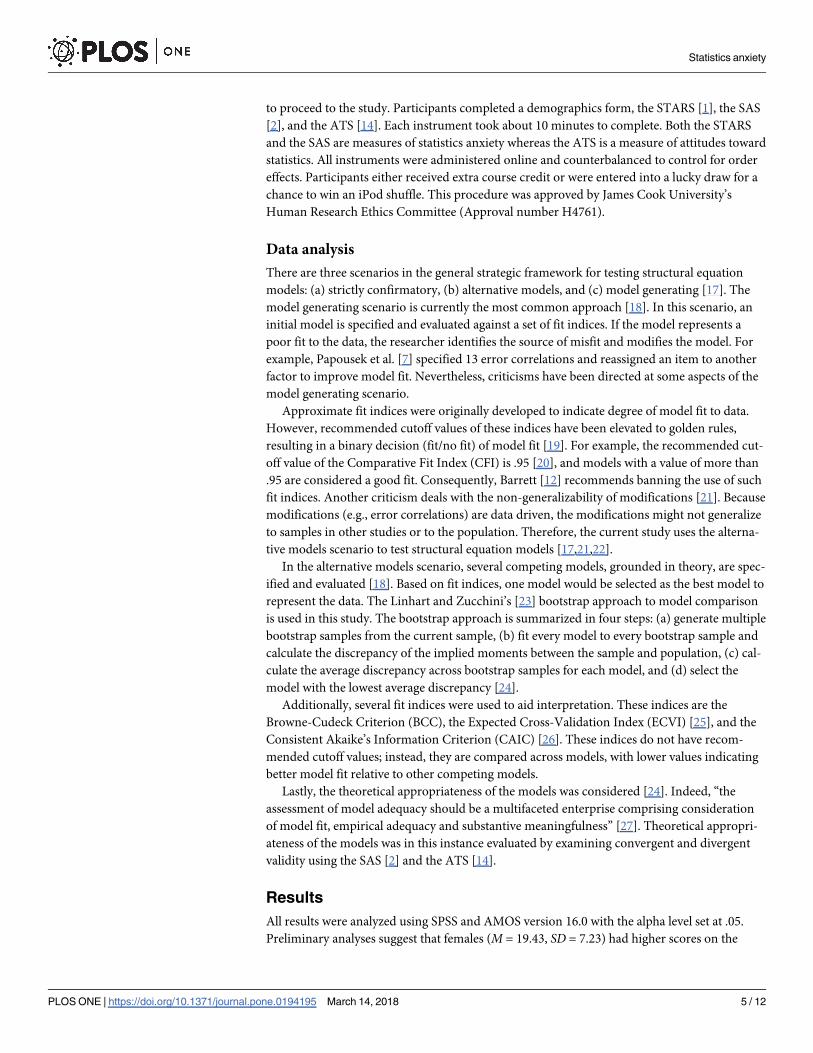
to proceed to the study. Participants completed a demographics form, the STARS [1], the SAS
[2], and the ATS [14]. Each instrument took about 10 minutes to complete. Both the STARS
and the SAS are measures of statistics anxiety whereas the ATS is a measure of attitudes toward
statistics. All instruments were administered online and counterbalanced to control for order
effects. Participants either received extra course credit or were entered into a lucky draw for a
chance to win an iPod shuffle. This procedure was approved by James Cook University’s
Human Research Ethics Committee (Approval number H4761).
Data analysis
There are three scenarios in the general strategic framework for testing structural equation
models: (a) strictly confirmatory, (b) alternative models, and (c) model generating [17]. The
model generating scenario is currently the most common approach [18]. In this scenario, an
initial model is specified and evaluated against a set of fit indices. If the model represents a
poor fit to the data, the researcher identifies the source of misfit and modifies the model. For
example, Papousek et al. [7] specified 13 error correlations and reassigned an item to another
factor to improve model fit. Nevertheless, criticisms have been directed at some aspects of the
model generating scenario.
Approximate fit indices were originally developed to indicate degree of model fit to data.
However, recommended cutoff values of these indices have been elevated to golden rules,
resulting in a binary decision (fit/no fit) of model fit [19]. For example, the recommended cut-
off value of the Comparative Fit Index (CFI) is .95 [20], and models with a value of more than
.95 are considered a good fit. Consequently, Barrett [12] recommends banning the use of such
fit indices. Another criticism deals with the non-generalizability of modifications [21]. Because
modifications (e.g., error correlations) are data driven, the modifications might not generalize
to samples in other studies or to the population. Therefore, the current study uses the alterna-
tive models scenario to test structural equation models [17,21,22].
In the alternative models scenario, several competing models, grounded in theory, are spec-
ified and evaluated [18]. Based on fit indices, one model would be selected as the best model to
represent the data. The Linhart and Zucchini’s [23] bootstrap approach to model comparison
is used in this study. The bootstrap approach is summarized in four steps: (a) generate multiple
bootstrap samples from the current sample, (b) fit every model to every bootstrap sample and
calculate the discrepancy of the implied moments between the sample and population, (c) cal-
culate the average discrepancy across bootstrap samples for each model, and (d) select the
model with the lowest average discrepancy [24].
Additionally, several fit indices were used to aid interpretation. These indices are the
Browne-Cudeck Criterion (BCC), the Expected Cross-Validation Index (ECVI) [25], and the
Consistent Akaike’s Information Criterion (CAIC) [26]. These indices do not have recom-
mended cutoff values; instead, they are compared across models, with lower values indicating
better model fit relative to other competing models.
Lastly, the theoretical appropriateness of the models was considered [24]. Indeed, “the
assessment of model adequacy should be a multifaceted enterprise comprising consideration
of model fit, empirical adequacy and substantive meaningfulness” [27]. Theoretical appropri-
ateness of the models was in this instance evaluated by examining convergent and divergent
validity using the SAS [2] and the ATS [14].
Results
All results were analyzed using SPSS and AMOS version 16.0 with the alpha level set at .05.
Preliminary analyses suggest that females (M = 19.43, SD = 7.23) had higher scores on the
Statistics anxiety
PLOS ONE | https://doi.org/10.1371/journal.pone.0194195 March 14, 2018 5 / 12

Computation Self-Concept factor than males [M = 16.35, SD = 5.86, t(80.09) = -2.90, p< .01].
Additionally, participants from the Singapore campus (M = 32.73, SD = 8.16) had higher
scores on the Interpretation Anxiety factor than their counterparts from the Australian cam-
puses [M = 27.10, SD = 9.55, t(200) = -4.23, p< .001]. However, the sample size was not large
enough to permit separate investigations. Thus, the results were collapsed across gender and
campuses. Internal consistencies, means, and standard deviations of the STARS [1], the SAS
[2], and the ATS [14] are presented in Table 2. Cronbach’s alphas of the STARS ranged from
.81 to .94, which was well above the acceptable alpha of .70 [28]. The intercorrelations between
factors of the STARS are presented in Table 3.
To evaluate the structure of the STARS [1], the following models were specified and evalu-
ated: a correlated six first-order factor model (Model 1), a six-factor model with one superordi-
nate factor (i.e., statistics anxiety only) (Model 2), and a six-factor model with two correlated
superordinate factors (i.e., statistics anxiety and negative attitudes toward statistics) (Model 3).
Bootstrapping was used with 1000 bootstrap samples and the results are presented in Table 4.
Model 1 had the lowest mean discrepancy and fit indices values, followed closely by Model 3
and lastly, Model 2. Hence, the fit indices suggest Model 1 to be the best fit to the data of the
three models tested (see Figs 1–3 for the standardized estimates of all three models, respec-
tively). The nested χ2 difference test was conducted to compare the remaining models. Model
3 (χ2(1217) = 2760.41) was a better fit to the data than Model 2 (χ2
(1218) = 2824.85), Δ χ2(1) =
64.44, p< .001.
Table 2. Internal consistencies (Cronbach’s alpha), means, and standard deviations of the STARS, the SAS, and the ATS.
STARS Cronbach’s alpha M SD No. of Items M / No. of Items
Interpretation Anxiety .91 31.08 8.94 11 2.83
Test and Class Anxiety .89 28.71 6.51 8 3.59
Fear of Asking for Help .88 9.93 4.07 4 2.48
Worth of Statistics .94 39.09 13.49 16 2.44
Computation Self-Concept .90 18.77 7.06 7 2.68
Fear of Statistics Teachers .81 11.41 4.20 5 2.28
SAS
Examination Anxiety .89 32.93 5.69 8 4.17
Asking for Help Anxiety .95 20.49 8.21 8 2.56
Interpretation Anxiety .89 21.18 6.71 8 2.65
ATS
Attitudes toward Field .91 72.67 11.58 20 3.63
Attitudes toward Course .91 26.78 8.35 9 2.98
https://doi.org/10.1371/journal.pone.0194195.t002
Table 3. Intercorrelations between factors of the STARS.
1 2 3 4 5 6
1. Interpretation Anxiety -
2. Test and Class Anxiety .62� -
3. Fear of Asking for Help .69� .48� -
4. Worth of Statistics .44� .35� .43� -
5. Computation Self-Concept .51� .59� .48� .74� -
6. Fear of Statistics Teachers .40� .29� .42� .68� .61� -
�p < .01.
https://doi.org/10.1371/journal.pone.0194195.t003
Statistics anxiety
PLOS ONE | https://doi.org/10.1371/journal.pone.0194195 March 14, 2018 6 / 12

Convergent and divergent validity
The theoretical appropriateness of the models was evaluated by examining convergent and
divergent validity of the factors. The hypothesized superordinate factors of the STARS were
derived by summing scores on the respective factors: (a) STARS-Anxiety (Interpretation Anxi-
ety, Test and Class Anxiety, and Fear of Asking for Help factors), (b) STARS-Negative Atti-
tudes (Worth of Statistics, Computation Self-Concept, and Fear of Statistics Teachers factors),
and (c) STARS-Total Scale (all six factors). SAS-Anxiety was derived by summing scores from
the three factors of the SAS [2] and ATS-Positive attitudes was derived by summing scores
from the two factors of the ATS [14]. Table 5 presents the correlations between these variables.
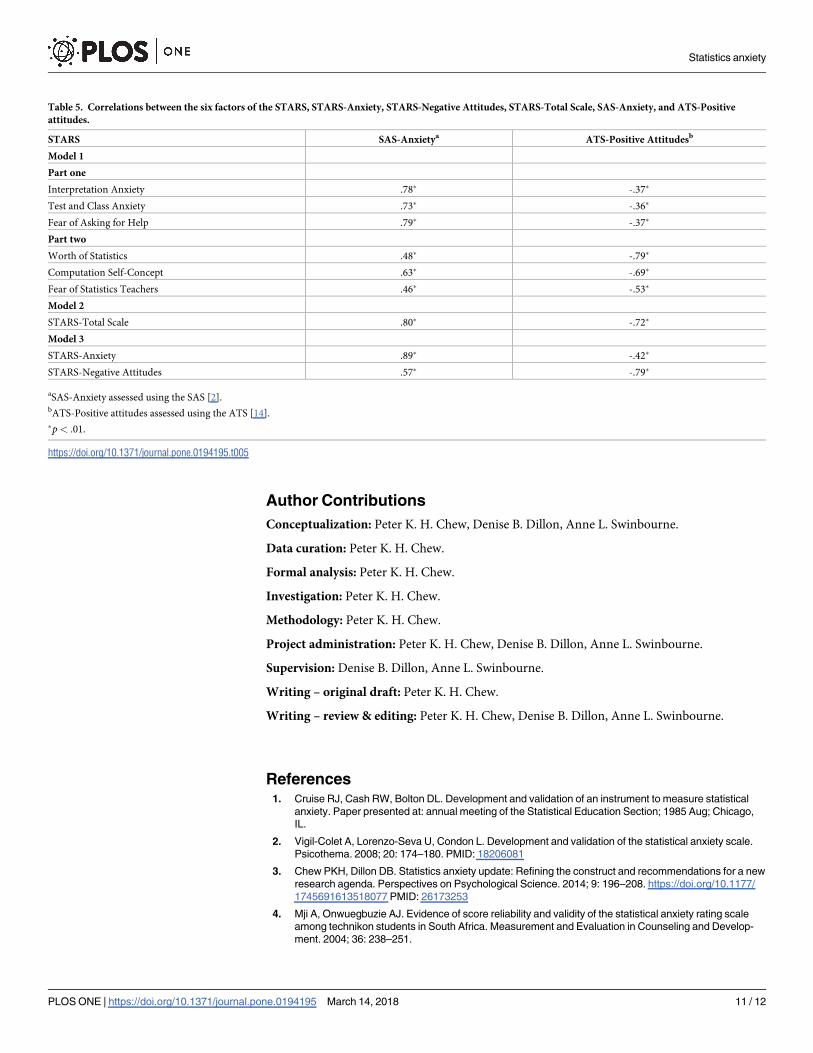
At least one factor in each model was highly correlated with ATS-Positive Attitudes. Model
3 was the only model to discriminate between anxiety and attitudes: STARS-Anxiety had a
larger correlation with SAS-Anxiety than ATS-Positive Attitudes whereas STARS-Negative
Attitudes had a larger correlation with ATS-Positive Attitudes than SAS-Anxiety. Therefore,
theoretical considerations suggest Model 3 best describe the data compared to competing
models.
Discussion
The purpose of the study was to examine the internal consistency and structure of the English
version of the STARS. Consistent with previous studies [5,7,8], acceptable internal consistency
reliabilities were found in the current study. For example, Papousek et al. [7] reported internal
consistency which ranged from .80 to .96 whereas the current study reported internal consis-
tency which ranged from .81 to .94. With regard to the structure of the STARS, it was hypothe-
sized that Model 3 would best represent the data from the current sample. The results
provided partial support for the hypothesis. Although the fit indices suggested that Model 1
provided the best fit to the data, theoretical considerations suggested that Model 3 best
describe the data.
The results were consistent with previous studies that indicate that the STARS assesses a
construct broader than statistics anxiety [5,7,8]. The fit indices showed that Model 2 repre-
sented a poor fit to the data compared to Model 1 and Model 3. More important, the use of
only one superordinate factor (i.e., statistics anxiety) did not discriminate between anxiety and
attitudes. The total scale of the STARS had large correlations with statistics anxiety and atti-
tudes toward statistics. This would result in multicollinearity in studies where both variables
are examined concurrently [11]. Thus, researchers should not use the STARS as a measure of
statistics anxiety.
The results were also consistent with previous studies that found both the correlated six
first-order factor model and the six-factor model with two correlated superordinate factors to
be acceptable models for the STARS [7,8]. The fit indices suggested Model 1 to be the best fit
of the data compared to competing models. Nevertheless, the theoretical appropriateness of
Table 4. Average mean discrepancies and fit indices for three competing models of the STARS.
Model Failures Mean Discrepancy BCC CAIC ECVI
1 0 2907.93 3023.56 3445.96 14.64
2 0 3012.55 3116.23 3506.14 15.13
3 0 2951.16 3054.49 3448.01 14.82
Model 1 = correlated six first-order model; Model 2 = six-factor model with one superordinate factor; Model 3 = six-factor model with two correlated superordinate
factors; BCC = Browne-Cudeck Criterion; CAIC = Consistent Akaike’s Information Criterion; ECVI = Expected Cross-Validation Index.
https://doi.org/10.1371/journal.pone.0194195.t004
Statistics anxiety
PLOS ONE | https://doi.org/10.1371/journal.pone.0194195 March 14, 2018 7 / 12
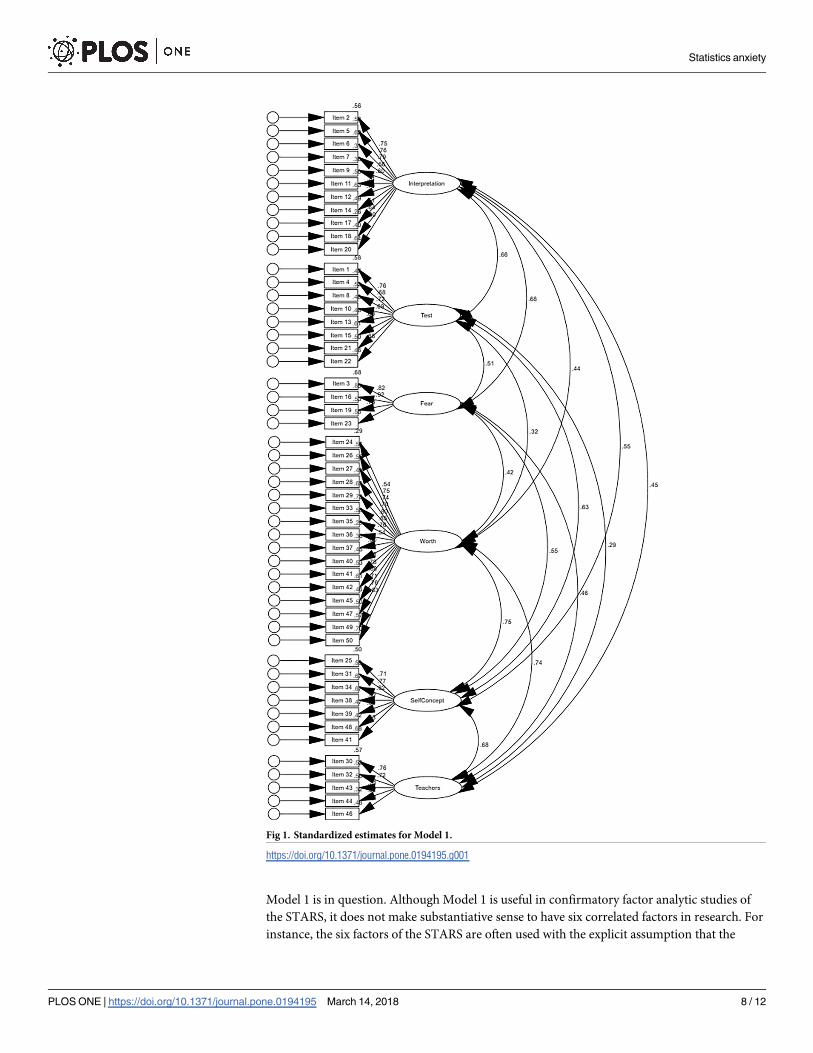
Model 1 is in question. Although Model 1 is useful in confirmatory factor analytic studies of
the STARS, it does not make substantiative sense to have six correlated factors in research. For
instance, the six factors of the STARS are often used with the explicit assumption that the
Fig 1. Standardized estimates for Model 1.
https://doi.org/10.1371/journal.pone.0194195.g001
Statistics anxiety
PLOS ONE | https://doi.org/10.1371/journal.pone.0194195 March 14, 2018 8 / 12

factors are indicators of a higher level construct (i.e., statistics anxiety) [10,11]. Additionally,
while part one discriminated between anxiety and attitudes, the Computation Self-Concept
factor and the Fear of Statistics Teachers factor of part two had similar correlations with both
anxiety and attitudes. Hence, we recommend researchers use Model 3 in their studies.
Model 3 appears to be a promising model. In terms of fit indices, it was a better model than
Model 2, and had similar values on the CAIC and the ECVI with Model 1. With regard to the-
oretical appropriateness, Model 3 distinguished between anxiety and attitudes. This allows
both variables to be studied concurrently and may provide researchers with clearer insights
Fig 2. Standardized estimates for Model 2.
https://doi.org/10.1371/journal.pone.0194195.g002
Statistics anxiety
PLOS ONE | https://doi.org/10.1371/journal.pone.0194195 March 14, 2018 9 / 12

into their data. Therefore, we recommend researchers use part one of the STARS to assess sta-
tistics anxiety and part two to assess attitudes toward statistics.
Limitations of the study should be noted. First, the sample was drawn predominantly from
psychology undergraduates in Singapore and Australia; the results might not generalize to
graduate students or undergraduates in other disciplines (e.g., Information Technology). Sec-
ond, the sample size did not permit separate investigations across demographic variables such
as gender and campus/country (Singapore vs. Australia). In particular, since preliminary anal-
ysis found some differences in statistics anxiety for these variables, future research should
examine the structure invariance of Model 3 across these variables.
The use of Model 3 provides several future research directions. Currently, the general con-
sensus has been that negative attitudes toward statistics result in statistics anxiety [29]. Future
research could administer both parts of the STARS at the start and end of the semester to test
this notion empirically. Future research could also examine the relative importance of these
two superordinate factors in predicting statistics achievement. Armed with such information,
interventions could be designed to target the appropriate construct, either by reducing statis-
tics anxiety or by reducing negative attitudes toward statistics.
Fig 3. Standardized estimates for Model 3.
https://doi.org/10.1371/journal.pone.0194195.g003
Statistics anxiety
PLOS ONE | https://doi.org/10.1371/journal.pone.0194195 March 14, 2018 10 / 12
Author Contributions
Conceptualization: Peter K. H. Chew, Denise B. Dillon, Anne L. Swinbourne.
Data curation: Peter K. H. Chew.
Formal analysis: Peter K. H. Chew.
Investigation: Peter K. H. Chew.
Methodology: Peter K. H. Chew.
Project administration: Peter K. H. Chew, Denise B. Dillon, Anne L. Swinbourne.
Supervision: Denise B. Dillon, Anne L. Swinbourne.
Writing – original draft: Peter K. H. Chew.
Writing – review & editing: Peter K. H. Chew, Denise B. Dillon, Anne L. Swinbourne.
References1. Cruise RJ, Cash RW, Bolton DL. Development and validation of an instrument to measure statistical
anxiety. Paper presented at: annual meeting of the Statistical Education Section; 1985 Aug; Chicago,
IL.
2. Vigil-Colet A, Lorenzo-Seva U, Condon L. Development and validation of the statistical anxiety scale.
Psicothema. 2008; 20: 174–180. PMID: 18206081
3. Chew PKH, Dillon DB. Statistics anxiety update: Refining the construct and recommendations for a new
research agenda. Perspectives on Psychological Science. 2014; 9: 196–208. https://doi.org/10.1177/
1745691613518077 PMID: 26173253
4. Mji A, Onwuegbuzie AJ. Evidence of score reliability and validity of the statistical anxiety rating scale
among technikon students in South Africa. Measurement and Evaluation in Counseling and Develop-
ment. 2004; 36: 238–251.
Table 5. Correlations between the six factors of the STARS, STARS-Anxiety, STARS-Negative Attitudes, STARS-Total Scale, SAS-Anxiety, and ATS-Positive
attitudes.
STARS SAS-Anxietya ATS-Positive Attitudesb
Model 1
Part one
Interpretation Anxiety .78� -.37�
Test and Class Anxiety .73� -.36�
Fear of Asking for Help .79� -.37�
Part two
Worth of Statistics .48� -.79�
Computation Self-Concept .63� -.69�
Fear of Statistics Teachers .46� -.53�
Model 2
STARS-Total Scale .80� -.72�
Model 3
STARS-Anxiety .89� -.42�
STARS-Negative Attitudes .57� -.79�
aSAS-Anxiety assessed using the SAS [2].bATS-Positive attitudes assessed using the ATS [14].
�p < .01.
https://doi.org/10.1371/journal.pone.0194195.t005
Statistics anxiety
PLOS ONE | https://doi.org/10.1371/journal.pone.0194195 March 14, 2018 11 / 12

5. Hanna D, Shevlin M, Dempster M. The structure of the statistics anxiety rating scale: A confirmatory fac-
tor analysis using UK psychology students. Personality and Individual Differences. 2008; 45: 68–74.
https://doi.org/10.1016/j.paid.2008.02.021
6. Liu S, Onwuegbuzie AJ, Meng L. Examination of the score reliability and validity of the statistics anxiety
rating scale in a Chinese population: Comparisons of statistics anxiety between Chinese college stu-
dents and their Western counterparts. Journal of Educational Enquiry. 2011; 11: 29–42.
7. Papousek I, Ruggeri K, Macher D, Paechter M, Heene M, Weiss EM, et al. Psychometric evaluation
and experimental validation of the statistics anxiety rating scale. Journal of Personality Assessment.
2012; 94: 82–91. https://doi.org/10.1080/00223891.2011.627959 PMID: 22176269
8. DeVaney TA. Confirmatory factor analysis of the statistical anxiety rating scale with online graduate stu-
dents. Psychological Reports. 2016; 118: 565–586. https://doi.org/10.1177/0033294116644093 PMID:
27154380
9. Keeley J, Zayac R, Correia C. Curvilinear relationships between statistics anxiety and performance
among undergraduate students: Evidence for optimal anxiety. Statistics Education Research Journal.
2008; 7: 4–15.
10. Bell JA. Statistics anxiety: The nontraditional student. Education. 2003; 124: 157–162.
11. Nasser FM. Structural model of the effects of cognitive and affective factors on the achievement of ara-
bic-speaking pre-service teachers in introductory statistics. Journal of Statistics Education. 2004; 12.
Available: http://www.amstat.org/publications/jse/v12n1/nasser.html
12. Barrett P. Structural equation modelling: Adjudging model fit. Personality and Individual Differences.
2007; 42: 815–824. https://doi.org/10.1016/j.paid.2006.09.018
13. Chiesi F, Primi C, Carmona J. Measuring statistics anxiety: Cross-country validity of the statistical anxi-
ety scale (SAS). Journal of Psychoeducational Assessment. 2011; 29: 559–569. https://doi.org/10.
1177/0734282911404985
14. Wise SL. The development and validation of a scale measuring attitudes toward statistics. Educational
and Psychological Measurement. 1985; 45: 401–405. https://doi.org/10.1177/001316448504500226
15. Shultz KS, Koshino H. Evidence of reliability and validity for wise’s attitudes toward statistics scale. Psy-
chological Reports. 1998; 82: 27–31.
16. Waters LK, Martelli T, Zakrajsek T, Popovich PM. Factor analyses of two measures of attitudes toward
statistics. Educational and Psychological Measurement. 1988; 48: 1037–1041. https://doi.org/10.1177/
0013164488484020
17. Joreskog KG. Testing structural equation models. In: Bollen KA, Long JS, editors. Testing structural
equation models. Newbury Park, CA: Sage; 1993. pp. 294–316.
18. Byrne BM. Structural equation modeling with AMOS: Basic concepts, applications, and programming,
second edition. 2nd ed. New York: Routledge; 2010.
19. Marsh HW, Hau K-T, Wen Z. In search of golden rules: Comment on hypothesis-testing approaches to
setting cutoff values for fit indexes and dangers in overgeneralizing Hu and Bentler’s (1999) findings.
Structural Equation Modeling: A Multidisciplinary Journal. 2004; 11: 320–341. https://doi.org/10.1207/
s15328007sem1103_2
20. Hu L, Bentler PM. Cutoff criteria for fit indexes in covariance structure analysis: Conventional criteria
versus new alternatives. Structural Equation Modeling: A Multidisciplinary Journal. 1999; 6: 1–55.
https://doi.org/10.1080/10705519909540118
21. MacCallum RC, Roznowski M, Necowitz LB. Model modifications in covariance structure analysis: The
problem of capitalization on chance. Psychological Bulletin. 1992; 111: 490. PMID: 16250105
22. MacCallum RC, Wegener DT, Uchino BN, Fabrigar LR. The problem of equivalent models in applica-
tions of covariance structure analysis. Psychological Bulletin. 1993; 114: 185. PMID: 8346326
23. Linhart H, Zucchini W. Model selection. New York: John Wiley and Sons; 1986.
24. Arbuckle JL. Amos 16 user’s guide. Chicago: SPSS; 2007.
25. Browne MW, Cudeck R. Single sample cross-validation indices for covariance structures. Multivariate
Behavioral Research. 1989; 24: 445–455. https://doi.org/10.1207/s15327906mbr2404_4 PMID: 26753509
26. Bozdogan H. Model selection and Akaike’s Information Criterion (AIC): The general theory and its ana-
lytical extensions. Psychometrika. 1987; 52: 345–370. https://doi.org/10.1007/BF02294361
27. Markland D. The golden rule is that there are no golden rules: A commentary on Paul Barrett’s recom-
mendations for reporting model fit in structural equation modelling. Personality and Individual Differ-
ences. 2007; 42: 851–858. https://doi.org/10.1016/j.paid.2006.09.023
28. Nunnally JC. Psychometric Theory. New York: McGraw-Hill; 1978.
29. Chiesi F, Primi C. Cognitive and non-cognitive factors related to students’ statistics achievement. Statis-
tics Education Research Journal. 2010; 9: 6–26.
Statistics anxiety
PLOS ONE | https://doi.org/10.1371/journal.pone.0194195 March 14, 2018 12 / 12