an evaluation of montessori education in south arolinas ... · montessori students in ela, math,...
TRANSCRIPT
AN EVALUATION CONDUCTED BY
THE RILEY INSTITUTE® AT FURMAN
WITH SUPPORT FROM:
Self Family Foundation S.C. Education Oversight Committee
An Evaluation of Montessori Education
in South Carolina’s Public Schools
Full Report


Leadership, Knowledge, Impact.
The Riley Institute at Furman broadens student and community perspective about issues critical to South Carolina’s
progress. It builds and engages present and future leaders, creates and shares data-supported information about the
state’s core challenges, and links the leadership body to those solutions to drive sustainable solutions.
Launched in 1999, the Institute is named for former South Carolina governor and former United States Secretary of
Education Richard W. (Dick) Riley. It is committed to nonpartisanship in all it does and to a rhetoric-free, facts-based
approach to change.
The Riley Institute’s research group promotes evidence informed education practices and supports organizations that
serve children and families across South Carolina. Part of the Institute’s Center for Education Policy and Leadership, the
group conducts in-depth research and evaluation studies to support organizational decision-making and practice. It
also builds internal evaluation capacity among organizations serving children and families so that outcomes are
maximized for citizens across the state.
For more information, please visit riley.furman.edu


An Evaluation of Montessori Education in
South Carolina’s Public Schools
Table of Contents
Executive Summary..................................................................................................................................................1
Montessori Education and Prior Research...............................................................................................................1
Study Components...................................................................................................................................................2
Key Research Findings..............................................................................................................................................3
Montessori in South Carolina’s Public Schools.........................................................................................................5
A Demographic Analysis of Participation in Public School Montessori………............................................................7
Fidelity to the Montessori Model in Public School Classrooms……….......................................................................9
Exploring the Impact of Public School Montessori on Academic and Behavioral Outcomes..................................13
Exploring the Impact of Public School Montessori on Affective Outcomes............................................................19
Teacher Perceptions of Montessori’s Impact on Students and Teaching………………………………………..…………..……..23
Conclusion and Discussion.......................................................................................................................................27
Acknowledgements..…………………............................................................................................................................28
References...............................................................................................................................................................29

Executive Summary
With support from the Self Family Foundation and the South Carolina Education Oversight Committee, the Riley
Institute has completed a multi-year study of Montessori education in South Carolina’s public schools, the most
comprehensive evaluation of public Montessori ever conducted in the United States. Between 2011 and 2016, this
mixed-method study examined how Montessori impacts stakeholders in South Carolina and provided information
needed to guide future investment in Montessori education. Researchers investigated the following as parts of the
study: the extent to which schools implemented Montessori with fidelity; the demographic makeup of public school
Montessori students; the effect of Montessori education on academic and behavioral outcomes; the impact of
Montessori education on creativity, social skills, work habits, and executive function; and Montessori teachers’
perspectives on job satisfaction and the challenges of Montessori in the public sector. The study results demonstrate
that students in public school Montessori classrooms across the state are faring well, as compared to similar non-
Montessori public school students, when examining academic, behavioral, and affective outcomes.
Montessori Education and Prior Research
Dr. Maria Montessori developed the Montessori education model over 100 years ago. The Montessori model is a child-
centered educational approach based on scientific observations of children from birth to adulthood. The necessary
components for a Montessori program to be considered authentic include multiage groupings that foster peer learning,
uninterrupted blocks of work time, and guided choice of work activities. In addition, specially designed lessons are
provided, and hands-on Montessori learning materials are carefully arranged and available for use to students in an
aesthetically pleasing environment. According to the Montessori model, there are no extrinsic rewards offered or
grades assigned, and children are encouraged to explore personal interests, while widely engaging with others.
Angeline Lillard (2017) further outlines the essential principles of Montessori in her book, Montessori: The Science
Behind the Genius.
There have been a number of prior evaluations that have explored Montessori education and have measured
outcomes of participation in Montessori education, both in the public and private sectors (Ansari, 2014; Byun, Blair, &
Pate, 2013; Hanson, 2009; Dohrmann, Nishida, Gartner, Lipsky, & Grimm, 2007; Lillard & Else-Quest, 2006; Lopata,
Wallace, & Finn, 2005; Peng & Md-Yunus, 2014; Rathunde & Csikszentmihalyi, 2005). While sometimes demonstrating
findings in favor of Montessori education, many of these studies have serious limitations, such as small sample sizes,
questionable authenticity of Montessori methods, and selection bias. More recently, a randomized controlled trial was
conducted that addresses many of these concerns and points to positive outcomes for children participating in high
fidelity Montessori primary programs (Lillard, Heise, Richey, Tong, Hart, & Bray, 2017). However, taken as a whole body
of work, the small quantity of research on Montessori education as compared to other educational models
demonstrates the critical need for more research in this area. The study described below attempts to fill some of the
gaps, particularly for research focusing on public sector Montessori education.
An Evaluation of Montessori Education in South Carolina’s Public Schools | 1

Study Components
Impact Study
Data about academic and behavioral outcomes, such as standardized test performance, discipline, and attendance, were
explored yearly as part of the impact study, along with affective outcomes such as creativity, social skills, work habits, and
executive function.
Analyzing Student Demographics. Using existing student record databases maintained by the South Carolina
Department of Education (SCDE), researchers compared demographic characteristics (gender, race, family
income, ESL status, and special education status) of Montessori students and non-Montessori public school
students.
Analyzing Student Academic and Behavioral Outcomes. Researchers used existing student record databases
maintained by the SCDE to examine standardized test performance, discipline, and attendance. The research
team compared outcomes of Montessori students to demographically similar students who did not attend a
Montessori school.
Examining the Impact of Montessori on Affective Outcomes. Researchers examined differences in how a
cohort of Montessori students and non-Montessori students performed on assessments measuring creativity,
work habits, social skills, and executive function. A cohort of students in a high-fidelity Montessori school was
selected and tracked across four years. This cohort was compared to non-Montessori students in a
demographically similar school in a different school district.
Gaining a Deeper Understanding of Montessori Programs: Surveying Montessori Teachers. Researchers
examined how Montessori programs affected students, teachers, and schools from the perspectives of
teachers. In the 2013-14 and 2015-16 academic years, an online survey was administered to all Montessori
teachers within the South Carolina public school system. For both years of distribution, an average of 72% of
Montessori teachers responded.
Implementation Study
Information about the extent to which public schools were adhering to the Montessori model was assessed in a two-part
fidelity study.
Programmatic Fidelity. Montessori principals in the state completed a survey each year about their school’s
Montessori program. Questions were asked about implementation factors including multi-aged groupings,
student assessment protocols, Montessori materials and equipment, Montessori accreditation, and teacher
and assistant Montessori credentialing and training.
Classroom Observations. Over four years, 126 classrooms across the state were randomly selected for an
unannounced observation. Retired Montessori teachers who met stringent requirements and underwent
extensive training conducted these observations. Teacher interviews were included as a part of this process.
2| An Evaluation of Montessori Education in South Carolina’s Public Schools
Overview of Key Findings
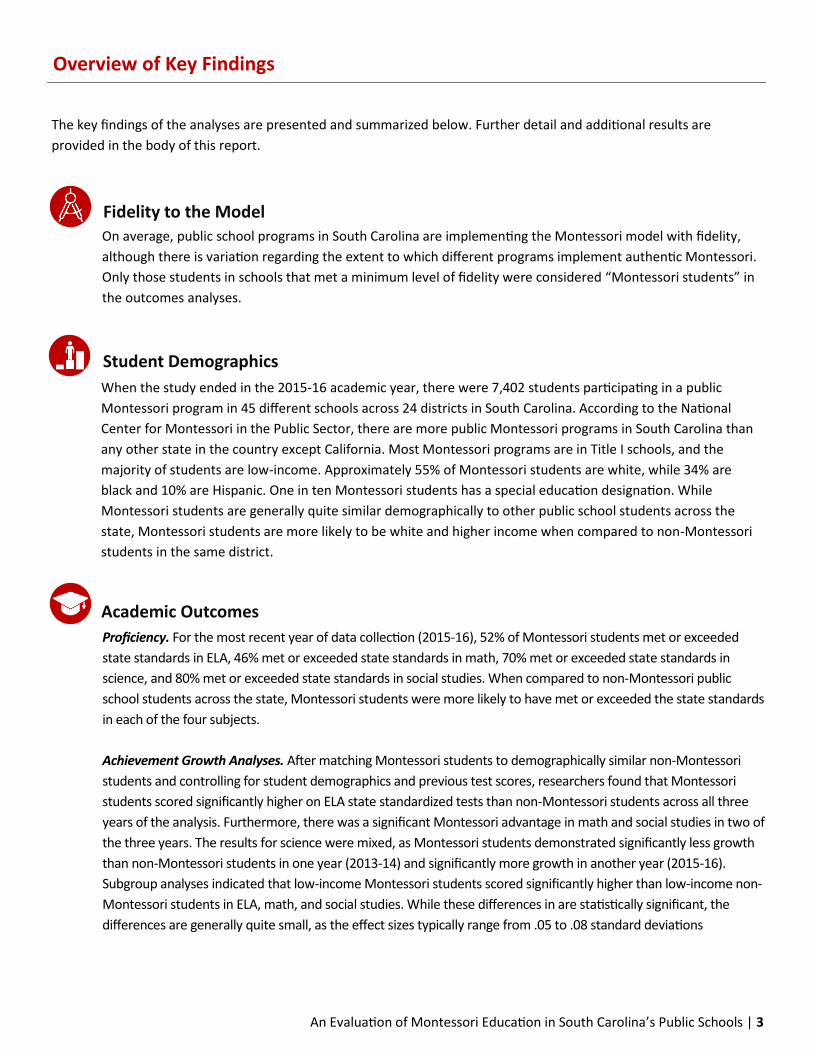
On average, public school programs in South Carolina are implementing the Montessori model with fidelity,
although there is variation regarding the extent to which different programs implement authentic Montessori.
Only those students in schools that met a minimum level of fidelity were considered “Montessori students” in
the outcomes analyses.
When the study ended in the 2015-16 academic year, there were 7,402 students participating in a public
Montessori program in 45 different schools across 24 districts in South Carolina. According to the National
Center for Montessori in the Public Sector, there are more public Montessori programs in South Carolina than
any other state in the country except California. Most Montessori programs are in Title I schools, and the
majority of students are low-income. Approximately 55% of Montessori students are white, while 34% are
black and 10% are Hispanic. One in ten Montessori students has a special education designation. While
Montessori students are generally quite similar demographically to other public school students across the
state, Montessori students are more likely to be white and higher income when compared to non-Montessori
students in the same district.
The key findings of the analyses are presented and summarized below. Further detail and additional results are
provided in the body of this report.
Proficiency. For the most recent year of data collection (2015-16), 52% of Montessori students met or exceeded
state standards in ELA, 46% met or exceeded state standards in math, 70% met or exceeded state standards in
science, and 80% met or exceeded state standards in social studies. When compared to non-Montessori public
school students across the state, Montessori students were more likely to have met or exceeded the state standards
in each of the four subjects.
Achievement Growth Analyses. After matching Montessori students to demographically similar non-Montessori
students and controlling for student demographics and previous test scores, researchers found that Montessori
students scored significantly higher on ELA state standardized tests than non-Montessori students across all three
years of the analysis. Furthermore, there was a significant Montessori advantage in math and social studies in two of
the three years. The results for science were mixed, as Montessori students demonstrated significantly less growth
than non-Montessori students in one year (2013-14) and significantly more growth in another year (2015-16).
Subgroup analyses indicated that low-income Montessori students scored significantly higher than low-income non-
Montessori students in ELA, math, and social studies. While these differences in are statistically significant, the
differences are generally quite small, as the effect sizes typically range from .05 to .08 standard deviations
An Evaluation of Montessori Education in South Carolina’s Public Schools | 3
Fidelity to the Model
Student Demographics
Academic Outcomes
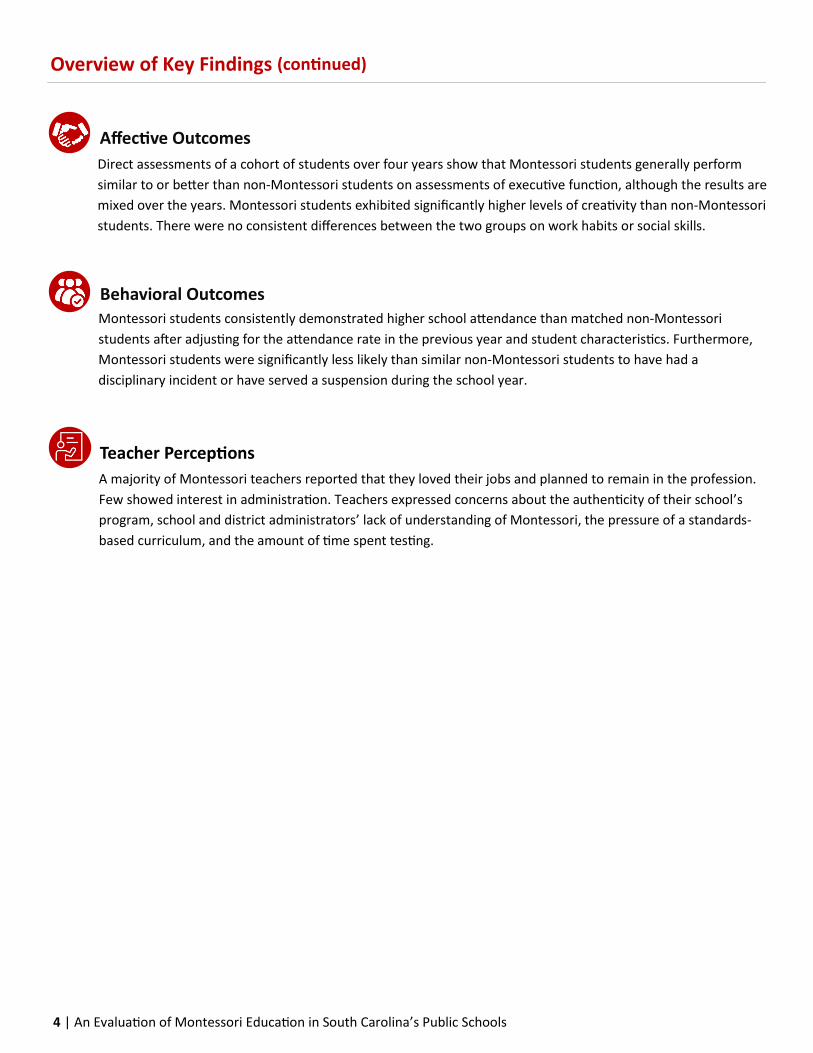
Direct assessments of a cohort of students over four years show that Montessori students generally perform
similar to or better than non-Montessori students on assessments of executive function, although the results are
mixed over the years. Montessori students exhibited significantly higher levels of creativity than non-Montessori
students. There were no consistent differences between the two groups on work habits or social skills.
A majority of Montessori teachers reported that they loved their jobs and planned to remain in the profession.
Few showed interest in administration. Teachers expressed concerns about the authenticity of their school’s
program, school and district administrators’ lack of understanding of Montessori, the pressure of a standards-
based curriculum, and the amount of time spent testing.
Overview of Key Findings (continued)
Montessori students consistently demonstrated higher school attendance than matched non-Montessori
students after adjusting for the attendance rate in the previous year and student characteristics. Furthermore,
Montessori students were significantly less likely than similar non-Montessori students to have had a
disciplinary incident or have served a suspension during the school year.
4 | An Evaluation of Montessori Education in South Carolina’s Public Schools
Affective Outcomes
Behavioral Outcomes
Teacher Perceptions

Montessori in South Carolina’s Public Schools
Over the past five decades, Montessori education has earned much acclaim within the private school community for its
overall approach to teaching and student learning. Its entrance into public education has been slower, but, over the
two past decades, Montessori has begun to gain a foothold in America’s public schools. In South Carolina, considerable
investment has been made into putting Montessori on the ground in the state’s public schools, specifically in areas of
teacher and administrative training, facilities, Montessori materials, and ongoing professional development.
In terms of the number of programs, public Montessori education in South Carolina expanded throughout the duration
of this study from 40 in 2012-13 to 45 in 2015-16. The number of Montessori students increased from 6,365 students in
the 2012-13 academic year to 7,402 students by the end of the study. See Figure 1. According to the National Center
for Montessori in the Public Sector, there now are more public Montessori programs in South Carolina than any other
state in the country except California.
While public school students in South Carolina attended Montessori programs in all grades from PK to eighth grade, the
majority of Montessori education occurred at the primary and lower elementary levels. See Table 1. During the 2015-
16 academic year, 17% of public Montessori students were enrolled at the pre-Kindergarten level and 13% at the
Kindergarten level. The grades with the largest Montessori enrollment were first and second grade, with each over
1,000 students. Enrollment in the middle school grades (sixth through eighth) accounted for approximately 9% of the
total South Carolina public Montessori student enrollment. Most schools that had Montessori were school-within-a-
school programs (88%). Approximately, 15% of schools were magnet programs, and 8% were charter schools. Sixty-one
percent of Montessori programs were housed within Title I schools.
40
42
44
46
6,300
6,500
6,700
6,900
7,100
7,300
7,500
2013 2014 2015 2016
# o
f Mo
nte
sso
ri P
rogr
ams
Mo
nte
sso
ri E
nro
llm
ent
Figure 1: Counts of Students and Schools Participating in Public
Montessori 2012-13 through 2015-16
Enrollment Schools
An Evaluation of Montessori Education in South Carolina’s Public Schools | 5
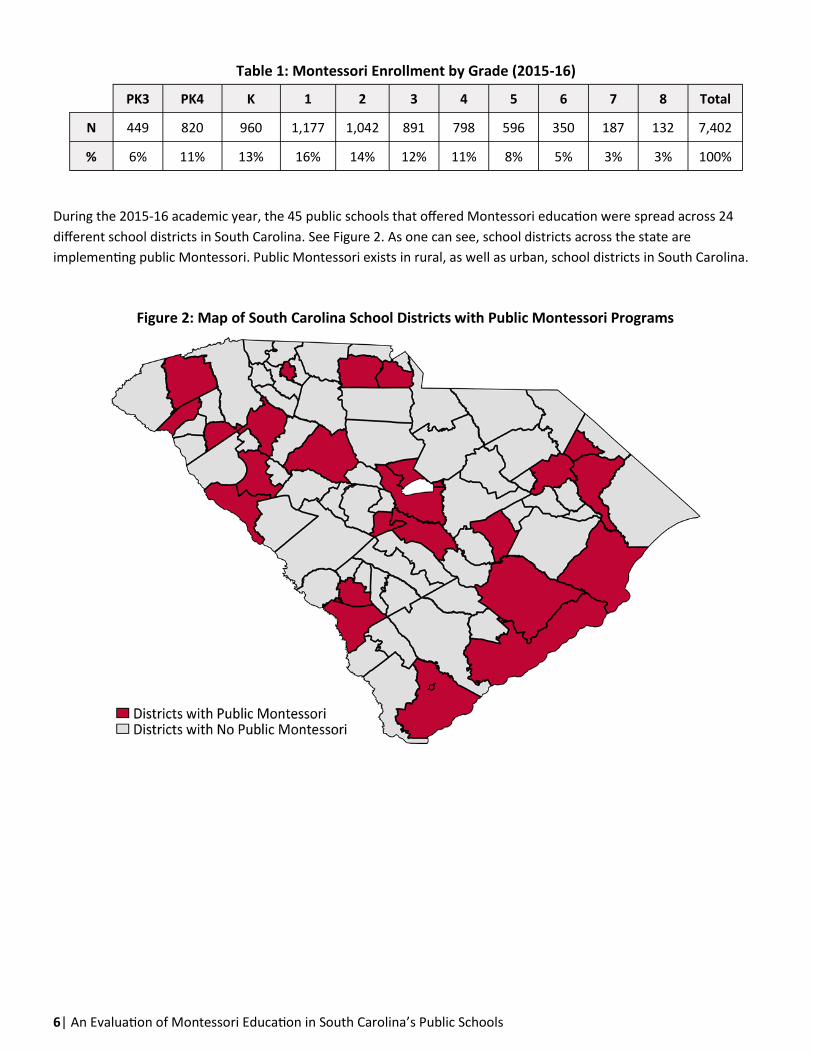
During the 2015-16 academic year, the 45 public schools that offered Montessori education were spread across 24
different school districts in South Carolina. See Figure 2. As one can see, school districts across the state are
implementing public Montessori. Public Montessori exists in rural, as well as urban, school districts in South Carolina.
Table 1: Montessori Enrollment by Grade (2015-16)
PK3 PK4 K 1 2 3 4 5 6 7 8 Total
N 449 820 960 1,177 1,042 891 798 596 350 187 132 7,402
% 6% 11% 13% 16% 14% 12% 11% 8% 5% 3% 3% 100%
Figure 2: Map of South Carolina School Districts with Public Montessori Programs
6| An Evaluation of Montessori Education in South Carolina’s Public Schools

A Demographic Analysis of Participation in Public School Montessori
Using 2015-16 data from the PowerSchool database, researchers compared the demographic characteristics of
individual public Montessori students to non-Montessori students across the state in preschool to grade eight. See
Figure 3. While the majority of Montessori students qualify for free or reduced priced lunches, the analysis showed
that Montessori students were somewhat more advantaged than non-Montessori public school students, as 54% of
Montessori students were low-income as compared to 63% of non-Montessori students. In terms of race,
approximately 55% of Montessori students were white, while 34% were black and 6% were Hispanic. Further, one in
ten Montessori students had a special education designation, and three percent were considered English Language
Learners. Finally, female students were slightly overrepresented in Montessori programs when compared to other
public school students.
Results of this analysis demonstrate that public Montessori education is not limited to high-income or white students in
South Carolina and that a large and diverse set of families are attracted to public Montessori programs. Although
demographic differences do exist, the population of Montessori students is generally quite similar to non-Montessori
students from across the state.
In order to better analyze the differences between Montessori and non-Montessori students, additional demographic
An Evaluation of Montessori Education in South Carolina’s Public Schools | 7
Research Question One: To what extent do the demographic characteristics of South Carolina’s public school Montessori students differ from students not enrolled in Montessori?
8 | An Evaluation of Montessori Education in South Carolina’s Public Schools
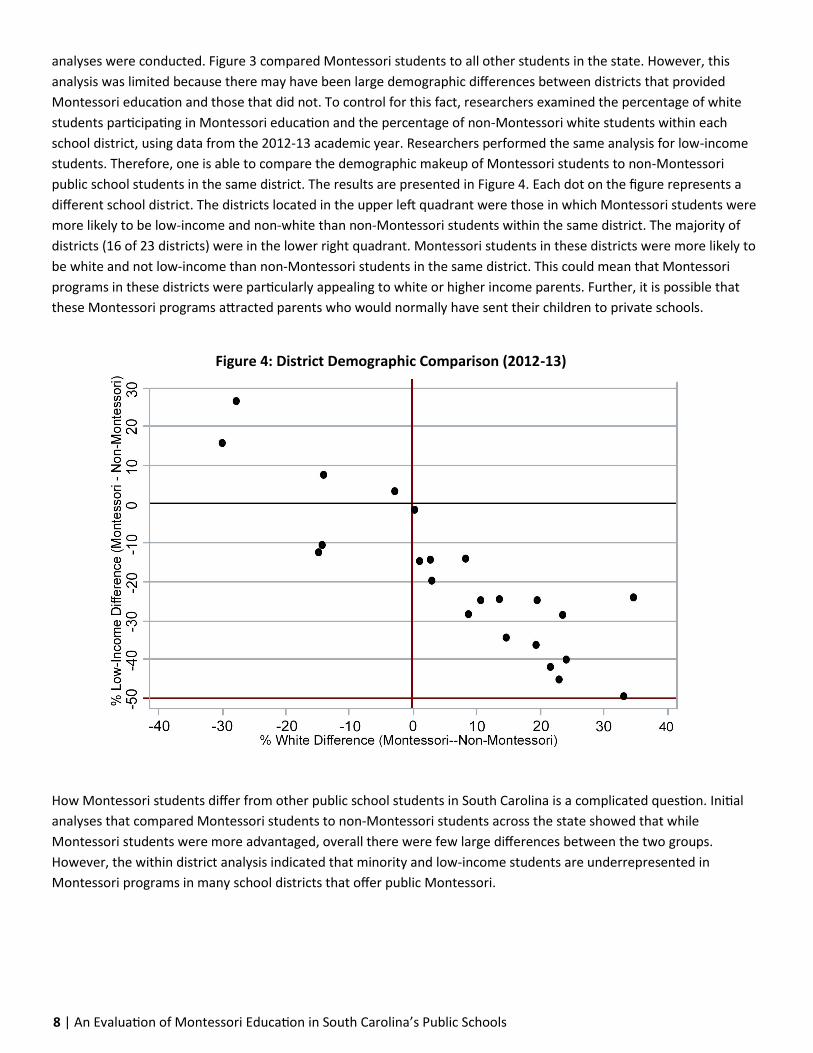
analyses were conducted. Figure 3 compared Montessori students to all other students in the state. However, this
analysis was limited because there may have been large demographic differences between districts that provided
Montessori education and those that did not. To control for this fact, researchers examined the percentage of white
students participating in Montessori education and the percentage of non-Montessori white students within each
school district, using data from the 2012-13 academic year. Researchers performed the same analysis for low-income
students. Therefore, one is able to compare the demographic makeup of Montessori students to non-Montessori
public school students in the same district. The results are presented in Figure 4. Each dot on the figure represents a
different school district. The districts located in the upper left quadrant were those in which Montessori students were
more likely to be low-income and non-white than non-Montessori students within the same district. The majority of
districts (16 of 23 districts) were in the lower right quadrant. Montessori students in these districts were more likely to
be white and not low-income than non-Montessori students in the same district. This could mean that Montessori
programs in these districts were particularly appealing to white or higher income parents. Further, it is possible that
these Montessori programs attracted parents who would normally have sent their children to private schools.
How Montessori students differ from other public school students in South Carolina is a complicated question. Initial
analyses that compared Montessori students to non-Montessori students across the state showed that while
Montessori students were more advantaged, overall there were few large differences between the two groups.
However, the within district analysis indicated that minority and low-income students are underrepresented in
Montessori programs in many school districts that offer public Montessori.
Figure 4: District Demographic Comparison (2012-13)
An Evaluation of Montessori Education in South Carolina’s Public Schools | 9
Fidelity to the Montessori Model in Public School Classrooms
On average, results showed that public school programs in South Carolina were implementing the Montessori model
with fidelity, although there was variation regarding the extent to which different programs implemented authentic
Montessori.
Fidelity to the Montessori model was measured by programmatic implementation surveys administered to all
principals and by observations of randomly selected classrooms in all programs that participated for the duration of the
study, across the state. The implementation survey focused on critical implementation factors, such as multi-aged
groupings, student assessment protocols, Montessori lessons and materials, Montessori accreditation, and teacher and
assistant credentialing and training. Schools not meeting a minimum threshold for fidelity on the programmatic
implementation survey were excluded from the study and not included in further classroom observations. Thus,
students attending these schools were not considered “Montessori students” for the impact analyses in this report.
Programs that met the minimum threshold for fidelity on the programmatic implementation survey were promoted to
the classroom observation process.
Over the four years of the study, 126 randomly selected Montessori classrooms were observed. At least one
Montessori classroom was observed in each program. The number of classrooms observed at each program depended
on the size of the Montessori program and the levels of Montessori offered.1 The instruments used during classroom
observations were developed by the research team for each of the three Montessori levels—primary, lower
elementary, and upper elementary—included in the fidelity study. The main resources used to develop the instruments
include Lillard’s (2017) Eight Principles of Montessori Education and the Classroom Assessment Scoring System (Pianta,
2003). All instruments were reviewed extensively by experts from international and national Montessori organizations
and were piloted and calibrated. In addition, an inter-rater reliability study was conducted to establish and confirm the
reliability of the data collection instruments.
Each classroom observation instrument had its own unique set of indicators widely accepted as critical to Montessori
classrooms of high quality for that level, in addition to several post-observation interview questions. The indicators for
all three levels were divided into the same areas: Prepared Environment; Classroom Climate; Student Learning; and
Teacher and Assistant. Following the formal classroom observation, researchers conducted a post-observation
interview focused on three areas: Lesson Planning; Recordkeeping; and Student Assessment.
The process to select the observation sample was systematic and utilized stratified random sampling techniques in
order to ensure the appropriate levels and programs from across the state were observed. The hour-long observations
were unannounced and conducted by former Montessori teachers with a Montessori credential for the level they
observed.
1 Montessori programs are typically divided into multi-age classrooms—parent infant (ages 0 to 3); primary (ages 3 to 6); lower
elementary (ages 6 to 9); upper elementary (ages 9 to 12); and middle school (ages 12 to 14).
Research Question Two: To what extent are public schools in South Carolina implementing Montessori with fidelity?
10| An Evaluation of Montessori Education in South Carolina’s Public Schools
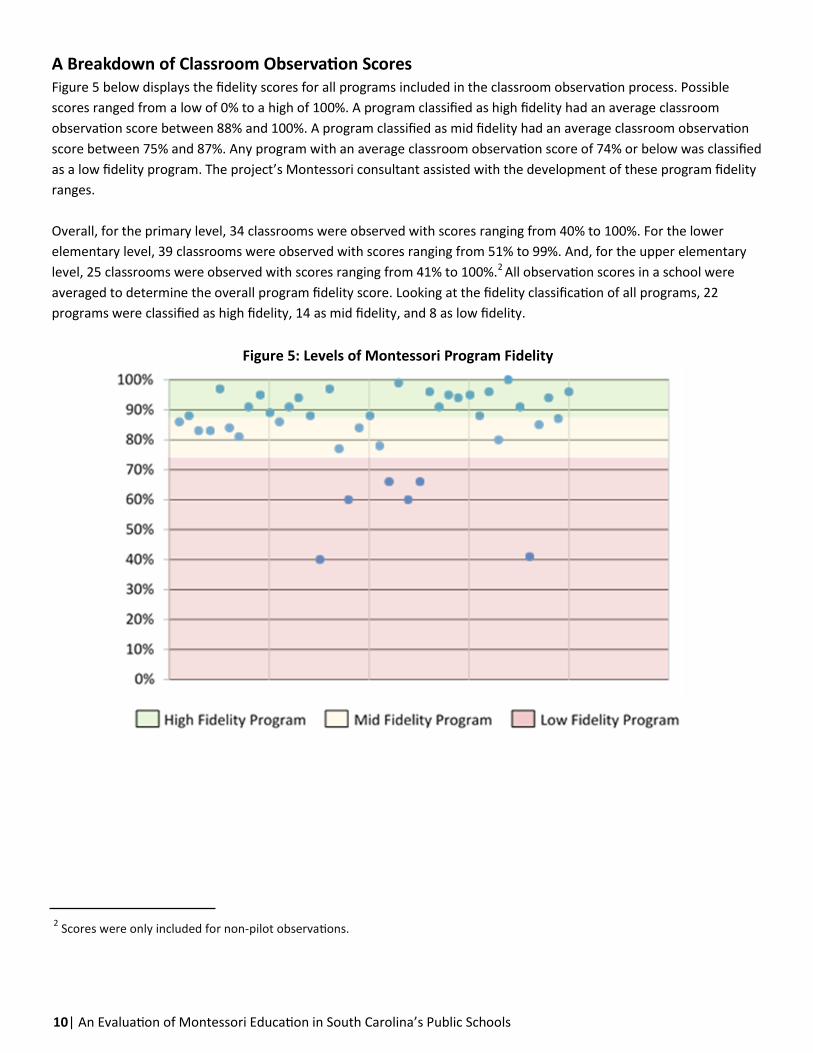
A Breakdown of Classroom Observation Scores Figure 5 below displays the fidelity scores for all programs included in the classroom observation process. Possible
scores ranged from a low of 0% to a high of 100%. A program classified as high fidelity had an average classroom
observation score between 88% and 100%. A program classified as mid fidelity had an average classroom observation
score between 75% and 87%. Any program with an average classroom observation score of 74% or below was classified
as a low fidelity program. The project’s Montessori consultant assisted with the development of these program fidelity
ranges.
Overall, for the primary level, 34 classrooms were observed with scores ranging from 40% to 100%. For the lower
elementary level, 39 classrooms were observed with scores ranging from 51% to 99%. And, for the upper elementary
level, 25 classrooms were observed with scores ranging from 41% to 100%.2 All observation scores in a school were
averaged to determine the overall program fidelity score. Looking at the fidelity classification of all programs, 22
programs were classified as high fidelity, 14 as mid fidelity, and 8 as low fidelity.
Figure 5: Levels of Montessori Program Fidelity
2 Scores were only included for non-pilot observations.

An Evaluation of Montessori Education in South Carolina’s Public Schools | 11
Rich data about Montessori implementation can be gleaned from the classroom observation results, particularly when
looking at results by level and focus area. Strengths of South Carolina’s public school Montessori classrooms include a
positive classroom climate, Montessori credentialed teachers, sufficient blocks of uninterrupted work time for
students, demonstration of the Montessori philosophy in the classroom, and high level of student engagement/
learning. Programs rated as low fidelity to the model often were lacking a fully prepared environment containing all of
the Montessori materials, an appropriate number of lesson demonstrations, and adequate recording of observation
notes for evaluation/record keeping.
As shown by Table 2, generally, across all Montessori levels, the highest classroom observation scores were found in
the area of classroom climate and the lowest scores were found in the area of prepared environment.
The post-observation interview results in Table 3 provided additional information that aided in the assessment of
classrooms. The lowest scores were in the area of record keeping and the highest scores were in the areas on lesson
planning and student assessment.
Table 2: Classroom Observation Scores by Level and Focus Area
Prepared
Environment
Classroom
Climate
Student
Learning
Instruction Total
Score Teacher Assistant
Primary 78% 88% 85% 78% 82% 82%
Lower Elementary 73% 95% 93% 86% 88% 87%
Upper Elementary 68% 90% 77% 84% 84% 81%
Average Score 73% 91% 85% 83% 85%
Table 3: Post-Observation Interview Scores by Levels and Indicator
Lesson Planning Record Keeping Student
Assessment Total Score
Primary 86% 78% 85% 83%
Lower Elementary 82% 80% 86% 83%
Upper Elementary 81% 79% 77% 79%
Average Score 83% 79% 83%

12 | An Evaluation of Montessori Education in South Carolina’s Public Schools
In Table 4, perceptions of teachers regarding Montessori implementation are displayed. As the results indicate, the
perceptions of teachers’ abilities to meet the needs of their students, particularly their behavioral needs, are high. The
perceptions of teachers’ abilities to implement authentic Montessori while incorporating state standards, however, are
lower, particularly in the lower and upper elementary levels.
Table 4: Post-Observation Interview Opinion Question Results*
Able to meet the
academic needs
of students.
Able to meet
behavioral needs
of students.
Able to
implement
authentic
Montessori while
incorporating
state standards
Feel supported,
not isolated by
administrators
and other
teachers.
Primary 8.3 8.0 8.6 8.3
Lower Elementary 7.3 8.1 6.9 7.4
Upper Elementary 7.5 8.3 6.7 7.9
Average Score 7.7 8.1 7.4 7.9
*For this portion of the interview, teachers were asked to rate on a scale from 1 to 10 how much they identified with each statement
(with 10 being the highest). The average rating for each question is shown above.

An Evaluation of Montessori Education in South Carolina’s Public Schools | 13
Exploring the Impact of Public School Montessori on Academic and Behavioral Outcomes
Using existing student record databases maintained by the South Carolina State Department of Education, the research
team examined outcomes of Montessori students and looked for changes over time in student achievement, student
behavior, and student attendance. The dataset included all public school students in the state from 2012-13 to 2015-
16. Importantly, this database had an indicator variable for students who received Montessori education.3 To measure
student achievement, researchers examined standardized test scores for grades three through eight in math, writing,
ELA, social studies, and science. While all five subjects were included in the analyses, the focus was on math and ELA,
as South Carolina eliminated the writing assessment for the 2015-16 school year and not all students took the science
and social studies tests every year. The research team created one measure for student attendance: average daily
attendance across all public schools the student attended in a given year. Finally, the research team examined student
behavior, specifically if a student had an in-school or out-of-school suspension and the number of discipline incidents
during the academic year.
Selection bias is a significant threat to evaluations like this one. Parents who choose to send their children to
Montessori schools may be quite different than parents who do not. These differences also may be related to a host of
outcomes, including test scores and attendance. To address the challenge of selection bias, the research team used
three methods to accurately estimate the effect of Montessori education on the outcomes of interest. First, the
analyses focused on individual student growth or change in the outcome over time, rather than on a one-year analysis
of outcomes. Second, the main analyses accounted for several factors that are related to student achievement and
behavior, such as family income and student disability. Lastly, the research team implemented a matching procedure
to produce apples-to-apples comparisons between Montessori and non-Montessori students. The design was similar to
the virtual control records approach made popular by the Center for Research on Education Outcomes (CREDO) at
Stanford University (e.g., CREDO 2009, 2015; Davis and Raymond 2012). In short, Montessori students were matched
to non-Montessori public school students using previous test scores and demographic factors. First, matches were
limited to other students in the same grade who attended a public school in the same school district as the Montessori
student. From this pool, students were exact matched on gender, race, English as a second language status, special
education status, and free/reduced priced lunch status.4 Then, researchers included the previous year’s test scores into
the matching procedure.5 Any potential match with a test score that differed from the Montessori student’s test score
by more than .20 standard deviations was dropped. For situations in which a Montessori student had more than five
3 The research team worked with Montessori schools to ensure the correct coding of the variable.
4 In this case, exact matching means that each Montessori student was matched to non-Montessori students with the same race,
gender, poverty status, ESL status, and special education status in the same grade and school district. 5 This process was completed separately for ELA, math, science, social studies, and writing.
Research Question Three: To what extent do South Carolina’s public school Montessori students differ from non-Montessori on student academic and behavioral outcomes?
14 | An Evaluation of Montessori Education in South Carolina’s Public Schools
potential matches at this point, the research team selected the five non-Montessori students with test scores that
were the closest to the Montessori student. The goal was to get two samples, a Montessori sample and a non-
Montessori sample that were as similar as possible at baseline.6
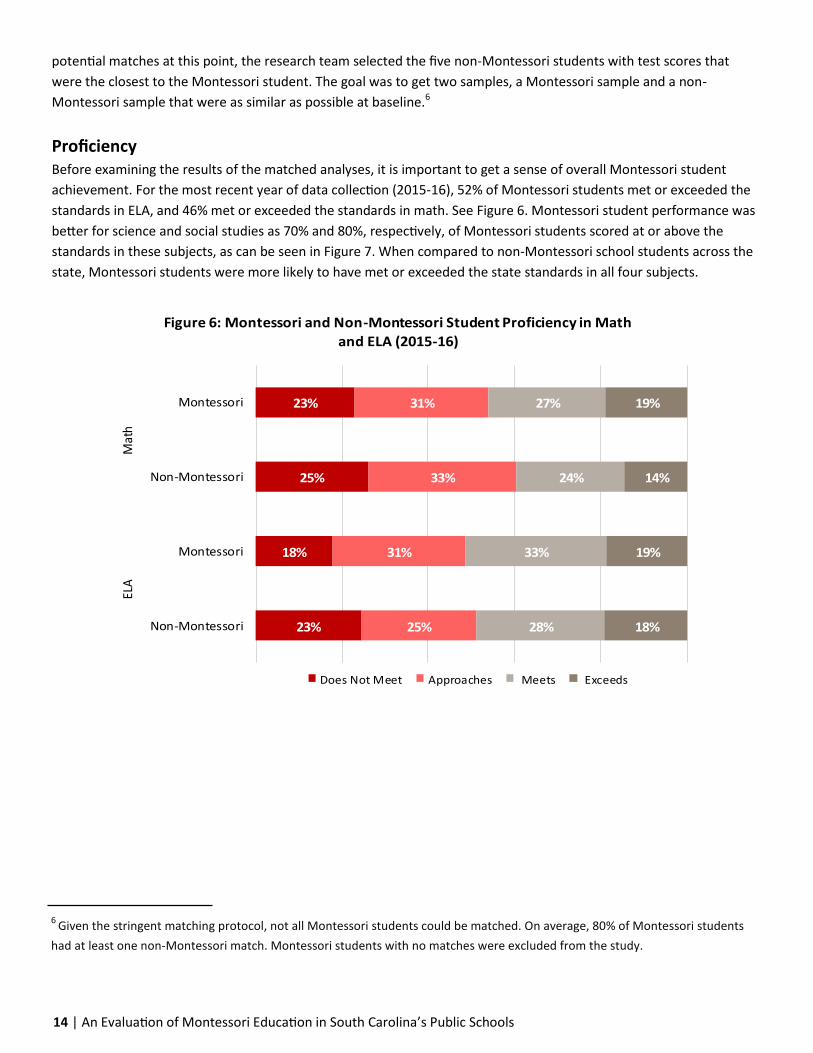
Proficiency Before examining the results of the matched analyses, it is important to get a sense of overall Montessori student
achievement. For the most recent year of data collection (2015-16), 52% of Montessori students met or exceeded the
standards in ELA, and 46% met or exceeded the standards in math. See Figure 6. Montessori student performance was
better for science and social studies as 70% and 80%, respectively, of Montessori students scored at or above the
standards in these subjects, as can be seen in Figure 7. When compared to non-Montessori school students across the
state, Montessori students were more likely to have met or exceeded the state standards in all four subjects.
6 Given the stringent matching protocol, not all Montessori students could be matched. On average, 80% of Montessori students
had at least one non-Montessori match. Montessori students with no matches were excluded from the study.
23%
18%
25%
23%
25%
31%
33%
31%
28%
33%
24%
27%
18%
19%
14%
19%
Non-Montessori
Montessori
Non-Montessori
Montessori
ELA
Mat
h
Figure 6: Montessori and Non-Montessori Student Proficiency in Math and ELA (2015-16)
Does Not Meet Approaches Meets Exceeds

An Evaluation of Montessori Education in South Carolina’s Public Schools | 15
Growth The previous analyses only consider differences in Montessori and non-Montessori students in terms of 2015-16
proficiency. In the preferred analyses presented below, researchers analyzed test score growth, or how students’
scores changed from one year to the next. Further, these analyses examined standardized scale scores, which are more
precise than proficiency levels.7 Montessori achievement growth was compared to two different groups: other public
schools students across the state and non-Montessori students who were matched to Montessori students based on
district, grade, demographic characteristics, and the previous years’ test scores.
Table 5 summarizes the results of these one-year growth models, which control for student grade and demographics.
Outcomes for each year are compared to how students did in the previous academic year. A positive value in the table
indicates that Montessori growth was higher than non-Montessori growth, whereas a negative value means that non-
Montessori students exhibited greater achievement growth.
34%
31%
26%
20%
41%
47%
40%
47%
25%
23%
34%
33%
Non-Montessori
Montessori
Non-Montessori
Montessori
Scie
nce
Soci
al S
tudi
es
Figure 7: Montessori and Non-Montessori Student Proficiency in Social
Studies and Science (2015-16)
Not Met Met Exemplary
7 Another advantage of standardizing the test score values is that it more readily allows for comparisons across different exams.
Given that South Carolina changed exams throughout this study from SC PASS (2012-13, 2013-14) to ACT Aspire (2014-15) to SC
Ready (2015-16), the analyses here do not measure true growth in test scores from one year to the next. However, each of the
exams should provide a proxy for student achievement in that subject and are used in the analyses to control for prior academic
achievement.

16 | An Evaluation of Montessori Education in South Carolina’s Public Schools
According to Table 5, Montessori students consistently demonstrated greater achievement growth than non-
Montessori students across all three years of analyses in ELA. When compared to the matched comparison students,
Montessori students increased their test scores by .07 or .08 standard deviations more than non-Montessori students.
While these effect sizes are small, the differences are statistically significant. Compared to all other public school
students across the state, there are few meaningful differences in math growth. However, Montessori students
exhibited greater growth when compared to matched non-Montessori students in the last two years of analyses. While
the Montessori advantage in math is apparent in the more recent analyses, the opposite trend is evident for writing
growth. Montessori students demonstrated statistically significant more growth in writing test scores from the 2012-13
to the 2013-14 school year. There was no statistically significant difference in growth for the following year.
The results for the science and social studies achievement are interesting. Montessori students exhibited .06 standard
deviations less growth in science than the matched sample in 2013-14. This difference was statistically significant at
the .10 level. Matched non-Montessori students also had higher growth than Montessori students in social studies, but
it was not statistically significant. There was no difference in science achievement growth in 2014-15, whereas
Montessori students achieved higher growth in science in 2015-16. Montessori students had higher growth for both of
the final two years of the analysis in social studies when compared to the matched sample. It is important to remember
that not all public school students take the science and social studies exam each year, unlike the ELA and math exams,
so the samples included in the analyses differ year-to-year. It also is important to note that the effect sizes of the
differences between Montessori and non-Montessori student achievement across the five subjects are generally small
with all estimates less than one-tenth of a standard deviation.
Table 5: Student Achievement - Summary of Regressions: Montessori Indicator
Comparison
Group ELA Math Writing Science
Social
Studies
2012-13 to
2013-14
State 0.05* -0.01 0.07** -0.03 -0.05
Matched 0.07*** 0.02 0.07** -0.06* -0.03
2013-14 to
2014-15
State 0.06* 0.07* 0.00 -0.01 0.05
Matched 0.07*** 0.07*** 0.02 -0.01 0.08***
2014-15 to
2015-16
State 0.05 -0.02 0.05 0.08**
Matched 0.08*** 0.04*** 0.07*** 0.08**
Note: *** p<0.01, ** p<0.05, * p<0.1. Values in the table represent the Montessori coefficient from multivariate OLS
regressions.

An Evaluation of Montessori Education in South Carolina’s Public Schools | 17
Sub Group Analyses Is Montessori education more “effective” for some students rather than others? Thus far, the results have examined
Montessori students as a single group. To examine the possibility of differential effects of Montessori by student
characteristics, researchers pooled the three years of growth together into one analysis and included interaction terms
between the Montessori indicator and race, gender, poverty status, and the previous year’s test score (highest and
lowest 20 percentiles).
The average marginal effects of participating in Montessori for different demographic and baseline test score groups
are presented in Table 6. Positive values indicate that Montessori students with a particular demographic exhibited
greater one-year achievement growth than matched non-Montessori students of that same demographic category
between the 2013-14 to 2015-16 school years. The results indicate that low-income Montessori students exhibit more
growth in ELA, math, and social studies than low-income non-Montessori students. These findings mirror the results for
non-low income students. In terms of race, significant differences exist for black students in ELA and social studies, with
Montessori students displaying greater growth. While white Montessori students achieved at greater levels than white
non-Montessori students across all five subjects, there were no statistically significant differences for Hispanic and
those in the “other race” category. The insignificant findings for Hispanic and the other race category may be partly
due to smaller samples sizes for these groups. Both male and female Montessori students achieve at greater levels
than their matched non-Montessori counterparts in ELA, math, and social studies.
Table 6: Subgroup Analysis– Average Marginal Effects
ELA Math Writing Science Social
Studies
0.06*** 0.04*** 0.03 0.03 0.05** Low Income
0.08*** 0.08*** 0.03 0.01 0.10*** Non-Low Income
0.07*** 0.08*** 0.04* 0.03* 0.08*** White
0.09*** 0.01 0.00 0.01 0.06** Black
-0.01 0.04 0.16 -0.05 0.02 Hispanic
0.08 0.08 -0.07 -0.03 0.09 Other Race
Female 0.08*** 0.06*** 0.04* 0.02 0.07***
Male 0.07*** 0.06*** 0.02 0.02 0.07***
Lowest Test 0.07*** 0.03 0.08** 0.00 0.06**
Highest Test 0.01 0.07** -0.02 -0.01 0.04
Note: *** p<0.01, ** p<0.05, * p<0.1. Values in the table represent the Montessori coefficient from multivariate
OLS regressions.

18 | An Evaluation of Montessori Education in South Carolina’s Public Schools
Is the higher achievement growth of Montessori students limited to students who are naturally high achievers? The
results in Table 6 suggest otherwise. While Montessori students who achieved at the 80th percentile or higher on the
prior year’s exam scored significantly better than matched non-Montessori students only in math, Montessori students
who scored at the 20th percentile or below on the baseline exam had statistically significantly higher one-year
achievement growth in ELA, writing, and social studies than matched students who scored at the 20th percentile or
below on the baseline exam.
Attendance & Behavior To get an accurate causal estimate of the effect of Montessori education on attendance and behavior, researchers
completed the same matching process as described above for the test score analyses. Students in grades PK to eighth
were included in these analyses. After the matched sample was identified, the researchers performed ordinary least
square regressions that adjusted for the previous year’s outcome, family income, race, gender, ESL status, special
education status, and grade. See Table 7. Looking at the attendance results, one sees that Montessori students
consistently demonstrated higher attendance than the non-Montessori matched comparison group after adjusting for
the attendance rate in the previous year and student demographics. In each year of the analysis, the difference is
approximately .05-07 standard deviations and is statistically significant. Montessori students were less likely to have
had in-school or out-of-school suspensions in 2015 and 2016 than non-Montessori students. In terms of discipline
incidents, the results indicated that Montessori students were less likely to have any discipline incidents and had a
smaller number of incidents on average when compared to the matched non-Montessori sample. These differences are
statistically significant for both year of the analysis. While the differences in attendance and behavior outcomes
between Montessori and non-Montessori matched students were often small, Montessori students consistently
demonstrated statistically significant higher attendance and fewer discipline incidents.
Table 7: Student Attendance and Behavior– Summary of Regressions: Montessori Indicator
Comparison
Group
Attendance
Rate Suspension
Any Discipline
Incidents
Discipline
Attendance
Count
2012-13 to
2013-14 Matched 0.07*** -0.00
2013-14 to
2014-15 Matched 0.05*** -0.02*** -0.05*** -0.12***
2014-15 to
2015-16 Matched 0.05*** -0.01*** -0.02*** -0.10***
Note: *** p<0.01, ** p<0.05, * p<0.1. Values in the table represent the Montessori coefficient from multivariate OLS
regressions.

An Evaluation of Montessori Education in South Carolina’s Public Schools | 19
Exploring the Impact of Public School Montessori on Affective Outcomes
State databases provided the research team with data on student test scores, attendance, and behavior. While these
are important outcomes, the research team also was interested in a number of other outcomes that are related to
college and career readiness. To this end, researchers examined the relationship between participation in Montessori
education and affective outcomes, including creativity, executive function, social skills, and work habits.
Since measures of these outcomes are not found in state databases, the research team selected and administered
assessments of these constructs to a sample of Montessori and comparison non-Montessori students. By their nature,
these outcomes are difficult to measure. Further, the number of valid and reliable measures available to the research
team at the beginning of the study were limited. The design of this longitudinal study followed a cohort of students
from age five to age eight, so it also was challenging to find consistent age-appropriate measures across time. With
these limitations in mind, the research team used several different assessments to try to accurately measure the effect
of Montessori education on these key outcomes.
As noted earlier, selection bias is major threat to evaluations of education programs. In the case of Montessori
education, it is challenging to isolate the effect of participating in a Montessori program, as parents usually select into
these programs. A primary task of the research team was to try to mitigate selection bias. Given limited resources, the
research team was unable to follow the population of all Montessori students, so a sample was selected. Researchers
chose a Montessori school with a “no choice” enrollment situation, where Montessori was the only option for parents
wanting to enroll their children in public preschool in the district. Since all preschool students were placed in the
Montessori program, selection bias may be lessened (but not eliminated). The research team also was able to verify
that the Montessori school included in this part of the study was implementing a high fidelity Montessori program, as
measured by programmatic implementation surveys and classroom observations.
After selecting the Montessori cohort, the research team chose a demographically similar public school in another
region of the state to be the non-Montessori comparison school. Approximately 100 Montessori and 100 non-
Montessori students were included in the analysis each year.
The research team administered a number of different measures across four general domains: executive function,
social skills, work habits, and creativity. To examine how the Montessori students differed on these outcomes from the
non-Montessori public school cohort, researchers used ordinary least squares (OLS) regression, while adjusting for
student race, poverty status, ESL status, gender, and special education status. When appropriate, growth models,
which included earlier outcome measures as covariates, were also estimated. In order to increase comparability, all
outcome measures for the regression models were standardized to have a mean of zero and a standard deviation of
one. This meant that the Montessori coefficient in the regression reflected how many standard deviations Montessori
students were above or below non-Montessori students on that particular measure, after controlling for student
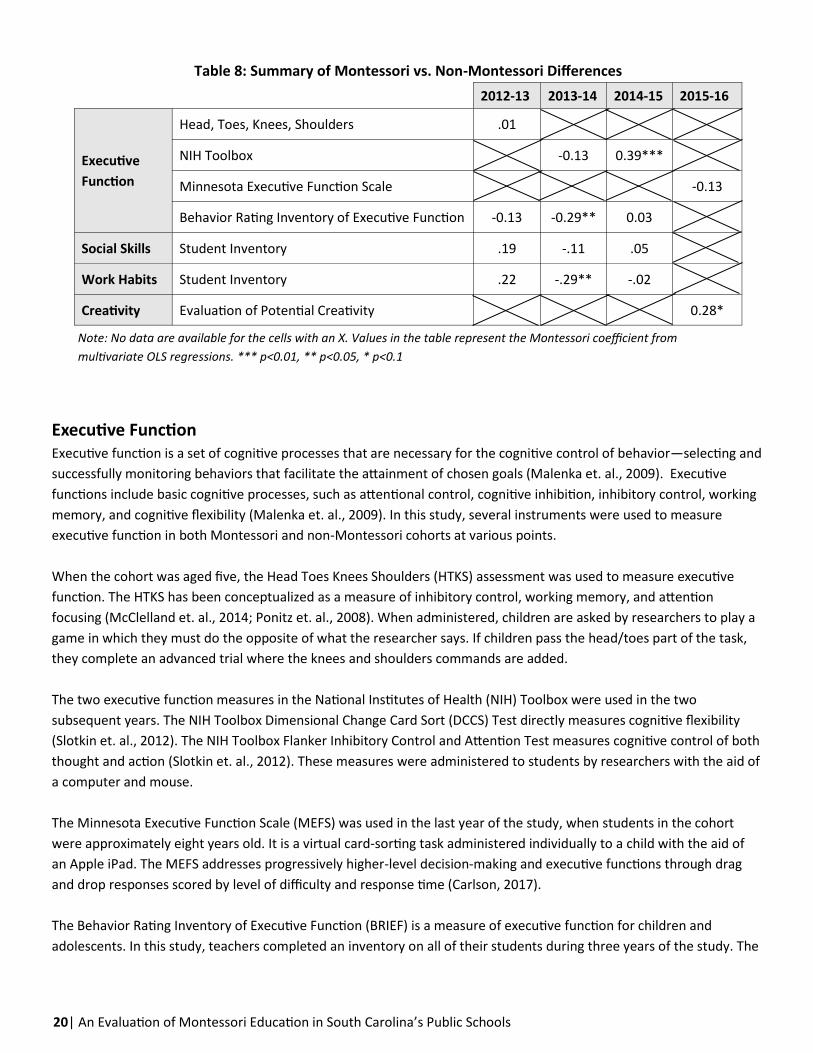
demographics. Table 8 presents the regression coefficient, or effect size, for the Montessori indicator variable from the
multivariate regressions.
Research Question Four: Two what extent do South Carolina’s public school Montessori students differ from non-Montessori students on variables generally classed in the affective domain?
20| An Evaluation of Montessori Education in South Carolina’s Public Schools
Executive Function Executive function is a set of cognitive processes that are necessary for the cognitive control of behavior—selecting and
successfully monitoring behaviors that facilitate the attainment of chosen goals (Malenka et. al., 2009). Executive
functions include basic cognitive processes, such as attentional control, cognitive inhibition, inhibitory control, working
memory, and cognitive flexibility (Malenka et. al., 2009). In this study, several instruments were used to measure
executive function in both Montessori and non-Montessori cohorts at various points.
When the cohort was aged five, the Head Toes Knees Shoulders (HTKS) assessment was used to measure executive
function. The HTKS has been conceptualized as a measure of inhibitory control, working memory, and attention
focusing (McClelland et. al., 2014; Ponitz et. al., 2008). When administered, children are asked by researchers to play a
game in which they must do the opposite of what the researcher says. If children pass the head/toes part of the task,
they complete an advanced trial where the knees and shoulders commands are added.
The two executive function measures in the National Institutes of Health (NIH) Toolbox were used in the two
subsequent years. The NIH Toolbox Dimensional Change Card Sort (DCCS) Test directly measures cognitive flexibility
(Slotkin et. al., 2012). The NIH Toolbox Flanker Inhibitory Control and Attention Test measures cognitive control of both
thought and action (Slotkin et. al., 2012). These measures were administered to students by researchers with the aid of
a computer and mouse.
The Minnesota Executive Function Scale (MEFS) was used in the last year of the study, when students in the cohort
were approximately eight years old. It is a virtual card-sorting task administered individually to a child with the aid of
an Apple iPad. The MEFS addresses progressively higher-level decision-making and executive functions through drag
and drop responses scored by level of difficulty and response time (Carlson, 2017).
The Behavior Rating Inventory of Executive Function (BRIEF) is a measure of executive function for children and
adolescents. In this study, teachers completed an inventory on all of their students during three years of the study. The
Table 8: Summary of Montessori vs. Non-Montessori Differences
2012-13 2013-14 2014-15 2015-16
Executive
Function
Head, Toes, Knees, Shoulders .01
NIH Toolbox -0.13 0.39***
Minnesota Executive Function Scale -0.13
Behavior Rating Inventory of Executive Function -0.13 -0.29** 0.03
Social Skills Student Inventory .19 -.11 .05
Work Habits Student Inventory .22 -.29** -.02
Creativity Evaluation of Potential Creativity 0.28*
Note: No data are available for the cells with an X. Values in the table represent the Montessori coefficient from
multivariate OLS regressions. *** p<0.01, ** p<0.05, * p<0.1

An Evaluation of Montessori Education in South Carolina’s Public Schools | 21
BRIEF questionnaire included approximately 80 items in eight non-overlapping clinical scales and two validity scales:
Behavioral Regulation (Inhibit, Shift, and Emotional Control) and Metacognition (Initiate, Working Memory, Plan/
Organize, Organization of Materials, and Monitor), as well as a Global Executive Composite score which takes into
account all of the clinical scales and represents the child's overall executive function (Gioia, 2000).
Results-Executive Function The HTKS assessment was administered to the Montessori and non-Montessori cohorts in the spring of 2013, when the
cohort was approximately age five. After controlling for student demographics, Montessori student performance on
the HTSK exam closely mirrored the performance of the non-Montessori students, as seen in Table XXX above.
Both cohorts of students were tested with the NIH Toolbox in spring 2014 and spring 2015. There were no significant
differences between the scores of Montessori students and non-Montessori students in 2014. However, Montessori
students scored almost .4 standard deviations above non-Montessori students in 2015, a statistically significant result.
Given that the cohorts received the NIH assessment in both the 2013-14 and 2014-15 school years, the researchers
also examined how NIH scores changed from one year to the next. The 2013-14 NIH score was used as a “pre-test”
covariate when examining the relationship between participating in the Montessori program in 2014-15 and the 2015
NIH score. The results from this analysis indicated that Montessori students exhibited significantly greater growth in
executive function during the 2014-15 academic year than did the comparison students.
In spring 2016, students in both cohorts completed the MEFS assessment. After adjusting for student demographics,
Montessori students scored .13 standard deviations below the comparison group, which was not a statistically
significant difference.
On the BRIEF assessment, there were no statistically significant differences between the two groups in 2013 or 2015. In
2014, however, non-Montessori students had better total BRIEF score, a statistically significant result.8 While the
results from the BRIEF assessment are suggestive, they should be interpreted with great caution. Unlike the HTSK, NIH
Toolbox, and MEFS, students in Montessori and non-Montessori cohorts were not assessed by a common rater, but
rather by the students’ own teachers. In addition, both cohorts had different raters over time. The teachers who
completed the BRIEF assessments may have had different interpretations of the questions or definitions of “often,”
“sometimes,” or “never.” Since teachers only completed assessments for students in one cohort, it was difficult for
researchers to compare across cohorts or even across time. Regardless, useful descriptive information, particularly for
use by schools, can be gleaned from the BRIEF assessment.
Social Skills and Work Habits Teachers also rated students on social skills and work habits using an inventory created by researchers at Lander
University. The Rating Scale of Work Habits and Social Relationships for Young Children was based largely upon the
developmental milestones of self-regulation detailed by Bronson (2000). The measure contained 17 Likert-scale
8 Originally, the BRIEF assessment was coded so that lower values indicated better executive function than higher values. This was
changed in this analysis, so that the interpretation for this outcome would be consistent with the other outcomes in Table 8.

22 | An Evaluation of Montessori Education in South Carolina’s Public Schools
response items; 8 related to social relationships and 9 to work habits. At the end of the scale, the teacher was asked to
rate each child’s academic performance (Ervin et. al., 2010). After standardizing these measures, researchers
performed OLS regressions while controlling for student demographics to examine the relationship between
participating in Montessori and these three domains. This inventory had many of the same limitations of a teacher
completed student inventory as did the BRIEF discussed above.
According to Table 8, Montessori students were rated as having better social skills than the non-Montessori
comparison group in 2013 and 2015, after controlling for student demographics, but these differences were not
statistically significant. There is one statistically significant difference between Montessori and non-Montessori
students in terms of work habits. According to teacher reports on the student inventories in 2014, Montessori students
were rated by their teachers approximately .3 standard deviations below non-Montessori students on work habits, a
statistically significant result.
Creativity Creativity is commonly acknowledged as the ability to produce original works (Paulus & Nijstad 2003; Runco & Jaeger
2012). Considered as one of the most important skills for childhood development, creativity contributes to an
individual’s problem-solving and innovative ability, which play a crucial role in personal growth and professional
development (Besançon & Lubart 2008).
The Evaluation of Potential Creativity (EPoC) measures creative potential through examining both divergent-
exploratory thinking and convergent-integrative thinking. This EPoC test is standardized (same task materials, same
time allotted, same instructions, etc.) and requires students to produce work (i.e., drawings) based on a specific set of
stimuli. Researchers have students complete one divergent-exploratory task and one convergent-integrative task to
complete during a first session and then another divergent-exploratory task and convergent-integrative task to
complete in a second session approximately one to two weeks later. This allows the child to show his/her creative
potential on two occasions (two different days) with two slightly different tasks for divergence and convergence
(Lubart, 2011).
The EPoC was administered to students in the Montessori and non-Montessori cohorts during the last year of the
study. According to Table 8, Montessori students scored .28 standard deviations higher than non-Montessori students
on the total EPoC score. This Montessori advantage is statistically significant at the .10 level. Additional analyses
indicated that this result was driven by Montessori students demonstrating better performance on the divergent-
exploratory section of the EPoC assessment.

An Evaluation of Montessori Education in South Carolina’s Public Schools | 23
Teacher Perceptions of Montessori’s Impact on Students and Teaching
For both years of administration (academic year 2013-14 and academic year 2015-16), researchers surveyed the entire
population of public Montessori lead teachers. The survey administered in academic year 2013-14 included 57
questions and had a 71% response rate (186 out of 261). The survey administered in academic year 2015-16 included
80 questions and had a 72% response rate (192 out of 268). The response rate for both years is substantially higher
than the average survey response rate and provides for results that should be quite representative of the population of
Montessori teachers.
The findings presented within this report are grouped by survey category. Some of the question scales have been
slightly adjusted to help in the summarizing of data.
Educator Demographics More than half of those surveyed have been teaching for 10 years or more; however, only 27% have been teaching in
the Montessori classroom for 10 years or more. Teachers have been in their current Montessori teaching positions an
average of 6 years. The majority have master’s degrees (67%), while 32% have bachelor’s degrees and 1% have a
doctorate degree. Nearly all educators who responded to the surveys hold a Montessori credential for the level they
currently teach or will within the next year (95%). The most popular program from which educators earned their
credential was the American Montessori Society, and the most credentialed levels were early childhood and lower
elementary.
Training and Professional Development Most Montessori educators report that they are observed in their classroom at least two times per school year for at
least 30 minutes (83%) and agree that they are provided helpful feedback after they are observed (63%).
Slightly less than half of educators report that their school or district implements two or more Montessori teacher
trainings every year (48%). Overall, 71% of educators report that they receive enough professional development to stay
current in their field. Most educators report that their biggest professional development need is Montessori-specific
curriculum and lessons instruction. Others would like to have more training on classroom management strategies, time
management, as well as more opportunities for networking and/or collaboration.
Job Satisfaction and Future Career Plans Most Montessori educators feel supported to some extent in their school (75%) and agree that their principal has
adequate knowledge about Montessori (77%). Nearly all educators report loving or liking their job as a Montessori
teacher (98%). This is substantially higher than the 89% of South Carolina educators on the 2015 Report Card Teacher
Survey who strongly agreed or agreed that they were satisfied with their current working conditions (EOC, 2016). Most
survey respondents plan to remain a Montessori teacher (84%). Very few plan to move to a non-Montessori classroom
(3%) or become a Montessori administrator (10%).
Research Question Five: What are the demographic characteristics of public school Montessori teachers in South Carolina? What are perspectives of teachers on the impact of Montessori on their students? What are perspectives of teachers on the impact of Montessori on their teaching?
24| An Evaluation of Montessori Education in South Carolina’s Public Schools
Classroom Organization Most primary and elementary level educators report that their classrooms are appropriately multi-aged according to
the Montessori Model (81%), while only half of middle level educators do. Approximately 84% of educators agree to
some extent that they can keep up with the multiple ages/levels of children in their classroom. The majority of
educators report having between 21 and 24 students enrolled in their classrooms. Nearly all educators have a full or
part time teaching assistant (90%).
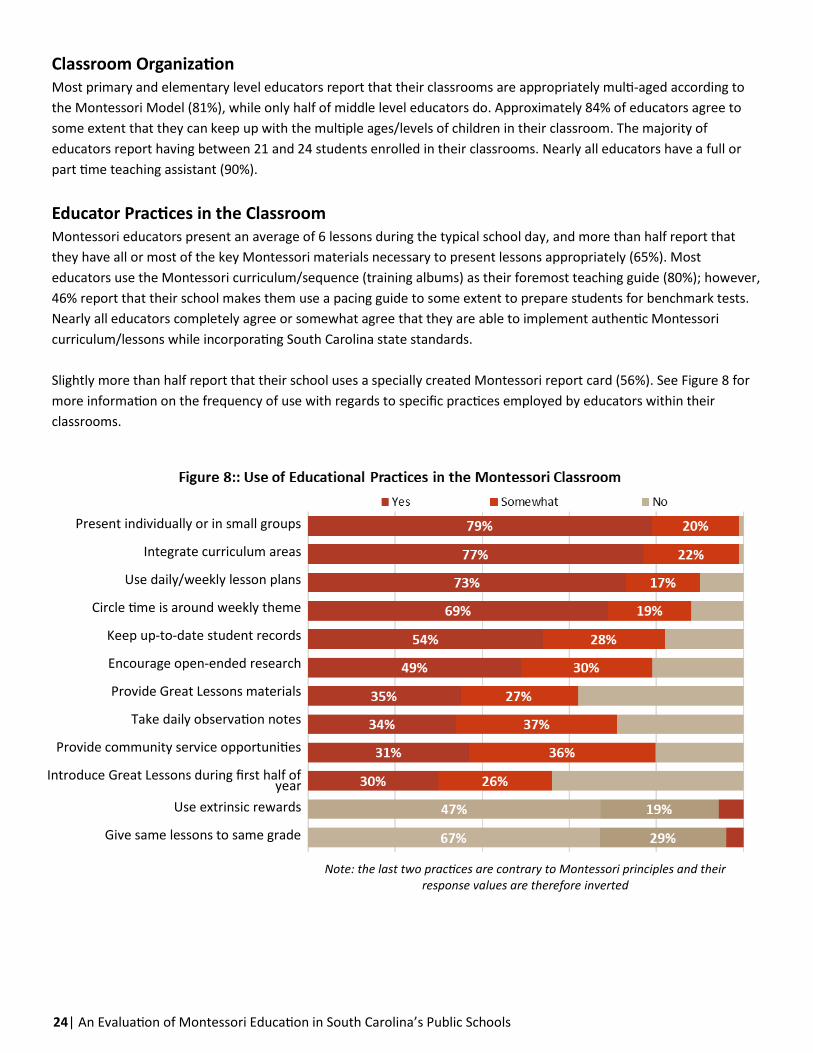
Educator Practices in the Classroom Montessori educators present an average of 6 lessons during the typical school day, and more than half report that
they have all or most of the key Montessori materials necessary to present lessons appropriately (65%). Most
educators use the Montessori curriculum/sequence (training albums) as their foremost teaching guide (80%); however,
46% report that their school makes them use a pacing guide to some extent to prepare students for benchmark tests.
Nearly all educators completely agree or somewhat agree that they are able to implement authentic Montessori
curriculum/lessons while incorporating South Carolina state standards.
Slightly more than half report that their school uses a specially created Montessori report card (56%). See Figure 8 for
more information on the frequency of use with regards to specific practices employed by educators within their
classrooms.
Note: the last two practices are contrary to Montessori principles and their response values are therefore inverted
Present individually or in small groups
Integrate curriculum areas
Use daily/weekly lesson plans
Circle time is around weekly theme
Keep up-to-date student records
Encourage open-ended research
Provide Great Lessons materials
Take daily observation notes
Provide community service opportunities
Introduce Great Lessons during first half of year
Use extrinsic rewards
Give same lessons to same grade
An Evaluation of Montessori Education in South Carolina’s Public Schools | 25
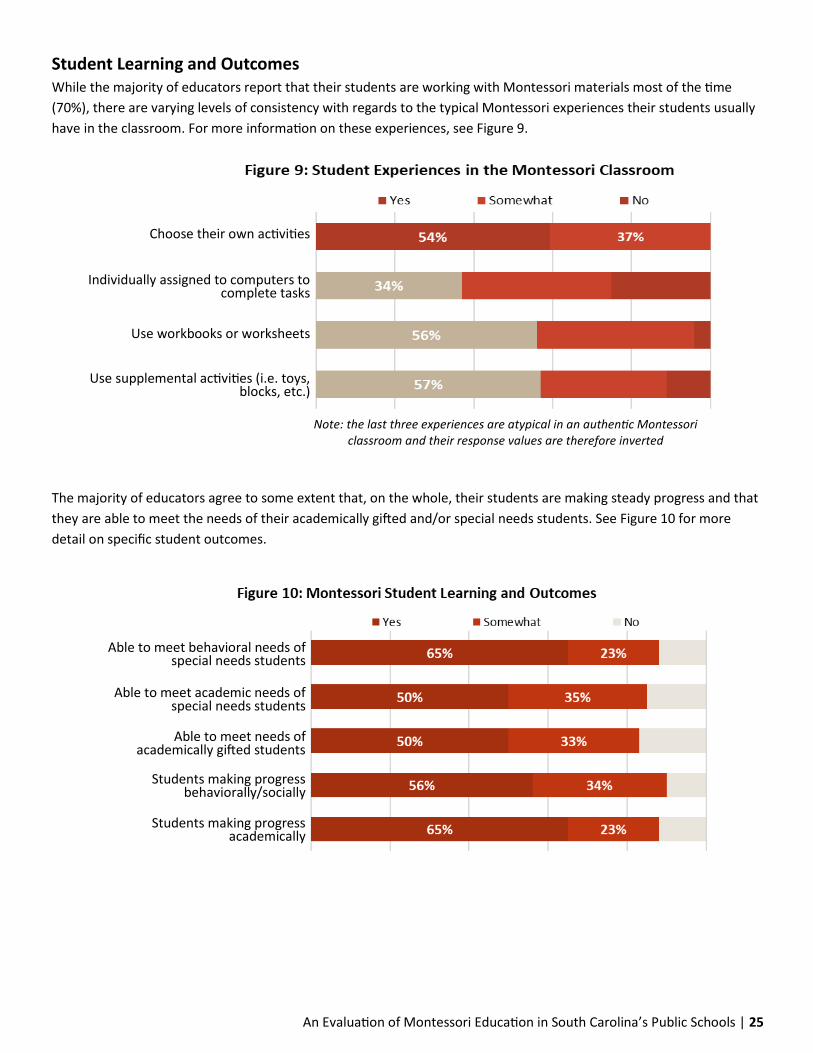
Student Learning and Outcomes While the majority of educators report that their students are working with Montessori materials most of the time
(70%), there are varying levels of consistency with regards to the typical Montessori experiences their students usually
have in the classroom. For more information on these experiences, see Figure 9.
The majority of educators agree to some extent that, on the whole, their students are making steady progress and that
they are able to meet the needs of their academically gifted and/or special needs students. See Figure 10 for more
detail on specific student outcomes.
Note: the last three experiences are atypical in an authentic Montessori classroom and their response values are therefore inverted
Choose their own activities
Individually assigned to computers to complete tasks
Use workbooks or worksheets
Use supplemental activities (i.e. toys, blocks, etc.)
Able to meet behavioral needs of special needs students
Able to meet academic needs of special needs students
Able to meet needs of academically gifted students
Students making progress behaviorally/socially
Students making progress academically
26 | An Evaluation of Montessori Education in South Carolina’s Public Schools
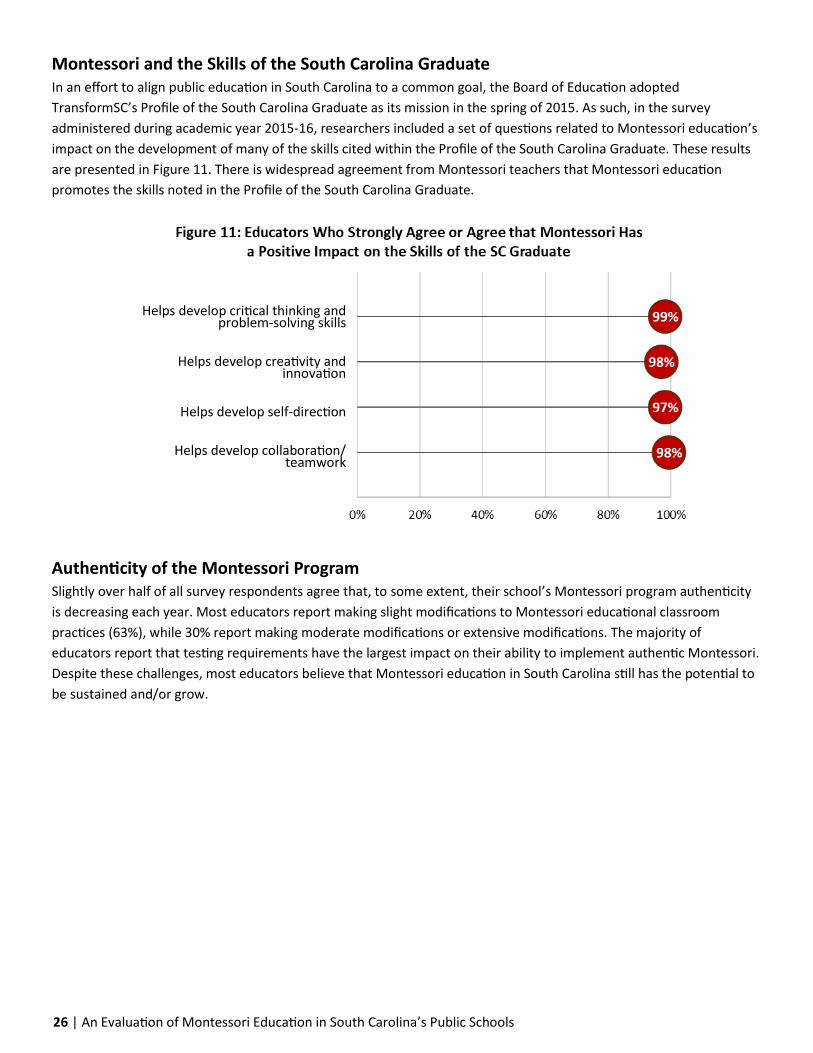
Montessori and the Skills of the South Carolina Graduate In an effort to align public education in South Carolina to a common goal, the Board of Education adopted
TransformSC’s Profile of the South Carolina Graduate as its mission in the spring of 2015. As such, in the survey
administered during academic year 2015-16, researchers included a set of questions related to Montessori education’s
impact on the development of many of the skills cited within the Profile of the South Carolina Graduate. These results
are presented in Figure 11. There is widespread agreement from Montessori teachers that Montessori education
promotes the skills noted in the Profile of the South Carolina Graduate.
Authenticity of the Montessori Program Slightly over half of all survey respondents agree that, to some extent, their school’s Montessori program authenticity
is decreasing each year. Most educators report making slight modifications to Montessori educational classroom
practices (63%), while 30% report making moderate modifications or extensive modifications. The majority of
educators report that testing requirements have the largest impact on their ability to implement authentic Montessori.
Despite these challenges, most educators believe that Montessori education in South Carolina still has the potential to
be sustained and/or grow.
Helps develop critical thinking and problem-solving skills
Helps develop creativity and innovation
Helps develop self-direction
Helps develop collaboration/teamwork

An Evaluation of Montessori Education in South Carolina’s Public Schools | 27
Conclusions and Discussion
Since the establishment of the state’s first public Montessori program at Walker Gamble School in the Clarendon 3
school district in the mid-1990s, South Carolina has been on the cutting edge of public Montessori. Yet, despite the
growth and popularity of Montessori education in the state and across the country, there has been a dearth of
research on the fidelity of Montessori programs in the public sector and the effect of Montessori on student outcomes.
To analyze these important questions, the Riley Institute developed and implemented the most comprehensive
evaluation of public Montessori to date. This evaluation provides insight on the impact of public Montessori on diverse
stakeholders.
Through the efforts of state, district, and school officials, South Carolina is a leader in public Montessori, and this study
demonstrates that public Montessori continues to grow throughout the state in terms of the number of Montessori
programs and student enrollment. While the teacher survey results indicate that there is some tension between the
Montessori model and the standards and accountability movement, classroom observation and principal surveys
indicate that most public Montessori programs are implementing the Montessori model with fidelity.
For the impact study, researchers matched Montessori students to non-Montessori students with the same
demographics and similar baseline academic performance. These matched analyses provided evidence that Montessori
students experienced greater achievement growth in ELA, math, and social studies. Further, the benefits of Montessori
extend beyond standardized test scores, as Montessori students also demonstrated better school attendance and
behavior. The results for affective outcomes were mixed, but Montessori students had higher levels creativity and
executive function in some years of the evaluation.
Some possible reasons for the positive Montessori effects seen in this study stem directly from the core elements of
the Montessori philosophy and method, which have remained relatively unchanged for over 100 years. Many of these
core practices have been researched independently and found to be solid strategies for yielding positive outcomes for
students. In the Montessori model, however, they are bundled into one instructional package, complementing each
other and guided by the Montessori philosophy of how children develop and learn.
Like any evaluation of this kind, this study is not without its limitations. In terms of fidelity to the model, principal
survey scores were sometimes inconsistent with the classroom observation scores. For the impact analyses, the major
challenge was selection bias. The research team employed exact matching for the achievement, attendance, and
behavior outcome analyses to create apples-to-apples comparisons, and a “no choice” Montessori program at entry for
three and four year-olds was selected for the cohort analyses. Despite the best efforts of the research team, selection
bias could still exist. Finally, the research team faced a host of challenges regarding measurement of outcomes. The
state-mandated standardized testing regime changed three times over the course of this study. Additionally, while
there is general agreement that affective outcomes are critically important, there is still debate regarding the best way
to measure them. In this evaluation, researchers used a variety of measures to assess affective outcomes, none of
which were perfect.
This evaluation provided considerable evidence of a Montessori advantage. However, the research team was
particularly interested in the effect of Montessori on education inequalities. Montessori education is often thought of
as an elite approach to education for privileged students, primarily available in the private sector. However, because of
28| An Evaluation of Montessori Education in South Carolina’s Public Schools
the promise the model has offered to students across the world for over 100 years, considerable investment was made
in South Carolina to implement Montessori in public schools across the state. These schools, most of them classified as
Title I, serve large numbers of low-income and minority students in often rural and poverty-stricken areas. The
question of how these students perform and whether or not investment in Montessori has paid off for these students
looms large.
This study attempted to answer these and other questions around the ability of Montessori education in the public
sector to moderate the effects of poverty on students. This study found that public Montessori is not limited to high-
income, primarily white students. In fact, low-income students and non-white students make up 54% and 45%,
respectively, of all Montessori students in public Montessori programs in South Carolina. However, within district
analyses demonstrated that white and higher income students may be overrepresented in public Montessori
programs. Nonetheless, it remained an open question whether the Montessori advantages in test score growth found
in the general analyses were wide-ranging. The sub-group analyses presented in this evaluation provide evidence of the
egalitarian possibilities of Montessori education. Low-income students and low-achieving students seem to benefit
from Montessori. While white Montessori students exhibit higher growth than similar students in the matched
comparison group, so do black Montessori students. This evaluation by the Riley Institute provides evidence that public
Montessori has appeal to a broad range of parents in South Carolina, and it appears that the benefits of Montessori
education are wide-ranging as well.
Acknowledgements
The authors thank the Self Family Foundation and the South Carolina Education Oversight Committee for providing
funding for this evaluation. The authors also thank the children, parents, teachers, and school administrators for their
participation and several groups and individuals who provided assistance throughout the study: the South Carolina State
Department of Education; Dr. Angela Murray with the American Montessori Society; Dr. Steve Hughes with the
Association Montessori Internationale global research committee; Jackie Cossentino and Katie Brown with the National
Center for Montessori in the Public Sector; and numerous student research assistants, including Delia Allen, Elizabeth
Bundy, Maddison Hall, Amanda Michalski, Julia Roberts, Hannah Warren, and Daniel Zhang.
This evaluation was carried out in accordance with the recommendations in the guidelines for human research of the
Institutional Review Board at Furman University, which approved the study protocol. Parents or guardians provided
written consent for all participation of minors.
The content of this report is solely the responsibility of the authors and does not necessarily reflect any official positions
of the funding organizations or Furman University.
Future reports from this evaluation will be available at furman.edu/Montessori.

An Evaluation of Montessori Education in South Carolina’s Public Schools | 29
References
Ansari, A. & Winsler, A. (2014). Montessori Public School Pre-K Programs and the School Readiness of Low-Income Black
and Latino Children. Journal of Educational Psychology, 106(4), 1066-1079.
Besançon, M. & Lubart, T. (2008). Differences in the development of creative competencies in children schooled in
diverse learning environments. Learning and Individual Differences, 18(4), 381-389.
Bronson, M. (2000). Self-regulation in early childhood. New York: Guilford Press.
Byun, W., Blair, S., & Pate, R. (2013). Objectively measured sedentary behavior in preschool children: comparison
between Montessori and traditional preschools. International Journal of Behavioral Nutrition and
Physical Activity, 10(2).
Cameron Ponitz C. E., McClelland M. M., Jewkes A. M., Connor C. M., Farris C. L., & Morrison F. J. (2008). Touch your
toes! Developing a direct measure of behavioral regulation in early childhood. Early Child. Res. Q. 23, 141–158.
Carlson, S. M. (2017). Minnesota Executive Function Scale Technical Report. St. Paul: Reflection Sciences.
Dohrmann, K., Nishida, T., Gartner, A., Lipsky, D., & Grimm, K. (2007). High School Outcomes for Students in a Public
Montessori Program. Journal of Research in Childhood Education, 22(2), 205-217.
Education Oversight Committee (2016). Results from the 2015 Parent Survey. Columbia, 31.
Ervin, B., Walsh, P. D., & Mecca, M. E. (2010). A Three-Year Study of Self-Regulation in Montessori and Non-Montessori
Classrooms. Montessori Life, (2), 22-31.
Gioia, G., Isquith, P., Guy, S., & Kenworthy, L. (2000). TEST REVIEW Behavior Rating Inventory of Executive Function. Child
Neuropsychology (Neuropsychology, Development and Cognition: Section C), 6(3), 235-238.
Hanson, B. E. E. (2009). An Exploratory Study on the Effectiveness of Montessori Constructs and Traditional Teaching
Methodology as Change Agents to Increase Academic Achievement of Elementary Black Students.
Unpublished doctoral dissertation. Capella University.
Lillard, A. S., & Else-Quest, N. (2006). Evaluating Montessori Education. Science, 313(5795), 1893-1894.
Lillard, A. S. (2012). Preschool children's development in classic Montessori, supplemented Montessori, and conventional
programs. Journal of School Psychology, 50(3), pp.379-401.
Lillard, A. S. (2017). Montessori: The Science behind the Genius, 3rd ed. New York, NY: Oxford University Press.
Lillard, A. S., Heise, M., Richey, E., Tong, X., Hart, A., & Bray, P. Montessori Preschool Elevates and Equalizes Child
Outcomes: A Longitudinal Study. Frontiers, 25 Sept. 2017, www.frontiersin.org/articles/10.3389/
fpsyg.2017.01783/full.
Lopata, C., Wallace, N., & Finn, K. (2005). Comparison of Academic Achievement Between Montessori and Traditional
Education Programs. Journal of Research in Childhood Education, 20(1), 5-13.
30| An Evaluation of Montessori Education in South Carolina’s Public Schools
Lubart, T., Laud B., and Baptiste, B. (2011). EPoC: Évaluation Du Potentiel Créatif Des Enfants. Paris: Editions Hogrefe
France.
Malenka, R.C., Nestler, E.J., & Hyman, S.E. (2009). Widely Projecting Systems: Monoamines, Acetylcholine, and Orexin
In A. Sydor & R.Y. Brown (Eds.) Molecular Neuropharmacology: A Foundation for Clinical Neuroscience, 2nd ed.
(155–157). New York: McGraw-Hill Medical.
McClelland, M. M., Cameron, C. E., Duncan, R., Bowles, R. P., Acock, A. C., Miao, A., & Pratt, M. E. (2014). Predictors of
early growth in academic achievement: The head-toes-knees-shoulders task. Frontiers in Psychology, 5, 1-14.
Paulus, P. B. & Nijstad, B. A. (2003). Group Creativity: Innovation through Collaboration. New York: Oxford University
Press.
Peng, H.H. & Md-Yunus, S. (2014). Do children in Montessori schools perform better in the achievement test? A
Taiwanese perspective. Int. J. Early Child. 46, 299–311.
Pianta, R. C., & La Paro, K. M. (2003). Classroom Assessment Scoring System: Guide and Training Manual. University of
Virginia, Charlottesville. Unpublished manuscript.
Rathunde, K. & Csikszentmihalyi, M. (2005). Middle school students’ motivation and quality of experience: a
comparison of Montessori and Traditional school environments. American Journal of Education, 111(3), 341-371.
Runco, M. & Jaeger, G. (2012). The Standard Definition of Creativity. Creativity Research Journal, 24(1), 92–96.
Slotkin, J., Kallen, M., Griffith, J. Magasi, S. Salsman, J., Nowinski, C. & Gershon, R. (2012). NIH Toolbox Technical
Manual. Bethesda: National Institutes of Health.
Davis, D. H. & Raymond, M. (2012). Choices for Studying Choice: Assessing Charter School Effectiveness Using Two
Quasi-Experimental Methods. Economics of Education Review 31(2), 225–36.
Center for Research on Education Outcomes (2015). Urban Charter School Study Report on 41 Regions. [online]
Stanford: Stanford University. Available at: http://urbancharters.stanford.edu/download/Urban%20Charter%
20School%20Study%20Report%20on%2041%20Regions.pdf [Accessed 28 Nov. 2017].
Center for Research on Education Outcomes (2009). Multiple choice: Charter school performance in 16 states. [online]
Stanford: Stanford University. Available at: http://credo.stanford.edu/reports/MULTIPLE_CHOICE_CREDO.pdf
Websites Cited
American Montessori Society: https://amshq.org
National Center for Montessori in the Public Sector: https://www.public-montessori.org/

Study Authors and Contributors
Dr. Brooke Culclasure (Ph.D. University of Virginia) served
as the study’s principal investigator
and oversaw all aspects of the study.
Dr. Culclasure is the Research Director
of the Riley Institute’s Center for
Education Policy and Leadership,
housed at Furman University.
Dr. David J. Fleming (Ph.D. University of Wisconsin) served
as the study’s senior statistician and
co-investigator. Dr. Fleming is an
Associate Professor in the Politics and
International Affairs Department at
Furman University and a Senior
Researcher with the Riley Institute.
Dr. Ginny Riga (Ed.D. University of South Carolina) served as
the Montessori expert consultant for
the study and assisted with the
measurement of model fidelity. Dr. Riga
currently works in the South Carolina
State Department of Education as the
Montessori Consultant in the Office of
Personalized Learning .
Alexis Sprogis assisted with data collection, project
logistics, and reporting. She is a
Research Specialist in the Riley
Institute’s Center for Education Policy
and Leadership, housed at Furman
University.
Dr. Lorraine DeJong, Kelly Gregory, and Rashmi Janakiraman served as data collectors in schools. Montessori classroom
observers included Catherine Stevenson Beemer, Gail Hornsby, Stacy Hudson, Elaine Kalagher, Jo-Anne Long, Russell Long,
Teresa Noble, and Diana Zellner.
Suggested Citation
Culclasure, B., Fleming, D.J., Riga, G., & Sprogis, A. (2018). An Evaluation of Montessori Education in South Carolina’s Public
Schools. The Riley Institute at Furman University. Unpublished manuscript.
