an evaluation of factors leading to … · an evaluation of factors leading to disequilibrium of...
TRANSCRIPT

, 20147Arabian Journal of Business and Management Review (Nigerian Chapter) Vol. 2, No.
38
AN EVALUATION OF FACTORS LEADING TO DISEQUILIBRIUM OF ELECTRICITY DEMAND AND SUPPLY
IN GAUTENG PROVINCE
Shadrack Mabaso Graduate of the Regent Business School, Durban, South Africa
Anis Mahomed Karodia (PhD) Professor, Senior Academic and Researcher, Regent Business School, Durban, South Africa
ABSTRACT The purpose of this study is to review, summarise and critically assess the academic studies that have dealt with either the causal relationship between energy consumption and demand and supply of electricity in South Africa and internationally, and outline recent forecasts for electricity demand and supply in 2013 until March 2014. The results of this review aim to identify gaps in the existing study. From a policy point of view, the findings of this effort have the potential to inform the relevant stakeholders (for example Eskom, Nersa, DOE) to make appropriate interventions to improve the status quo of the energy sector. The results have indicated that studies examining the causality direction between energy (electricity) consumption, gross domestic products (GDP) and economic growth have failed to reach a consensus. Another potential reason for the results is the availability –or lack thereof– of data specific for the country. The study connected the relationship between prices, income and inflation. The study also looked at the relationship between variables like unemployment and poverty. On the other side, the studies looking at the factor affecting energy (electricity) demand have agreed that economic growth or income or output are considered significant factors. The role of prices was debatable among different studies. This has become more apparent when reviewing the few forecasting efforts in the country that resulted in conflicting results. The study also came with other energy reduction strategies that can be used with different industries within Gauteng province and the rest of South Africa (SA), and barriers to energy reduction strategies. The aim of this study is to analyse the impact caused by the shortage of electricity supply and increasing demand to the economy of Gauteng Province. This research identified some factors that contribute to disequilibrium of electricity demand and supply, and to come with other energy reduction strategies that can help to solve the shortage of energy.. For the purpose of this study both qualitative and quantitative research methodologies were used. However, for a major portion of this study, the qualitative research methodology was used. The sample population of fifty respondents was targeted, with a 82% response achieved. A questionnaire was used to gather data from the target population.

, 20147Arabian Journal of Business and Management Review (Nigerian Chapter) Vol. 2, No.
39
The study recommended other energy reduction strategies that can be used in South Africa to help reduce demand of electricity from the national grid. This study had limitations in its research design, strategy and sampling method; hence, areas for future studies addressing these shortcomings have been identified and recommended. Introduction The chapter give overview of the problem South Africa is facing regarding electricity shortage, and the history connected to this problem. This chapter also highlight from the time of former president Thabo Mbeki when the white paper was developed to solve this problem of electricity shortage. The main aim of the study is to evaluate factors leading to disequilibrium of electricity demand and supply in Gauteng Province. The objectives of the study are already mentioned in this chapter in order to analyse and come with a solution to the problem. This study is significant in that it provides valuable theoretical insight to Eskom Demand Response section (a wing of IDM department). In addition, this study will provide recommendations to the Senior General Manager of IDM and to the Senior Manager of Demand Response team in Eskom. Further, this study highlights impact caused by disequilibrium of demand and supply of electricity in Gauteng Province. The study also provides recommendations regarding other energy reduction strategies that can be used to reduce demand and consumption of electricity per industry in Gauteng Province, and to look at how Demand Response team can add value to the whole of Eskom. The advents of computer-based communication technologies and communication networks have become an important factor in global interaction (Haque, Khatibi, Raquib and Al Mahmud, 2007:2). Telephone, for example, provides the basic connection for social interaction between individuals and linkages, both within and among nations. The Namibian telecommunication industry has grown rapidly over the past years, keeping appropriate pace with global advancements, especially the mobile telecommunication market. The liberalization of the sector has particularly helped to reform and also increase competition among the mobile telecommunication service providers (MTSPs). Therefore, in this highly competitive market, it is important to know the consumer buying behaviour as it plays a vital role in creating an impact on the purchase of products and services. Organisations influence consumer behaviour through the use of integrated marketing mix. A successful company is able to constantly offer benefits to satisfy the changing customer needs and wants through the manipulation of its products or services, price, place and promotion. Therefore,marketers must try to understand consumer buying behaviour so that they can offer consumers greater satisfaction. The purpose of the study was to evaluate factors that determine the selection of MTSPsin northern Namibia, specifically in Oshakati. This chapter underlines the importance of the research, formulate its objectives, explain the rationale and discussthe research significance and potential value. The structure of the dissertation is outlined with a brief description of each chapter provided. Aim of the Research The main aim of the study is to evaluate factors leading to disequilibrium of electricity demand and supply in Gauteng Province. Research Objectives The objectives of the study are to analyse how the shortage of electricity supply and increasing demand of electricity in Gauteng will have the impact in the following areas:
To evaluate NERSA decision in granting Eskom tariff increase of 8% in 2012 until 2015 - how it will threaten economic growth and gross domestic products (GDP) of the Gauteng province and SA.
To evaluate the impact or harm on the economy caused by disequilibrium in demand and supply of electricity.

, 20147Arabian Journal of Business and Management Review (Nigerian Chapter) Vol. 2, No.
40
To examine the weakness/movement of the price mechanisms in order to adjust supply and demand of electricity.
LITERATURE REVIEW Introduction Electricity is a low-valued yet necessary good within any economy and is one of the pillars of economic growth (Blignaut, 2009). The generation, supply and distribution of electricity, and access to it, have the potential to unlock economic development. South Africa, with almost 50 million residents, has about 39 000MW of installed electricity capacity. In comparison, Nigeria has an installed capacity of 4 000MW serving 150 million. This comparison indicates a key reason why South Africa could develop in the way it has, while Nigeria, despite its natural resources, climate and arable land, and has not. A number of studies for both developed and developing countries have focused their investigations on the demand for energy or, more specifically, for electricity (Amarawickrama & Hunt, 2008; Atakhanova & Howie, 2007; Hondroyiannis, 2004; Dergiades & Tsoulfidis, 2008; Diabi, 1998; Alfaris, 2002; Narayan et al., 2007). This chapter explained the economic challenges faced by the citizens of SA, resulting from income inequality, unequal wealth distribution, poverty and high unemployment rate. A literature review is an examination of scholarly information and research-based information on a specific topic (Dawidowicz, 2010:6). Its goal is to create a complete, accurate representation of the knowledge and research-based theory available on a topic. This chapter reviews the existing literature on factors influencing consumer buying behaviour in regard to use and demand of electricity and adoption of Demand Response programme by Eskom to manage demand of electricity in Gauteng Province and analyse as well as the marketing mix elements. This chapter discusses the views of various authors with regard to NERSA decision in granting Eskom tariff increase of 8% in 2012 until 2015 - how it will threaten economic growth and gross domestic products (GDP) of the Gauteng province and SA. The overview of factors influencing disequilibrium of demand and supply of electricity. In addition to service and service quality, other energy efficiency/reduction and its barriers, the chapter also focused on Eskom electricity demand forecasting for 2013 until March 2014. From a policy point of view, the findings of this study have the potential to give answers to the general debate and inform the relevant stakeholders to make appropriate interventions to improve the status quo of the energy sector. Definition of NERSA The national energy regulator of South Africa (NERSA) is responsible to regulate the whole energy industry in South Africa (SA), and to set the applicable tariffs which Eskom needs to charge to the market. NERSA also receive budget from national treasury that will be used by Eskom. NERSA is also responsible to fund the energy/electricity projects that are being undertaken by Eskom. such as Demand Response (DR) programme that is being run by Eskom but is fully funded by NERSA and DoE, but Eskom only run it. Demand response (DR) team its effectiveness refers to the extent to which DR team has been successful in meeting the objectives of its assignment (Eccles, Smith, Tanner, Van Belle and Van der Watt, 2010:3). Conceptual Frameworks Khan (2011:10) states that conceptual framework is the researchers’ own position on the problem and gives direction to the study. Conceptual frameworks and the research model are discussed in the following sections. The South African electricity sector has been characterised over the years by unique traits, while it has passed through different phases in which various key players had dissimilar

, 20147Arabian Journal of Business and Management Review (Nigerian Chapter) Vol. 2, No.
41
responsibilities. Here, the main phases as well as the key players and their roles in each are analysed. The following sections discuss the evolution of South African electricity consumption and prices. According to Marquard (2006), the South African electricity system experienced three main phases.
Phase one, the late 19th century to the 1900s, was characterised by the existence of small electricity systems set up by local authorities in cities and relatively larger electricity systems that were self-producers (mainly mines).
Phase two, the late 1900s up to the early 1920s, started with the development of a generation monopoly in the Witwatersrand for the provision of electricity to the gold-mining industry.
Phase three, from the early 1920s until today, started with the establishment of the state utility, Eskom, and saw the transition towards an integrated national system with Eskom as the generator, transmitter and main distributor of electricity (Marquard, 2006).
According to daily maverick (2013) electricity generation increased slightly (approx. 4%) during the study period. However, the current maximum generation capacity has a ceiling, as can be noted from the year 2000/2006, which saw no capacity expansion. This makes it unfeasible for the policy-makers to increase the supply substantially in the short-run. Most people in SA think that electricity is pumped out of the ground from moving air like wind energy. Electricity can't be pumped out of the ground like oil or captured from moving air like wind energy. Electricity is a secondary source of energy, meaning that it is produced by the use of primary energy sources such as coal, natural gas, or nuclear reactions. Electricity plays such an essential role in South Africa that its supply and demand are often examined separately from the primary sources used to produce it. Minister of Public Enterprise Malusi Gigaba recently announced that coal is a scarce resource in SA because of its value being used for producing electricity. It is very difficult to change the situation of moving from coal generated electricity in SA to nuclear generated electricity, because while Eskom is still struggling with expertise to build coal generated electricity power stations, what about the difficulty of acquiring skills of building nuclear generated electricity power stations. Eskom has always got it wrong when it comes to costing the building of coal generated power stations. In the long run renewable sources such as solar, wind, and geothermal are still unlikely to substantially change the mix of SA energy supply. And integrating the energy from many of these renewable energy sources would likely require substantial expansion of the electric transmission system. While nuclear generation is a zero-atmospheric-emissions alternative that already produces one-fifth of America's electricity as per figure 2.1 below. Getting electric power to consumers may be as much of a problem as generating it. Generating stations usually are built away from load centres because sites are easier to find and fewer people are disturbed by the accompanying noise, emissions, and activity. This power must be delivered by a high-voltage transmission system that has become increasingly stressed in recent years as growing demand has outstripped capacity.

, 20147Arabian Journal of Business and Management Review (Nigerian Chapter) Vol. 2, No.
42
Figure 2.1 The problem in SA is similar to the problem in USA except that SA don’t have nuclear programme that is currently active, although USA nuclear programme is 19.4%. SA produce 80% of coal and 49% of the same coal produced is used to produce electricity in SA power stations across the whole country. Figure 2.1 above show nearly exactly the same way how Eskom utilise SA natural resources to produce energy. Figure 2.1 above shows that America has plenty of coal. Its mines produced 1.2 billion tons in 2006, nearly all of it destined for electricity generation. That was a record year, but it barely scratched the surface of U.S. recoverable coal reserves, which are estimated at about 270 billion tons.32 More than one-fourth of the total known world coal reserves, are in the United States, and supplies are sufficient for hundreds of years at current consumption rates. The situation in South Africa is similar to the situation in USA because SA is one of the largest producers of coal in the world, and all SA power stations use coal to produce electricity. SA nuclear programme is still very low as compared to America and most of the households and companies don’t prefer to use natural gas as a supplement to energy. According to the National Academies (2013) advisers to the nation on science, engineering and medicine, demand in U.S.A is projected to increase by 30% between now and 2030, propelled by rising use of electricity and possibly the expanded use of still-developing technology that converts coal to liquid fuel. Most of the increased supply will probably come from western states, which now provide about six-tenths of the nation's coal. Wyoming alone accounted for 38% of all domestic coal mined in 2006. SA has the same situation as compared to USA where demand for electricity is projected to increase by 30% in 2030. One of the reasons for the increase in demand of electricity is the new developments of properties and residential dwellings, increase in urbanisation, population and new entrants to the market or industrialisation. According to the National Academies (2013) advisers to the nation on science, engineering and medicine, America has plenty of coal. Its mines produced 1.2 billion tons in 2006, nearly all of it destined for electricity generation. That was a record year, but it barely scratched the surface of U.S. recoverable coal reserves, which are estimated at about 270 billion tons. More than one-fourth of the total known world coal reserves are in the United States, and supplies are sufficient for hundreds of years at current consumption rates. The country’s economic growth and industrialisation, as well as the electrification programme, resulted in high levels of demand for electricity. This, in combination with the limited supply, led to countrywide power outages that had significant negative effects on the economy as a whole. As the national electricity supplier, Eskom was responsible for

, 20147Arabian Journal of Business and Management Review (Nigerian Chapter) Vol. 2, No.
43
managing the situation, focusing on demand side management (DSM) and the energy efficiency programme in the short term, as well as planning to maintain and expand the current infrastructure in the long term. According to department of minerals and energy (2010b) for the past five years since 2008 until middle 2017, Eskom has been building new power plants in order to close the gap between demand and supply of electricity (DME, 2010b), focusing more on the long-term increase of the supply. The new build programme includes four new power plants (Kusile, 4,800MW; Medupi, 4,800 MW; Ingula, 1,332 MW; Sere wind farm, 100MW) that will boost the electricity supply of SA. A new project has also been launched in Botswana, a coal-fired power plant with a capacity of up to 4,800 MW. Moreover, it is also necessary to upgrade the older plants, hence the electricity entity’s intermediate plans, known as the Simunye projects. However, this rise in electricity supply will be in effect only by 2013 or later, so the maximum supply in the short term will remain constant. Rahman (2010:2886) mentions that the good reliability of electricity supply and strategies on managing demand of electricity depends on efforts and feasible investments that Eskom is making). Many customers in SA use electricity on a daily basis, and they rely on Eskom to supply reliable electricity, but Eskom national grid is under continuous pressure because Eskom new build programme (building new power stations) is still underway. Therefore strategies must be made in the meantime to manage the demand of electricity. Electricity distribution depend on some factors and customers always use electricity because is cheap and accessible, therefore it is easy to fulfil customers desires. In the energy market, customers have different expectations when it comes to the supply of electricity they receive from Eskom. South Africa (SA) market has got only major supplier /distributor of electricity that is Eskom. Eskom distributes almost 90% of electricity to the market of Gauteng Province, and the rest of SA; therefore it leaves very little space for Independent power producers (IPP) to supply to the market of Gauteng Province, and the rest of SA. Moreover there is no clear direction in terms of policy how IPP are going to compete against state owned monopoly Eskom. Therefore even if SA customers are not happy with the service they receive from Eskom, it is very difficult for SA consumers and industries to rely elsewhere for assistance. Eskom has introduced DR programme in order to reduce demand of electricity and meet SA consumer/customer expectations. The consumer wants and expectations are changing all the time (as per different seasons) and this directs to a condition where customers create ever higher benchmarks. The positive relationship of service quality with customer satisfaction, customer preference, profitability, competitiveness is well proven in the academic literature. (Paulrajan and Rajkumar, 2011:41) mentioned that applying customer satisfaction approach means recognizing customers, and then finding their wants and expectations, and to end with their perceptions (Paulrajan and Rajkumar, 2011:41). Moreover, researchers have also found customer satisfaction from a multi-dimensional nature and view overall satisfaction as a function of satisfaction with multiple experiences with the service provider. Eskom DR programme success factor is the ability to manage electricity demand that will help Eskom in delivering better customer value and the objective of a strategy is to deliver value to the customers in order to provide required returns to the shareholders and employees. For Eskom to identify purchasing behaviour determinants for electricity, some variables that significantly correlate with the purchase of electricity were identified. Addressing these could improve the efficiency to get customers or make customers enrol with DR programme because there is no opportunity to switch to other competitors because Eskom has monopolised the whole market. The decision of NERSA to grant Eskom 8% tariff increase in 2012 until 2017 mean that Eskom has to re-engineer its business for the following reasons

, 20147Arabian Journal of Business and Management Review (Nigerian Chapter) Vol. 2, No.
44
To look for funding elsewhere in order to finish its new build programme in order to help in increasing the capacity of electricity.
To rely on DR programme to manage the ever increasing demand of electricity, and while maintaining its current power stations.
Each and every business in the world operates for only one reason, profit. Customer satisfaction is one of the tools used to boost business profits. The decision of NERSA means that Eskom projected revenue will not increase with more than 8%, although Eskom applied for 12% increase from NERSA (NERSA:2012). According statistics SA (2013) the Gross domestic products (GDP) of SA economy are 3% currently in the second quarter of 2013. Therefore 8% tariff increase of electricity result in pushing SA inflation to be more and higher than anticipated. The NERSA decision to grant Eskom 8% tariff increase means that all good manufactured must be marked up by 8% more in order for producers to recover their cost production; otherwise they will operate their business on a loss. According statistics SA (2013) inflation is curretly 6% in SA in second quarter of 2013. The 8% tariff increase means that Eskom tariff increase will be 2% more than current rate of inflation. 8% tariff increase is not good for economy of Gauteng because most producers of goods and service must increase their products with more than 8%, which will be very harmful to the whole economy of Gauteng. The increase in price of electricity will make the cost of living too high, and some companies might find it difficult to continue producing goods and might end up exiting the industry because the cost the cost of producing the goods and services is too high or the industry is no longer productive. The opportunity cost of producing goods is one of the critical factors that decide whether the business should continue producing or not. If the opportunity cost is favourable to the business of course the business will continue operating and producing, but if it is unfavourable to the business, the business will exit the market. If the businesses exit the market it means unemployment will be increasing. Gauteng is one of the economy harbour of SA. Most people leave rural areas to Gauteng province in search of better living and economic opportunities. The decision of NERSA to increase electricity tariffs by 8% will have negative effect in growing the economy and improving unemployment rate. Factors influenced/affected by NERSA decision to increase electricity tariff by 8%. Inflation and prices In February 2000 the government of SA under leadership of former president Thabo Mbeki announced that formal inflation targeting would also be adopted in all provinces in SA as the monetary policy framework. Before this announcement “informal inflation targeting” was already applied by the Reserve Bank only. Gauteng Province and the whole government of SA started to adopt inflation targeting in the year 2000 because the government wanted to move to economic approach of growth in quality and reliable supply of electricity. Since the year 2004 SA government has been targeting inflation to be between 3 and 6 percent per year. Economists like Adam Smith, David Hume, Alfred Marshall they all argued that rapid growth or increase in price of goods and services cause inflation. Therefore monetary policy must be properly timed in order to help stabilise an economy of Gauteng Province. Expansionary monetary policy in Gauteng Province can help to stimulate demand and push output of economy to required level. But we must always remember that expansionary monetary policy is a source of inflation, therefore we must strictly control tariffs to help control inflation in Gauteng Province. Mishkin (2001:1) has mentioned that ‘’ inflation targeting is the monetary policy strategy used/adopted now in order to achieve the following’’ i) The public announcement of medium-term numerical targets for inflation.

, 20147Arabian Journal of Business and Management Review (Nigerian Chapter) Vol. 2, No.
45
ii) An institutional commitment to price stability as the primary goal of monetary policy, to which other goals are controlled/monitored
iii) Increase in accountability of the central bank for meeting its inflation objectives. iv) It increases the transparency of the monetary policy strategy through communication
with the public and markets about the plans, aims and the decisions of the monetary authorities.
v) The information must be inclusive of the strategy in which many variables and not just monetary aggregates or exchange rates are used for deciding the setting of policy instruments.
Eskom has recently announced that it will be increasing the price of electricity with 8% annually for the coming 5 years, this will in turn result in the increase in the price of commodities & goods and services, and will finally implies in higher inflation. Therefore looking at global financial crisis it is also anticipated that inflation is still expected to continue to increase, however it is also expected that rates may decrease but does not mean we will achieve inflation targeting of between 3 and 6 percent as per Reserve Bank target. Gauteng Province and the SA government focus mainly in increasing aggregate demand in order to reduce prices (when prices go down aggregate demand will go up or increase and inflation will be forced to reduce). There are two factors that play important role in inflation, namely: - prices and interest rates. In economics they mention that when demand increase price decrease. But because electricity is necessity and need, even if NERSA increase electricity tariff rates, the demand of electricity will not reduce because consumers and companies (Industries) use electricity every day in Gauteng province and the rest of South Africa. Demand for money is linked to money income (nominal GDP) and interest rates. If nominal income expands, more money balance is required, and we must also remember that there is a relationship between price, quantity of money demanded and the interest rates. Economy nominal GDP is Py= GDP=MV, and velocity= GDP/size of money stock (V=GDP/M1). Velocity of money means number of times rand is used to purchase final products. Therefore when demand for money declines, velocity for money increases. Long term inflation takes place when quality and reliable price of electricity grows faster than the final production of goods and services, but in the short period inflation can result from different components of economy, but the most common example in Gauteng Province is the price of electricity, food and petrol. High interest rates cause investments and consumption to be very expensive for South African consumers and producers. Reserve bank has already reduced interest by 100 basis points, and the worry is that people will purchase/demand more of electricity and it will result in the increase of aggregate demand of electricity again. High interest rates and direct reduction in current purchases will decrease aggregate demand and reduction in aggregate demand according to economists take place when economy is at full employment, because it reduce output and result in recession and disturb long run equilibrium. Currently in Gauteng Province SA economy is not in full employment and SA is already having disequilibrium of demand and supply of electricity which is also having negative impact to the economy. There are main two reasons why inflation and monetary instability tend to retard economic progress:- a) Inflation disturbs information delivered by prices and changes the results of long term
contracts. Some prices will respond quickly to inflationary policies, prices for rental lease agreements, utility rates, mortgage interest rates will change more slowly- it is also evident in Gauteng Province and the rest of SA. The problem with inflation it always causes the price to change because is highly variable and unpredictable,

, 20147Arabian Journal of Business and Management Review (Nigerian Chapter) Vol. 2, No.
46
therefore many firms and companies loose potential production and end up making loses in Johannesburg Securities Exchange (JSE).
b) Investors & people will spend less time in producing goods and services when the price of electricity increase, and also spend more time trying to protect their wealth against inflation and global monetary instability. Rate of inflation may affect one’s wealth, for example: Inflation and global financial crisis has also affected Eskom, because made it very difficult for Eskom to receive money/funds from investors in order to finance the project of building new coal power stations.
Research by many economists has proven that many countries ever achieve their goal through inflation targeting, and there is no evidence that countries adopting inflation targeting attract more direct investment. Inflation targeting in our country is not helping us to achieve required growth, because there is no evidence that our inflation rate is lowering and we will manage to attract direct investment. Gauteng Province is trying to control inflation through up/and down of interest rates by our reserve Bank, but the other problem is that we are unable to control/stabilise our prices on the market. In their research, entitled inflation and growth, economists Michael Bruno and William Easterly (1988) explain that’ there is growing evidence that moderate rates of inflation of up to 20% or more have no predictable negative consequences on the real economy; it is not associated with slower growth, reduced investment, less foreign direct investment, or any other important real variable that one can find. Many Economists argue that there is a relationship between interest rates, prices and inflation. Because when the Reserve bank reduce or increase interest rates it also affect the prices, same with reduction/increase in price of electricity, but that does not mean that it got the direct control on inflation. Therefore when SARB lower the interest rates it does mean that SA inflation will lower as well.’ Raising interest rates causes slow growth and recession, leaves people vulnerable to unemployment and there is no empirical evidence which proves that it draws foreign investment to the country.’’(The times; published 14 June 2008). Presently in Gauteng Province the Reserve Bank have reduced interest rates by 100 points basis but still it does not mean that SA will be able reap faster economic growth during this period because many companies and consumers in Gauteng Province and rest of SA, are finding it hard to operate/survive because of the constant increase in electricity price/tariffs. Inflation is reported as percentage change in the overall price level between two periods as measured by price index.
Figure 2.2: changes in the rate of inflation Source: US Bureau of Labor Statistics

, 20147Arabian Journal of Business and Management Review (Nigerian Chapter) Vol. 2, No.
47
All Urban Consumers; All Items, Seasonally Adjusted 1982-1984=100; The chart above shows changes in the rate of inflation, not changes in actual prices. A downward-trending line above zero means that prices are still increasing, just at a lower rate. This is sometimes called disinflation but it is inflation nevertheless. When the rate falls below zero, as it did briefly in 1954, average prices actually are falling (deflation). While lower prices may seem ideal at first from a consumer's point of view, deflation leads to rising unemployment and falling production, a situation from which it is extremely difficult to recover. An inflation rate of 1 - 2.5% currently seems to be acceptable by many economists. The inflation rate is national average of all prices. The next chart shows the effects of sustained inflation accumulate over the years. It also contains the CPI index values for December of each year. An index value of 180 means that prices have increased 80% measured from a base of 100. They must insure that their income and the interest from their investments keep pace with long term inflation.
Figure 2.3:(SARB) measure inflation Source: US Bureau of Labor Statistics All Items, Seasonally Adjusted; 1982-1984=100; South African Reserve bank (SARB) measure inflation in the following ways:
The consumer price index (CPI) which measures inflation at the retail level. The producer’s price index (PPI) which measures inflation at the wholesale level and
therefore may also predict future retail prices. The Gross Domestic Product, the widest indicator which measures prices for all
finished goods produced domestically, including those for governmental purchase, capital investments and net exports.
Price inflation greatly control time value of money (TVM), and it also plays important role in interest rates which we use them every time we calculate time value of money. Our Reserve bank has reduced the number of independent monetary tools until they only managed to concentrate on short term interest changes. Increase in electricity tariffs in Gauteng Province and the rest of SA will temporarily disturb output and employment, but in the long run it will decrease again and inflation will increase. We must increase quality and reliable supply of electricity and try to increase production because price, inflation and money interest rates are interrelated (for example:- If inflation rates rise, money interest rates will also rise). My only worry is that decrease/increase in tariffs controls inflation, but it might backfire because now our economy is below long run capacity.

, 20147Arabian Journal of Business and Management Review (Nigerian Chapter) Vol. 2, No.
48
Many economists around the world agree general or principle that each and every country monetary policy should be more concerned about the price stability on their economy. Therefore the problem is how to achieve price stability within the same economy because some of the variables is difficult to control and it push our prices to be very high.ie: ‘’Eskom previously requested Electricity price increase of not less than 20% to NERSA but was granted only 8% tariff increase, because Eskom wanted to use the price increase to fund its major build programme of coal power stations to boost the supply of electricity, and this initiative will encourage that has reached peak currently.. However the idea of targeting inflation was adopted since 1990 for the first time in New Zealand, and then after New Zealand has implemented this strategy many developed and developing countries has followed New Zealand in adopting inflation strategy till today. In the year 2000 President Thabo Mbeki was the main drive to implement Inflation targeting in all SA provinces or the rest of SA, but surprisingly before President Mbeki announced this initiative SA Reserve Bank has already followed New Zealand and other United Kingdoms who adopted inflation targeting policy. SARB must control against issuing more money circulation in the market because when this happen consumers will need to purchase more goods and services than can be produced with our available resources in Gauteng Province. Because it will also result in prices increasing because there is more money circulating than goods available in the market. SA Reserve bank along with the SA Treasury department of need to control inflation since it can disturb economy.’’ Governments need to control high levels of unpredictable inflation since can severely disrupt the economy, cause uncertainty in financial decisions, and redistribute wealth unevenly. SA as well as many countries like United States has chosen to adopt monetary policy as their primary tool because it has proven the following:
It is very effective It is less disruptive to market operations. It is easier and quicker to implement. Adjusting to quality and reliable supply of electricity does not require legislative
approval. The responsibility of implementing monetary policy is carried mostly by SA Reserve Bank and must not bow down to the political pressure, for example: NERSA looks like it has bowed to political pressure before making decisions on granting Eskom 8% increase in electricity tariffs. SA Reserve bank need to be more effective in implementing monetary policy that will be beneficial to the whole of SA, it must concentrate on the responsibility of maintaining market with order and maintaining low, positive rate of inflation (most economists believe that positive inflation must not be more than 3 percent). The other thing to do is to keep quality and reliable supply of electricity at a level that will encourage/accommodate positive growth in goods and services; it must not be high to cause high inflation or to be very low that it causes deflation (an overall decrease in prices). It will increase unemployment and increase more reliance to the government Unemployment is the biggest concern not only in Gauteng Province, but to the rest of South Africa, and it is also becoming worse recently due to the global financial crisis. My believe is that the only solution to this problem is for each province in SA to teach their residence to learn to be self-reliant and get the relevant education that will enhance skills, like the Japanese and other developed countries. The more electricity prices increases it will discourage more new entrants to the market, and many producers of goods and services will increase the price of their goods and services in order to cover production costs, because the aim of the business is to make profit. No producer will continue operating while making loss. Therefore if the producer does not

, 20147Arabian Journal of Business and Management Review (Nigerian Chapter) Vol. 2, No.
49
increase the price of their goods and services they will shut down their operations or businesses and exit the market, and this will result in high unemployment rate. Increase in electricity high price also discourage the spirit of self-reliant or local economic development because many residents of SA who aspire to become entrepreneurs will be discouraged to start their new businesses, therefore SA economy will rely on foreign investors to come and start businesses. Mohau Pheko (2008) of the times mentioned that inflation targeting is not really working for SA economy because the savings does not increase but instead SA consumers keep on spending more’’ Inflation targeting is out-dated and old fashioned, his assertion is that interest rates hikes will dampen SA appetite for spending is fallacious’’(Source; www.the times.co.za: published June 14 2008 article by Mohau Pheko). Van Der Merwe (2004:9) mentioned that SA government needs to change monetary policy of inflation targeting and start focus on other things. ‘’ This does not imply that inflation-targeting by central banks should know or little attention to exchange rates developments, the exchange rate as well is an important transmission mechanism of monetary policy’’). Of course SA government must pay attention to other role players that play vital role in growing our economy, by doing this is then SA will be able to achieve the goal of full employment. (Source; Occasional paper no 19 July 2004; pp9 by E J Van Der Merwe). In order to solve unemployment problem SA must focus more on economic growth than only putting inflation targeting as major role player for SA economy. It will affect introduction and growth of Small and big businesses. It is not possible for all local products to be sold directly to the customer. Local shops, industries and companies have crucial role to play in creating and retaining employment. This will create economic self-reliance. If NERSA increase electricity tariffs it will destroy our businesses, especially small businesses because it will be too expensive to produce goods and services locally. The other people faced with high unemployment are people staying in rural areas. The more the Gauteng Provinces invest in local shops and products are the more local self-reliant will grow/increase. How economic self-reliance will improve if businesses are unable to cover their production costs. NERSA increase in electricity tariffs destroys economic self-reliance to the province of Gauteng and to the rest of South Africa (SA). Big chain stores do their buying centrally and will not be prepared to stock very different sets of supplies in each of their outlets. The most important aspect of locally owned shops is that a smaller proportion of the price the customer pays stays within the local community in order to develop that particular economy, sometimes local small shops, industries and companies close down because of higher electricity tariffs. Haulstock model has 2 vital feautures:- i) Communities wishing to retain local shops, industries and companies must invest
money on it, also guaranteeing that they will give their trade. ii) Other method is to pledge their working capital, such as reverse credit in which
customers or clients advance cash to cover their purchases for a month. Small businesses within our communities are also big role players in helping to create jobs in Gauteng Province. Money spent on big chain stores is lost or leakage to the community and does nothing to empower local community with other skills so that tomorrow they can be self-employed/reliant. Local owned shops and businesses create jobs and boost our economy. Gauteng Province must negotiate less tariff increase especially for local owned business in order to sustain jobs created locally. Gauteng province and the rest of SA must not always rely to foreign investors and companies to be the main role players in creating employment in Gauteng Province and the rest of SA.

, 20147Arabian Journal of Business and Management Review (Nigerian Chapter) Vol. 2, No.
50
Gauteng Province has got a long history of apartheid where many people are still unemployed due to lack of skills and education. But the question is that is SA fully utilising all factors of production (i.e: land, labour, production and capital). Figure 2.4
Year Unemployment rate Rank Percent Change Date of Information 2003 37.00 % 18 2001 est. 2004 31.00 % 24 -16.22 % 2003 est. 2005 26.20 % 161 -15.48 % 2004 est. 2006 26.60 % 168 1.53 % 2005 est. 2007 25.50 % 172 -4.14 % 2006 est. 2008 24.30 % 169 -4.71 % 2007 est.
Information accessed from; www.statssa.org on 15 October 2013 Figure 2.4 above mentioned unemployment in Gauteng Province has never fell below 20% since 2003. At the same time when many companies are retrenching or downsizing NERSA has approved the increase of electricity tariffs. Therefore can SA fix a historical problem of unemployment when NERSA and Eskom are busy creating another problem? NERSA was supposed to consider ceteris paribus rule when increasing electricity rates (for example: it means electricity tariffs will only be increased when only there is enough evidence that all other things (prices, inflation, unemployment, interest rates) will remain the same)). It will slow down direct foreign investment (FDI) into country International Monetary Fund (IMF) mentioned that policies that make an economy open to trade and investment with the rest of the world are needed for sustained economic growth. The evidence on this is clear. No country in recent decades has achieved economic success, in terms of substantial increases in living standards for its people, without being open to the rest of the world. In industrial countries, protection of manufacturing is generally low, but it remains high on many labour-intensive products produced by developing countries (Information accessed from. www.imf.org on 30 October 2013). It will increase inequality and poverty Figure 2.5 below give clear indication that 20% of the population of Gauteng province, and around half of the population in the rest of SA are defined as poor and living below the poverty line. Poverty is mainly rural- about two thirds of the country's poor people live in rural areas and more than two thirds of rural people are poor. In urban areas only 28% are poor. Around 56% of black people are estimated to be poor compared to around 36% of Coloured people, 15% percent of Indian people and 7% of white people. 60% of female headed households are poor. South Africa has a one of the highest rates of income inequality in the world. The richest 10% of the population gets almost half the income and the poorest 20% receive only 3, 3% of the income. There is also a huge income inequality between provinces where the average income per person in Gauteng is six times greater than the average income in Limpopo. There are extreme differences between races and provinces. White South Africans, are ranked 19th out of 173 on a global scale. Black South Africans are ranked 117th out of 173 on a global scale when it comes to income. South Africa as a whole is ranked 76th. Poverty is much worse in those provinces containing

, 20147Arabian Journal of Business and Management Review (Nigerian Chapter) Vol. 2, No.
51
the former homelands with Eastern Cape and Limpopo containing the greatest percentage of poor people. Figure 2.5. People living below the poverty line (Based on income only)
PROVINCE Percentage of population living below poverty line
Eastern Cape 68.3 Free State 59.9 Gauteng 20.0 KZN 50.5 Limpopo 60.7 Mpumalanga 54.8 Northern Cape 54.4
North West 56.5 Western Cape 28.8 National 48.4 (Data Source; UNDP 2002 and www.gov.za, retrieved on 30 October 2013) UNDP towards ten year review mentioned SA government has developed a set of indicators (measurements) to measure development and improvements to people's lives. These indicators go far beyond measuring income and looks at things like access to basic services, improvements in the quality of life and changes in areas like crime, transport, etc. Income inequality in South Africa among different race (Africans, Indians, coloureds and whites) is still a big concern. The SA new democratic government under the leadership of African National Congress (ANC) has tried its best to address/eradicate poverty, reduce inequality problem not only in income but to different sectors of life since 1994. Remember South Africa for all the past decades was ruled by the apartheid government which normally used to promote income inequality amongst different racial lines/population. Past policies of segregation and discrimination have left a legacy of inequality and poverty and, in more recent decades, low economic growth. The apartheid system was heavily biased towards providing health, education and housing services to the white minority, to the disadvantage of the black population who were denied the opportunity to accumulate human and physical capital. Labour market policies were aimed at protecting the position of white workers through active policies such as job reservation, while inferior education, influx control and the Group Areas Act ensured little competition from other race groups (Woolard 2002:7) Sometimes there is an agreement amongst social scientists that some degree of income inequality is needed, but this dilemma continue to be the difficult issue for governments in the world to tackle income differences. The South African Human Development Report (SAHDR) assesses progress made by the government of African National Congress (ANC) regarding social development and policy making. Report by the United Nations Development Program (UNDP) has realised/outlined the following:- UNDP (2000) mentioned that many South Africans are still facing the issue of poverty, inequality, access to basic services, environmental sustainability, unemployment and economic growth.
, 20147Arabian Journal of Business and Management Review (Nigerian Chapter) Vol. 2, No.
52
Unemployment and Growth: - Over the past 15 years it was found that between 5.2 million and 8.4 million black/Africans South Africans are unemployed, and are willing to do any job without comparing income differences amongst their white counterparts.
Education:-Since 1995 SA education standard has dropped as compared with international league tables. Therefore it was reported by former minister of education Naledi Pandor that most matriculates’ cannot read properly.
Health:- South Africa is facing a drop in the total number of health professionals which according to the UNDP report ‘’ In many hospitals and clinics around the whole country of South Africa, there are insufficient medical and support staff to handle the workload. There are simply not additional funds being allocated to the hiring of additional staff and the payment of more attractive salaries”. Sowetan newspaper (2009) reported that many doctors in South Africa have participated on the illegal strike regarding their wages saying they are not well paid as compared to other professions within the country of SA (information accessed from; www.sowetan.co.za published 21/04/2009).
Housing: Most of the South Africans it was reported that they cannot afford a decent housing due to income difference.
Poverty and inequality: - According to UNDP (2000) report it states that blacks constitute the poorest layer of the population, making up over 90 percent of the 21, 9 million poor people. It was further mentioned that 7 out of 9 provinces more than 50 percent of the population lives in poverty. The report continue to say that South Africa is also one of the countries with high unequal distribution of income in the world with approximately 60 percent of the population earning less than R42000 per annum (about US$700) while 2.2. percent of the population have income exceeding R360000 per annum (about US$50000). (Information accessed from. UNDP 2000 and www.gov.org on 15 October 2013).
According to UNDP (2000) mentioned that the level of inequality is confirmed by the Gini coefficient. A Gini coefficient of one indicates perfect income inequality, while a Gini coefficient of 0 indicates perfect equality. The report notes that in 1995 the Gini coefficient for South Africa was 0.596, rising to 0.635 in 2002. The report goes on to note: “In view of this rising income inequality, only six percent of all people who reached retirement age of 65 in 2000 can be regarded as financially independent. About 47 percent of people retiring are dependent on their families, 31 percent have to continue working and 16 percent rely solely on a pension from government There seems to be a scarcity of statistical information regarding the impact of Black Economic Empowerment (BEE) on inequality in South Africa and this is reflected in the UNDP report. However, with the information available, it is possible to draw certain conclusions. Only a tiny minority of blacks have benefited from BEE. Ernst and Young Management Services (2003) reported that in 2003 R42.2 billion ($US620 million) worth of BEE deals were made. But the beneficiaries of these deals belonged largely to the politically well-connected elite. The opposition party Democratic Alliance noted that 60 percent (R25.3 billion) of these deals “accrued to the companies of two men [both close to the ANC leadership]: Patrick Motsepe and Tokyo Sexwale”. According to Servaas van der Berg & Megan Louw from University of Stellenbosch (2003), on their Paper presented to the Conference of the Economic Society of South Africa, at Stellenbosch, 17-19 September 2003, they have presented the following figures regarding income inequality in S.A:- Figure 2.6

, 20147Arabian Journal of Business and Management Review (Nigerian Chapter) Vol. 2, No.
53
Blacks Coloureds Indians Whites 1970 - 0.53 0.42 0.43 1975 0.49 - - - 1993 0.56 0.47 0.50 0.47 1995 0.57 0.52 0.49 0.47 1996 0.68 0.57 0.53 0.52 2000 0.59 0.55 0.51 0.49 But according to UNDP and SAIR shows that income inequality amongst difference populations in S.A were as follows in 2001 as mentioned below:- Figure 2.7 Blacks Coloured Indians Whites National 1975 0.47 0.51 0.45 0.36 0.68 1991 0.62 0.52 0.45 0.46 0.68 1996 0.66 0.56 0.52 0.50 0.69 2001 0.66 0.60 0.56 0.51 0.73 The two figures contradict each other, for example: in 2000 Van Der Berg & Louw shows that Gini Coefficients for South Africa amongst blacks were 0.59 while UNDP shows that it was 0.66 in 2001. Therefore it does not explain the true reflection of income differences in South African economy. In their study Berg et al (2006:19) found out that in racial per capita income performance, the per capita incomes of Whites have been growing rapidly since the mid-1990s as a result of this group maintaining a constant share of remuneration income, increasing their share of property income, and experiencing negative population growth. During the same period, Black per capita income growth has been steady but not rapid since the political transition. Inequality within race groups is also substantial; African households, for example, have a Gini coefficient of 0.54, nearly as high as the national figure (May 1998). Landmark (2003:7) even argued that the main driver of inequality currently in SA is no longer the Black/White divide, but rather the intra-group divide between rich Blacks and poor Blacks. The national Gini figure is 0.6. However, amongst Black households it moved decisively up from 0.49 in 1970 to 0.59 in 2000. This was supported by Everatt (2005: 79) who asserted that inequality has been ‘changing from being race to class based’ as a rich black elite has emerged and whites have become proportionately less wealthy. In simple terms, only a small proportion of black South Africans is benefiting significantly from the post-apartheid economic dispensation Poverty and lack of education limits employment opportunities for young people and the rest of citizens in the whole country. South Africa with high unemployment rate, many young people have no hope of finding work in the formal sector. Urban youth are also very vulnerable to getting involved in crime, gangs and drug or alcohol abuse. These youth are often called "youth at risk" and government targets them for public works and other employment and training programmes. Factors influencing/affecting demand of electricity Demand forecasting Demand forecasting timescales

, 20147Arabian Journal of Business and Management Review (Nigerian Chapter) Vol. 2, No.
54
Due to the long lead times associated with building new generation plant (and, to a lesser extent, with transmission system augmentation), the ability to forecast the demand for power over the short, medium and longer term, is crucial to meeting security of supply requirements economically and effectively. A demand forecast that understates the future demand growth is likely to lead to a shortfall in capacity required built to meet the demand, whereas an over-stated demand forecast is likely to lead to a surplus, with consequent cost implications for customers. It is not only the overall level of demand growth that needs to be predicted accurately but it is also important to identify the geographic and demographic trends in demand growth, since these will impact on the economics of generation plant expansion and the requirements for transmission and distribution system expansion. Demand Level and Shape Much of the focus of demand forecasting is on the annual level of peak demand on the integrated system (i.e. the highest simultaneous aggregate kW demand level in any given period, usually a year). However, whilst the level of peak demand is the most critical for establishing the capacity requirements to meet the peak, it is necessary to consider also the demand for power at other times of the year, on a seasonal and daily basis. Thus it is important to be able to predict accurately the shape of demand over the year, in addition to the peak level. Forecasting the overall annual level of consumption (kWh) is an important and generally, a prior, step to forecasting demand but this in itself will not provide a forecast of the demand shape throughout the year. Assuming that the existing load shape will prevail and concentrating entirely on peak demand and annual consumption levels is likely to lead to sub-optimal choices of generation plant and may cause supply security to be at risk in certain periods of the year outside the annual peak. For example, if the demand level is less “peaky” than forecast, with long periods of demand close to peak levels, there may be a need for greater use of peaking plant, perhaps over and above its design parameters. On the other hand, if out-turn demand is more “peaky” than forecast, this may lead to the need for more base-load plant to operate increasingly in load-following mode, which may be inefficient. Demand Forecasting Purposes Demand forecasts are used for two different purposes. Medium to long term demand forecasts are used to develop an economic expansion plan for future new build and plant retirement scheduling. Short term demand forecasts are used to operate the existing system in the most economic and effective manner, taking into account short-term positions on plant availability, the fuel situation and transmission constraints. Whilst there is no firm demarcation, short-term forecasts usually relate to hourly, daily, weekly and within year timescales, whereas medium to long term demand forecasts are usually for periods of a year ahead and beyond. This study focuses on the medium to long term demand forecasting, since this is used for system expansion planning purposes and is most relevant to the determination of a reserve margin. Demand Forecast Accuracy It is good practice to check the accuracy of demand forecasts periodically. In doing so, it is necessary to ensure that appropriate comparisons are carried out. For example, if the focus is on a short-term demand forecast, say day-ahead or week-ahead forecasts for plant scheduling purposes, the appropriate comparison is between the forecast and actual demands over these timescales. On the other hand, to check the accuracy of long-term demand forecasts used for system expansion planning, it is appropriate to compare forecast and actual annual demands over a long-term timescale. For example, a typical comparison would be between forecasts made 5-10 years ago with the actual demand level for each year. Comparing year-ahead demand forecasts with actual demands is not adequate for this purpose. No forecast can ever

, 20147Arabian Journal of Business and Management Review (Nigerian Chapter) Vol. 2, No.
55
be entirely accurate and any forecast will have an associated margin of error, which can be determined statistically, on the basis of uncertainties in the input parameters. A good demand forecast should meet all of the following conditions:
The actual demand should fall within the margins of error of the forecasts; The difference between the forecast level of demand and the actual level should be
capable of explanation, by reference to differences between the forecast assumptions and actual out-turn conditions (e.g. weather and economic effects).
There should be no inherent bias in the forecast, so that, the average deviation between forecast and actual level of demand should be close to zero, with some years being positive and others being negative.
The forecast should be capable of adapting to actual demands, so that, as each new actual demand is recorded, the demand forecast is adjusted to take account, if necessary, of the most recent actual demands.
Approaches to Demand Forecasting Two different approaches are commonly employed for electricity demand forecasting:
A “Bottom-up” approach, utilising detailed data of separate demand sectors and individual large loads, together with expectations of how each sector and large load will change over time, in relation to individual sector drivers such as population and habitation trends, manufacturing production levels, electrical appliance ownership, energy efficiency, and sector price elasticity; and
A “Top-down” approach, which depends strongly on the correlation between electricity demand and economic drivers, particularly GDP and others such as population growth.
Price Elasticity and Energy Substitution It is theoretically possible to measure the effect of price elasticity for certain major sectors and apply this as one of the drivers for sector demand. However, this approach is difficult, as price elasticity varies hugely between sectors and within sectors. Fortunately, the impact of price elasticity is only significant for certain energy intensive industries and for certain types of consumption where there exists the possibility of substitution (for example, the use of gas for water or space heating). Applying price elasticity effects requires assumptions to be made about future price movements (in real terms), which, in part is affected by the demand growth and cost of meeting that growth through expansion plans. It is therefore important to be careful about where in the demand forecasting process such effects are applied. Energy Efficiency and Demand-side Management Consumption levels and demand shape can be affected significantly by changes in the efficiency of energy conversion at the point of use (energy efficiency) and the particular application of other demand-side measures designed to influence the level and shape of demand. In forecasting electricity demand, it is most important to avoid double counting in this respect. Generally, changes in energy efficiency are best built into a sector forecast, in conjunction with other drivers such as new technologies and customer consumption patterns. Otherwise, it becomes unclear as to how energy efficiency changes will impact on sector demand. Similarly, some demand-side measure based on incentive pricing to change demand patterns may already have been taken into account via a price elasticity input. Where energy efficiency and demand-side measures are identified as separate adjustments to demand or as alternatives to generation capacity, great care is required to avoid such double counting and also to ensure that the levels of demand reduction are realistic in terms of what can be achieved in practice. Environmental Issues Demand may be influenced significantly by changes in legislation, public attitudes or corporate policies regarding the impact of electricity consumption on the environment. Where

, 20147Arabian Journal of Business and Management Review (Nigerian Chapter) Vol. 2, No.
56
certain changes are known to be planned to take place, it is prudent to make allowance for the relevant changes in the demand forecasts but with appropriate sensitivity tests to identify the impact. Where changes are under consideration, the effects on electricity consumption may be included as part of the sensitivity tests. Weather Effects In addition to the drivers described above, weather is known to have a significant effect on electricity demand, particularly in markets such as South Africa where electricity is used for heating and air-conditioning. Demand forecasts are usually prepared on the basis of “normal weather”, meaning that the demand forecast figures relate to average long-term temperatures occurring at relevant times of the year. In order to relate historic data to the input drivers, it is necessary to apply a correction to actual demand data to change the actual demand levels (up or down) to what would have been expected had “normal weather” conditions applied. This requires a detailed model of the impact of weather on demand and one that is capable of reacting to changes in the impact, as customer consumption patterns and responses to weather effects vary over time. Eskom does not carry out weather correction for actual demand levels. Instead, weather sensitivity is provided within the overall sensitivity ranges around the central demand forecasts. However, Eskom believes that cold weather can add between 700MW and 1000MW to the peak demand. At that level, the impact of weather is significant and equivalent to a year’s demand growth. It is not sufficient, therefore, to rely on what are essentially guesstimates of the weather impact for planning purposes. In addition to a demand forecast on the basis of “normal weather”, it is usual to develop scenarios or sensitivity tests with variations such as cold or mild weather. However, whilst fairly extreme variations can be expected in weather from year to year, it is unlikely that abnormally cold or mild conditions would apply throughout a long-term demand forecast timescale. The exception to consider is that of longer-term climate change, now widely accepted throughout the world as a real factor on long-term weather influences. Thus, apart from climate change effects, demand forecasts based on “cold” or “mild” weather provide an envelope of possible demand levels for the period considered, rather than possible demand levels in each and every year. Other Short-term External Influences on Demand In addition to the effects of weather, other short-term influences on demand include the impact of commodity prices, particularly in the mining and manufacturing sectors in South Africa, where a significant part of the electricity demand is influenced by the world commodity price for products such as Ferro-chrome and aluminium. In monitoring the actual demand against forecasts, it is important to identify where such influences have occurred and the extent of the impact on demand, in terms of level and duration. Eskom’s electricity Demand Forecasting for 2013 until March 2014 This review of Eskom’s demand forecasting is based on Eskom summer and winter demand forecasting plus additional information obtained from Eskom IDM during the course of discussions and specific requests to Eskom for additional data. No attempt is made in this study to reconstruct the forecasts from the input data and this review is based primarily report and other documentation provided by Eskom for the specific purposes of this study. Access to Eskom’s demand forecast model has not been requested, as the time available for this study would not permit a detailed review of the demand forecasting process. Thus, it is assumed that the data used and processes carried out by Eskom to derive the demand forecasts are accurate and appropriate to the software employed. To those not in the energy industry, this supply chain is called Integrated Demand Management (IDM). It is a comprehensive process in which the planning, implementation and monitoring of the
, 20147Arabian Journal of Business and Management Review (Nigerian Chapter) Vol. 2, No.
57
consumer's electricity use- and the modifying of this use- is considered against the levels of electricity available in the power grid which supplies the nation of SA. The benefits of Integrated Demand Management are crucial to promoting energy efficiency in South Africa, as it:
Help to reduce the demand/constraints on the electricity network or national grid. Help to delay the need for additional power stations to be built to meet demand for
power. Help to keeps electricity costs down. Help to create opportunities for the introduction of the creation and funding of
incentives for projects and products. Eskom want replacement of inefficient lighting (with light-emitting diodes [LEDs] and compact fluorescent lamps [CFLs energy and water saving showerheads, flow restrictors, geyser timers, geyser blankets and load-control devices in households. But there is no legislation that bans the sale of LED and CFLs to the consumers on the market of SA, Eskom so far has already introduced numerous projects in order to assist in reducing the demand for electricity, and they are as follows:
Shower heads: The aim is to encourage consumers to replace their shower heads with energy efficient shower heads in order to save the water and energy. Eskom promotes the benefits of energy efficient shower heads that it use less water and electricity.
Heat pumps: The aim of the programme is to encourage the consumers that a best way to heat water efficiently while using electricity is through heat pumps. Where a geyser uses three units of electrical energy to produce three units of heat energy, a Heat Pump converts just one unit of electrical energy into three units of heat energy. The current heat pump programme only caters for the industrial and commercial sectors utilising the NERSA budget allowance and ESCO model process. The purpose of the residential heat pump rebate programme is to provide financial assistance to the residential market through a rebate, enabling individual customers to purchase energy efficient heat pumps at a rebated cost.
Geyser blankets: The aim of the programme is to reduce energy standing losses from domestic hot-water cylinders. The geyser blanket is wrapped around the geyser to ensure the hot water inside the geyser does not become too cold very soon.
Solar water heating: Currently the programme in SA is managed by Eskom and sponsored by Department of energy (DoE), because SA government has set a target for renewable energy to contribute 10 000 giga-watt hours (GWh) of final energy consumption by 2013. Solar water heating could contribute up to 23% towards this target. Solar power is one of the most effective renewable energy sources available. By implementing it in water heating, Eskom is targeting one of the most power-intensive household activities for maximum power saving effect. To actively encourage and promote the widespread implementation of solar water heating, Eskom has rolled out a large-scale solar water heating programme. This programme assist consumers when buying an SABS tested solar water heater to replace their conventional geysers. In addition to the rebate that the consumer will receive upon installation of solar water heating, many insurance companies are now allowing consumers to put their claim value towards a solar system or are offering solar water heaters as replacement in the event of a burst geyser.
Information retrieved from; www.eskom.co.za/idm on 30 October 2013

, 20147Arabian Journal of Business and Management Review (Nigerian Chapter) Vol. 2, No.
58
Figure 2.8 Figure 2.8 above shows the average week summer profile. In summer Eskom can supply up to 31,000 MW, because during summer Eskom do more of the maintenance of its power stations. Therefore between 2 and 3 MW shortage of supply must be catered by IDM to ensure there is no further load shedding’s. The problem in summer is that demand for electricity is flat for almost the whole day, and it makes it difficult for Eskom to meet electricity demand.
Figure 2.9 Data Source; www.eskom.co.za Figure 9 above indicate average winter profile where demand exceeds 35,000 MW due to cold weather. During winter Eskom does not do any maintenance work for its power stations,

, 20147Arabian Journal of Business and Management Review (Nigerian Chapter) Vol. 2, No.
59
but when demand exceeds 35,000 MW Eskom has to make sure it pleads with consumers to reduce their usage of electricity. The usage of electricity in winter is predictable because more consumption takes place during peak times (in the morning and afternoon). The figure above is total consumption of all the industries using electricity in SA. Programs targeting residential and small commercial customers are unlikely to result in the use of backup generators, though such programs also have smaller peak demand impacts than programs targeting the large commercial and industrial market. Some program administrators have addressed this issue by including requirements for the types of load reductions that are eligible for demand response incentives. For example, New York Independent System Operator’s Day Ahead Demand Response Program prohibits the use of backup generation. As economic programs are more likely to encourage load flexing, demand bidding initiatives could be a more appropriate candidate for inclusion in a HEDD strategy than emergency demand response programs (US Environmental protection agency, clean energy options for addressing high electric demand, 2008:3-35). Information accessed from www.eskom.co.za/idm on 15 October 2013 Figure 2.10 Forecasted electricity Shortfall for September 2013
Information retrieved from www.eskom/idm.co.za on 15 October 2013 Figure 2.10 shows in colour green forecasted shortfall in the month of September, and up to which level do we require OCGT (running diesel generators to add to power generated by power stations). In September Eskom could offer up to 30,000 MW, therefore it needs further 3,700 MW in order to meet the forecasted demand of 33,500 MW. Figure 2.11. Forecasted electricity Shortfall for October 2013
0
500
1000
1500
2000
2500
3000
3500
4000
18000
20000
22000
24000
26000
28000
30000
32000
34000
36000
1:00
3:00
5:00
7:00
9:00
11:0
0
13:0
0
15:0
0
17:0
0
19:0
0
21:0
0
23:0
0
Calculated Shortfall At EP OCGT MW Required

, 20147Arabian Journal of Business and Management Review (Nigerian Chapter) Vol. 2, No.
60
Information retrieved from www.eskom.co.za on 15 October 2013 Figure 2.11 above shows that Eskom forecasted demand for electricity will not exceed 32,000 MW in the month of October 2013. Therefore Eskom further need 2,100 MW to meet the shortfall of energy demand in October. Eskom can offer up to 29,000 MW as indicated by the graph above. Figure 2.12. Forecasted electricity Shortfall for November 2013
Information retrieved from www.eskom.co.za on 15 October 2013
0
500
1000
1500
2000
2500
3000
3500
4000
18000
20000
22000
24000
26000
28000
30000
32000
34000
1:00
3:00
5:00
7:00
9:00
11:0
0
13:0
0
15:0
0
17:0
0
19:0
0
21:0
0
23:0
0
Calculated Shortfall At EP OCGT MW Required
0
500
1000
1500
2000
2500
3000
3500
4000
18000
20000
22000
24000
26000
28000
30000
32000
34000
1:00
3:00
5:00
7:00
9:00
11:0
0
13:0
0
15:0
0
17:0
0
19:0
0
21:0
0
23:0
0Calculated Shortfall At EP OCGT MW Required

, 20147Arabian Journal of Business and Management Review (Nigerian Chapter) Vol. 2, No.
61
Figure 2.12 above shows that Eskom forecasted demand will not exceed 32,000 MW in the month of November 2013. Therefore Eskom further needs 3,500 MW to meet the shortfall of energy demand in November. Eskom can offer up to 28,500 MW as indicated by the graph above. Figure 2.13. Forecasted electricity Shortfall for December 2013
Figure 2.14. Forecasted electricity Shortfall for January 2014
Figure 2.15. Forecasted electricity Shortfall for February 2014
0
500
1000
1500
2000
2500
3000
3500
4000
18000
20000
22000
24000
26000
28000
30000
32000
34000
1:00
3:00
5:00
7:00
9:00
11:0
0
13:0
0
15:0
0
17:0
0
19:0
0
21:0
0
23:0
0
Calculated Shortfall At EP OCGT MW Required
0
500
1000
1500
2000
2500
3000
3500
4000
18000
20000
22000
24000
26000
28000
30000
32000
1:00
3:00
5:00
7:00
9:00
11:0
0
13:0
0
15:0
0
17:0
0
19:0
0
21:0
0
23:0
0
Calculated Shortfall At EP OCGT MW Required
, 20147Arabian Journal of Business and Management Review (Nigerian Chapter) Vol. 2, No.
62
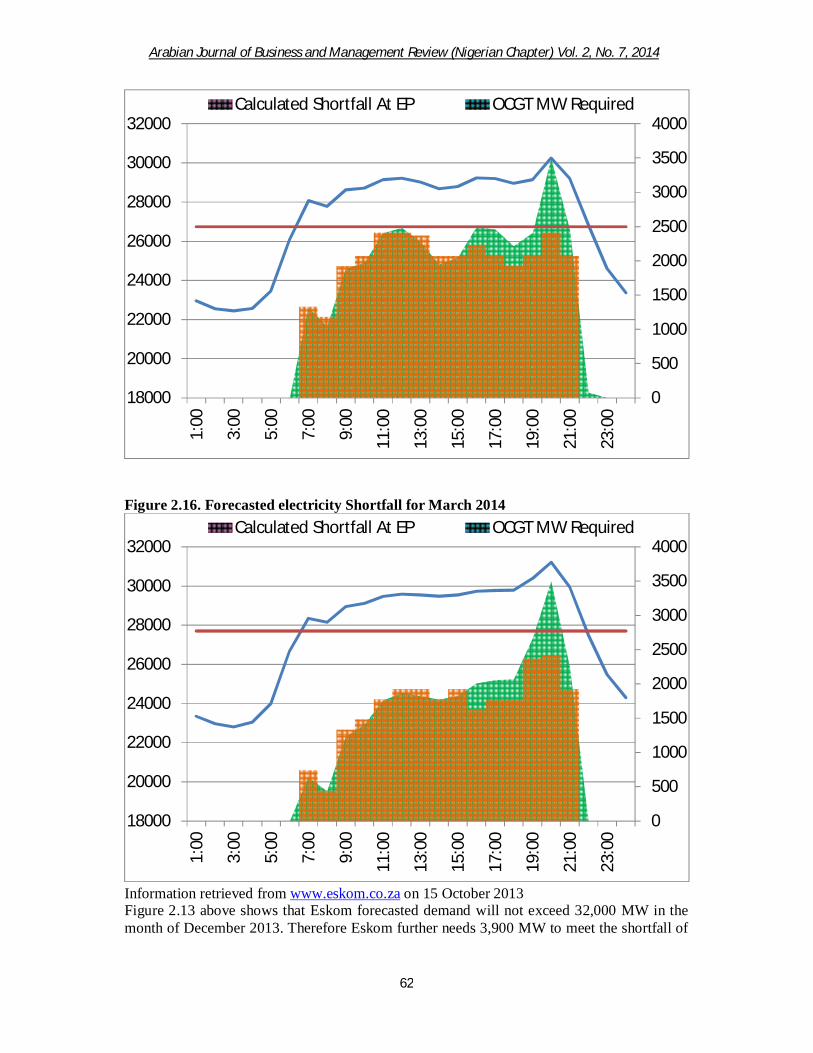
Figure 2.16. Forecasted electricity Shortfall for March 2014
Information retrieved from www.eskom.co.za on 15 October 2013 Figure 2.13 above shows that Eskom forecasted demand will not exceed 32,000 MW in the month of December 2013. Therefore Eskom further needs 3,900 MW to meet the shortfall of
0
500
1000
1500
2000
2500
3000
3500
4000
18000
20000
22000
24000
26000
28000
30000
32000
1:00
3:00
5:00
7:00
9:00
11:0
0
13:0
0
15:0
0
17:0
0
19:0
0
21:0
0
23:0
0
Calculated Shortfall At EP OCGT MW Required
0
500
1000
1500
2000
2500
3000
3500
4000
18000
20000
22000
24000
26000
28000
30000
32000
1:00
3:00
5:00
7:00
9:00
11:0
0
13:0
0
15:0
0
17:0
0
19:0
0
21:0
0
23:0
0
Calculated Shortfall At EP OCGT MW Required

, 20147Arabian Journal of Business and Management Review (Nigerian Chapter) Vol. 2, No.
63
energy demand in December. Eskom can offer up to 28,000 MW as indicated by the graph above. Figure 2.14 above shows that Eskom forecasted demand will not exceed 30,000 MW in the month of January 2014. Therefore Eskom further needs 2,200 MW to meet the shortfall of energy demand in January 2014. Eskom can offer less than 28,000 MW as indicated by the graph above. The reason for the lowest demand of 30,000 MW is that most of the factories and companies are still closed for holidays and some will start operation at the end of January 2014. Figure 2.15 and 2.16 above shows that Eskom forecasted demand will not exceed 30,000 MW in the month of February and March 2014. Therefore Eskom further needs between 2,500 MW and 3500 MW to meet the shortfall of energy demand in February and March 2014. Eskom will offer less than 28,000 MW as indicated by the graph above. The reason for the lowest demand of 30,000 MW is that most of the factories and companies are still finalising their year-end production and financial year end of most companies takes place in March. Most companies do more of stock-taking, planning, evaluation of results and previous strategy and trying to implement their plans for the New Year which kicks start in April 2014.
a) Residential building sector findings regarding energy consumption (Sioshansi (2013:212) mentioned that electricity consumption appliances have become saturated in urban areas. Electricity use of appliances will continue to grow fast. The urban consumption of electricity in the residential sector will increase per household due to use of reduction in rural population (migration from rural areas to urban areas), use of lighting and appliances. He further mentioned that residential primary energy demand will grow quickly until 2025 or 2030. The important opportunity for reducing energy, electricity consumption in households lies in three key areas, namely;
Improvement of equipment efficiency through implementation of stringent standards Labeling programs and tightening of thermal shell of residential buildings Accelerated adoption d implementation of more aggressive efficiency policies such as
strengthened appliance efficiency standards and expansion of SA energy to reach international best practices.
b) Commercial buildings sector findings regarding energy consumption According to Sioshansi (2013:214) energy demand in the commercial buildings sector is currently growing very fast all over the world in the short run and utilities must make very quick notice of commercial buildings development, however growth will slow in the medium term, reaching a plateau by about 2030 due to declining growth in total commercial sector employees and commercial floor space approaching saturation. Total commercial building floor space may saturate in the short term, but end use intensity has much room to grow before reaching current levels in industrialised countries. Lighting, office equipment and other electrical plugs loads in commercial buildings is growing dramatically in SA before is the second largest consumers of electricity after industrial sector as shown in figure 2.8 to figure 2.16. Sioshansi (2013:214) further explained that the dynamic of energy consumption in commercial buildings is that energy growth will be largely dominated by intensity increases, rather than overall increases in commercial floor area. The number of workers available to commercial sector will limit increases in commercial building space in future in SA although the economic activity in commercial sector will continue to gain in significance physical infrastructure that will enable it to grow at a much slower rate than value added GDP. For example; space cooling and equipment energy intensity is only a fraction of current Japanese level.
, 20147Arabian Journal of Business and Management Review (Nigerian Chapter) Vol. 2, No.
64
With rising commercial end use energy intensity expected, building efficiency policies such as tighter building design codes, building efficiency and green labelling programs, equipment efficiency standards, and phase out o inefficient lighting is also one of the most important aspects of controlling energy demand growth. Most of the electricity demand in commercial buildings will be driven by lighting and electric equipment (for example; plug loads) usage and cooling to a smaller extent. Sioshansi (2013:215), further explained that electricity consumption by 2050 will be heavily dominated by lighting and equipment usage with much smaller shares of consumption by cooling, space heating, and water heating. Efficiency improvements in lighting and equipment will have greatest electricity saving potential by 2050 followed by cooling efficiency improvements.
c) Industrial sector findings regarding energy consumption Industrial sector is one of the largest consumption of electricity in Gauteng province. Industrial sector consist of refining, coal mining, iron, steel, aluminium, extraction, oil and gas exploration, paper industry, construction, cement industry and fossil fuel extraction. Cement, iron, steel aluminium are closely linked to construction. Because SA is a developing country with so many increasing property developments taking place, therefore this industry has a major impact in increasing the demand of electricity. Gauteng province has many steel, aluminium and iron companies operating within the province. Iron, steel and aluminium in Gauteng province are the two largest in terms of electricity consumption, followed by manufacturing, chemicals and light industry consumes the most electricity in absolute terms.
d) Transport sector findings regarding energy consumption Gauteng province has a very good transport system, and Passenger Rail of South Africa (PRASA) has recently announced that it has signed a multi- billion tender for the manufacturing of improved passenger trains. Sioshansi (2013:219) mentioned that the greatest growth for energy demand in the transport industry will be from passenger rail and road transportation, with urban car ownership expected to increase. Electrification of rail and vehicles will also increase demand of electricity in Gauteng province. SA government must learn from China because it promoted transport electrification setting specific targets for more efficient electric rail and vehicles. In addition subsidy programmes have been launched to accelerate the market entry of electric vehicles (or example: reducing heavy reliance on oil). Increase in electricity prices influence changes in commodity/goods and services prices, and also in demand and supply of goods. The Law of Demand The law of demand states that, if all other factors remain equal, the higher the price of a good, the less people will demand that good. In other words, the higher the price, the lower the quantity demanded. The amount of a good that buyers purchase at a higher price is less because as the price of a good goes up, so does the opportunity cost of buying that good. As a result, people will naturally avoid buying a product that will force them to forgo the consumption of something else they value more. The chart below shows that the curve is a downward slope.

, 20147Arabian Journal of Business and Management Review (Nigerian Chapter) Vol. 2, No.
65
Figure 2.17
A, B and C are points on the demand curve. Each point on the curve reflects a direct correlation between quantity demanded (Q) and price (P). So, at point A, the quantity demanded will be Q1 and the price will be P1, and so on. The demand relationship curve illustrates the negative relationship between price and quantity demanded. The higher the price of a good the lower the quantity demanded (A), and the lower the price, the more the good will be in demand (C). In this scenario there will be electricity prices that is determined by the consumer behaviour and Consumer Income. Consumer who rely only in electricity for usage they will continue using electricity even if the price of the electricity increase by 8% annually .Whereas those who earn more will continue consuming more electricity irrespective of increase in price of the electricity because their income match the product. Price is not a determining factor here. On this instance there is a negative relationship between price and quantity demanded. However if the income drop when the electricity price increase the consumer will change his/her behaviour of buying particular products or service the demand curve will shift to the left. The Law of Supply Like the law of demand, the law of supply demonstrates the quantities that will be sold at a certain price. But unlike the law of demand, the supply relationship shows an upward slope. This means that the higher the price, the higher the quantity supplied. Producers supply more at a higher price because selling a higher quantity at higher price increases revenue.

, 20147Arabian Journal of Business and Management Review (Nigerian Chapter) Vol. 2, No.
66
Figure 1.18
A, B and C are points on the supply curve. Each point on the curve reflects a direct correlation between quantities supplied (Q) and price (P). At point B, the quantity supplied will be Q2 and the price will be P2, and so on. Producers who supply products/services such as steel, gold and platinum, when the price of electricity increase the supplier will supply less quantity because their products are more reliant on electricity prices, which also means their revenue will decrease, or otherwise in order to receive higher revenue these suppliers must increase the price of their goods. Time and Supply Unlike the demand relationship, however, the supply relationship is a factor of time. Time is important to supply because suppliers must, but cannot always, react quickly to a change in demand or price. So it is important to try and determine whether a price change that is caused by demand will be temporary or permanent. The increase in the price of electricity s permanent and will have impact on the long run on the prices of steel, gold and platinum. As per Appendix A the increase in Tax will mean that the price of steel, gold and platinum will increase because this will have an Impact on the long run. Supply and Demand Relationship It is important to know the laws of supply and demand, for the purpose of this study the focus will be to show how supply and demand affect price. For example if electricity price increase by 80c if per Megawatt (MW) Eskom is charging R1.00 the new price will be R1, 80c per MW.. Consequently, the rise in price should prompt Eskom to sell/supply more electricity to the end users as the supply relationship shows that the higher the price, the higher the quantity supplied. Equilibrium When supply and demand are equal (i.e. when the supply function and demand function intersect) the economy is said to be at equilibrium. At this point, the allocation of goods is at its most efficient because the amount of goods being supplied is exactly the same as the amount of goods being demanded. Thus, everyone (individuals, firms, or countries) is

, 20147Arabian Journal of Business and Management Review (Nigerian Chapter) Vol. 2, No.
67
satisfied with the current economic condition. At the given price, suppliers are selling all the goods that they have produced and consumers are getting all the goods that they are demanding.
Figure 2.19
Shifts A shift in a demand or supply curve occurs when a good's quantity demanded or supplied changes even though price remains the same. For instance, if the price for a bottle of electricity price was $2 and the quantity of electricity price demanded increased from Q1 to Q2, then there would be a shift in the demand for electricity price. Shifts in the demand curve imply that the original demand relationship has changed, meaning that quantity demand is affected by a factor other than price. A shift in the demand relationship would occur if, for instance, electricity price suddenly became the only type of alcohol available for consumption.
Figure 2.20 Conversely, if the price for a can of beer was R9,00 because it is dependent on the price of electricity (for example: refrigerators in order to cool the beers it is dependent on reliable supply of electricity, if the price of electricity increase, price of beer will increase), and the quantity supplied decreased from Q1 to Q2, then there would be a shift in the supply beer. Like a shift in the demand curve, a shift in the supply curve implies that the original supply curve has changed, meaning that the quantity supplied is affected by a factor other than price.

, 20147Arabian Journal of Business and Management Review (Nigerian Chapter) Vol. 2, No.
68
A shift in the supply curve would occur if, for instance, a natural disaster caused a mass shortage of shops; electricity price manufacturers would be forced to supply less electricity price for the same price.
Figure 2.21 The degree to which a demand or supply curve reacts to a change in price is the curve's elasticity. Elasticity varies among products because some products may be more essential to the consumer. Products that are necessities (for example: electricity is a necessity) are more insensitive to price changes because consumers would continue buying these products despite price increases. Conversely, a price increase of a good or service that is considered less of a necessity will deter more consumers because the opportunity cost of buying the product will become too high. A good or service is considered to be highly elastic if a slight change in price leads to a sharp change in the quantity demanded or supplied. Usually these kinds of products are readily available in the market and a person may not necessarily need them in his or her daily life. On the other hand, an inelastic good or service is one in which changes in price witness only modest changes in the quantity demanded or supplied, if any at all. These goods tend to be things that are more of a necessity to the consumer in his or her daily life. To determine the elasticity of the supply or demand curves, the below simple equation has been used:
Elasticity = (% change in quantity / % change in price) If elasticity is greater than or equal to one, the curve is considered to be elastic. If it is less than one, the curve is said to be inelastic. As we mentioned previously, the demand curve is a negative slope, and if there is a large decrease in the quantity demanded with a small increase in price, the demand curve looks flatter, or more horizontal. This flatter curve means that the good or service in question is elastic.

, 20147Arabian Journal of Business and Management Review (Nigerian Chapter) Vol. 2, No.
69
Figure 2.22
Meanwhile, inelastic demand is represented with a much more upright curve as quantity changes little with a large movement in price.
Figure 2.23
Elasticity of supply works similarly. If a change in price results in a big change in the amount supplied, the supply curve appears flatter and is considered elastic. Elasticity in this case would be greater than or equal to one.

, 20147Arabian Journal of Business and Management Review (Nigerian Chapter) Vol. 2, No.
70
Figure 2.24 On the other hand, if a big change in price only results in a minor change in the quantity supplied, the supply curve is steeper and its elasticity would be less than one.
Figure 2.25
Factors Affecting Demand Elasticity There are three main factors that influence a demand's price elasticity:
The availability of substitutes - This is probably the most important factor influencing the elasticity of a good or service. In general, the more substitutes, the more elastic the demand will be. For example, if the price of a gas went up by 10%, consumers will buy less of gas .This means that gas demand is an elastic because a raise in price will cause a large decrease in demand as consumers start buying less of gas .Thus, while a product within an industry is elastic due to the availability of substitutes, the industry itself tends to be inelastic. Usually, unique services such as electricity and petrol are inelastic because they have few if any substitutes.
Amount of income available to spend on the good - This factor affecting demand elasticity refers to the total a person can spend on a particular good or service. Thus, if the price of a can of electricity price goes up from R9.50 to R12,00 and income stays the same, the income that is available to spend on electricity price , which is R12,00 is now enough for only two kilowatt (KW) than four KW’s of electricity. In other words, the consumer is forced to reduce his or her demand of electricity. Thus if there is an increase in price and no change in the amount of income available to spend on the good, there will be an elastic reaction in demand; demand will be sensitive to a change in price if there is no change in income.
Time - The third influential factor is time. If the price of electricity goes up R10, 00 per KW’s, a consumer with very few available substitutes will most likely continue buying electricity. This means that electricity is inelastic because the change in price will not have a significant influence on the quantity demanded of electricity. However, if the consumer finds that he cannot afford to spend the extra increase of R1 per day and switch to using gas over using electricity, the price elasticity of electricity for that consumer becomes elastic in the long run.

, 20147Arabian Journal of Business and Management Review (Nigerian Chapter) Vol. 2, No.
71
Elasticity of demand and indirect taxation Here we consider the effects of indirect taxes on a producers costs and the importance of price elasticity of demand in determining the effects of a tax on market price and quantity.
Figure 2.26 A tax increases are the costs of a business causing an inward shift in the supply curve. The vertical distance between the pre-tax and the post-tax supply curve shows the tax per unit. With an indirect tax, the supplier may be able to pass on some or all of this tax onto the consumer through a higher price. This is known as shifting the burden of the tax and the ability of businesses to do this depends on the price elasticity of demand and supply. Consider the two charts above. In the left hand diagram, the demand curve is drawn as price elastic. Eskom must absorb the majority of the tax itself (i.e. accept a lower profit margin on each kw of electricity sold). When demand is elastic, the effect of a tax is still to raise the price – but we see a bigger fall in equilibrium quantity. Output has fallen from Q to Q1 due to a contraction in demand. In the right hand diagram, demand is drawn as price inelastic (i.e. Ped <1 over most of the range of this demand curve) and therefore Eskom is able to pass on most of the tax to the consumer through a higher price without losing too much in the way of sales. The price rises from P1 to P2 – but a large rise in price leads only to a small contraction in demand from Q1 to Q2. The usefulness of price elasticity for electricity producer Eskom can use price elasticity of demand (PED) estimates to predict the effect of a change in price on the total revenue & expenditure on a product. The likely price volatility in a market following unexpected changes in supply – this is important for commodity producers who may suffer big price movements from time to time.The effect of a change in a government indirect tax on price and quantity demanded and also whether the business is able to pass on some or all of the tax onto the consumer.Information on the price elasticity of demand can be used by Eskom as part of a policy of price discrimination (also known as yield management). This is where a monopoly supplier

, 20147Arabian Journal of Business and Management Review (Nigerian Chapter) Vol. 2, No.
72
decides to charge different prices for the same product to different segments of the market (for example: Eskom as a monopoly is already charging different prices for electricity in different segments of the market in SA). Figure 2.27. Consumer prices
Data Source: http://www.reservebank.co.za/internet/Publication.nsf/LADV/C1E04C14CD41930A42257037003E1C24/$File/Factsheet2.pdf on 30 June 2013 The graph above show how prices were fluctuating in South Africa, with a real fall of prices that has taken place in 1998, and we assume that since then there were no major price fall/decline in the market. Every industry there are leaders who always set the pace in terms of pricing on that industry, for example:- Coca-cola always set the pace on soft drinks industry because it is the biggest player in the whole industry, therefore it is the same with Eskom because it set the pace in terms of pricing at the energy industry of SA. Elasticity of demand: occurs when consumers buy more or less of electricity when price changes. Price elasticity of demand (PED) shows the relationship between price and quantity demanded and provides a precise calculation of the effect of a change in price on quantity demanded. The following equation enables PED to be calculated.
The equation above is used to calculate the effect of price changes on quantity demanded, and on the revenue received by firms before and after any price change. For example, if the price of electricity unit in S.A increases from R1.00 to R1.20, and the daily sales falls from 500,000 to 250,000, the PED will be: - 50% + 20% = (-) 2.5 The negative sign indicates that P and Q are inversely related, which we would expect for

, 20147Arabian Journal of Business and Management Review (Nigerian Chapter) Vol. 2, No.
73
most price/demand relationships. For example: This is significant because Eskom can calculate or estimate how revenue will be affected by the change in price. In this case, revenue at R1.00 is R500, 000 (R1 x 500,000) but falls to R300, 000 after the price rise (R1.20 x 250,000). The degree of response of quantity demanded to a change in price can vary considerably. The key benchmark for measuring elasticity is whether the co-efficient is greater or less than proportionate. If quantity demanded changes proportionately, then the value of PED is 1, which is called ‘unit elasticity’. PED can also be:
Less than one, which means PED is inelastic. Greater than one, which is elastic. Zero (0), which is perfectly inelastic. Infinite (∞), which is perfectly elastic. a) PED along a linear demand curve
PED on a linear demand curve will fall continuously as the curve slopes downwards, moving from left to right. PED = 1 at the midpoint of a linear demand curve. Figure 2.28
b) PED and revenue
There is a precise mathematical connection between PED and revenue Eskom is expecting or receiving. There are three ‘types’ of revenue:
Total revenue (TR), which is found by multiplying price by quantity sold (P x Q). Average revenue (AR), which is found by dividing total revenue by quantity sold
(TR/Q). Marginal revenue (MR), which is defined as the revenue from selling one extra unit.
This is calculated by finding the change in TR from selling one more unit. For example: Eskom can forecast the impact of a change in price of electricity on its sales volume, and sales revenue (total revenue, TR). For example, if PED for electricity is (-) 2, a 10% reduction in price of electricity (let’s say, from R10 to R9) will lead to a 20% increase in sales (say from 1000 to 1200). In this case, revenue will rise from R10, 000 to R10, 800.
c) Determinants of PED

, 20147Arabian Journal of Business and Management Review (Nigerian Chapter) Vol. 2, No.
74
According to economics (2013) online mention that There are several reasons why consumers may respond elastically or in elastically to a price change, including:
The number and ‘closeness’ of substitutes. For example: – electricity is unique and desirable in S.A and is likely to exhibit an inelastic demand with respect to price.
The degree of necessity of the good. For example: - electricity is necessity in S.A and will be demanded in elastically with respect to price.
Whether the good is habit forming. For example: - consumers are also relatively insensitive to changes in the price of habitually demanded products.
The proportion of consumer income which is spent on the good. For example: the PED for a daily newspaper is likely to be much lower than that for a new car!
Whether consumers are loyal to the brand. For example - brand loyalty reduces sensitivity to price changes and reduces PED.
d) There are three extreme cases of PED. Perfectly elastic, where only one price can be charged. Perfectly inelastic, where only one quantity will be purchased. For example: inelastic
demand: means an increase or decrease in price of electricity will not significantly affect demand of electricity in SA.
Unit elasticity, where all the possible price and quantity combinations are of the same value. The resultant curve is called a rectangular hyperbola.
Figure 2.29
Overview of Factors Influencing disequilibrium of demand and supply of electricity. Eskom supply 85% of electricity in SA market and household, therefore Eskom is a monopoly. Consumers in SA have no other choice in terms of receiving electricity. SA Consumers are stuck with Eskom until the government of SA decide to deregulate energy market. Little is known about the SA customers and their purchasing behaviour. However, literature findings identify some of the issues and factors associated with consumer buying behaviour and marketing tools, which may also be related to the purchase of electricity. These factors were used to generate the constructs applicable to this research in order to build the research model and investigate the research objectives. Buying behaviour is central

, 20147Arabian Journal of Business and Management Review (Nigerian Chapter) Vol. 2, No.
75
in understanding buyer intentions for electricity. Definitions of Consumer Buying Behaviour According to Lancaster (2011:1), consumer behaviour is the acts of individuals directly involved in obtaining and using economic goods and services, including the decision processes that precede and determine these acts. Boone, Kurtz and Mackenzie (2009:136) state that consumer behaviour refers to the mental and physical activities that occur during selection and purchase of a product or service. Thus, consumer behaviour involves the study of how consumers buy, how they think, what they buy, when they buy and why they buy. In other words consumer buyer’s behaviour is all psychological, social and physical behaviour of potential customers as they become aware of, evaluate purchase, consume and tell other people about the product and services (Bose, 2010:215). Factors Influencing Consumer Buying Behaviour The definitions of consumer behaviour suggested that there are various processes involved in the consumer behaviour. Initially, consumers try to find what goods they are interested/willing to consume, then they select the goods that promise greater utility. Eskom after producing Electricity for the needs and market of SA, consumers make an estimate of the available money they can spend. Lastly, consumers analyse the prevailing price of electricity and then decide on how many units of electricity kWh (kilowatt per hour) they wish to consume (Shah, 2010:1). Consumer buying behaviour is also influenced by other factors, such as, social, cultural, personal and psychological factors (Madaan, 2009: 82). For the purpose of this study, the focus was on the external factors influencing consumer behaviour in purchase of electricity. Cultural and social factors: exert the broadest and deepest influences on consumer buying behaviour. They include roles, family, reference group and opinion leaders, social class, and culture and subculture (Kumar, 2010:222). According to Bose (2010:215). Culture is the most influencing and fundamental determinant of a person’s wants and behaviour. Eskom needs to know whether customers are influenced significantly by any reference groups and determine the kind of customer influenced by a particular reference group. Though, much marketing efforts need to go into identifying and converting opinion leaders within a particular reference groups, opinion followers tend to follow leaders by imitating them and sometimes purchasing the same brands (Madaan, 2009: 83). Talloo (2008:203) argues that consumers often decide to buy goods and services based on what they believe others expect of them. But it when it comes to electricity it is very difficult to say the needs and wants of customers are influenced by a particular reference group, because electricity is a necessity inSA. Boone et al. (2009:132) claim that cultures are not homogenous entities with universal values. Each culture includes numerous subculture groups, with their own distinct modes of behaviour. Gauteng province is composed of significant subcultures that differ by ethnicity, nationality, age, social class, disadvantaged versus advantaged urban reaction, and geographic distribution. In view of these, marketing strategies and business practices that work in one country may be offensive or ineffective in another (Pride and Ferrell, 2008:140).Consequently, understanding the influence of cultural/social factors on consumer behaviour indicate that marketing strategies need to be varied from one area of a country to another. Therefore, Eskom can no longer succeed by selling one-size-fits-all services; they must consider consumer needs, interest, and concerns when developing their marketing strategies (Boone et al., 2009:132). This implies that Eskom will need to segment its consumers on various categories, for example, geographic, ethnic, social class and so forth (Rao, 2009:95). Psychological Factors Psychological factors are internal to an individual and generate forces within that individual
, 20147Arabian Journal of Business and Management Review (Nigerian Chapter) Vol. 2, No.
76
to influence purchase behaviour (Lamb, Hair and McDaniel, 2009:200). Talloo (2008:205) mentions that consumer buying choices are influenced by four major psychological factors, namely;
Motivations, Perception, Learning, Beliefs and attitudes.
Kotler (2003:196) submits that Maslow agree that human needs are arranged in a hierarchy; from the most pressing to the least pressing. In order of importance, they are physiological needs, safety needs, social needs, esteem needs, and self-actualisation needs. Lamb et al. (2008:192) mention that marketers must recognise the importance of cues or signals, in consumers’ perception of products or services. Equally, marketing managers must identify important attributes, such as, price or quality, that the targets market wants in a product/service and then design signals to communicate these attributes. Schultz, Barnes, Schultz and Azzaro (2009:4) observe that one of the key aspects of differentiation for a product or service is branding. Branding is a name, term, symbol or design or combination of them, intended to identify goods or services of one seller or group of sellers and to differentiate them from those of their competitors (Swarbrooke and Homer, 2007:164). Hence, brand names, logos, or trademarks encourage consumers to buy products and services because they give them the benefits that they are seeking. Eskom brand name in South Africa and internationally is highly recognised. For example: Eskom hired Converge an energy company from USA to help with marketing and implementation of Demand Response programme in Gauteng province. It was found out that most consumers were not willing or comfortable with working with employees of Comverge without the presence of Eskom employees. Consumers co-operated only when Eskom employees are available because they felt more safe and comfortable as Eskom brand is well known and trusted in SA. Blythe (2008:270) believes that signals are important to consumers when judging product/service quality. This is particularly, true in the case of energy industry sectors, (Eskom offering electricity), due to the intangible characteristics of services. According to Shah (2010:2), consumers develop an attitude toward a brand on the basis of their beliefs about the brand. Personal Factors Personal factors include those aspects that are unique to a person and influence purchase behaviour (Leekha, 2008:30). Some of the important personal factors that influence the buying behaviour are: lifestyle, economic situation, occupation, age, personality and self-concept (Shah, 2010:3). Research indicates that buyers purchase products that reflect and enhance their self-concept (Pride and Ferrell, 2009:205). Life style is an individual pattern of living, expressed through activities, interest, and opinions. Lifestyles influence consumers’ needs, brand preference, and how and where they buy. Although, marketing and advertising influence consumers by evoking them to purchase a particular product or service, energy regulator like NERSA does not predetermine if the target consumers have a secure job and a regular income to spend on electricity before increasing the price Service and Service Quality Hardy (2001:3) indicates that the “service” in the term of “quality of telecommunication service” is understood to pertain to something that is provided day-to-day for the use of someone, the user of that service. Nowadays, consumers and firms are demanding more services as well as services of increasing quality and sophistication. As more property developments and new residential houses are built in Gauteng province, it means the demand of electricity is increasing, and Eskom need to ensure the service it give to its customers is of high quality. Gone are the days where the utility focuses on supplying the electricity without
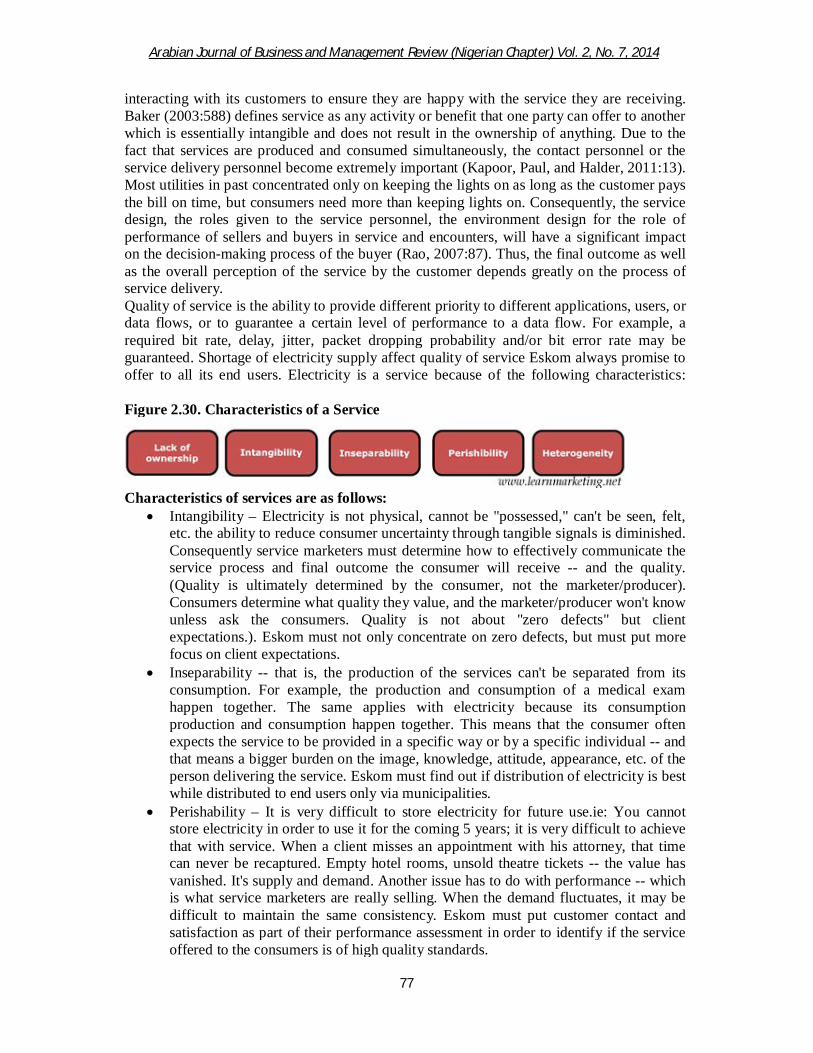
, 20147Arabian Journal of Business and Management Review (Nigerian Chapter) Vol. 2, No.
77
interacting with its customers to ensure they are happy with the service they are receiving. Baker (2003:588) defines service as any activity or benefit that one party can offer to another which is essentially intangible and does not result in the ownership of anything. Due to the fact that services are produced and consumed simultaneously, the contact personnel or the service delivery personnel become extremely important (Kapoor, Paul, and Halder, 2011:13). Most utilities in past concentrated only on keeping the lights on as long as the customer pays the bill on time, but consumers need more than keeping lights on. Consequently, the service design, the roles given to the service personnel, the environment design for the role of performance of sellers and buyers in service and encounters, will have a significant impact on the decision-making process of the buyer (Rao, 2007:87). Thus, the final outcome as well as the overall perception of the service by the customer depends greatly on the process of service delivery. Quality of service is the ability to provide different priority to different applications, users, or data flows, or to guarantee a certain level of performance to a data flow. For example, a required bit rate, delay, jitter, packet dropping probability and/or bit error rate may be guaranteed. Shortage of electricity supply affect quality of service Eskom always promise to offer to all its end users. Electricity is a service because of the following characteristics: Figure 2.30. Characteristics of a Service
Characteristics of services are as follows:
Intangibility – Electricity is not physical, cannot be "possessed," can't be seen, felt, etc. the ability to reduce consumer uncertainty through tangible signals is diminished. Consequently service marketers must determine how to effectively communicate the service process and final outcome the consumer will receive -- and the quality. (Quality is ultimately determined by the consumer, not the marketer/producer). Consumers determine what quality they value, and the marketer/producer won't know unless ask the consumers. Quality is not about "zero defects" but client expectations.). Eskom must not only concentrate on zero defects, but must put more focus on client expectations.
Inseparability -- that is, the production of the services can't be separated from its consumption. For example, the production and consumption of a medical exam happen together. The same applies with electricity because its consumption production and consumption happen together. This means that the consumer often expects the service to be provided in a specific way or by a specific individual -- and that means a bigger burden on the image, knowledge, attitude, appearance, etc. of the person delivering the service. Eskom must find out if distribution of electricity is best while distributed to end users only via municipalities.
Perishability – It is very difficult to store electricity for future use.ie: You cannot store electricity in order to use it for the coming 5 years; it is very difficult to achieve that with service. When a client misses an appointment with his attorney, that time can never be recaptured. Empty hotel rooms, unsold theatre tickets -- the value has vanished. It's supply and demand. Another issue has to do with performance -- which is what service marketers are really selling. When the demand fluctuates, it may be difficult to maintain the same consistency. Eskom must put customer contact and satisfaction as part of their performance assessment in order to identify if the service offered to the consumers is of high quality standards.

, 20147Arabian Journal of Business and Management Review (Nigerian Chapter) Vol. 2, No.
78
Variability -- sometimes called "heterogeneity," electricity services quality and consistency is subject to great variability because it is delivered by people and human behavior is difficult to control. For example municipalities may lower/vary the quality standards of Eskom when delivering electricity to the end users. Because services are people based, quality can vary of time of day (people get tired), experience, attitude, knowledge, style, etc. Maintaining client trust during lapses (which will happen) is critical. And this is why it can be very dangerous to a client relationship to have one person make the sale and establish the relationship, and another person delivers the service. The original personal contact reduced risk in the mind of the consumer and they may become agitated when someone else must deliver the service.
Four Factors That Distinguish Services Marketing It's been called "selling the invisible"-delivering intangible services as a core "product" offering. But invisibility, or intangibility, is just one factor that distinguishes services marketing from product marketing. Along with inseparability, variability, and perishability, these four characteristics affect the way clients behave during the buying process and the way organizations must interact with them. Differences between service marketing and product marketing
When Eskom market a service, Eskom is really marketing relationship and value. This relationship and value needs to be marketed differently than marketing actual products. Marketing of electricity must be marketed differently from marketing other tangible products. For example: Eskom must learn from banking industry how to market quality service and customer satisfaction.
Another major difference between marketing services and marketing products is that when a buyer purchases a service, the buyer is purchasing something that is intangible, instead of a tangible product, like a computer or a sprinkler system or a web page. But when a consumer buys electricity he/she is purchasing a service (intangible).
Consumers' concept of a service is often times based on just the reputation of only one single person. Eskom instead of building a reputation based on the quality of a number of different pricing products, a service is built on how well Eskom employeesdeliver on a better quality service to the end users.
It is pretty easy to compare the quality of different products. It's easy for anyone to see if one computer works more quickly than another computer, or if one TV has a better picture than another picture. However, it is much more difficult to compare the quality of similar services that are provided. The only difference that makes consumers to identify in service quality is point of contact by the staff of the company/producer offering that service.
Products are returnable. However, services are not returnable. For example: it is impossible to return electricity after buying it.
Generally speaking, marketing a product requires what are known as the "4 P's": Product, Price, Place, and Promotion. Marketing a service adds three more "P's" to the traditional "4 P's": People, Physical evidence, and Process. Service marketing also includes marketing what is known as the services cape, which is the aesthetics of my business place: the outside of business building, the inside of business building, and the way that the businessemployees look. Services marketing is marketing based on relationship and value. It may be used to market a service or a product. Marketing a service-base business is different from marketing a goods-base business. There are several major differences, including:

, 20147Arabian Journal of Business and Management Review (Nigerian Chapter) Vol. 2, No.
79
The buyer purchases are intangible, for example: electricity is intangible. The service may be based on the reputation of a single person It's more difficult to compare the quality of similar services, for example: it is very
difficult to compare the service of electricity. The buyer cannot return the service, for example: a buyer cannot return the electricity
after buying. The major difference in the education of services marketing versus regular marketing is that instead of the traditional "4 P's," Product, Price, Place, Promotion, there are three additional"P's" consisting of People, Physical evidence, and Process. Service marketing also includes the service women referring to but not limited to the aesthetic appearance of the business from the outside, the inside, and the general appearance of the employees themselves. Service Marketing has been relatively gaining ground in the overall spectrum of educational marketing as developed economies move farther away from industrial importance to service oriented economies.
2.9 Energy awareness/efficiency as per age and gender in Gauteng province Figure 2.31

, 20147Arabian Journal of Business and Management Review (Nigerian Chapter) Vol. 2, No.
80
Other energy reduction strategies Enernoc.com (2013 ) has provided other energy reduction strategies which might help in reducing demand for electricity per industry in Gauteng province and the rest of South Africa (SA) Despite the benefits of clean energy and the success of programs across the whole country of SA, clean energy remains underutilized as an energy resource and as an emissions reduction strategy. Energy Efficiency, which refers to using less energy to provide the same or improved level of service to the energy consumer, can be an effective way to provide peak demand savings in addition to overall energy savings, depending on the types of equipment and loads that are targeted. US Environmental protection agency (2008:ES2) report summarizes best practices for clean energy policies and initiatives that address summer and winter peak electricity demand. Eskom and SA government must implement clean energy strategies that include the following:
Policies that promote broader deployment of clean energy technologies by addressing existing market and regulatory barriers to clean energy investment, and/or establishing incentives to promote such investment.
Energy efficiency initiatives targeting the leading drivers of summer peak electric demand such as residential air conditioning, commercial heating, ventilation and air conditioning (HVAC), and commercial lighting.
Demand response programs that reduce purchased electricity consumption during periods of peak demand, provided such programs are structured to avoid a net emissions increase through the use of emissions-intensive sources of backup power generation.
This report summarizes best practices for cross-cutting policies that promote the adoption of clean energy technologies and provides detailed information on targeted policies and programs that promote energy efficiency, demand response that could be employed to deliver significant reductions in peak. New York State Energy Research and Development Authority (2006) mentioned that energy efficiency programs can do more than just target and secure energy savings measured on a kilowatt hour (kWh) basis; they can also achieve peak demand reductions which are measured on a kilowatt (kW) basis. For energy efficiency programs to address emissions on HEDDs, it is important to focus programs on loads that are highly coincident with peak demand. Quantifying the peak demand impacts of energy efficiency programs presents a greater technical challenge than evaluating energy savings impacts. While electric bills provide energy use data for all customer classes on a kWh basis, time of use (TOU) meters and demand meters are not widely distributed across all customer classes. In particular, residential and small commercial customers typically lack electric demand and TOU meters, making quantification of peak demand impacts of energy efficiency measures more challenging. (New York State Energy Research and Development Authority (May 2006). New York Energy $martSM Program Evaluation and Status Report, 5-39-41)). According to York, Kushler, Witte (2007), energy efficiency refers to using less energy to provide the same or improved level of service to the energy consumer, can be an effective way to provide peak demand savings in addition to overall energy savings, depending on the types of equipment and loads that are targeted. For energy efficiency programs that address emissions on HEDDs, it is important to focus programs on loads that are coincident with peak demand. There is growing information on the potential to reduce peak demand through energy efficiency programs. The impacts of energy efficiency initiatives can be assessed in

, 20147Arabian Journal of Business and Management Review (Nigerian Chapter) Vol. 2, No.
81
terms reduced electricity consumption, typically measured in terms of kilowatt hours (kWh) of electricity saved, or in terms of the reduction in peak demand for electricity, typically measured in terms of kilowatts (kW) of peak demand reduction. The primary objective of most energy efficiency programs is to produce energy savings (kWh) rather than peak demand reduction (kW). Historically there have been limited resources devoted to assessing the peak demand impacts of energy efficiency programs. While electric bills provide energy use (kWh) data for all customer classes, time of use (TOU) meters and demand meters are not widely distributed across all customer classes. In particular, residential and small commercial customers typically lack electric demand and TOU meters, making quantification of peak demand impacts of energy efficiency measures more challenging. Even with advanced metering infrastructure, it may still be difficult to isolate the peak demand impacts associated with individual energy efficiency measures, and primary data collection efforts are costly. Typical approaches for assessing peak demand impacts involve applying load shapes or load factors to energy savings data. In order to meet short-term operating requirements and in connection with long term electric demand forecasting, utilities have developed comprehensive load shape data for their customer base. Individual load shapes have even been developed down to the level of market sub-segments such as single family homes and small commercial facilities. York, Kushler, Witte (2007), further explained that the American Council for Energy Efficient Economy (ACEEE) recently completed an assessment of the peak demand impacts of energy efficiency programs nationwide. The data presented in this assessment demonstrate how much the relationship between overall energy savings (kWh) and peak demand reduction (kW) can vary based on the end use characteristics of each individual measure However, there is growing interest in the peak demand impacts associated with energy efficiency initiatives, in part due to grid congestion and electric supply reliability issues that are facing some areas of the country. The leading drivers of summer peak electricity demand are residential cooling, commercial heating, ventilation and air conditioning (HVAC), and commercial lighting. Inefficient home appliances, commercial refrigeration, and office plug loads represent additional opportunities for energy efficiency improvement. Clean energy opportunities such as enhanced energy efficiency, demand response initiatives, and clean forms of distributed generation (DG) such as combined heat and power (CHP) and solar energy can be cost-effective strategies for reducing peak electric demand, achieving air quality benefits, and contributing to electric supply reliability. “Demand response” is a broad term encompassing a range of program types designed to reduce electricity use during periods of peak electric demand, (US Environmental protection agency, clean energy options for addressing high electric demand, 2008: ES4). Demand response initiatives range from programs that provide customer incentives for voluntary (non-firm) or mandatory (firm) load curtailment based on contractual arrangements, to dynamic pricing structures that charge higher rates during peak periods, employing a market-based approach to achieving peak demand reduction. Some program administrators are finding that a portfolio of demand response programs comprised of voluntary and mandatory reduction commitments is the most cost-effective demand response strategy to accommodate the different technologies and customer preferences in different market sectors. This approach also offers customers increased flexibility in terms of selecting the demand response option that is best suited to their risk tolerance. The broad term “Demand response” encompasses a range of program types designed to reduce electricity use during peak demand periods. Demand response programs are typically designed to increase system reliability and/or minimize the use of peaking units that are

, 20147Arabian Journal of Business and Management Review (Nigerian Chapter) Vol. 2, No.
82
usually among the most expensive and most polluting sources of power. At the retail level, demand response programs are typically implemented by utilities or other load-serving entities (LSEs). At the wholesale level, independent system operators (ISOs) or regional transmission organizations (RTOs) might also provide incentives to LSEs for the aggregated demand reductions of retail customers. Demand response initiatives range from programs that provide customer incentives for voluntary (non-firm) or mandatory (firm) load curtailment, to dynamic pricing structures that charge higher rates during peak periods, employing a market-based approach to achieving peak demand reduction. A variety of enabling technologies reinforce demand response objectives. Advanced metering and communications infrastructure transmits hourly (or even more frequent) data on customer energy use to the LSE, which is necessary to support dynamic pricing structures. Load control devices such as smart thermostats or switches might be located at a customer’s home or business, permitting the LSE to remotely curtail their energy use. Smart thermostats and other energy management devices also provide the customer with more detailed information on their energy use, helping to motivate demand reductions when they are needed. Assessment of Demand Response and Advanced Metering (2000) mentioned that some administrators of demand response programs are finding that a portfolio of demand response programs comprised of voluntary and mandatory reduction commitments is the most cost-effective demand response strategy. This approach also offers customers increased flexibility in terms of selecting the demand response option that is best suited to their risk tolerance. A recent assessment of demand response programs by the Federal Energy Regulatory Commission (FERC) notes that multiple demand response offerings can serve complementary goals. For example, large-scale implementation of time-based rates reduces the severity or frequency of reserve shortages, which in turn reduces the need for mandatory curtailments. Reductions in the frequency of curtailment events may also boost participation in incentive-based mandatory curtailment programs by reducing the risks associated with frequent curtailment events . (Federal Energy Regulatory Commission (August 2006). Assessment of Demand Response and Advanced Metering. Docket No. AD-06-2-000)) Barriers to other energy reduction strategies United States Environmental protection agency (2008) states the following barriers regarding other energy reduction strategies: US Environmental protection agency (2008:3-11) mentioned the following barriers, which are similar to SA energy market where Eskom is operating, and they include:
a) The adoption of energy efficiency technologies in the home building industry, Industry resistance to change and concerns with risk;
First cost decision making which ignores utility cost savings and improved comfort, durability and indoor air quality;
Lack of skills selling energy efficient homes; Lack of consumer awareness; and Lack of technical infrastructure for construction and verification.
b) Market barriers includes fundamental market characteristics that inhibit
investment in clean energy opportunities. For example they include the following:
The split incentive barrier, where the economic benefits of increased energy efficiency do not accrue to the decision-maker (e.g., the home builder or commercial developer who is not responsible for paying the on-going energy bill), and
The transaction cost barrier, where the costs associated with making the investment (acquiring information, evaluating risks, etc.) inhibit investment. Transaction cost

, 20147Arabian Journal of Business and Management Review (Nigerian Chapter) Vol. 2, No.
83
barriers chronically affect individual and small business decision-making regarding investment in clean energy opportunities.
c) Customer barriers includes the following: Lack of information about clean energy opportunities, Lack of awareness of how existing clean energy programs make investments easier, Lack of time and attention to evaluating and implementing clean energy opportunities,
and Lack of funding to invest in clean energy opportunities.
d) Public policy barriers include existing policy and regulatory conditions:
That discourages clean energy investment by utilities, retail electric service providers, power producers, and transmission and distribution companies.
Historically these organizations have been rewarded more for building infrastructure (e.g., power plants, transmission lines, pipelines) and increasing energy sales than for helping their customers use energy wisely, even when the clean energy opportunities might cost less than building infrastructure.
e) Utility, government, and regional planning barriers includes: Energy supply planning structures/processes which do not allow clean energy
opportunities to compete equitably with traditional supply-side resources.
f) Program barriers includes: Sub-optimal clean energy program design and implementation due to lack of
knowledge about the most effective and cost-effective means of promoting clean energy opportunities in the target market, and
Try to come with best strategies to address common market barriers, and available technologies.
According to US Environmental protection agency (2008:3-18), barriers to HVAC installations and maintenance program requires a commitment to work with HVAC trade contractors, of which in SA we are still lacking behind and play a role in technician training and mentoring. To maintain the credibility of the program, it is essential to verify that contractors are meeting program standards. So far in SA Eskom is the only one trying to enforce these standards because when standards are not enforced, the program does not achieve the expected savings, and the business of contractors following program standards is damaged. Some programs use an independent organization, called a verification service provider, to verify that air flow and refrigerant charge are correct. Programs have also used on-site inspections to verify that program standards are met. US Environmental protection agency (2008:3-24) have discovered that IT departments regularly deactivate power management features when setting up new PCs because they update computers at night or had bad experiences when CPM was much more unstable. IT departments and companies in SA must be convinced that power management is a sound technology and be presented with solutions to ensure that sleeping computers do not interfere with the night-time distribution of administrative software updates. For these reasons, it is important for energy efficiency programs to have a high level of technical capability so they can communicate effectively work with IT staff and change standard practice. Prescriptive incentive programs might fail to realize savings that are associated with more complex measures or with systems that include multiple technologies. For example, a facility that is evaluating equipment for a cooling system upgrade might not consider how

, 20147Arabian Journal of Business and Management Review (Nigerian Chapter) Vol. 2, No.
84
implementing a lighting system upgrade would reduce cooling load and potentially allow for down-sizing of cooling equipment. A balanced energy efficiency portfolio will also include programs to promote more comprehensive assessments of facility energy use and cross-cutting energy efficiency opportunities (US Environmental protection agency, clean energy options for addressing high electric demand, 2008:3-28). Proven models include custom incentive programs that offer a greater degree of technical assistance and incentives based on calculated energy savings and/or demand reduction. Design assistance programs offer similar mechanisms to promote energy efficient design and construction of commercial facilities (new construction or major renovations). Whole building energy performance programs are generally more complex to administer than prescriptive rebate programs, and are most commonly implemented by program administrators with an established record of energy efficiency initiatives (US Environmental protection agency, clean energy options for addressing high electric demand, 2008:3-31). Less experienced program administrators might begin with traditional prescriptive programs and gain experience with more comprehensive approaches on a small-scale pilot basis. In order to capture a larger amount of energy efficiency potential and serve a broad range of end-users, a mature energy efficiency portfolio will typically include a mixture of prescriptive and comprehensive program approaches for the C&I market. Such programs may also encounter more substantial barriers to participation as they require a higher level of effort on the part of the customer/trade ally. In some markets, there may be few trade allies qualified to implement more comprehensive energy efficiency improvement projects. NYSERDA and National Grid have invested resources in developing networks of qualified trade allies through screening and training activities. Lastly, whole building approaches typically require more measurement and verification (EM&V) M&V resources to verify peak demand impacts. Where prescriptive programs can employ deemed savings estimates due to the standardized nature of the energy savings measures they promote, custom programs often require a greater number of on-site assessments as well as some post-installation metering and verification because of the non-standard nature of the measures covered, interactive effects (e.g., between lighting and HVAC systems), and project size. Cool roof incentive programs are not cost-effective in all areas. Building code requirements may be a more effective strategy in milder climate regions (US Environmental protection agency, clean energy options for addressing high electric demand, 2008:3-35). Where cool roof programs are cost-effective, it is important to conduct verification of contractor work to ensure that program requirements are being met. For SA demand response (DR) incentive programs must provide an effective strategy to reduce HEDD emissions, it is essential that such programs be structured to avoid a net emissions increase through the use of emissions-intensive sources of backup power generation. According to US Environmental protection agency (2008:4-39), a recent ISO New England report, a significant fraction of incentive-based demand response came from the use of backup generation rather than curtailment. Demand response programs that allow the use of backup generators to meet demand response obligations are likely to compromise the environmental benefits of the programs. Figure 2.32. Comparison of dynamic pricing structures

, 20147Arabian Journal of Business and Management Review (Nigerian Chapter) Vol. 2, No.
85
Source: Federal Energy Regulatory Commission (August 2006). Assessment of Demand Response and Advanced Metering. Docket No. AD-06-2-000. Federal Energy Regulatory Commission (2006) mentioned that in order for dynamic pricing structures to function effectively, the following conditions must be in place: (1) customers need timely access to information about rate changes; (2) customers must be capable of responding to price changes with automated load control systems facilitating demand response; and (3) customers must have an advanced meter installed so that hourly consumption data are available. Current estimates suggest that the market penetration of advanced meters is low nationally—around 6 percent. However, market penetration of advanced metering infrastructure is much higher in states such as Pennsylvania is 52.5 percent and Connecticut is 21.4 percent. (Federal Energy Regulatory Commission (August 2006). Assessment of Demand Response and Advanced Metering. Docket No. AD-06-2-000)) Time-based rates are best viewed as an important part of a portfolio approach to demand side management that also includes energy efficiency, incentive-based demand response, customer education, and technical assistance. RESEARCH METHODOLOGY The selection of research components in this study was done keeping in view of the objectives of the research. Most research objectives can be achieved by using one of the three types of research designs, namely exploratory, descriptive and explanatory or casual research (Hair, Bush and Ortinau, 2000:37). Target population Bryman (2008:697) defines population as the universe of units from which a sample is to be selected. Katzenellenbogen, Joubert and Karim (2001:74) describe the study population as the source population from which cases and controls are selected. Bryman (2008:698) defines a sample as being the segment of the population that is selected for research – it is a subset of the population. This part of the research involves analysis of data from Eskom regarding demand and supply of electricity in Gauteng. The study of population was sent to consumers (end users) of electricity, and a sample of 45 questionaires was sent to 50 consumers/participants. Being a small sample size the researcher was able to target at least 50 of these individual consumers for the purpose of this study. The study achieved 82% percent success response rate due to the population being small, and with a very limited time. Response Rate: Forty one (82%) out of fifty (sample population) respondents took part in the self-administered questionnaires. The questionnaires were delivered to them via the hand delivery or via the email. Table 3.2: Questionnaire Response Rate Frequency
Percen Valid Percent Cumulative
Percent

, 20147Arabian Journal of Business and Management Review (Nigerian Chapter) Vol. 2, No.
86
t Responded 41 82 82 82 Non respondent 9 18 18 100 Total 50 100 100 Figure 3.2
According to Brink (2002:179) statistics is the most powerful tool available to the researcher in analysing quantitative data. Agresti and Franklin (2009:10) distinguish between descriptive and inferential statistics as follows: Descriptive statistics refers to methods for summarizing the data. The summaries usually consist of graphs and numbers such as averages and percentages. Inferential statistics refers to methods for making decisions or predictions about a population, based on data obtained from a sample of that population. For the purpose of this study both descriptive and inferential statistics were used. Limitations and Delimitations of the Study The research is homogenous in that it was limited to the residence of Gauteng Province. A discussion of the study limitations demonstrates that the researcher understands that no research project is perfectly designed; consequently, the researcher make no overweening claims about generalizability or conclusiveness about what has been learned (Marshall and Rossman, 2011:76).This study will be limited to disequilibrium of electricity demand and supply in Gauteng province. In fact, considering resources and time constraints, the research was limited to one province of Gauteng in South Africa. Therefore, it cannot be representative of the South African companies, population’s and municipalities behaviour. Some of the limitations originated from the tool that was used. The use of the closed ended questionnaire meant that it was not possible to ask follow-up questions and thus finding out the reasons and impact on the Gauteng economy caused by disequilibrium of electricity supply and demand. The other concern is that this study was measuring factors affecting consumers’ or customer’s perception in the energy sector, but there is a lack of related literature. The delimitations of a study are those characteristics that limit the scope of the inquiry and define boundaries for the
Responded82%
Non respondent
18%

, 20147Arabian Journal of Business and Management Review (Nigerian Chapter) Vol. 2, No.
87
study (Ledez, 2008:120). This study examined only reasons that influence disequilibrium of electricity demand and supply, and the impact on the economy of Gauteng province. Furthermore, the delimitations of this study was also related to the use of a singular research design as opposed to triangulation. The research instrument and the number of test items were also limited. Sometime people lie therefore it is hard to know if the survey is accurate. Another hindrance was poor or inaccessibility to the whole region of study (Gauteng province), access to information within Eskom, access to resources, time management (there was very limited time to conduct the study), access to expirts for editing, proofreading, and guidance, support from organizations (it was very slow) and participants were also limited because time was very limited.
experimental errors. 6th step: To make sure that the results of the research are accurately recorded in
literature to avoid reporting bias. DATA ANALYSIS, INTERPRETATION AND FINDINGS Response rate Forty one (82%) out of fifty (sample population) respondents took part in the survey. The questionnaires were delivered to them by hand or via the e-mail. Figure 4.1: Response rate
Table 4.1 Frequency
Percent
Valid Percent Cumulative Percent
Responded 41 82 82 82 Non respondent 9 18 18 100 Total 50 100 100 Only 41 responses out of 50 was received which makes it 82% responded, and 9 (18%) have not responded. Analysis of data
Responded82%
Non-responded
18%

, 20147Arabian Journal of Business and Management Review (Nigerian Chapter) Vol. 2, No.
88
The findings were presented in four main sections, demographic information, biographical information, impact on the economy and other energy reduction strategies. 4.4. Demographics Figure 4.2: Academic qualifications
The survey response were as follows; 12% were below matric, 10% have matric, 24% have diplomas, 34% have degree, and 20% have other qualifications. Figure 4.3: Metros (Municiplities)
78% of the respondents were coming from City of Tshwane (previously known as Pretoria) and Johannesburg. 44 % of respondents are residing at City of Tshwane and 34 % of respondents are residing at City of Johannesburg, 15% of respondents are residing at City of Ekurhuleni, 2% of respondents reside at the City of Emfuleni and 5% of respondents reside at the Midvaal City. Figure 4.4
12%
10%
24%34%
20%Below matric
Matric
Diploma
Degree
Other
34%
44%
15%
2%5%
City Johannesburg
City of Tshwane
City of Ekurhuleni
City of Emfuleni
Midvaal City
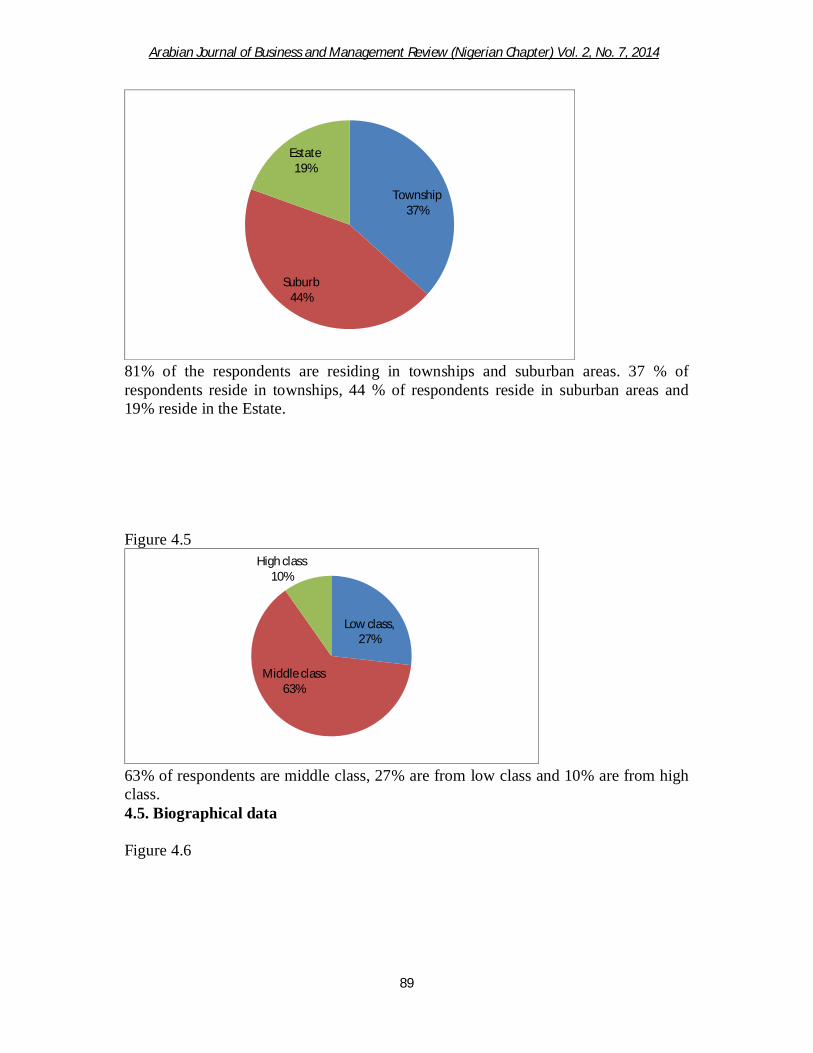
, 20147Arabian Journal of Business and Management Review (Nigerian Chapter) Vol. 2, No.
89
81% of the respondents are residing in townships and suburban areas. 37 % of respondents reside in townships, 44 % of respondents reside in suburban areas and 19% reside in the Estate. Figure 4.5
63% of respondents are middle class, 27% are from low class and 10% are from high class. 4.5. Biographical data Figure 4.6
Township 37%
Suburb 44%
Estate19%
Low class, 27%
Middle class63%
High class 10%
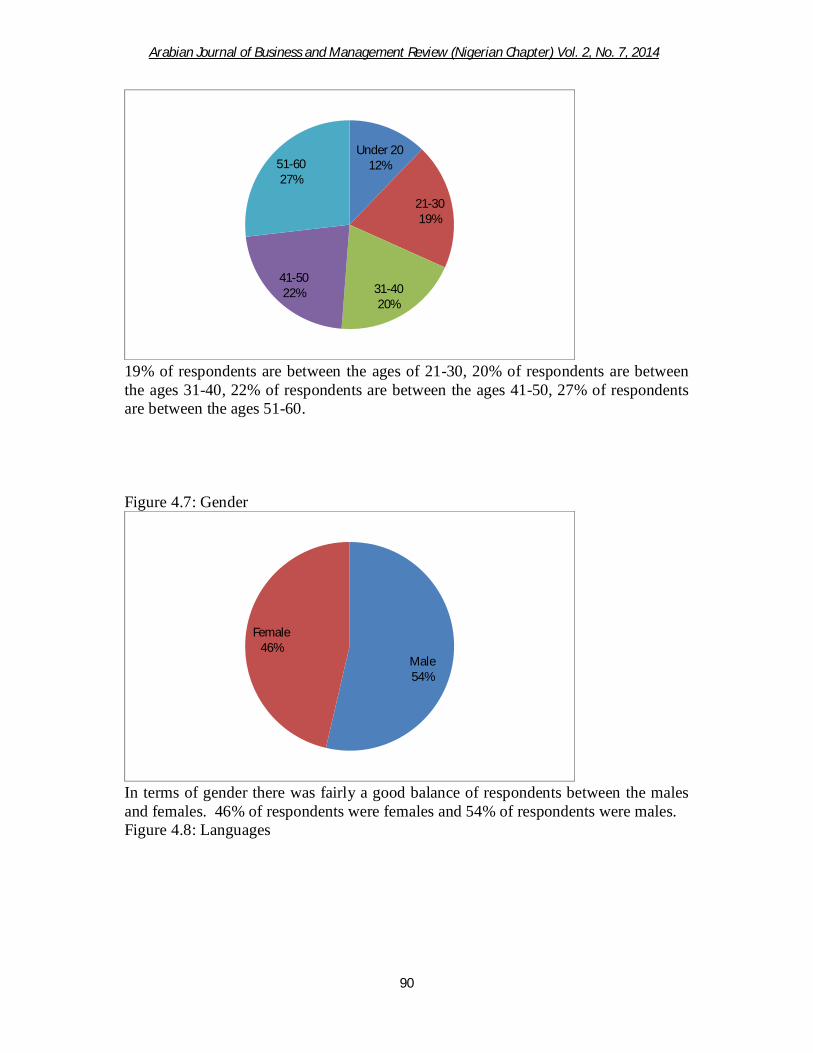
, 20147Arabian Journal of Business and Management Review (Nigerian Chapter) Vol. 2, No.
90
19% of respondents are between the ages of 21-30, 20% of respondents are between the ages 31-40, 22% of respondents are between the ages 41-50, 27% of respondents are between the ages 51-60. Figure 4.7: Gender
In terms of gender there was fairly a good balance of respondents between the males and females. 46% of respondents were females and 54% of respondents were males. Figure 4.8: Languages
Under 2012%
21-3019%
31-4020%
41-5022%
51-6027%
Male54%
Female46%

, 20147Arabian Journal of Business and Management Review (Nigerian Chapter) Vol. 2, No.
91
The majority of respondents were English speaking (24%), followed by Tsonga speaking (17%), followed by Zulu speaking (15%), followed by Afrikaans speaking (12%), followed by Sotho (10%), followed by Xhosa speaking (7%), and the rest which were not mentioned above fall under other languages (3%). Figure 4.9
The majority of respondents were blacks (71%), followed by whites (12%), followed by coloured (10%), and the last ethnic group in terms of colour were Indians (7%). Impact to the economy of Gauteng province Questions 9 – 33 aimed at analysing the impact caused by disequilibrium of electricity supply and demand to the economy of Gauteng province. The following section present and interpret the impact tot the economy of Gauteng province. 4.6.1. Electricity shortage will have positive or negative impact to the economy of Gauteng province.
Tsonga17%
English24%
Afrikaans12%
Zulu15%
Xhosa7%
Tswana12%
Sotho10%
Other (Specify)3%
White12%
Black71%
Indian7% Coloured
10%
Other (Specify)0%

, 20147Arabian Journal of Business and Management Review (Nigerian Chapter) Vol. 2, No.
92
Figure 4.10: Electricity shortage have positive impact to the economy of Gauteng Province
The findings in figure 4.10 reveal that 66 % of the respondents disagreed (44 % strongly disagreed and 22 % disagreed), 17% were unsure and 17% agreed (10% agreed and 7% strongly agreed) that electricity shortage has positive impact to the economy of Gauteng province. It is evident (figure 10) that majority of respondents disagree that electricity shortage is having positive impact to the economy of Gauteng Province. Sioshansi (2013:227) said that Associations of Southeast Asian Nations (ASEAN)- consist of Brunei, Cambodia, Indonesia, Laos, Malaysia, Philipines, Singapore, Thailand and Vietnam. This part of the world is experiencing fast economic growth and industrialisation. Sioshansi further mentioned that the GDP of ASEAN grew at an average of 5.2% annually over a period of 2000-2009, at the same time energy consumption of ASEAN economies grew at 4.8% annually, slightly lower than GDP expansion. Between 2000-2009 period world average annual growth rate grew at 3.5% annually, and world average consumption grew annually at 2.2% during this period (Sioshansi, 2013:227). Therefore the picture above reveal very clear that consumption of electricity must always be less than GDP and economic growth is then it will positively affect economic growth. For example: SA electricity prices and consumption rate is more than GDP and economic growth. SA is experiencing shortage of electrity but the rate of the consumption/demand of electricity is forever increasing, that is why there is no enough supply to meet the demand. Sioshansi theory agree with 66% of respondents who disagreed that electricity shortage have positive or negative impact to the economy of Gauteng province and the rest of SA. Figure 4.11: Electricity shortage have negative impact to the economy of Gauteng Province
Strongly Disagree
44%
Disagree 22%
Neither Agree Nor Disagree
17%
Agree 10%
Strongly Agree 7%

, 20147Arabian Journal of Business and Management Review (Nigerian Chapter) Vol. 2, No.
93
The findings in figure 4.11 reveal that 0 % of the respondents agreed (0 % strongly disagreed and 0 % disagreed), 5% were unsure and 95% agreed (29% agreed and 66% strongly agreed) that electricity shortage has negative impact to the economy of Gauteng province. Shortage of electricity is not good for the economic growth because it slows down industrialisation, and SA is shifting from Agricultural sector to manufacturing and commercial sectors. Electricity plays a vital role in urbanisation, because most of consumers substituted consumption of primary energy with consumption of electricity. The shortage of electricity affects industrialisation, manufacturing and urbanisation negatively. Therefore shortage of electricity is not good for economic growth. Sioshansi (2013: 230) said that electricity demand in developing economies is primarily driven by GDP, prices (electricity tariffs), income, level and characteristics of economic activity, urbanisation and seasonal factors. For example: uni-directional causality from growth in GDP to growth in electricity consumption in Indonesia and Thailand. These findings support the argument that growth in GDP is a key driver of growth in electricity consumption (Sioshansi, 2013: 231). If GDP is the main driver of electricity consumption, in other words it means the country must be experiencing good/positive economic growth, therefore consumption will increase, but currently SA is experiencing a very low growth in GDP because there is no enough supply of electricity. Disequilibrium of demand and supply how it affect consumers and the growth of Gauteng province. The aim of questions 11-14 was to determine whether respondents and the growth of Gauteng province are affected by the disequilibrium of demand and supply of electricity. Figure 4.12: Are you affected by the impact caused by the disequilibrium of demand and supply of electricity?
Strongly Disagree
0%
Disagree 0%
Neither Agree Nor Disagree
5%
Agree 29%
Strongly Agree 66%

, 20147Arabian Journal of Business and Management Review (Nigerian Chapter) Vol. 2, No.
94
Results in Figure 4.12 indicate that 5% of the respondents disagreed (0% strongly disagreed and 5% disagreed), 22% were unsure while 73% agreed (15% agreed and 58% strongly agreed) to being affected by the disequilibrium of demand and supply of electricity. The results denotes that 73 of respondents are being affected by disequilibrium of demand and supply. 73% of respondents agreed that they are affected by the impact caused by the disequilibrium of demand and supply of electricity. Gauteng and the whole government of SA must learn from USA where advances in energy efficiency rather than in energy supply have been a primary driver of economic productivity. (Sioshansi, 2013: 446). Americans converted electricity shortage into a productive economic opportunity. Shortage of electricity comes with opportunity of energy savings measures which can benefit consumers economically and financially. If South Africans are affected by the shortage in electricity supply, it is important to look very close that what kind of economic opportunities is this electricity shortage bringing. Figure 4.13: Does electricity shortage contribute to slow growth of factories in Gauteng Province?
Strongly Disagree
0%
Disagree 5%
Neither Agree Nor Disagree
22%
Agree 15%
Strongly Agree 58%
Strongly Disagree
2%
Disagree 0%
Neither Agree Nor Disagree
2%
Agree 20%
Strongly Agree 76%

, 20147Arabian Journal of Business and Management Review (Nigerian Chapter) Vol. 2, No.
95
Results in Figure 4.13 indicate that 2% of the respondents disagreed (2% strongly disagreed and 0% disagreed), 2% were unsure while 86% agreed (20% agreed and 76% strongly agreed) electricity shortage contribute to slow growth of factories in Gauteng Province. The results show that 76% of respondents agree that electricity shortage contribute to slow growth of factories in Gauteng Province. Sioshansi (2013:446) said that the availability of high quality yet affordable electricity has been significant contributor to past productive improvements. My interpretation of shortage means that high quality standards have been sacrificed. High quality means reliable supply and total customer satisfaction, therefore in USA they realised that quality is linked productivity improvements. How can factories improve productivity when there is always shortage of electricity supply, it is high time that Gauteng government along with the rest of SA start realising that electricity shortage is the result behind the slow growth of factories in Gauteng Province, because no investor who want to invest in a place where productivity is compromised, because without improved productivity the business will not make profits as many of its customers will not be happy. Businesses can lose billions of rands if the power is out for only a few minutes (Sioshansi, 2013:456). Figure 4.14: Electricity shortage contributes positively to the gross domestic products (GDP)?
Sioshansi (2013:229) said that world average growth in both energy consumption and electricity consumption are lower than that of the GDP, therefore Asian economies follow this trend in energy, not in electricity consumption. In other words growth in electricity consumption in ASEAN economies has been very high, which means it is reasonable to raise concern about efficiency of electricity consumption. Based on the responses 71% of respondents that disagreed that electricity shortage has positive impact to the GDP of Gauteng province. Sioshansi (2013:230) also mentioned that developing economies usually have a room for reducing electricity consumption without harming GDP in the short run. He further mentioned that growth in electricity
Strongly Disagree
37%
Disagree 34%
Neither Agree Nor Disagree
15%
Agree 2% Strongly
Agree 12%

, 20147Arabian Journal of Business and Management Review (Nigerian Chapter) Vol. 2, No.
96
consumption move with growth in GDP, although with slightly different patterns in different economies. It is possible to reduce electricity consumption withpout harming GDP only when that country is experiencing full employment. GDP is linked to improved productivity, therefore if productivity is not improving it means GDP is the one that suffer at the end. Sioshansi (2013:446) said that the availability of high quality yet affordable electricity has been significant contributor to past productive improvements or improvement in GDP. My interpretation of shortage means that high quality standards have been sacrificed. High quality means reliable supply and total customer satisfaction, therefore in USA they realised that quality is linked productivity improvements. How can factories improve productivity when there is always shortage of electricity supply? The shortage of electricity is not contributing positively to the gross domestic products (GDP), because many businesses are unable to improve their profits due to lack of improvement in production that is caused by shortage of electricity supply. Figure 4.15: Is electricity a necessity for Gauteng economic growth?
In figure 4.15 and above 95% of the respondents agreed that electricity is a necessity especially in Gauteng province because majority of respondents does not use gas in their homes. 95% of the respondents agreed that 80% of their appliances in their homes use electricity. A necessity is a need that means one cannot leave/survive without it. Therefore without electricity businesses and consumers in Gauteng province find it difficult to leave without electricity. For example: The load sheddings that took place in early 2007 until 2011 left the economy of SA crippled because productivity was negatively affected, and many businesses had to deal with unhappy customers which resulted in a loss in those businesses. . Sioshansi (2013:446) said that the availability of high quality yet affordable electricity has been significant contributor to past productive improvements or improvement in GDP. Businesses can lose billions of rands if the power is out for only a few minutes (Sioshansi, 2013:456). Business are the key and backbone of economic growth, therefore if they keep on losing millions is either they reduce staff or exit that market to look for opportunities elsewhere the economic conditions are stable and good for business. 4.6.3. The impact of NERSA 8% increase granted to Eskom for the coming 5 years on the economy of Gauteng Province.
Strongly Disagree
3%
Disagree 0%
Neither Agree Nor Disagree
2%
Agree 27%
Strongly Agree 68%

, 20147Arabian Journal of Business and Management Review (Nigerian Chapter) Vol. 2, No.
97
The aim of the questionnaire is to determine whether 8% tariff increase has negatively or positively impact to the economy of Gauteng Province, and whether it will reduce the growth of Gauteng economy. Figure 4.16: NERSA decision in granting Eskom 8% increase of electricity/tariffs for the coming 5 years has positive impact to the economy of Gauteng Province.
Results in Figure 4.16 indicate that 56% of the respondents disagreed (34% strongly disagreed and 22% disagreed), 10% were unsure while 34% agreed (17% agreed and 17% strongly agreed) that 8% tariff increase has negatively impact to the economy of Gauteng Province, and that it reduce the growth of Gauteng economy. Economics taught us that when the price of a product or service increase demand decrease, but it is very difficult for demand of electricity to decrease because it is regarded as a need not want in SA. Price plays a vital role in production of goods and services, therefore businesses will try to cover their increased production costs by increasing the price of goods and services. Therefore the consumers are the one that will be heavily affected because the businesses will pass the burden to the consumers of price increase to carry. That is why 56% of the respondents disagreed that price increase will have positive effect to the economy of Gauteng province, because goods and services will be expensive.
Strongly Disagree
34%
Disagree 22%Neither Agree
Nor Disagree 10%
Agree 17%
Strongly Agree 17%
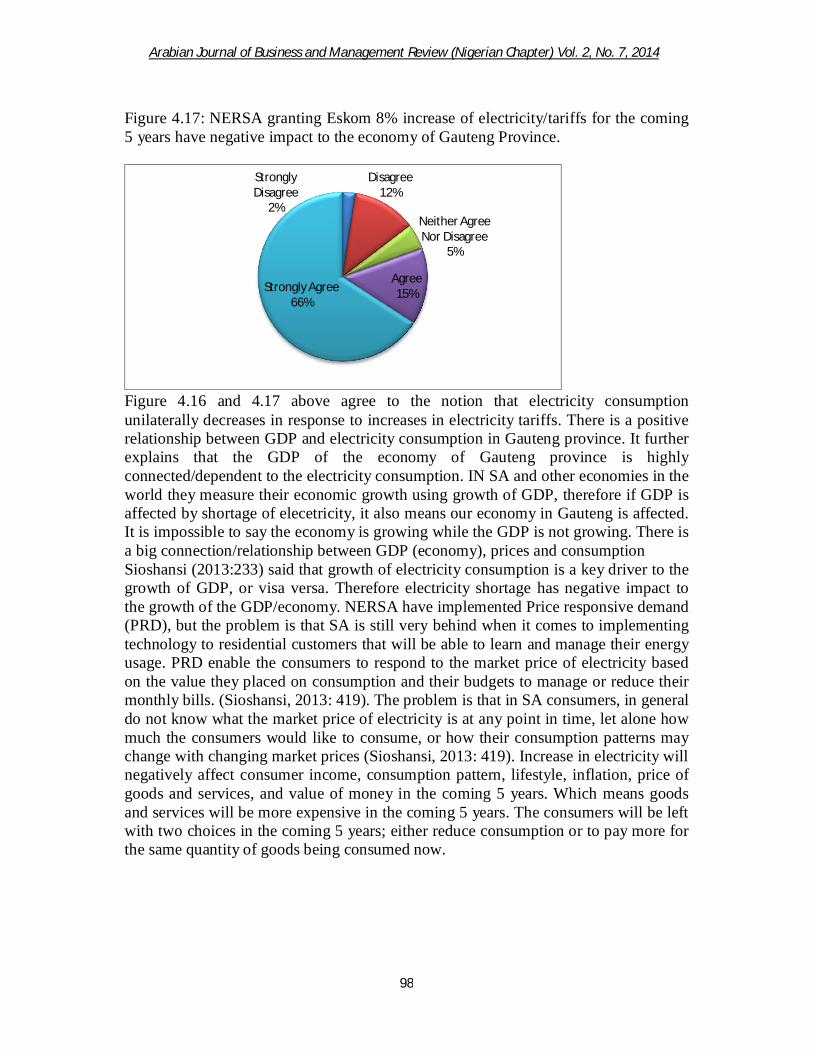
, 20147Arabian Journal of Business and Management Review (Nigerian Chapter) Vol. 2, No.
98
Figure 4.17: NERSA granting Eskom 8% increase of electricity/tariffs for the coming 5 years have negative impact to the economy of Gauteng Province.
Figure 4.16 and 4.17 above agree to the notion that electricity consumption unilaterally decreases in response to increases in electricity tariffs. There is a positive relationship between GDP and electricity consumption in Gauteng province. It further explains that the GDP of the economy of Gauteng province is highly connected/dependent to the electricity consumption. IN SA and other economies in the world they measure their economic growth using growth of GDP, therefore if GDP is affected by shortage of elecetricity, it also means our economy in Gauteng is affected. It is impossible to say the economy is growing while the GDP is not growing. There is a big connection/relationship between GDP (economy), prices and consumption Sioshansi (2013:233) said that growth of electricity consumption is a key driver to the growth of GDP, or visa versa. Therefore electricity shortage has negative impact to the growth of the GDP/economy. NERSA have implemented Price responsive demand (PRD), but the problem is that SA is still very behind when it comes to implementing technology to residential customers that will be able to learn and manage their energy usage. PRD enable the consumers to respond to the market price of electricity based on the value they placed on consumption and their budgets to manage or reduce their monthly bills. (Sioshansi, 2013: 419). The problem is that in SA consumers, in general do not know what the market price of electricity is at any point in time, let alone how much the consumers would like to consume, or how their consumption patterns may change with changing market prices (Sioshansi, 2013: 419). Increase in electricity will negatively affect consumer income, consumption pattern, lifestyle, inflation, price of goods and services, and value of money in the coming 5 years. Which means goods and services will be more expensive in the coming 5 years. The consumers will be left with two choices in the coming 5 years; either reduce consumption or to pay more for the same quantity of goods being consumed now.
Strongly Disagree
2%
Disagree 12%
Neither Agree Nor Disagree
5%
Agree 15%Strongly Agree
66%

, 20147Arabian Journal of Business and Management Review (Nigerian Chapter) Vol. 2, No.
99
Figure 4.18: Will electricity price increase for the coming 5 years reduce the growth of Gauteng economy?
Results in Figure 4.18 indicate that 5% of the respondents disagreed (0% strongly disagreed and 5% disagreed), 12% were unsure while 83% agreed (32% agreed and 51% strongly agreed) that electricity price increase for the coming 5 years will reduce the growth of Gauteng economy. . Figure 4.16 and 4.17 and 4.18 above agree to the notion that electricity consumption unilaterally decreases in response to increases in electricity tariffs. There is a positive relationship between GDP and electricity consumption in Gauteng province. It further explains that the GDP of the economy of Gauteng province is highly connected/dependent to the electricity consumption. IN SA and other economies in the world they measure their economic growth using growth of GDP, therefore if GDP is affected by shortage of elecetricity, it also means our economy in Gauteng is affected. It is impossible to say the economy is growing while the GDP is not growing. There is a big connection/relationship between GDP (economy), prices and consumption Sioshansi (2013:233) said that growth of electricity consumption is a key driver to the growth of GDP, or visa versa. Therefore electricity shortage has negative impact to the growth of the GDP/economy. Electricity high tariffs discourage productive use of electricity, which means if the tariffs discourage productive use of electricity the economy is suffering, therefore high tariffs reduce the growth of Gauteng economy. 5% of respondents were unsure that high tariffs reduce the growth of economy because Singapore has the highest electricity tariffs which are about $.20/kWh, and it has the highest efficiency in electricity use among the ASEAN economies, (Sioshansi, 2013:237). Adjusting electricity prices as the mechanism of energy reduction strategies. The aim of the questionnaire is to determine whether price adjustment method is good while being used as energy reduction strategies. Figure 4.19: Is it good to continuously adjust electricity prices as one of the mechanism of energy reduction strategies?
Strongly Disagree
0%
Disagree 5%
Neither Agree Nor Disagree
12%
Agree 32%
Strongly Agree 51%

, 20147Arabian Journal of Business and Management Review (Nigerian Chapter) Vol. 2, No.
100
Results in Figure 4.19 and Table 4.19 indicate that 17% of the respondents disagreed (7% strongly disagreed and 10% disagreed), 24% were unsure while 59% agreed (42% agreed and 17% strongly agreed) that adjusting electricity prices is one of the good mechanism of energy reduction strategies. It is known in economics that when you increase the price of goods and services, the consumption of that goods and services decrease, that is why 59% agreed that the increase in price reduce the demand of electricity. Federal Energy Regulatory Commission (2006) mentioned that in order for dynamic pricing structures to function effectively for energy efficient or reduction, the following conditions must be in place:
Customers need timely access to information about rate changes; Customers must be capable of responding to price changes with automated load
control systems facilitating demand response; and Customers must have an advanced meter installed so that hourly consumption
data are available. Current estimates suggest that the market penetration of advanced meters is low nationally—around 6 percent, although the government of SA is working very hard to change this bad situation very urgently. However, market penetration of advanced metering infrastructure is much higher in states such as Pennsylvania is 52.5 percent and Connecticut is 21.4 percent. According to US Environmental protection agency (2008:4-43) mentioned that barriers to dynamic pricing is the type of customer response (e.g., shifting, foregoing, generating on site) to high peak prices is likely to impact the environmental benefits of time-based rates and is a key consideration for program design. In addition, dynamic pricing programs require advanced meters, are enhanced by enabling technologies such as smart thermostats that provide customers with timely information on electricity prices and consumption, and automate demand response by cycling equipment and/or changing set points. Allowing utility cost recovery for these investments and/or providing incentives to encourage such investments can be effective strategies to support the use of dynamic pricing. However, disseminating
Strongly Disagree
7% Disagree 10%
Neither Agree Nor Disagree
24%Agree 42%
Strongly Agree 17%

, 20147Arabian Journal of Business and Management Review (Nigerian Chapter) Vol. 2, No.
101
technology is not often sufficient to generate significant demand response. Providing technical assistance to help customers develop response strategies is also important. The problem is that in SA consumers, in general do not know what the market price of electricity is at any point in time, let alone how much the consumers would like to consume, or how their consumption patterns may change with changing market prices (Sioshansi, 2013: 419). Until recently there has not been cost effective technology to both measure consumption at 5-minute or hourly intervals; to date most electricity consumers have not been exposed to market prices, but have paid one flat rate for electricity regardless of the current market price in large measure due to technology limitations (Sioshansi, 2013: 419-420). In SA the residential consumers have not been afforded PRD because PRD leverages the availabiltity of cost effective smart grid technologies such as interval meters with two communications and automated responses to prices through appliance specific or building wide energy management systems that can receive price information and respond in an automated fashion to allow electricity consumers to see and respond to market prices for power(Sioshansi, 2013: 420).According to economics it is good to continuously adjust electricity prices as one of the mechanism of energy reduction strategies, because the aim is to reduce demand, but accrding to Sioshansi it does not make sense when using this strategy to continuously adjust electricity prices as one of the mechanism of energy reduction strategies when there is no metering (that deals with calculating and communicating with consumers regarding energy efficiency) in place in the residential properties. Shortage of electricity supply and its contribution to the gross domestic product. The aim of the questionnaire is to determine whether shortage of electricity supply has positive or negative contribution to the gross domestic supply. Figure 4.20: Does electricity shortage contribute positively to the gross domestic products (GDP)?
Results in Figure 4.20 indicate that 81% of the respondents disagreed (44% strongly disagreed and 37% disagreed), 17% were unsure while 2% agreed (2% agreed and 0% strongly agreed) that shortage of electricity supply has positively contribution to the gross domestic supply. The results revealed that majority of respondents do not agree that electricity shortage contribute positively to the gross domestic product. This study
Strongly Disagree
44%
Disagree 37%
Neither Agree Nor Disagree
17%
Agree 2%
Strongly Agree 0%

, 20147Arabian Journal of Business and Management Review (Nigerian Chapter) Vol. 2, No.
102
also revealed that the minority of the respondents (2%) agreed that electricity shortage contribute positively to the gross domestic product. Sioshansi (2013:446) said that the availability of high quality yet affordable electricity has been significant contributor to past productive improvements or improvement in GDP. Businesses can lose billions of rands if the power is out for only a few minutes (Sioshansi, 2013:456). There is a positive relationship between GDP and electricity consumption in Gauteng province. It further explains that the GDP of the economy of Gauteng province is highly connected/dependent to the electricity consumption. IN SA and other economies in the world they measure their economic growth using growth of GDP, therefore if GDP is affected by shortage of elecetricity, it also means our economy in Gauteng is affected. It is impossible to say the economy is growing while the GDP is not growing. There is a big connection/relationship between GDP (economy), prices and consumption. The arguments above agree that electricity shortage does not contribute positively to the gross domestic products (GDP). Figure 4.21: Does electricity shortage contribute negatively to the gross domestic products (GDP)?
Results in Figure 4.21 indicate that 3% of the respondents disagreed (3% strongly disagreed and 0% disagreed), 12% were unsure while 85% agreed (29% agreed and 56% strongly agreed) that shortage of electricity supply has negatively contribution to the gross domestic supply. Sioshansi (2013:446) said that the availability of high quality yet affordable electricity has been significant contributor to past productive improvements or improvement in GDP. Businesses can lose billions of rands if the power is out for only a few minutes (Sioshansi, 2013:456). Power/electricity shortage cause businesses billions of rands in Gauteng because it is difficult for businesses to improve productivity, as they are no longer able to offer high quality service because now their focus is to deal with customers complaints. Most of the respondents in figure 20 and 21 above agree with Sioshansi (2013: 231) mentioned that growth in GDP is a key driver of electricity consumption, or visa versa. 12% of the respondents were unsure because they agree with Sioshansi when he
Strongly Disagree
3%
Disagree 0%
Neither Agree Nor Disagree
12%
Agree 29%
Strongly Agree 56%

, 20147Arabian Journal of Business and Management Review (Nigerian Chapter) Vol. 2, No.
103
mentioned that it is possible to reduce electricity consumption without harming economic growth, or visa versa. This means that there is a positive relationship between GDP and electricity consumption in Gauteng province. It further explains that the GDP of the economy of Gauteng province is highly connected/dependent to the electricity consumption. Sioshansi (2013:233) also mentioned that growth of electricity consumption is a key driver to the growth of GDP, or visa versa. Therefore electricity shortage has negative impact to the growth of the GDP. Electricity price increase how it contributes to the inflation. The aim of the questionnaire is to determine whether electricity price increase contribute positively to the inflation. Figure 4.22: Will electricity price increase contribute positively to inflation?
Results in Figure 4.22 indicate that 46% of the respondents disagreed (22% strongly disagreed and 24% disagreed), 24% were unsure while 30% agreed (15% agreed and 15% strongly agreed) that electricity price increase contribute positively to the inflation. There are three major types of inflation, according to Robert J. Gordon (1988), and in his book it is called the "triangle model":
Demand-pull inflation is caused by increases in aggregate demand due to increased private and government spending, etc. Demand inflation encourages economic growth since the excess demand and favourable market conditions will stimulate investment and expansion. SA energy market has excess demand of electricity and it is sometimes argued that this excess demand might stimulate investors who are willing to invest in SA energy market and Eskom is looking for investors to fund its expansion programme.
Tim MCMahon of Inflation data.com said that inflation may affect electricity to a greater or lesser extent than normal commodities. This is because, utilities in most countries are “regulated monopolies” meaning that since it would be inefficient for one company to run wires to your house and a different company to run wires to your neighbour’s house, the government granted a monopoly to the local electric company to run wires to everyone’s house. But since having a monopoly would enable them to charge whatever they wanted, regulations require the utility to get approval for rate increases from a governing agency. Generally, the governing agency allows a certain profit margin and as costs rise they allow prices to rise equally.
Strongly Disagree
22%
Disagree 24%
Neither Agree Nor Disagree
24%
Agree 15%
Strongly Agree 15%

, 20147Arabian Journal of Business and Management Review (Nigerian Chapter) Vol. 2, No.
104
When electricity prices increase contributes positively to inflation, it will result to the following;
Labour-market adjustments: Nominal wages are slow to adjust downwards. This can lead to prolonged disequilibrium and high unemployment in the labour market. Since inflation allows real wages to fall even if nominal wages are kept constant, moderate inflation enables labor markets to reach equilibrium faster (Tobin, James:1969).
Room to maneuver: The primary tools for controlling the money supply are the ability to set the discount rate, the rate at which banks can borrow from the central bank, and open market operations, which are the central bank's interventions into the bonds market with the aim of affecting the nominal interest rate. If an economy finds itself in a recession with already low, or even zero, nominal interest rates, then the bank cannot cut these rates further (since negative nominal interest rates are impossible) in order to stimulate the economy – this situation is known as a liquidity trap. A moderate level of inflation tends to ensure that nominal interest rates stay sufficiently above zero so that if the need arises the bank can cut the nominal interest rate.
Mundell–Tobin effect: The Nobel laureate Robert Mundell noted that moderate inflation would induce savers to substitute lending for some money holding as a means to finance future spending. That substitution would cause market clearing real interest rates to fall. Mundell, James (1963: 280–83) said that the lower real rate of interest would induce more borrowing to finance investment. In a similar vein, Nobel laureate James Tobin noted that such inflation would cause businesses to substitute investment in physical capital (plant, equipment, and inventories) for money balances in their asset portfolios. That substitution would mean choosing the making of investments with lower rates of real return. (The rates of return are lower because the investments with higher rates of return were already being made before.) Tobin (1965: 671–84) said that the two related effects are known as the Mundell–Tobin effect. Unless the economy is already overinvesting according to models of economic growth theory, that extra investment resulting from the effect would be seen as positive.
Instability with deflation: Economist S.C. Tsaing noted that once substantial deflation is expected, two important effects will appear; both a result of money holding substituting for lending as a vehicle for saving, (Tsaing, 1969: 266–80). The first was that continually falling prices and the resulting incentive to hoard money will cause instability resulting from the likely increasing fear, while money hoards grow in value, that the value of those hoards are at risk, as people realize that a movement to trade those money hoards for real goods and assets will quickly drive those prices up. Any movement to spend those hoards "once started would become a tremendous avalanche, which could rampage for a long time before it would spend itself. Thus, a regime of long-term deflation is likely to be interrupted by periodic spikes of rapid inflation and consequent real economic disruptions. Moderate and stable inflation would avoid such a seesawing of price movements (Tsaing, 1969: 272).

, 20147Arabian Journal of Business and Management Review (Nigerian Chapter) Vol. 2, No.
105
Figure 4.23: Will electricity price increase contribute negatively to inflation?
Results in Figure 23 indicate that 8% of the respondents disagreed (5% strongly disagreed and 3% disagreed), 24% were unsure while 68% agreed (34% agreed and 34% strongly agreed) that electricity price increase contribute negatively to the inflation. Figure 4.22 and 4.23 explain that 68% of respondents agreed that increase in price of electricity has a negative impact on inflation. The responses agree that there is a positive relationship between price and inflation. The U.S.A data below agree with most respondents that electricity price increase affect inflation negatively, the more electricity prices increase the more inflation increase. The inflation adjusted price of electricity in 1990 measured in 2010 dollars was 13.06 cents per KWH. Figure 4.23.1
Residential Price(Cents per kwh)
Inflation Adj. Price in 2010 Dollars
1990 7.83 13.06 1991 8.04 12.87 1992 8.21 12.76 1993 8.32 12.56 1994 8.38 12.33 1995 8.40 12.02 1996 8.36 11.62 1997 8.43 11.45 1998 8.26 11.05 1999 8.16 10.68 2000 8.21 10.40 2001 8.55 10.53 2002 8.40 10.18 2003 8.68 10.29 2004 8.91 10.29 2005 9.40 10.50 2006 10.36 11.21 2007 10.59 11.14 2008 11.18 11.32 2009 11.43 11.62
Strongly Disagree
5%
Disagree 3%
Neither Agree Nor Disagree
24%
Agree 34%
Strongly Agree 34%

, 20147Arabian Journal of Business and Management Review (Nigerian Chapter) Vol. 2, No.
106
2010 11.44 11.44 Data Source: Electricity- U.S. Energy Information Administration (EIA) The data above give indication of residential electricity costs on a nationwide average basis from 1990 through 2010 have not kept up with inflation in U.S.A. This means that relative to everything else electricity prices have gone down. This does not mean that this is the case in all localities. Individual states and even local regions will differ. One thing that may have kept a lid on the Inflation Rate of Electricity during this period was the deregulation of electric companies allowing competition among electric suppliers. According to Taylor & Hall (1993); the inflation rate is widely calculated by calculating the movement or change in a price index, usually the consumer price index. The consumer price index measures movements in prices of a fixed basket of goods and services purchased by that type of consumer. The inflation rate is the percentage rate of change of a price index over time. The retail prices index is also a measure of inflation that is commonly used in the United Kingdom. It is broader than the CPI and contains a larger basket of goods and services (Mankiw, 2002: 22–32). For example, if in January 2007, the SA Consumer Price Index was 202.416, and in January 2008 it was 211.080. The formula for calculating the annual percentage rate inflation in the CPI over the course of 2007 is
The resulting inflation rate for the CPI in this one year period is 4.28%, meaning the general level of prices for SA consumers rose by approximately 4( four) percent in 2007. Wyplosz & Burda (1997) said that inflation is a persistent increase in the general price level of goods and services in an economy over a period of time. When the general price level rises, each unit of currency buys fewer goods and services. Paul H. Walgenbach (1973:429) inflation reflects a reduction in the purchasing power per unit of money – a loss of real value in the medium of exchange and unit of account within the economy. Mankiw (2002: 22-32) said that a chief measure of price inflation is the inflation rate, the annualized percentage change in a general price index (normally the consumer price index) over time. Inflation's effects on an economy are various and differ as per countries and economic policies those countries are using, and can be positive and negative very quickly. Negative effects of inflation include an increase in the opportunity cost of holding money, uncertainty over future inflation which may discourage investment and savings, and if inflation is rapid enough, shortages of goods as consumers begin hoarding out of concern that prices will increase in the future. Negative inflation is high or unpredictable inflation rates, and are regarded as harmful to an overall economy. Taylor, Timothy (2008) mentioned that uncertainty about the future purchasing power of money discourages investment and saving. Bulkley, George (March 1981) explain that inflation can impose hidden tax increases, as inflated earnings push taxpayers into higher income tax rates unless the tax brackets are indexed to inflation.

, 20147Arabian Journal of Business and Management Review (Nigerian Chapter) Vol. 2, No.
107
There can also be negative impacts to trade from an increased instability in currency exchange prices caused by unpredictable inflation, namely; Cost-push inflation, hoarding, social unrest and revolts, hyper inflation and allocative efficiency. Keynesian economics proposes that changes in money supply do not directly affect prices, and that visible inflation is the result of pressures in the economy expressing themselves in prices. There are three major types of inflation, according to Robert J. Gordon (1988), and in his book it is called the "triangle model":
Demand-pull inflation is caused by increases in aggregate demand due to increased private and government spending, etc. Demand inflation encourages economic growth since the excess demand and favourable market conditions will stimulate investment and expansion. SA energy market has excess demand of electricity and it is sometimes argued that this excess demand might stimulate investors who are willing to invest in SA energy market and Eskom is looking for investors to fund its expansion programme.
Cost-push inflation, also called "supply shock inflation," is caused by a drop in aggregate supply (potential output). This kind of inflation is what SA government is experiencing because of the shortage in supply of electricity, because Eskom can no longer keep up with increasing demand of electricity.
Built-in inflation is induced by adaptive expectations, and is often linked to the "price/wage spiral". It involves workers trying to keep their wages up with prices (above the rate of inflation), and firms passing these higher labour costs on to their customers as higher prices, leading to a 'vicious circle'. Built-in inflation reflects events in the past, and so might be seen as hangover inflation.
O'Sullivan, Arthur; Sheffrin, Steven M. (2003) said that demand-pull theory states that inflation accelerates when aggregate demand increases beyond the ability of the economy to produce (its potential output). Hence, any factor that increases aggregate demand can cause inflation. O'Sullivan, Arthur; Sheffrin, Steven M. (2003) further mention that in the long run, aggregate demand can be held above productive capacity only by increasing the quantity of money in circulation faster than the real growth rate of the economy. Electricity price increase how it contributes to the high unemployment rate The aim of the questionnaire is to determine whether electricity price increase contribute positively or negatively to the high unemployment rate. Figure 4.24: Does an electricity high price contribute negatively to high unemployment rate?
Strongly Disagree
2%
Disagree 15%
Neither Agree Nor Disagree
22%Agree 29%
Strongly Agree 32%

, 20147Arabian Journal of Business and Management Review (Nigerian Chapter) Vol. 2, No.
108
Results in Figure 4.24 and Table 4.24 indicate that 17% of the respondents disagreed (2% strongly disagreed and 15% disagreed), 22% were unsure while 61% agreed (29% agreed and 32% strongly agreed) that electricity price increase contribute negatively to the high unemployment rate. Electricity high prices will adjust labour market: for example: Nominal wages are slow to adjust downwards. This can lead to prolonged disequilibrium and high unemployment in the labour market (Tobin, James: 1969). Forbes.com mentions that most employers cannot simply raise prices to cover the higher minimum wage, particularly in the competitive services sector. And if they do increase prices, consumers will buy less or have less money to spend on other things, meaning fewer jobs. Figure 4.24
How electricity high price contributes to local economic development. The aim of the questionnaire is to determine whether electricity high price or increase contribute positively or negatively to the local economic development and spirit of entrepreneurship in Gauteng province. Figure 4.25: Does an electricity high price contribute negatively to local economic development?
Strongly Disagree
20%
Disagree 41%
Neither Agree Nor Disagree
20%
Agree 12%
Strongly Agree 7%
Strongly Disagree
3%
Disagree 17%
Neither Agree Nor Disagree
10%
Agree 24%
Strongly Agree 46%

, 20147Arabian Journal of Business and Management Review (Nigerian Chapter) Vol. 2, No.
109
Results in Figure 4.25 indicate that 20% of the respondents disagreed (3% strongly disagreed and 17% disagreed), 10% were unsure while 70% agreed (24% agreed and 46% strongly agreed) that electricity price increase or high price contributes negatively to the local economic development. There is a positive relationship between energy use, economic growth and development is complex and important. Changes in energy demand are affected by factors such as volume effects, which reflect changes in economic activity; changes in factor inputs in production; structural change resulting in changes in energy technology used; energy conservation, mainly through substitution of old appliances; and changes in average income, distribution and growth – factors that define change in poverty, inequality and growth; and so forth. Evidence suggests that inequality could slow growth, leading to a cycle of low productivity and poverty (Wolfensohn and Bourguignon, 2004). Figure 4.26: Does an electricity high price contribute positively to local economic development?
Results in Figure 4.26 indicate that 76% of the respondents disagreed (37% strongly disagreed and 39% disagreed), 17% were unsure while 7% agreed (5% agreed and 2% strongly agreed) that electricity price increase or high price contributes positively to the local economic development. Figure 4.27: Does an electricity high price contribute to the positive spirit of entrepreneurship in Gauteng Province?
Results in Figure 4.27 indicate that 84% of the respondents disagreed (42% strongly disagreed and 42% disagreed), 12% were unsure while 4% agreed (2% agreed and 2% strongly agreed) that electricity price increase or high price contributes positively to the spirit of entrepreneurship in Gauteng province.
Strongly Disagree
37%Disagree
39%
Neither Agree Nor Disagree
17%
Agree 5%
Strongly Agree
2%
Strongly Disagree
42%
Disagree 42%
Neither Agree Nor Disagree
12%
Agree 2%
Strongly Agree
2%

, 20147Arabian Journal of Business and Management Review (Nigerian Chapter) Vol. 2, No.
110
Entrepreneurs are also the back bone of the growth of any economy in the world, as long as they can cover their production costs and make profits at the same time. In SA electricity increases are not good because currently the country is experiencing high unemployment where the government keep on saying small business and private business have a vital role to play in reducing high unemployment rate. Increase in electricity prices makes it difficult for entrepreneurs to enter the market, and those in the market already it becomes very difficult for them to sustain their businesses. That is the reason 84% of respondents disagreed that electricity high price contribute to the positive spirit of entrepreneurship in Gauteng Province. How electricity high price contributes to high poverty rate currently experienced in Gauteng province. The aim of the questionnaire is to determine whether electricity high price or increase contributes to high unemployment rate currently experienced in Gauteng province. Figure 4.28: Does an electricity high price contribute to high poverty rate experienced currently in Gauteng Province?
Results in Figure 4.28 indicate that 5% of the respondents disagreed (0% strongly disagreed and 5% disagreed), 34% were unsure while 61% agreed (39% agreed and 22% strongly agreed) that electricity price increase or high price contributes to high poverty rate currently experienced in Gauteng province. There are many factors contributing to poverty except increase in electricity prices. Increase in electricity prices makes it difficult for entrepreneurs to enter the market, and those in the market already it becomes very difficult for them to sustain their businesses. Number one goal of every business model is to make profit. If the business profits start to reduce because of increase in electricity prices, the business will retrench or lay-off some of the employees in order to cover production costs or will exit the market and close down the whole business. How electricity high price affects consumer income spending. The aim of the questionnaire is to determine whether electricity high price or increase affects consumer income spending positively or negatively.
Strongly Disagree
0%
Disagree 5%
Neither Agree Nor Disagree
34%
Agree 39%
Strongly Agree 22%

, 20147Arabian Journal of Business and Management Review (Nigerian Chapter) Vol. 2, No.
111
Figure 4.29: Does an electricity high price affect positively consumer income spending?
Results in Figure 4.29 indicate that 68% of the respondents disagreed (29% strongly disagreed and 39% disagreed), 12% were unsure while 20% agreed (15% agreed and 5% strongly agreed) that electricity price increase or high price affects consumer income spending positively. When the price of goods and services increases because of electricity price increase, it will affect the consumer in a negative. For example: If Eskom decide to increase the price of electricity, the producer of goods and services will be affected negatively because production costs will increase. Because producer is a businessman his motive is to make profit he will pass the burden to the consumer. The consumer income will be negatively affected by the increase that will be imposed on goods and services by the producer. That is the reason 68% of respondents disagreed that electricity price increase or high price affects consumer income spending positively. Figure 4.30: Does an electricity high price affect negatively consumer income spending?
Results in Figure 4.30 indicate that 5% of the respondents disagreed (0% strongly disagreed and 5% disagreed), 5% were unsure while 90% agreed (32% agreed and 58% strongly agreed) that electricity price increase or high price affects consumer income spending negatively. When the price of goods and services increases because of electricity price increase, it will affect the consumer in a negative. For example: If Eskom decide to increase the price of electricity, the producer of goods and services will be affected negatively because production costs will increase. Because producer is a businessman his motive is to make profit he will pass the burden to the consumer. The consumer income will be negatively affected by the increase that will be imposed on goods and services by
Strongly Disagree
29%
Disagree 39%
Neither Agree Nor Disagree
12%
Agree 15%
Strongly Agree 5%
Strongly Disagree
0%
Disagree 5%
Neither Agree Nor Disagree
5%
Agree 32%Strongly
Agree 58%
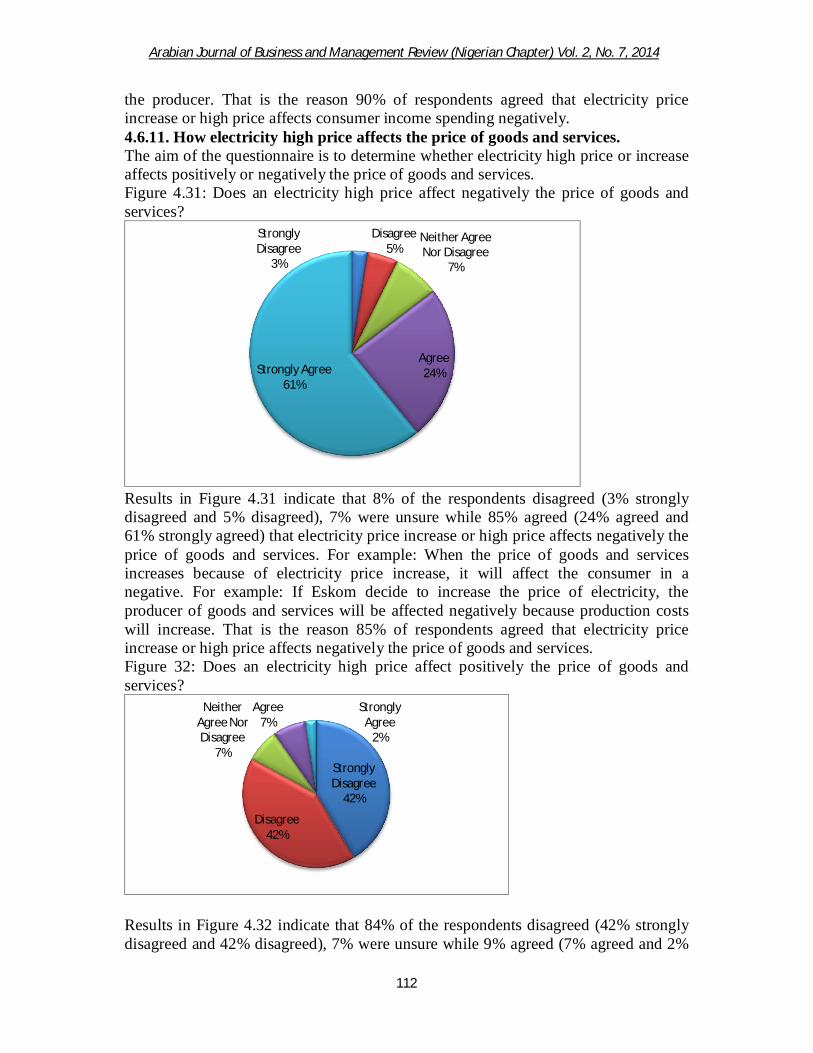
, 20147Arabian Journal of Business and Management Review (Nigerian Chapter) Vol. 2, No.
112
the producer. That is the reason 90% of respondents agreed that electricity price increase or high price affects consumer income spending negatively. 4.6.11. How electricity high price affects the price of goods and services. The aim of the questionnaire is to determine whether electricity high price or increase affects positively or negatively the price of goods and services. Figure 4.31: Does an electricity high price affect negatively the price of goods and services?
Results in Figure 4.31 indicate that 8% of the respondents disagreed (3% strongly disagreed and 5% disagreed), 7% were unsure while 85% agreed (24% agreed and 61% strongly agreed) that electricity price increase or high price affects negatively the price of goods and services. For example: When the price of goods and services increases because of electricity price increase, it will affect the consumer in a negative. For example: If Eskom decide to increase the price of electricity, the producer of goods and services will be affected negatively because production costs will increase. That is the reason 85% of respondents agreed that electricity price increase or high price affects negatively the price of goods and services. Figure 32: Does an electricity high price affect positively the price of goods and services?
Results in Figure 4.32 indicate that 84% of the respondents disagreed (42% strongly disagreed and 42% disagreed), 7% were unsure while 9% agreed (7% agreed and 2%
Strongly Disagree
3%
Disagree 5%
Neither Agree Nor Disagree
7%
Agree 24%Strongly Agree
61%
Strongly Disagree
42%
Disagree 42%
Neither Agree Nor Disagree
7%
Agree 7%
Strongly Agree
2%
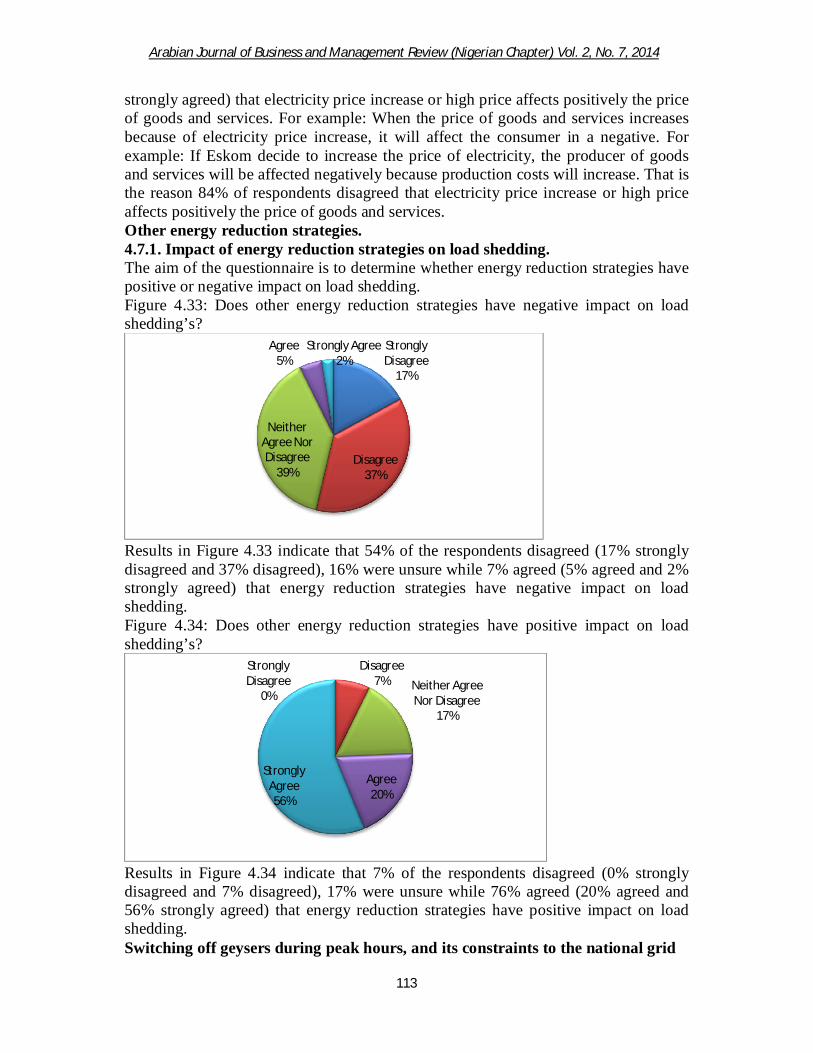
, 20147Arabian Journal of Business and Management Review (Nigerian Chapter) Vol. 2, No.
113
strongly agreed) that electricity price increase or high price affects positively the price of goods and services. For example: When the price of goods and services increases because of electricity price increase, it will affect the consumer in a negative. For example: If Eskom decide to increase the price of electricity, the producer of goods and services will be affected negatively because production costs will increase. That is the reason 84% of respondents disagreed that electricity price increase or high price affects positively the price of goods and services. Other energy reduction strategies. 4.7.1. Impact of energy reduction strategies on load shedding. The aim of the questionnaire is to determine whether energy reduction strategies have positive or negative impact on load shedding. Figure 4.33: Does other energy reduction strategies have negative impact on load shedding’s?
Results in Figure 4.33 indicate that 54% of the respondents disagreed (17% strongly disagreed and 37% disagreed), 16% were unsure while 7% agreed (5% agreed and 2% strongly agreed) that energy reduction strategies have negative impact on load shedding. Figure 4.34: Does other energy reduction strategies have positive impact on load shedding’s?
Results in Figure 4.34 indicate that 7% of the respondents disagreed (0% strongly disagreed and 7% disagreed), 17% were unsure while 76% agreed (20% agreed and 56% strongly agreed) that energy reduction strategies have positive impact on load shedding. Switching off geysers during peak hours, and its constraints to the national grid
Strongly Disagree
17%
Disagree 37%
Neither Agree Nor Disagree
39%
Agree 5%
Strongly Agree 2%
Strongly Disagree
0%
Disagree 7% Neither Agree
Nor Disagree 17%
Agree 20%
Strongly Agree 56%
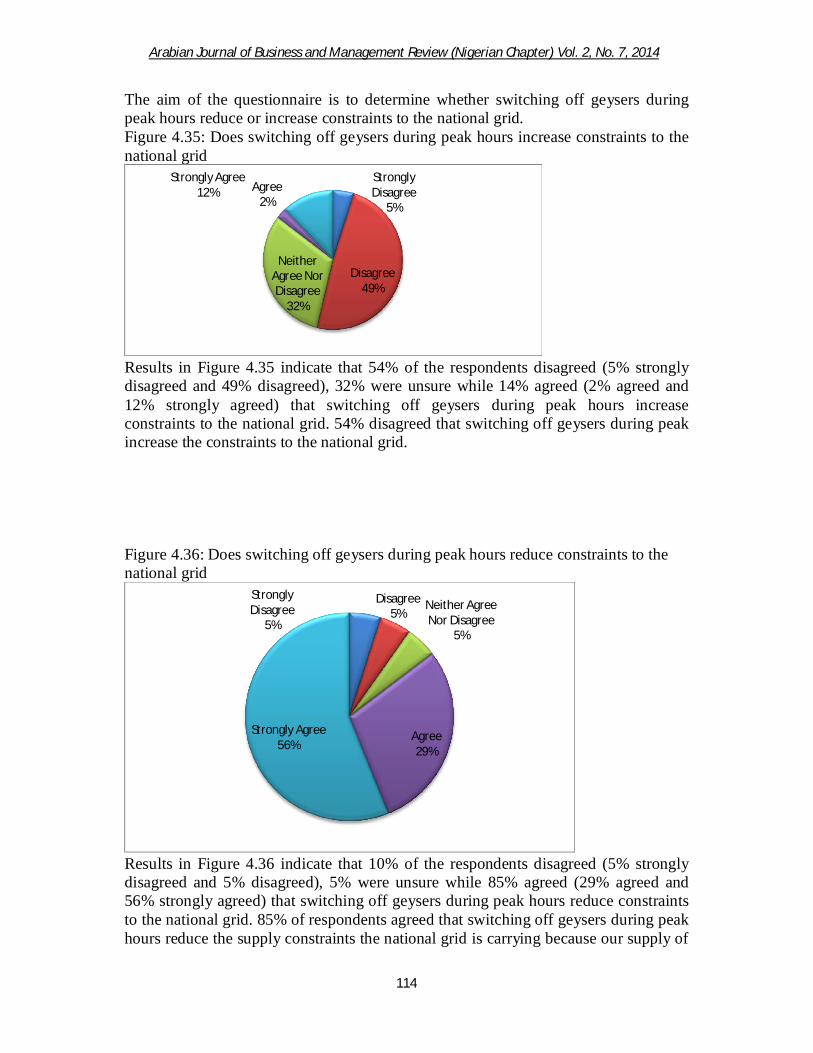
, 20147Arabian Journal of Business and Management Review (Nigerian Chapter) Vol. 2, No.
114
The aim of the questionnaire is to determine whether switching off geysers during peak hours reduce or increase constraints to the national grid. Figure 4.35: Does switching off geysers during peak hours increase constraints to the national grid
Results in Figure 4.35 indicate that 54% of the respondents disagreed (5% strongly disagreed and 49% disagreed), 32% were unsure while 14% agreed (2% agreed and 12% strongly agreed) that switching off geysers during peak hours increase constraints to the national grid. 54% disagreed that switching off geysers during peak increase the constraints to the national grid. Figure 4.36: Does switching off geysers during peak hours reduce constraints to the national grid
Results in Figure 4.36 indicate that 10% of the respondents disagreed (5% strongly disagreed and 5% disagreed), 5% were unsure while 85% agreed (29% agreed and 56% strongly agreed) that switching off geysers during peak hours reduce constraints to the national grid. 85% of respondents agreed that switching off geysers during peak hours reduce the supply constraints the national grid is carrying because our supply of
Strongly Disagree
5%
Disagree 49%
Neither Agree Nor Disagree
32%
Agree 2%
Strongly Agree 12%
Strongly Disagree
5%
Disagree 5%
Neither Agree Nor Disagree
5%
Agree 29%
Strongly Agree 56%

, 20147Arabian Journal of Business and Management Review (Nigerian Chapter) Vol. 2, No.
115
electricity has reached peak (Eskom can only supply up to 35-36 000 MW, not more than that), until the new power station which Eskom is currently building they are completed. The leading drivers of summer peak electricity demand are residential cooling, commercial heating, ventilation and air conditioning (HVAC), and commercial lighting. Inefficient home appliances, commercial refrigeration, and office plug loads represent additional opportunities for energy efficiency improvement. Eskom want replacement of inefficient lighting (with light-emitting diodes [LEDs] and compact fluorescent lamps [CFLs energy and water saving showerheads, flow restrictors, geyser timers, geyser blankets and load-control devices in households. But there is no legislation that bans the sale of LED and CFLs to the consumers on the market of SA, Eskom so far has already introduced numerous projects in order to assist in reducing the demand for electricity, and they are as follows:
Shower heads: The aim is to encourage consumers to replace their shower heads with energy efficient shower heads in order to save the water and energy. Eskom promotes the benefits of energy efficient shower heads that it use less water and electricity.
Heat pumps: The aim of the programme is to encourage the consumers that a best way to heat water efficiently while using electricity is through heat pumps. Where a geyser uses three units of electrical energy to produce three units of heat energy, a Heat Pump converts just one unit of electrical energy into three units of heat energy. The current heat pump programme only caters for the industrial and commercial sectors utilising the NERSA budget allowance and ESCO model process. The purpose of the residential heat pump rebate programme is to provide financial assistance to the residential market through a rebate, enabling individual customers to purchase energy efficient heat pumps at a rebated cost.
Geyser blankets: The aim of the programme is to reduce energy standing losses from domestic hot-water cylinders. The geyser blanket is wrapped around the geyser to ensure the hot water inside the geyser does not become too cold very soon.
Solar water heating: Currently the programme in SA is managed by Eskom and sponsored by Department of energy (DoE), because SA government has set a target for renewable energy to contribute 10 000 giga-watt hours (GWh) of final energy consumption by 2013. Solar water heating could contribute up to 23% towards this target. Solar power is one of the most effective renewable energy sources available. By implementing it in water heating, Eskom is targeting one of the most power-intensive household activities for maximum power saving effect. To actively encourage and promote the widespread implementation of solar water heating, Eskom has rolled out a large-scale solar water heating programme. This programme assist consumers when buying an SABS tested solar water heater to replace their conventional geysers. In addition to the rebate that the consumer will receive upon installation of solar water heating, many insurance companies are now allowing consumers to put their claim value towards a solar system or are offering solar water heaters as replacement in the event of a burst geyser.

, 20147Arabian Journal of Business and Management Review (Nigerian Chapter) Vol. 2, No.
116
(Information accessed from; www.eskom.co.za/idm on 30 October 2013) Switching off unused appliances, and its constraints to the national grid The aim of the questionnaire is to determine whether switching off unused appliances within the house reduces or increase constraints to the national grid. Figure 4.37: Does switching off other unused appliances within the house increase constraint to the national grid?
Results in Figure 4.37 indicate that 56% of the respondents disagreed (10% strongly disagreed and 46% disagreed), 32% were unsure while 12% agreed (0% agreed and 12% strongly agreed) that switching off unused appliances within the house increase constraints to the national grid. The more many appliances are plugged on is the more the national grid have more constraints, but when appliances are switched off it means the national grid does not have constraints. For example everyday after 19:30 news on SABC 1, consumers in SA are being encouraged to switch off all the unused appliances in their homes and at the same time are updated of the current state or situation in the national grid. 56% of respondents disagreed that switching off other unused appliances within the house increase constraint to the national grid. But if the consumer leaves the unused appliances plugged on it is increasing constraint to the national grid. Figure 4.38: Does switching off other unused appliances within the house reduce constraints to the national grid?
Strongly Disagree
10%
Disagree 46%
Neither Agree Nor Disagree
32%
Agree 0% Strongly
Agree 12%

, 20147Arabian Journal of Business and Management Review (Nigerian Chapter) Vol. 2, No.
117
Results in Figure 4.38 indicate that 8% of the respondents disagreed (3% strongly disagreed and 5% disagreed), 2% were unsure while 90% agreed (22% agreed and 68% strongly agreed) that switching off unused appliances within the house reduces constraints to the national grid. The more many appliances are plugged on is the more the national grid have more constraints, but when appliances are switched off it means the national grid does not have constraints. For example everyday after 19:30 news on SABC 1, consumers in SA are being encouraged to switch off all the unused appliances in their homes and at the same time are updated of the current state or situation in the national grid. 90% of respondents agreed that switching off other unused appliances within the house reduce constraints to the national grid. Eskom want replacement of inefficient lighting (with light-emitting diodes [LEDs] and compact fluorescent lamps [CFLs energy and water saving showerheads, flow restrictors, geyser timers, geyser blankets and load-control devices in households. But there is no legislation that bans the sale of LED and CFLs to the consumers on the market of SA The leading drivers of summer peak electricity demand are residential cooling, commercial heating, ventilation and air conditioning (HVAC), and commercial lighting. Inefficient home appliances, commercial refrigeration, and office plug loads represent additional opportunities for energy efficiency improvement. Mapako, Prasad (2005) from University of Cape Town in their study of Solar home system discovered the following;
SHS owners almost all cooked with wood (91%), with very limited use of gas and paraffin (6% and 3% respectively). The majority indicated they preferred to switch to grid electricity for cooking (77%) while 2% wanted to cook with solar
If 77% of respondents to their study preferred to cook using electricity, lets take for example the same 77% of respondents decide to switch off their appliances or use other means of cooking except electricity, it means the constraints will be reduced from the national grid, and the following will take place: 77% of electricity demand will be reduced from the national grid, therefore the
national grid must supply 77% less of electricity to the consumers.
Strongly Disagree
3%
Disagree 5%
Neither Agree Nor Disagree
2%
Agree 22%
Strongly Agree 68%
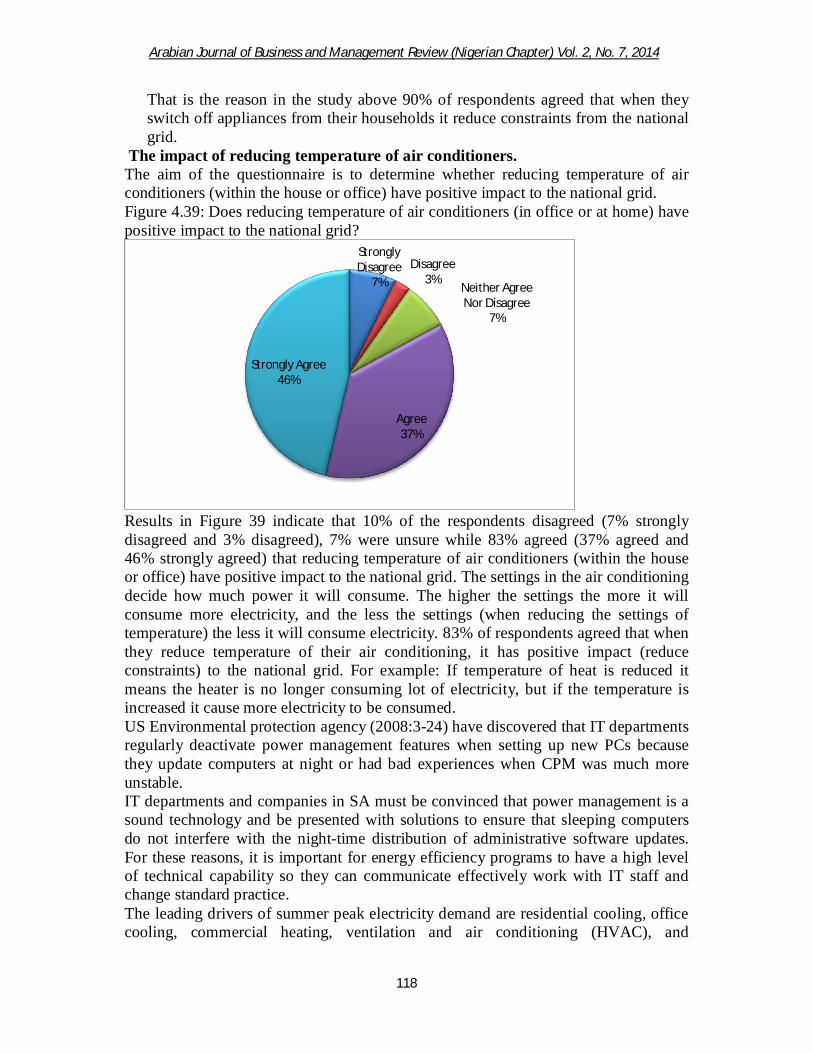
, 20147Arabian Journal of Business and Management Review (Nigerian Chapter) Vol. 2, No.
118
That is the reason in the study above 90% of respondents agreed that when they switch off appliances from their households it reduce constraints from the national grid.
The impact of reducing temperature of air conditioners. The aim of the questionnaire is to determine whether reducing temperature of air conditioners (within the house or office) have positive impact to the national grid. Figure 4.39: Does reducing temperature of air conditioners (in office or at home) have positive impact to the national grid?
Results in Figure 39 indicate that 10% of the respondents disagreed (7% strongly disagreed and 3% disagreed), 7% were unsure while 83% agreed (37% agreed and 46% strongly agreed) that reducing temperature of air conditioners (within the house or office) have positive impact to the national grid. The settings in the air conditioning decide how much power it will consume. The higher the settings the more it will consume more electricity, and the less the settings (when reducing the settings of temperature) the less it will consume electricity. 83% of respondents agreed that when they reduce temperature of their air conditioning, it has positive impact (reduce constraints) to the national grid. For example: If temperature of heat is reduced it means the heater is no longer consuming lot of electricity, but if the temperature is increased it cause more electricity to be consumed. US Environmental protection agency (2008:3-24) have discovered that IT departments regularly deactivate power management features when setting up new PCs because they update computers at night or had bad experiences when CPM was much more unstable. IT departments and companies in SA must be convinced that power management is a sound technology and be presented with solutions to ensure that sleeping computers do not interfere with the night-time distribution of administrative software updates. For these reasons, it is important for energy efficiency programs to have a high level of technical capability so they can communicate effectively work with IT staff and change standard practice. The leading drivers of summer peak electricity demand are residential cooling, office cooling, commercial heating, ventilation and air conditioning (HVAC), and
Strongly Disagree
7%Disagree
3%Neither Agree Nor Disagree
7%
Agree 37%
Strongly Agree 46%

, 20147Arabian Journal of Business and Management Review (Nigerian Chapter) Vol. 2, No.
119
commercial lighting. Inefficient home appliances, commercial refrigeration, and office plug loads represent additional opportunities for energy efficiency improvement. Public awareness regarding other energy reduction strategies. The aim of the questionnaire is to determine whether awareness or training regarding other energy reduction strategies will be beneficial to the public Figure 4.40: Will it be beneficial to the public to make awareness of other energy reduction strategies?
Results in Figure 4.40 indicate that 100% agreed (39% agreed and 61% strongly agreed) that awareness regarding other energy reduction strategies will be beneficial to the public. New York State Energy Research and Development Authority (2006) mentioned that energy efficiency programs can do more than just target and secure energy savings measured on a kilowatt hour (kWh) basis; they can also achieve peak demand reductions which are measured on a kilowatt (kW) basis. For energy efficiency programs to address emissions on HEDDs, it is important to focus programs on loads that are highly coincident with peak demand. Quantifying the peak demand impacts of energy efficiency programs presents a greater technical challenge than evaluating energy savings impacts. While electric bills provide energy use data for all customer classes on a kWh basis, time of use (TOU) meters and demand meters are not widely distributed across all customer classes. In particular, residential and small commercial customers typically lack electric demand and TOU meters, making quantification of peak demand impacts of energy efficiency measures more challenging. According to US Environmental protection agency (2008:3-15) said that barriers to home market performance program implementers need to consider local market conditions in their planning process, as there are several common barriers to address in program design and implementation. Common barriers and strategies for overcoming them include:
Contractor participation: In many markets there is a limited supply of qualified contractors with the skills to diagnose and market whole-house energy efficiency improvements. A key strategy to overcome this barrier is to help develop a local network of qualified professionals. Offering technical training to participating home improvement trade contractors is one place to start. Many program sponsors offer sales and business process training to help contractors succeed in selling and delivering home performance services.
Financing home improvements: The up-front cost to the homeowner of whole-house energy efficiency improvements is another common barrier. Several programs offer financing for home improvements. Cash rebates can also help
Strongly Disagree
0%
Disagree 0%
Neither Agree Nor Disagree
0%Agree 39%
Strongly Agree 61%

, 20147Arabian Journal of Business and Management Review (Nigerian Chapter) Vol. 2, No.
120
generate consumer interest in the program and offset some costs, especially when the rebates are contingent on the purchase of a comprehensive package of improvements from participating contractors.
Consumer awareness: Many homeowners are not aware that a whole-house assessment can uncover their home’s performance problems and identify improvements that, when made together, can greatly improve their home’s energy efficiency and comfort. Program administrators can use a variety of marketing and media activities to overcome this barrier.
Quality assurance: Quality assurance reassures homeowners that participating contractors will be held accountable for the work they perform. Following a quality assurance plan will help streamline delivery and avoid problems associated with contractor reporting. This plan will determine how and what information contractors will submit and how it will be reviewed, and these data will become the basis for the evaluation of program impacts (demand reduction, etc.).
Figure 4.41: Will public training in other energy reduction strategies raise more awareness to the consumers?
Results in Figure 4.41 indicate that 5% were unsure while 95% agreed (34% agreed and 61% strongly agreed) that training in other energy reduction strategies will raise more awareness to the consumers. New York State Energy Research and Development Authority (2006) mentioned that energy efficiency programs can do more than just target and secure energy savings measured on a kilowatt hour (kWh) basis; they can also achieve peak demand reductions which are measured on a kilowatt (kW) basis. For energy efficiency programs to address emissions on HEDDs, it is important to focus programs on loads that are highly coincident with peak demand. Quantifying the peak demand impacts of energy efficiency programs presents a greater technical challenge than evaluating energy savings impacts. While electric bills provide energy use data for all customer classes on a kWh basis, time of use (TOU) meters and demand meters are not widely distributed across all customer classes. In particular, residential and small commercial customers typically lack electric demand and TOU meters, making quantification of peak demand impacts of energy efficiency measures more challenging. Sioshansi (2013:593) mentioned that the average consumer doesn’t know what kilowatt-hours or therms are. When they receive the bill, customers don’t know whether using 200 kWh per month is high or low. There is a lot misconception about
Strongly Disagree
0%
Disagree 0%
Neither Agree Nor Disagree
5%
Agree 34%
Strongly Agree 61%

, 20147Arabian Journal of Business and Management Review (Nigerian Chapter) Vol. 2, No.
121
using energy. For example, 81% of people leave their heating or cooling system running when they are not at home, with a false belief that it takes more energy to them on and off rather than leaving the system running continuously. Sioshansi (2013:594-595) mentioned that public training will raise more awareness and change of behaviour to the consumers on how to use energy efficiently. US Environmental protection agency (2008:3-11) mentioned the following barriers, which are similar to consumers when it comes SA energy market where Eskom is operating, and they include: a) The adoption of energy efficiency technologies in the home building industry, Industry resistance to change and concerns with risk;
Cost decision making which ignores utility cost savings and improved comfort, durability and indoor air quality;
Lack of skills selling energy efficient homes; Lack of consumer awareness; and Lack of technical infrastructure for construction and verification.
According to US Environmental protection agency (2008:3-15) said that barriers to home market performance program implementers need to consider local market conditions in their planning process, as there are several common barriers to address in program design and implementation. Common barriers and strategies for overcoming them include:
Contractor participation: In many markets around the world has limited supply of qualified contractors with the skills to diagnose and market whole-house energy efficiency improvements. A key strategy to overcome this barrier is to help develop a local network of qualified professionals and to train consumers on energy reduction awareness. Offering technical training to participating home improvement trade contractors and consumers is one place to start. Many program sponsors offer sales and business process training to help contractors succeed in selling and delivering home performance services.
Consumer awareness: Many homeowners are not aware that a whole-house assessment can uncover their home’s performance problems and identify improvements that, when made together, can greatly improve their home’s energy efficiency and comfort. Program administrators can use a variety of marketing and media activities to overcome this barrier.
Quality assurance: The consumers must be taught or trained that quality assurance have to reassure homeowners that participating contractors must be held accountable for the work they perform. Following a quality assurance plan will help streamline delivery and avoid problems associated with contractor reporting. This plan will determine how and what information contractors will submit and how it will be reviewed, and these data will become the basis for the evaluation of program impacts (demand reduction, etc.).
Introducing energy saving education as part of extra mural activities. The aim of the questionnaire is to determine whether introducing energy saving education as part of extra mural activities (at primary and high schools) will be economically viable.

, 20147Arabian Journal of Business and Management Review (Nigerian Chapter) Vol. 2, No.
122
Figure 4.42: Will it be economically viable to introduce energy saving education as part of extra mural activities at high schools?
Results in Figure 4.42 indicate that 2% of the respondents disagreed (0% strongly disagreed and 2% disagreed), 5% were unsure while 93% agreed (34% agreed and 59% strongly agreed) that introducing energy saving education as part of extra mural activities (at high schools) will be economically viable. There is a proverb in a bible that says teach a child so that tomorrow the child can move on the same way you taught him. Education is the key because it raises awareness. Thus, 93% of the respondents agreed that it will be economically viable to introduce energy saving education as part of extra mural activities at high schools, because it will reduce the below mentioned barriers: US Environmental protection agency (2008) mentioned that customer barriers include the following:
Lack of information about clean energy opportunities, Lack of awareness of how existing clean energy programs make investments
easier, Lack of time and attention to evaluating and implementing clean energy
opportunities, and Lack of funding to invest in clean energy opportunities.
Figure 4.43: Will it be economically viable to introduce energy saving education as part of extra mural activities at primary schools?
Results in Figure 4.43 indicate that 3% of the respondents disagreed (0% strongly disagreed and 3% disagreed), 0% were unsure while 97% agreed (51% agreed and
Strongly Disagree
0%
Disagree 2%
Neither Agree Nor Disagree
5%
Agree 34%Strongly Agree
59%
Strongly Disagree
0%
Disagree 3%
Neither Agree Nor Disagree
0%
Agree 51%
Strongly Agree 46%

, 20147Arabian Journal of Business and Management Review (Nigerian Chapter) Vol. 2, No.
123
46% strongly agreed) that introducing energy saving education as part of extra mural activities (at primary schools) will be economically viable. Sioshansi (2013:596-597) agree with the majority of respondents in figure 4.42 and 4.43 that opening more channels of communications raise more awareness, and we must adopt to behavioural change that lead to energy savings. For example: Opower provides utility customers with personalised reports and compare their energy usage to their neighbours through variety of channels- on-line, text messages, smart phones, phone calls, introduced energy saving as part of extra mural activities at high schools and primary schools. They also delivered their targeted message through mail, and Opower was able to reach 99% of customers, including children, low income and senior households, and were able to measure the level of understanding regarding energy efficient from all their customers. US Environmental protection agency (2008) mentioned that customer barriers includes the following:
Lack of information about clean energy opportunities, Lack of awareness of how existing clean energy programs make investments
easier, Lack of time and attention to evaluating and implementing clean energy
opportunities, and Lack of funding to invest in clean energy opportunities.
Conclusion This chapter presented, analysed and discussed the research findings. Analysed data were presented in pie graphs. The study reflects that most respondents indicated that disequilibrium or shortage of electricity demand and supply is not good for economic growth and energy reduction strategies are helping to reduce constraints to the national grid. The findings were discussed and justified by theoretical support from relevant reviewed literature. The next chapter concludes the study and makes recommendations based on the findings from the secondary and primary research, and propose areas for further research. CONCLUSIONS AND RECOMMENDATIONS Findings from the Study Findings from the literature review and the primary study will be discussed under 5.2.1 and 5.2.2 respectively. Findings from the Literature Review Extensive review of relevant literature was done in order to evaluate factors leading to disequilibrium of electricity demand and supply, (and its impact to the economy) of Gauteng Province. However, only a summarized report is presented under this heading. The study has also touched on supply of electricity. Factors leading to disequilibrium of electricity demand and supply The adequacy of generation capability depends upon such factors as the installed capacity, unit size, plant reliability, demand forecasting error and the shape of the load curve. A reserve margin is a deterministic criterion and provides perhaps the simplest available measure of system security. However, it does not take account of generator unit size or the relative reliability of generating units on a system. The construction time of new power plant has a dramatic impact upon the level of uncertainty involved in generation planning. The longer the construction period, the

, 20147Arabian Journal of Business and Management Review (Nigerian Chapter) Vol. 2, No.
124
greater the uncertainty, due to such factors as demand forecasting error, performance of existing generating units, and uncertainty over the commissioning dates of new units. For example, the decision as to whether to proceed with a Combined Cycle Gas Turbine (CCGT) plant, with a relatively short construction time, or a coal fired plant, will have a significant impact upon the required plant margin in South Africa (Wilson and Adams:2006). Following the difficulties at Koeberg nuclear power station, the electricity supply and demand balance is extremely tight, particularly over the current winter peak demand season. Even with a resolution of the Koeberg problems, the national supply/demand balance is likely to remain tenuous during the next few years. Given Eskom’s key role in planning and managing supply security, it is therefore appropriate for the Department of Public Enterprise (DPE) to develop a position on security of supply, for both the immediate short-term following the Koeberg incidents and the medium to longer-term. In developing this DPE position, it is proposed to engage with Eskom, DME, NERSA and other relevant parties that have a responsibility for electricity supply security and energy policy. The security of an electricity system is affected by all elements of the supply chain – generation, transmission and distribution. The main focus of this study is on demand of electricity, but the study has also touched on supply side of electricity. Wilson and Adams (2006:14-17)said that the adequacy of generation capability depends upon such factors as the installed capacity, unit size, plant reliability, demand forecasting error and the shape of the load curve. The Reserve Margin is a deterministic criterion, which provides perhaps the simplest available measure of system security. However, it does not take explicit account of the fact that security is dependent upon underlying factors such as the size of individual generating units and the relative reliability of generating units on a system. As the reserve margin on a system is increased, the probability of failing to meet demand as a result of inadequate generation will fall. Due to the probabilistic nature of security of supply, it is only possible to provide an expectation of failing to meet demand. As load grows, the reserve margin is eroded, until such time as new plant is commissioned. The decision as to when new plant should be commissioned depends upon what reliability of supply is deemed to be appropriate. Increased reliability implies greater investment costs while reduced reliability results in an increased expectation of power shortages, which have an implied cost to customers. Appropriate reliability criteria are derived by balancing these two factors (Wilson and Adams, 2006:14). Wilson and Adams (2006) said that the construction time of new power plant has a dramatic impact upon the level of uncertainty involved in generation planning. The longer the construction period, the greater the uncertainty, due to such factors as demand forecasting error, performance of existing generating units and uncertainty over the commissioning dates of new generation units. For example, the decision as to whether to build a combined cycle gas turbine (CCGT) plant, with a relatively short construction time, or a coal fired plant, will have a significant impact upon the required plant margin in South Africa.

, 20147Arabian Journal of Business and Management Review (Nigerian Chapter) Vol. 2, No.
125
The supply problems during 2006 have highlighted, not only concerns about generation capacity in South Africa but also concerns about the adequacy of the transmission system to deliver power to all of South Africa’s regions. It has become apparent that although the transmission system is generally designed to be resilient to a single circuit outage, the transmission system does not meet this criterion in all regions (Wilson and Adams, 2006:14-17). Currently, however, there is lack of agreement, within the electricity industry, about the assumed level of economic growth that the industry is preparing to meet. This is not a good basis for planning. The problems experienced with the availability of the Koeberg power plant have demonstrated very clearly that, with the generation and transmission infrastructure that is currently available in South Africa, the loss of a single 900MW generating unit at the Koeberg station for any extended period during the winter months results in Eskom being unable to meet customer demand in the Western Cape. This illustrates clearly that the security of electricity supply in South Africa is currently at risk from a single (albeit low probability) event. Over the past 10 years the reserve margin has fallen very significantly as a result of growth in electricity demand of around 3% per annum (which equates to approximately 1,000MW of additional peak demand each year) and the very limited amount of new generating plant that has been commissioned. However, the monitoring of reserve margin is inadequate and inconsistent. There is no agreement between NERSA and Eskom on whether to include demand-side management (DSM) measures as part of demand or as a supply-side option and there is lack of clarity concerning the distinction between the reserve margin adopted for long-term planning purposes and that used for short-term operational purposes (Wilson and Adams, 2006:14-16). Currently, Eskom operates most of the generation and transmission facilities in South Africa and has a de facto obligation to maintain security of supply at the wholesale level (i.e. generation and transmission). Distribution is undertaken by both the Municipalities and by Eskom. Wilson and Adams (2006) further explained that the adequacy of a power system relates to the existence of a system capable of satisfying customers' demand throughout the year. A power system comprises facilities necessary to generate energy, together with the associated transmission and distribution systems to transport the energy to the customer. The generation, transmission and distribution systems all impact upon the supply quality to the customer and outages on any of these components can result in interruptions to customer supply. Failures of generation or transmission are important because such failures can affect large sections of the system and therefore can have widespread consequences. Failures in distribution systems, although much more frequent (particularly for rural customers), have much more localised effects. The South African economy produces and uses a large amount of energy, is highly energy-intensive, and is heavily dominated by the extraction of raw materials and primary processing. The energy sector contributes 15% to Gross Domestic Product (GDP), and employs a labour force of over 250 000 (Nkomo:2005). Energy provision and use are crucial to South Africa’s overall development, especially given the desire to attract foreign investment in the industrial sector. The demand for

, 20147Arabian Journal of Business and Management Review (Nigerian Chapter) Vol. 2, No.
126
energy is expected to grow, with the energy sector remaining of central importance to the country’s economic growth. The industrial sector (industry and mining) accounts for the largest proportion, 45%, of energy consumed (SANEA, 2003). Industries can be assumed to choose energy inputs to minimise the total cost of energy subject to energy-burning appliances. Technologies differ across industries and so is the nature of their energy demand. Energy consumption levels and energy intensity, particularly of electricity, are high compared to all of Africa and of the world average. Large industrial consumers of electricity are gold production, because of declining ore grades and mines therefore going deeper, and non-ferrous metals. Coal is the main energy source for the following industries: iron and steel, chemicals (it is used as feedstock), non-metallic minerals (where coal is mainly burnt in clamp kilns), pulp and paper (which rely heavily on the black liquor to produce most of their energy requirements), food, tobacco, and beverages. Coal-based industries have low energy conversion efficiencies compared with oil, gas and hydro plants (Eberhard & van Horen, 1995). Nkomo (2005) from University of Cape Town further mentioned that residential energy demand is complex and is often explained in terms of both the ‘transition’ and ‘ladder’ concepts, representing the positions of households and their transition from low-cost high emission non-commercial forms of energy (for example, wood and coal) to much costlier modern or less polluting commercial fuels like electricity. Household fuel/energy choice is influenced by a wide range of factors such as educational levels, the degree of mobility and the length of time urbanised (Viljoen, 1990), the relative availability (or access) of fuels, income and affordability of energy resources (Eberhard & van Horen (1995), and cultural preferences. The phenomenon of multi-fuel use, however, is widespread, with households selecting fuels for different end-uses, as well as using more than a single fuel for the same end-use. Relative to other groups, poor urban households (people staying in shacks around Gauteng province) have fewer energy options. Primary sources for low income households are paraffin and candles, and to a lesser extent, liquefied petroleum gas (LPG), and wood fuel. Their consumption of electricity is low, although it is preferred for reasons of convenience, cleanliness and better light quality. When it comes to Eskom Electricity tariffs, Nkomo (2005) mentioned that Eskom sells electricity to distributors who then resell to residential consumers, commerce and industry. The average price, per kilowatt-hour, is no longer the cheapest in the world as compared to the year 2007. This is attributable to several factors such as: • Access to large resources of low-grade coal and use of technologies that
maximise economies of scale. To add to this, power stations are located near coal mines and enjoy the benefits of long-term contracts, but this is no longer a benefit to people living in Gauteng province and the rest of South Africa.
• Overcapacity from power stations, which are already paid for. Previously this reduced Eskom’s finance costs and enabled it to peg electricity prices at a low marginal cost. But the new build programme which Eskom has been currently undertaken has increased Eskom finance costs and is one of the reason Eskom is increasing its tariffs.
, 20147Arabian Journal of Business and Management Review (Nigerian Chapter) Vol. 2, No.
127
• Eskom’s investment has been subsidised through the Reserve Bank forward cover thus protecting Eskom against exchange rate fluctuations. Further financial benefits are that Eskom is exempted from taxation and dividends.
• Ultimately, the price of electricity does not reflect economic costs, the long term costs of increasing capacity, and excludes the externality costs. Undoubtedly, the high tariffs destroy the local industries competitive advantage and drive away new investment within our economy. For example, the manufacturing and mining sectors are linked through beneficiation and metals production (Spalding-Fecher: 2002). These activities are energy–intensive, and rely on low prices for coal and electricity, which, in turn, have contributed to the development of an energy-intensive primary sector. Electricity price increases have gone above or equal inflation since 2013, Eskom allowed prices to rise in real terms, so as to earn an acceptable rate of return on capital invested and ensure sufficient generation of dividends and interest. But this raises the problem of affordability by poorer households, especially given the government’s commitment to making electricity accessible to all its citizens. Price of electricity in SA has increased very high or equivalent to the developed countries like USA, providing a bad foundation for economic growth, and it has a negative impact in promoting poor households’ access to affordable electricity services. Energy efficiency standards not only in Gauteng Province (but the rest of SA) are generally lacking. Even given benefits of energy efficiency, most of the standards have not been implemented because of high-cost energy supply in coal, lack of public awareness, the unaffordability of appliances, and the inadequate long-term policies and absence of codes and standards. Energy pricing, particularly electricity pricing, deserves more attention. Electricity is generated from coal of low quality, and its price does not account for the environmental externality of this resource. The full cost of producing electricity is lower than that borne by Eskom, and the external costs are borne by society or consumers. However, high prices does not benefit the poor consumers, South Africa is no longer having a comparative advantage when it comes to price of electricity. Incentive for energy intensive mainly exports oriented industries, and provide a subsidy to foreign markets. But the high price of coal has not promoted incentives for investments in both energy efficient technologies and renewable energy. Energy governance should be improved by clarifying the roles of various government institutions, and making them accountable, transparent, and representative of the population – particularly of the previously disadvantaged groups. Economic and social losses from poor energy sector governance manifest themselves in through: misdirection of growth (through subsidies) and losses of growth; continued economic, social and gender inequalities; negative environmental impacts and high direct consumption subsidies. Greater energy efficiency will also yield potential financial and environmental benefits to industry, commerce and mining sectors, with industry becoming more internationally competitive. SANEA (2003) estimates that greater energy efficiency could save between 10 and 20% of current consumption. This, in turn, would lead to an increase of between 1.5 and 3% in the GDP. But to achieve this, a solution has to be sought to critical barriers in the uptake

, 20147Arabian Journal of Business and Management Review (Nigerian Chapter) Vol. 2, No.
128
of such technologies such as inappropriate economic signals, lack of awareness, and the high capital costs. In order for Eskom and Gauteng government to achieve sustainable behaviour change at scale, to succeed the solution has to be affordable, actionable, reliable and measurable: Affordable-: for example: while others were trying to convince customers to adopt some sort of new energy monitoring device in the home, Opower focused on leveraging information that the utility already has, and delivering it through channels they already use; online through email (Sioshansi, 2013:597). Reliable-: for example: Utilities already have the data on how people use energyand can establish customer relationship. The challenge is how to best partner with utilities to make home energy reporting a big part of engaging customers with better energy services (Sioshansi, 2013:597). Actionable-: for example: Most of the people do not spend a lot of time thinking about energy use. Sioshansi (2013:598) further mentioned that higher levels of customer engagement lead to reduced customer attrition, increased customer acquisition, and expanded margins. These benefits are highly valuable in the banking, telecom and consumer products industries, but were regarded as irrelevant for regulated utilities that have service territory monopolies. Historically or previously there was not much need for strong customer engagement, as long as the utility kept the power on and customers paid their bills. That type of relationship between customers and utility were very minimal. Conclusion If the goal of Eskom is reduce demand of electricity by improving energy intensity, all sectors which are actively consuming electricity a proper plan must be developed in order to reduce demand and to be efficient in electricity consumption in these sectors, the following steps must be taken and formalised: First formal legislation is fundamental, to regulate DR policies, and not to impose regulations to consumers and industries. Second setting the correct incentives is critical. Improving energy efficiency usually requires additional investment is the main barrier that makes industries hesitates. Incentives scheme should be provided by the government (not utility Eskom) in the form of direct subsidies as well as tax alleviation to investments that aim at improving energy efficiency and reduction. Many ASEAN economies provide subsidies to either fuel or electricity (Sioshansi, 2013:242). Thirdly, energy efficient technologies and energy efficient operational improvements are very important. Our government of SA must invest a lot in energy related technologies, provide technical services to Small medium enterprises (it must not be left as a responsibility of Eskom), conduct energy audits and provide suggested solutions regarding energy efficient and reduction. Gauteng and SA companies must be encouraged by our government to implement total quality control (TQM) system to achieve operational improvements and reduce or conserve energy. Fourth, energy efficiency labelling for home appliances and other consumer products is useful in both improving public awareness and disseminating necessary information to the consumers. It must not only be responsibility of Eskom, but the government of Gauteng and SA should launch energy conservation campaigns from time to time.

, 20147Arabian Journal of Business and Management Review (Nigerian Chapter) Vol. 2, No.
129
Improved public awareness on energy efficiency and reduction may even push industry associations to initiate voluntary energy efficient and reduction programs. Gauteng government must learn from country like Singapore where their parliament in 2012 passed they a New Energy Conservation Bill, the bill introduced mandatory energy management practices for large energy users in industrial and commercial sectors. The Bill defines those that consume more than 15GWh (gigawatt hour) of energy equivalent each year as large users to appoint an energy manager. Singapore in numerous occasion consulted large energy users in industrial and transport sectors on the energy management best practices to be mandated in process of legislation formation (Sioshansi, 2013:243-244). Mandatory energy management it will improve Gauteng province efficiency in electricity consumption. Eskom and Gauteng province must focus on raising more energy awareness, building capabilities, and incentivizing the adoption of energy efficiency or reduction programmes. To formally introduce incentives to improve energy efficiency, Eskom, Gauteng government and all government agencies must come together to establish an Energy Efficient Programme Office (EEPO) consisting of all participants from residential, industrial, agricultural and commercial sectors. Recommendations Eskom goals, strategies, and technologies must be highly dependent on customer acceptance and action. Energy efficiency and peak reduction programs, smart grid infrastructure and time differentiated rates in order to succeed there must be high level of trust, awareness and involvement from customers. Relationship that is only based on nothing more than monthly bill payment will not succeed. In order for Eskom that succeed and compete successfully with best utilities in the world it must engage more with customers, and consider customers as partners in order to manage energy usage and cost. Customer engagement is a combination of emotion and behaviour. Eskom must measure its cutomer engagement through the following ways; • Home energy activity. For example: what customers do • Trust in the utility. For example: how customers feel. Eskom must consider its customers in four different groups in order to asses readiness and willingness of customers to engage with them, namely; a) Passive • Generally unaware or uninterested in energy issues. • Don’t respond to communications • May not have trust in the utility. • Unlikely to engage unless a serious problem or surprises arises. b) Independently active • Moderate to highly aware and active with energy issues. • May be taking important actions to manage energy usage independently of utility programs or advice. • Skeptical and possibly very mistrustful of the utility. • Potential for vocal opposition of utility programs c) Slightly engaged with the utility • Care at least a little about energy usage. • Have moderate level of trust in the utility. • May already been taking some actions to manage usage.

, 20147Arabian Journal of Business and Management Review (Nigerian Chapter) Vol. 2, No.
130
• Good prospects for utility programs and increased engagements, but unlikely to make major investments. d) Highly engaged with the utility • This is small group of people who are both highly energy aware and active, and highly trusting of the utility. For Eskom to implement demand response programme (pay customer to reduce energy) successfully in SA, the goals of the programme must be dependent on customer awareness and involvement. These goals must include energy efficiency, peak reduction, smart meter acceptance, and customer satisfaction. In some instances Eskom must formalise these goals in performance based regulation. Motivating customers to manage and reduce their energy consumption is very important for utilities. Historic participation in residential efficiency programs are very low and even awareness programs are very minimum. The fundamental problem is that any amount of marketing will fall short of its goals if customers are not ready and willingly to engage. Engaged customers can be motivated to sustainably reduce their energy consumption through informative messaging and other forms of communication and trainings (Sioshansi, 2013:602-603). Thermostat depends on how frequently and deeply a user sets back the temperature. It also need monitoring, feedback, better coaching in the initial setup, an information gap between the capabilities of the device and the user, therefore without customer engagement, willingness and trust the programme will not succeed or yield expected results. It is the same with pricing or giving incentives to consumers who reduce energy usage, without some the level of customer interest and trust, these pricing plans or customer incentives are unlikely to drive important shifts or reductions in peak consumption, and it is more highly likely that Eskom will face a backlash from upset and confused customers. Peak energy reductions programs will only be successful through customer engagement. According to US Environmental protection agency (2008:ES2-3), the clean energy opportunities discussed in this study remain underutilized as an energy resource and as an emissions reduction strategy. Cross-cutting state policies that support clean energy development, and Gauteng province must learn from US Environmental protection by doing the following:
Establishing quantitative and enforceable goals for energy efficiency, renewable energy, and/or CHP through energy portfolio standards. SA government must learn from USA when it comes to implementation energy efficiency/renewable policies.
That Eskom and the government of Gauteng province must Lead by example by establishing guidelines for government agencies to follow. Example guidelines include building energy performance standards, energy efficiency procurement policies, and renewable energy purchase requirements.
Gauteng province along with the government of SA must offer tax incentives to promote clean energy investment through personal or corporate income tax credits, tax reductions or exemptions, or tax deductions.

, 20147Arabian Journal of Business and Management Review (Nigerian Chapter) Vol. 2, No.
131
Gauteng province and the government of SA must create clean energy funding mechanisms such as public benefits funds that entail a small per-kWh charge on customer electric bills to fund grants, loans, rebates, technical assistance, and other strategies for enhancing clean energy investment, where cost effective.
Gauteng province along with the government of SA must analyse opportunities remain underutilized as an energy resource and as an emissions reduction strategy. There must be cross-cutting state policies that support clean energy development.
Gauteng province along with the government of SA must establish quantitative and enforceable goals for energy efficiency, renewable energy, and/or CHP through energy portfolio standards.
Department of energy; department of minerals; and department of public enterprises in SA must lead by example by establishing guidelines for government agencies to follow. For example guidelines must include building energy performance standards, energy efficiency procurement policies, and renewable energy purchase requirements.
Gauteng province along with the government of SA must offer tax incentives to promote clean energy investment through personal or corporate income tax credits, tax reductions or exemptions, or tax deductions.
Gauteng province along with the government of SA (including South African Revenue Services (SARS)) must create clean energy funding mechanisms such as public benefits funds that entail a small per-kWh charge on customer electric bills to fund grants, loans, rebates, technical assistance, and other strategies for enhancing clean energy investment, where cost effective.
Department of public enterprise; and energy must help develop regulatory incentive structures to promote utility investment in clean energy programs, such as mechanisms for program cost recovery, revenue stability, and performance-based incentives.
Eskom and SA government must facilitate deployment of advanced metering infrastructure to support dynamic pricing for retail electric customers.
Eskom must incorporate energy efficiency as an important resource into utility resource planning, along with supply-side resources.
Eskom must include evaluation measurement and verification (EM&V) as an essential part of energy efficiency program design that documents the results, benefits, and lessons learned from an energy efficiency program. EM&V can be used for planning future programs, for determining the value and potential of energy efficiency, and for retrospectively determining the performance (and payments, incentives, and/or penalties) of those responsible for implementing efficiency programs.

, 20147Arabian Journal of Business and Management Review (Nigerian Chapter) Vol. 2, No.
132
Eskom along with government of SA must always conduct energy efficiency potential studies as an effective tool for building the policy case for energy efficiency and other clean energy technologies as an alternative to supply side resources.
It is also important to leverage the relationships that exist between the clean energy opportunities addressed in this chapter. For example, greater environmental benefits can be captured through demand response initiatives if grid power is offset with low-emissions onsite power generating technologies such as CHP and PV, rather than fossil fuel-fired backup generators. The problem with South Africa energy industry is that there is no effective clean energy strategy that might employ multiple policy-level best practice approaches, also SA energy market don’t have coordinated action on the part of state, legislatures, and utility regulator (NERSA), and support from a variety of stakeholders is not yet clear. Eskom is expected to come with the best practices and policies regarding clean energy, energy efficiency and demand response, and it is difficult without clear direction and more support from the SA government. Capacity is required to meet future demand economically and at an acceptable level of reliability. Generation adequacy is usually assessed by determining the likelihood of there being sufficient generation to meet customer demand, or in other words, by calculating the risk of supply shortages occurring. The risk of supply shortages can be calculated by using statistical techniques to determine the probability that demand will exceed supply. According to Wilson and Adams (2006:15) the installed capacity on a power system must exceed the expected demand to allow for such factors as generator breakdown, severe weather, demand forecast uncertainty and transmission problems that could result in a loss of generation. This additional capacity is known as reserve capacity. The ratio of reserve capacity to load is known as the reserve margin. The reserve margin is usually expressed as a percentage of the annual peak demand. Reserve margin = (installed capacity – maximum demand)/maximum demand x 100%) In planning South Africa’s future generation requirements, there is a need to determine what system capacity is required to meet the future demand economically and at an acceptable level of reliability. However, at present, there is no explicitly defined generation security standard in South Africa. In delivering an overall level of security to customers in is necessary to achieve an appropriate balance between expenditure on generation, transmission and distribution facilities. Typically for any given power system, there are defined levels of security associated with different magnitudes of demand to be supplied. The larger the load supplied the greater the level of security that is required to meet planning standards. Given the widely varying costs that can be involved in securing a given size of load, it may be appropriate in certain specific circumstances to relax the level of security if the associated costs are considered excessive. However, the international practice in such circumstances is to have a specific derogation from the security standards. When it comes to determining reserve margin a combination of a probabilistic and deterministic approach is adopted. The N-k rule determines the maximum accepted risk level. Where the extent of an outage is deemed to be unacceptable in terms of the consequences (measured as a proportion of the system affected), preventive measures

, 20147Arabian Journal of Business and Management Review (Nigerian Chapter) Vol. 2, No.
133
are taken, if necessary, even if they are costly. Otherwise, where the extent of the outage is deemed to be an acceptable risk, the implementation of preventive measures must be the result of technical and economic analysis (Wilson and Adams, 2006:22). It is also advisable for municipalities to enforce energy efficiency measures on new property developments both in commercial and residential buildings. Below are the recommendations on energy efficiency strategies as per different industries in order to help reduce demand for electricity and pressure from Eskom national grid, and they are as follows: Commercial Industry a) Office buildings
Complete dishwashing and housekeeping activities before or after an event. Turn off or turn down boilers, pumps, fans and equipment not in use, especially
in printing facilities. Turn off excess elevators banks and escalators (as permitted). Turn off or turn down chillers, and reset chilled water temperature. Adjust variable speed drive controls to reduce load from fans, pumps and
chillers. Apply ventilation control-temporarily reducing outside air flow can help reduce
cooling demand. Information accessed from; www.enernoc.com on 16 October 2013 b) Warehouses
Turn off all unnecessary warehouse lighting, and dim lighting where possible. Charge batteries and battery operated equipment before or after an event. Schedule non-essential operations before or after an event. Apply ventilation control-temporarily reducing outside air flow can help reduce
cooling demand. c) Health Care: Hospitals and medical buildings
Reduce use of non-essential testing and diagnostic equipment. Conduct dishwashing, housekeeping, waste processing and laundry activities
before or after an event. Turn off all non-essential food preparation equipment not in use.
d) Hospitality Turn off decorative lighting, fountains, saunas, pools, hot tubs and exercise
equipment. Complete dishwashing, housekeeping and laundry before or after an event. Turn off excess elevator banks and escalators (as permitted).
e) Schools Turn off pool heating and pumps. Turn off food service equipment, non-essential office equipment, excess
elevators and escalators (as permitted) Complete dishwashing, housekeeping and laundry before or after an event.
f) High Tech: i) Server rooms and data centres
Leverage ’power capping’ software or slow down workloads during an event.

, 20147Arabian Journal of Business and Management Review (Nigerian Chapter) Vol. 2, No.
134
Use Cassatt, VMware or other software applications to maximise server workload.
Power down servers that are not needed. Turn off extra elevators or escalators (as permitted). Reschedule server maintenance to occur before or after an event.
Information accessed from; www.enernoc.com on 16 October 2013 ii) Manufacturing plants
Turn off all non-essentials process and pumping equipment. Reduce or reschedule production. Curtail process loads that can be served by generators or alternative fuels. Schedule testing before or after an event. Stockpile inventory prior to an event, then stock production during an event. Produce extra product a day ahead, and do packaging on event day.
g) Biotech Turn off all non-essentials process and pumping equipment. Shut down or cycle air compressors, air handlers and ventilation systems. Turn off or turn down chillers, and reset chilled water temperature. Adjust variable speed drive controls to reduce load from fans, pumps and
chillers. Curtail process loads that can be served by generators or alternative fuels Produce extra product a day ahead, and do packaging on event day.
h) Retail i) Small retailers and restaurants
Turn off excess cash registers and computers. Shut doors and windows to pre-cool, then turn off air conditioners during an
event. Perform housekeeping-related tasks before or after an event.
ii) Product retailers (in addition to the above) Reduce lighting and decrease air conditioning in back office and unused
spaces. Turn off excess elevators and escalators (as permitted).
iii) Grocery retailers (in addition to the above) Delay use of electric resistance defrosts controls and use of anti-sweat heaters. Shift use of electrically operated equipment before or after an event. Back store refrigerated storage and refrigerant compressors can be turned
down, cycled or turned off, and may safely float for hours with little temperature change.
Agriculture and food processing a) Food processing
Shut down or cycle air compressors, air handlers and ventilation system. Turn off or down chillers, and reset chilled water temperature. Adjust variable speed drive controls to reduce load from fans, pumps and
chillers.

, 20147Arabian Journal of Business and Management Review (Nigerian Chapter) Vol. 2, No.
135
Turn down, turn off or cycle blowers, pump motors and any other air circulation motors.
Pre-cool, then float or cycle refrigeration. Reduce or reschedule production.
b) Dairies Pre-cool, then float or cycle refrigeration. Shift irrigation tasks to take place before or after an event. Instead of running at full operation, conduct only certain processes and delay
the rest until after the event or the next day. Turn off barn and yard lights.
c) Industrial refrigeration Pre-cool, then float or cycle refrigeration. Certain products can safely float for
hours. Turn down, turn off or cycle evaporator and condenser fans, some or all
compressors and all non-essential motors. Alternate cooling methods between cold storage areas to lower simultaneous
demand. d) Wineries
Turn off or turn down chillers, and reset chilled water temperature. Move batch and continuous processes to either before or after an event or to
another day. Decrease use of aerators during an event.
Information accessed from; www.enernoc.com on 16 October 2013 Industrial a) Manufacturing
Reduce or reschedule production to avoid unnecessary use of compressed air. Reduce or reschedule production. Pre-cool, then float or cycle refrigeration. Produce extra product day ahead, and do packaging only on the event day. Reduce loads from fans, pumps and chillers.
b) Water and wastewater treatment. Shut off all or most pumps during and after an event. Pump water into storage tanks prior to an event, and use this water during an
event. Shut off operations completely during an event. Decrease use of aerators during an event.
Information accessed from; www.enernoc.com on 16 October 2013 Residential Sector New homes: Promotes energy-efficient new home construction. Home performance: Provides comprehensive energy efficiency improvement for existing homes. Quality HVAC Installation & Maintenance: Promotes proper sizing, installation, and maintenance practices for residential AC. Appliance Recycling: Facilitates removal and recycling of inefficient home appliances.
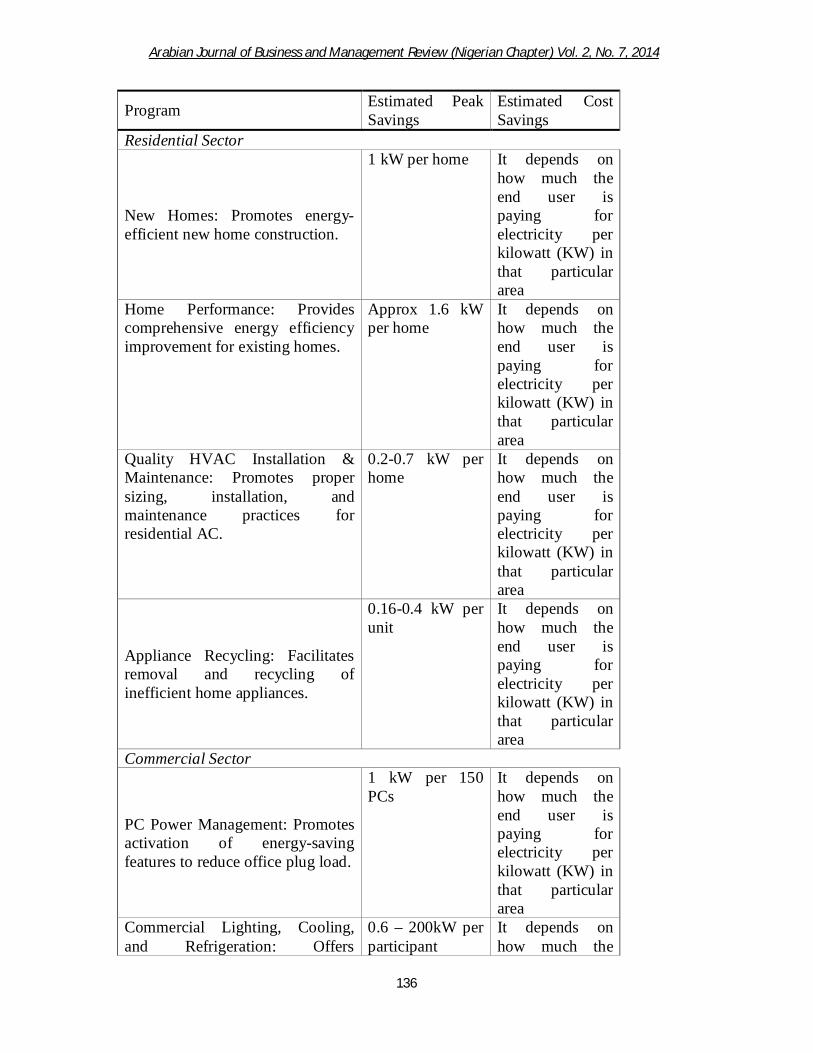
, 20147Arabian Journal of Business and Management Review (Nigerian Chapter) Vol. 2, No.
136
Program Estimated Peak Savings
Estimated Cost Savings
Residential Sector
New Homes: Promotes energy-efficient new home construction.
1 kW per home It depends on how much the end user is paying for electricity per kilowatt (KW) in that particular area
Home Performance: Provides comprehensive energy efficiency improvement for existing homes.
Approx 1.6 kW per home
It depends on how much the end user is paying for electricity per kilowatt (KW) in that particular area
Quality HVAC Installation & Maintenance: Promotes proper sizing, installation, and maintenance practices for residential AC.
0.2-0.7 kW per home
It depends on how much the end user is paying for electricity per kilowatt (KW) in that particular area
Appliance Recycling: Facilitates removal and recycling of inefficient home appliances.
0.16-0.4 kW per unit
It depends on how much the end user is paying for electricity per kilowatt (KW) in that particular area
Commercial Sector
PC Power Management: Promotes activation of energy-saving features to reduce office plug load.
1 kW per 150 PCs
It depends on how much the end user is paying for electricity per kilowatt (KW) in that particular area
Commercial Lighting, Cooling, and Refrigeration: Offers
0.6 – 200kW per participant
It depends on how much the

, 20147Arabian Journal of Business and Management Review (Nigerian Chapter) Vol. 2, No.
137
incentives for energy-efficient commercial equipment.
end user is paying for electricity per kilowatt (KW) in that particular area
Whole Building Performance: Provides comprehensive energy efficiency improvement for commercial buildings.
16 – 600 kW per participant
It depends on how much the end user is paying for electricity per kilowatt (KW) in that particular area
Cool Roofs: Promotes roofing materials with high reflectance and surface emittance. Information accessed from; www.eskom.co.za/idm on 30 October 2013 Areas for future research Introduction of electric vehicles in Gauteng province and other parts of SA still need more attention for research regarding its impact to the national grid, and how Eskom is going to structure the pricing and policies in order to control the increase of demand that will be required by the electric vehicle. SA is still not having proper policy that govern Demand Response (DR), as well as the utility Eskom is not yet sure how to price DR products in order to keep the whole market open. Environmental costs are not yet included in the price of electricity in SA. In future Eskom will be required to include environmental costs to its price of electricity, and this initiative will increase electricity prices much higher. Energy efficiency standards not only in Gauteng Province (but the rest of SA) are generally lacking. Even given benefits of energy efficiency, most of the standards have not been implemented because of high-cost energy supply in coal, lack of public awareness, the unaffordability of appliances, and the inadequate long-term policies and absence of codes and standards. Energy governance should be improved by clarifying the roles of various government institutions, and making them accountable, transparent, and representative of the population – particularly of the previously disadvantaged groups. Conclusion This study aimed to evaluate the leading to disequilibrium of electricity demand and supply in Gauteng province. SA energy market has grown over the past decade and it’s is no longer able to keep with demand of electricity. However, it is extremely important that Eskom recognizes the needs, wants, criteria and the perceptions of its customers. The study employed data representing factors the leading to disequilibrium of electricity demand and supply in Gauteng province, therefore the data will help Eskom to identify and meet customers’ needs and wants as well as to establish the perceived and preferred service quality, activities that would entice customers and the

, 20147Arabian Journal of Business and Management Review (Nigerian Chapter) Vol. 2, No.
138
possible best ways of utilizing available resources in order to reduce demand of electricity in SA. The study suggested that NERSA should take appropriate measures to include these dimensions in undertaking objective assessment of price of electricity and how to implememt energy reduction strategies at customers’ interest. In this study, the focus on consumer behaviour was helpful in situating and understanding customers' preferences and buying behaviour of energy or electricity. This chapter concluded the study, recommended strategies that will enhance SA energy market and suggested areas for future research. The aim of this study has been fulfilled by achieving the stated objectives and answering all the research questions. Demand-Response can be used to limit residential demand growth or mitigate the impacts through the provision of incentives for industry and commerce to move load out of the peak periods. Benefits of this include avoiding high price increases through the deferment or avoidance of certain generation capacity construction. Eskom ran/implemented the residential electrification programme, with a final target of five million additional connections in 2007, raised various issues of public policy interest. Electrification connection of poor households (where coal, wood, paraffin and liquid petroleum gas were the primary household energy sources), promotes the use of clean, versatile and convenient form of energy that connects them to the modern economy. There is substantial scope for energy savings for the commercial and industrial sectors. For the commercial sector, the opportunity is through better design of buildings and improved management of energy use. A relatively high potential for energy savings exists in the industrial sector, with focal areas being as follows: energy management and good housekeeping, providing incentives to adopt specific technologies, conducting energy assessments to identify areas for energy savings, and implementation or adoption of standards for electrical equipment. The main challenge rests with the adoption and promotion of economically efficient energy measures. This, in turn, would guarantee achievement of market transformation and demand side management sustainability. Giving incentives to consumers who reduce energy usage, without some the level of customer interest and trust, these pricing plans or customer incentives are unlikely to drive important shifts or reductions in peak consumption, and it is more highly likely that Eskom will face a backlash from upset and confused customers. Peak energy reductions programs will only be successful through customer engagement (Sioshansi, 2013: 604). BIBLIOGRAPHY
Abel & Bernanke 1995 (Glossary) Ader, H. J., Mellenbergh, G.J. and Hand, D.J. (2008).Advising on Research Methods: A Consultant’s Companion.Netherlands: Johannes van Kessel. AFP (January 27, 2011). "Egypt protests a ticking time bomb: Analysts". The New Age. Retrieved January 29, 2011. Africa, A. 2003. Demand side management in South Africa. Electricity Supply Industry. Issue 1, pages 44 – 46.

, 20147Arabian Journal of Business and Management Review (Nigerian Chapter) Vol. 2, No.
139
Agresti, A. and Franklin, C. (2009). Statistics the Art and Science of Learning from Data. Upper Saddle River: Pearson Education, Inc. Altinay, L. and Paraskevas, A. (2008).Planning Research in Hospitality and Tourism. Oxford: Butterworth-Heinemann. Babbie, E., Mouton, J., Vorster, P. and Prozesky, B. (2007). The Practice of Social Research. South African Edition. Cape Town: Oxford University Press. Babbie, E.R. (2008). The Basics of Social Research.5th edition. USA: Wadsworth Cengage Learning. Barro 1997 (Glossary) Bennett, J. (2003). Evaluation methods in Research. London: Continuum. Blanchard 2000 (Glossary) Bulkley, George (March 1981). "Personal Savings and Anticipated Inflation". The Economic Journal 91 (361): 124–135. doi:10.2307/2231702. JSTOR 2231702. Burns, N. and Grove, S.K. (2005).The Practice of Nursing Research: Conduct, Critique, & Utilization. 5th edition. Missouri: Elsevier Saunders. Brink, H. I. (2002). Fundamentals of Research Methodology for Health Care professionals. South Africa: Juta and Company. Bryman, A. (2008). Social Research Methods. New York: Oxford University Press. Cant, M., Gerber-Nel, C., Nel, D. and Kotze, T. (eds.) (2003). Marketing Research.South Africa: New Africa Books (PTY) Ltd. Capron, A.M. (1989). Human experimentation. In R.M. Veatch (Ed.), Medical ethics (125-172). Boston: Jones & Bartlett. Creswell, J.W., Research Design: Qualitative & Quantitative Approaches, London: SAGE Publications, 1994. Cohen, L. and Manion, L., Research Methods in Education, London: Groom Helm Ltd., 1980. Cohen, L., Manion, L., and Morrison, K. (2007).Research Methods in Education.6th edition. USA: Taylor & Francis Group. Connaway, L.S. and Powell, R. (2010).Basic Research Methods for Librarians.5th edition. USA: Greenwood Publishing Group. Cooper, D. R. and Schindler, P. S. (2003). Business Research Methods. International Edition. New Delhi: Tata McGraw- Hill. Creswell, J. W. (2003). Research Design: Qualitative, Quantitative and Mixed Method Approaches. Thousand Oaks, California: Sage Publications. Duncan Wilson and Ivan Adams; Review of security supply in SA,2006, pp14-17 Eberhard, A. & van Horen, C. 1995. Poverty and power. London: Pluto Press. Engineering News (Shona Kohler, 16 May, 2008: 3). Electricity- U.S. Energy Information Administration (EIA) Federal Energy Regulatory Commission (August 2006). Assessment of Demand Response and Advanced Metering. Docket No. AD-06-2-000. Fereidoon P. Sioshansi (2013). Energy efficiency (Towards the end of demand growth) Field, P.A., & Morse, J.M. (1992). Nursing research. The application of qualitative approaches. London: Chapman & Hall.

, 20147Arabian Journal of Business and Management Review (Nigerian Chapter) Vol. 2, No.
140
Gravetter, F.J. and Forzano, L.B. (2009).Research Methods for the Behavioural Sciences.3rd edition. USA:Wadsworth. Hair, J.F., Bush, R.P. and Ortinau, D. (2000).Marketing Research: A Practical Approach for the New Millennium. Boston: Irwin/McGraw-Hill. Hanuman, M. (2006). A Critical Evaluation of Bed Occupancy Rates at Public Hospitals in the eThekwini District and Recommendations for Addressing Critical Shortages. MBA. Regent Business School. Henning, E., Van Rensburg, W. and Smit, B. (2005). Finding your Way in Qualitative Research. Pretoria: Van Schaik Publishers. http://www.dailymaverick.co.za/article/2013-03-01-eskom-tariff-compromise-their-loss-our-loss/ on 16 July 2013 http//www.doe.gov.org; Interventions to address electricity shortages (Department of energy, 2008:6), accessed 12 June 2013. http; www.enernoc.com, accessed 31 august 2013 http://www.erc.uct.ac.za/jesa/volume16/16-3jesa-nkomo.pdf http://www.newagepublishers.com/samplechapter/000896.pdf http://www.moneyweb.co.za/moneyweb-soapbox/the-electricity-crisis--from-bad-to-terrible on 01 October 2013 The Express Tribune with the International Herald Tribune (Published June 29, 2011). JC Nkomo, Energy Research Centre, University of Cape Town; Energy and economic development, challenges for South Africa; Journal of Energy in Southern Africa • Vol 16 No 3 • August 2005 Johansson, R., Leander, T. and Nilsson, V. (2010). Are You The Leader You Think You Are? Bachelor Thesis within Business Administration. JÖNKÖPING UNIVERSITY. Jump up ^ Why price stability?, Central Bank of Iceland, Accessed on September 11, 2008. Jump up ^ Paul H. Walgenbach, Norman E. Dittrich and Ernest I. Hanson, (1973), Financial Accounting, New York: Harcourt Brace Javonovich, Inc. Page 429. Jump up to: a b Mankiw 2002, pp. 22–32 Katzenellenbogen, J. M., Joubert, J. M. and Abdool Karim, S. S. (2001). Epidemiology. A manual for South Africa. (Eds) Edition. South Africa: Oxford University Press. Ledez, R.E. (2008). Change Management: Getting a Tuned up Organization Business Intelligence Journal European Management Development, 1(1), p.111-120. Lessons about America energy problems -The national academies: advisers to the nation on science, engineering and medicine Les prix alimentaires proches de «la cote d'alerte»" – Le Figaro, with AFP, February 20, 2011 Les Egyptiens souffrent aussi de l'accélération de l'inflation", Céline Jeancourt-Galignani – La Tribune, February 10, 2011 Marshall, C. and Rossman, G. (2011). Designing Qualitative Research. 5th edition. California: Sage Publications, Inc.
, 20147Arabian Journal of Business and Management Review (Nigerian Chapter) Vol. 2, No.
141
Moore, D. S., McCabe, G. P., Duckworth, W. M. and Sclove S. L. (2003). The Practice of Business Statistics Using Data for Decisions. New York: W. H. Freeman and Company. Mundell, James, Journal of Political Economy, LXXI (1963), 280–83 "Inflation and Real Interest" Naidoo, N. (2010). An Evaluation of Customer Retention Strategies at a Retail Hearing Aid Company. MBA. Regent Business School. New York State Energy Research and Development Authority (May 2006). New York Energy Smart SM Program Evaluation and Status Report, 5-39-41. O'Sullivan, Arthur; Sheffrin, Steven M. (2003) [January 2002]. Economics: Principles in Action. The Wall Street Journal:Classroom Edition (2nd ed.). Upper Saddle River, New Jersey 07458: Pearson Prentice Hall: Addison Wesley Longman. p. 341. ISBN 0-13-063085-3. Retrieved May 8, 2013. Peck, R., Olsen, C. and Devore, J. (2005). Introduction to Statistics and Data Analysis. 2nd Edition. California: Thompson Learning. Punch, M. (1994). Politics and ethics in qualitative research. In N.K. Denzin & Y.S. Lincoln (Eds.), Handbook of qualitative research. Newbery Park, CA: Sage. R Morimoto and C Hope (WP 24/2001). THE IMPACT OF ELECTRICITY SUPPLY ON ECONOMIC GROWTH IN SRI LANKA: The Judge Institute of Management Studies Robson, C. (2002). Real World Research. 2nd Edition. Oxford: Blackwell. Ramos, M.C. (1989). Some ethical implications of qualitative research. Research in Nursing & Health, 12, 57-63. Randall S. Jones, Myungkyoo Kim. Restructuring electricity sector and promoting green growth in Japan: OECD Economics Department Working Papers No. 1069; Robert J. Gordon (1988), Macroeconomics: Theory and Policy, 2nd ed., Chap. 22.4, 'Modern theories of inflation'. McGraw-Hill. SANEA 2003. South African Energy Profile 2003. Melville, South Africa. Saunders, M., Lewis, P. and Thornhill, A. (2000). Research Methods and Theory for Business Students.2nd edition. Great Britain: Pitman Publishing. Saunders, M., Lewis, P. and Thornhill, A. (2003). Research Methods for Business Students. 3rd edition. Essex: Prentice Hall. Sekaran, U. (2003). Research Methods for Business. A Skill Building Approach. Singapore: John Wiley and Sons Inc. Spalding-Fecher, R. 2002. Energy sustainability indicators for South Africa. Energy and Development Research Centre, University of Cape Town. Sutherland, M. L. (2006). Conflict Management: A Union's Approach at the Durban University of Technology (DUT). MBA. University of KwaZulu-Natal. Shajahan, S. (2005). Research Methods for Management. Mumbai: Jaico Publishing House. Shields, Patricia and Hassan Tajalli. (2006). Intermediate Theory: The Missing Link in Successful Student Scholarship. Journal of Public Affairs Education. Vol. 12, No. 3. Pp. 313-334 Streubert, H.J., & Carpenter, D.R. (Eds.). (1999). Qualitative research in nursing. Advancing the humanistic imperative (2nd ed.). Philadelphia: Lippincott.

, 20147Arabian Journal of Business and Management Review (Nigerian Chapter) Vol. 2, No.
142
Sweeney, D. J., Williams, T. A. and Anderson, D. R. (2009). Fundamentals of Business Statistics. 5th Edition. Ohio: South-Western. Taylor, Timothy (2008). Principles of Economics. Freeload Press. ISBN 1-930789-05-X. Taylor and and Hall 1993; Tobin, James, American Economic Review, march (1969), "Inflation and Unemployment" Tobin, J. Econometrica, V 33, (1965), 671–84 "Money and Economic Growth" Thakur, D. (2005). Research Methodology in Social Sciences. New Delhi: Deep & Deep Publications Pty. Ltd. Thorsten Polleit, "Inflation Is a Policy that Cannot Last", Mises Institute Tsaing, S.C., Journal of Money, Credit and Banking, I(1969), 266–80 "A Critical Note on the Optimum Supply of Money" Tshuma, N. (2010). An Evaluation of a Change Strategy to Integrate Nutrition in HIV and AIDS Progammes run by the Community AIDS Response. MBA Thesis. Regent Business School. Van Blerkom, M.L. (2009). Measurements and Statistics for Teachers. New York: Routledge. Vik, K. (2010). Clinicians as leaders: How Important is Leadership Competencies for Leadership Performance? MBA Thesis. Blekinge Tekniska Högskola. US Consumer Price Index for All Urban Consumers, All Items, series CPIAUCNS, from base level 100 in base year 1982. They were downloaded from the FRED database at the Federal Reserve Bank of St. Louis on May 8, 2013. Wilkinson, D. and Birmingham, P. (2003). Using Research Instruments: A Guide for Researchers. London: RoutledgeFalmer. Wikipedia Encyclopedia. Retrieved from http://en.wikipedia.org/wiki/Socialscience.pdf Wyplosz & Burda 1997 (Glossary); York, Kushler, Witte (February 2007). Examining the Peak Demand Impacts of Energy Efficiency: A Review of Program Experiences and Industry Practices. ACEEE. Zikmund, W. G. (2003). Business Research Methods. 7th Edition: Thomson South Western Publishing India.