an evaluation of current human resource management a thesis … · an evaluation of current human...
TRANSCRIPT

AN EVALUATION OF CURRENT HUMAN RESOURCE MANAGEMENT
PRACTICES IN THE TURKISH PRIVATE SECTOR
A THESIS SUBMITTED TO THE GRADUATE SCHOOL OF SOCIAL SCIENCES
OF MIDDLE EAST TECHNICAL UNIVERSITY
BY
SERAY SÖZER
IN PARTIAL FULFILLMENT OF THE REQUIREMENTS FOR THE DEGREE OF
MASTER OF SCIENCE IN
THE DEPARTMENT OF PSYCHOLOGY
DECEMBER 2004

Approval of the Graduate School of Social Sciences _____________________ Prof. Dr. Sencer Ayata Director I certify that this thesis satisfies all the requirements as a thesis for the degree of Master
of Science.
______________________ Assoc. Prof. Dr. Nebi Sümer Head of the Department This is to certify that we have read this thesis and that in our opinion it is fully adequate,
in scope and quality, as a thesis for the degree of Master of Science.
______________________ Assoc. Prof. Dr. H. Canan Sümer Supervisor Examining Committee Members Assoc. Prof. Dr. H. Canan Sümer ______________________ Assoc. Prof. Dr. Reyhan Bilgiç ______________________ Assoc. Prof. Dr. Canan Ergin _______________________

iii
I hereby declare that all information in this document has been obtained and presented in accordance with academic rules and ethical conduct. I also declare that, as required by these rules and conduct, I have fully cited and referenced all material and results that are not original to this work. Seray Sözer : Signature :

iv
ABSTRACT
AN EVALUATION OF CURRENT HUMAN RESOURCE MANAGEMENT
PRACTICES IN THE TURKISH PRIVATE SECTOR
Sözer, Seray
M.S., Department of Psychology
Supervisor: Assoc. Prof. Dr. H. Canan Sümer
December, 2004, 198 pages
This study explored human resource management (HRM) functions of 200 work
organizations operating in Turkey using a questionnaire. The participating organizations
were the members of either the Personnel Managers Association or the Quality
Association in Turkey. Job analysis and design, recruitment and selection, orientation
and employee training, performance appraisal, career planning and development, human
resource planning, compensation management and incentives, managing employee
health and safety were among the fields that were examined. In addition to the prevalent
HRM functions, the profile of Human Resource Departments of the organizations (i.e.,
title, size, number of hierarchical levels, etc.), the characteristics of HRM managers
(education, age, gender, experience, etc.) were also examined. For example, it was found

v
that the departments operating in field of HRM were named Human Resource
Department in 59.5% of the organizations in the sample. Moreover, the results indicated
that the main HRM areas practiced by the private sector organizations operating in
Turkey were personnel selection, employee recruitment, training and development,
compensation management, and employee orientation. Nevertheless, the other essential
functions of HRM, such as job analysis, human resource planning and career planning,
and development were not practiced as frequently. Whether those functions were
frequently practiced or not, each of them was further analysed in terms their specific
applications. Another aim of the present study was to compare the practices of HRM in
Turkey with its applications in the world. For instance, the results demonstrated that
recruiting via internet was practiced frequently in the surveyed organizations and in the
US companies. The present study also revealed that personnel selection methods, such
as interviews, were popular among surveyed organizations and organizations in Eastern
European countries, England, and the US.
Keywords: Human Resource Management, HRM Functions, HRM in Turkey, Cross-
Cultural Comparison of HRM functions

vi
ÖZ
TÜRK ÖZEL SEKTÖRÜNDE UYGULANAN GÜNCEL İNSAN KAYNAKLARI
FAALİYETLERİ ÜZERİNE BİR DEĞERLENDİRME
Sözer, Seray
Yüksek Lisans, Psikoloji Bölümü
Tez Yöneticisi: Doç. Dr. H. Canan Sümer
Aralık 2004, 198 sayfa
Bu çalışma Türkiye’de faaliyet gösteren 200 organizasyonun insan kaynakları alanındaki
(İK) uygulamalarını 200 katılımcının ankete verdiği cevapları inceleyerek araştırmıştır.
Araştırma kapsamında Türkiye’de değişik sektörlerde faaliyet gösteren ve Personel
Yöneticileri Derneği’ne veya Kalite Derneği’ne üye organizasyonlar yer almaktadır.
Araştırma dahilinde, iş analizi ve tasarımı, başvuru sağlama ve personel seçme,
oryantasyon ve eğitim, performans değerlendirme, kariyer planlama ve gelişim, insan
kaynakları planlaması, ücret yönetimi, işçi sağlığı ve güvenliği gibi insan kaynakları
uygulamaları incelenmiştir. Bunlara ek olarak, İnsan Kaynakları Departmanlarının
profili (departman adı, çalışan kişi sayısı, hiyerarşik düzeyleri vb.) ve İK yöneticilerinin
özellikleri de (eğitim, yaş, cinsiyet, deneyim, vb.) incelenmiştir. Araştırmanın
vii
sonuçlarına göre; Türkiye’deki organizasyonların %59.5’inde İK uygulamalarını yürüten
departmanlar İnsan Kaynakları Departmanı olarak adlandırılmaktadır. Ayrıca,
Türkiye’de faaliyet gösteren firmalar çoğunlukla personel seçme, başvuru sağlama,
eğitim ve gelişim, ücret yönetimi ve oryantasyon gibi insan kaynakları faaliyetlerini
uygulamaktadırlar. Ancak, iş analizi, insan kaynakları planlaması ve kariyer planlama
gibi bazı önemli İK süreçleri aynı çoğunlukta uygulanmamaktadır. Araştırmaya katılan
firmalar tarafından uygulansın yada uygulanmasın, bütün bu İK fonksiyonlarının herbiri
detaylı olarak analiz edilmiştir. Son olarak, araştırmanın bir diğer amacı Türkiye’deki İK
uygulamalarını kalitatif olarak dünyadaki uygulamaları ile benzerlik ve farklılıklarını
ortaya koymaktır. Bu bağlamda, araştırma sonuçları internet yolu ile başvuru sağlamanın
araştırmaya katılan organizasyonlar ile Amerika Birleşik Devletleri’nde faaliyet gösteren
firmalarda yaygın olarak kullnıldığını ortaya koymuştur. Ayrıca araştırma sonuçları,
personel seçme yöntemlerinden görüşme yönteminin araştırmaya katılan firmalar ile
Doğu Avrupa’daki ülkelerde, İngiltere’de ve Amerika Birleşik Devletleri’nde faaliyet
gösteren organizasyonlarda yaygın olarak kullanıldığını ortaya koymuştur.
Anahtar kelimeler: İnsan Kaynakları Yönetimi, İK uygulamaları, Türkiye’de İK, Farklı
Ülkelerde İK Uygulamaları

vii
To my family…

viii
ACKNOWLEDGEMENTS
Initially I would like to express my special thanks to my supervisor Assoc.
Prof. H. Canan Sümer for her valuable guidance. This thesis would not have been
completed without her continuous support and supervision. I also would like to thank
members of my examining committee; Assoc. Prof. Reyhan Bilgiç and Assoc. Prof.
Canan Ergin for their valuable suggestions and comments.
I also wish to express my great thanks to METU Career Planning Center for
their permission to put my questionnaire on their web page, especially to Eray Özkan
and Selen Arda for their valuable technical support and warm friendship.
This thesis would not have been possible without unlimited support of my
friends Adonis Çiğdem Erkunt, Pınar Kocabıyıkoğlu, Bengü Tunçludemir, Nihal
Doğrusöz, Nilay Aygüney and İrem Palalıoğlu. I also would like to express my
thanks to Erkin Ataman for his technical assistance, great understanding and genuine
patience.
Above all I would like to express my gratitude to my parents; Serpil Sözer
and Tayfun Sözer for their endless love and warm support that they have given me
all through out of my life. They were the heroes for their psychological and
economical support.
Finally, I thank to my participants for their contributions by participating in
this study.

ix
TABLE OF CONTENTS
PLAGIARISM............................................................................................................... iii
ABSTRACT.................................................................................................................. iv
ÖZ.................................................................................................................................. vi
ACKNOWLEDGEMENTS.......................................................................................... viii
TABLE OF CONTENTS............................................................................................... ix
LIST OF TABLES......................................................................................................... xiv
CHAPTER
1. INTRODUCTION
Overview....................................................................................................... 1
1.1 What is Human Resource Management?................................................ 1
1.2 Human Resource Management Today.................................................... 4
1.3 Objectives of Human Resource Management Functions........................ 6
1.4 Human Resource Management Practices................................................ 7
1.4.1 Job Analysis................................................................................... 7
1.4.2 Recruitment and Selection............................................................. 8
1.4.3 Orientation and Employee Training.............................................. 11
1.4.4 Performance Appraisal.................................................................. 13
1.4.5 Career Planning and Development................................................ 16
1.4.6 Human Resource Planning............................................................. 17
1.4.7 Compensation Management and Incentives.................................. 18

x
1.4.8 Managing Employee Health and Safety........................................ 20
1.4.9 Managing Union Relationships..................................................... 21
1.5 Current Human Resource Practices in Turkey...................................... 22
1.5.1 Job Analysis.................................................................................. 24
1.5.2 Recruitment and Selection............................................................ 25
1.5.3 Training and Development of Employees.................................... 26
1.5.4 Performance Appraisal.................................................................. 28
1.5.5 Career Planning and Development................................................ 29
1.5.6 Compensation Management.......................................................... 30
1.6 Human Resource Management Practices in Different Countries.......... 31
1.6.1 United States of America.............................................................. 33
1.6.2 Canada........................................................................................... 34
1.6.3 Japan.............................................................................................. 35
1.6.4 European Human Resource Management..................................... 37
1.6.5 Eastern Europe.............................................................................. 39
2. METHOD
2.1 Sample....................................................................................................... 41
2.1.1. Profile of the Organizations.......................................................... 42
2.1.2 Sector of the Organizations........................................................... 42
2.1.3 Age of the Organizations.............................................................. 42
2.1.4 Size of the Organizations.............................................................. 43
2.2 Measure..................................................................................................... 44
2.3 Procedure.................................................................................................. 45
xi
3. RESULTS
3.1 HRM Departments in Organizations........................................................ 47
3.1.1 Functioning Areas of HRM Departments..................................... 53
3.1.1.1 Correlations Among HRM Functions............................... 56
3.2 Job Analysis.............................................................................................. 58
3.3 Recruitment............................................................................................... 63
3.4 Position Norm Analysis............................................................................ 68
3.5 Personnel Selection................................................................................... 68
3.6 Orientation................................................................................................. 74
3.7 Training and Development........................................................................ 78
3.8 Performance Appraisal.............................................................................. 86
3.9 Career Planning......................................................................................... 92
3.10 Human Resource Planning...................................................................... 97
3.11 Compensation and Benefits................................................................... 100
3.12 Job Evaluation....................................................................................... 107
3.13 Managing Union Relations.................................................................... 109
3.14 Employee Health and Safety.................................................................. 110
4. DISCUSSION
4.1 HRM Practices in Turkey........................................................................ 113
4.2 Comparison of HRM Practices across Different Countries.................... 121
4.3 Conclusion............................................................................................... 133
4.3.1 Limitations and Suggestions....................................................... 136

xii
REFERENCES............................................................................................................. 137
APPENDICES.............................................................................................................. 146
A. Questionnaire (Anket)......................................................................................146
B. Crosstabs Analysis (Organization Size by HRM Function............................. 162
C. Correlations Among HRM Functions............................................................. 166
D. Crosstab Analyis (Organization Size by Job Analysis Methods) .................. 167
E. Correlations Among HRM Functions in Which Results of Job Analysis
were Used........................................................................................................ 170
F. Crosstab Analysis (Organization Size by Methods Used to Select
Managers.......................................................................................................... 171
G. Crosstab Analysis (Organization Size by Methods Used to Select Non-
managers......................................................................................................... 173
H. Crosstab Analysis (Organization Size by Kinds of Interviews)..................... 175
I. Correlations Among Methods of Orientation Programs.................................. 178
J. Correlations Among the Positions That Orientation Programs were Applied
For.................................................................................................................. 179
K. Crosstab Analysis (Organization Size by Training Methods.......................... 180
L. Correlations Among Methods of Need Analysis............................................ 182
M. Correlations Among Methods of Performance Appraisal.............................. 183
N. Crosstab Analysis (Organization Size by Performance Appraisal
Methods.......................................................................................................... 184
O. Correlations Among the Functions in Which Performance Results were
Used............................................................................................................... 186

xiii
P. Correlations Among Assessors of Employer Performance............................. 187
Q. Crosstab Analysis (Organization Size by Career Development Activities..... 188
R. Correlations Among the Activities of Career Development........................... 190
S. Correlations Among the Individuals Performing Career Planning................. 191
T. Correlations Among Activities of Human Resource Planning....................... 192
U. Correlations Among the Factors That Affect Salary Increment.................... 193
V. Correlations Among the Factors and Individuals Playing a Role in
Managers’ Salary Increment.......................................................................... 194
W. Correlations Among the Factors and Individuals Playing a Role in
Non-Managers’ Salary Increment.................................................................. 195
X. Correlations Among Managers’ Benefits........................................................ 196
Y. Correlations Among Non-Managers’ Benefits............................................... 197
Z. Correlations Among the Methods of Job Evaluation...................................... 198
xiv
LIST OF TABLES
TABLES
1.1 HRM Activities in Different Countries................................................................ 32
2.1 Distribution of the Participating Organizations by Sector................................... 42
2.2 Age Profile of the Organizations.......................................................................... 43
2.3 Size Profile of the Organizations.......................................................................... 43
2.4 The Frequency Distribution of the Size of Organizations Sector......................... 44
3.1 Name of the Departments Operating in HRM Functions..................................... 47
3.2 Frequency Distribution of Number of Employees in HRM Department.............. 49
3.3 Frequency Distribution of Number of Hierarchy Levels in HRM Department.... 50
3.4 Title of Primary Responsible Persons of HRM Functions.................................... 50
3.5 Executive Managers Reported by HRM Managers............................................... 51
3.6 Education Level of HRM Managers..................................................................... 51
3.7 Education Fields of HRM Managers..................................................................... 52
3.8 Age of HRM Managers......................................................................................... 52
3.9 Gender of HRM Managers.................................................................................... 53
3.10 Frequency Distribution of Experience Duration of HRM Managers.................... 53
3.11 HRM Functions..................................................................................................... 54
3.12 Job Analysis.......................................................................................................... 58
3.13 The Fields in Which the Results of Job Analysis were Used............................... 59
3.14 Frequency Distribution of Job Analysis Performers............................................. 60
xv
3.15 The Methods of Job Analysis................................................................................ 60
3.16 Frequency of Job Analysis.................................................................................... 63
3.17 Recruitment Methods for Non-Managerial Positions........................................... 64
3.18 Recruitment Methods for Managerial Positions.................................................... 65
3.19 Effective Recruitment Methods for Non-Managerial Positions............................ 66
3.20 Effective Recruitment Methods for Managerial Positions.................................... 67
3.21 The Ways of Internal Recruitment......................................................................... 67
3.22 Methods Used to Select Non-Managers................................................................ 69
3.23 Methods Used to Select Managers........................................................................ 70
3.24 Effective Methods of Selection Used for Managerial Positions........................... 72
3.25 Effective Methods of Selection Used for Non-Managerial Positions................... 72
3.26 Techniques of Interviews...................................................................................... 73
3.27 Performers of Orientation Programs..................................................................... 75
3.28 Techniques of Orientation Programs..................................................................... 76
3.29 Length of Orientation Programs............................................................................ 77
3.30 Length of the Trial Period...................................................................................... 78
3.31 Training Department.............................................................................................. 79
3.32 Divisions That the Training Departments were Under.......................................... 79
3.33 Frequency Distribution of Number of Employees in Training Department.......... 80
3.34 Training Techniques Used..................................................................................... 80
3.35 The Ways of Determining Training Programs...................................................... 82
3.36 Methods of Determining Training Programs........................................................ 82
3.37 Methods of Need Analysis.................................................................................... 83

xvi
3.38 The Profile of the Trainers.................................................................................... 84
3.39 Methods of Training Evaluation........................................................................... 84
3.40 Receivers of Training Programs........................................................................... 85
3.41 Amount of Training Budget.................................................................................. 85
3.42 Methods of Performance Appraisal...................................................................... 87
3.43 The Functions for which PA results were Used.................................................... 88
3.44 The Frequency of Performance Appraisal for Managers...................................... 89
3.45 The Frequency of Performance Appraisal for Non-Managers.............................. 89
3.46 Assessors of Performance...................................................................................... 90
3.47 Feedback of Performance Appraisal...................................................................... 91
3.48 The Content of PA Form........................................................................................ 92
3.49 The Activities of Career Development.................................................................. 93
3.50 The Stages of Career Planning System.................................................................. 95
3.51 The Evaluation Criteria of Employee KSA’s for Career Planning Purposes......... 95
3.52 The Profile of the Managers Performing Career Management System.................. 97
3.53 The Length of HR Plan........................................................................................... 97
3.54 Activities of Human Resource Planning................................................................ 98
3.55 The Factors Affecting the Salary Increment......................................................... 101
3.56 The Factors and Individuals Playing a Role in Managers’ Salary Increment...... 102
3.57 The Factors and Individuals Playing a Role in Non-Managers’ Salary
Increment............................................................................................................. 103
3.58 The Benefits for Managers................................................................................... 104
3.59 The Benefits for Non-Managers......................................................................... 105

xvii
3.60 The Kinds of Monetary Rewards......................................................................... 106
3.61 The Kinds of Non-Moneterial Rewards............................................................... 107
3.62 The Methods of Job Evaluation........................................................................... 108
3.63 The Activities Performed in Managing Union
Relationships........................................................................................................ 110
3.64 The Performers of Employee Health and Safety Issues....................................... 111
3.65 The Activities of Managing Employee Health and Safety................................... 112
4.1 Comparison of Present Study with Arthur Andersen’s Study............................. 114
4.2 Recruitment Activities in Different Countries..................................................... 125
4.3 Selection Activities in Different Countries.......................................................... 126
4.4 Orientation Activities in Different Countries....................................................... 127
4.5 Training Activities in Different Countries........................................................... 128
4.6 PA Activities in Different Countries.................................................................... 129
4.7 Compensation Management Activities in Different Countries............................ 131
4.8 Pay for Performance Activities in Different Countries........................................ 132

1
CHAPTER 1
INTRODUCTION
Overview
In the present report, there are mainly four sections. The first section aims to
define concept of HRM and explains its main objectives and functions, emergence
and historical development of HRM, main HRM practices, HRM practices carried
out in Turkey and in different countries. The method of the study is explained in the
second section, which involves information on participants, measures, procedures,
and data analysis. In the third section, the results of the study are explained in details.
In the last section, the findings of the study are discussed further and the HRM
practices of Turkey are compared and contrasted with HRM applications in different
countries.
1.1 What is Human Resource Management?
The term human resource management (HRM) has relatively adopted in
business organizations in place of personnel management. HRM can be defined as
“the management of activities under taken to attract, develop, motivate, and maintain
a high performing workforce with in the organization” (Harvey & Bowin, 1996, p.6).
HRM involves following characteristics. First, it focuses on horizontal authority and
reduced hierarchy. The second characteristic is that the role of human resource
professionals is to support and facilitate line managers who have the direct
responsibility of managing personnel. Thirdly, HRM is proactive and fused with
2
corporate level planning. The fourth characteristic is that employees are seen as
subjects who have potential to develop and grow. The purpose of HRM is to specify
employee’s potential and develop it in line with the needs of the organization.
Finally, HRM holds the view that the management and non-management have a
common interest in the success of the organization (Krulis cited in Goss, 1994).
The development of HRM in the 1980s is reflective of an increased
realization of the importance of human element in organizations. Goss (1994) stated
that the evolution of HRM could be linked to socio-economic factors such as changes
in international competition, restructuring of industrial sectors and organizations, and
changes in the concept of managerialism. According to Goss (1994), during the
1970s and the early 1980s the US and the UK industries became incompetent at
international markets because of increasing domination of Japanese manufacturers.
Therefore, Western managers began to analyze the Japanese industry and concluded
that Japanese organizations value people as the key asset of business. In short, this
conclusion opened the way for the development of HRM.
The second factor that influenced the development of HRM is the
restructuring of industries and organizations because of a recession and trade crisis in
the UK and the US in the early 1980s. Organizations were becoming less
hierarchical, more flexible, and decentralized. Moreover, participation and
commitment of employees, greater reliance on self-discipline and development of
more effective reward systems were becoming the valued concepts in the
restructuring of organizations. In brief, these changes in organizations called for a
new perspective on people management, which then led to the emergence of HRM.
The last factor that contributed to the emergence of HRM is the change in the
power and confidence of management. As a result of the economic recession in

3
the1980s, trade unions lost their power and influence on organizations and this
resulted in greater power for managers. Managers had greater confidence, freedom,
and willingness to experience new ideas in years of economic boom that followed the
recession.
There were other reasons for HRM to develop in the early1980s. Among
them were market changes taking place in line with globalization and effects of
enterprise culture (Legge, 1995). Increased globalization and competition were the
two trends in the world markets. The intensification of international competition
forced companies to analyze their source of competitive advantage. The analysis
demonstrated that investment in human and technical capacity was something that
was required. As a result, human resource policies started to be integrated with
business strategies.
In both the UK and US, the enterprising was emphasized by political entities
for economic well being. The concepts of being initiative, energetic, independent,
bold, self-reliant, and willingness to take risks were emphasized in enterprise culture.
The acquisition and exercise of these qualities were encouraged and led HRM to
further develop.
In addition, Beaumont (1993) stated other reasons that pave the way for HRM
to emerge. These factors were the relative growth of service sector and white-collar
employment, declining levels of workforce unionization, particularly in the US
private sector, and limited power of personnel management in terms of increasing the
organizational performance. Beaumont (1993) argued that HRM should be viewed as
a change or development driven by fundamental environmental changes to which the
traditional personnel function could not adequately respond.

4
According to European perspective, there are two main approaches to HRM.
The first one is called ‘hard model’ that focuses on utilitarian instrumentalism, and
the second one is called ‘soft model’ reflecting a developmental humanism. The hard
model of human resource management involves the integration of human resource
systems, practices, and policies with the business strategy of the organization. The
soft model also values this integration but with an emphasis that involves notions like
valuing employees and seeing them as a source of competitive advantage through
their commitment, adaptability, and highly qualitative skills or performance (Legge,
1995). To clarify the difference between the two approaches, it can be said that the
hard model gives importance to promote the reduction of the costs, including labor,
whereas the soft model gives employees the opportunity to participate in the firm’s
success.
In addition, there are three core characteristics of the most models of HRM
developed in Europe. The first one is the close involvement of HRM and corporate
strategy. The second one is an emphasis on organizational independence to make
decisions about personnel such as an independent remuneration policy and minimal
influence from trade unions. The last characteristic is the preference for carefully
controlled labour market involving freedom to recruit, absence of restriction on
employee contracts, and a substantial degree of training (Brewster & Bournois cited
in Goss, 1994).
1.2 Human Resource Management Today
Poole (1990) stated that today’s HRM could be described as broad and
strategic, involving all managerial personnel, valuing employees as important assets
of organizations, and being proactive in its responsibilities. Moreover, today human
resource functions refer to those tasks and duties performed in both large and small
5
organizations to coordinate human resources (Byars & Rue, 1991). These functions
of human resource management activities can be listed as follows:
1. To ensure that the organization apply equal employment opportunities and other
government obligations.
2. To conduct job analysis to specify different requirements of jobs in an
organization.
3. To identify personnel requirements that led the organization to achieve its
objectives.
4. To develop and implement a plan that meet personnel and job requirements.
5. To recruit employees needed by the organization in order to achieve its
objectives.
6. To select personnel in order to fill vacant positions within an organization.
7. To provide orientation and training to the employees.
8. To design and implement management and organizational development
programs.
9. To design and implement performance appraisal systems to evaluate employee
performance.
10. To assist employees in developing career plans.
11. To design and implement compensation systems for employees.
12. To mediate the relationship between organizations and its units.
13. To design systems for discipline and grievance handling.
14. To develop employee communication systems.
15. To develop employee health and safety programs (Byars & Rue, 1991).
The present study aim to cover all of the HRM activities mentioned above.
6
Some other functions of HRM that mainly improve organizational
performance are as follows. First, it is responsible for enhancing competency and
adaptability of the workforce by developing advanced recruitment and selection
processes, intensive training and development programs. Second, it is stated that “the
identification of needs and cultivation of the requisite managerial skills also represent
new challenges that HRM function is being called on to fulfil” (Dulebohn, Ferris &
Stodd, 1995, p.33). As a result, current emphasis of HRM is to train managers to be
effective leaders and good in relational skills. The third responsibility of HRM is to
share the HRM activities with senior line management because empowered managers
and staff are expected to participate in activities such as recruitment, selection,
performance evaluation, and even compensation.
In conclusion, Sisson (1990) stated that there are four features of HRM
practice today. To begin with, HRM involves both traditional personnel management
activities and activities related to organizational planning. Next, HRM is seen as a
partner in organizational change, creator of organizational culture and commitment.
Third, HRM is characterized by decentralization of HRM activities from personnel
specialists to senior line management. Lastly, current HRM practice focuses on
individual employees rather than collective management-trade union relations.
1.3 Objectives of Human Resource Management Functions
The functions of HRM increase organizational effectiveness in several ways.
First, HRM implications serve the organization to reach its goals and objectives. In
order to reach this objective, HRM both aims to employ skills and abilities of
workforce efficiently and provides the organization with well-trained and well-
motivated employees. Human resource activities also help to maintain ethical
policies and behaviours within the organization.

7
Next, HRM is responsible for communicating organization’s policies to all
employees. It aims to increase the employee job satisfaction and self-actualization.
These activities also aim to develop and maintain a quality of work life that makes
employment in the organization more desirable. Lastly, an important objective of
human resource activities is to manage changes and trends occurring in the field of
HRM. Consequently, the benefits to employees, groups, organizations, and the public
are enhanced.
1.4 Human Resource Management Practices
In this section, the sub-fields of human resource management such as job
analysis and design, recruitment, selection, orientation, training, performance
appraisal, career planning and development, human resource planning, compensation
management, employee health and safety, and union relations would be described in
details.
1.4.1 Job Analysis and Design
“Job analysis is a method of for describing jobs and/or the human attributes
necessary to perform them” (Spector, 2003, p.54). The results of a job analysis are
used to form job description and job specifications. Job description involves
knowledge about tasks, duties, and responsibilities of a particular job. Job
specifications, on the other hand, are composed of knowledge, skills and abilities that
are required to perform the job efficiently (Harvey & Bowin, 1996). Many human
resource management activities make use of job analysis. Among them are
recruitment, selection and placement, orientation, training, career counselling,
performance appraisal, and compensation (Spector, 2003, p.54).
In addition, information obtained from job analysis can be used in designing
jobs. Job design is the process of structuring work to achieve the objectives of the

8
business plan (Byars & Rue, 1991). Job design is basically structuring the work of an
organization. It involves continuous process of dividing activities, assigning
responsibility to groups or individuals, coordinating performance, and specifying the
relationships among newly created jobs. The specific work tasks of an individual or
group of individuals, question of how the job is to be performed, who is to perform it
and where is to be performed are defined within process of job design. The process
of job design can be classified as three parts. First, the individual tasks are specified.
Then the method of performing each task is specified. Lastly, individual tasks are
combined into specific jobs to be assigned to individuals (Byars & Rue, 1991).
Practices of job analysis and design reveal that job is such an important part of any
organization’s effectiveness that it needs to be clearly understood and designed in a
way that allows employee productivity and satisfaction.
1.4.2 Recruitment and Selection
Recruitment is a process of seeking and attracting a pool of people in order to
select qualified candidates for vacant positions within the organization (Byars &
Rue, 1991). During recruitment process, organizations may use both internal and
external sources to fill vacant positions. Internal recruiting is looking for candidates
among employees already working in the organization. It involves techniques like
job posting. In this method, notices about vacant positions are posted in central
locations throughout the organization and employees are given a time to apply these
positions. Another method used in internal recruiting is to seek recommendations
from present employees regarding friends who might fill vacancies. External
recruiting, on the other hand, seeks for candidates from outside the organization. The
methods of external recruiting can be listed as follows; media advertisements,

9
campus recruiting, working with employment agencies or executive search firms,
using computer databases (Ivancevich, 1992).
Organizations are better to use realistic job previews in order to improve the
effectiveness of recruitment process. Realistic job preview is a way to provide
complete information including positive and negative things about the organization
to the job applicant (Ivancevich, 1992).
After recruiting qualified applicants, the selection process begins. “Selection
is the process of choosing from a pool of applicants the individual or individuals who
best fit the selecting criteria for a position” (Harvey & Browin, 1996, p. 120).
Generally, in the organizations selection process begins with the completion of the
application form by the applicant. The second step is preliminary screening interview
in which minimum qualifications of applicants are screened and a brief personal
interview is conducted to form general impression of the applicants, and obtain key
information about them. The third step is to make employment tests such as
cognitive or psychomotor ability tests, knowledge and skill tests, emotional
intelligence tests, integrity tests, personality tests, vocational interest tests, and
performance simulations. The validity studies of these tests demonstrate that integrity
tests have an operational validity of .41 (Ones, Viswesvaran, & Schmidt, 1993).
Moreover, the validity of cognitive ability tests to predict performance is around .51
(Schmidt & Hunter, 1998). As a fourth step, employment interviews are conducted.
These interviews can be in different formats; structured, unstructured, or semi-
structured. In the structured interview, the interviewee received a set of questions
that have been prepared in advance by the interviewer and the interviewer leads the
course of the interview. However, in unstructured interviews, the candidates control
the flow of the conversation. The interviewers do not direct the interviewee; they

10
repeat the statements made by the candidates to encourage further discussion.
Unfortunately, unstructured interviews are subject to the interviewer’s interpretations
(Harvey & Browin, 1996). The validity of unstructured interview has been shown to
be relatively low whereas the validity of structured interview is higher and similar to
assessment center validities (Lowry, 1994). There are also other kinds of interviews
such as panel, situational and stress interviews. In panel interviews, the applicant is
interviewed by a panel or group of individuals. In situational interviews, the
applicants solve a particular problem or describe how they would behave in a
specific job situation. The validity of situational interviews has been shown to range
between .14 and .46 (Cesare, 1996). Lastly, in stress interviews, recruit is subjected
to the stresses and strains supposedly encountered in the job situation (Harvey &
Browin, 1996).
The next step is to check references or recommendation letters that are
submitted by the applicants. As another step, some organizations require applicants
take a physical examination tests or drug tests. The final hiring decision is made
based on the results of the selection process.
In addition, there are some other tools that used in selection process such as
work samples and assessment centers. A work sample is a selection tool that requires
the candidates to show how well they perform the tasks involved in a job under
standardized conditions. On the other hand, assessment centers measures how well a
recruit is able to perform the tasks of a specific job and they include exercises like in-
basket exercise, leaderless group exercise, problem solving simulation, and role-play
exercise. Additionally, according to Schmitt, Gooding, Noe, and Kirsch (1984), the
work samples have true validity of .38 and average validity of assessment centers is
around .40 (Howard, 1997).

11
1.4.3 Orientation and Employee Training
Orientation is a planned introduction of employees to the organization, work
unit, their job, and co-workers. It should be conducted in two separate levels; general
company orientation and departmental or job orientation. There are many purposes
of the orientation process. Among them are reducing the anxiety of new employee,
reducing employee turnover, saving time of supervisors or co-workers, developing
realistic job expectations, developing positive attitudes toward organization, and
improving job satisfaction (Ivancevich, 1992).
In orientation process HR department cooperates with new employee’s
manager. HR department initiates and coordinates general company orientation and
departmental and job orientation, trains line managers in procedures for conducting
department and job orientation, conducts general company orientation and follows up
the initial orientation with the new employee. The line managers, on the other hand,
are responsible for conducting job and departmental orientation.
After a comprehensive orientation, new employees may not be able to
perform satisfactorily, so they have to be trained in the duties they are expected to
do. Training is a learning process that involves the acquisition of skills, knowledge,
concepts or attitudes to increase employee performance (Byars & Rue, 1991). Before
training programs are developed, the needs of both employees and organization are
assessed in order to determine what objectives should be sought. Prior to needs
assessment phase organizational support is provided. Salas and Cannon-Bowers
(2001) stated that the need assessment involves the analysis of job and task. The
job/task analysis determines the work functions to be performed on the job, the
conditions of the job, and knowledge, skill, ability and other requirements (KSAO’s)
needed to perform those tasks. Moreover, needs assessment phase involves

12
organizational analysis that determines training climate, identifies goals of the
organization, and external and legal constraints (Salas & Cannon-Bowers, 2001).
Need assessment process also includes requirement analysis in which the targeted job
is defined, methods of need assessment are chosen, participants are determined, and a
protocol is developed.
The methods of training can be classified into two: on-site methods and off-
site methods. On-site training involves techniques such as job rotation, vestibule
training, on the job training, and apprenticeship training. Off-site training methods
are seminars or lectures, programmed instruction, computer-assisted instructions,
audiovisual techniques, machine simulators, and behavioural modifications (Riggio,
2003). Additional methods such as management games, case study, role playing,
behavioural role modelling, laboratory training, achievement motivation training, and
leader match training are particularly used in training managerial and interpersonal
skills.
After employees receive training, it should be evaluated. Evaluation of
training is composed of comparing the results of training with the objectives of
training expected by managers, employees, and trainers. The evaluation of training
can be made using four levels of criteria; reaction, learning, behaviour, and results
(Kirkpatrick, 1977). Reaction refers to feeling of employees towards training
program whether they like it or not. Learning criterion assesses to what extents the
trainee has learned the principles, facts, and approaches that are included in the
training program. Behaviour criterion evaluates the job behaviour of the trainee. That
is, whether the behaviour has changed in the desired direction as a result of the
program. Lastly, the results part is related to tangible results that are achieved as a
result of the training program, such as reduction in cost or turnover, improvement in

13
production. Another study conducted by Alliger, Tannenbaum, Bennett, Traver &
Shotland (1997) divided the training reactions into affective and utility reactions, and
learning into post training measures of learning, retention, and behaviour/skill
demonstration.
1.4.4 Performance Appraisal
Performance management is a strategic approach to increasing the
effectiveness of organizations by improving the performance of the employees and
by developing the capabilities of teams and individual contributors (Baron &
Armstrong, 1998).
Borman and Motowidlo (1993) conceptualized job performance as
comprising task performance and contextual performance. They suggested that task
performance relates to the proficiency, with which employees perform core technical
activities that are important for their jobs, whereas contextual performance is defined
as extra task proficiency that contributes more to the organizational, social, and
psychological environment to help achieving organizational goals. Contextual factors
include aspects like persisting with enthusiasm and extra effort, volunteering to carry
out duties not formally part of one’s job, and endorsing and supporting
organizational objectives (Borman & Motowidlo 1993).
Performance appraisal is the process that determines how an employee is
performing on the job and communicates that information to the employee back.
Performance appraisal systems provide data for other HRM activities such as
promotion, layoffs, firing, and merit pay increases. Performance appraisal
information can also provide input for training and development needs of employees.
Additionally, it provides input for the validation of selection procedures and human
resource planning (Riggio, 2003). Finally, Cleveland, Murphy and Williams (1989)

14
stated that the results of performance appraisal are used to give feedback to
employees about their performance and to develop employee’s performance.
The performance of the employees is evaluated by their supervisors, peers or
outside sources like customers and employees themselves. Muchinsky (1999) stated
that there are different methods for performance appraisal. These methods are
classified in three groups. The first group is Graphic Rating Scales (GRS), which are
the most commonly used techniques of performance appraisal. In GRS, employees
are rated on a number of traits or factors. The rater judges how much each factor or
trait the employee has. Usually, employees are judged on a 5- or 7- point scale. The
number of factors ranges between 5 and 20 (Muchinsky, 1999).
The second group of methods is employee comparison methods that involve
rank-order, paired comparisons, and forced distribution. These rating scales are norm
referenced; that is, employees are evaluated against each other. With the rank-order
method, employees are rated from high to low on a given performance dimension.
However, since rank-order data have ordinal scale characteristics, the level of
performance is not known exactly. Additionally, in paired comparison method, each
employee is compared with every other employee and rater selects which of the two
is better on the dimension that is being evaluated. The method is typically used to
assess employees on overall ability to perform the job. Lastly, forced distribution
method is most useful when the number of employees being evaluated is high. In this
method, the raters assign employees to established categories ranging from poor to
good on the basis of comparison with all the other employees in the group (Riggio,
2003). However, this method is criticised because it creates artificial distinctions
between employees. The third group of performance appraisal methods is named as
behavioural checklists and scales. This group is composed of the techniques like
15
behaviourally anchored rating scales (BARS), behavioural-observation scales (BOS),
and mixed standard rating scales (Muchinsky, 1999).
Firstly, BARS is a combination of behavioural incident and rating scale
methods. In BARS, employee performance is rated on a scale in which scale points
are anchored with actual work behaviours. Raters read a number of behavioural
statements and then circle the number that corresponds to the statement that best
describes the employee’s behaviour. Unfortunately, the development of BARS is
time consuming.
Secondly, BOS is developed as an attempt to improve BARS. The assessor
rates the employee on the frequency of critical incidents or specific employee
behaviours. The rater observes the employee for a certain period of time and
evaluates him or her on a critical incident scale recording how often they observed
the behaviour (Muchinsky, 1999).
Finally, on mixed standard rating scales, the nature of performance dimension
and the levels of performance described by the behavioural examples are disguised.
The employee score is calculated after on the basis of rater responses to items
forming a specific dimension. Raters respond to behavioural statements that
demonstrate high, low, and average performance for each dimension. For each
statement, raters evaluate the employee’s performance whether it is better than, equal
to, or lower than the behaviour reflected in the statement (Murphy & Cleveland,
1995).
It is agreed that performance evaluation is a two way communication process.
That is, it involves an active communication between employees and supervisors
about performance. Therefore, feedback interviews that take place after performance
appraisals are important parts of the evaluation process. These interviews include

16
review of the strengths, needed improvements, as well as the overall progress of the
employee. The problems that are encountered are discussed and afterwards the
employee and the supervisor focus on the ways to improve performance. The issue of
how current performance fits with career goals of the employee is also discussed.
Finally, specific action plans are prepared for following term (Beardwell & Holden,
2001).
1.4.5 Career Planing and Development
Career planning and development aims to develop employees and to match
the employee’s knowledge, skills, abilities, and experience with the improvement
opportunities that are provided by the organization. Gutteridge (1986) stated that
organizations have some important reasons to have career planning and development
programs. First career planning is an effective way to deal with problems such as
voluntary turnover among managers and low level of productivity.
There are two perspectives of career planning process; organizational
centered vs. individual centered career planning. Organizational centered career
planning focuses on jobs and constructing career paths that provide logical
progression of individuals between jobs (Mathis & Jackson, 1991). Individual
centered career planning, on the other hand, focuses directly on employees. Their
skills and goals are at the hearth of the analysis.
Sümer (1998) stated that an effective career planning and development
system has four parts: human resource planning, individual assessment, matching,
and development. It is better to have individuals working for the organization to
perform career planning programs rather than individuals outside the firm since the
career planning process is closely related to the other HRM functions.
17
Human resource planning, which is the part of career planning and
development systems, aims to predict future personnel needs and to develop human
resource strategies in order to fulfil these needs. The goal of the individual
assessment part is to evaluate the knowledge, skills, attitudes, expectations, and
career interests of the employee who wants to plan his or her career. Matching part of
the career planning process compares employees’ career plans with the identified
future personnel needs of the organization. This part also involves the forming of
individual career development strategies. Lastly, the stage of career development
involves activities that get employees ready for achieving their career goals. These
activities can be listed as follows; job rotation, courses, seminars, workshops, and
money or time support for the graduate programs.
1.4.6 Human Resource Planning
“Human resource planning is the system of matching the supply of people,
internally (existing employees) and externally (those to be hired and searched for)
with over a given time frame” (Watters cited in Byars & Rue, 1991). Human
resource planning has two objectives; the optimum utilization of currently employed
human resources and providing future HR needs in the areas of skills and numbers
(Harvey & Bowin, 1996). Human resource planning is usually performed by both
human resource managers and operating managers.
Human resource planing consists of four basic steps. First, effect of general
objectives of organization on specific organizational units is determined. Next, skill,
expertise, and total number of employees are defined in order to achieve the
organization and departmental objectives. In the third step, additional human
resource requirements are determined in the light of the organizations current human

18
resources. The final step involves the development of action plans to meet the
anticipated human resource needs.
1.4.7 Compensation Management and Incentives
Compensation management can be defined as the system of rewards, which
an employee receives in return for organizational performance (Harvey & Bowin,
1996). While the organizations design their compensation systems, they have some
objectives. First, they try to acquire qualified personnel and retain present
employees. Next, the organizations aim to ensure internal and external equity of
wages that employees earn. The third objective is to reward desired behaviours of
employees like good performance and loyalty. The other objective of a rational
compensation program is to control costs of obtaining and retaining the
organization’s workforce. Finally, compensation management programs consider
legal constraints and provide compliance with all government regulations related
with employee compensation (Mathis & Jackson, 1991).
In compensation management, it is important to determine appropriate pay
level for each job. This is acquired through several phases. The first phase is to
collect information about jobs by conducting job analysis in order to determine job
and position descriptions and job standards. The second phase is the evaluation of
jobs in order to obtain internal equity in terms of pay with in the organization.
There are different methods to designate the relative worth of jobs, such as
job ranking, job grading, factor comparison, and point system (Hollenbeck & Wright,
1996). The next phase aims to ensure external equity in terms of pay systems by
conducting wage and salary surveys. These surveys find out what other employers in
the same sector are paying for specific jobs. There are many sources for this survey
information in North America. Among these sources are government’s department of

19
labour, employer, and professional associations and surveys conducted by HR
departments of the firms (Hollenbeck & Wright, 1996). The last phase is pricing
jobs. The job evaluation worth and labour market worth are matched in pricing jobs.
In addition to structuring of most efficient compensation program, the organizations
should communicate how these programs are formed and obtain employee
participation (Hollenback & Wright, 1996).
Human resource professionals also design and install incentive pay systems.
Incentives are pay systems that reward employees for their efforts beyond normal
performance expectations. In order to pay incentives, organizations measure
employee performance at three levels; individual level, group level, and
organizational level. Individual level incentives are merit pay, skill-based pay,
competency-based pay, piece rate pay, standard hour systems, employee suggestion
systems and commissions (Heneman & Gresham, 1998). Merit pay is provided to
employees for their individual behavioural contributions to organization. In skill-
based pay, pay increases are based on skill mastery. It is used by organizations in
order to improve organizational learning and promote flexibility. Moreover,
competency based pay rewards employee motivation and personality traits. The piece
rate plan pay is given for an individual output above a previously defined standard.
Specifically, it focuses on productivity enhancement. Additionally, standard hour
plans depend on the time for per unit of output and completion of a task in definite
time period. If employees complete their task before the designated time ends, they
receive a higher hourly wage. In employee suggestion systems, incentives are offered
to individuals for their suggestion that leads to cost saving.
In addition to individual level incentives, there are organizational level
incentives such as team-based merit pay, group incentives, team recognition, and

20
sales teams. The team-based merit pay depends on team performance evaluated by
team members and supervisor. On the other hand, group incentives rewarded the
group performance where it is hard to assess individual contributions of group
members. In team recognition, monetary or mostly non-monetary recognition awards
are offered for the team developing a more efficient way to produce products or
services (Heneman & Gresham, 1998).
Lastly, the organizational level incentives can be listed as follows;
gainsharing, profit sharing, stock sharing, and executive pay. Gainsharing
emphasizes costsavings, timesavings, and revenue enhancement. Profit sharing is a
group incentive pay plan that uses profitability as the standard for organizational
level incentives. Additionally, stock sharing is another group incentive-based pay
that provides employees with the ability to buy company stock at reduced rate per
share. Finally, executive pay is a form of profit and stock sharing that is applied to
top level management (Heneman & Gresham, 1998).
In addition, there are other incentives, which are non-monetary such as
providing plaquettes, novelty items, certificates, and time-off vacations.
1.4.8 Managing Employee Health and Safety
It is important for organizations to improve occupational safety and health,
which in turn, positively affects employee safety and health. Schuler (1995) defined
occupational safety and health as the physical and psychological conditions of
organization’s work force that results from the work environment provided by the
organization.
Improvement in occupational safety and health results in many benefits. For
instance, it improves productivity due to fewer lost workdays, savings of litigation
costs, fewer medical and insurance costs, reduction in insurance premiums, and

21
better selection ratios because of the enhanced image of the organization (Schuler,
1995).
As a result, the challenge of safety and health management provides human
resource professionals with achieving humanitarian goals, while obtaining significant
cost reductions for the organizations (Harvey & Bowin, 1996). In order to manage
employee health and safety, human resource departments coordinate health and
safety programs, develop safety reporting systems, and provide accident
investigation expertise and technical expertise on accident research and prevention.
Specifically, human resource departments are generally responsible from maintaining
government-required health and safety records, coordinating a safety training for new
employees, assisting the supervisors in investigating accidents in which an employee
was injured, and developing a plant-wide safety communication program and
informational materials (Harvey & Bowin, 1996).
1.4.9 Managing Union Relationships
Unions are effective forces that influence organizational practices, legislation,
and political thought. In some organizations, human resource departments are not
involved in labour relations because operating managers handle these issues. In other
organizations, on the other hand, human resource departments are completely in
charge of labour relations. Human resource departments that are involved in labour
relation process are mainly responsible from dealing with organizing attempts at the
company level to monitoring climate for unionization and union relationships,
helping in negotiating labour agreements and providing detailed knowledge of labour
legislation as may be necessary (Mathis & Jackson, 1991).
Collective bargaining is one of the major processes within labour relations.
The process takes place between managers and union representatives to reach an

22
agreement on employee wages and benefits, work rules, and the resolution of
disputes and violation of union contracts (Harvey & Bowin, 1996). For the human
resource department knowledge of collective bargaining is important. It is necessary
in compensation and benefits because wages and benefits are typically open to
negotiation.
Grievance management is another important process of labour relations. The
essential responsibilities of human resource department in grievance management are
assisting in designing the grievance procedure, monitoring trends in grievance rates
for the organization, assisting preparation of grievance cases for arbitration and
finally, having responsibility for setting grievances (Mathis & Jackson, 1991).
1.5 Current Human Resource Practices in Turkey
In Turkey, the transition from “personnel management” to “human resource
management” started in the late 1980’s. Altın (1997) stated that the changes in
Turkey’s economic and social life, education level and demographic composition,
quality of workforce, and unionism are among the factors that affected this transition.
Emre (1998) and Üsdiken (1996) stated that human resource management is
lately adopted from foreign countries and is still developing mostly by learning from
foreign experiences. Moreover, the authors stated that the academic interest in public
and business administration is affected the development of human resource
management in Turkey. The adoption of HRM from foreign countries and academic
interest in the area HRM determined the institutionalization of HRM discipline and
its further development in Turkey. In addition, Acuner (2001) stated that the
development of human resource management is not an internalized process. It is
simply adopted from abroad with the notion that in well-developed countries the
practices of human resource management increase the work productivity.
23
Efforts to improve HRM show variability by geographical region in Turkey.
The efforts are more common in Marmara region compared to East and Southeast
Anatolian regions due to the fact that the industry and exportation are well developed
in that region (Acuner, 2001).
Both organizational culture and practices of HRM are affected by culture of
the society in which the organization operates. The Model of Culture Fit explains the
way in which socio-cultural surrounding affects internal work culture and HRM
practices (Aycan, Kanungo, Mendonca, Yu, Deller, Stahl, & Kurshid, 2000). This
model was tested using 1954 employees from work organizations in 10 countries
such as Turkey, Germany, Canada, China etc. In this study, Turkey is identified as a
paternalistic and a collectivist society in which power distance is high. The findings
also revealed that managers who perceived paternalism and high power distance in
their socio-cultural environment do not provide job enrichment, empowerment.
Therefore, job enrichment, empowered supervision and performance based reward
management are not commonly applied in Turkish organizations (Aycan et al.,
2000).
Moreover, the organizational culture of the firms in Turkey is shaped by
several factors. First, managers believe that employee skills can be improved as a
result of training that they received. Therefore, organizations emphasize training and
development functions of HRM. However, in Turkey, managers believe that
employees are not proactive and do not seek responsibility. In addition, Aycan and
Kanungo (2000) stated that the practices of HRM are affected by managers’ beliefs
and assumptions about the employees. As a result managers should be made
conscious about the strategic importance of HRM practices in order to make them
support these activities.

24
Concerning the general structure of HRM, a study was conducted among 258
organizations through out Turkey and the findings stated that in 46.5% of the
organizations the managers of human resource department are members of executive
committees. The 87.9% of the organizations have a human resource strategy. Among
these organizations, 58.6% have a written HR strategy. In 60.6% of the
organizations, the manager of human resource department is involved in the process
of developing strategy of the organization. 95.5% of the organizations have a
structured policy for personnel recruitment and selection, 90.8% for training and
development of employees, 95.5% for wage systems, and 49.6% for flexible working
hours (Uyargil & Dündar, 2000).
Finally, the organizations generally do not have human resource departments
at their plants, branch offices, etc. (Acuner, 2001). Human resource practices at the
plants are performed in line with the directions coming from the head quarters.
1.5.1 Job Analysis
The results of a study conducted in 33 public sector and 253 private sector
organizations in Turkey revealed that in most of the organizations job analysis is not
performed frequently (Öztürk, 1995). In organizations that conduct job analysis, job
descriptions are formed as a result of job analysis. However, the organizations do not
updating those job descriptions regularly. In both sectors, job descriptions are
updated once a year or once every five year. However, it is better to update job
descriptions as the quality and property of job changes.
Furthermore, in the year 2000, Turkish Cabinet took a law-equivalent
decision that required all government organizations to do organizational and job
analyses and to conduct a position norm analysis. Therefore, many public sector
organizations provide assistance from industrial and organizational psychologists to

25
engage in the mentioned processes. For instance, Sümer & Erol (2003) performed a
study that aims to conduct position norm analysis in the light of job analysis
information in one of the public sector organizations in Turkey.
It can be concluded that law-equivalent decision made by the Cabinet, which
requires all government organizations to do organizational and job analyses and to
conduct a position norm analysis would improve the practices of job analysis in
Turkey.
1.5.2 Recruitment and Selection
The results of a study conducted within 258 organizations by Özçelik (2000)
showed that the organizations that do not have human resource department face more
difficulties in both selection of employees and providing the continuity of newly
selected employees in the organization, as compared to organizations that have
human resource department. In addition, the organizations that received support from
outside sources like consultant companies for their selection and recruitment process
are more likely to recruit employees from foreign countries as compared to ones that
do not have such consultancy.
Next, Öztürk (1995) stated that government organizations in Turkey received
consultancy from universities. However, private sector provided support from
consultant firms in selection process. Moreover, private sector mostly uses media
advertising and college recruitment as recruitment methods. Additionally, interviews
are mostly used as a selection method both in private and publicly owned
organizations. Psychological tests and other techniques are not commonly used. On
the other hand, some paper-pencil tests are used in selection process in both sectors
(1995). Lastly, Sümer, Çifci, Demirutku, and Sümer (2000) developed a personality

26
test battery for Turkish Armed Forces to be used in the selection of officers recruited
from outside sources.
1.5.3 Training and Development of Employees
Concerning training issue, a study conducted by Cengizhan and Ersun (2000)
showed that human resource departments are involved training activities in Turkey.
Training units in organizations generally function under the administration of human
resource department. Individuals working in training units and senior managers
generally prepare the training programs. These programs are developed based on the
training needs of employees. Usually, human resource departments conducted need
analysis in organizations and need analysis is formed on the basis of both
performance appraisal of employees and the information received from interviews
conducted with their managers about their performance. Moreover, employees who
participate in a training program are selected by department chiefs, managers, and
human resource departments. Also, employees are generally asked about their
willingness to participate in a training program. Lastly, the results of the study
(Cengizhan & Ersun, 2000) presented that both on-site and off-site training methods
are used in organizations. The training programs are usually evaluated by
questionnaires.
Furthermore, Acuner (2001) stated that training is identified to be the most
widely used practice in organizations that operate in Blacksea region of Turkey. The
second widely used practice is revealed as job rotation. The third technique is the
employee participation in organizational decisions. Training programs are provided
to all employees in organizations without regarding their level of position. Job
rotation, on the other hand, is performed with personnel who do not have a manager
role. Acuner (2001) also showed that the organizations generally have training units

27
that functioned in accordance with human resource departments in the head offices.
They have ready to use training programs that are applied to high level managers and
to newly selected employees. As a training method, on the job training is widely used
within the organizations. Generally managers decide which training program to be
applied without considering the developmental needs or specific demands of
personnel.
Moreover, Başboğaoğlu (1999) stated that there is a lack of training specialist
in application of training programs, and training programs mostly include theoretical
knowledge rather than practical applications. Unfortunately, training evaluation
systems are not common in most of the organizations.
On the contrary, Aycan and Balcı (2001) examined the factors that play a role
in evaluation process of training programs and they found that individual factors,
organizational factors, and the factors related to training programs played a role in
the effectiveness of training programs. The effectiveness of training programs are
evaluated by three factors; transformation of training programs in job environment,
performance improvement, and changes in attitudes towards the job. The findings of
the study revealed that in organizations operating in Turkey, pre-knowledge about
the topic of training programs, attitudes and expectations of employees towards the
training programs, organizational support, source adequacy, the method and time of
training programs, the effectiveness of trainer and the factors used to accelerate
learning are among the factors that positively effected the transformation of training
programs in job environment. Moreover, Aycan and Balcı (2001) found that being
job-oriented, tenure, attitudes and expectations of employees towards the training
programs, organizational support, and source adequacy are among the factors that
positively affected the performance of the employees. Finally, attitudes and

28
expectations of employees towards the training programs, organizational support,
source adequacy, supervisor’s support, the effectiveness of trainer and the factors
used to accelerate learning are among the factors that have positive effect on attitudes
towards the job.
1.5.4 Performance Appraisal
The results of a study, which examined the performance appraisal systems of
organizations operating in different parts of Turkey, demonstrated that rank order
was the first and forced distribution was the second widely used techniques of
performance appraisal (Erdil, 1998). Performance of employees is generally
evaluated by their first (22.8%) and second rank superiors (14%) in of the
organizations. The employee performance is evaluated twice a year (47.2%) and
once a year (37.7%) in most of the organizations. In evaluation of performance;
desire for achievement, coordination, communication, customer orientation, and
creativity are commonly used as performance criteria. Results of performance
appraisal systems are used mostly for rewarding employees. The other areas that use
results of performance appraisal systems are determining the weaknesses and
strengths of employees, preparation of training programs, and long term career
planning for employees. Face to face interviews are conducted with employees after
performance evaluation in 76% of the organizations in the sample.
Additionally, Sümer (2000) stated that reward distribution based on needs of
employees rather than on performance is more likely to be preferred in Turkey. Also,
the high level of power distance between managers and employees in Turkey lead to
the distribution of sources of organizations based on political issues rather than on
performance. Sümer (2000) also suggested that the training of performance appraiser
would improve the performance appraisal systems in Turkish work organizations.

29
The appraisers should be trained especially in terms of giving feedback to employees
about their performance.
1.5.5 Career Planning and Development
Concerning career planning and development activities, the results of a
research conducted in Turkey revealed that career planing is not an important aspect
of HRM in private organizations (Soysal, 2000). Some of the plausible reasons of
this fact can be listed as follows; 1) the organizations involved in the study were
family firms, they had a hierarchical structure and less opportunity for employees to
promote; 2) the managers did not possess effective leadership skills so they were not
able to direct employees for future duty and responsibilities; 3) human resource
planning function is not carried out sufficiently neither in private sector nor in state
economic enterprises (Öztürk, 1995).
In addition, the findings of a survey conducted by Arthur Andersen
Consulting Company in 750 small, medium and large sized Turkish work
organizations operating in different sectors such as construction and material,
technology, media, textile, finance and metal industries revealed that only 42% of
companies had systematic career management systems (Arthur Andersen, 2000).
Other findings of the study were; 1) 84.7 % of the companies that had a career
management system applied it together with their performance systems, 2) in 31.2 %
of organizations with a career management system, HRM departments informed the
employees about the required competencies, 3) 72.5 % of the organizations informed
their employees about required performance level. This application resulted in
accomplishment of coaching function of career development process, 4) employees
had been informed about the training that they needed to receive and length of time

30
that they needed to work in a specific position in 69.8 % and 44.4 % of the
organizations, respectively.
1.5.6 Compensation Management
The findings of a survey conducted in 750 small, medium, and large sized
Turkish work organizations operating in different sectors such as construction and
material, technology, media, textile, finance and metal industries showed that in 94.4
% of the organizations wage increases are dependent on the inflation rate and in
82.6% of the organizations they are dependent on performance ratings (Arthur
Andersen, 2000). Moreover, in 57.7 % of the companies, the seniority is another
factor that affected the wage increments. In addition, 70.9 % of the organizations
make wage increments twice a year and 10.5 % once a year. Also, the increment
rates are in 51 % - 75 % range in 65.6 % of the organizations and in 26 %- 50 %
range in 22.5 % of the organizations. Moreover, general managers and first rank
supervisors determined the wage level of managerial positions with rates of 77.7 %
and 50.0 %, respectively. On the other hand, first level supervisors and HR managers
played a role with rates of 63.0 % and 49.8 %, respectively. Additionally, job
evaluation, which is an important process of compensation management, was
performed in 45.6 % of the organizations. The 35.8 % of these organizations used the
results of job evaluation in wage determination process.
In terms of incentives and benefits, the survey (Arthur Andersen, 2000) had
several results; 1) the most widely applied incentive was food ticket (93.3% and 95.0
% of managerial and non-managerial positions, respectively); 2) the other common
incentives for managerial positions were company car assignment (85.7 %), gasoline
allowance (77.1 %), and health insurance (71.1 %); 3) the incentives provided for
non-managerial positions were health insurance (54.8%), payments in religious

31
festivals (42.2 %) and fuel allowance (41.2 %); 4) the most widely used incentive
pay systems were individual based premiums with a rate of 57.8 %; 5) however, in
16.3% of the organizations there were not any provided incentive system.
1.6 Human Resource Management Practices in Different Countries
A major transformation in form and function of the HRM practices has taken
place within the past two decades throughout the world. Intensified foreign
competition, rapid technological changes, greater needs for innovation and workers’
demands for empowered jobs have led organizations to engage in efficient human
resource practices (Kalleberg & Moody, 1994). Organizations try to establish an
effective HRM because there is a positive relationship between HRM effectiveness
and firm performance (Huselid, 1995). Moreover, the results of a study in 385 small
business organizations operating in the USA revealed that HR practices influenced
organizational climate, which in turn influenced customer HR practices such as
developmental performance appraisal systems and establishing an internal equity of
rewards positively affected employee commitment towards the organization
(Whitener, 2001). Because of these positive effects of HRM in organizational
functioning, organizations started to develop their HRM practices. In the following
sections the HRM practices of different countries is briefly reviewed and in Table 1.1
the summary of HRM activities in different countries is presented. However, it
should be kept in mind that Table 1.1 does not necessarily represent the whole HRM
activities performed in different countries and the findings are not the resulted from
cross-cultural comparisons. Results are only reflective of the situations in the
sampled organizations in studies conducted in different countries. Yet, this table is
expected to help readers understand the nature of HRM activities very roughly in
different countries.

1
T
able
1.1
HR
M A
ctiv
ities
in D
iffe
rent
Cou
ntri
es
Cou
ntry
HR
M
US
Can
ada
Ja
pan
H
olla
nd
Eas
tern
Eur
ope
Rec
ruitm
ent m
etho
d on
line
recr
uitm
ent
Se
lect
ion
Too
l te
sts
tes
ts
wor
k sa
mpl
es
inte
rvie
ws
w
alk-
in
asse
ssm
ent c
ente
rs
int
ervi
ews
tes
ts
Fr
eque
ncy
of P
A
annu
al
ann
ual
annu
al
PA
met
hods
BO
S ra
nkin
g m
etho
ds
32
B
AR
S G
RS
360
deg
rees
feed
back
T
rain
ing
met
hods
jo
b ro
tatio
n
on th
e jo
b tr
aini
ng
o
n th
e jo
b tr
aini
ng
lect
ures
/sem
inar
s
o
ff th
e jo
b tr
aini
ng
Ben
efits
, Inc
entiv
es, R
ewar
ds
heal
th in
sura
nce
pens
ion
plan
s e
duca
tion
supp
ort
educ
atio
n s
uppo
rt
relig
ious
fest
ival
pay
fle
xibi
lity/
vari
abili
ty
of jo
bs
recr
eatio
nal
faci
litie
s
fu
el a
llow
ance
qu
ality
cir
cles
bo
nus
prem
ium
pa
rtic
ipat
ive
deci
sion
m
akin
g

33
1.6.1 United States of America
According to the results of a study conducted in 50 major U.S. service and
manufacturing companies, the top HRM activities are as follows:
1. Proactive planning to maintain appropriate staffing levels
2. Implementing more effective selection and promotion practices
3. Establishing systematic management development
4. Giving employee training and development a greater priority
5. More involvement in strategic planning and restructuring
6. Reducing human resource bureaucracies and increasing customer service
7. Applying value added performance appraisals and reviews
8. Developing flexible compensation and benefit systems
9. Using pay based performance incentives
10. Effectively monitoring work relations and morale (“Retaining Workers”, 1999).
In addition, Selden, Ingraham, and Jacobson (2001) stated that in terms of
selection process, several states in U.S., such as Kansas, have abandoned the use of
centralized civil service exams and established skill matching programs that fill
positions based on a set of core competencies. Several states have adopted
automated application systems that help managers match applicant skills with skills
required by jobs. Other innovations in selection process involve use of pass/ fail
examinations, walk-in testing applying online and signing bonuses.
The practices of performance appraisal are common in the USA. Selden et al.
(2001) stated that thirty-seven states have an annual formal performance appraisal.
Eleven states required supervisors to appraise their staff twice a year. In New
Jersey’s performance appraisal system, there has to be at least three interactive
discussions about employee performance between employees and their supervisors

34
throughout the year. The first meeting is the initial performance agreement in which
the department’s work goals and employee work responsibilities are discussed. The
expected standards of achievement and employee goals are also identified in the first
session. In the second session, the progress of the employee is analyzed and a
development plan is made. The third formal meeting takes place at the end of the
year. In this meeting, the overall performance of the employee is evaluated.
Moreover, Selden et al. (2001) stated that performance management systems
require employees and managers to determine the goals together, establish how
employees or teams contribute to the organizational goals, identify strengths and
weaknesses of an individual’s performance, and recognize high performance in U.S.
recently. According to the same study, many states in the U.S. use non-monetary
reward systems that include job and time flexibility. However, the use of monetary
tools such as individual and group performance bonuses is not common.
1.6.2 Canada
Relatively limited information is available concerning the HRM practices in
Canada. However, Ng and Maki (1993) found that small and large organizations in
Canada differ in their ranking of the importance of HRM activities. There were three
most important activities for smaller firms. The first one was “retaining activities”
that included administrating personnel records, payroll processing, health and safety
compliance, public relations, and vacation processing. The second one was the
“obtaining activities” that was composed of pre- employment testing, recruiting, and
hiring. The last one was the “identifying activities” that involved human resource
planning and job evaluation.
For larger firms the most important activities were as follows. The first one
was the “adjustment activities” that involved promotion, transfer, and the separation

35
of employees; union management relations; disciplinary issues, and employee
assistance plan administration. This is followed by “identifying and developing
activities” in which skill training, orientation, and career development were
emphasized.
The results of a research conducted by Wager (1998) in 1000 small
organizations in Canada revealed that half of the organizations had a formal
performance appraisal system and employee pension plan. Almost 30% of
employers had a job sharing program and about 27% of organizations conducted
employee attitude surveys. Employee assistance programs and presence of a HRM
department were less common. Moreover, Wager pointed out that there was a strong
relationship between progressive decision making ideology and HRM practices. In
other words, firms that valued open communication and employee participation in
decision making were more likely to implement HRM practices in Canada.
Finally, a survey conducted in Canada demonstrated that there were
differences between most successful and least successful organizations in terms of
HRM practices (“Human Resource”, 1994). The first difference was that most
successful plants made use of employee work teams more than least successful ones.
The second difference was that most successful plants emphasized training issues
more than the least successful ones. The successful plants trained their production
workers and their supervisory or technical staff. The training programs involved
training employees in advanced skills such as problem solving or quality.
1.6.3 Japan
Japan is another country that is active in HRM practices. In terms of
selection process, the traditional way of hiring inexperienced graduates from elite
universities has been questioned in Japan and organizations have started to hire

36
white-collars or technical workers without college degrees (Selmer, 2001). Selmer
(2001) also presented that sophisticated tests and other screening devices are used in
selection of employees. After permanent workers are hired, they received a
prolonged orientation program that has been designed to create the culture of loyalty
(Kandel, 2001).
Furthermore, as it is the leading economy in its region, the Japanese
organizations have increased to spend on training, and other human resource
development activities (Zhu, 2004). The employees received extensive training
programs. Most companies provided different kinds of trainings such as job rotation,
on the job training, and periodic off the job training (Koike, 1997). However, as
stated by Zhu (2004), there are differences in terms of training activities among
different sectors in Japan. For instance, sectors of financing insurance and real estate
have the highest percentage (94%) in implementing training programs. On the
contrary, the sectors of communication and transport have the lowest percentage
(51%) in providing training programs to their employees.
Additionally, Takeuchi (1990) stated that performance evaluations are done
annually or sometimes more frequently in Japan. Performance evaluations do not
only depend on performance in terms of output but also on attitudes, ability, growth
in skills, and processes for generating output. Both supervisors and human resources
department appraise the employees. Human resource department participates in the
process in order to increase objectivity and company-wide consistency.
In addition, the organizations in Japan are leaving the traditional salary
increment based on seniority and they have started to depend on individual ability
and performance in salary increment. Since the early 1990’s some companies have
developed job ability based systems. These systems focus on goal in evaluation of
37
employee performance (Selmer, 2001). Moreover, salary administration is basically
the function of the human resources department. Salary is paid to “person” so it
differs among the employees who do the same work. Furthermore, in large firms
employees received profit sharing and bonuses as incentives (Kandel, 2001).
Finally, labor-management relations are very different in Japan. In most
industries, employees working for a particular company form unions. The members
of unions include production workers, supervisors, foreman, and white collar
employees. Unlike American practices, seniority of union members does not play a
significant role (Takeuchi, 1990).
1.6.4 European Human Resource Management
Clark and Pugh (1999) examined the HRM functions in 7 European
countries (United Kingdom, Germany, Spain, Denmark, France, Netherlands, and
Sweden). They concluded that HRM was valued as a source of competitive
advantage in most of these countries. Also, there was a decentralization of
responsibility for HR issues from state to firm level and personnel function to line
management. Lastly, there was a strong emphasis on integration of HR strategies
with corporate strategies to make them mutually reinforcing.
Pugh and Clark (1999) stated that there was a considerable degree of
convergence among four of the seven countries in terms of HRM practices. These
countries were France, Netherlands, Sweden, and United Kingdom. There were four
factors that affected the similarity of HRM in these countries. The first factor was
that these countries accepted the U.S. management philosophies and practices of
HRM. Secondly, the governments and employers in these 4 countries faced similar
economic problems and development. Consequently, HRM was used as a novel way
to gain a competitive advantage in these countries. For instance, in France, HRM
38
was associated with government’s attempts to create a cheaper and flexible work
force. While in Sweden it was associated with individualization of employment
relationship (Brunstein, 1995). Third factor was the increasing decentralization of
industrial relations, institutions, and practices in many of these countries. With
decentralization, the locus of collective bargaining shifted from national or multi
company level to firm or plant level. In addition, decentralization resulted in a
decline in union membership. The final factor was that management sought greater
autonomy from the workforce. For example, in Britain, HRM became a powerful
managerial rhetoric that reflected current societal values and political priorities
(Clark & Pugh, 1999).
Furthermore, concerning selection activity in Holland, it was found that
work samples, paper and pencil tests, assessment centers, and interviews are
common selection devices (Wiersma, Van den Berg, & Latham, 1995). The other
practices that are valued by organizations in Holland are job analysis, career
development, developing selection techniques and instruments.
In terms of performance evaluation, managers, and employees engage in two
types of appraisal in Holland. One of them is a top-down method in which the
employee performance is evaluated by immediate supervisor. The second one is a
bilateral evaluation in which employee and supervisor discuss employee
performance together. Generally, organizations conduct formal performance
appraisals once a year. In addition, Wiersma et al. (1995) stated that BOS are used
more than trait scales and BARS in Dutch organizations. Other than these
performance appraisal techniques, 360-degree feedback, although not widely used,
is conducted by some consulting companies. Moreover, organizations in Holland
use intrinsic rewards more than extrinsic ones to motivate their employees.

39
Providing employees with additional education, increasing task variety and
flexibility of jobs, applying participative decision making, and forming quality
circles can be given as examples of intrinsic rewards that are used.
1.6.5 Eastern Europe
As Kiriazov, Sullivan and Tu (2000) stated that HR practices in Eastern
Europe are relatively immature despite efficient HRM practices in Western Europe.
They stated that countries in Eastern Europe focus more on personnel administration
than the integration of HR practices with corporate strategy. Specifically, in terms of
selection activities, it can be said that only few firms have well developed selection
systems. Application forms and informational interviews have started to be applied
recently and these interviews measure competence, motivation, and communication
skills. However, application forms or interviews still contain personal questions that
are considered discriminatory against minorities (Kriazov et al., 2000). In addition,
performance appraisal methods are gaining popularity among East European HR
professionals. Ranking methods and graphic ratings are applied in some of the
organizations. Using performance appraisal to reward employees is becoming more
common. However, there is still some resistance to performance based pay,
especially among older workers.
According to the Kiriazov et al (2000), in Eastern Europe firms recognize
importance of training and development. However, they lack financial resources and
expert trainers. The most popular training technique is on the job training. Among
the other common techniques are classroom lectures and seminars. As compensation
practices analyzed, it is seen that typical East European managerial compensation
package consists of base pay, other cash, benefits, and bonuses. Among them base
pay has the largest portion with 65%. Organizations also offer social benefits, which

40
are valued by employees. For example, women have company paid maternity leave
with guarantee to return to same position. The tenured employees have unlimited
paid sick leave. Moreover, large firms sponsor schools, housing, holiday
accommodations, recreational facilities, and cafeterias (Kiriazov et al., 2000).
Hence, it seems fair to conclude that HRM is an immature but developing issue in
East European countries.
In conclusion, the purpose of the present study was to explore the nature of
the HRM practices in a sample of Turkish private sector organizations. Furthermore,
after exploring the extent of major HRM functions in the participating organizations,
a comparison of the HRM activities in the Turkish and foreign organizations were
made based on the available studies on HRM practices in other countries.

41
CHAPTER 2
METHOD
2.1 Sample
Seven-hundred-fifty organizations operating throughout Turkey in various
sectors had been contacted via telephone and e-mail in order to participate in this
research. However, the final sample included 200 organizations, with a 27% return
rate. The organizations in the sample were the members of both Personnel Managers
Association (PERYON) and Quality Association (KALDER) in Turkey. PERYON is
an association in Turkey that was established to operate in the field of human
resource and personnel management in 1971. It has been working for the
development of human resource management throughout Turkey for more than two
decades. Secondly, KALDER is an organization that was established in 1991 with a
vision of becoming an exemplary organization in the world by the efficient
deployment and efficient use of the Total Quality Management throughout Turkey.
In addition, 85% of the participating organizations in the final sample were
also among the ones that have been identified as the first 1000 companies of Turkey
as classified by the Istanbul Association of Manufacturers in the year 2001. Among
the participants there were managers, coordinators or employees working in HRM
departments; owner and general managers of these organizations.

42
2.1.1 Profile of the Organizations
In this section, characteristics of the participating organizations (i.e., sector
they operate in, age, and size) are evaluated.
2.1.2 Sector of the Organizations
A frequency analysis was conducted to find out the distribution of the
organizations by sector. The results in Table 2.1 revealed that 16 % of the 200
organizations was operating in sector of automotive, 15 % of them was in textile
sector. Moreover, the sectors of health and medicine, technology, fast consumer
goods, and construction and material represented the 9.5 %, 8.5%, 7.5%, and 7.0% of
the organizations, respectively.
Table 2.1 Distribution of the Participating Organizations by Sector
Sector Frequency Percentage % Automotive 32 16 Textile 30 15 Health and Medicine 19 9.5 Durable Consumer Goods 18 9 Technology 17 8.5 Metal 16 8 Fast Consumer Goods 15 7.5 Construction and Material 14 7 Energy 8 4 Insurance 6 3 Service 5 2.5 Communication 4 2 Finance 4 2 Holding Company 4 2 Consultancy 3 1.5 Tourism 3 1.5 Education 1 0.5 Missing 1 0.5 Total 200 100
2.1.3 Age of the Organizations
In order to find out the age profile of the organizations another frequency
analysis was conducted. The results in Table 2.2 indicated that 50.5 % and 38% of

43
the organizations were aged between 0- 25 and 26-50 years, respectively. The 6.5%,
3.5% and 1.5% of the remaining organizations were aged between 51-75, 76-100,
101 and over years old, respectively.
Table 2.2 Age Profile of the Organizations
Age Profile Frequency Percentage 0-25 Ages 101 50,5 26-50 Ages 76 38 51-75 Ages 13 6,5 76-100 Ages 7 3,5 101 and Over Ages 3 1,5 Total 200 100
2.1.4 Size of the Organizations
In the identification of the size of the organizations, the standards of
KOSGEB (Small and Medium Industry Development Organization) were used
(Arthur Andersen, 2000). Based on these standards, the organizations that had 0- 49
employees were identified as small-sized organizations. Those that had 50-199
employees and over 200 employees were classified as medium-sized organizations
and large-sized organizations, respectively.
As seen in Table 2.3, 65% (N = 130) of the 200 organizations were large-
sized. Twenty-four percent of the organizations employed between 50-199 people,
and lastly the percentage of small-sized organizations was 11% (N = 22).
Table 2.3 Size Profile of the Organizations
Size of the Organization Frequency Percentage % 0- 49 Employees 22 11 50-199 Employees 48 24 200 and over Employees 130 65 Total 200 100
As it was illustrated at Table 2.3, it can be concluded that most of the
organizations in the sample were large-sized (N = 129), the remaining of the
organizations were medium- and small sized organizations with frequency of 48 and

44
22, respectively. Moreover, most of the large-sized organizations were in the sectors
of textile (N = 24), automotive (N = 23), construction and material (N = 14), and
metal (N = 13). The frequency of the medium-sized organizations analyzed disclosed
that more than half of the medium sized organizations belong to sectors such as
technology (N = 7), automotive (N = 7), fast consumer goods (N = 6), health and
medicine (N = 5), and durable consumer goods (N = 5). Lastly, the small-sized
organizations were mostly belong to sectors of technology (N = 4), health and
medicine (N = 4), textile (N = 3), automotive (N = 2), metal (N = 2), and durable
consumer goods (N = 2).
Table 2.4 The Frequency Distribution of Size of Organizations by Sector
Sector Small-sized Medium-sized Large-sized Finance - 1 3 Technology 4 7 6 Fast Consumer Goods 1 6 8 Construction and Material 1 - 13 Health and Medicine 4 5 10 Communication - 1 3 Automative 2 7 23 Textile 3 3 24 Metal 2 1 13 Durable Consumer Goods 2 5 11 Holding Company 1 - 3 Consultancy 1 2 - Energy - 1 7 Tourism - 2 1 Insurance - 5 1 Education - - 1 Service 1 2 2 Total 22 48 129
2.2 Measure
Data were collected by using a structured questionnaire which was formed to
assess human resource management practices of the organizations operating in
Turkey (See Appendix A). The questionnaire was consisted of 83 questions and 12
major sections. The two sections were about profile of the organizations (sector, size,

45
age, etc.) and HR departments. The remaining 10 sections were about HRM
functions such as job analysis and design, recruitment, personnel selection,
orientation, training and development, performance management, career planning
and development, human resource planning, compensation management and benefits,
employee relations, and employee health and safety.
There were 10 open ended questions asking for the name of the organization,
age of the organization, size of the organization, and age of the manager of HRM
department, etc. and the remaining 73 were in multiple choice format. For instance,
the questions like sector of the organization, name of HRM department, title of the
person who is responsible for HRM functions at first level etc. were among the
multiple choice questions. The participants were able to mark more than one item for
36 of the multiple choice questions, such as functioning areas of HRM department,
the areas in which the job analysis results were used, and methods of job analysis.
2.3 Procedure
The questionnaire was placed on the internet site of the Middle East
Technical University (METU) Career Planning Center. In order to attract people an
e-mail was sent to whole e-mail group members of PERYON by the president of
Ankara Office. In this e-mail, the aim and scope of the research had been explained
and members were requested to participate in the study by visiting the home page of
METU Career Planning Center and clicking on the link of the questionnaire.
However, out of approximately 1000 recipients, only 65 participants filled out the
questionnaire.
On the next stage, member lists of both PERYON and KALDER were
obtained and 300 organizations were reached and asked to participate in the study.

46
However, only 135 of the organizations among 250 organizations that accepted to
participate in the research filled out the questionnaire.
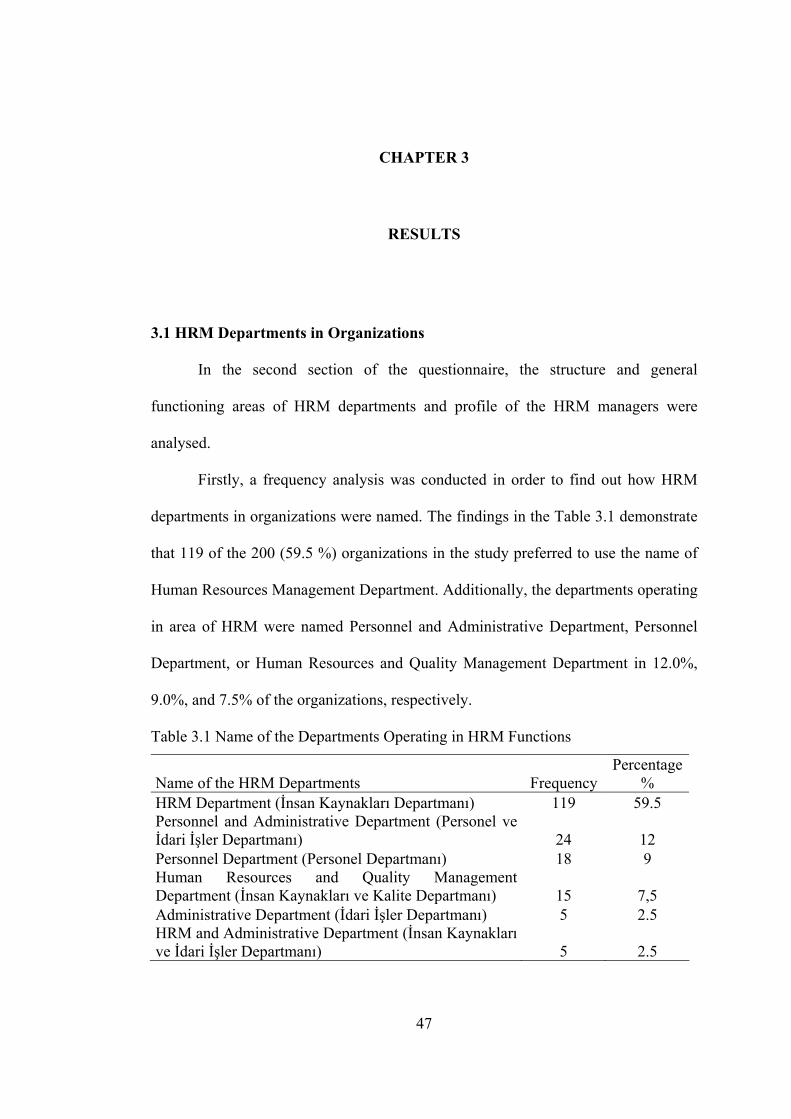
47
CHAPTER 3
RESULTS
3.1 HRM Departments in Organizations
In the second section of the questionnaire, the structure and general
functioning areas of HRM departments and profile of the HRM managers were
analysed.
Firstly, a frequency analysis was conducted in order to find out how HRM
departments in organizations were named. The findings in the Table 3.1 demonstrate
that 119 of the 200 (59.5 %) organizations in the study preferred to use the name of
Human Resources Management Department. Additionally, the departments operating
in area of HRM were named Personnel and Administrative Department, Personnel
Department, or Human Resources and Quality Management Department in 12.0%,
9.0%, and 7.5% of the organizations, respectively.
Table 3.1 Name of the Departments Operating in HRM Functions
Name of the HRM Departments Frequency Percentage
% HRM Department (İnsan Kaynakları Departmanı) 119 59.5 Personnel and Administrative Department (Personel ve İdari İşler Departmanı) 24 12 Personnel Department (Personel Departmanı) 18 9 Human Resources and Quality Management Department (İnsan Kaynakları ve Kalite Departmanı) 15 7,5 Administrative Department (İdari İşler Departmanı) 5 2.5 HRM and Administrative Department (İnsan Kaynakları ve İdari İşler Departmanı) 5 2.5

48
Table 3.1 Continued General Director Office (Genel Müdürlük) 4 2 Industrial Relations and HRM Department (Endüstri İlişkileri ve İnsan Kaynakları Departmanı) 3 1.5 HRM and Training Department (İnsan Kaynakları ve Eğitim Departmanı) 2 1 Finance Department (Finans Departmanı) 2 1 Management, Organizational Development and HRM Department (Yönetim, Organizasyonel Gelişim ve İnsan Kaynakları Departmanı) 2 1 Missing 1 0.5 Total 200 100
Moreover, the descriptive analysis revealed that the minimum number of
employees working in HRM departments was 1 and the maximum number was 48
with a mean and standard deviation of 5.98 and 6.81, respectively. The frequency
analysis presented in the Table 3.2 illustrates that in 21% of the HRM departments 2
people were employed. In addition, the number of employees working in HRM
departments was 3 and 1 in 15.5% and 11.0% of the organizations, respectively. In
other words, there were 5 employees or less than 5 employees working in HRM
departments in 65.0% of the 200 organizations.
Furthermore, in 20.0% (N = 40) of the organizations, the employee number of
HRM departments was between 6 and 10. In medium-sized organizations, most of
the organizations (79.2%) had 1-5 employees working in HRM departments and in
12.5% of the organizations the employee number in HRM department was between 6
to 10 individuals. In addition, in 72.7% (N = 16) of the small-sized organizations
HRM department was consisted of 1 to 5 individuals and only 14.6% (N = 3) of the
small-sized organizations there were 6 to 10 employees working in HRM
department.

49
Table 3.2 Frequency Distribution of Number of Employees in HRM Department
Number of Employees Frequency Percentage % 1 22 11 2 42 21 3 31 15.5 4 20 10 5 15 7.5 6 10 5 7 12 6 8 8 4 9 4 2 10 6 3 11 3 1.5 12 5 2.5 13 1 0.5 14 2 1 15 2 1 16 4 2 18 1 0.5 22 1 0.5 23 1 0.5 24 1 0.5 25 2 1 29 1 0.5 31 1 0.5 47 1 0.5 48 1 0.5
Missing 3 1.5 Total 200 100
Also, the descriptive analysis demonstrated that the minimum number of
hierarchy levels in HRM departments was 1 and the maximum number was 6 with a
mean and a standard deviation of 245 and 1.06, respectively. Moreover, the Table 3.3
demonstrates that in 71 organizations (35.5%) there were 2 hierarchical levels. The
number of hierarchy levels in HRM departments were 3 and 1 in 31.5% and 19.0%
of the organizations, respectively.
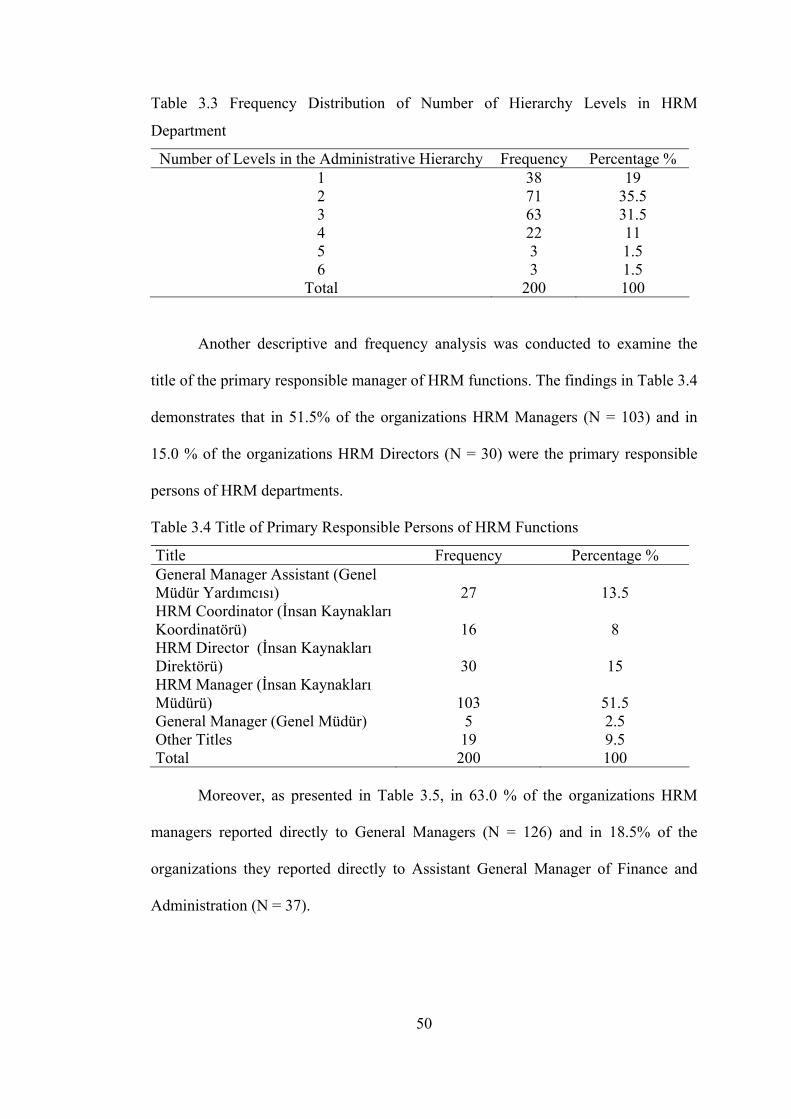
50
Table 3.3 Frequency Distribution of Number of Hierarchy Levels in HRM
Department
Number of Levels in the Administrative Hierarchy Frequency Percentage % 1 38 19 2 71 35.5 3 63 31.5 4 22 11 5 3 1.5 6 3 1.5
Total 200 100
Another descriptive and frequency analysis was conducted to examine the
title of the primary responsible manager of HRM functions. The findings in Table 3.4
demonstrates that in 51.5% of the organizations HRM Managers (N = 103) and in
15.0 % of the organizations HRM Directors (N = 30) were the primary responsible
persons of HRM departments.
Table 3.4 Title of Primary Responsible Persons of HRM Functions
Title Frequency Percentage % General Manager Assistant (Genel Müdür Yardımcısı) 27 13.5 HRM Coordinator (İnsan Kaynakları Koordinatörü) 16 8 HRM Director (İnsan Kaynakları Direktörü) 30 15 HRM Manager (İnsan Kaynakları Müdürü) 103 51.5 General Manager (Genel Müdür) 5 2.5 Other Titles 19 9.5 Total 200 100
Moreover, as presented in Table 3.5, in 63.0 % of the organizations HRM
managers reported directly to General Managers (N = 126) and in 18.5% of the
organizations they reported directly to Assistant General Manager of Finance and
Administration (N = 37).

51
Table 3.5 Executive Managers Reported by HRM Managers
The Individuals to Whom HRM Managers Report Frequency Percentage
% General Manager (Genel Müdür) 126 63 Assistant General Manager of Finance and Administration (Finans ve İdari İşlerden Sorumlu Genel Müdür Yardımcısı) 37 18.5 President of Executive Committee (Yönetim Kurulu Başkanı) 12 6 Assistant General Manager HRM and Administration (İnsan Kaynakları ve İdari İşlerden Sorumlu Genel Müdür Yardımcısı) 7 3.5 General Coordinator (Genel Koordinatör) 6 3 Branch/Factory Manager (Fabrika Müdürü) 6 3 HRM Director (İnsan Kaynakları Direktörü) 5 2.5 Coordinator of Administration and Marketing (İdari İşler ve Pazarlama Koordinatörü) 1 0.5 Total 200 100
As the education level of HRM Managers was analyzed, as the findings in the
Table 3.6 showed that 63.0% (N =126) of the HRM managers were university
graduates and 31.0% (N = 62) of HRM managers had a masters degree.
Table 3.6. Education Level of HRM Managers Education Level Frequency Percentage % High School 4 2 University Graduate 126 63 Masters Degree 62 31 Doctorate 8 4 Total 200 100
As it was further examined and demonstrated in Table 3.7, the 16.5% (N =
33) of HRM managers had a university degree in management and 13.0% (N = 26)
of HRM managers had a masters degree in Management of Business Administration
(MBA). Nine and a half percent of HRM managers were graduated from economy
department of universities (N = 19).

52
Table 3.7 Education Fields of HRM Managers
Education Fields Frequency Percentage % University Degree in Management 33 16.5 University Degree in Social Sciences 6 3 University Degree in Economy 19 9.5 University Degree in Administrative and Economic Sciences 6 3 University Degree Industrial Engineering 8 4 University Degree in Other Engineering Departments 6 3 University Degree in Educational Sciences 7 3.5 University Degree in Other Departments 12 6 Masters Degree in MBA 26 13 Masters Degree in Industrial Engineering 9 4.5 Masters Degree in Educational Sciences 3 1.5 Masters Degree in Administrative and Economy Sciences 9 4.5 Masters Degree in Human Resources Management 5 2.5 Masters Degree in Other Departments 10 5 Doctorate Degree in Management 3 1.5 Doctorate Degree in Industrial Engineering 1 0.5 Missing 37 18.5 Total 200 100
The results of the descriptive analysis which was conducted to examine the
age profile of HRM managers revealed that the youngest HRM Manager is 24 years
old and the oldest one is 67 years old with a mean and standard deviation of 40.4 and
8.9, respectively. The frequency analysis presented in the Table 3.8 demonstrates that
the 36.0 % of HRM managers were aged between 36 - 45 years old (N = 72) and
33.5 % of them were between 24 - 35 years old (N = 67).
Table 3.8 Age of HRM Managers Age of HRM Managers Frequency Percentage % 24 - 35 Years Old 67 33.5 36 - 45 Years Old 72 36 46 - 55 Years Old 37 18.5 55 and Over Years Old 15 7.5 Missing 9 4.5 Total 200 100
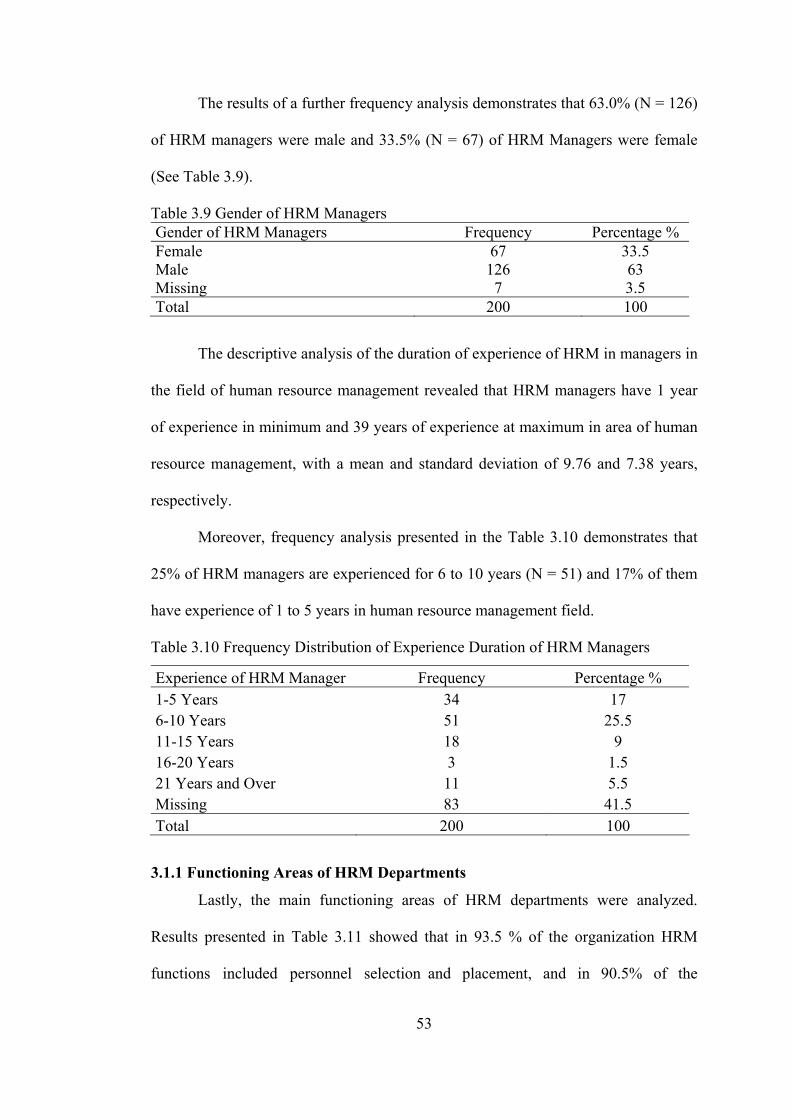
53
The results of a further frequency analysis demonstrates that 63.0% (N = 126)
of HRM managers were male and 33.5% (N = 67) of HRM Managers were female
(See Table 3.9).
Table 3.9 Gender of HRM Managers Gender of HRM Managers Frequency Percentage % Female 67 33.5 Male 126 63 Missing 7 3.5 Total 200 100
The descriptive analysis of the duration of experience of HRM in managers in
the field of human resource management revealed that HRM managers have 1 year
of experience in minimum and 39 years of experience at maximum in area of human
resource management, with a mean and standard deviation of 9.76 and 7.38 years,
respectively.
Moreover, frequency analysis presented in the Table 3.10 demonstrates that
25% of HRM managers are experienced for 6 to 10 years (N = 51) and 17% of them
have experience of 1 to 5 years in human resource management field.
Table 3.10 Frequency Distribution of Experience Duration of HRM Managers
Experience of HRM Manager Frequency Percentage % 1-5 Years 34 17 6-10 Years 51 25.5 11-15 Years 18 9 16-20 Years 3 1.5 21 Years and Over 11 5.5 Missing 83 41.5 Total 200 100
3.1.1 Functioning Areas of HRM Departments
Lastly, the main functioning areas of HRM departments were analyzed.
Results presented in Table 3.11 showed that in 93.5 % of the organization HRM
functions included personnel selection and placement, and in 90.5% of the

54
participating organizations HRM functions included recruitment. However, functions
such as social (9.5%) and administrative services (3.5%), and quality (3.5%) were
not performed as much as the other HRM functions.
Moreover, 12.5% of the organizations (N = 25) perform 16 of the 19 HRM
functions presented in Table 3.11 such as job analysis, job design, recruitment,
personnel selection and placement, orientation, training and development,
performance management, career planning, HR planning, employee health and
safety, compensation and benefits, payroll, employee transportation and food
services, matters pertaining to personnel and employee relations. In addition, 2.5% of
the organizations (N = 5) perform the functions that were mentioned above except
for employee relations.
Table 3.11 HRM Functions
HRM Functions Frequency Percentage % Personnel Selection and Placement 187 93.5 Recruitment 181 90.5 Training and Development 167 83.5 Compensation and Benefits 164 82 Matters Pertaining to Personnel 162 81 Performance Management 161 80.5 Orientation 160 80 Payroll 149 74.5 Employee Health and Safety 147 73.5 Job Analysis 131 65.5 Meal 126 63 Human Resource Planning 117 58.5 Transportation 115 57.5 Career Planing 94 47 Employee Relations 90 45 Job Design 76 38 Social Services 19 9.5 Quality Management 7 3.5 Administrative Services 7 3.5
Furthermore, cross-tab analyses were conducted to present the relation
between size of the organizations and the performed HRM activities for exploratory
55
purposes (See Appendix B). The findings demonstrated that 70.2% (N = 92) and
21.4% (N = 28) of the organizations that perform job analysis were large- and
medium-sized organizations, respectively. However, the correlation was not found to
be significant (Spearman rho = .16, p < .05). In terms of recruitment activity, the
results revealed that 68.5% (N = 124) and 22.1% (N = 40) of the organizations that
performed recruitment were large- and medium-sized (Spearman rho = .23, p < .001 ,
Chi-square = 10.9, p < .01). Moreover, 95.4% (N = 124 ), 83.3% (N = 40) 77.3% (N
= 17) of the large-, medium-, and small-sized organizations in the sample carried out
recruitment activities. The 67.4% (N = 126), 22.5% (N = 42) and 10.2% (N = 19) of
the organizations that engaged in personnel selection activities were large-, medium-
and small-sized organizations (Spearman rho = .19, p < .01, Chi-square = 7.19, p <
.05). In other words, the 86.4% (N = 19) of the small-sized, 87.5% (N = 42) of the
medium-sized and 96.9% (N =126) of the large-sized organizations conducted
personnel selection activities. Additionally, 10.8% (N = 18), 21.0% (N = 35), and
68.3% (N =114) of the 167 organizations that carried out employee training activities
were small-, medium-, and large-sized organizations, respectively. In other words,
the 81.8% of the small-sized, 72.9% of the medium-sized and 87.7% of the large-
sized organizations engaged in employee training activities. However, the correlation
was not found to be significant (Spearman rho = .14, p > .05). Considering
performance appraisal activity, the results showed that 10.6% (N = 17 ), 21.1% (N =
34) and 68.3% (N = 110) of the 161 organizations that carried out performance
management activities were small-, medium-, and large-sized organizations,
respectively. However, the correlation was not found to be significant (Spearman rho
= .13, p > .05). Considering career planning activity, the results showed that 7.9% (N

56
= 10), 22.2% (N = 28) and 69.8% (N = 88) of the 126 organizations that carried out
career planning and development activities were small-, medium- and large-sized
organizations, respectively (Spearman rho = .14, p < .05). Lastly, the results showed
that 13.3% (N = 12), 11.1% (N = 10) and 75.6% (N = 68) of the 90 organizations that
engaged in managing employee relations activities were small-, medium- and large-
sized organizations, respectively (Spearman rho = .16, p < .05, Chi-square = 14.94, p
< .001). In other words, the 54.5% of the small-sized, 20.8% of the medium-sized
and 52.3% of the large-sized organizations engaged in managing employee relations.
3.1.1.1 Correlations Among HRM Functions
For exploratory purposes, bivariate correlations were computed to find out the
correlations among different HRM functions1. The results presented in Appendix C
showed that HRM departments of the organizations that performed job analysis were
likely to perform functions such as job design (r = .55, p < .01) and performance
management (r = .47, p < .01), human resource planning (r = .45, p < .01),
orientation (r = .40, p < .01), career planning (r = .40, p < .01), training and
development (r = .36, p < .01), personnel selection and placement (r = .24, p < .01),
recruitment (r = .23, p < .01), and compensation management (r = .18, p < .05).
These findings are also in line with the literature since activities of job design,
performance appraisal, orientation, career planning, training and development,
personnel selection and placement, recruitment and compensation management make
use of job analysis results (Mathis & Jackson, 1991).
In addition, correlation analysis revealed that the HRM departments that
performed job design were likely to function in HRM practices such as performance
1 Phi coefficients were also computed instead of each bivariate correlation analysis and the results demonstrated that there were no diferences between the two kinds of correlational analysis.

57
appraisal (r = .31, p < .01), career planning (r = .32, p < .01), human resource
planning (r = .51, p < .01). Moreover, HRM departments that perform recruitment
processes were more likely to operate in personnel selection (r = .40, p < .01), and
orientation (r = .28, p < .01).
The correlational analysis also revealed that the HRM function of personnel
selection process was significantly and positively correlated with orientation (r = .33,
p < .01), training (r = .43, p < .01), performance appraisal (r = .38, p < .01), career
planning (r = .30, p < .01), and compensation management (r = .30, p < .01).
The organizations that functioned in orientation were likely to operate in
training (r = .73, p < .01), performance appraisal (r = .54, p < .01), and career
planning (r = .43, p < .01).
The training function of HRM was found to be positively and significantly
correlated with performance appraisal (r = .46, p < .01) and career planning (r = .39,
p < .01). Additionally, the HRM departments that functioned in performance
management activities were likely to perform activities of career planning (r = .51, p
< .01), human resource planning (r = .38, p < .01), and compensation management
(r = .26, p < .01).
It was also found that career planning activities were positively and
significantly correlated with human resource planning (r = .50, p < .01) and
compensation management (r = .34, p < .01).
Moreover, the organizations that operated in compensation management were
found likely to perform the activities of both making payroll (r = .29, p < .01) and
personnel matters (r = .34, p < .01). Also, the activity of making payroll was

58
positively correlated with personnel matters (r = .68, p < .01), employee health and
safety activities (r = .38, p < .01), transportation (r = .36, p < .01), and food services
(r = .31, p < .01).
In addition, HRM departments that worked in the area of employee health and
safety were likely to perform employee relation activities (r = .25, p < .01). The
HRM departments that were responsible for social services such as arranging social
activities or preschool services were likely to work in areas of quality management
(r = .50, p < .01) and administrative services (r = .40, p < .05).
3.2 Job Analysis
In this section, the proportion of the participating organizations conducting
job analysis, the areas in which the results of job analysis are used, the performers of
job analysis, the methods and, lastly, the frequency of job analysis are presented.
First, as shown in Table 3.12, 65.5% of the surveyed organizations conduct
job analysis (N = 131).
Table 3.12 Job Analysis
Job Analysis Frequency Percentage % Not Performed 69 34.5 Performed 131 65.5 Total 200 100
Second, the findings presented in Table 3.13 demonstrates that in 64.3% of
the 157 organizations, which performed job analysis, the results of the job analysis
were used in the field of selection and placement and compensation management.
Moreover, it was found that 61.1% of the organizations use the results of job analysis
in training and development. Performance appraisal (55.4%), job design (50.3%),
promotion and assignment (48.4%), career planning (47.8%), recruitment
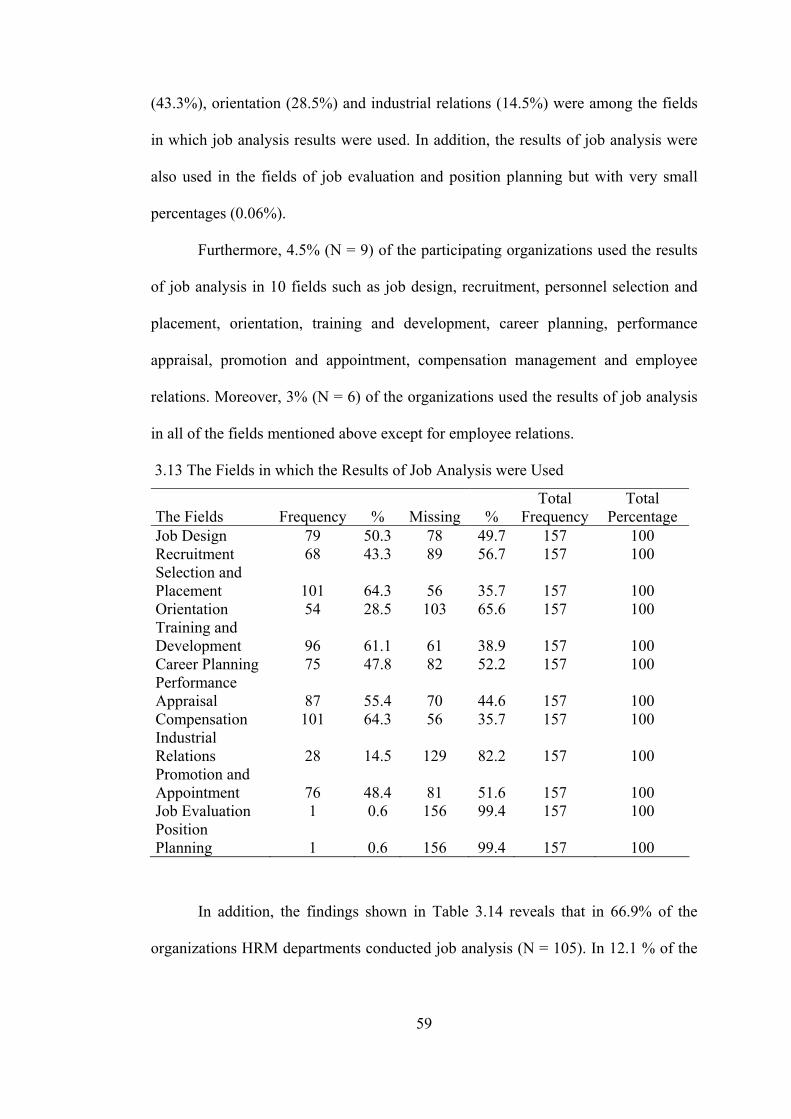
59
(43.3%), orientation (28.5%) and industrial relations (14.5%) were among the fields
in which job analysis results were used. In addition, the results of job analysis were
also used in the fields of job evaluation and position planning but with very small
percentages (0.06%).
Furthermore, 4.5% (N = 9) of the participating organizations used the results
of job analysis in 10 fields such as job design, recruitment, personnel selection and
placement, orientation, training and development, career planning, performance
appraisal, promotion and appointment, compensation management and employee
relations. Moreover, 3% (N = 6) of the organizations used the results of job analysis
in all of the fields mentioned above except for employee relations.
3.13 The Fields in which the Results of Job Analysis were Used
The Fields Frequency % Missing % Total
Frequency Total
Percentage Job Design 79 50.3 78 49.7 157 100 Recruitment 68 43.3 89 56.7 157 100 Selection and Placement 101 64.3 56 35.7 157 100 Orientation 54 28.5 103 65.6 157 100 Training and Development 96 61.1 61 38.9 157 100 Career Planning 75 47.8 82 52.2 157 100 Performance Appraisal 87 55.4 70 44.6 157 100 Compensation 101 64.3 56 35.7 157 100 Industrial Relations 28 14.5 129 82.2 157 100 Promotion and Appointment 76 48.4 81 51.6 157 100 Job Evaluation 1 0.6 156 99.4 157 100 Position Planning 1 0.6 156 99.4 157 100
In addition, the findings shown in Table 3.14 reveals that in 66.9% of the
organizations HRM departments conducted job analysis (N = 105). In 12.1 % of the

60
organization consultancy firms and individual consultants conducted job analysis (N
= 19).
Table 3.14 Frequency Distribution of Job Analysis Performers
JA Performers Frequency Percentage % HRM Department 105 66.9 Consultancy Firms 19 12.1 HRM Department & Consultancy Firms 6 3.8 Consultants out of the Organizations 5 3.2 General Manager 5 3.2 HRM Department & Managers of Relevant Departments 4 2.5 Production Planning Department 4 2.5 Quality Management Department 3 1.9 Organization Planning Department 3 1.9 HRM & Quality Department 1 0.6 Directorship of System Development 1 0.6 Missing 1 0.6 Total 157 100
Next, Table 3.15 presents that employee interview method was used to
conduct job analysis in 69.4% of the participating organizations (N =109) and 59.2%
of the organizations (N =93) used the method of observation. In addition, in 37.6 %
(N = 59), 36.9% (N = 58) and 33.1% (N = 52) of the organizations the methods of
job experts, questionnaire, and job analysis form were used, respectively. However,
the other methods of manager interview (2.5%) and benchmarking (0.5%) were not
used commonly by the participating organizations.
Table 3.15 The Methods of Job Analysis
Methods of Job Analysis Frequency
Percen-tage % Missing
Percen-tage %
Total Frequency
Total Percen-
tage Employee Interview 109 69.4 48 30.6 157 100 Observation 93 59.2 64 40.8 157 100 Job Experts 59 37.6 103 98 62.4 100 Question-naire 58 36.9 99 63.1 157 100 JA Form 52 33.1 105 66.9 157 100
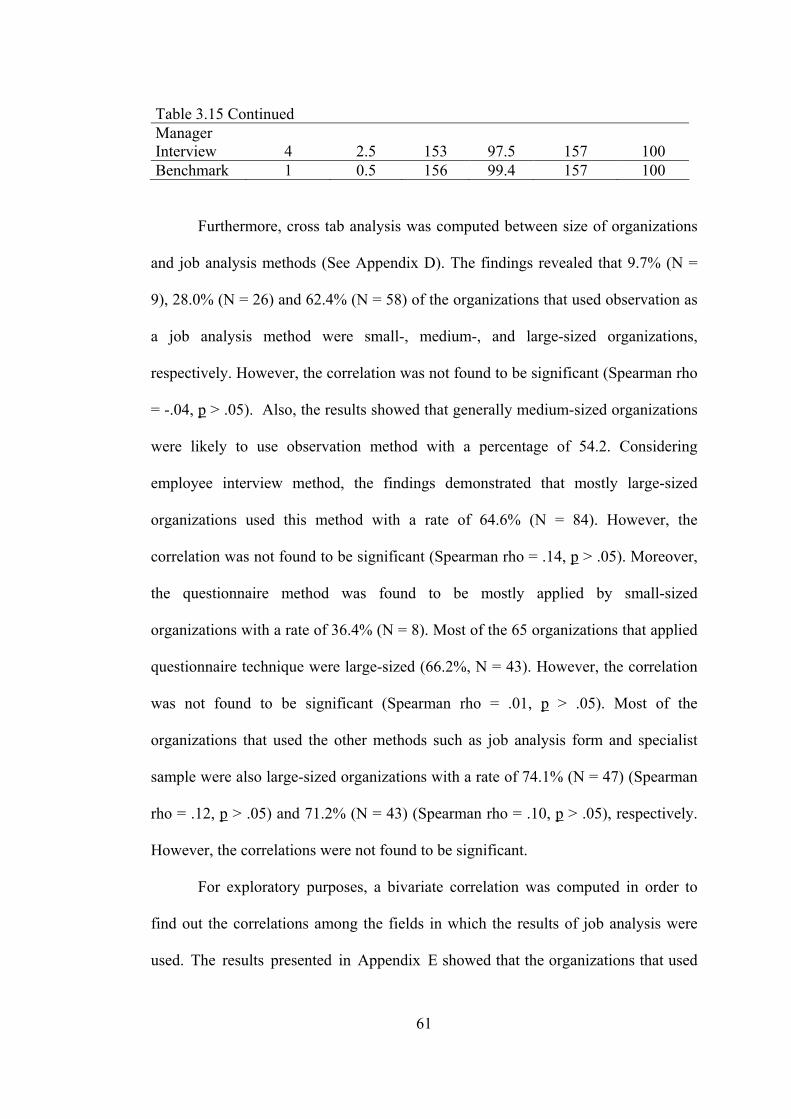
61
Table 3.15 Continued Manager Interview 4 2.5 153 97.5 157 100 Benchmark 1 0.5 156 99.4 157 100
Furthermore, cross tab analysis was computed between size of organizations
and job analysis methods (See Appendix D). The findings revealed that 9.7% (N =
9), 28.0% (N = 26) and 62.4% (N = 58) of the organizations that used observation as
a job analysis method were small-, medium-, and large-sized organizations,
respectively. However, the correlation was not found to be significant (Spearman rho
= -.04, p > .05). Also, the results showed that generally medium-sized organizations
were likely to use observation method with a percentage of 54.2. Considering
employee interview method, the findings demonstrated that mostly large-sized
organizations used this method with a rate of 64.6% (N = 84). However, the
correlation was not found to be significant (Spearman rho = .14, p > .05). Moreover,
the questionnaire method was found to be mostly applied by small-sized
organizations with a rate of 36.4% (N = 8). Most of the 65 organizations that applied
questionnaire technique were large-sized (66.2%, N = 43). However, the correlation
was not found to be significant (Spearman rho = .01, p > .05). Most of the
organizations that used the other methods such as job analysis form and specialist
sample were also large-sized organizations with a rate of 74.1% (N = 47) (Spearman
rho = .12, p > .05) and 71.2% (N = 43) (Spearman rho = .10, p > .05), respectively.
However, the correlations were not found to be significant.
For exploratory purposes, a bivariate correlation was computed in order to
find out the correlations among the fields in which the results of job analysis were
used. The results presented in Appendix E showed that the organizations that used

62
the results of job analysis in recruitment practices were likely to use the same results
in areas of personnel selection (r = .61, p < .01) and orientation (r = .56, p < .01).
Additionally, the organizations that made use of job analysis results in the
HRM function of training and development were likely to use the job analysis results
in the functions such as career planning (r = .50, p < .01), promotion and
appointment (r = .43, p < .01), and performance appraisal (r = .40, p < .01). The
correlational analysis also revealed that career planning, in which the results of job
analysis were used, was significantly and positively correlated with other areas in
which the job analysis results were used such as promotion and appointment (r = .51,
p < .01) and performance management (r = .45, p < .01
Additionally, the organizations that made use of job analysis results in the
HRM function of performance appraisal were likely to use the job analysis results in
functions such as promotion and appointment (r = .47, p < .01) and compensation
management (r = .40, p < .01). Lastly, the organizations that made use of job analysis
results in the HRM function of compensation management were likely to use the job
analysis in the area of promotion and appointment (r = .50, p < .01).
Moreover, the frequency analysis revealed that 11.0% (N = 22) of the
participating organizations were likely to use the combination of observation,
employee interview, and questionnaires when they were conducting job analysis.
Furthermore, the combination observation and employee interview methods was
used by 7.0% (N = 14) of the organizations. Lastly, the 6.0% (N = 12) of the
participating organizations preferred to use the combination of observation,
employee interview, and interviews with job expert methods in their job analysis
process.

63
Finally, the frequency of job analysis in the organizations was examined and
the results are presented in Table 3.16. In 58 (36.9%), 38 (24.2%), and 24 (15.3%) of
the organizations job analysis was conducted once a year, once in every two or three
years, once in every four or five years, respectively. However, in 18.4% of the
organization job analysis was not conducted systematically (N = 29). Those
organizations performed job analysis in unsystematic intervals, in time of a need or
after organizational changes.
Table 3.16 Frequency of Job Analysis
Performance Frequency of JA Frequency Percentage % Once a Year 58 36.9 Once in Every 2-3 Years 38 24.2 Once in Every 4-5 Years 24 15.3 In Time of a Need 11 7 Unsystematic Intervals 9 5.7 After Organizational Changes 9 5.7 First Time 4 2.5 Twice a Year 2 1.3 Missing 2 1.3 Total 157 100
3.3 Recruitment
In this section, recruitment process of HRM is evaluated by means of
conducting frequency analyses that analyse the methods of recruitment applied in the
participating organizations, the effective methods of recruitment, methods of internal
recruitment, and the number of the organizations that had structured tools for
organizational presentation.
First, it was concluded that the methods that are used for employee
recruitment were different than the ones used for manager recruitment. For instance,
as shown in Table 3.17 the method of walk-ins was the most frequently used method
in employee recruitment with a percentage of 72.5 (N = 145). However,
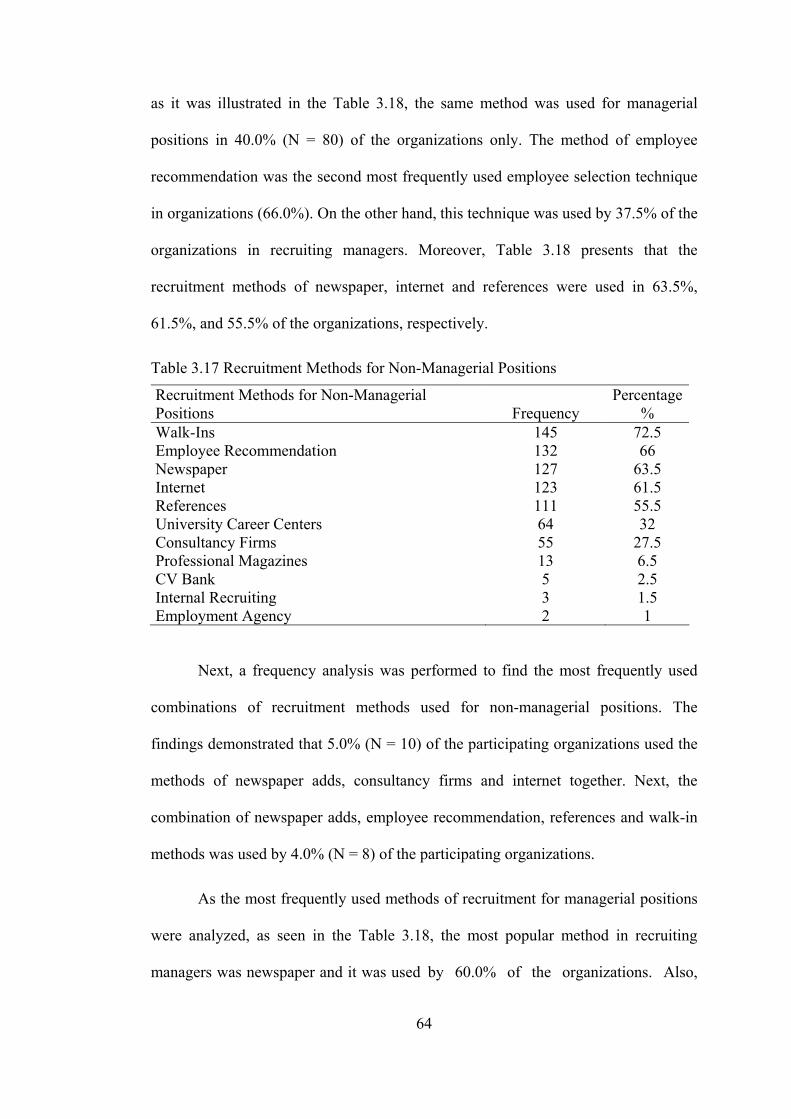
64
as it was illustrated in the Table 3.18, the same method was used for managerial
positions in 40.0% (N = 80) of the organizations only. The method of employee
recommendation was the second most frequently used employee selection technique
in organizations (66.0%). On the other hand, this technique was used by 37.5% of the
organizations in recruiting managers. Moreover, Table 3.18 presents that the
recruitment methods of newspaper, internet and references were used in 63.5%,
61.5%, and 55.5% of the organizations, respectively.
Table 3.17 Recruitment Methods for Non-Managerial Positions
Recruitment Methods for Non-Managerial Positions Frequency
Percentage %
Walk-Ins 145 72.5 Employee Recommendation 132 66 Newspaper 127 63.5 Internet 123 61.5 References 111 55.5 University Career Centers 64 32 Consultancy Firms 55 27.5 Professional Magazines 13 6.5 CV Bank 5 2.5 Internal Recruiting 3 1.5 Employment Agency 2 1
Next, a frequency analysis was performed to find the most frequently used
combinations of recruitment methods used for non-managerial positions. The
findings demonstrated that 5.0% (N = 10) of the participating organizations used the
methods of newspaper adds, consultancy firms and internet together. Next, the
combination of newspaper adds, employee recommendation, references and walk-in
methods was used by 4.0% (N = 8) of the participating organizations.
As the most frequently used methods of recruitment for managerial positions
were analyzed, as seen in the Table 3.18, the most popular method in recruiting
managers was newspaper and it was used by 60.0% of the organizations. Also,
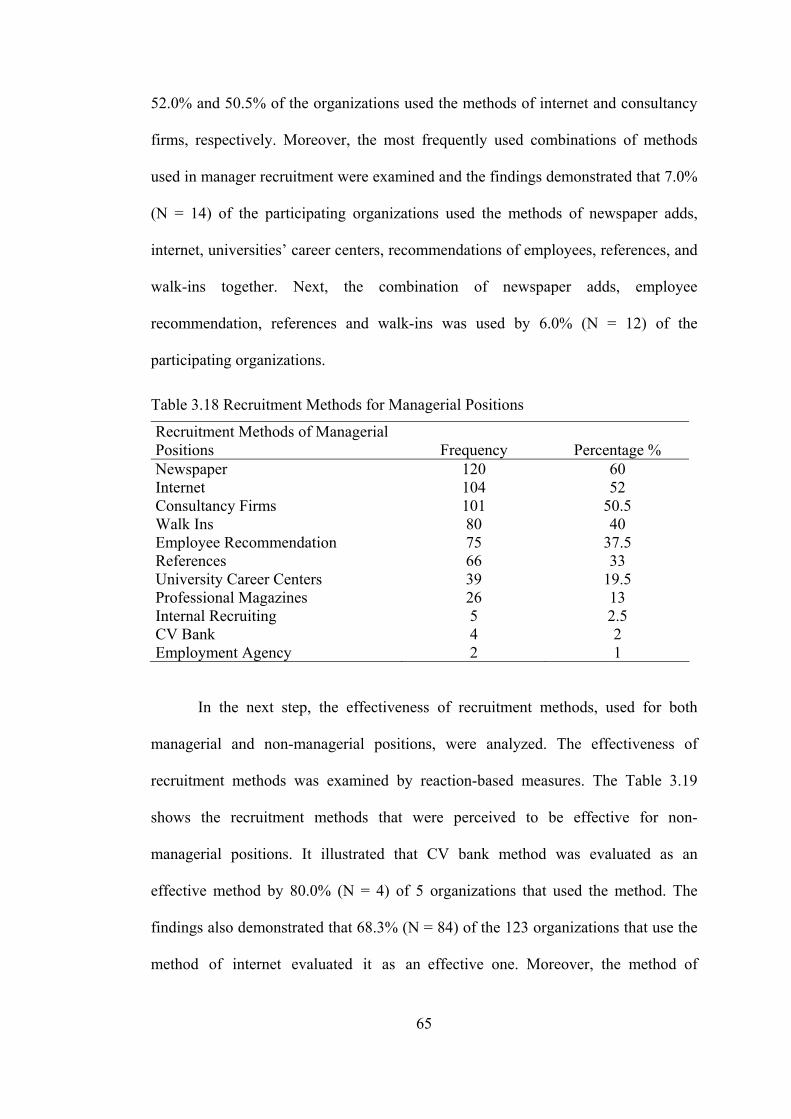
65
52.0% and 50.5% of the organizations used the methods of internet and consultancy
firms, respectively. Moreover, the most frequently used combinations of methods
used in manager recruitment were examined and the findings demonstrated that 7.0%
(N = 14) of the participating organizations used the methods of newspaper adds,
internet, universities’ career centers, recommendations of employees, references, and
walk-ins together. Next, the combination of newspaper adds, employee
recommendation, references and walk-ins was used by 6.0% (N = 12) of the
participating organizations.
Table 3.18 Recruitment Methods for Managerial Positions
Recruitment Methods of Managerial Positions Frequency Percentage % Newspaper 120 60 Internet 104 52 Consultancy Firms 101 50.5 Walk Ins 80 40 Employee Recommendation 75 37.5 References 66 33 University Career Centers 39 19.5 Professional Magazines 26 13 Internal Recruiting 5 2.5 CV Bank 4 2 Employment Agency 2 1
In the next step, the effectiveness of recruitment methods, used for both
managerial and non-managerial positions, were analyzed. The effectiveness of
recruitment methods was examined by reaction-based measures. The Table 3.19
shows the recruitment methods that were perceived to be effective for non-
managerial positions. It illustrated that CV bank method was evaluated as an
effective method by 80.0% (N = 4) of 5 organizations that used the method. The
findings also demonstrated that 68.3% (N = 84) of the 123 organizations that use the
method of internet evaluated it as an effective one. Moreover, the method of

66
internal recruiting was evaluated as an effective method by 66.7% (N = 2) of the 3
organizations that use the method. Lastly, the method of newspaper adds was
evaluated as an effective way of recruiting non-managerial positions by 60.6% (N =
77) of the 127 organizations that use the method.
Table 3.19 Effective Recruitment Methods for Non-Managerial Positions
Recruitment Methods for Non-Managerial Positions
Number of Organizations Using
the Method
Frequency of Organizations Evaluating the
Method as Effective
Perceived Effectiveness
(%) CV Bank 5/200 4 80 Internet 123/200 84 68.3 Internal Recruiting 3/200 2 66.7 Newspaper Adds 127/200 77 60.6 Consultancy Firms 55/200 25 45.5 Employee Recommendation 132/200 56 42.4 References 111/200 47 42.3 Walk Ins 145/200 58 40 University Career Centers 64/200 19 29.7 Professional Magazines 13/200 2 15.4
Table 3.20 demonstrates the most effective ways of manager recruitment as
perceived by the organizations. Fifty two (51.5%) of the 101 organizations that had
consultancy firms to recruit their managerial positions evaluated this method as an
effective one. Also, 56 (46.0%) of the 120 organizations that used the method of
newspaper adds evaluated it as an effective way to recruit managers. In addition, the
method of internet was found to be another effective way to recruit managers by
39.4% of the 104 organizations that used this method (N = 41).
The method of professional magazines was not evaluated as effective as the
other methods. Only, 15.4% and 12.8% of the organizations that used this method
evaluated it as an effective one for recruiting employees and managers, respectively.

67
Table 3.20 Effective Recruitment Methods for Managerial Positions
Recruitment Methods of Managerial Positions
Number of Organizations
Using the Method
Frequency of Organiza-tions Evaluating the Method as Effective
Perceived Effective-ness (%)
Consultancy Firms 101/200 52 51.5 Newspaper Adds 120/200 56 46 Internet 104/200 41 39.4 CV Bank 4/200 1 25 References 66/200 15 22.7 Employee Recommendation 75/200 15 20 Internal Recruiting 5/200 1 20 Walk Ins 80/200 15 18.8 University Career Centers 39/200 5 12.8 Professional Magazines 26/200 2 07.8
The next step was to specifically examine the method of internal recruitment.
It was found that 55.0% (N = 110) of the organizations performed internal recruiting.
As demonstrated in Table 3.21, there were 5 different ways to perform internal
recruitment. Thirty nine and a half percent (N = 79) and 20.0% (N =40) of the
organizations used the methods of organizational intranet and job posting,
respectively.
Table 3.21 The Ways of Internal Recruitment
Ways of Internal Recruiting Frequency Percentage % Intranet 79 39.5 Job Posting 40 20 Verbal Communication 15 7.5 Meetings 6 3 Journal of the Organization 3 1.5
Lastly, the participating organizations were examined in order to see if they
provide organizational information to their new employees and it was concluded that
68.5% of the organizations apply structured methods such as video presentations,

68
brochures in order to provide organizational information to their new employees (N
= 137).
3.4 Position Norm Analysis
Concerning position norm analysis, the analyses were performed in order to
examine the number of organizations that employ position norm analysis, the
applicability and length of position planning.
First, it was found that 74.0% of the organizations (N = 148) performed the
practices of position norm analysis. However, only 35.5% of the 148 organizations
managed to apply the results of position norm analysis and in the remaining 60.0% of
the organizations position planning was partly applied.
In addition, the organizations performed position norm analysis for different
lengths of duration. For example, 46.5% of the 148 organizations performed their
position norm analysis for 1 to 3 years (N = 93). Moreover, the position norm
analysis was conducted once a year and once in every 4 or 5 years in 18.0% and
5.5% of the organizations, respectively.
3.5 Personnel Selection
Frequency analyses were performed to examine the number of organizations
that owned a structured personnel selection system, the methods of selection used by
the organizations and their effectiveness, the methods of selection interview
performed by organizations, and the scoring systems of the interviews.
First, the results revealed that a structured personnel selection system was
present in 50.8% (N = 95) of the responding organizations that apply personnel
selection practices. In 20.3% (N = 38) of the responding organizations a structured
selection system partly existed and in 3.2% (N = 6) of them there was not such a

69
structured system. However, the remaining organizations (25.7%) did not mention
the kind of the interviews they performed.
As demonstrated in the Table 3.22 and 3.23, 92.5% of the organizations used
the method of interviews for non-managerial positions and 85.0% of the
organizations use the same method for managerial positions. Moreover, the method
of references were used in 69.0% (N = 138) and 65.0% (N = 130) of the
organizations for non-managerial and managerial positions, respectively. The
personality tests were the third and biographical data were the fourth most commonly
used method to select both managers and non-managers. Forty one point five
percentage (N = 83) of the organizations preferred to use that method for non-
managerial positions and 37.5% (N = 75) of them for managerial positions. In
addition, the results revealed that 39.0% the organizations used the method of
biographical data for non-managerial positions and 34.5% of them for managerial
positions.
Table 3.22 Methods Used to Select Non-Managers
Methods of Personnel Selection for Non-Managers Frequency Percentage % Interview 185 92.5 References 138 69 Personality Tests 83 41.5 Biographical Data 78 39 Skill Tests 69 34.5 Occupational Tests 63 31.5 Mechanical Tests 53 26.5 IQ Tests 38 19 Assessment Centers 35 17.5 Integrity Tests 17 8.5 Language Tests 8 4 Analytical Thinking Tests 3 1.5 Trial Period 1 0.5 Check up 1 0.5

70
Table 3.23 Methods Used to Select Managers
Methods of Personnel Selection for Managers Frequency Percentage % Interview 170 85 References 130 65 Personality Tests 75 37.5 Biographical Data 69 34.5 Occupational Tests 34 17 Assessment Centers 32 16 IQ Tests 26 13 Mechanical Tests 16 8 Integrity Tests 11 5.5 Language Tests 10 5 Analytical Thinking Tests 3 1.5 Trial Period 1 0.5 Check up 1 0.5
In addition, it was concluded that 12.5% of the participating organizations (N
= 25), the methods of interview and reference were used together. Nine percent of
the organizations (N = 18) employed the methods of interview, biographic data, and
references together in selecting managers. The combination of interview and
reference methods were also found to be among the frequently used combination of
methods for selecting employees with a percentage of 9.5 (N = 19) and the
combination of interview, biographic data, and references were used together to
select employees in 5.5% of the organizations (N = 11).
Additionally, cross tab analyses were computed among size of the
organizations and selection methods that are used both for manager and non-manager
selection. The findings revealed that most of the organizations (62.9%, N = 107) of
that applied interview method in selecting their managerial positions were large-
sized organizations but generally the method of interview was used by medium-sized
organizations (95.8%, N = 46) (Spearman rho = -.07, p > .05, Chi-square = 6.19, p <
.05) (See Appendix F). Similarly, most of the organizations that used personality

71
tests in selecting managers were large-sized organizations (58.7%, N = 44) but
generally personality tests were most frequently used by medium-sized organizations
(45.8%, N = 22). However, the correlation was not significant (Spearman rho = -.10,
p > .05). Moreover, the method of reference checking was mostly applied by large-
sized organizations (69.2%, N = 90). However, the correlation was not significant
(Spearman rho = .12, p > .05).
In selecting non-managerial positions, most of the organizations that used
interview method were large-sized (65.4%, N = 121) (See Appendix G). However,
the correlation was not significant (Spearman rho = .03, p > .05). Similarly, most of
the 83 organizations that applied the method of personality tests were large-sized
organizations 65.1% N = 54), on the other hand, the medium-sized organizations
were likely to use the same method more frequently than the other organizations with
a percentage of 41.7% (N = 20). However, the correlation was not significant
(Spearman rho = .002, p > .05). Lastly, among the 138 organizations that applied the
method of reference checking in selecting non-managers were large-sized
organizations with a percentage of 68.8 (N = 95) (Spearman rho = .13, p > .05).
In the next step, the perceived effectiveness of the selection methods was
analyzed in terms of selecting candidates for managerial positions. As it is
demonstrated in Table 3.24, the most commonly used methods such as interview,
references, personality tests, and biographical data were evaluated by participating
organizations as effective ways in selecting managers by 93.5% of the 170, 53.1% of
the 130, 50.7% of the 175, and 39.1% of the 69 organizations that used these
techniques. Methods that were found to be effective by participating organizations in
selecting candidates for non-managerial positions presented in Table 3.25.
72
Table 3.24 Effective Methods of Selection Used for Managerial Positions
Effective Methods of Personnel Selection Used for Managers
Number of organizations
using the method
Frequency of organizations evaluating the method as
effective
Perceived effectiveness
(%) Analytical Thinking Tests 3/200 3 100 Interview 170/200 159 93.5 Assessment Centers 32/200 18 56.3 References 130/200 69 53.1 Occupational Tests 34/200 18 52.9 Personality Tests 75/200 38 50.7 Language Tests 10/200 5 50 IQ Tests 26/200 11 42.5 Biographical Data 69/200 27 39.1 Skill Tests 31/200 10 32.3 Mechanical Tests 16/200 5 31.3 Integrity Tests 11/200 3 27.3
As it is seen in Table 3.25, the most commonly used methods such as
interview, references, personality tests and biographical data were evaluated as the
effective ways in selecting non-managers by 94.6% of the 185, 55.8% of the 138,
57.8% of the 83, and 46.2% of the 78 organizations that used these techniques. The
other methods that found to be effective in selecting candidates for non-managerial
positions were as follows; analytical thinking tests (100%), assessment centers
(62.9%), integrity tests (58.8%), personality tests (57.8%), references (55.8%),
mechanical tests (52.8%), skill tests (52.2%).
Table 3.25 Effective Methods of Selection Used for Non-Managerial Positions
Effective Methods of Personnel Selection Used for Non-Managers
Number of organizations
using the method
Frequency of organizations that
evaluate the method as effective
Perceived effectiveness
(%) Analytical Thinking Tests 3/200 3 100 Interview 185/200 175 94.6 Assessment Centers 35/200 22 62.9 Integrity Tests 17/200 10 58.8 Personality Tests 83/200 48 57.8

73
Table 3.25 Continued References 138/200 77 55.8 Mechanical Tests 23/200 28 52.8 Skill Tests 69/200 36 52.2 Biographical Data 78/200 36 46.2 Occupational Tests 63/200 29 46 IQ Tests 38/200 15 39.5 Language Tests 8/200 3 37.5
Next, the kinds of interview techniques used by organizations during
selection processes were analyzed. Results shown in Table 3.26 discloses that most
frequently used interview format was one interviewer and one interviewee and it was
used in 86.0% of the organizations (N = 172). Next, the techniques of panel and
group interview were used by 52.0% (N = 104) and 15.0% (N = 30) of the
organizations, respectively. The Table 3.26 also illustrated that organizations apply
structured, semi-structured and unstructured interviews with percentages of 24.0%
(N = 48), 15.5% (N = 31) and 14.5% (N = 29), respectively.
The further analyses revealed that 21.5% of the organizations (N = 50) used
the interview format of one interviewer and one interviewee, and 18.0% of them (N
= 36) applied the formats of both one interviewer and one interviewee and panel
interview.
Table 3.26 Techniques of Interviews
Techniques of Interview Frequency Percentage % One Interviewee + One interviewer 172 86 Panel Interview 104 52 Structured Interview 48 24 Unstructured Interview 31 15.5 Group Interview 30 15 Semi-structured Interview 29 14.5 Group of Interviewees and Interviewers 2 1
Furthermore, a cross tab analyses was computed among sector of the
organization and interview techniques that are used (See Appendix H). The
74
findings demonstrated that 63.4% (N = 109) of the 172 organizations that used one to
one interview method was large-sized organizations, however, the medium sized
organizations were more likely to use the same technique with a percentage of 91.7
(N = 44). However, the correlation was not significant (Spearman rho = -.08, p >
.05). Sixty two and a half percentage (N = 65) of the 104 organizations that applied
the panel interview technique were large-sized. However, the small sized
organizations (59.1%, N = 13) applied this technique more frequently than medium-
and large-sized ones. However, the correlation was not found to be significant
(Spearman rho = -.06, p > .05). Considering structured interview technique, the cross
tab analysis showed that among the 48 organizations that applied this technique,
most of them were large-sized organizations (81.3%, N = 39) (Spearman rho = .18, p
< .05, Chi-square = 7.83, p < .05). In addition, 80.6% (N = 25) of the 31
organizations that used unstructured interviews were large-sized organizations.
However, the correlation was not found to be significant (Spearman rho = .14, p >
.05).
Finally, a frequency analysis was conducted to see whether a scoring system
was used during the selection interviews or not. The results showed that in half of the
organizations (N = 100), interviewers rated candidates during the interview and in
47.5% (N = 94) of the organizations there wasn’t such a grading system.
3.6 Orientation
In this part, frequency analyses were performed in order to examine the
nature of the orientation activities performed by the organizations. The result of these
analyses demonstrated the number of organizations that applied an orientation
program; the performers, the methods and duration of these programs; the positions
75
that received orientation programs; and lastly, the length of the trial period of newly
hired employees. In addition, for exploratory purposes, correlational analyses were
performed among the methods of orientation programs and among the positions that
orientation programs were applied for.
First, it was concluded that 80.0% (N = 160) of the organizations performed
an orientation program for their newly hired employees whereas 17.0% (N = 34) of
participating organizations did not have such a program.
Secondly, the results presented in Table 3.27 demonstrates that in 58.0% (N =
116) and 46.5% (N = 93) of the organizations orientation programs were carried out
by the HRM departments and first level managers, respectively.
Table 3.27 Performers of Orientation Programs
Performers of Orientation Programs Frequency Percentages % HRM Department 116 58 First Level Managers 93 46.5 Department Managers 12 6 Mentors 10 5 Training Departments 7 3.5 Colleagues 6 3
Furthermore, the techniques of orientation programs were analyzed and it was
found that the most frequently used methods were orientations performed by the
department managers and trips inside the organizations with a rate of 67.0% (N
=134) and 66.5% (N = 133), respectively. Table 3.28 demonstrates that the methods
of handling brochures or handbooks, visual techniques (videos, slides etc.), and
conferences or group meetings were applied in 56.5%, 33.0%, and 24.0% of the
organizations, respectively.
Next, a frequency analysis was performed to find the most frequently used
combinations of orientation program techniques used by the participating

76
organizations. The findings demonstrated that 15.5% (N = 31) of the participating
organizations apply the combination of handing brochures or handbooks, trips and
orientations performed by department managers. Moreover, the combination of
handing brochures or handbooks, visual techniques, trips and orientations performed
by department managers was used by 13.5% (N = 27) of the participating
organizations.
Table 3.28 Techniques of Orientation Programs
Techniques of Orientation Programs Frequency Percentage % Orientation by Department Managers 134 67 Trips 133 66.5 Brochures/handbooks 113 56.5 Visual Techniques 66 33 Conferences-group Meetings 48 24
The bivariate correlational analysis among the techniques of orientation
programs presented in Appendix I reveals that organizations that used the method of
brochures and handbooks were likely to use trips (r = .47, p < .01), orientation
programs performed by department managers (r = .46, p < .05), and visual
techniques (r = .44, p < .01). The method of visual techniques was found to be
significantly and positively correlated with the method of trips inside the
organizations (r = .34, p < .01). Moreover, the organizations that used the technique
of arranging trips to present their firms were more likely to use the other methods of
orientation programs performed by department managers (r = .61, p < .01).
Furthermore, there were differences among organizations in terms of the
length of orientations programs. Table 3.29 demonstrates that in 30.5% (N = 61) of
160 organizations, the length of the orientation programs was 1day to 1 week. In
15.5% (N = 31) and 14.5% (N = 29) of the organizations, the length of the
orientation programs were over 1 month and between 2 weeks to 1 month

77
respectively. Also, it was found that in 7.0% (N = 14) of the organizations duration
of orientation programs depended on the position.
Table 3.29 Length of Orientation Programs
Length of Orientation Program Frequency Percentage % 1 day – 1 week 61 30.5 Over 1 Month 31 15.5 2 Weeks – 1 Month 29 14.5 1 Week – 2 Weeks 22 11 Depends on the Position 14 7 Missing 43 21.5 Total 200 100
The results also revealed that orientation programs were applied to different
positions with different frequencies and percentages. For instance, organizations
mostly applied their orientation programs to non-managerial employees (63.5%) and
first level managers (60.5%) positions. Also in 57.0% of the organizations
orientation programs were performed for middle level managerial positions.
The bivariate correlational analysis performed in order to see the relations
among the positions that orientation programs were applied for, and the results are
presented in Appendix J. It was found that organizations that applied orientation
programs for first level managers were likely to apply the orientation programs for
middle level manager (r = .62, p < .01), high level managers (r = .45, p < .01), non-
managers (r = .43, p < .01), blue collar workers (r = .38, p < .01), management
trainees (r = .47, p < .01). Also, the orientation programs applied for middle level
managers were likely to be performed for high level managers (r = .54, p < .01), non-
managers(r = .37, p < .01), blue collar workers (r = .36, p < .01), management
trainees (r = .47, p < .01) in organizations. Moreover, organizations that applied
orientation programs for high level managers were likely to perform them for
management trainees (r = .31, p < .01). The organizations that applied orientation

78
programs for non-managers were likely to apply orientation programs for blue-collar
workers (r = .41, p < .01) and management trainees (r = .49, p < .01). Finally, it was
concluded that the orientation programs applied for blue collars were likely to be
performed for management trainees.
Finally, trial periods of newly hired employees were analysed and it was
concluded that 162 organizations (82.0%) had an application of trial period.
Moreover, the organizations used trial periods with differing lengths of duration. For
example, as it is demonstrated in Table 3.30, 41.0% of the organizations (N = 82)
had a trial period of 2 months and 20.5% of them (N = 41) had a trial period of 3
months.
Table 3.30 Length of the Trial Period
Length of Trial Period Frequency Percentage % 2 Months 82 41 3 Months 41 20.5 1 Month 17 8.5 Depends on the Position 9 4.5 6 Months 8 4 Less than 1 Month 2 1 Missing 41 20.5 Total 200 100
3.7 Training and Development
Training and development process of HRM was evaluated in this section by
performing frequency analyses to find the number of organizations that had a
training department and to examine the size of the training departments, the kind of
training methods, the approaches that were used to determine the needed training
programs, the profile of the trainers and the evaluation process of the training
programs. Frequency analyses were also conducted to analyse the yearly training
hours per employee and the amount of the training budget of the participating

79
organizations. In addition; again, for exploratory purposes, the correlations between
methods of need analyses were examined.
First, the findings in Table 3.31 reveals that 54.5% (N = 109) of the
organizations had a training department, the percentage of organizations that did not
have a training department was 41 (N = 82). As it was demonstrated in Table 3.32, in
31.0% of the organizations (N = 62) department of training was within the HRM
department.
Table 3.31 Training Department
Training Department Frequency Percentage % Does Not Exist 109 54.5 Exists 82 41 Missing 9 4.5 Total 200 100
Table 3.32 Divisions That the Training Departments were Under
Divisions Which Training Departments were Bound to Frequency Percentage % HRM 62 31 General Director’s Office 13 6.5 HRM and Quality Department 9 4.5 HRM and Industrial Relations 7 3.5 Personnel Department 6 3 Quality Department 6 3 System Development Department 5 2.5 Personnel and Administration Department 5 2.5 Finance Department 2 1 Logistics Services Department 1 0.5 Missing 84 42 Total 200 100
The size of the training departments showed diversity as it is presented in
Table 3.33. It was found that in 20.5% (N = 41) of the organizations, training
departments had only one employee. The number of employees working in training
departments were 2 in 19.0% (N = 38) of the organizations, respectively.

80
Table 3.33 Frequency Distribution of Number of Employees in Training Department
Number of Employees in Training Department Frequency
Percentage %
1 Employee 41 20.5 2 Employees 38 19 3 Employees 17 8.5 4 Employees 6 3 5 Employees 7 3.5 6 Employees 4 2 8 Employees 1 0.5 20 Employees 1 0.5 Missing 85 42.5 Total 200 100
As presented in Table 3.34, in terms of training techniques, the most
frequently used four methods were on the job training (72.5%), lecture (71.5%),
visual techniques (51.5%), such as slides or videos, and computer-based training
(47.0%). Moreover, in 24.0%, 21.0%, and 15.0% of the organizations the methods of
role-playing, games, and simulators were used, respectively.
Additionally, it was found that 10.5% (N = 21) of the organizations apply
both the methods of in-class and on the job training. Furthermore, in 10.0% (N = 20)
of the organizations, the methods of in-class training, on the job training and visual
techniques were used together.
Table 3.34 Training Techniques Used
Training Techniques Used Frequency Percentage % On The Job Training 145 72.5 Lecture 143 71.5 Visual Techniques 103 51.5 Computer-Based Training 94 47 Role Playing 48 24 Games 42 21 Simulators 30 15 Similar Sector Trips 2 1 Others (Case Study, Psychodrama, etc.) 2 1
Furthermore, a cross tab analysis was computed to see the relation between

81
the size of the organizations and the applied training methods (See Appendix K). The
findings presented that most of the 145 organizations that apply the method of on-
the-job training were large-sized organizations (67.6%, N = 98). However, the
correlation was not found to be significant (Spearman rho = .08, p > .05). Similarly,
most of the organizations that applied the method of lectures were large-sized
organizations (68.5%, N = 98). However, the correlation was not found to be
significant (Spearman rho = .13, p > .05).
On the following step, the planning and application of training activities were
examined. As it can be seen in Table 3.35, the frequency analysis disclosed that in
47.5% of the organizations, all of the training activities were planned and performed
in the direction of organizational career plans by the departments, HRM departments
in 25.0%, training departments in 5.5%, and personnel departments in 4.5% of the
organizations.
Also, in 17.5% (N = 35) of the organizations, employees received training
programs based on the identified needs and with the approval of their managers.
Moreover, training activities were planned and carried out by departments in line
with job-related departmental needs in 11.5% of the organizations (N = 23). The
training activities were planned as a result of employee performance meetings and
competency analysis in 5.5% of the organizations (N = 11). In 4.5% (N =9) of the
organizations, managers and employees determined the training the employees
would receive and the planning related training activities were performed by the
HRM departments. In 3.5% (N = 7) of the organizations, HRM department planned
the training activities but the application of those activities were performed by the
departments themselves.

82
Table 3.35 The Ways of Determining Training Programs
The ways of Determining Training Programs Frequency Percentage
% By HRM in Line with Career Plans 50 25 By Manager Approval 35 17.5 Determined by Departments 23 11.5 By Training Department in Line with Career Plans 11 5.5 By Employee-Manager Meetings 11 5.5 By Personnel Department in Line with Career Plans 9 4.5 In Line with PA Results and Competency Analysis 9 4.5 By Quality Department in Line with Career Plans 7 3.5 By Quality and HRM Department in Line with Career Plans 7 3.5 By Quality and Training Department in Line with Career Plans 7 3.5 Planned by HRM and Performed by Departments 7 3.5 By HRM and Administrative Department in Line with Career Plans 4 2 Missing 20 10 Total 200 100
Additionally, a frequency analysis was performed to find out the methods that
were used to determine which training program(s) employees would receive in
organizations. As it is presented in Table 3.36, the results demonstrated that in 76.0
% (N = 152) of the organizations managers determined the kind of the training
programs that their subordinates would receive. Moreover, in 72% (N = 144) of the
organizations, the training programs were determined on the basis of employee
demand.
Table 3.36 Methods of Determining Training Programs
Methods of Determining Training Programs Frequency Percentage % Demand of Managers 152 76 Demand of Employees 144 72 PA Results 106 53 Need Analysis by HRM 92 46 Training Based on Appointment 87 43.5 Consultancy Firms 49 24.5 Need Analysis by Consultancy Firms 28 14

83
On the next step, process of training need analysis was examined in detail.
First, a frequency analysis was conducted in order to see the methods that are used in
performing need analysis. The results presented in Table 3.37 indicates that
performance appraisal results, questionnaires and interviews were used in 60.0% (N
= 120), 53.0% (N = 106), and 40.0% (N = 80) of the organizations, respectively.
It was also found that 21.5% (N = 43) of the surveyed organizations used the
methods of questionnaires and PA results together. Moreover, the method of PA
results was used solely in 15.0% (N = 30) of the organizations.
Table 3.37 Methods of Need Analysis
Methods of Need Analysis Frequency Percentage % PA Results 120 60 Questionnaires 106 53 Interviews 80 40 Assessment Center 19 9.5 Manager Suggestions 8 4
Additionally, the correlations between methods of need analysis were
examined by performing a bivariate correlation analysis. The findings demonstrated
that the method of questionnaire was significantly and negatively correlated with the
method of interviews (r = - .28, p < .01). In addition, the organizations that used the
method of performance appraisal method were not likely to use the method of
assessment centers (r = -.22, p < .01). (See Appendix L).
Furthermore, the profile of the trainers was also analysed. The findings
presented in Table 3.38 demonstrates that employees were trained by trainers out of
the firm, experienced managers working in the organization, and individual trainers
out of the firm in 68.5% (N = 137), 66.5% (N = 133), and 55.0% (N = 110) of the
organizations, respectively.

84
Table 3.38 The Profile of the Trainers
Profile of the Trainers Frequency Percentage % Trainers Out of the Firm 137 68.5 Experienced Managers in Organizations 133 66.5 Individual Trainers in Organizations 110 55 Trainers of Consultancy Firms 65 32.5
In addition, the process of training evaluation was examined. As can be seen
in Table 3.39, the trainee evaluation was found to be the most frequently used
method in evaluating training programs with a rate of 69.0% (N = 138) . The
methods of tests applied before and after the training programs and trainer
evaluations were used in 41.5% of the organizations (N = 83), each. In 35.0% of the
organizations (N = 55), the effectiveness of training programs were evaluated by
utility analysis. Furthermore, it was concluded that 6.0% (N = 12) of the
organizations used the evaluation methods of trainee evaluation and trainer
evaluation together and in 5.5% (N = 11) of the organizations the method of trainee
evaluation was used solely. However, 4.5% (N = 9) of the organizations did not
assess the effectiveness of their training programs.
Table 3.39 Methods of Training Evaluation
Methods of Training Evaluation Frequency Percentage % Trainee Evaluation (questionnaire) 138 69 Tests Applied Before and After the Training 83 41.5 Trainer Evaluation 83 41.5 Consultancy Firm Evaluations 74 37 Behavioral Change 70 35 Utility Analysis 55 27.5 No Evaluation 9 4.5
The findings of another frequency analysis presented in Table 3.40 discloses
that in 60.0% (N = 120) and 59.5% (N = 119) of the organizations non-managers and
middle level managers received training programs more frequently than the
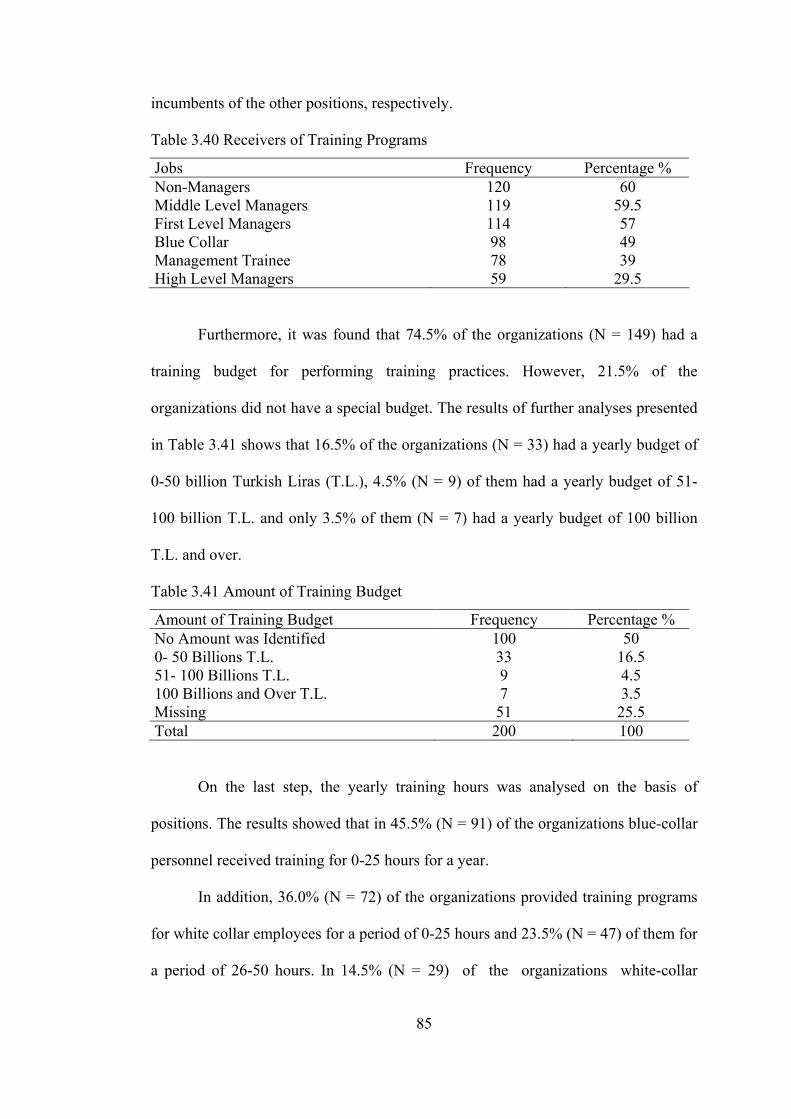
85
incumbents of the other positions, respectively.
Table 3.40 Receivers of Training Programs
Jobs Frequency Percentage % Non-Managers 120 60 Middle Level Managers 119 59.5 First Level Managers 114 57 Blue Collar 98 49 Management Trainee 78 39 High Level Managers 59 29.5
Furthermore, it was found that 74.5% of the organizations (N = 149) had a
training budget for performing training practices. However, 21.5% of the
organizations did not have a special budget. The results of further analyses presented
in Table 3.41 shows that 16.5% of the organizations (N = 33) had a yearly budget of
0-50 billion Turkish Liras (T.L.), 4.5% (N = 9) of them had a yearly budget of 51-
100 billion T.L. and only 3.5% of them (N = 7) had a yearly budget of 100 billion
T.L. and over.
Table 3.41 Amount of Training Budget
Amount of Training Budget Frequency Percentage % No Amount was Identified 100 50 0- 50 Billions T.L. 33 16.5 51- 100 Billions T.L. 9 4.5 100 Billions and Over T.L. 7 3.5 Missing 51 25.5 Total 200 100
On the last step, the yearly training hours was analysed on the basis of
positions. The results showed that in 45.5% (N = 91) of the organizations blue-collar
personnel received training for 0-25 hours for a year.
In addition, 36.0% (N = 72) of the organizations provided training programs
for white collar employees for a period of 0-25 hours and 23.5% (N = 47) of them for
a period of 26-50 hours. In 14.5% (N = 29) of the organizations white-collar
86
employees receive training for a period of 51 hours and more in a year.
Moreover, 37.5% (N =75) of the organizations provided training programs for
managers for a period of 0-25 hours and 18.5% (N =37) of them for a period of 26-
50 hours. In 10.0% (N =20) of the organizations managers received training for a
period of 51 hours and more in a year.
3.8 Performance Appraisal
Frequency analyses were conducted to find the number of organizations that
owned a performance appraisal system and to disclose the methods of performance
appraisal. Additionally, the areas in which PA results were used, the frequency and
the performers of PA and the areas in which the results of PA were used were also
examined via frequency analyses. The frequency analyses were also performed to
find the number of surveyed organizations that had a PA form and the content of
those forms. In addition, the correlations among methods of performance appraisal,
the functions of HRM in which the results of PA were used and variables of
performance assessors were analysed by a bivariate correlation for exploratory
purposes.
Initially, the results indicated that 80.5% (N = 161) of the organizations had a
performance appraisal system. Secondly, the findings of frequency analysis revealed
that in 26.0% (N = 52) and 14.0% (N = 28) of the organizations, the methods of rank
order and graphic rating scales were used, respectively. The Table 3.42 demonstrates
both the other methods used by organizations and their percentages like forced
distribution (12.5%), checklists (12.0%), paired comparisons (10.5%), critical
incidence technique (9.0%), behaviorally anchored rating scales (BARS) (7.0%),
behaviorally observed rating scales (6.5%) and objective cards (4.5%).

87
Table 3.42 Methods of Performance Appraisal
Methods of PA Frequency Percentage % Rank Order 52 26 Graphic Rating 28 14 Forced Distribution 25 12.5 Checklist 24 12 Paired Comparison 21 10.5 Critical Incidence 18 9 BARS 14 7 BOS 13 6.5 Objective Cards 9 4.5
Correlations among methods of performance appraisal are presented in
Appendix M. Results demonstrates that there was a significant and positive
correlation between critical incidence technique and checklists (r = .37, p < .01). The
organizations that used the method of BARS were likely to use the method of BOS
(r = .25, p < .01), and checklists (r = .32, p < .01).
Additionally, a cross tab analysis was conducted in order to see the relation
between size of the organizations and methods of performance management (See
Appendix N). The results demonstrated that most of the 52 organizations that used
rank order method were large-sized (57.7%, N = 30). Whereas, the medium-sized
organizations (35.4%, N = 17) were likely to use this method more frequently than
small- and large-sized organizations. However, the correlation was not found to be
significant (Spearman rho = -.07, p > .05). Moreover, most of the 28 organizations
that applied graphic rating scales were large-sized (67.9%, N = 19). The medium-
sized organizations (16.7%, N = 8) were likely to use this method more frequently
than small- and large-sized organizations. However, the correlation was not found to
be significant (Spearman rho = .04, p > .05). Lastly, most of the 25 organizations that
used forced distribution technique were large-sized (64%, N = 16). The medium-
sized organizations (14.6%, N = 7) were likely to apply this method more

88
frequently than small- and large-sized organizations. However, the correlation was
not found to be significant (Spearman rho = .001, p > .05).
Next, the frequency analysis demonstrated that the results of PA were used in
many different areas. As seen in Table 3.43, 52.0% (N = 104) and 50.0% (N = 100)
of the organizations made use of their PA results in the area of training needs and
compensation management and benefits, respectively.
Table 3.43 The Functions for which PA Results were Used
Functions of HRM for which PA Resultswere Used Frequency Percentage % Training Needs 104 52 Compensation and Benefits 100 50 Career Planning 98 49 Reward Systems 67 33.5
The results of bivariate correlation analysis in Appendix O discloses that the
organizations that used their PA results in the area of compensation management
were more likely to use those results in career planning (r = .50, p < .01), training
need analysis (r = .60, p < .01), and reward management (r = .37, p < .01). Next, the
organizations that used their PA results in the area of career planning were more
likely to use those results in training need analysis (r = .52, p < .01) and reward
management (r = .41, p < .01). Moreover, the results of PA that were used in the area
of training need analysis were more likely to be used in the area of reward
management (r = .30, p < .01).
Furthermore, a frequency analysis was performed to examine the frequency
of performance appraisals conducted for managers in the organizations. The results
presented in Table 3.44 shows that in 67 (51.5%) of the 130 organizations that
applied performance management system the performance appraisals were conducted
once a year.
89
Table 3.44 The Frequency of Performance Appraisal for Managers
Frequency of PA Frequency Percentage % Once a Year 67 51.5 Two Times a Year 48 36.9 Four Times a Year 4 3.1 Once in Two Years 3 2.3 Based on Projects 2 1.5 Once a Month 2 1.5 Missing 4 3.1 Total 130 100
Another frequency analysis was performed to examine the frequency of
performance appraisals conducted for non-managerial positions in the organizations.
The findings in Table 3.45 discloses that in 51.5% (N = 67) and 37.7% (N = 49) of
the 130 organizations performance appraisals were conducted once and twice a year,
respectively.
Table 3.45 The Frequency of Performance Appraisal for Non-Managers
Frequency of PA Frequency Percentage % Once a Year 67 51.5 Two Times a Year 49 37.7 Four Times a Year 5 3.8 Once in Two Years 3 2.3 Once a Month 1 0.8 Missing 5 3.8 Total 130 100
When the frequency of performance appraisals applied for managers and non-
managers were compared, the results in Tables 3.44 and 3.45 shows that performance
of both managers and non-managers were evaluated once a year and twice a year in
most of the organizations. On the other hand, performances of managers were
evaluated on the basis of projects in 1.5% of the organizations but for non-
managerial positions there was not such a practice.
Next, a frequency analysis was conducted in order to find out the assessors of
performance in the work place. As seen in Table 3.46, in 60.5% (N = 121) of the
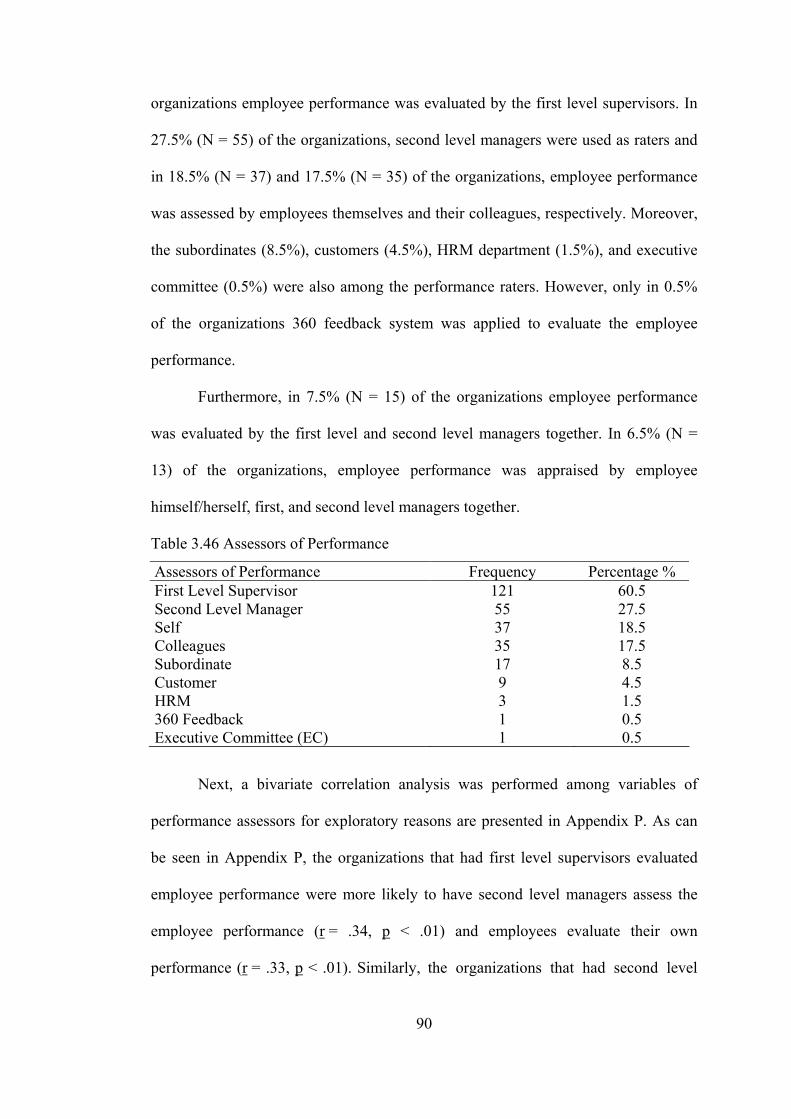
90
organizations employee performance was evaluated by the first level supervisors. In
27.5% (N = 55) of the organizations, second level managers were used as raters and
in 18.5% (N = 37) and 17.5% (N = 35) of the organizations, employee performance
was assessed by employees themselves and their colleagues, respectively. Moreover,
the subordinates (8.5%), customers (4.5%), HRM department (1.5%), and executive
committee (0.5%) were also among the performance raters. However, only in 0.5%
of the organizations 360 feedback system was applied to evaluate the employee
performance.
Furthermore, in 7.5% (N = 15) of the organizations employee performance
was evaluated by the first level and second level managers together. In 6.5% (N =
13) of the organizations, employee performance was appraised by employee
himself/herself, first, and second level managers together.
Table 3.46 Assessors of Performance
Assessors of Performance Frequency Percentage % First Level Supervisor 121 60.5 Second Level Manager 55 27.5 Self 37 18.5 Colleagues 35 17.5 Subordinate 17 8.5 Customer 9 4.5 HRM 3 1.5 360 Feedback 1 0.5 Executive Committee (EC) 1 0.5
Next, a bivariate correlation analysis was performed among variables of
performance assessors for exploratory reasons are presented in Appendix P. As can
be seen in Appendix P, the organizations that had first level supervisors evaluated
employee performance were more likely to have second level managers assess the
employee performance (r = .34, p < .01) and employees evaluate their own
performance (r = .33, p < .01). Similarly, the organizations that had second level

91
manager evaluate their subordinates were more likely to have employees assess their
own performance (r = .23, p < .01). Moreover, employees who were assessed by
their colleagues were more likely to be evaluated by their subordinates (r = .47, p <
.01) and customers (r = .22, p < .01). Lastly, in organizations where employees
evaluated themselves, the method of customer evaluation were more likely to be used
(r = .27, p < .01).
Additionally, another frequency analysis was conducted to examine the way
the performance appraisal results were shared by employees. The results presented in
Table 3.47 shows that in 33.5% (N = 67) of the organizations employees knew their
performance evaluations and they had a feedback interview with their rater(s).
However, in 12.0% of the organizations (N = 24) employees did not receive any
information about their performance evaluations. In 9.0% (N = 18) of the
organizations, the employees knew their PA results and demanded an interview from
the supervisor, and in 7.5% (N = 15) of the organizations, employee performance
was evaluated in a face to face PA interview.
Table 3.47 Feedback of Performance Appraisal
PA Results Frequency Percentage %Employees Make an Interview with the Rater 67 33.5 Employees Do Not Know the PA Results 24 12 Employees Demand an Interview 18 9 PA Done Face to Face 15 7.5 Written PA Results 3 1.5 Missing 72 36 Total 200 100
Lastly, 57.0% (N = 114) of the organizations had a performance appraisal
form, whereas, 43.0% (N = 86) of the organizations did not use a specific rating.
When performance appraisal form was analysed, the results presented in Table 3.48
shows that in 19.5% (N = 39) of the organizations, PA form was the same for

92
all organizational levels, like first level managers and middle level managers the PA
form were same for all employees in 17.0% of the participating organizations (N =
34).
Table 3.48 The Content of PA Form
Content of PA Form Frequency Percentage % Same For Hierarchical Levels 39 19.5 Same For All Employees 34 17 Based on Position 20 10 Same For Fob Groups 17 8.5 Based on Managerial Positions 9 4.5 Different For Blue and White Collar 7 3.5 Different For Hierarchical Levels and Job Groups 6 3 Missing 68 34 Total 200 100
3.9 Career Planning
Concerning career planning activities, frequency analyses were conducted to
find out the number of organizations that had a career management system and to
examine the focus of the system, the activities and the content of the career
management systems, and the ways that employee KSAO’s were evaluated. The
frequency analyses were also conducted to analyse the performers of career
management. In addition, the correlations among the activities of career development
and among the performers of career planning were examined for exploratory
purposes.
First, the results of frequency analysis revealed that only 47.0% (N = 94) of
the organizations had a career planning system, on the other hand, 51.5% (N = 103)
of the organizations did not have such a system. Secondly, the focus of career
planning systems was analyzed and the findings revealed that in 31.5% (N = 63) of
the organizations the career planning systems were both organization and personnel
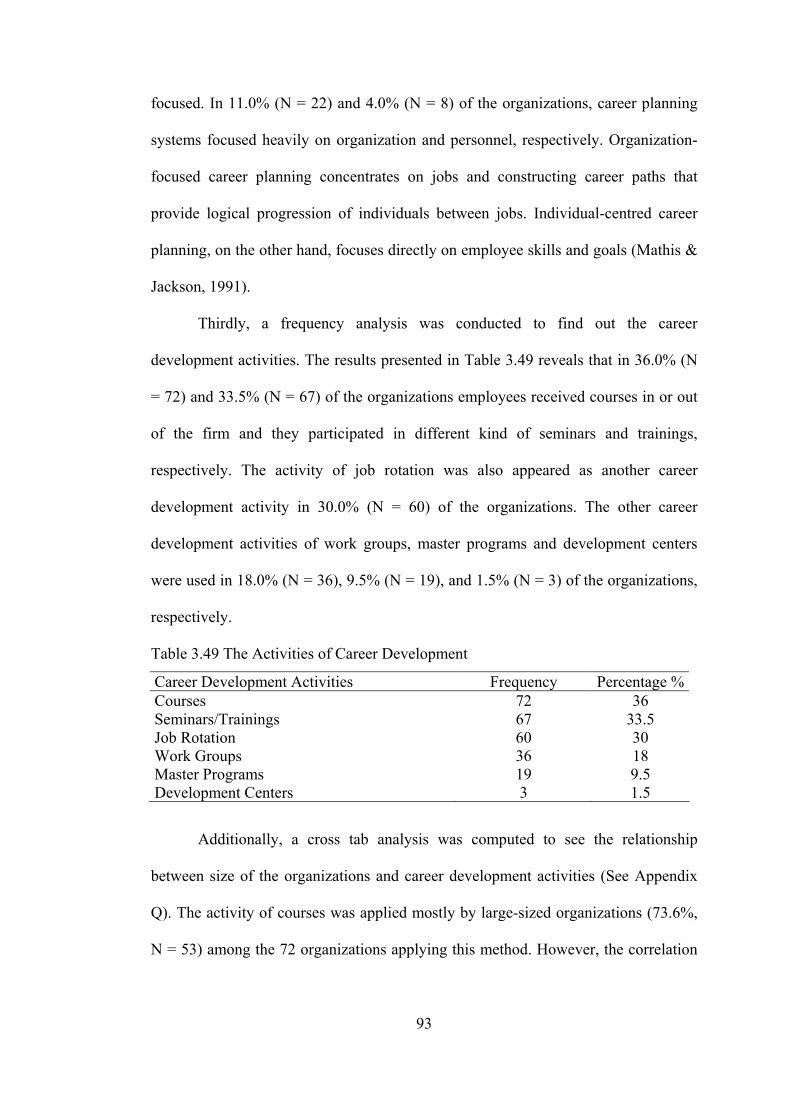
93
focused. In 11.0% (N = 22) and 4.0% (N = 8) of the organizations, career planning
systems focused heavily on organization and personnel, respectively. Organization-
focused career planning concentrates on jobs and constructing career paths that
provide logical progression of individuals between jobs. Individual-centred career
planning, on the other hand, focuses directly on employee skills and goals (Mathis &
Jackson, 1991).
Thirdly, a frequency analysis was conducted to find out the career
development activities. The results presented in Table 3.49 reveals that in 36.0% (N
= 72) and 33.5% (N = 67) of the organizations employees received courses in or out
of the firm and they participated in different kind of seminars and trainings,
respectively. The activity of job rotation was also appeared as another career
development activity in 30.0% (N = 60) of the organizations. The other career
development activities of work groups, master programs and development centers
were used in 18.0% (N = 36), 9.5% (N = 19), and 1.5% (N = 3) of the organizations,
respectively.
Table 3.49 The Activities of Career Development
Career Development Activities Frequency Percentage %Courses 72 36 Seminars/Trainings 67 33.5 Job Rotation 60 30 Work Groups 36 18 Master Programs 19 9.5 Development Centers 3 1.5
Additionally, a cross tab analysis was computed to see the relationship
between size of the organizations and career development activities (See Appendix
Q). The activity of courses was applied mostly by large-sized organizations (73.6%,
N = 53) among the 72 organizations applying this method. However, the correlation
94
was not found to be significant (Spearman rho = .13, p > .05). Moreover, the activity
of providing seminars or trainings was applied mostly by large-sized organizations
(67.2%, N = 45) among the 67 organizations that apply this method. However, the
correlation was not found to be significant (Spearman rho = .03, p > .05). In terms of
job rotation, the findings demonstrated that among the 60 organizations that applied
this method, 75.0% (N = 45) of them were large-sized. However, the correlation was
not found to be significant (Spearman rho = .13, p > .05).
On the next step, bivariate correlations were calculated to examine the
relations among the activities of career development. The findings in Appendix R
suggested that the organizations that carried out the activity of job rotation were
likely to perform the activities of courses (r = .37, p < .01), seminars or trainings (r =
.48, p < .01), work groups (r = .37, p < .01), and master programs (r = .38, p < .01).
Moreover, the organizations, in which employees received courses for developing
their careers, were likely to perform the activities of seminars or trainings (r = .59, p
< .01), work groups (r = .38, p < .01) and master programs (r = .36, p < .01). The
activities of seminars and trainings were significantly and positively correlated with
the other career development activities of work groups (r = .33, p < .01) and master
programs (r = .38, p < .01).
Fourthly, the stages of career planning system were examined in details. The
results presented in Table 3.50 suggested that in 28.0% (N = 56) of the organization
the career planning systems included human resource planning. Human resource
planning was performed to predict future personnel needs and to develop human
resource strategies in order to fulfil these needs. Moreover, in 25.5% (N = 51) of the
organizations career planning system was composed of practices that aim to support
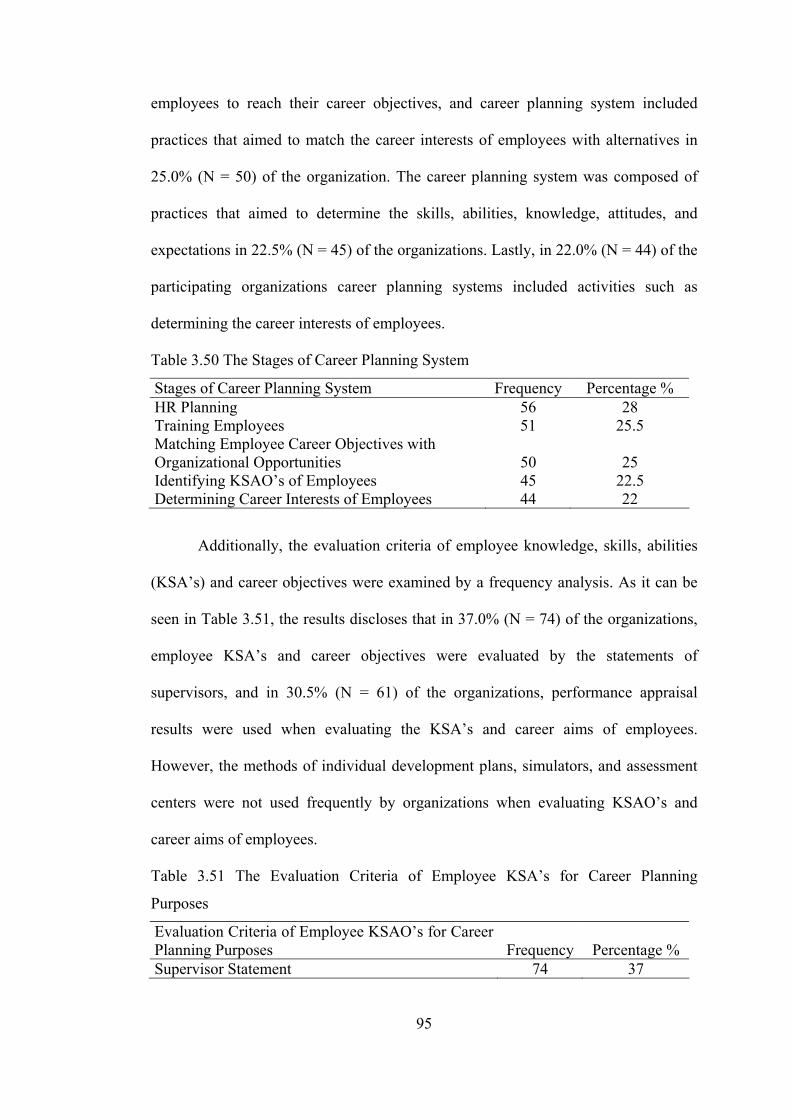
95
employees to reach their career objectives, and career planning system included
practices that aimed to match the career interests of employees with alternatives in
25.0% (N = 50) of the organization. The career planning system was composed of
practices that aimed to determine the skills, abilities, knowledge, attitudes, and
expectations in 22.5% (N = 45) of the organizations. Lastly, in 22.0% (N = 44) of the
participating organizations career planning systems included activities such as
determining the career interests of employees.
Table 3.50 The Stages of Career Planning System
Stages of Career Planning System Frequency Percentage % HR Planning 56 28 Training Employees 51 25.5 Matching Employee Career Objectives with Organizational Opportunities 50 25 Identifying KSAO’s of Employees 45 22.5 Determining Career Interests of Employees 44 22
Additionally, the evaluation criteria of employee knowledge, skills, abilities
(KSA’s) and career objectives were examined by a frequency analysis. As it can be
seen in Table 3.51, the results discloses that in 37.0% (N = 74) of the organizations,
employee KSA’s and career objectives were evaluated by the statements of
supervisors, and in 30.5% (N = 61) of the organizations, performance appraisal
results were used when evaluating the KSA’s and career aims of employees.
However, the methods of individual development plans, simulators, and assessment
centers were not used frequently by organizations when evaluating KSAO’s and
career aims of employees.
Table 3.51 The Evaluation Criteria of Employee KSA’s for Career Planning
Purposes
Evaluation Criteria of Employee KSAO’s for Career Planning Purposes Frequency Percentage % Supervisor Statement 74 37
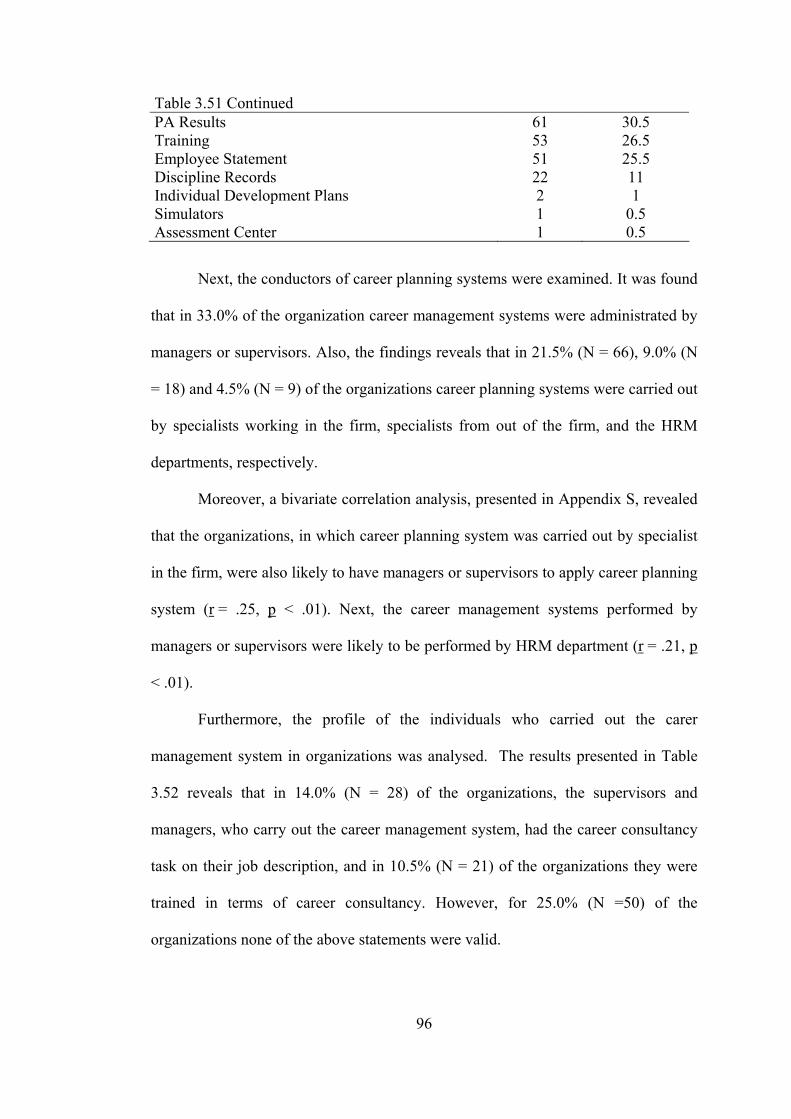
96
Table 3.51 Continued PA Results 61 30.5 Training 53 26.5 Employee Statement 51 25.5 Discipline Records 22 11 Individual Development Plans 2 1 Simulators 1 0.5 Assessment Center 1 0.5
Next, the conductors of career planning systems were examined. It was found
that in 33.0% of the organization career management systems were administrated by
managers or supervisors. Also, the findings reveals that in 21.5% (N = 66), 9.0% (N
= 18) and 4.5% (N = 9) of the organizations career planning systems were carried out
by specialists working in the firm, specialists from out of the firm, and the HRM
departments, respectively.
Moreover, a bivariate correlation analysis, presented in Appendix S, revealed
that the organizations, in which career planning system was carried out by specialist
in the firm, were also likely to have managers or supervisors to apply career planning
system (r = .25, p < .01). Next, the career management systems performed by
managers or supervisors were likely to be performed by HRM department (r = .21, p
< .01).
Furthermore, the profile of the individuals who carried out the carer
management system in organizations was analysed. The results presented in Table
3.52 reveals that in 14.0% (N = 28) of the organizations, the supervisors and
managers, who carry out the career management system, had the career consultancy
task on their job description, and in 10.5% (N = 21) of the organizations they were
trained in terms of career consultancy. However, for 25.0% (N =50) of the
organizations none of the above statements were valid.
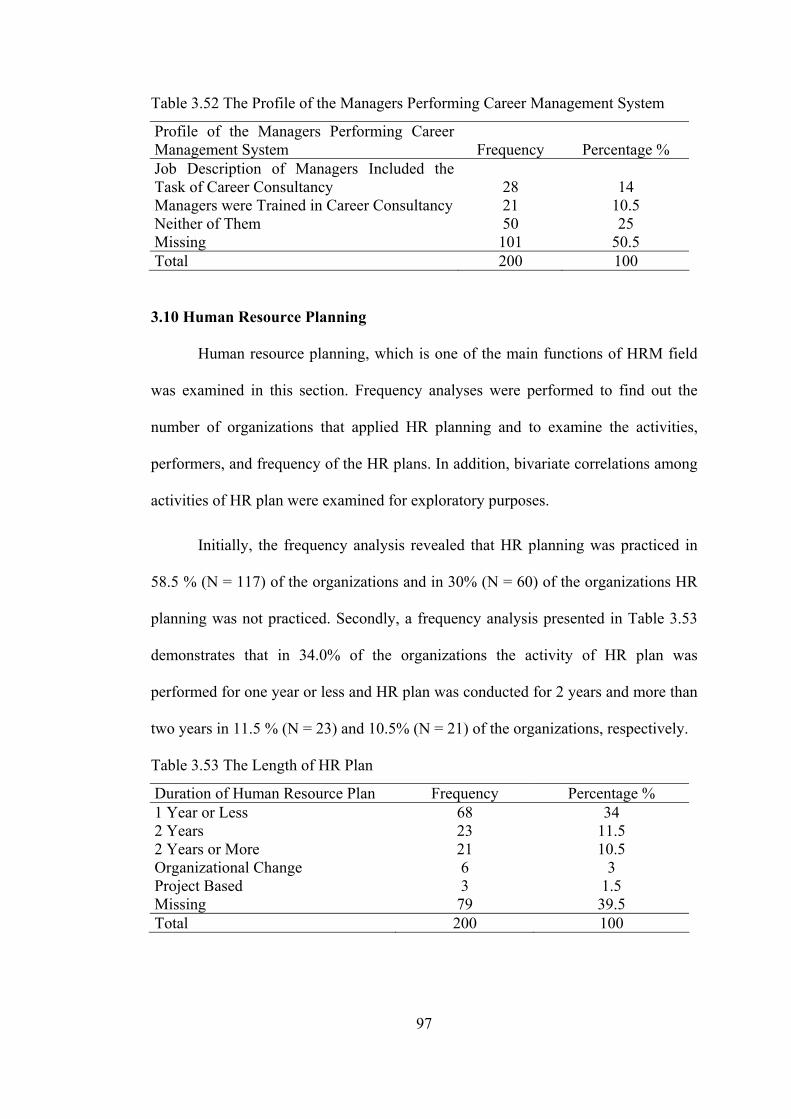
97
Table 3.52 The Profile of the Managers Performing Career Management System
Profile of the Managers Performing Career Management System Frequency Percentage % Job Description of Managers Included the Task of Career Consultancy 28 14 Managers were Trained in Career Consultancy 21 10.5 Neither of Them 50 25 Missing 101 50.5 Total 200 100
3.10 Human Resource Planning
Human resource planning, which is one of the main functions of HRM field
was examined in this section. Frequency analyses were performed to find out the
number of organizations that applied HR planning and to examine the activities,
performers, and frequency of the HR plans. In addition, bivariate correlations among
activities of HR plan were examined for exploratory purposes.
Initially, the frequency analysis revealed that HR planning was practiced in
58.5 % (N = 117) of the organizations and in 30% (N = 60) of the organizations HR
planning was not practiced. Secondly, a frequency analysis presented in Table 3.53
demonstrates that in 34.0% of the organizations the activity of HR plan was
performed for one year or less and HR plan was conducted for 2 years and more than
two years in 11.5 % (N = 23) and 10.5% (N = 21) of the organizations, respectively.
Table 3.53 The Length of HR Plan
Duration of Human Resource Plan Frequency Percentage % 1 Year or Less 68 34 2 Years 23 11.5 2 Years or More 21 10.5 Organizational Change 6 3 Project Based 3 1.5 Missing 79 39.5 Total 200 100

98
Next, the main practices of the HR planning were analysed. The results
presented in Table 3.54 demonstrated that the main parts of a HR plan were
determining organizational strategies and objectives, evaluation of existing
manpower, and determining the development speed of the organization in 37.5%,
31.5%, 29.0% of the participating organizations, respectively.
In addition, a frequency analysis was conducted to find out the combination
of HR activities that was most frequently performed by the organizations. The results
demonstrated that all of the HR planning activities mentioned in the questionnaire
were used in combination in 3.5% (N = 7) of the participating organizations.
Table 3.54 Activities of Human Resource Planning
Activities of Human Resource Planning Frequency Percentage % Strategies 75 37.5 Manpower Evaluation 63 31.5 Development Speed 58 29 Demand-Supply 48 24 Methods 46 23 Manpower Analysis 44 22 Employee Evaluation 43 21.5 Existing Manpower 38 19 Source Analysis 37 18.5 Equilibrium 36 18
Bivariate correlations among activities of HR planning were also analysed for
exploratory purposes. The findings presented in Appendix T reveals that the
organizations that engaged in the activity of determining organizational strategies
and objectives were likely to engage in determining organizational applications and
methods (r = .51, p < .01), determining the development speed of the organization
(r = .53, p < .01), and analyzing the manpower in and out of the organization (r = .41,
p < .01). Next, the organizations that performed the activity of determining
organizational applications and methods were likely to engage in determining the

99
development speed of the organization (r = .41, p < .01) and analyzing the manpower
in and out of the organization (r = .43, p < .01),
In addition, the activity of determining the development speed of the
organization was significantly and positively correlated with other activities such as
analyzing the manpower in and out of the organization (r = .49, p < .01) and
evaluation of existing manpower (r = .44, p < .01).). The activity of making
equilibrium adjustments was significantly and positively correlated with activities of
analyzing manpower in and out of the organization (r = .44, p < .01), evaluation of
existing manpower (r = .54, p < .01), and measuring the time and way of providing
the required sources (r = .48, p < .01).
Moreover, analyzing the manpower in and out of the organization was
significantly and positively correlated with evaluation of existing manpower (r = .52,
p < .01), evaluating employees in order to reach organizational objectives for the
time of forecasting (r = .43, p < .01), and measuring the time and way of providing
the required sources (r = .56, p < .01). The organizations that performed the practice
of evaluation of existing manpower were likely to perform other HR planning
activities, such as evaluating employees in order to reach organizational objectives
for the time of forecasting (r = .68, p < .01) and measuring the time and way of
providing the required sources (r = .56, p < .01). Lastly, the activity of evaluating
employees in order to reach organizational objectives for the time of forecasting was
significantly and positively correlated with measuring the time and way of providing
the required sources (r = .60, p < .01).
In addition, a frequency analysis was conducted to find out the departments or
individuals who performed HR plan in organizations. The findings demonstrated that

100
in 47.5% (N = 95) of the organizations, human resources were planned by the HRM
departments and in 39.0% (N = 78) of the organizations HR plan was conducted by
the upper-level management. Also, in 31.0% (N = 62) of the organizations,
department managers perform the activities of HR planning.
3.11 Compensation and Benefits
In this section, the compensation management systems of the participating
organizations and benefits that were provided by the organizations were examined.
Frequency analyses were performed to examine the factors that affected and the
managers who played a role in salary increment, the frequency of salary increment,
the benefits provided by the organizations and the non-monetary and monetary
rewards received by employees. The frequency analyses were also conducted to
analyse the payment of overtime work. In addition, the correlations among the
factors and individuals that affected salary increment, the benefits provided by
organizations, and the kinds of monetary rewards were examined for exploratory
purposes.
As can be seen in Table 3.55, inflation, employee performance, organization
profit or rate of sales influenced salary increments in 66.5% (N = 133), 62.5% (N =
125) and 44.5% (N = 89) of the organizations, respectively. However, the factors of
wage research (1%) and collective bargaining (0.5%) did not affect the salary
increment as much as the other factors.
Moreover, inflation and individual performance affected the salary increment
together in 7.5% (N = 15) of the surveyed organizations. Additionally, 6.5% (N = 13)
of the organizations had inflation, individual performance, and company profitability
as the factors that affect the wage increment in combination.

101
Table 3.55 The Factors Affecting the Salary Increment
Salary Increment Frequency Percentage % Inflation 133 66.5 Performance 125 62.5 Profit 89 44.5 Appointment 72 36 Education Level 55 27.5 Seniority 54 27 Group Performance 39 19.5 Skill 36 18 Relations 28 14 Wage Research 2 1 Collective Bargaining 1 0.5
Bivariate correlation analyses that were conducted for exploratory goals
demonstrated that used the factor of inflation in salary increment were likely to use
other factors of organization profit or rate of sales (r = .32, p < .01), employee
appointment (r = .29, p < .01), employee performance (r = .26, p < .01) (See
Appendix U). The factor of individual performance was significantly and positively
correlated with other factors of yearly profit of organization or rate of sales (r = .30,
p < .01) and employee appointment (r = .34, p < .01). The organizations, that took
the seniority of employees into consideration in salary increment, were also likely to
use the factors of level of employee education (r = .38, p < .01), employee skill (r =
.27, p < .01), and personal relations within the organization (r = .21, p < .01) in
determining their salary increment level.
Secondly, the factors and individuals that played a role in salary increment of
managers were examined in detail by a frequency analysis presented in Table 3.56. It
was found that first level managers (49.0%, N = 98), PA results (43.5%, N = 89),
general managers (38.5%, N = 77), executive committee (31.5%, N = 63), and
performance results (31%, N = 62) play a role in determining manager’s salary
increment amounts in organizations. Also, HR Managers, the level of
102
obtaining individual objectives, and second level managers were used as factors or
individuals to increase salary levels of employee in 23.0% (N = 46) and 22.5% (N =
45) of the organizations, respectively.
Table 3.56 The Factors and Individuals Playing a Role in Managers’ Salary
Increment
Factors of Wage Increment Frequency Percentage % First Level Manager 98 49 PA Results 89 43.5 General Manager 77 38.5 Executive Committee 63 31.5 Performance Results 62 31 HR Manager 46 23 Attaining Objectives 45 22.5 Second Level Manager 45 22.5 Collective Bargaining 2 1 Wage Research 2 1 Job Evaluation 1 0.5
Bivariate correlation analyses presented in Appendix V revealed that the
organizations in which first level managers played a role in salary increment were
likely to have second level managers to play a role in salary increment (r = .21, p <
.01). Moreover, the organizations in which HR managers play a role in salary
increment were likely to use attaining individual objectives in salary increment for
managers (r = .27, p < .01). The organizations that had general managers to
determine the rate of salary increment of managers were likely to use performance
appraisal results (r = .20, p < .01). The factor of attaining objectives was likely to be
used together with performance appraisal results (r = .36, p < .01) and numerical
performance appraisal criteria (r = .28, p < .01). Lastly, the factor of performance
appraisal results was found to be significantly and positively correlated with
numerical performance appraisal criteria (r = .30, p < .01).
Next, the factors and individuals that played a role in salary increment of

103
non-managers were examined in details by a frequency analysis. The findings
presented in Table 3.57 demonstrates that in 62.5% (N = 125) and 36.5% (N = 73) of
the organizations first level managers and general managers played a role in
determining the amount of salary increment for non-managers, respectively.
Table 3.57 The Factors and Individuals Playing a Role in Non-Managers’ Salary
Increment
Factors of Wage Increment Frequency Percentage % First Level Manager 125 62.5 General Manager 73 36.5 PA Results 72 36 HR Manager 64 32 Second Level Manager 62 31 Executive Committee 59 29.5 Collective Bargaining 3 1.5 Wage Research 2 1 Job Evaluation 1 0.5
The findings of bivariate correlation analyses presented in Appendix W
reveals that the organizations in which first level managers played a role in salary
increment were likely to have second level managers to play a role in salary
increment of non-managers (r = .21, p < .01). Moreover, the organizations in which
HR managers played a role in salary increment were likely to have general managers
to play a role in salary increment for non-managers (r = .21, p < .01). The factor of
attaining individual objectives were likely to be used together with performance
appraisal results (r = .36, p < .01) and numerical performance appraisal criteria (r =
.25, p < .01) in the organizations. Lastly, the factor of performance appraisal results
was likely to be used together with numerical performance appraisal criteria (r = .28,
p < .01) in the organizations.
Next, the frequency of salary increment was analysed. The findings
demonstrated that in 63.0% (N = 126) of the organizations and 28.5% (N = 57) of

104
the organizations, the salary increments were done twice and once a year,
respectively.
Furthermore, the organizations were analysed in terms of the benefits they
provide to their managers. The results presented in Table 3.58 demonstrated that
69.0% (N = 139) of the organizations provided lunch for managers. The 55.5% (N =
111) of the organizations provided company car and 50.5% (N = 101) of them
provided gasoline allowance for employees working in managerial positions. In
addition to those benefits, managers received health insurance and mobile phone in
45.0% (N = 90) and 43.5% (N = 87) of the organizations respectively.
Table 3.58 The Benefits for Managers
Benefits Frequency Percentage % Food Service 139 69.5 Car 111 55.5 Gasoline 101 50.5 Health Insurance 90 45 Mobile Phone 87 43.5 Travel Allowance 60 30 Festival Premium 59 29.5 New Year Premium 51 25.5 Fuel Allowance 49 24.5 Children Aid 48 24 Life Insurance 44 22 Accident Insurance 43 21.5 Education Aid 38 19 Profit Sharing 36 18 Social Benefits 36 18 Special Retirement 33 16.5 Rent Help 26 13 Club Membership 26 13 Free Apartment 25 12.5 Kinder Garden 18 9 Home Phone 13 6.5 Food Aid 1 0.5
The relationships among the benefits received by managers were analysed by
a correlation analysis for exploratory reasons. The results presented in Appendix X

105
revealed that the existence of the benefit of health insurance was significantly and
positively correlated with life (r = .37, p < .01) and accident (r = .26, p < .01)
insurances. The organizations that provided life insurance to their managers were
likely to provide benefits of accident insurance (r = .28, p < .01) and special
retirement programs (r = .28, p < .01). The organizations that provided company cars
to their managers were likely to provide other benefits of gasoline (r = .52, p < .01)
and mobile phone (r = .48, p < .01). Next, the managers who received new year
premium were likely to receive festival premium, too (r = .25, p < .01).
The organizations were also analysed in terms of the benefits they provided to
their employees. The results shown in Table 3.59 indicated that 74.0% (N = 148) of
the organizations provided lunch for non-managers. Forty three percentage (N = 87)
of the organizations provided travel allowance and 39.0% (N = 78) of them provided
health insurance allowance for employees working in non-managerial positions.
Table 3.59 The Benefits for Non-managers
Benefits for Non-Managers Frequency Percentage % Food Service 148 74 Travel Allowance 87 43.5 Health Insurance 78 39 Festival Premium 73 36.5 Social Benefits 71 35.5 Fuel Allowance 70 35 Children Allowance 62 31 Education Allowance 57 28.5 Accident Insurance 49 24.5 New Year Premium 38 19 Life Insurance 32 16 Gasoline 30 15 Kinder Garden 26 13 Rent Help 25 12.5 Special Retirement 22 11 Club Membership 20 10 Car 19 9.5 Mobile Phone 19 9.5 Profit Sharing 19 9.5

106
Table 3.59 Continued Free Apartment 13 6.5 Home Phone 5 2.5 Food Allowance 1 0.5
The relationships among the benefits received by non-managers are presented
in Appendix Y. As can be seen, the benefit of health insurance received by non-
managers was significantly and positively correlated with life insurance (r = .38, p <
.01) and special retirement programs (r = .21, p < .01). The organizations that
provided life insurance to employees were likely to provide accident insurance (r =
.20, p < .01). Organizations that provided company cars were likely to provide
gasoline (r = .20, p < .01) and mobile phone (r = .42, p < .01).
Moreover, in addition to the incentives the organizations used monetary
rewards to motivate their employees. The frequency analysis presented in Table 3.60
revealed that in 41.0% (N = 82) of the organizations, individual premiums were used
as monetary rewards. On the other hand, in 34.5% (N = 69) of the organizations,
monetary rewards were not used. Two other kinds of monetary rewards, profit
sharing and group premium, were used in 13.0% (N = 26) and 12.5% (N = 25) of the
organizations, respectively.
Table 3.60 The Kinds of Monetary Rewards
Monetary Rewards Frequency Percentage % Individual Premium 82 41 No Moneterial Reward 69 34.5 Profit Sharing 26 13 Group Premium 25 12.5 Share 14 7 Individual Premium For Sales Team 5 2.5 Travel 1 0.5
In addition, 51.5% (N = 103) of the organizations gave plaques to employees
to reward their accomplishments or high performance. As it is presented in Table

107
3.61, in 42.5% (N = 85) and 34.0% (N = 68) of the organizations employees were
rewarded by gifts or success stories posted on boards or published in company
magazines.
Table 3.61 The Kinds of Non-Moneterial Rewards
Kinds of Non-Moneterial Rewarding Frequency Percentage % Plaquette 103 51.5 Gifts 85 42.5 Success Stories 68 34 Holiday 27 13.5 Social Activities 1 0.5
Participating organizations were also examined in terms of their pay format
for overtime. Findings showed that in 70.5% (N = 141) of the organizations,
employees received extra payment for over time work, however, in 25.0% (N = 50)
of the organizations employees did not receive any extra payment for over time.
In 50.5% (N = 101) of the organizations, blue collar employees received extra
payment for overtime and in 37.5% of the organizations non-managers received extra
payment for over time work. Additionally, first level managers and management
trainees received extra payment for overtime work in 16.5% (N = 33) and 10.5% (N
= 21) of the organizations, respectively.
3.12 Job Evaluation
Considering job evaluation function of HRM, frequency analyses were
conducted to find out the number of organizations that engaged in job evaluation and
whether the results of job evaluation were used in compensation, and to examine the
methods of job evaluation. The frequency analyses were also conducted to analyse
whether organizations conducted a study to determine the salary levels of employees
in the sector they operated. In addition, the correlations between methods of job
evaluation were examined for exploratory purposes.

108
First, it was found that 45.0% (N = 90) of the organizations used systematic
approach to find out the relative worth of jobs in the organization, however 49.0% (N
= 98) of the organizations did not use such an approach.
Next, the methods that were used in job evaluation process were examined by
a frequency analysis presented in Table 3.62. Results reveals that in 27.0% (N = 54),
23.5% (N = 47), 22.0% (N = 44) and 15.5% (N = 31) of the organizations, the
methods of job grading, scoring, job ranking, and factor comparison were used,
respectively.
Table 3.62 The Methods of Job Evaluation
Methods of Job Evaluation Frequency Percentage % Job Grading 54 27 Scoring 47 23.5 Job Ranking 44 22 Factor Comparison 31 15.5
Bivariate correlation analyses were performed to find out the relations among
the methods of job evaluation. Results presented in Appendix Z suggested that the
method of job ranking was significantly and positively correlated with job grading
(r = .33, p < .01). Moreover, the method of job grading was significantly and
positively correlated with the method of job scoring (r = .27, p < .01). Scoring was
significantly and positively correlated with factor comparison (r = .28, p < .01).
Additionally, another frequency analysis was performed to examine whether
the results of job evaluation were used in compensation or not. The results disclosed
that in 41.0% (N = 82) of the organizations, the results of a study that was carried out
to find out the relative worth of jobs within the organization were used as an input in
compensation management. On the other hand, the results of job evaluation study
were not used in the area of compensation management in 18.5% (N = 37) of the

109
organizations.
Moreover, it was examined whether the organizations conducted a study to
find out the salary levels of employees in the sector they operated. The findings
disclosed that only 34.5% (N = 69) of the organizations carried out such a study.
However, 61.0% (N = 122) of the organizations did not do a research on salary levels
of other organizations operating in same sector.
3.13 Managing Union Relations
In this part of the analyses, the organizations were examined in terms of their
practices in union relationship management. The frequency analyses were conducted
in order to examine the departments that were responsible for union relation
activities and the functions involved in management of union relations.
Firstly, a frequency analysis was performed to find out the number of
organizations in which HRM departments were responsible for managing employee
relations. The findings demonstrated that in 28.5% (N = 57) of the organizations,
HRM departments were responsible for managing union relationships.
As seen in Table 3.63, 33.3% (N = 19) of the HRM departments, that were
responsible for managing union relationships, performed the required preparations
before the collective bargaining. Moreover, 31.6% (N = 18) of the HRM departments
were responsible for performing collective bargaining with unions. Also, the
activities of applying the requirements of the collective agreement, managing the
relations with unions, and solving employee complaints were carried out by 26.3%
(N = 15), 21.1% (N = 12) and 14.0% (N = 8) of the HRM departments respectively.
Furthermore, a frequency analysis was conducted to find out the
combinations of union relationship management activities that were most frequently
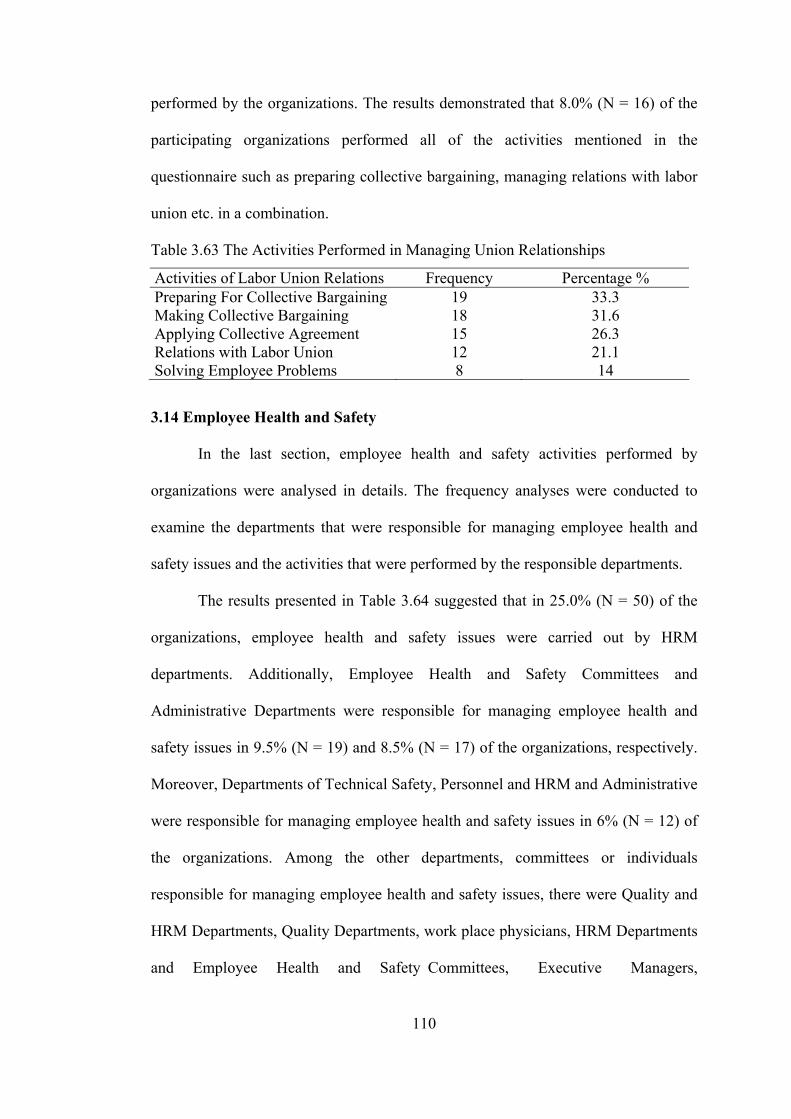
110
performed by the organizations. The results demonstrated that 8.0% (N = 16) of the
participating organizations performed all of the activities mentioned in the
questionnaire such as preparing collective bargaining, managing relations with labor
union etc. in a combination.
Table 3.63 The Activities Performed in Managing Union Relationships
Activities of Labor Union Relations Frequency Percentage % Preparing For Collective Bargaining 19 33.3 Making Collective Bargaining 18 31.6 Applying Collective Agreement 15 26.3 Relations with Labor Union 12 21.1 Solving Employee Problems 8 14
3.14 Employee Health and Safety
In the last section, employee health and safety activities performed by
organizations were analysed in details. The frequency analyses were conducted to
examine the departments that were responsible for managing employee health and
safety issues and the activities that were performed by the responsible departments.
The results presented in Table 3.64 suggested that in 25.0% (N = 50) of the
organizations, employee health and safety issues were carried out by HRM
departments. Additionally, Employee Health and Safety Committees and
Administrative Departments were responsible for managing employee health and
safety issues in 9.5% (N = 19) and 8.5% (N = 17) of the organizations, respectively.
Moreover, Departments of Technical Safety, Personnel and HRM and Administrative
were responsible for managing employee health and safety issues in 6% (N = 12) of
the organizations. Among the other departments, committees or individuals
responsible for managing employee health and safety issues, there were Quality and
HRM Departments, Quality Departments, work place physicians, HRM Departments
and Employee Health and Safety Committees, Executive Managers,

111
Personnel and HRM Departments, Personnel and Administrative Departments and
Administrative Departments.
Table 3.64 The Performers of Employee Health and Safety Issues
Performers of Health and Safety Activities Frequency Percentage % HRM Department 50 25 Employee Health and Safety Committee 19 9.5 Administrative Department 17 8.5 Technique Safety Department 12 6 HRM and Administrative Department 12 6 Personnel Department 12 6 Quality and HRM Department 11 5.5 Quality Department 10 5 Work place physician 9 4.5 HRM & Employee Health and Safety Committee 9 4.5 Executive Manager 7 3.5 Personnel and HRM Departments 7 3.5 Personnel and Administrative Department 6 3 Administrative Department & doctor 4 2 Missing 15 7.5 Total 200 100
Next, the activities of employee health and safety management were analysed
by a frequency analysis. The findings in Table 3.65 demonstrated that 70.0% of the
organizations (N = 140) applied legal issues of employee health and safety.
Moreover, 67.0% (N = 134) and 65.0% (N = 130) of the organizations performed the
practices of analysing job accidents and taking precautions to prevent potential
accidents, and coordinating the employee health and safety programs, respectively.
In addition, 62.5% (N = 125) of the organizations were responsible for preparing
employee health and safety programs. Sixty two percent (N = 124) of the
organizations were responsible for training employees in terms of health and safety
issues and recording documents related to those issues. Finally, Table 3.66 illustrated
that generating statistical reports for job accidents and participating in Employee
Health and Safety Committee were among the activities that were performed by

112
61.0% (N = 122) and 56.0% (N = 113) of the organizations.
Furthermore, a frequency analysis was conducted to identify the
combinations of employee health and safety activities that were most frequently
performed by the organizations. The results demonstrated that all of the employee
health and safety activities mentioned in the questionnaire were used in combination
in 28.0% (N = 56) of the participating organizations.
Table 3.65 The Activities of Managing Employee Health and Safety
Activities of Health and Safety Frequency Percentage % Legal Issues 140 70 Job Accidents 134 67 Coordinating 130 65 Preparing 125 62.5 Training Employees 124 62 Records 124 62 Statistics 122 61 Committee 113 56.5

113
CHAPTER 4
DISCUSSION 4.1 HRM Practices in Turkey The objective of the present study was both to examine the current HRM
practices in Turkish private sector organizations and to compare these activities with
the HRM practices in other countries based on the available studies conducted in
these countries. The HRM practices were examined under 11 sections (i.e., job
analysis and design, recruitment, selection, orientation, employee training and
development, performance appraisal, career planning and development, human
resource planning, compensation management and incentives, employee relations,
and managing employee health and safety).
First of all, the results of the present study revealed that most of the
organizations prefer to use the name Human Resources Management Department
instead of Personnel Department. This finding is in line with the previous research
conducted in 307 organizations operating in Turkey in the year 2000 (Arthur
Andersen, 2000) (See Table 4.1).
The results of the present study also demonstrated that HRM Managers were
the primary responsible persons of HRM departments in more than half of the
surveyed organizations. Additionally, HRM managers reported directly to top
management, as it was the case in a previous study (Arthur Andersen, 2000) (See

114
Table 4.1). Furthermore, when the education background of HRM managers was
analyzed, it was found that they were educated in different areas such as
management, economy, industrial engineering etc. and only 2.5% of them had a
masters’ degree in HRM.
Moreover, the present study showed that personnel management activities
such as making payroll, transportation and food services, etc. were still performed by
the HRM departments. So, it can be noted that personnel management activities were
still among the functioning area of HRM departments in organizations.
Table 4.1 Comparison of Present Study with Arthur Andersen’s Study
Present Study Arthur Andersen's StudyHRM Name of HRM Departments
HRM Department-İnsan Kaynakları Departmanı
HRM Department-İnsan Kaynakları Departmanı
Individuals to whom HRM Manager Reports
Top Management Top Management
Selection Tools for Managers
Interview References Personality Tests
Newspaper Consultancy Firms CV Bank
Selection Tools for Non-managers Interview
References Personality Tests
Employee Recommendation CV Bank Newspaper
Interview Techniques
Single Interviewer Panel Interview Structured Interview
Single Interviewer Panel Interview
Methods of Orientation
Orientation by Department Managers Trips Brochures/Handbooks
Information about Different Departments Brochures Video Presentation
Receivers of Orientation Programs
Non-managers First Level Managers
Non-managers First Level Managers

115
Table 4.1 Continued Length of Orientation Programs
1 Day to 1 Week Less Than 1 Day
Methods of Training
On the Job Training In Class Training
On the Job Training In Class Training
Receivers of Training
Non-managers Middle Level Managers
Non-mangers Management Trainees
Ways of Determining Training Programs
Demand of Managers Demand of Employees
Demand of Managers Demand of Employees
Evaluation of Training Programs
Trainee Evaluation Tests Trainer Evaluation
Trainer Evaluation Tests
Methods of Need Analysis
PA Results Questionnaires
Questionnaires Interviews
Content of PA Form
Same for Hierarchical Levels Same for All Employees
Same for Hierarchical Levels Same for All Employees
Sharing PA Results Feedback Interview Feedback Interview
Use of PA Results Determining Training
Needs Compensation
Career Planning Compensation Training
Duration of HR Planning
One Year or Less One to Three Years
Factors that Affect Salary Increment
Inflation Individual Performance
Inflation Individual Performance
Individuals Playing a Role in Salary Increment
First Level Manager General Manager
First Level Manager Second Level Manager
Benefits Lunch Lunch
Health Insurance Moneterial Rewarding
Individual Premium Individual Premium

116
Furthermore, personnel selection and recruitment were the most frequently
applied activities in the surveyed organizations. The most frequently used selection
methods were interview and references both for managerial and non-managerial
positions. It was also found that the most widespread technique was one-to-one
interview, similar to what is reported in a prior study (Arthur Andersen, 2000) (See
Table 4.1). In addition, most of the interviews performed by organizations were
either structured or semi-structured. As it was stated before, recruitment was the
second most frequently performed activity in the surveyed organizations and walk-in
was the most widespread method in selecting employees. This finding is not in line
with the findings of the previous study by Arthur Andersen (2001) (See Table 4.1).
In that study, the method of employee recommendation was identified to be the most
frequently used method. However, employee recommendation was the second most
frequently used method in the present study. Surprisingly, although the methods of
walk-ins and employee recommendation used frequently, they were not evaluated as
effective ways to select non-managerial positions.
In terms of manager recruitment, techniques such as newspaper, internet and
consultancy firms were used more frequently than the other methods. When these
findings were compared with those of Arthur Andersen it was seen that newspaper
and consultancy firms were also among the most frequently used methods in the year
2000 (See Table 4.1). However, the method of internet was not used as frequently as
found in the present study.
Furthermore, the method of campus recruitment was not found to be a
frequently used method in the present study, however, it was found to be the most
widely used method especially in private organizations in Turkey (Öztürk, 1995).

117
The third most frequently carried out HRM function was training and
development activity, yet only 41% of the organizations had a training department.
When the training function of HRM was further analyzed, it was found that in most
of the participating organizations, the training needs were determined by either the
immediate managers or employees themselves. Moreover, the organizations that
conducted a training need analysis generally used the performance appraisal results
of employees and questionnaires. Results of a previous study showed that need
analysis was performed by using the results of performance appraisal and the
information received by conducting interviews with managers (Cengizhan & Ersun,
2000). When the training methods applied by organizations were analysed, it was
found that on the job training was the most frequently used method. This finding was
also consistent with the results of Acuner’s (2001) study. Additionally, in the present
study the methods like computer-based training, role playing, games and simulators
were not found to be as widespread as on-the-job or in-class training.
Another important issue in training function was the evaluation of training
programs. It was found that in most of the surveyed organizations training programs
were evaluated by using reaction criteria. However, the results of a previous study
demonstrated that the organizations generally used the method of trainer evaluation
(Arthur Andersen, 2000) (See Table 4.1). On the contrary, in both studies, learning
criteria was the second most frequently used evaluation criteria. That is, knowledge
tests that assess to what extent the trainees have learned the principles, facts, and
approaches that are included in the training program, were found to be the second
most frequently used criterion in evaluating training effectiveness. The fourth
frequently applied activity of HRM was compensation management and benefits.
When the factors that affected the salary increment were analysed, it was concluded

118
that inflation was still the main factor in determining the amount of wage increment
in the participating organizations. The second important factor in wage increment
was employee performance (i.e., merit) as it was the case in a previous study (Arthur
Andersen, 2000) (See Table 4.1). Moreover, the classical factor of employee
seniority was not found to be as important as either employee performance or
inflation. The present study also revealed that the individual relations had a minor
role in wage increments, suggesting that subjective criteria were not that much
effective in salary increment. As a result, it seems fair to say that participating
organizations tended to use more westernized approaches in compensation
management.
The individuals who played a role in wage increments were found to be
immediate supervisors as it was reported by the Arthur Andersen study (2001) (See
Table 4.1). Arthur Andersen’s study also revealed that second-rank managers played
a secondary role in wage increment in 36.2% of the surveyed organizations in
Turkey. However, in the present study this rate was 22.5%.
In addition to compensation, managing monetary and non-monetary
incentives were also important aspects in employee motivation. The findings of the
present study revealed that the most frequently used monetary incentive was
individual premium and the most frequently used non-monetary incentives were
giving plaquettes or gifts to employees. As a result, the number of organizations that
provided non-monetary incentives was more than the ones that applied monetary
incentive payments.
Performance appraisal or performance management was found to be the fifth
frequently applied HRM activity in the surveyed organizations. Coming from a
public sector tradition, seniority has played an important role in wage increments and

119
appointments in Turkey for a long time. However, according to the results of present
study, 80.5% of the surveyed organizations evaluated their employees based upon
their performance. So, in this respect, Turkish organizations seem to catch up with
their western counterparts.
In the Arthur Andersen study (2000), the rate of organizations in Turkey with
a structured PA system was reported to be 72%. However, the results of the present
study demonstrated that the rate of organizations that had a PA system was 57%.
This difference is probably due to sampling differences between the two studies. Yet,
the implication is that majority of the Turkish private sector organizations appear to
have a systematic approach to performance appraisal. Moreover, in the present study
it was found that performance criteria on PA form were the same for all levels in the
surveyed organizations, apparently not a very desirable situation. Ideally,
performance criteria are expected to be different for different workgroups, positions,
and levels of employees.
Next, the present study demonstrated that most of the organizations evaluated
employee performance once or twice a year and the employee performance was
generally evaluated by the first-rank and second rank supervisors, consistent with the
available literature (Erdil, 2000). However, relatively more recent and
unconventional approaches to performance management, such as 360 degree
feedback that has built on the idea of multiple assessors from all around the
employee (from employee manager, subordinate, peer, customer etc.), was not
widespread among organizations in Turkey. In addition, the most frequently used
two PA methods by the surveyed organizations were rank order approach and
graphic rating scales. Concerning feedback to employees about PA results, only in
33.5% of the surveyed organizations performance results were systematically shared
120
with employees. This finding is not necessarily consistent with the results of other
studies. For example, Erdil (2000) and Arthur Andersen (2000) reported that 76%
and 43% of the Turkish organizations conduct face to face interviews, respectively.
Employee orientation activity was found to be the sixth frequently applied
HRM activity in the surveyed organizations. Majority of the surveyed organizations
had an orientation program for their newly hired employees and new employee
orientation was performed mostly by HRM departments and/or the new employee’s
manager. The present study revealed that the most frequently used orientation
methods were orientation programs performed by department managers, trips to
work sites, and handling brochures/handbooks. The percentage of the surveyed
organizations that employed all three of these methods was 15.5% only. Lastly, the
present study revealed that the orientation programs were mostly applied to non-
managers, consistent with other findings (Arthur Andersen, 2001) (See Table 4.1).
Managing employee health and safety was the seventh most frequently
applied HRM practice in the surveyed organizations. However, in most of the
organizations the related activities were not carried out by the HRM departments.
Furthermore, one of the most important HRM functions, job analysis, was
performed only in 65.5% of the surveyed organizations. This finding is in line with
the previous findings (Öztürk, 1995). The present study also revealed that job
analysis was conducted mostly by HRM departments of the organizations and it was
usually conducted once a year. However, Öztürk’s (1995) study revealed that most of
the organizations in Turkey performed job analysis once every five year only. The
results related to job analysis activities of the two study is different since the type of
the organizations participated in these two studies were different. The organizations

121
in Öztürk’s study were small and medium enterprises however present study has
examined the private organizations.
The present study demonstrated that the HRM activity of career planning was
not performed generally in the participating organizations. The present study also
revealed that the most frequently applied stages of career management were human
resource planning, employee assessment, matching employee career objectives with
organizational opportunities and training employees. As it was stated above, one of
the stages of career planning system was identifying employee KSAO’s. The present
study showed that supervisor evaluations and PA results were the most frequently
used methods in evaluation of employee KSAO’s. In addition, the present study
examined the activities that were included in career management systems and the
results revealed that courses, seminars/trainings and rotations were among the most
frequently applied activities. On the other hand, the methods of assessment centers or
simulators were used only by 0.5% of the organizations.
Human resource planning, a significant component of career planning, was
performed by the majority of the surveyed organizations (58.5%). The present study
also revealed that in most of the surveyed organizations, the HR plans was performed
for one year or less. This finding was not consistent with previous findings since the
results of a previous study demonstrated that in most of the organizations (56.7%)
HR plans were conducted for 1 to 3 years (Arthur Andersen, 2000).
4.2 Comparison of HRM Practices across Different Countries
Human resource management began to mature in the 1990’s throughout the
world. HRM became a field with varying applications and practices in different
countries, and it is growing and changing more rapidly than imaginable. Once HR
departments were considered as mechanical units or administrative necessities that
122
help the organization to hire, fire, and possibly train employees. However, nowadays
HRM departments are expected to add value to the organization since the importance
of a highly skilled, motivated, flexible workforce has become certain (Aghazadeh,
2003). Moreover, it has become more and more important for organizations to reach
organizational excellence via HRM strategies. Ulrich (1998) has presented four
ways for HRM to deliver organizational excellence;
1. Forming a partnership with senior and line managers to move to the
marketplace.
2. Becoming an expert in the way that work is organized and executed to deliver
efficiency to reduce costs but maintain quality.
3. Working to increase employee contributions, commitment and ability to
deliver results.
4. Being an agent of continuous transformation, improving an organization’s
capacity to change by shaping processes and a culture.
Aghazadeh (2003) stated that there are five essential challenges that need to
be faced in today’s business environment; globalization, profitability through growth,
technology, intellectual capital, and change management. Of course, HR
professionals have to face all of these challenges. First, to deal with globalization,
HR managers have to ensure that HR policies and practices provide the balance
between consistency and coordination versus recognition of cultural and other
differences. Secondly, HR professionals have to make employees creative and
innovative through continuous learning and development. Additionally, in
organizations that grow through mergers or joint ventures, HR managers have to use
their skills to combine different work processes and cultures. Thirdly, to deal with
improving technology, HR professionals should minimize the resistance of

123
employees towards new technology by supporting them with the necessary training.
Fourthly, in order to capture intellectual capacity, HR managers have to attract,
develop, and retain talented individuals. Finally, HR departments must examine and
adopt new structures, new working processes, and a new culture of business support
in order to deal with challenge of continuous change (Aghazadeh, 2003).
Considering all of the mentioned roles of HR professionals, it can be stated
that the role of HRM has become more strategic. Accordingly, the field of strategic
human resource management (SHRM) has grown steadily since the mid 1980s
(Boxall & Purchell, 2000).
As the sub-fields of HRM were further analyzed, it was seen that the
transition from the practice of personnel management to HRM had been
accomplished with a more systematic and strategic approach to staffing. As a result,
personnel selection and recruitment appeared as the most important areas of HRM.
This study presented that the most frequently applied HRM areas in the surveyed
organizations in Turkey were personnel selection and recruitment. The HRM
functions of personnel selection and recruitment were also among the top HRM
activities in the United States (“Retaining Workers”, 1999). Proactive planning to
maintain appropriate staff and implementing more effective selection activities were
important for HRM practitioners in the US.
In terms of recruitment practices, the present study concluded that recruiting
via internet was practiced frequently in the surveyed Turkish organizations. The
technique of online recruitment was also used in the US companies with different
sizes operating in various industries since it is a cost effective and fast way to reach
potential candidates. Online job ads also allow the applicants to visit organization’s
web site so that they receive further information about the company. Gale (1994)

124
reported that in the US, 96% of job seekers use the internet as their most commonly
used search tactic.
Concerning the method of internal recruitment, it was found that more than
half of the organizations operating in Turkey employed internal recruiting via
organizational intranet and job posting. Table 4.2 presents recruitment activities in
four different countries. A word of caution is needed concerning this table and the
following tables in which HRM practices across different countries are summarized.
These tables bring together results of independent/individual studies conducted in
different countries; they do not present summary findings from cross-cultural
comparisons. So, it should be kept in mind that, they do not necessarily represent the
totality of the HRM activities in those countries. Results are only reflective of the
situations in the sampled organizations in studies conducted in different countries.
Yet, these tables are expected to help the readers understand the nature of the HRM
activities very roughly in different countries.
As presented in Table 4.2, internal recruiting is also popular in companies
operating in the US. For instance, many organizations such as IBM recruit their non-
entry level jobs via internal recruiting strategies for reasons such as improving
employee morale and not dealing with the issues of fairness and openness of hiring
processes (Springer & Springer, 1990). Additionally, internal recruitment was also
practiced by organizations in Holland in manager recruitment using the method of
job posting (Wiersma & Van Den Berg, 1999). In addition, the methods of print
advertisements, referral from universities, recruitment consultants and internet were
among the techniques that were employed by organizations in Indonesia (Bennington
& Habir, 2003).
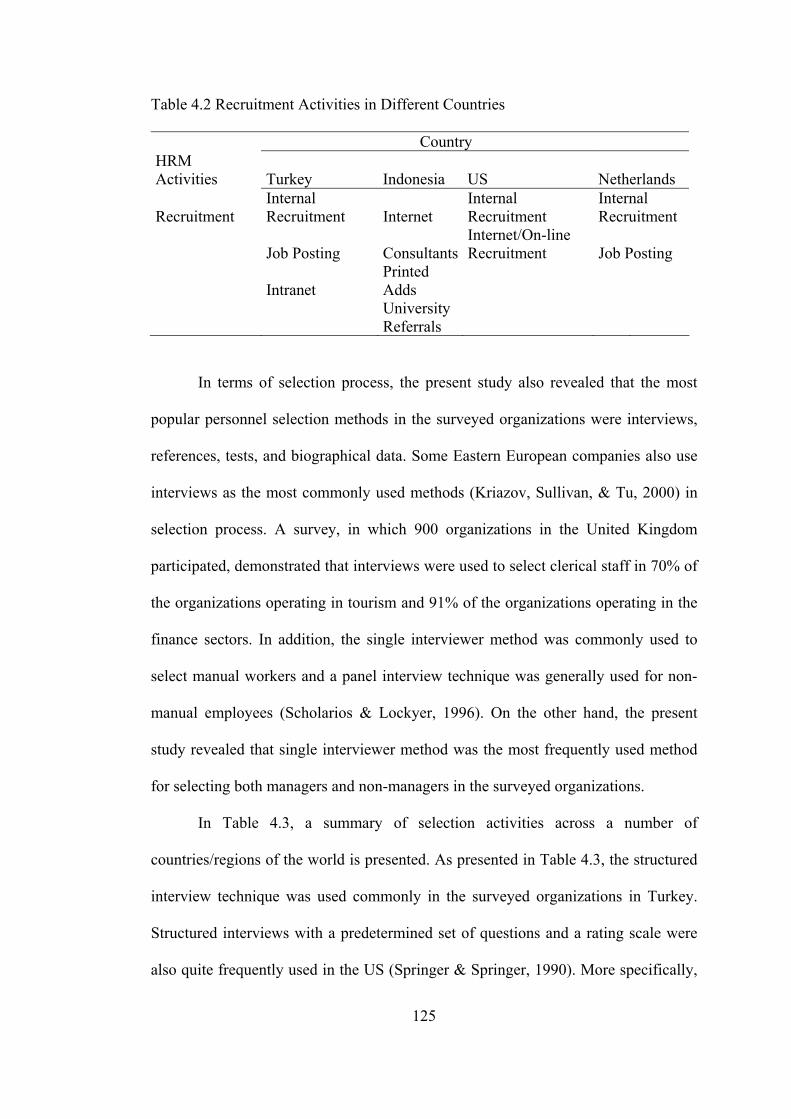
125
Table 4.2 Recruitment Activities in Different Countries
Country HRM Activities Turkey Indonesia US Netherlands
Recruitment Internal Recruitment Internet
Internal Recruitment
Internal Recruitment
Job Posting ConsultantsInternet/On-line Recruitment Job Posting
Intranet Printed Adds
University Referrals
In terms of selection process, the present study also revealed that the most
popular personnel selection methods in the surveyed organizations were interviews,
references, tests, and biographical data. Some Eastern European companies also use
interviews as the most commonly used methods (Kriazov, Sullivan, & Tu, 2000) in
selection process. A survey, in which 900 organizations in the United Kingdom
participated, demonstrated that interviews were used to select clerical staff in 70% of
the organizations operating in tourism and 91% of the organizations operating in the
finance sectors. In addition, the single interviewer method was commonly used to
select manual workers and a panel interview technique was generally used for non-
manual employees (Scholarios & Lockyer, 1996). On the other hand, the present
study revealed that single interviewer method was the most frequently used method
for selecting both managers and non-managers in the surveyed organizations.
In Table 4.3, a summary of selection activities across a number of
countries/regions of the world is presented. As presented in Table 4.3, the structured
interview technique was used commonly in the surveyed organizations in Turkey.
Structured interviews with a predetermined set of questions and a rating scale were
also quite frequently used in the US (Springer & Springer, 1990). More specifically,

126
the techniques such as patterned behavior description interviews and situational
interviews were used in employee selection by many US companies (Cascio, 1995).
Furthermore, in Netherlands assessment centers and work samples were among the
most commonly used selection methods (Wiersma & Van den Berg, 1999). The
present study demonstrated that assessment center method was not commonly used
in employee selection by the surveyed organizations and the method of work samples
was not applied by any of the surveyed organizations, despite meta-analytic findings
showing that work samples have a true validity of .38 (Schmitt, 1984), and average
validity of assessment centers is around .40 (Howard, 1997).
Table 4.3 Selection Activities in Different Countries
Country
HRM Activities Turkey US Netherlands England
Eastern Europe
Selection Tools
Single Interviewer
Behavioural Interview
Work Samples
Single Interview
Interview
Structured Interview
Structured Interview
Assessment Centers
Panel Interview
References Situational Interviews
Tests
Biographical Data
After selecting employees, the organizations need to provide orientation
programs to them. The results presented in Table 4.4, show that orientation programs
were applied generally by the HRM departments in the surveyed organizations and
the first-rank managers, as was the case in the US (Barbazette, 2004). The functions
of the HRM departments and the first rank supervisors were not the same in
orientation programs in the US organizations. The former is responsible of sharing
organizational policies, history, and benefits but the latter usually explains safety

127
rules, reporting requirements, and mainly job tasks (Barbazette, 2004). In addition,
the present study demonstrated that trips to the organization and handling brochures
were mainly used in orientation programs in the surveyed organizations. The
practices in the US organizations are also similar since they generally set up a tour in
the organization that ends in employee’s work area, and the new employee is paired
with a veteran employee (Barbazette, 2004). However, the method of using a veteran
employee or a mentor was not common in the surveyed organizations.
Table 4.4 Orientation Activities in Different Countries
Country HRM Activities Turkey US Performers of Orientation Programs HRM Departments HRM Departments First Rank Managers First Rank Managers Orientation methods Trips Trips Brochures Mentors
Training and development function was also presented as one of the most
essential HRM activities practiced in the surveyed organizations. As it is presented in
Table 4.5, on the job training and in-class training were among the most popular
training techniques in organizations operating in Turkey. Japanese organizations also
give priority to training activities. They frequently use the method of on-the-job
training and job rotation. In addition, off the job training techniques are also gaining
importance among Japanese organizations (Koike, 1997). Rowley, Benson, and
Warner (2004) stated that the methods of job rotation and on the job training were
also commonly applied in South Korean organizations. Moreover, the trend in the
US is to provide in-house training programs that include the usage of software
packages (Springer & Springer, 1990). However, the computer-based training

128
programs were also used by the participating organizations in Turkey, but not very
commonly. Although the training and development issue was also important for the
organizations in Eastern Europe, they lack the financial resources. Similar to the
organizations in Turkey, most of the organizations in Eastern Europe apply the
method of on the job training and lectures (Kiriazov et al., 2000).
Table 4.5 Training Activities in Different Countries
Country HRM Activities
Turkey Japan US Eastern Europe
Training Methods
On Site Training
On Site Training
In house training On Site Training
In-class Training
Job Rotation Work Place Problems
Lectures
Computer Based Training
Computer Based Training
Considering performance appraisal the present study demonstrated that 80.5%
of the organizations had a performance management system. Studies indicated that
85% of the organizations in Australia (Nankervis & Leece, 1997), 86% of the
organizations in the UK and 90% of the organizations in the US had a systematic
performance system (Anderson, 1996). According to Anderson, performance
management systems are applied mainly to managers and supervisors in the UK but
it has been extended to clerical and manual workers in recent years.
As presented in Table 4.6, employee performance was appraised mainly by
the first level supervisors in the surveyed organizations. However, in Japanese
organizations, the employee performance is also evaluated by the HRM departments
(Takeuchi, 1990). In addition, employees are mostly appraised annually in Japanese
(Takeuchi, 1990) and US organizations (Selden, Ingraham, & Jacobson, 2001).
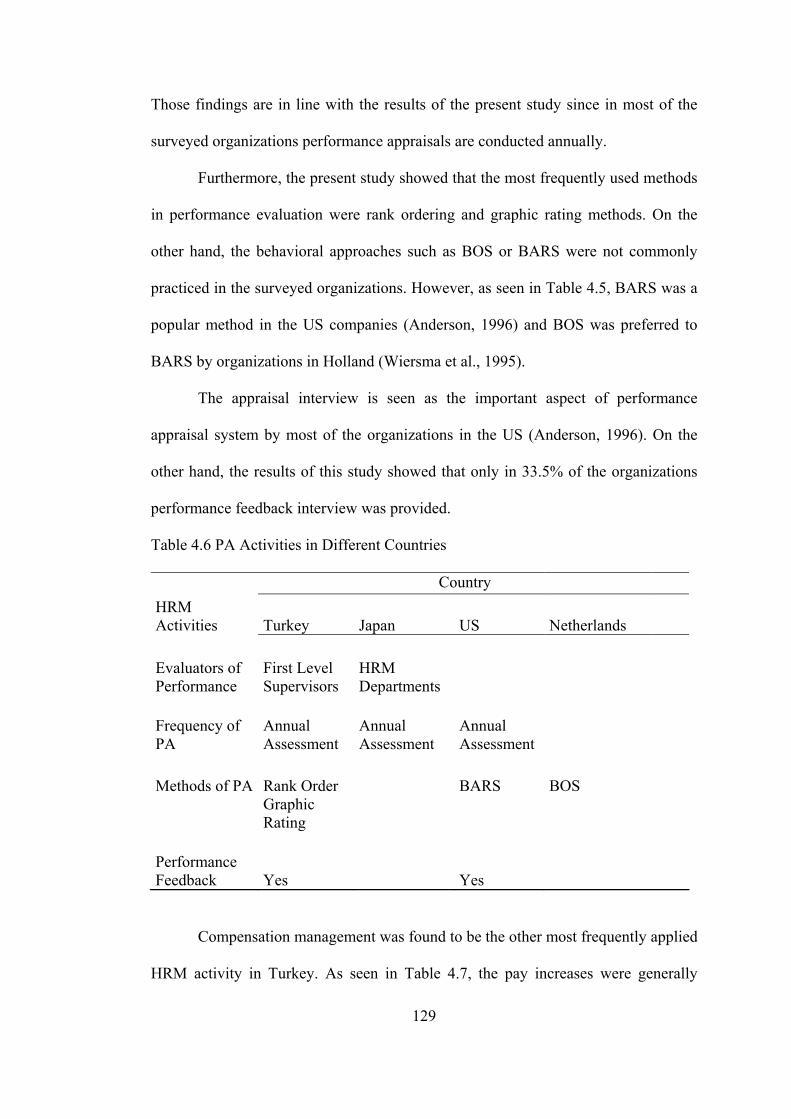
129
Those findings are in line with the results of the present study since in most of the
surveyed organizations performance appraisals are conducted annually.
Furthermore, the present study showed that the most frequently used methods
in performance evaluation were rank ordering and graphic rating methods. On the
other hand, the behavioral approaches such as BOS or BARS were not commonly
practiced in the surveyed organizations. However, as seen in Table 4.5, BARS was a
popular method in the US companies (Anderson, 1996) and BOS was preferred to
BARS by organizations in Holland (Wiersma et al., 1995).
The appraisal interview is seen as the important aspect of performance
appraisal system by most of the organizations in the US (Anderson, 1996). On the
other hand, the results of this study showed that only in 33.5% of the organizations
performance feedback interview was provided.
Table 4.6 PA Activities in Different Countries
Country HRM Activities Turkey Japan US Netherlands Evaluators of Performance
First Level Supervisors
HRM Departments
Frequency of PA
Annual Assessment
Annual Assessment
Annual Assessment
Methods of PA Rank Order BARS BOS
Graphic Rating
Performance Feedback Yes Yes
Compensation management was found to be the other most frequently applied
HRM activity in Turkey. As seen in Table 4.7, the pay increases were generally

130
based on inflation, employee performance, and company profit in the present study.
Similarly, pay increases are tied to individual improvement and company
performance in the US organizations (“Lessons From 100 Years of Compensation,
2000). On the other hand, since team work is important in the US companies, the pay
increases are also based on group performance (“Lessons From 100 Years of
Compensation, 2000). Accordingly, the present study revealed that salary increments
based on group performance was not common among the surveyed organizations. In
addition, as it is presented in Table 4.7, individual performance is also an indicator of
salary increment in Korean and Japanese organizations (Rowley et.al., 2004).
Other than salary administration, the benefits are also important in
compensation management. The results of the present study revealed that there were
differences among managers and non-managers in terms of the benefits they
received. The managers generally received food services, company cars, whereas
employees received food services as social benefits. On the contrary, as it is
presented in Table 4.7, large organizations in Eastern Europe sponsor schools and
provide housing, holiday accommodations, recreational facilities, and cafeterias to
their employees (Kriazov et al., 2000). However, those kinds of benefits do not seem
to be common among organizations operating in Turkey. As the benefit packages
provided by the US companies are analyzed, it is seen that health insurance and
private pension plans are among the most common benefits provided by the US
organizations (Springer & Springer, 1990). However, those benefits were not
commonly provided by the participating organizations in Turkey.

131
Table 4.7 Compensation Management Activities in Different Countries
Country HRM Activities Turkey US Japan Korea
Eastern Europe
Factors of Pay Increases
Individual Performance
Group Performance
Individual Performance
Individual Performance
Inflation Company Profit
Benefits Food Services
Paid Leave Time
Sponsoring Schools
Company Cars
Health Insurance Housing
Pension Plans Holiday Cafeteria
Creational Activities
In addition to benefits, the surveyed organizations used monetary and non-
monetary rewards to motivate their employees. In terms of monetary rewards, these
organizations mostly provided individual premiums. On the other hand, as it is stated
by Springer and Springer (1990), the new trend seems to use team or organization
wide incentives such as profit sharing and productivity gain sharing in the US
organizations. As shown in Table 4.8, the use of profit and gain sharing was not
common among the surveyed organizations.
In terms of non-monetary reward systems, the US companies generally use
time and job flexibility (Springer & Springer, 1990). In addition, organizations in
Holland increase task and job variety, apply participative decision making and form
quality circles to intrinsically motivate their employees (Wiersma & Van den Berg,
1999). In the present study it was found that the surveyed organizations in Turkey
generally used the methods of giving plaquettes and gifts to the employees.
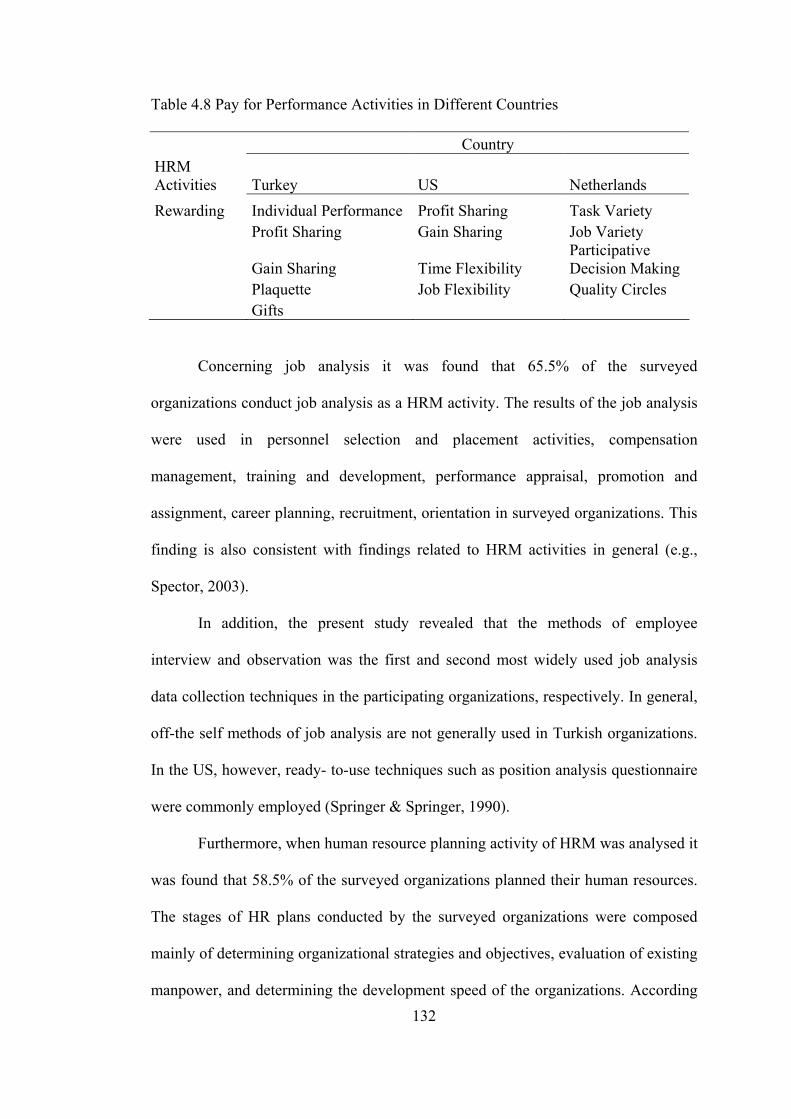
132
Table 4.8 Pay for Performance Activities in Different Countries
Country HRM Activities Turkey US Netherlands Rewarding Individual Performance Profit Sharing Task Variety Profit Sharing Gain Sharing Job Variety
Gain Sharing Time Flexibility Participative Decision Making
Plaquette Job Flexibility Quality Circles Gifts
Concerning job analysis it was found that 65.5% of the surveyed
organizations conduct job analysis as a HRM activity. The results of the job analysis
were used in personnel selection and placement activities, compensation
management, training and development, performance appraisal, promotion and
assignment, career planning, recruitment, orientation in surveyed organizations. This
finding is also consistent with findings related to HRM activities in general (e.g.,
Spector, 2003).
In addition, the present study revealed that the methods of employee
interview and observation was the first and second most widely used job analysis
data collection techniques in the participating organizations, respectively. In general,
off-the self methods of job analysis are not generally used in Turkish organizations.
In the US, however, ready- to-use techniques such as position analysis questionnaire
were commonly employed (Springer & Springer, 1990).
Furthermore, when human resource planning activity of HRM was analysed it
was found that 58.5% of the surveyed organizations planned their human resources.
The stages of HR plans conducted by the surveyed organizations were composed
mainly of determining organizational strategies and objectives, evaluation of existing
manpower, and determining the development speed of the organizations. According

133
to Jackson and Schuler (1990), the leading organizations in the US plan their human
resources in 4 phases; forecasting demand and supply of human resources,
establishing human resource objectives, designing and implementing HR programs,
and lastly monitoring and evaluating those programs. So, there appear differences
between these two countries concerning the steps involved in making HR plans.
Human resource planning was also used as a part of career management systems in
the 28% of the surveyed organizations in US. However, the practice of career
management was not widespread among the surveyed organizations in Turkey.
Lastly, the present study examined the practices of organizations in terms of
managing union relations. Managing union relations was not commonly held by the
HRM departments in the surveyed organizations. In the US, however, unions have
become weaker especially in the private sector. On the contrary, union management
relations are still among the most important HRM practices in the state-owned
organizations and foreign invested enterprises operating in China (Rowley et al.,
2004).
4.3 Conclusion
This study has been concerned with exploring the nature of the current HRM
practices in a sample of Turkish private sector organizations and comparing the
identified practices with HRM practices carried out in different countries as reported
in the relevant literature. As a result of changing business conditions, the
organizations in Turkey have lived through a transition from personnel management
to HRM since the beginning of the late 1980’s. However, HRM is relatively lately
adopted in Turkey and is still developing mostly by learning from the experiences of
other countries (Emre, 1998).
134
Concerning the general HRM practices, the results of the present study
demonstrated that some of the HR practices such as recruitment, selection, training,
performance management, and orientation are more frequently applied than practices
of job analysis, human resource planning, career planning and job design in the
surveyed organizations. Thus, it can be concluded that HRM practices that aim to
attract, select, retain and develop potential workforce are more widespread among
the surveyed organizations. It is also the case in most Western organizations.
Marriott (2001) argues that the processes of selection, recruitment, and retention
(including training and performance management.) are the most pressing challenges
facing the US business today.
The results of the present study revealed that HRM applications, which are
related to recruitment, selection, orientation, training, and performance, need to be
further improved in organizations in Turkey. For instance, concerning recruitment
process, it can be stated that the use of internet as a recruitment tool should become
widespread among Turkish organizations since it is a cost effective and fast way to
reach potential candidates (Gale, 2004). Moreover, the use of internal recruitment
should be also become more widespread among organizations operating in Turkey
since it aims to improve employee morale and also provides a shield against the
charges of unfairness and discrimination.
In terms of selection processes, the present study showed that the application
of valid selection tools such as assessment centers, work samples, personality or
cognitive ability tests are not widespread among the surveyed organizations.
However, those selection tools can be expected to be used more frequently in the
future since using only tools and techniques, such as interviews and references, that

135
are likely to be more subjective and biased would not be effective in maximizing
person-job or person-environment fit.
Next, concerning training and development issue the present study revealed
that the surveyed organizations generally determine the training needs by relying on
the reports of managers or employees. However, a healthier way to identify training
needs of employees is to conduct a systematic training need analysis. The training
programs applied based on the reported needs/demands of employees or managers
are not expected to be as effective as the ones that are applied after a comprehensive
need analysis. In conclusion, the activity of need analysis should become widespread
among organizations.
The evaluation of training is another important issue in HRM. The surveyed
organizations used criteria such as reaction (trainee evaluations) and learning (tests
applied before and after the training programs) to evaluate effectiveness of their
training programs. However, there are other criteria such as evaluating on the job
behavior of trainees (behavior criterion) and reduction in turnover, improvements in
production (results criterion). These evaluation techniques should also be employed
in order to increase the effectiveness of evaluation process.
Concerning performance appraisal process, the present study found that the
performance appraisal methods of BARS and BOS are not commonly used in the
surveyed organizations. An examination of the literature revealed that the US
(Anderson, 1996) and Netherlands (Wiersma et al., 1995) are among the countries
that use methods of BARS or BOS. Although the superiority of these systems over
simple graphic rating scales are not clearly shown (Landy & Farr, 1980),
organizations may still benefit from such techniques of assessment which involve
more clearly defined performance dimensions and scale anchors.

136
In addition to needed efforts in improving the practices of frequently applied
HRM activities, there seems to be a need to focus more on the activities that are not
practiced widely in the Turkish organizations, such job analysis, career development,
compensation management, and human resource planning. Among these activities,
job analysis deserves a special attention since it is the basis of almost all other HRM
activities. There is a need to develop job analysis systems/methods, both off-the-self
and tailor-made types. When systems of job analysis are developed fully and used
systematically and widely, since then the other HRM activities would be performed
properly.
4.3.1 Limitations and Suggestions
The present study is expected to contribute to the literature since it provides a
basis to compare HRM practices in Turkey against those in other countries.
However, there are several limitations/drawbacks of the study that needs to be
mentioned. One of these drawbacks is that the number of organizations participated
in the research was 200, so the size of the sample was not large enough to be a good
representative of the population of interest (i.e., all private sector organizations in
Turkey). Yet, it is a consolation that the sample of the present study included
organizations from a wide range of sectors.
Secondly, the data were collected via questionnaires answered by HR
professionals working in organizations. These individuals may have a tendency to
answer the questions in a more positive way. Thus, there is a probability of social
desirability problem in the given answers.
Thirdly, most of the organizations in the sample were large- or medium-sized
organizations. Thus, the results of the study may not generalize to HRM practices in
small-sized organizations in Turkey.

137
Fourthly, in this study HRM practices in different countries were examined
by reviewing the related literature. However, it would be a much better strategy to
conduct a cross-cultural comparison study, using the same data collection instrument
across different countries and collecting data from organizations that are similar to
each other in terms of size, sector, etc.
Lastly, the present study solely focused on the current practices of HRM in
the surveyed organizations but it is also important to assess the influences of HRM
practices on business performance (Roos, Femström, & Pike, 2004). The issue of
effects of HRM on business performance of organizations was beyond the aim of this
thesis yet it may be an important point to consider in future research.

138
REFERENCES
Acuner, T. (2001). İnsan kaynaklarının yetiştirilmesi, geliştirilmesi ve hizmet sektöründe bir saha araştırması. Atatürk Üniversitesi İktisadi ve İdari Bilimler Dergisi, 15, 177-190. Aghazadeh, S. (2003). The future of human resource management. Work Study, 52, 201-207. Alliger, G.M., Tannenbaum, S.I., Bennett W., Traver H. & Shotland, A. (1997). A meta- analysis of the relations among training criteria. Personnel Psychology, 50, 341-358. Altın, A. (1997). İşletmelerde insan kaynakları yönetiminin faaliyetleri, işlevleri, önemi ve organizasyondaki yeri. Unpublished master’s thesis, Celal Bayar Üniversitesi, Manisa, Turkey. Anderson, G. (1996). Performance appraisal. B. Towers (Ed.). The handbook of human resource management (196-223). Oxford: Blackwell. Arthur Andersen (2000). 2001’e doğru insan kaynakları araştırması. Sabah Yayıncılık: İstanbul. Aycan, Z. & Balcı, H. (2001). Hizmetiçi eğitimin etkililiğini yordayan bireysel ve kurumsal faktörler. Türk Psikoloji Dergisi, 16, 13-31. Aycan, Z. & Kanungo, R.N. (2000). Toplumsal kültürün kurumsal kültür ve insan kaynakları uygulamaları üzerine etkileri. Z. Aycan (Ed.). Türkiye’de Yönetim, Liderlik ve İnsan Kaynakları Uygulamaları (25- 53). Ankara: Türk Psikologlar Derneği Yayınları. Aycan, Z., Kanungo, R.N., Mendonca, M., Yu, K., Deller, J., Stahl, J., & Kurshid, A. (2000). Impact of culture on human resource management practices: A ten-country comparison. Applied Psychology: An International Review, 49, 192-220. Barbazette, J. (2004). Make new employee orientation a success. September, 14, 2004. Baron, A. & Armstrong, M. (1998). ‘Out of box’. People Management, 23, 38-41.

139
Başboğaoğlu, U. (1999). Gaziantep’ deki kamusal ve özel kesim işletmelerinde insan kaynaklarının geliştirilmesi. Verimlilik Dergisi, 1, 31-54. Beardwell, I. & Holden, L. (2001). Human resource management: A contemporary approach. Prentice Hall: New Jersey. Beaumont, P.B. (1993). Human resource management: Key concepts and skills. London: Sage Publications. Bennington, L. & Habir, A.D. (2003). Human resource management in Indonesia. Human Resource Management Review, 13, 373-392. Bormon, W.C. (1993). Expanding the criterion domain to include elements of contextual performance. N. Schmitt and W. Borman (Ed.). Personnel selection in organizations (71-98). San Francisco: Jossey-Bass. Boxall, P. & Purchell, J. (2000). Strategic human resource management: Where have we come from and where should we be going?, International Journal of Management Reviews, 2, 183-203. Brunstein, I. (1995). Human Resource Management in Western Europe. Berlin: De Gruyter. Byars, L.L., & Rue, L.W. (1991). Human resource management. USA: Von Hoffman Press. Cascio, W. F. (1995). Whither industrial and organizational psychology in a changing world of work? American Psychologist, 50, 928-939. Cengizhan, S., & Ersun, O. (2000). Büyük ölçekli işletmelerde eğitim geliştirme çalışmalarının durum saptaması. M. Ertürk (Ed.). 8. Ulusal Yönetim ve Organizasyon Kongresi: Bildiriler (731-752). Nevşehir: Erciyes Üniversitesi Yayınları. Cesare, S.J. (1996). Subjective judgment and the selection interview: A methodological review. Public Personnel Management, 25, 291-307.
140
Clark, T., & Pugh, D. (1999). Similarities and differences in European conceptions of human resource management. International Studies of Management & Organization, 29, 15-35. Cleveland, J.N., Murphy, K.R., & Williams, R.E. (1989). Multiple uses of performance appraisal: Prevalence and correlates. Journal of Applied Psychology, 74, 130-135. Dulebohn, J.H., Ferris, G.R., & Stodd, J.T. (1995). The history and evolution of human resource management. G.R. Ferris, S.D. Rosen & D.T. Barnum (Ed.). Handbook of Human Resource Management (18-40). Cambridge, MA: Blackwell. Emre, C. (1998). Cumhuriyet Döneminde Türkiye’de Bilim – Sosyal Bilimler II. Ankara: TÜBA. Erdil, O. (1998). İşgörenlerin performans yönetiminde yeni yaklaşımlar ve sanayi işletmelerinde bir uygulama. 6.Ulusal İşletmecilik Kongresi: Bildiriler (164-180). Antalya: Akdeniz Üniversitesi Yayınları. Gale, S.F. (2004). Internet recruiting: Better, cheaper, faster. Workforce Online, 05, 2003. Goss, D. (1994). Principles of HRM. New York: Rou Hedge. Gutteridge, T.G. (1986). Organizational development systems: The state of practice. D. Hall (Ed.). Career development in organizations (50-94). San Francisco: Jossey- Bass. Harvey, D., & Bowin, R. B. (1996). Human resource management: An experiential approach. New Jersey: Prentice Hall. Heneman, R.L. & Gresham, M.T. (1998). Performance-based pay plans. J.W. Smither (Ed.). Performance appraisal: State of the art in practice (496-536). San Francisco: Jossey-Bass Publishers. Hollenbeck, N., & Wright, G. (1996). Human resource management: Gaining a competitive advantage. United States: Irwin/ McGraw-Hill.

141
Human resource practices and competitive success (1994, September). Worklife Report. Howard, A. (1997). A reassessment of assessment centers: Challenges for the 21st century. Journal of Social Behavior & Personality, 12, 13-53. Huselid, M. (1995). The impact of human resource management practices on turnover, productivity, and corporate financial performance. Academy of Management Journal, 40, 171-188. Ivancevich, J.M. (1992). HRM foundations of personnel. USA: Von Hoffman Press, Inc. Jackson, S.E. & Schuler, R.S. (1990). Human resource planning: Challenges for industrial/organizational psychologists. American Psychologist, 45, 223-239. Kalleberg, A.L., & Moody, J.W. (1994). Human resource management and organizational performance. American Behavioral Scientist, 37, 948-962. Kandel, E. (2001). Flexibility versus commitment in personnel management. Journal of Japanese and International Economies, 15, 515-556. Kiriazov, D., Sullivan, S.E., & Tu, H.S. (2000). Business success in Eastern Europe: Understanding and customizing HRM. Business Horizons, 43, 89-100. Kirkpatrick, D.L. (1977). Evaluating training programs: Evidence versus proof. Training and Development Journal, 31, 9-12 Koike, K. (1997). Human resource development, Japanese Economy and Labour Series, No:2, Tokyo: Japan Institute of Labour. Landy, F.J. & Farr, J.L. (1980). Performance rating, Psychological Bulletin, 87, 72- 107. Legge, K. (1995). Human resource management: Rhetorics and realities. London: Mac-Millan Press Ltd.

142
Lessons from 100 years of compensation. (2000, March). HR Spectrum. Lowry, P. E. (1994). The structured interview: An alternative to the assessment center? Public Personnel Management, 23, 201-216. Manzolini, L. (1993). Environmental dynamics and the organizational innovation process: Implications for Human resource management in Italy. S. Tyson, P. Lawrence, P. Poirson, L. Manzolini & C.S. Vicente (Ed.). Human resource management in Europe (131-209). England: Clays Ltd. Marriott, J.W. (2001). “Our competitive strength: human capital”, Executive Speeches, April, 29, p.18 Mathis, R.L., & Jackson, J.H. (1991). Personnel/ human resource management. St. Paul: West Publishing Company. Muchinsky, P.M. (1999). Psychology applied to work. United States: Wadshworth. Murphy, K.R., & Cleveland, J.N. (1995). Understanding performance appraisal: social, organizational, and goal-based perspectives. London: Sage Publications. Ng, I. & Maki, D. (1993). Human resource management in the Canadian manufacturing sector. International Journal of Human Resource Management, 4, 897-916. Nankervis, A. & Leece, P. (1997). Performance appraisal: two steps forward, one step back. Asia-Pacific Journal of Human Resources, 35, 80-92. Ones, D.S., Viswesvaran, C., & Schmidt F.L. (1993). Comprehensive meta analysis of integrity test validation: Findings and implications for personnel selection and theories of job performance. Journal of Applied Psychology, 78, 679-703. Özçelik, A.O. (2000). İşletmelerde insan kaynaklarına ilişkin bazı kriterlere göre işe alma uygulamalarındaki farklılıklarının belirlenmesine yönelik bir araştırma. M. Ertürk (Ed.). 8. Ulusal Yönetim ve Organizasyon Kongresi: Bildiriler (801-816). Nevşehir: Erciyes Üniversitesi Yayınları

143
Öztürk, Z. (1995). İşletmelerde personel seçme yöntemleri. Verimlilik Dergisi, 2, 41-59. Poole, M. (1990).Editorial: HRM in an international perspective. International Journal of Human Resource Management, 1, 1-15. Reshef, Y. (1990). Union decline: A view from Canada. Journal of Labor Research, 11, 25- 39. Retaining workers is key to profits. (1999, April). USA Today Magazine. Riggio, E.R.. (2003). Introduction to industrial/organizational psychology. Prentice Hall: New Jersey Rogg, K.L., Schmidt, D.B., Shull, C., & Schmitt, N. (2001). Human resource practices, organizational climate, and customer satisfaction. Journal of Management, 27, 431-449. Ross, G., Femström, L., & Pike, S. (2004). Human resource management and business performance. Measuring Business Excellence, 8, 28-37. Rowley, C., Benson, J., & Warner, M. (2004). Towards an Asian model of human resource management? A comparative analysis of China, Japan and South Korea. International Journal of Human Resource Management, 15, 917-933. Salas, E. & Cannon-Bowers, J.A. (2001). The science of training: A decade of progress. Annual Review of Psychology, 52, 471-499. Schmidt, F., & Hunter, J. (1998). The validity and utility of selection methods in personnel psychology: Practical and theoretical implications of 85 years of research findings. Psychological Bulletin, 124, 262-274. Schmitt N., Gooding R.Z., Noe, R. A., & Kirsch, M. (1984). Meta-analysis of validity studies published between 1964 and 1982 and the investigation of study characteristics. Personnel Psychology, 1, 89-92

144
Scholarios, D. & Lockyer, C. (1996). Human resource management and selection: Beter solutions or new dilemmas. B. Towers (Ed.). The handbook of human resource management (173-195). Oxford: Blackwell. Schuler, R.S. (1995). Managing human resources. St Paul: West Publishing Company. Selden, S.C., Ingraham, P.W., & Jacobson, W. (2001). Human resource practices in state government: Findings from a national survey. Public Administration Review, 62, 598-607. Selmer, J. (2001). Human Resource Management in Japan: Adjustment or transformation? International Journal of Manpower, 22, 235-243. Sisson, K. (1990). Introducing the human resource management journal. Human Resource Management Journal, 1, 1-11. Soysal, A. (2000). Örgütlerde kariyer planlama sürecinin işlemesinde motivasyon faktörünün etkisi: Kahramanmaraş özel işletmelerinde yapılan bir uygulama. M. Ertürk (Ed.). 8. Ulusal Yönetim ve Organizasyon Kongresi: Bildiriler (787-800). Nevşehir: Erciyes Üniversitesi Yayınları. Spector, P.E. (2003). Industrial and organizational psychology: Research and practice. John Wiley & Sons: New York. Springer, B. & Springer S. (1990). Human resource management in the U.S.-Celebration of its centenary. R. Pieper (Ed.). Human resource management: An international comparison (41-57). New York: Walter de Gruyter. Strauss, G. (1996). Human relations in the USA. Towers B. (Ed.). The handbook of human resource management (26-49). Oxford: Blackwell. Sümer, H.C. (1998). İnsan kaynakları yönetimi etkinliği olarak örgütsel kariyer planlama ve geliştirme. Türk Psikoloji Bülteni, 9, 62-65. Sümer, H.C., Çifci, O.S., Demiroğlu, K., & Sümer, N. (2000). Subay kişilik özelliklerinin ölçülmesi ve yapı geçerliliği çalışması. Türk Psikoloji Dergisi, 15, 15-36.

145
Sümer, H.C. (2000). Performans değerlendirmesine tarihsel bir bakış ve kültürel bir yaklaşım. Z. Aycan (Ed.). Türkiye’de Yönetim, Liderlik ve İnsan Kaynakları Uygulamaları (57-90). Ankara: Türk Psikologlar Derneği Yayınları. Takeuchi, N. (1990). Comparative competitive aspects of Japenese use of human resource vis-a-vis United States and Canada. United States Law Journal, 16, 46-62. Ulrich, D. (1998). “A new mandate or human resources”. Harvard Business Review, 76, 124-134. Üsdiken, B. (1996). Importing theories of management and organization. International Studies of Management and Organization, 26, 33-46. Uyargil, C., & Dündar, G. (2000). İşletmelerde insan kaynakları fonksiyonunun stratejik niteliğinin belirlenmesine yönelik bir araştırma. M. Ertürk (Ed.). 8. Ulusal Yönetim ve Organizasyon Kongresi: Bildiriler (675- 688). Nevşehir: Erciyes Üniversitesi Yayınları. Wager, T.H. (1998).Determinants of human resource management practices in small firms: Some evidence from Atlantic Canada. Journal of Small Business Management, 36, 15- 31. Whitener, E.M. (1997). The impact of human resource activities on employee trust. Human Resource Management Review, 7, 389-404. Wiersma, U.J., Van den Berg, P.T., & Latham, G.P. (1995). Dutch reactions to behavioral observation, behavioral expectation, and trait scales. Group and Organization Management, 20, 297-309. Wiersma, U.J. & Van den Berg, P.T. (1999). Influences and trends in human resource practices in the Netherlands. Employee Relations, 21, 187-202. Zhu, Y. (2004). Responding to the challenges of globalization: Human resource development in Japan. Journal of World Business, 39, 337-348

146
APPENDICES
APPENDIX A
ANKET
FİRMA BİLGİLERİ 1. Çalışmakta olduğunuz firmanın adı nedir? (⋅⋅⋅⋅⋅⋅⋅⋅⋅⋅⋅⋅⋅⋅⋅⋅⋅⋅⋅⋅⋅⋅⋅⋅⋅⋅⋅⋅⋅⋅⋅⋅⋅⋅⋅⋅⋅⋅⋅⋅⋅⋅⋅⋅⋅⋅⋅⋅⋅⋅⋅⋅⋅⋅⋅⋅⋅⋅⋅⋅⋅⋅⋅⋅⋅⋅⋅⋅⋅⋅⋅⋅⋅⋅⋅⋅⋅⋅⋅⋅⋅⋅⋅⋅) 2. Firmanız hangi sektörde yer almaktadır?
Finans Teknoloji Hızlı Tüketim Malları İnşaat ve Malzeme Sağlık ve İlaç Medya
Otomotiv Tekstil Metal Dayanıklı Tüketim Malları
Diğer (⋅⋅⋅⋅⋅⋅⋅⋅⋅⋅⋅⋅⋅⋅⋅⋅⋅⋅⋅⋅⋅⋅⋅⋅⋅⋅⋅⋅⋅⋅⋅⋅⋅⋅⋅⋅⋅⋅⋅⋅⋅⋅⋅⋅⋅⋅⋅) 3. Firmanız kaç yıllık bir kuruluştur? (⋅⋅⋅⋅⋅⋅⋅⋅⋅⋅⋅⋅⋅⋅⋅⋅⋅⋅⋅⋅⋅⋅⋅⋅⋅⋅⋅⋅⋅⋅⋅⋅⋅⋅⋅⋅⋅⋅⋅⋅⋅⋅⋅⋅⋅⋅⋅) 4. Firmanız bünyesinde toplam kaç kişi çalışmaktadır? (⋅⋅⋅⋅⋅⋅⋅⋅⋅⋅⋅⋅⋅⋅⋅⋅⋅⋅⋅⋅⋅⋅⋅⋅⋅⋅⋅⋅⋅⋅⋅⋅⋅⋅⋅⋅⋅⋅⋅⋅⋅⋅⋅⋅⋅) İNSAN KAYNAKLARI YÖNETİMİ DEPARTMANI 5. Firmanızda İnsan Kaynakları Yönetimine ilişkin faaliyetleri yürüten bölümünüzün adı nedir?
İnsan Kaynakları Yönetimi Departmanı Personel Departmanı Personel ve İdari İşler Departmanı İdari İşler Departmanı Diğer (⋅⋅⋅⋅⋅⋅⋅⋅⋅⋅⋅⋅⋅⋅⋅⋅⋅⋅⋅⋅⋅⋅⋅⋅⋅⋅⋅⋅⋅⋅⋅⋅⋅⋅⋅⋅⋅⋅⋅⋅⋅⋅⋅⋅⋅⋅⋅)

147
Not: Aşağıdaki sorularda bu bölümden İnsan Kaynakları Yönetimi Departmanı olarak bahsedilecektir. 6. Firmanızda İnsan Kaynakları Yönetimi Departmanı aşağıdaki alanların hangilerinden sorumludur? Sorumlu olunan tüm seçenekleri işaretleyiniz.
İş analizi İş tasarımı Başvuru sağlama İşe alma ve yerleştirme İşe alıştırma (oryantasyon) Eğitim ve geliştirme Performans değerlendirme Kariyer planlama İnsangücü planlaması Ücretlendirme ve ek kazançlar Bordro Servis Yemek Personel ve özlük işlemleri İş güvenliği ve sağlık Endüstriyel ilişkiler Diğer (⋅⋅⋅⋅⋅⋅⋅⋅⋅⋅⋅⋅⋅⋅⋅⋅⋅⋅⋅⋅⋅⋅⋅⋅⋅⋅⋅⋅⋅⋅⋅⋅⋅⋅⋅⋅⋅⋅⋅⋅⋅⋅⋅⋅⋅⋅⋅⋅⋅⋅⋅⋅⋅⋅⋅⋅⋅⋅⋅⋅⋅⋅⋅⋅⋅⋅⋅⋅⋅⋅⋅⋅⋅⋅⋅⋅⋅⋅⋅⋅⋅⋅⋅)
7. İnsan Kaynakları Yönetimi Depatmanında çalışan sayısı kaçtır? (İdari İşler’in bu departmana dahil olması durumunda lütfen sadece İnsan Kaynakları Yönetimi ile ilgili olarak çalışan personel sayısını belirtiniz) ................................................. 8. İnsan Kaynakları Yönetimi hiyerarşisinde kaç düzey vardır?(Örn; müdür, müdür yardımcısı, vb.) (...........................................) 9. Firmanızda İnsan Kaynakları Yönetiminden birinci derecede sorumlu olan kişinin unvanı nedir?
Genel Müdür Yardımcısı İnsan Kaynakları Koordinatörü İnsan Kaynakları Direktörü İnsan Kaynakları Müdürü Diğer (⋅⋅⋅⋅⋅⋅⋅⋅⋅⋅⋅⋅⋅⋅⋅⋅⋅⋅⋅⋅⋅⋅⋅⋅⋅⋅⋅⋅⋅⋅⋅⋅⋅⋅⋅⋅⋅⋅⋅⋅⋅⋅⋅⋅⋅⋅⋅⋅⋅⋅⋅⋅⋅⋅⋅⋅⋅⋅⋅⋅⋅⋅⋅⋅⋅⋅⋅⋅⋅⋅⋅⋅⋅⋅⋅⋅⋅⋅⋅⋅⋅⋅⋅)
10. Firmanızda İnsan Kaynakları Yönetimi Departmanında en üst düzeyde olan kişinin eğitim durumu nedir?
Lise Lisans Bölüm: (⋅⋅⋅⋅⋅⋅⋅⋅⋅⋅⋅⋅⋅⋅⋅⋅⋅⋅⋅⋅⋅⋅⋅⋅⋅⋅⋅⋅⋅⋅⋅⋅⋅⋅⋅⋅⋅⋅⋅⋅⋅⋅⋅⋅⋅⋅⋅⋅⋅⋅⋅⋅⋅⋅⋅) Yüksek lisans Alan: (⋅⋅⋅⋅⋅⋅⋅⋅⋅⋅⋅⋅⋅⋅⋅⋅⋅⋅⋅⋅⋅⋅⋅⋅⋅⋅⋅⋅⋅⋅⋅⋅⋅⋅⋅⋅⋅⋅⋅⋅⋅⋅⋅⋅⋅⋅⋅⋅⋅⋅⋅⋅⋅⋅⋅) Doktora Alan: (⋅⋅⋅⋅⋅⋅⋅⋅⋅⋅⋅⋅⋅⋅⋅⋅⋅⋅⋅⋅⋅⋅⋅⋅⋅⋅⋅⋅⋅⋅⋅⋅⋅⋅⋅⋅⋅⋅⋅⋅⋅⋅⋅⋅⋅⋅⋅⋅⋅⋅⋅⋅⋅⋅⋅)
11. Firmanızda İnsan Kaynakları Yönetimi Departmanında en üst düzeyde olan kişinin yaşı kaçtır?
25-30 31-39

148
40- 49 50-59 60- 69 70 yaş ve üstü
12. Firmanızda İnsan Kaynakları Yönetimi Departmanında en üst düzeyde olan kişinin cinsiyeti nedir?
Kadın Erkek
13. Firmanızda İnsan Kaynakları Yönetimi Departmanında en üst düzeyde olan kişinin İnsan Kaynakları Yönetimi alanındaki deneyim süresi nedir?
(⋅⋅⋅⋅⋅⋅⋅⋅⋅⋅⋅⋅⋅⋅⋅⋅⋅⋅⋅⋅⋅⋅⋅⋅⋅⋅⋅⋅⋅⋅⋅⋅⋅⋅⋅⋅⋅⋅⋅⋅⋅⋅⋅⋅⋅⋅⋅⋅⋅⋅⋅⋅⋅⋅⋅⋅⋅⋅⋅⋅⋅⋅⋅⋅⋅⋅⋅⋅⋅⋅⋅⋅⋅⋅⋅⋅⋅⋅⋅⋅⋅⋅⋅) 14. İnsan Kaynakları Yönetimi Departmanında en üst düzeyde olan kişi kime bağlı olarak çalışmaktadır?
Genel Müdür Mali ve İdari İşlerden Sorumlu Genel Müdür Yardımcısı Diğer (⋅⋅⋅⋅⋅⋅⋅⋅⋅⋅⋅⋅⋅⋅⋅⋅⋅⋅⋅⋅⋅⋅⋅⋅⋅⋅⋅⋅⋅⋅⋅⋅⋅⋅⋅⋅⋅⋅⋅⋅⋅⋅⋅⋅⋅⋅⋅⋅⋅⋅⋅⋅⋅⋅⋅⋅⋅⋅⋅⋅⋅⋅⋅⋅⋅⋅⋅⋅⋅⋅⋅⋅⋅⋅⋅⋅⋅⋅⋅⋅⋅⋅⋅)
İŞ ANALİZİ ve İŞ TASARIMI 15. Firmanızda iş analizi yapılıyor mu?
Evet Hayır
16. Firmanızda yapılan iş analizi kim/kimler tarafından yürütülüyor?
İnsan Kaynakları Yönetimi Departmanı Danışmanlık şirketleri Diğer (⋅⋅⋅⋅⋅⋅⋅⋅⋅⋅⋅⋅⋅⋅⋅⋅⋅⋅⋅⋅⋅⋅⋅⋅⋅⋅⋅⋅⋅⋅⋅⋅⋅⋅⋅⋅⋅⋅⋅⋅⋅⋅⋅⋅⋅⋅⋅⋅⋅⋅⋅⋅⋅⋅⋅⋅⋅⋅⋅⋅⋅⋅⋅⋅⋅⋅⋅⋅⋅⋅⋅⋅⋅⋅⋅⋅⋅⋅⋅⋅⋅⋅⋅)
17. Firmanızda iş analizi hangi sıklıkta yapılmaktadır?
Her yıl 2-3 yılda bir 4-5 yılda bir Diğer (⋅⋅⋅⋅⋅⋅⋅⋅⋅⋅⋅⋅⋅⋅⋅⋅⋅⋅⋅⋅⋅⋅⋅⋅⋅⋅⋅⋅⋅⋅⋅⋅⋅⋅⋅⋅⋅⋅⋅⋅⋅⋅⋅⋅⋅⋅⋅⋅⋅⋅⋅⋅⋅⋅⋅⋅⋅⋅⋅⋅⋅⋅⋅⋅⋅⋅⋅⋅⋅⋅⋅⋅⋅⋅⋅⋅⋅⋅⋅⋅⋅⋅⋅)
18. Firmanızda uygulanan iş analizi sonuçları aşağıdaki alanlardan hangisi/hangilerinde kullanılıyor? Uygun olan tüm seçenekleri işaretleyiniz.
İş tasarımı Başvuru sağlama İşe alma ve yerleştirme İşe alıştırma (Oryantasyon) Eğitim ve geliştirme Kariyer planlaması Performans değerlendirme/ yönetimi Ücretlendirme Endüstriyel ilişkiler Terfi ve atamalar

149
Diğer (⋅⋅⋅⋅⋅⋅⋅⋅⋅⋅⋅⋅⋅⋅⋅⋅⋅⋅⋅⋅⋅⋅⋅⋅⋅⋅⋅⋅⋅⋅⋅⋅⋅⋅⋅⋅⋅⋅⋅⋅⋅⋅⋅⋅⋅⋅⋅⋅⋅⋅⋅⋅⋅⋅⋅⋅⋅⋅⋅⋅⋅⋅⋅⋅⋅⋅⋅⋅⋅⋅⋅⋅⋅⋅⋅⋅⋅⋅⋅⋅⋅⋅⋅) 19. İş analizi yaparken kullandığınız bilgi toplama yöntemleri nelerdir? Uygun olan tüm seçenekleri işaretleyiniz.
Gözlem Çalışanlarla görüşme Anketler Konuyla ilgili uzman grupları Standart iş analizi formu Diğer (⋅⋅⋅⋅⋅⋅⋅⋅⋅⋅⋅⋅⋅⋅⋅⋅⋅⋅⋅⋅⋅⋅⋅⋅⋅⋅⋅⋅⋅⋅⋅⋅⋅⋅⋅⋅⋅⋅⋅⋅⋅⋅⋅⋅⋅⋅⋅⋅⋅⋅⋅⋅⋅⋅⋅⋅⋅⋅⋅⋅⋅⋅⋅⋅⋅⋅⋅⋅⋅⋅⋅⋅⋅⋅⋅⋅⋅⋅⋅⋅⋅⋅⋅)
BAŞVURU SAĞLAMA 20. Firmanızda aşağıdaki başvuru sağlama yöntemlerinden hangisi/ hangileri kullanılmaktadır? Uygun olan tüm seçenekleri işaretleyiniz.
Yöneticiler Yönetici olmayanlar için için
Gazete ilanları Danışmanlık firmaları Internet Profesyonel dergiler Üniversitelerin kariyer merkezleri Çalışanların tavsiyesi Tanıdık vasıtasıyla Kendiliğinden Başvuru Diğer (⋅⋅⋅⋅⋅⋅⋅⋅⋅⋅⋅⋅⋅⋅⋅⋅⋅⋅⋅⋅⋅⋅⋅⋅⋅⋅) (⋅⋅⋅⋅⋅⋅⋅⋅⋅⋅⋅⋅⋅⋅⋅⋅⋅⋅⋅⋅⋅⋅⋅⋅⋅⋅)
21. Firmanızda kullanılan yöntemlerden en etkili olduğunu/olduklarını düşündüklerinizi işaretleyiniz. Uygun olan tüm seçenekleri işaretleyiniz.
Yöneticiler Yönetici olmayanlar için için
Gazete ilanları Danışmanlık firmaları Internet Profesyonel dergiler Üniversitelerin kariyer merkezleri Çalışanların tavsiyesi Tanıdık vasıtasıyla Kendiliğinden Başvuru Diğer (⋅⋅⋅⋅⋅⋅⋅⋅⋅⋅⋅⋅⋅⋅⋅⋅⋅⋅⋅⋅⋅⋅⋅⋅⋅⋅) (⋅⋅⋅⋅⋅⋅⋅⋅⋅⋅⋅⋅⋅⋅⋅⋅⋅⋅⋅⋅⋅⋅⋅⋅⋅⋅)
22. Boşalan pozisyonları firmanızda çalışan mevcut personele bildiriyor musunuz?
Evet Hayır
23. Boşalan pozisyonları hangi yöntemle/ yöntemlerle çalışanlarınıza bildirirsiniz? Uygun olan tüm seçenekleri işaretleyiniz. İş yerindeki panolara ilan asma Organizasyon içi internet ağı
150
Firma dergisi Diğer (⋅⋅⋅⋅⋅⋅⋅⋅⋅⋅⋅⋅⋅⋅⋅⋅⋅⋅⋅⋅⋅⋅⋅⋅⋅⋅⋅⋅⋅⋅⋅⋅⋅⋅⋅⋅⋅⋅⋅⋅⋅) 24. Yapılandırılmış bir “Firma Tanıtım Paketi” (sunum, video kaseti, broşür, vs) var mı?
Evet Hayır
ELEMAN SEÇME 25. Firmanızda kadro planlaması yapılıyor mu? Evet
Hayır 26. Yapılıyorsa bu plan uygulanabiliyor mu?
Uygulanıyor Kısmen Uygulanıyor Uygulanamıyor
27. Bu plan ne uzunlukta bir süreyi kapsamaktadır? 1 yıldan az 1-3 yıl 4-5 yıl 5 yıldan fazla 28. Firmanızda yapılandırılmış bir eleman seçme sistemi ( başvuru yapan kişilerin/adayların hangi aşamalardan hangi sırada geçeceklerinin önceden belirlendiği bir süreç) var mı?
Evet Kısmen Hayır
29. Aşağıdaki personel seçimi metodlarından hangisi/ hangileri firmanızda uygulanmaktadır? Uygun olan tüm seçenekleri işaretleyiniz. Yöneticiler Yönetici olmayanlar için için
Mülakat Yetenek testleri Zeka testleri Mekanik beceri testleri Kişilik ve ilgi envanterleri Mesleki testler Değerlendirme merkezi Biyografik bilgiler Referanslar Dürüstlük testleri Diğer (⋅⋅⋅⋅⋅⋅⋅⋅⋅⋅⋅⋅⋅⋅⋅⋅⋅⋅⋅⋅⋅⋅⋅⋅⋅⋅⋅⋅⋅⋅⋅⋅⋅⋅⋅⋅⋅⋅⋅⋅⋅⋅⋅⋅⋅⋅⋅⋅⋅⋅⋅⋅⋅⋅⋅⋅⋅⋅⋅⋅)

151
30. Firmanızda kullanılan yöntemlerden en etkili olduğunu/olduklarını düşündüklerinizi işaretleyiniz. Uygun olan tüm seçenekleri işaretleyiniz. Yöneticiler Yönetici olmayanlar için için
Mülakat Yetenek testleri Zeka testleri Mekanik beceri testleri Kişilik ve ilgi envanterleri Mesleki testler Değerlendirme merkezi Biyografik bilgiler Referanslar Dürüstlük testleri Diğer (⋅⋅⋅⋅⋅⋅⋅⋅⋅⋅⋅⋅⋅⋅⋅⋅⋅⋅⋅⋅⋅⋅⋅⋅⋅⋅⋅⋅⋅⋅⋅⋅⋅⋅⋅⋅⋅⋅⋅⋅⋅⋅⋅⋅⋅⋅⋅⋅⋅⋅⋅⋅⋅⋅⋅⋅⋅⋅⋅⋅)
31. Aşağıdaki görüşme (mülakat) tekniklerinden hangisini/ hangilerini kullanıyorsunuz? Uygun olan tüm seçenekleri işaretleyiniz.
Birebir görüşme (bir görüşmeci, bir aday) Panel görüşme ( bir aday, birkaç görüşmeci) Grup görüşme ( bir görüşmeci, birkaç aday) Yapılandırılmış görüşme Yapılandırılmamış görüşme Yarı yapılandırılmış görüşme Diğer (⋅⋅⋅⋅⋅⋅⋅⋅⋅⋅⋅⋅⋅⋅⋅⋅⋅⋅⋅⋅⋅⋅⋅⋅⋅⋅⋅⋅⋅⋅⋅⋅⋅⋅⋅⋅⋅⋅⋅⋅⋅⋅⋅⋅⋅⋅⋅⋅⋅⋅⋅⋅⋅⋅⋅⋅⋅⋅⋅⋅⋅⋅⋅⋅⋅⋅⋅⋅⋅⋅⋅⋅⋅⋅⋅⋅⋅⋅⋅⋅⋅⋅⋅)
31.b Mülakat sırasında bir puanlama yapılıyor mu?
Evet Hayır
ORYANTASYON 32. Firmanızda, işe yeni başlayanlar için standart bir işe alıştırma (oryantasyon) programı var mı?
Evet Hayır
33. İşe alıştırma programının süresi nedir? (⋅⋅⋅⋅⋅⋅⋅⋅⋅⋅⋅⋅⋅⋅⋅⋅⋅⋅⋅⋅⋅⋅⋅⋅⋅⋅) 34. İşe alıştırma programı aşağıdaki yöntemlerden hangisini/ hangilerini içermektedir? Uygun olan tüm seçenekleri işaretleyiniz.
Firmayı tanıtan yayınlar (broşür, elkitabı vb.) Konferanslar, açık oturumlar, grup toplantıları Görsel teknikler (video, slayt vb.) Firma içi geziler İlk amir, uzmanlar veya kıdemli bir işgören tarafından yürütülen işe
alıştırma Diğer (⋅⋅⋅⋅⋅⋅⋅⋅⋅⋅⋅⋅⋅⋅⋅⋅⋅⋅⋅⋅⋅⋅⋅⋅⋅⋅⋅⋅⋅⋅⋅⋅⋅⋅⋅⋅⋅⋅⋅⋅⋅⋅⋅⋅⋅⋅⋅⋅⋅⋅⋅⋅⋅⋅⋅⋅⋅⋅⋅⋅⋅⋅⋅⋅⋅⋅⋅⋅⋅⋅⋅⋅⋅⋅⋅⋅⋅⋅⋅⋅⋅⋅⋅⋅⋅⋅⋅⋅⋅⋅⋅⋅⋅⋅⋅⋅)

152
35. İşe alıştırma programı aşağıdaki kademelerden hangisine/ hangilerine uygulanmaktadır? Uygun olan tüm seçenekleri işaretleyiniz.
İlk kademe yöneticiler Orta kademe yöneticiler Üst kademe yöneticiler Yönetici olmayan personel Mavi yakalı Yönetici adayları Diğer (⋅⋅⋅⋅⋅⋅⋅⋅⋅⋅⋅⋅⋅⋅⋅⋅⋅⋅⋅⋅⋅⋅⋅⋅⋅⋅⋅⋅⋅⋅⋅⋅⋅⋅⋅⋅⋅⋅⋅⋅⋅⋅⋅⋅⋅⋅⋅⋅⋅⋅⋅⋅⋅⋅⋅⋅⋅⋅⋅⋅⋅⋅)
36. Firmanızda deneme süresi uygulaması var mı? Varsa bu süre ne kadardır yazınız.
Evet (⋅⋅⋅⋅⋅⋅⋅⋅⋅⋅⋅⋅⋅⋅⋅⋅⋅⋅⋅⋅⋅⋅⋅⋅⋅⋅⋅⋅⋅⋅⋅⋅⋅⋅⋅⋅⋅⋅⋅⋅⋅⋅⋅⋅⋅⋅⋅⋅⋅⋅⋅⋅⋅⋅⋅⋅⋅⋅⋅⋅⋅⋅) Hayır
37. Firmanızda, işe alıştırma programının yürütülmesinden kim/kimler sorumludur? Uygun olan tüm seçenekleri işaretleyiniz.
İnsan Kaynakları Yönetimi Bölümü Yeni iş görenleri doğrudan yönetecek amirlere Diğer (⋅⋅⋅⋅⋅⋅⋅⋅⋅⋅⋅⋅⋅⋅⋅⋅⋅⋅⋅⋅⋅⋅⋅⋅⋅⋅⋅⋅⋅⋅⋅⋅⋅⋅⋅⋅⋅⋅⋅⋅⋅⋅⋅⋅⋅⋅⋅⋅⋅⋅⋅⋅⋅⋅⋅⋅⋅⋅⋅⋅⋅⋅)
EĞİTİM VE GELİŞTİRME 38. Firmanızda bir eğitim departmanı var mı?
Evet Hayır
39. Eğitim departmanı hangi bölüme bağlıdır ve departmanda kaç kişi çalışmaktadır?
(⋅⋅⋅⋅⋅⋅⋅⋅⋅⋅⋅⋅⋅⋅⋅⋅⋅⋅⋅⋅⋅⋅⋅⋅⋅⋅⋅⋅⋅⋅⋅⋅⋅⋅⋅⋅⋅⋅⋅⋅⋅⋅⋅⋅⋅⋅⋅⋅⋅⋅⋅⋅⋅⋅⋅⋅⋅⋅⋅⋅⋅⋅⋅⋅⋅⋅⋅⋅⋅⋅⋅⋅⋅⋅⋅⋅⋅⋅⋅⋅⋅⋅⋅⋅⋅⋅⋅⋅⋅⋅⋅⋅⋅⋅⋅⋅⋅⋅⋅⋅⋅⋅⋅⋅⋅⋅⋅) 40. Firmanızdaki eğitim faaliyetleriyle ilgili olarak;
Tüm eğitim faaliyetleri işletme içi kariyer planları doğrultusunda aynı departman tarafından planlanmakta ve yürütülmektedir. Lütfen departmanın adını belirtiniz (⋅⋅⋅⋅⋅⋅⋅⋅⋅⋅⋅⋅⋅⋅⋅⋅⋅⋅⋅⋅⋅⋅⋅⋅⋅⋅⋅⋅⋅⋅⋅⋅⋅⋅⋅⋅⋅⋅⋅⋅⋅⋅⋅⋅⋅⋅⋅⋅⋅⋅⋅⋅⋅⋅)
İşle ilgili ihtiyaçlar doğrultusunda departmanlar tarafından bağımsız olarak planlanmakta ve yürütülmektedir
Çalışanlar, ihtiyaçları doğrultusunda yöneticilerinin onayı ile eğitim almaktadırlar.
Diğer (⋅⋅⋅⋅⋅⋅⋅⋅⋅⋅⋅⋅⋅⋅⋅⋅⋅⋅⋅⋅⋅⋅⋅⋅⋅⋅⋅⋅⋅⋅⋅⋅⋅⋅⋅⋅⋅⋅⋅⋅⋅⋅⋅⋅⋅⋅⋅⋅⋅⋅⋅⋅⋅⋅⋅⋅⋅⋅⋅⋅⋅⋅⋅⋅⋅⋅⋅⋅⋅⋅⋅⋅⋅⋅⋅⋅⋅⋅⋅⋅⋅⋅⋅⋅⋅⋅⋅⋅⋅⋅⋅⋅⋅⋅⋅⋅⋅⋅⋅⋅⋅⋅⋅⋅⋅⋅⋅) 41. Firmanızda aşağıdaki eğitim metodlarından hangisi/ hangileri kullanılmaktadır? Uygun olan tüm seçenekleri işaretleyiniz.
Sınıf içi eğitimler İşbaşı eğitimler Bilgisayar destekli programlar Sesli- görüntülü eğitimler ( video, slayt vb.) Simülatörler Rol oynama Oyunlar

153
Diğer (⋅⋅⋅⋅⋅⋅⋅⋅⋅⋅⋅⋅⋅⋅⋅⋅⋅⋅⋅⋅⋅⋅⋅⋅⋅⋅⋅⋅⋅⋅⋅⋅⋅⋅⋅⋅⋅⋅⋅⋅⋅⋅⋅⋅⋅⋅⋅⋅⋅⋅⋅⋅⋅⋅⋅⋅⋅⋅⋅⋅⋅⋅⋅⋅⋅⋅⋅⋅⋅⋅⋅⋅⋅⋅⋅⋅⋅⋅⋅⋅⋅⋅⋅⋅⋅⋅⋅⋅)
42. Firmanızda en çok hangi kademede çalışanlara eğitim verilmektedir? Uygun olan tüm seçenekleri işaretleyiniz.
İlk kademe yöneticiler Orta kademe yöneticiler Üst kademe yöneticiler Yönetici olmayan personel Mavi yakalı peronel Yönetici adayları Diğer (⋅⋅⋅⋅⋅⋅⋅⋅⋅⋅⋅⋅⋅⋅⋅⋅⋅⋅⋅⋅⋅⋅⋅⋅⋅⋅⋅⋅⋅⋅⋅⋅⋅⋅⋅⋅⋅⋅⋅⋅⋅⋅⋅⋅⋅⋅⋅⋅⋅⋅⋅⋅⋅⋅⋅⋅⋅⋅⋅⋅⋅⋅⋅⋅⋅⋅⋅⋅⋅⋅⋅⋅⋅⋅⋅⋅⋅⋅⋅⋅⋅⋅⋅⋅)
43. Çalışanlara verilecek eğitim programları belirlenirken aşağıdaki yöntemlerden hangisini/hangilerini kullanıyorsunuz? Uygun olan tüm seçenekleri işaretleyiniz.
Personel tarafından iletilen talepler Yöneticilerin astları için belirlediği eğitimler Unvanlar bazında alınması gereken eğitimler (Terfi öncesi ve sonrasında) Performans Değerlendirme sonuçlarına göre belirlenen eğitimler Danışmanlık şirketleri tarafından sunulan eğitimlerden seçerek İnsan Kaynakları Yönetimi Departmanı tarafından yapılan ihtiyaç analizi
sonuçlarını dikkate alarak Danışmanlık şirketlerine yaptırılan ihtiyaç analizi sonuçlarını dikkate
alarak Diğer (⋅⋅⋅⋅⋅⋅⋅⋅⋅⋅⋅⋅⋅⋅⋅⋅⋅⋅⋅⋅⋅⋅⋅⋅⋅⋅⋅⋅⋅⋅⋅⋅⋅⋅⋅⋅⋅⋅⋅⋅⋅⋅⋅⋅⋅⋅⋅⋅⋅⋅⋅⋅⋅⋅⋅⋅⋅⋅⋅⋅⋅⋅⋅⋅⋅⋅⋅⋅⋅⋅⋅⋅⋅⋅⋅⋅⋅⋅⋅⋅⋅⋅⋅⋅)
44. Firmanızda eğitim ihtiyaçlarının belirlenmesinde aşağıdaki yöntemlerden hangisi/ hangileri kullanılmaktadır? Uygun olan tüm seçenekleri işaretleyiniz.
Anketler Yüz yüze derinlemesine görüşme Performans değerlendirme sonuçları Değerlendirme merkezi Diğer (⋅⋅⋅⋅⋅⋅⋅⋅⋅⋅⋅⋅⋅⋅⋅⋅⋅⋅⋅⋅⋅⋅⋅⋅⋅⋅⋅⋅⋅⋅⋅⋅⋅⋅⋅⋅⋅⋅⋅⋅⋅⋅⋅⋅⋅⋅⋅⋅⋅⋅⋅⋅⋅⋅⋅⋅⋅⋅⋅⋅⋅⋅⋅⋅⋅⋅⋅⋅⋅⋅⋅⋅⋅⋅⋅⋅⋅⋅⋅⋅⋅⋅⋅⋅)
45. Firmanızda sunulan eğitimleri kim/kimler veriyor? Uygun olan tüm seçenekleri işaretleyiniz.
Firmanızda çalışan profesyonel eğitimciler Firma içinde konusunda uzman olan yöneticiler Firma dışından gelen eğitimciler Eğitim danışmanlığı şirketleri eğitimcileri Diğer (⋅⋅⋅⋅⋅⋅⋅⋅⋅⋅⋅⋅⋅⋅⋅⋅⋅⋅⋅⋅⋅⋅⋅⋅⋅⋅⋅⋅⋅⋅⋅⋅⋅⋅⋅⋅⋅⋅⋅⋅⋅⋅⋅⋅⋅⋅⋅⋅⋅⋅⋅⋅⋅⋅⋅⋅⋅⋅⋅⋅⋅⋅⋅⋅⋅⋅⋅⋅⋅⋅⋅⋅⋅⋅⋅⋅⋅⋅⋅⋅⋅⋅⋅⋅)
46. Firmanızda verilen eğitimler değerlendirilirken aşağıdaki yöntemlerden hangisi/hangileri kullanılmaktadır? Uygun olan tüm seçenekleri işaretleyiniz.
Eğitim öncesi ve sonrası uygulanan testler Eğitim sonunda uygulanan katılımcı değerlendirmeleri Eğitimci görüşleri özeti Eğitim danışmanlığını veren firma tarafından hazırlanan değerlendirmeler Performans değerlendirmeleri ile davranış değişikliğinin ölçümü

154
Eğitimin iş sonuçlarına etkisinin veya yatırımın geri dönüş oranının ölçümü
Değerlendirme yapılmıyor Diğer (⋅⋅⋅⋅⋅⋅⋅⋅⋅⋅⋅⋅⋅⋅⋅⋅⋅⋅⋅⋅⋅⋅⋅⋅⋅⋅⋅⋅⋅⋅⋅⋅⋅⋅⋅⋅⋅⋅⋅⋅⋅⋅⋅⋅⋅⋅⋅⋅⋅⋅⋅⋅⋅⋅⋅⋅⋅⋅⋅⋅⋅⋅⋅⋅⋅⋅⋅⋅⋅⋅⋅⋅⋅⋅⋅⋅⋅⋅⋅⋅⋅⋅⋅⋅)
47. Kişi başına düşen yıllık eğitim saati nedir? Mavi yakalı personel (⋅⋅⋅⋅⋅⋅⋅⋅⋅⋅⋅⋅⋅⋅⋅⋅⋅⋅⋅⋅⋅⋅⋅⋅⋅⋅⋅⋅⋅⋅⋅⋅⋅⋅⋅⋅⋅⋅⋅⋅⋅⋅⋅⋅⋅⋅⋅⋅⋅⋅⋅⋅⋅⋅⋅⋅⋅⋅⋅⋅⋅⋅⋅⋅⋅⋅⋅) Beyaz yakalı personel (⋅⋅⋅⋅⋅⋅⋅⋅⋅⋅⋅⋅⋅⋅⋅⋅⋅⋅⋅⋅⋅⋅⋅⋅⋅⋅⋅⋅⋅⋅⋅⋅⋅⋅⋅⋅⋅⋅⋅⋅⋅⋅⋅⋅⋅⋅⋅⋅⋅⋅⋅⋅⋅⋅⋅⋅⋅⋅⋅⋅⋅⋅⋅⋅⋅⋅) Yöneticiler (⋅⋅⋅⋅⋅⋅⋅⋅⋅⋅⋅⋅⋅⋅⋅⋅⋅⋅⋅⋅⋅⋅⋅⋅⋅⋅⋅⋅⋅⋅⋅⋅⋅⋅⋅⋅⋅⋅⋅⋅⋅⋅⋅⋅⋅⋅⋅⋅⋅⋅⋅⋅⋅⋅⋅⋅⋅⋅⋅⋅⋅⋅⋅⋅⋅⋅⋅⋅⋅⋅⋅⋅⋅⋅⋅⋅⋅⋅⋅⋅⋅⋅⋅⋅) 48. Firmanızda, eğitim faaliyetleri için ayrı bir bütçe var mı?
Evet. 2002 yılı eğitim harcamalarınız (yaklaşık olarak) ⋅⋅⋅⋅⋅⋅⋅⋅⋅⋅⋅⋅⋅⋅⋅⋅⋅⋅⋅⋅⋅⋅⋅⋅⋅⋅⋅⋅⋅⋅TL
Hayır PERFORMANS DEĞERLENDİRME 49. Firmanızda uygulanan sistematik bir performans değerlendirme sistemi var mı?
Evet Hayır
Firmanızda performans değerlendirme sisteminiz varsa; 50. Standart bir performans değerlendirme formunuz var mı? (elektronik ya da yazılı) Evet
Hayır 51. Bu formdaki değerlendirme kriterleri ;
Tüm çalışanlar için aynıdır Organizasyon seviyeleri için aynıdır (ilk kademe yöneticiler, orta kademe
yöneticiler İş grupları için aynıdır Her pozisyon için ayrıdır Diğer (⋅⋅⋅⋅⋅⋅⋅⋅⋅⋅⋅⋅⋅⋅⋅⋅⋅⋅⋅⋅⋅⋅⋅⋅⋅⋅⋅⋅⋅⋅⋅⋅⋅⋅⋅⋅⋅⋅⋅⋅⋅⋅⋅⋅⋅⋅⋅⋅⋅⋅⋅⋅⋅⋅⋅⋅⋅⋅⋅⋅⋅⋅⋅⋅⋅⋅⋅⋅⋅⋅⋅⋅⋅⋅⋅⋅⋅⋅⋅⋅⋅⋅⋅⋅)
52. Firmanızda uygulanan performans değerlendirme sonuçları hangi alanlarda kullanılmaktadır? Uygun olan tüm seçenekleri işaretleyiniz.
Ücret ve ek kazançların belirlenmesinde Kariyer planlamasında (terfi, yatay hareketler vb.) Eğitim ihtiyaçlarının belirlenmesinde Ödül ve takdir sistemlerinde Diğer (⋅⋅⋅⋅⋅⋅⋅⋅⋅⋅⋅⋅⋅⋅⋅⋅⋅⋅⋅⋅⋅⋅⋅⋅⋅⋅⋅⋅⋅⋅⋅⋅⋅⋅⋅⋅⋅⋅⋅⋅⋅⋅⋅⋅⋅⋅⋅⋅⋅⋅⋅⋅⋅⋅⋅⋅⋅⋅⋅⋅⋅⋅⋅⋅⋅⋅⋅⋅⋅⋅⋅⋅⋅⋅⋅⋅⋅⋅⋅⋅⋅⋅⋅⋅)

155
53. Firmanızda performans değerlendirme hangi sıklıkta yapılmaktadır? Yöneticiler için Yönetici olmayanlar için
3 ay 6 ay 1 yıl 2 yıl Proje bazında Diğer(⋅⋅⋅⋅⋅⋅⋅⋅⋅⋅⋅⋅⋅⋅⋅⋅⋅⋅⋅⋅⋅⋅⋅⋅⋅⋅⋅⋅⋅⋅⋅⋅⋅⋅⋅⋅⋅⋅⋅) 54. Firmanızda uygulanan performans değerlendirme sistemi kapsamında değerlendirilen kişileri kim/ kimler değerlendirir? Uygun olan tüm seçenekleri işaretleyiniz.
İlk amiri değerlendirir. İkinci amiri değerlendirir. Çalışma arkadaşları değerlendirir. Kişi kendini değerlendirir. Astı değerlendirir. Dış müşteri değerlendirir. Diğer (⋅⋅⋅⋅⋅⋅⋅⋅⋅⋅⋅⋅⋅⋅⋅⋅⋅⋅⋅⋅⋅⋅⋅⋅⋅⋅⋅⋅⋅⋅⋅⋅⋅⋅⋅⋅⋅⋅⋅⋅⋅⋅⋅)
55. Aşağıdaki performans değerlendirme ölçümlerinden hangisi/hangileri firmanızda kullanılıyor? Uygun olan tüm seçenekleri işaretleyiniz.
Sıralama yöntemi (çalışanları en yüksek performansa sahip olandan en düşük performansa sahip olana doğru sıralamak)
İkili karşılaştırmalar (çalışanları ikişer ikişer birbiriyle kıyaslayarak sıralamak)
Zorunlu normal dağılım sıralaması (çalışanları normal dağılım eğrisine göre gruplara ayırarak sıralamak)
Grafik değerlendirme ölçekleri (çalışanları performans boyutlarının çeşitli basamaklarla gösterildiği bir ölçek üzerinde değerlendirmek)
Kritik olaylar tekniği (çalışanın iş yapılırken gösterilen en etkili yada en zayıf davranış örnekleri üzerinden değerlendirilmesi)
Davranışa odaklı değerlendirme ölçekleri- BARS (çalışanları performans boyutlarının davranış cinsinden ifade edildiği bir ölçek üzerinde değerlendirmek)
Davranış gözlemleme ölçekleri- BOS (çalışanları performans boyutlarının davranış cinsinden tanımlandığı bir ölçek üzerinde davranışı gösterme sıklığı açısından değerlendirmek)
Kontrol listesi yöntemi (Yapılan işle ilgili davranışların yer aldığı bir listenin her bir davranışın söz konusu çalışan tarafından yapılıp yapılmadığını düşünerek işaretlenmesi)
Diğer (⋅⋅⋅⋅⋅⋅⋅⋅⋅⋅⋅⋅⋅⋅⋅⋅⋅⋅⋅⋅⋅⋅⋅⋅⋅⋅⋅⋅⋅⋅⋅⋅⋅⋅⋅⋅⋅⋅⋅⋅⋅⋅⋅)
56. Firmanızda uygulanan performans değerlendirme sonuçlarını; Değerlendirilen kişi görmez Değerlendirilen kişi görür ve değerlendirenden görüşme talep edilir Değerlendirilen kişi görür ve değerlendiren kişi ile görüşmesi zorunludur Performans değerlendirme karşılıklı yapılır

156
Değerlendiren kişi yazılı olarak değerlendirilen kişiye iletir Diğer (⋅⋅⋅⋅⋅⋅⋅⋅⋅⋅⋅⋅⋅⋅⋅⋅⋅⋅⋅⋅⋅⋅⋅⋅⋅⋅⋅⋅⋅⋅⋅⋅⋅⋅⋅⋅⋅⋅⋅⋅⋅⋅⋅⋅⋅⋅⋅⋅⋅⋅⋅⋅⋅⋅⋅⋅⋅⋅⋅⋅⋅⋅⋅⋅⋅⋅⋅⋅⋅⋅⋅⋅⋅⋅⋅⋅⋅⋅⋅⋅⋅⋅⋅⋅)
KARİYER PLANLAMA/ GELİŞTİRME 57. Firmanızda uygulanan bir kariyer planlama ve geliştirme sistemi var mı?
Evet Hayır
58. Firmamızda uygulanan kariyer planlama ve geliştirme sistemi,
Organizasyon odaklıdır Personel odaklıdır Hem organizasyon hem personel odaklıdır
59. Firmanızdaki uygulanan kariyer planlama ve geliştirme sistemi aşağıdaki aşamalardan hangisini/ hangilerini içermektedir? Uygun olan tüm seçenekleri işaretleyiniz.
İnsan kaynakları planlaması Çalışanların kariyer ilgilerinin saptanması Çalışanların bilgi, beceri, yetenek, tutum ve beklentilerinin saptanması Çalışanların kariyer hedefleri ile organizasyonun sunabileceği olanakların
eşleştirilmesi Çalışanların kariyer hedeflerine ulaşmalarına destek olmak için
geliştirilmeleri ( eğitim verilmesi vb.) 60. Firmanızda kariyer planlama ve geliştirme faaliyetini kim/kimler yürütmektedir? Uygun olan tüm seçenekleri işaretleyiniz.
Kurum içi uzmanlar Kurum dışı uzmanlar Amirler/ yöneticiler Diğer(⋅⋅⋅⋅⋅⋅⋅⋅⋅⋅⋅⋅⋅⋅⋅⋅⋅⋅⋅⋅⋅⋅⋅⋅⋅⋅⋅⋅⋅⋅⋅⋅⋅⋅⋅⋅⋅⋅⋅⋅⋅⋅⋅⋅⋅⋅⋅⋅⋅⋅⋅⋅)
61. Çalışanların kariyer hedefleri, bilgi, beceri ve yetenekleri değerlendirilirken; Uygun olan tüm seçenekleri işaretleyiniz
Çalışanların kendi ifadelerinden yararlanılır Amirlerin ifadelerinden yararlanılır Çalışanların geçmiş dönem performans değerlendirme sonuçlarından
yararlanılır Çalışanların geçmiş dönemde aldığı eğitimlerden yararlanılır Çalışanların disiplin bilgilerinden yararlanılır Gerçek ya da bilgisayar simülasyonlarından yararlanılır Diğer (⋅⋅⋅⋅⋅⋅⋅⋅⋅⋅⋅⋅⋅⋅⋅⋅⋅⋅⋅⋅⋅⋅⋅⋅⋅⋅⋅⋅⋅⋅⋅⋅⋅⋅⋅⋅⋅⋅⋅⋅⋅⋅⋅⋅⋅⋅⋅⋅⋅⋅⋅⋅⋅⋅⋅⋅⋅⋅⋅⋅⋅⋅⋅⋅⋅⋅⋅⋅⋅⋅⋅⋅⋅⋅⋅⋅⋅⋅⋅⋅⋅⋅⋅⋅⋅⋅⋅⋅⋅⋅⋅⋅⋅⋅⋅⋅⋅)
62. Firmanızda kariyer danışmanlığını üstlenen amirler ya da yöneticiler;
Kariyer danışmanlığı üzerine eğitim almışlardır Kariyer danışmanlığı görevleri iş tanımında yer almaktadır Hiç biri
63. Firmanızda, aşağıdaki kariyer geliştirme aktivitelerinden hangisi/hangileri

157
uygulanmaktadır? Uygun olan tüm seçenekleri işaretleyiniz. İş rotasyonu Kurum içi ve dışı kurslar Seminerler/ eğitimler Çalışma grupları Yurt içi ya da dışı yüksek lisana programlarına destek verilmesi Diğer (⋅⋅⋅⋅⋅⋅⋅⋅⋅⋅⋅⋅⋅⋅⋅⋅⋅⋅⋅⋅⋅⋅⋅⋅⋅⋅⋅⋅⋅⋅⋅⋅⋅⋅⋅⋅⋅⋅⋅⋅⋅⋅⋅⋅⋅⋅⋅⋅⋅⋅⋅⋅⋅⋅⋅⋅⋅⋅⋅⋅⋅⋅⋅⋅⋅⋅⋅⋅⋅⋅⋅⋅⋅⋅⋅⋅⋅⋅⋅⋅⋅⋅⋅⋅⋅⋅⋅⋅⋅⋅⋅⋅⋅⋅⋅⋅⋅)
İNSANGÜCÜ PLANLAMASI 64. Firmanızda insan gücü planlaması yapılıyor mu?
Evet Hayır
65. Firmanızda yapılan insangücü planlaması aşağıdaki aktivitelerden hangisini/hangilerini içerir? Uygun olan tüm seçenekleri işaretleyiniz.
Örgütün strateji ve hedeflerinin belirlenmesi Örgütün uygulama ve yöntemlerinin belirlenmesi Örgütün büyüme hızının saptanması İç ve dış insangücü analizlerinin yapılması Arz ve talebe ilişkin tahminlerin yapılması Denge ayarlarının yapılması (Piyasa çalışmaları, eldekileri koruma ya da
sayıyı azaltma vb. kararlar) Varolan insan kaynaklarının değerlendirilmesi Tahminde bulunulan zaman dilimi içinde halen varolan insan
kaynaklarının ne kadarının işyerinde çalışmaya devam edeceği Tahminde bulunulan zaman diliminde örgütün amaçlarına ulaşabilmesi
için çalışanların değerlendirilmesi/ tahmin edilmesi Gerekli kaynakların nasıl ve ne zaman sağlanabileceği konusundaki
ölçümlerin yapılması Diğer (⋅⋅⋅⋅⋅⋅⋅⋅⋅⋅⋅⋅⋅⋅⋅⋅⋅⋅⋅⋅⋅⋅⋅⋅⋅⋅⋅⋅⋅⋅⋅⋅⋅⋅⋅⋅⋅⋅⋅⋅⋅⋅⋅⋅⋅⋅⋅⋅⋅⋅⋅⋅⋅⋅⋅⋅⋅⋅⋅⋅⋅⋅⋅⋅⋅⋅⋅⋅⋅⋅⋅⋅⋅⋅⋅⋅⋅⋅⋅⋅⋅⋅⋅⋅⋅⋅⋅⋅⋅⋅⋅⋅⋅⋅⋅⋅)
66. Firmanızda yapılan insangücü planlamasında kim/kimler görev almaktadır? Uygun olan tüm seçenekleri işaretleyiniz.
İnsan kaynakları departmanı Diğer departman yöneticileri Üst düzey yöneticiler İnsangücü planlama uzmanı Diğer (⋅⋅⋅⋅⋅⋅⋅⋅⋅⋅⋅⋅⋅⋅⋅⋅⋅⋅⋅⋅⋅⋅⋅⋅⋅⋅⋅⋅⋅⋅⋅⋅⋅⋅⋅⋅⋅⋅⋅⋅⋅⋅⋅⋅⋅⋅⋅⋅⋅⋅⋅⋅⋅⋅⋅⋅⋅⋅⋅⋅⋅⋅)
67. Firmanızda insan gücü planlaması ne uzunlukta bir süre için yapılıyor?
1 yıl ya da daha az 2 yıl 2 yıldan fazla Diğer (⋅⋅⋅⋅⋅⋅⋅⋅⋅⋅⋅⋅⋅⋅⋅⋅⋅⋅⋅⋅⋅⋅⋅⋅⋅⋅⋅⋅⋅⋅⋅⋅⋅⋅⋅)
158
ÜCRET ve EK KAZANÇLAR 68. Firmanızda ücret artışlarını aşağıdaki faktörlerden hangisi/hangileri etkilemektedir? Uygun olan tüm seçenekleri işaretleyiniz.
Enflasyon Bireysel performans Grup performansı Firma karlılığı/ satışlar Firmada çalışılan süre Öğrenim durumu Terfi Yetenek Kişisel ilişkiler Diğer (⋅⋅⋅⋅⋅⋅⋅⋅⋅⋅⋅⋅⋅⋅⋅⋅⋅⋅⋅⋅⋅⋅⋅⋅⋅⋅⋅⋅⋅⋅⋅⋅⋅⋅⋅⋅⋅⋅⋅⋅⋅⋅⋅⋅⋅⋅⋅⋅⋅⋅⋅⋅⋅⋅⋅⋅⋅⋅⋅⋅⋅⋅⋅⋅⋅⋅⋅⋅⋅)
69. Firmanızda çalışanlara yılda kaç kez zam yapılmaktadır?
1 kez 2 kez 3 kez 4 kez Diğer (⋅⋅⋅⋅⋅⋅⋅⋅⋅⋅⋅⋅⋅⋅⋅⋅⋅⋅⋅⋅⋅⋅⋅⋅⋅⋅⋅⋅⋅⋅⋅⋅⋅⋅⋅⋅⋅⋅⋅⋅⋅⋅⋅⋅⋅⋅⋅⋅⋅⋅⋅⋅⋅⋅⋅⋅⋅⋅⋅⋅⋅⋅)
70. Firmanızdaki ücret artışlarında rol oynayan faktörler/kişiler nelerdir/ kimlerdir? Uygun olan tüm seçenekleri işaretleyiniz.
Yöneticiler Yönetici olmayanlar için için
Çalışanın birinci amiri Çalışanın ikinci amiri İnsan kaynakları yöneticisi Genel Müdür Yönetim Kurulu Hedeflere ulaşma derecesi Performans değerlendirme sonuçları Sayısal olarak belirlenen performans kriterleri Diğer (⋅⋅⋅⋅⋅⋅⋅⋅⋅⋅⋅⋅⋅⋅⋅⋅⋅⋅⋅⋅⋅⋅⋅⋅⋅⋅⋅⋅⋅⋅⋅⋅⋅⋅⋅⋅⋅⋅⋅⋅⋅⋅⋅⋅⋅⋅⋅⋅⋅⋅) 71. Firmanızda iş değerleme çalışması ( ücretlendirmeye esas olacak şekilde işlerin sistematik bir şekilde sıralanması) uygulandı mı?
Evet Hayır
72. İş değerleme çalışması yapıldıysa sonuçları ücretlendirmede kullanılıyor mu?
Evet Hayır

159
73. İş değerleme çalışmasında aşağıdaki yöntemlerden hangisi/hangileri kullanıldı? Uygun olan tüm seçenekleri işaretleyiniz.
İş sıralama İş dereceleme Puanlama Faktör karşılaştırma
Diğer (⋅⋅⋅⋅⋅⋅⋅⋅⋅⋅⋅⋅⋅⋅⋅⋅⋅⋅⋅⋅⋅⋅⋅⋅⋅⋅⋅⋅⋅⋅⋅⋅⋅⋅⋅⋅⋅⋅⋅⋅⋅⋅⋅⋅⋅⋅⋅⋅⋅⋅) 74. Firmanızın ait olduğu sektördeki çalışanların genel olarak nasıl ücretlendirildiğini saptamak üzere bir çalışma yapıldı mı?
Evet Hayır
75. Firmanızda fazla mesai ücreti uygulaması var mı?
Evet Hayır
76. Fazla mesai ücreti uygulaması aşağıdaki seviyelerden hangisine/hangilerine uygulanmaktadır? Uygun olan tüm seçenekleri işaretleyiniz.
İlk kademe yöneticiler Yönetici olmayan personel Mavi yakalı Yönetici adayları Diğer (⋅⋅⋅⋅⋅⋅⋅⋅⋅⋅⋅⋅⋅⋅⋅⋅⋅⋅⋅⋅⋅⋅⋅⋅⋅⋅⋅⋅⋅⋅⋅⋅⋅⋅⋅⋅⋅⋅⋅⋅⋅⋅⋅⋅⋅⋅⋅⋅⋅⋅⋅⋅⋅⋅⋅⋅⋅⋅⋅⋅⋅⋅⋅⋅⋅⋅⋅⋅⋅⋅⋅⋅⋅⋅⋅⋅⋅⋅⋅⋅⋅⋅⋅⋅)
77. Aşağıdaki ek kazançlardan hangileri firmanızda uygulanmaktadır? Uygun olan tüm seçenekleri işaretleyiniz.
Yöneticiler Yönetici olmayanlar için için Yemek/yemek fişi Sağlık sigortası Hayat sigortası Kaza sigortası Özel emeklilik Araba Yol parası Benzin Cep telefonu Ev telefonu Lojman Ev kirası yardımı Kreş Klüp/dernek üyeliği Yılbaşı ikramiyesi Bayram harçlığı Kar payı Çocuk yardımı Tahsil yardımı

160
Yakacak yardımı Şarta bağlı sosyal yardımlar Diğer (⋅⋅⋅⋅⋅⋅⋅⋅⋅⋅⋅⋅⋅⋅⋅⋅⋅⋅⋅⋅⋅⋅⋅⋅⋅⋅⋅⋅⋅⋅⋅⋅⋅⋅⋅⋅⋅⋅⋅⋅⋅⋅⋅⋅⋅⋅⋅⋅⋅⋅⋅⋅⋅⋅⋅⋅⋅⋅⋅⋅⋅⋅⋅⋅⋅⋅⋅⋅⋅⋅⋅⋅⋅⋅⋅⋅⋅⋅) 78. Firmanızda aşağıdaki nakdi teşvik edici yöntemlerden hangisi/hangileri kullanılıyor? Uygun olan tüm seçenekleri işaretleyiniz.
Bireysel prim Grup primi Hisse senedi Kardan pay verme Teşvik edici bir yöntem kullanılmamaktadır. Diğer (⋅⋅⋅⋅⋅⋅⋅⋅⋅⋅⋅⋅⋅⋅⋅⋅⋅⋅⋅⋅⋅⋅⋅⋅⋅⋅⋅⋅⋅⋅⋅⋅⋅⋅⋅⋅⋅⋅⋅⋅⋅⋅⋅⋅⋅⋅⋅⋅⋅⋅⋅⋅⋅⋅⋅⋅⋅⋅⋅⋅⋅⋅⋅⋅⋅⋅⋅⋅⋅⋅⋅⋅⋅⋅⋅⋅⋅⋅)
79. Firmanızda aşağıdaki ayni teşvik yöntemlerinden hangisi/hangileri kullanılmaktadır? Uygun olan tüm seçenekleri işaretleyiniz.
Plaket vermek Fazladan tatil imkanları sağlamak Hediyeler vermek Firma dergisinde ya da iş yerindeki panolarda çalışanların başarı
öykülerine yer vermek Diğer (⋅⋅⋅⋅⋅⋅⋅⋅⋅⋅⋅⋅⋅⋅⋅⋅⋅⋅⋅⋅⋅⋅⋅⋅⋅⋅⋅⋅⋅⋅⋅⋅⋅⋅⋅⋅⋅⋅⋅⋅⋅⋅⋅⋅⋅⋅⋅⋅⋅⋅⋅⋅⋅⋅⋅⋅⋅⋅⋅⋅⋅⋅⋅⋅⋅⋅⋅⋅⋅⋅⋅⋅⋅⋅⋅⋅⋅⋅)
SENDİKAL İLİŞKİLER 80. Firmanızda İnsan Kaynakları Yönetimi Departmanı sendikal ilişkilerin yürütülmesinden sorumlu mu?
Evet Hayır
81. Evetse, İnsan Kaynakları Yönetimi Departmanı aşağıdaki faaliyetlerin hangisinden/ hangilerinden sorumludur? Uygun olan tüm seçenekleri işaretleyiniz.
Toplu İş Sözleşmesi hazırlık çalışmalarının yapılması Sendikalarla Toplu İş Sözleşmesinin yapılması Sendikaya bağlı çalışanların şikayet ve uyuşmazlıklarının çözümlenmesi Sendika (merkez ya da şube) temsilcileri ile ilişkilerin düzenlenmesi Toplu İş Sözleşmesinin uygulanması Diğer (⋅⋅⋅⋅⋅⋅⋅⋅⋅⋅⋅⋅⋅⋅⋅⋅⋅⋅⋅⋅⋅⋅⋅⋅⋅⋅⋅⋅⋅⋅⋅⋅⋅⋅⋅⋅⋅⋅⋅⋅⋅⋅⋅⋅⋅⋅⋅⋅⋅⋅⋅⋅⋅⋅⋅⋅⋅⋅⋅⋅⋅⋅⋅⋅⋅⋅⋅⋅⋅⋅⋅⋅⋅⋅⋅⋅⋅⋅)
İŞÇİ SAĞLIĞI VE GÜVENLİĞİ 82. Firmanızda çalışanların sağlığını korumak ve güvenliğini sağlamaktan hangi departman sorumludur? (⋅⋅⋅⋅⋅⋅⋅⋅⋅⋅⋅⋅⋅⋅⋅⋅⋅⋅⋅⋅⋅⋅⋅⋅⋅⋅⋅⋅⋅⋅⋅⋅⋅⋅⋅⋅⋅⋅⋅⋅⋅⋅⋅⋅⋅⋅⋅⋅⋅⋅⋅⋅⋅⋅⋅⋅⋅⋅⋅⋅⋅⋅⋅⋅⋅⋅⋅⋅⋅⋅⋅⋅⋅⋅⋅⋅⋅⋅) 83. Söz konusu departman aşağıdaki çalışan sağlığı ve güvenliği faaliyetlerinin hangisinden/ hangilerinden sorumludur? Uygun olan tüm seçenekleri işaretleyiniz. İş Sağlığı ve Güvenliği programlarını koordine etmek
İş Sağlığı ve Güvenliği programları hazırlamak Çalışanları İş Sağlığı ve Güvenliği konularında eğitmek İş kazalarını analiz etmek ve gerekli önlemleri almak

161
İş kazalarına ilişkin istatistikler tutmak İş Sağlığı ve Güvenliğine ilişkin yasal mevzuata uymak İş Sağlığı ve Güvenliği Kurulunda görev almak Çalışan sağlığı ve güvenliği ile ilgili kayıtları tutmak Diğer (⋅⋅⋅⋅⋅⋅⋅⋅⋅⋅⋅⋅⋅⋅⋅⋅⋅⋅⋅⋅⋅⋅⋅⋅⋅⋅⋅⋅⋅⋅⋅⋅⋅⋅⋅⋅⋅⋅⋅⋅⋅⋅⋅⋅⋅⋅⋅⋅⋅⋅⋅⋅⋅⋅⋅⋅⋅⋅⋅⋅⋅⋅⋅⋅⋅⋅⋅⋅⋅⋅⋅⋅⋅⋅⋅⋅⋅⋅)
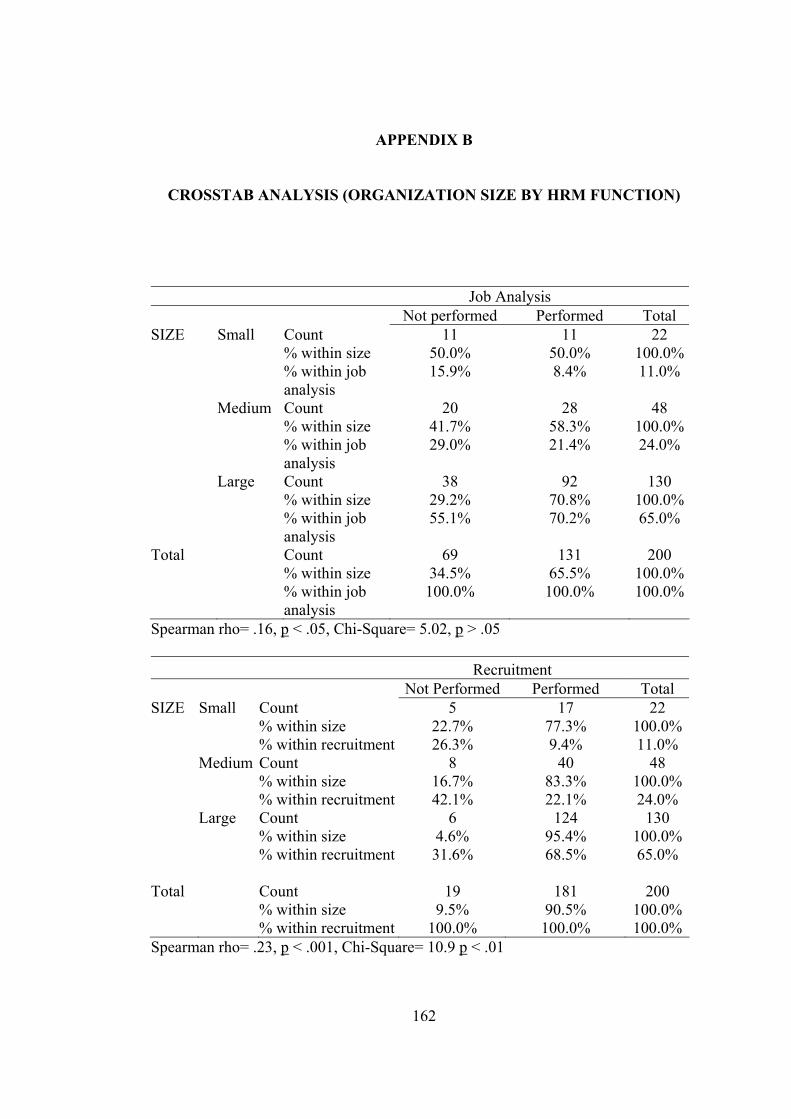
162
APPENDIX B
CROSSTAB ANALYSIS (ORGANIZATION SIZE BY HRM FUNCTION)
Spearman rho= .16, p < .05, Chi-Square= 5.02, p > .05
Recruitment Not Performed Performed Total
SIZE Small Count 5 17 22 % within size 22.7% 77.3% 100.0%
% within recruitment 26.3% 9.4% 11.0% Medium Count 8 40 48 % within size 16.7% 83.3% 100.0% % within recruitment 42.1% 22.1% 24.0% Large Count 6 124 130 % within size 4.6% 95.4% 100.0%
% within recruitment 31.6% 68.5% 65.0%
Total Count 19 181 200 % within size 9.5% 90.5% 100.0%% within recruitment 100.0% 100.0% 100.0%
Spearman rho= .23, p < .001, Chi-Square= 10.9 p < .01
Job Analysis Not performed Performed Total SIZE Small Count 11 11 22 % within size 50.0% 50.0% 100.0% % within job
analysis 15.9% 8.4% 11.0%
Medium Count 20 28 48 % within size 41.7% 58.3% 100.0% % within job
analysis 29.0% 21.4% 24.0%
Large Count 38 92 130 % within size 29.2% 70.8% 100.0% % within job
analysis 55.1% 70.2% 65.0%
Total Count 69 131 200 % within size 34.5% 65.5% 100.0% % within job
analysis 100.0% 100.0% 100.0%

163
Personnel Selection
Not Performed Performed Total SIZE Small Count 3 19 22 % within size 13.6% 86.4% 100.0% % within
personnel selection
23.1% 10.2% 11.0%
Medium Count 6 42 48 % within size 12.5% 87.5% 100.0% % within
personnel selection
46.2% 22.5% 24.0%
Large Count 4 126 130 % within size 3.1% 96.9% 100.0% % within
personnel selection
30.8% 67.4% 65.0%
Total Count 13 187 200 % within size 6.5% 93.5% 100.0% % within
personnel selection
100.0% 100.0% 100.0%
Spearman rho= .19, p < .01, Chi-Square= 7.19, p < .05
Training Not performed Performed Total
SIZE Small Count 4 18 22 % within size 18.2% 81.8% 100.0% % within training 12.1% 10.8% 11.0% Medium Count 13 35 48 % within size 27.1% 72.9% 100.0% % within training 39.4% 21.0% 24.0% Large Count 16 114 130 % within size 12.3% 87.7% 100.0% % within training 48.5% 68.3% 65.0% Total Count 33 167 200 % within size 16.5% 83.5% 100.0% % within training 100.0% 100.0% 100.0% Spearman rho= .14, p > .05, Chi-Square= 5.61, p > .05

164
Performance Management Not Performed Performed Total SIZE Small Count 5 17 22 % within size 22.7% 77.3% 100.0% % within performance 12.8% 10.6% 11.0% Medium Count 14 34 48 % within size 29.2% 70.8% 100.0% % within performance 35.9% 21.1% 24.0% Large Count 20 110 130 % within size 15.4% 84.6% 100.0% % within performance 51.3% 68.3% 65.0% Total Count 39 161 200 % within size 19.5% 80.5% 100.0% % within performance 100.0% 100.0% 100.0%Spearman rho= .13, p > .05, Chi-Square= 4.41, p > .05
Spearman rho= .14, p < .05, Chi-Square= 4.58, p > .05
Career Planning Not Performed Performed Total SIZE Small Count 12 10 22 % within size 54.5% 45.5% 100.0% % within career
planning 16.2% 7.9% 11.0%
Medium Count 20 28 48 % within size 41.7% 58.3% 100.0% % within career
planning 27.0% 22.2% 24.0%
Large Count 42 88 130 % within size 32.3% 67.7% 100.0% % within career
planning 56.8% 69.8% 65.0%
Total Count 74 126 200 % within size 37.0% 63.0% 100.0% % within career
planning 100.0% 100.0% 100.0%

165
Employee Relations Not Performed Performed Total SIZE Small Count 10 12 22 % within size 45,5% 54,5% 100,0% % within employee
relations 9,1% 13,3% 11,0%
Medium Count 38 10 48 % within size 79,2% 20,8% 100,0% % within employee
relations 34,5% 11,1% 24,0%
Large Count 62 68 130 % within size 47,7% 52,3% 100,0% % within employee
relations 56,4% 75,6% 65,0%
Total Count 110 90 200 % within size 55,0% 45,0% 100,0% % within employee
relations 100,0% 100,0% 100,0%
Spearman rho= .16, p < .05, Chi-Square= 14.94, p < .001

166
APPENDIX C
CORRELATIONS AMONG HRM FUNCTIONS Q
ualit
y M
anag
emen
t
-.04
Soci
al
Sevi
ces
.50*
*
.40*
*
Empl
oyee
R
elat
ions
.08
.16*
.05
Hea
lth
Safe
ty
.25*
*
.16*
.05
.11
Pers
onne
l
.37*
*
.23*
*
.11
.02
.09
Lunc
h
.37*
*
.41*
*
.17*
.18*
.09
.15*
Tran
spor
tatio
n
.81*
*
.43*
*
.40*
*
.31*
*
.18*
.11
.11
Payr
oll
.36*
*
.31*
*
.68*
*
.38*
*
.18*
*
.07
.05
.11
Com
pens
atio
n
.29*
*
.12
.18*
.34*
*
.10
.27*
*
-.07
.09
-.05
HR
Pl
anni
ng
.29*
*
.11
.11
-.05
.08
.19*
*
.36*
*
-.09
.10
-.01
Car
eer
Plan
ning
.50*
*
.34*
*
.07
.10
-.03
.10
.06
.24*
*
-.14*
-.02
-.02
Perf
orm
ance
.51*
*
.38*
*
.26*
*
.06
.14
.04
.15*
.05
.24*
*
.07
.09
.03
Trai
ning
.46*
*
.38*
*
.24*
*
.07
.05
.16*
.08
.03
.19*
.10
.10
.08
.01
Orie
ntat
ion
.72*
*
.54*
*
.43*
*
.29*
*
.15*
.12
.18*
.09
.14
.23*
*
.20*
*
.05
.01
.01
Pers
onne
l Se
lect
ion
.33*
*
.43*
*
.38*
*
.30*
*
.16*
.30*
*
.03
.06
.01
.13
-.02
.08
.02
.05
-.06
Rec
ruitm
ent
.40*
*
.28*
*
.18*
.23*
*
.14*
.16*
.16*
.16*
.20*
*
.07
.19*
*
.15*
.26*
*
.10
.06
-.03
Job
Des
ign
.15*
.12
.26*
*
.21*
*
.31*
*
.32*
*
.51*
*
.21*
*
.08
.24*
*
.13
.12
.24*
*
.29*
*
.06
.13
.08
Job
Ana
lysi
s
.55*
*
.23*
*
.24*
*
.40*
*
.36*
*
.47*
*
.40*
*
.45*
*
.18*
-.09
.08
-.01
.02
.09
.21*
*
.02
.14
.02
Job
Des
ign
Rec
ruitm
ent
Pers
onne
l Se
lect
ion
Orie
ntat
ion
Trai
ning
Perf
orm
ance
Car
eer P
lann
ing
HR
Pla
nnin
g
Com
pens
atio
n
Payr
oll
Tran
spor
tatio
n
Lunc
h
Pers
onne
l
Hea
lth_S
afet
y
Empl
oyee
R
elat
ions
Soci
al S
evic
es
Qua
lity
Man
agem
ent
Adm
inis
trativ
e Se
rvic
es
*P<
.05,
**P
< .0
1

167
APPENDIX D
CROSSTAB ANALYSIS (ORGANIZATION SIZE BY JOB ANALYSIS
METHODS)
Spearman rho= -.04, p > .05, Chi-Square= 1.60, p > .05
Observation Not
PerformedPerformed Total
SIZE Small Count 13 9 22 % within size 59.1% 40.9% 100.0% % within
observation 12.1% 9.7% 11.0%
% of Total 6.5% 4.5% 11.0% Medium Count 22 26 48 % within size 45.8% 54.2% 100.0% % within
observation 20.6% 28.0% 24.0%
% of Total 11.0% 13.0% 24.0% Large Count 72 58 130 % within size 55.4% 44.6% 100.0% % within
observation 67.3% 62.4% 65.0%
% of Total 36.0% 29.0% 65.0% Total Count 107 93 200 % within size 53.5% 46.5% 100.0% % within
observation 100.0% 100.0% 100.0%
% of Total 53.5% 46.5% 100.0%

168
Employee Interview Not
Performed Performed Total
SIZE Small Count 12 10 22 % within size 54.5% 45.5% 100.0% % within employee
interview 15.0% 8.3% 11.0%
% of Total 6.0% 5.0% 11.0% Medium Count 22 26 48 % within size 45.8% 54.2% 100.0% % within employee
interview 27.5% 21.7% 24.0%
% of Total 11.0% 13.0% 24.0% Large Count 46 84 130 % within size 35.4% 64.6% 100.0% % within employee
interview 57.5% 70.0% 65.0%
% of Total 23.0% 42.0% 65.0% Total Count 80 120 200 % within size 40.0% 60.0% 100.0% % within employee
interview 100.0% 100.0% 100.0%
% of Total 40.0% 60.0% 100.0% Spearman rho= .14, p > .05, Chi-Square= 3.77, p > .05
Questionnaire Not Performed Performed Total SIZE Small Count 14 8 22 % within size 63.6% 36.4% 100.0% % within
questionnaire 10.4% 12.3% 11.0%
% of Total 7.0% 4.0% 11.0% Medium Count 34 14 48 % within size 70.8% 29.2% 100.0% % within
questionnaire 25.2% 21.5% 24.0%
% of Total 17.0% 7.0% 24.0% Large Count 87 43 130 % within size 66.9% 33.1% 100.0% % within
questionnaire 64.4% 66.2% 65.0%
% of Total 43.5% 21.5% 65.0% Total Count 135 65 200 % within size 67.5% 32.5% 100.0% % within
questionnaire 100.0% 100.0% 100.0%
% of Total 67.5% 32.5% 100.0% Spearman rho= .01, p > .05, Chi-Square= .41, p > .05
Specialist Sample

169
Not Performed
Performed Total
SIZE Smalll Count 17 5 22 % within size 77.3% 22.7% 100.0% % within Specialist
sample 12.7% 7.6% 11.0%
% of Total 8.5% 2.5% 11.0% Medium Count 34 14 48 % within size 70.8% 29.2% 100.0% % within Specialist
sample 25.4% 21.2% 24.0%
% of Total 17.0% 7.0% 24.0% Large Count 83 47 130 % within size 63.8% 36.2% 100.0% % within Specialist
sample 61.9% 71.2% 65.0%
% of Total 41.5% 23.5% 65.0% Total Count 134 66 200 % within size 67.0% 33.0% 100.0% % within Specialist
sample 100.0% 100.0% 100.0%
% of Total 67.0% 33.0% 100.0% Spearman rho= .10, p > .05, Chi-Square= 1.95, p > .05
JA Form Not
Performed Performed Total
SIZE Small Count 17 5 22 % within size 77.3% 22.7% 100.0% % within JA form 12.0% 8.6% 11.0% % of Total 8.5% 2.5% 11.0% Medium Count 38 10 48 % within size 79.2% 20.8% 100.0% % within JA form 26.8% 17.2% 24.0% % of Total 19.0%
5.0% 24.0%
Large Count 87 43 130 % within size 66.9% 33.1% 100.0% % within JA form 61.3% 74.1% 65.0% % of Total 43.5% 21.5% 65.0% Total Count 142 58 200 % within size 71.0% 29.0% 100.0% % within JA form 100.0% 100.0% 100.0% % of Total 71.0% 29.0% 100.0%
Spearman rho= .12, p > .05, Chi-Square= 3.03, p > .05
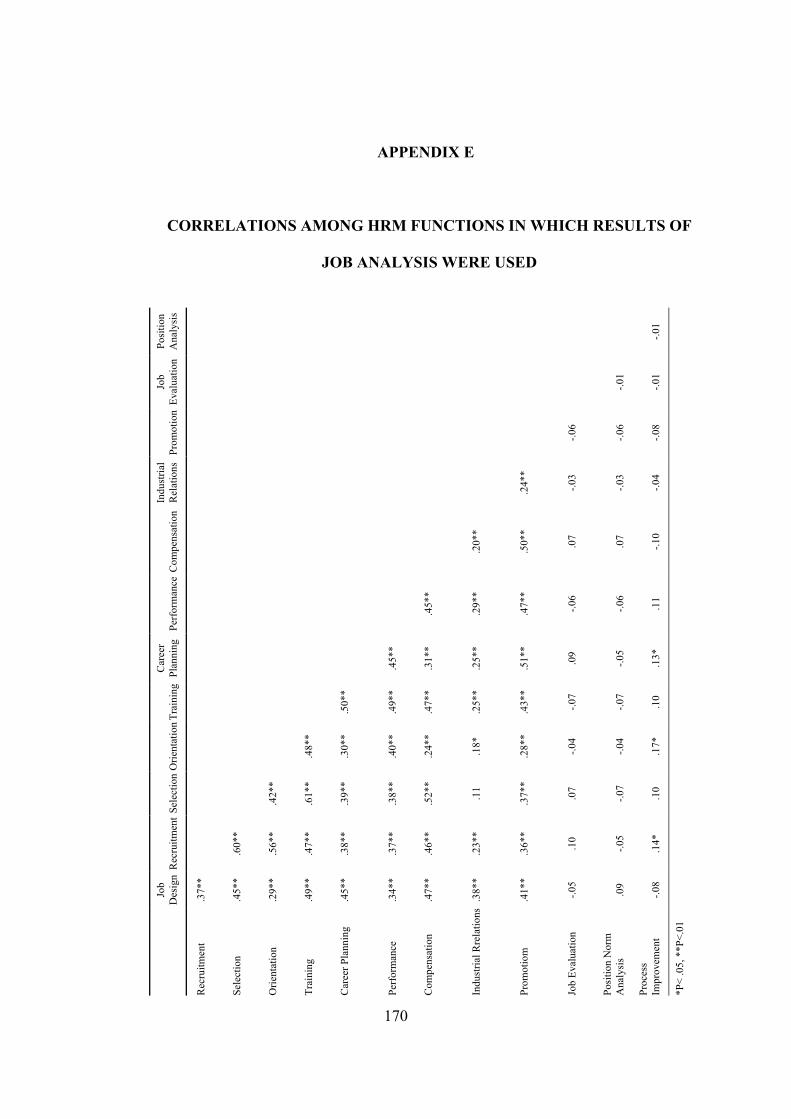
170
APPENDIX E
CORRELATIONS AMONG HRM FUNCTIONS IN WHICH RESULTS OF
JOB ANALYSIS WERE USED
Posi
tion
Ana
lysi
s
-.01
Job
Eval
uatio
n
-.01
-.01
Prom
otio
n
-.06
-.06
-.08
Indu
stria
l R
elat
ions
.24*
*
-.03
-.03
-.04
Com
pens
atio
n
.20*
*
.50*
*
.07
.07
-.10
Perf
orm
ance
.45*
*
.29*
*
.47*
*
-.06
-.06
.11
Car
eer
Plan
ning
.45*
*
.31*
*
.25*
*
.51*
*
.09
-.05
.13*
Trai
ning
.50*
*
.49*
*
.47*
*
.25*
*
.43*
*
-.07
-.07
.10
Orie
ntat
ion
.48*
*
.30*
*
.40*
*
.24*
*
.18*
.28*
*
-.04
-.04
.17*
Sele
ctio
n
.42*
*
.61*
*
.39*
*
.38*
*
.52*
*
.11
.37*
*
.07
-.07
.10
Rec
ruitm
ent
.60*
*
.56*
*
.47*
*
.38*
*
.37*
*
.46*
*
.23*
*
.36*
*
.10
-.05
.14*
Job
Des
ign
.37*
*
.45*
*
.29*
*
.49*
*
.45*
*
.34*
*
.47*
*
.38*
*
.41*
*
-.05
.09
-.08
Rec
ruitm
ent
Sele
ctio
n
Orie
ntat
ion
Trai
ning
Car
eer P
lann
ing
Perf
orm
ance
Com
pens
atio
n
Indu
stria
l Rre
latio
ns
Prom
otio
m
Job
Eval
uatio
n
Posi
tion
Nor
m
Ana
lysi
s
Proc
ess
Impr
ovem
ent
*P<
.05,
**P
<.01

171
APPENDIX F
CROSSTAB ANALYSIS (ORGANIZATION SIZE BY METHODS USED TO
SELECT MANAGERS)
Spearman rho= -.07, p > .05, Chi-Square= 6.19, p < .05
Interview Not
Performed Performed Total
SIZE Small Count 5 17 22 % within size 22.7% 77.3% 100.0% % within
interview 16.7% 10.0% 11.0%
% of Total 2.5% 8.5% 11.0% Medium Count 2 46 48 % within size 4.2% 95.8% 100.0% % within
interview 6.7% 27.1% 24.0%
% of Total 1.0% 23.0% 24.0% Large Count 23 107 130 % within size 17.7% 82.3% 100.0% % within
interview 76.7% 62.9% 65.0%
% of Total 11.5% 53.5% 65.0% Total Count 30 170 200 % within size 15.0% 85.0% 100.0% % within
interview 100.0% 100.0% 100.0%
% of Total 15.0% 85.0% 100.0%

172
Personality Tests Not Performed Performed Total SIZE Small Count 13 9 22 % within size 59.1% 40.9% 100.0% % within personality
tests 10.4% 12.0% 11.0%
% of Total 6.5% 4.5% 11.0% Medium Count 26 22 48 % within size 54.2% 45.8% 100.0% % within personality
tests 20.8% 29.3% 24.0%
% of Total 13.0% 11.0% 24.0% Large Count 86 44 130 % within size 66.2% 33.8% 100.0% % within personality
tests 68.8% 58.7% 65.0%
% of Total 43.0% 22.0% 65.0% Total Count 125 75 200 % within size 62.5% 37.5% 100.0% % within personality
and interest inventories
100.0% 100.0% 100.0%
% of Total 62.5% 37.5% 100.0% Spearman rho= -.10, p > .05, Chi-Square= 2.27, p > .05
References Not Performed Performed Total SIZE Small Count 9 13 22 % within size 40.9% 59.1% 100.0% % within references 12.9% 10.0% 11.0% % of Total 4.5% 6.5% 11.0% Medium Count 21 27 48 % within size 43.8% 56.3% 100.0% % within references 30.0% 20.8% 24.0% % of Total 10.5% 13.5% 24.0% Large Count 40 90 130 % within size 30.8% 69.2% 100.0% % within references 57.1% 69.2% 65.0% % of Total 20.0% 45.0% 65.0% Total Count 70 130 200 % within size 35.0% 65.0% 100.0% % within references 100.0% 100.0% 100.0% % of Total 35.0% 65.0% 100.0%
Spearman rho= .12, p > .05, Chi-Square= 2.98, p > .05

173
APPENDIX G
CROSSTAB ANALYSIS (ORGANIZATION SIZE BY METHODS USED TO
SELECT NON MANAGERS)
Interview
Not performed Performed Total SIZE Small Count 2 20 22 % within size 9.1% 90.9% 100.0% % within interview 13.3% 10.8% 11.0% % of Total 1.0% 10.0% 11.0% Medium Count 4 44 48 % within size 8.3% 91.7% 100.0% % within interview 26.7% 23.8% 24.0% % of Total 2.0% 22.0% 24.0% Large Count 9 121 130 % within size 6.9% 93.1% 100.0% % within interview 60.0% 65.4% 65.0% % of Total 4.5% 60.5% 65.0% Total Count 15 185 200 % within size 7.5% 92.5% 100.0% % within interview 100.0% 100.0% 100.0% % of Total 7.5% 92.5% 100.0%
Spearman rho= .03, p > .05, Chi-Square= .19, p > .05

174
Personality Tests Not Performed Performed Total SIZE Small Count 13 9 22 % within size 59.1% 40.9% 100.0% % within personality
tests 11.1% 10.8% 11.0%
% of Total 6.5% 4.5% 11.0% Medium Count 28 20 48 % within size 58.3% 41.7% 100.0% % within personality
tests 23.9% 24.1% 24.0%
% of Total 14.0% 10.0% 24.0% Large Count 76 54 130 % within size 58.5% 41.5% 100.0% % within personality
tests 65.0% 65.1% 65.0%
% of Total 38.0% 27.0% 65.0% Total Count 117 83 200 % within size 58.5% 41.5% 100.0% % within personality
tests 100.0% 100.0% 100.0%
% of Total 58.5% 41.5% 100.0% Spearman rho= .002, p > .05, Chi-Square= .004, p > .05
References Not Performed Performed Total SIZE Small Count 10 12 22 % within size 45.5% 54.5% 100.0% % within references 16.1% 8.7% 11.0% % of Total 5.0% 6.0% 11.0% Medium Count 17 31 48 % within size 35.4% 64.6% 100.0% % within references 27.4% 22.5% 24.0% % of Total 8.5% 15.5% 24.0% Large Count 35 95 130 % within size 26.9% 73.1% 100.0% % within references 56.5% 68.8% 65.0% % of Total 17.5% 47.5% 65.0% Total Count 62 138 200 % within size 31.0% 69.0% 100.0% % within references 100.0% 100.0% 100.0% % of Total 31.0% 69.0% 100.0%
Spearman rho= .13, p > .05, Chi-Square= 3.60, p > .05

175
APPENDIX H
CROSSTAB ANALYSIS (ORGANIZATION SIZE BY KINDS OF
INTERVIEWS)
One to One Interview Not Performed Performed Total SIZE Small Count 3 19 22 % within size 13.6% 86.4% 100.0% % within one to
one interview 10.7% 11.0% 11.0%
% of Total 1.5% 9.5% 11.0% Medium Count 4 44 48 % within size 8.3% 91.7% 100.0% % within one to
one interview 14.3% 25.6% 24.0%
% of Total 2.0% 22.0% 24.0% Large Count 21 109 130 % within size 16.2% 83.8% 100.0% % within one to
one interview 75.0% 63.4% 65.0%
% of Total 10.5% 54.5% 65.0% Total Count 28 172 200 % within size 14.0% 86.0% 100.0% % within one to
one interview 100.0% 100.0% 100.0%
% of Total 14.0% 86.0% 100.0% Spearman rho= -.08, p > .05, Chi-Square= 1.78, p > .05

176
Panel Interview Not Performed Performed Total SIZE Small Count 9 13 22 % within size 40.9% 59.1% 100.0% % within panel interview 9.4% 12.5% 11.0% % of Total 4.5% 6.5% 11.0% Medium Count 22 26 48 % within size 45.8% 54.2% 100.0% % within panel interview 22.9% 25.0% 24.0% % of Total 11.0% 13.0% 24.0% Large Count 65 65 130 % within size 50.0% 50.0% 100.0% % within panel interview 67.7% 62.5% 65.0% % of Total 32.5% 32.5% 65.0% Total Count 96 104 200 % within size 48.0% 52.0% 100.0% % within panel interview 100.0% 100.0% 100.0% % of Total 48.0% 52.0% 100.0%
Spearman rho= -.06, p > .05, Chi-Square= .74, p > .05
Structured Interview Not
Performed Performed Total
SIZE Small Count 18 4 22 % within size 81.8% 18.2% 100.0% % within structured
interview 11.8% 8.3% 11.0%
% of Total 9.0% 2.0% 11.0% Medium Count 43 5 48 % within size 89.6% 10.4% 100.0% % within structured
interview 28.3% 10.4% 24.0%
% of Total 21.5% 2.5% 24.0% Large Count 91 39 130 % within size 70.0% 30.0% 100.0% % within structured
interview 59.9% 81.3% 65.0%
% of Total 45.5% 19.5% 65.0% Total Count 152 48 200 % within size 76.0% 24.0% 100.0% % within structured
interview 100.0% 100.0% 100.0%
% of Total 76.0% 24.0% 100.0% Spearman rho= .18, p < .05, Chi-Square= 7.83, p < .05

177
Unstructured Interview Not
Performed Performed Total
SIZE Small Count 20 2 22 % within size 90.9% 9.1% 100.0% % within unstructured
interview 11.8% 6.5% 11.0%
% of Total 10.0% 1.0% 11.0% Medium Count 44 4 48 % within size 91.7% 8.3% 100.0% % within unstructured
interview 26.0% 12.9% 24.0%
% of Total 22.0% 2.0% 24.0% Large Count 105 25 130 % within size 80.8% 19.2% 100.0% % within unstructured
interview 62.1% 80.6% 65.0%
% of Total 52.5% 12.5% 65.0% Total Count 169 31 200 % within size 84.5% 15.5% 100.0% % within unstructured
interview 100.0% 100.0% 100.0%
% of Total 84.5% 15.5% 100.0% Spearman rho= .14, p > .05, Chi-Square= 3.95, p > .05

178
APPENDIX I
CORRELATIONS AMONG METHODS OF ORIENTATION PROGRAMS
Brochures/Handbooks
Conferences/Group
Meetings Visual Techniques Trips Conferences/Group Meetings .23** Visual Techniques .44** .28** Trips .47 .20 .34 Orientation by Managers .46 .15 .24 .61
*p< .05, **p< .01

179
APPENDIX J
CORRELATIONS AMONG THE POSITIONS THAT ORIENTATION
PROGRAMS WERE APPLIED FOR
First Level Managers
Middle Level
Managers High Level Managers
Non-managers
Blue Collar MT
Middle Level Managers .62** High Level Managers .45** .54** Non-managers .43 .37 .24
Blue Collar .38** .36** .30** .41**
MT .46** .47** .31** .49** .49** Interns .01 .11 .07 .09 .05 .13
*p< .05, **p< .01

180
APPENDIX K
CROSSTAB ANALYSIS (ORGANIZATION SIZE BY TRAINING
METHODS)
Lecture Not Performed Performed Total SIZE Small Count 10 12 22 % within size 45.5% 54.5% 100.0% % within lecture 17.5% 8.4% 11.0% % of Total 5.0% 6.0% 11.0% Medium Count 15 33 48 % within size 31.3% 68.8% 100.0% % within lecture 26.3% 23.1% 24.0% % of Total 7.5% 16.5% 24.0% Large Count 32 98 130 % within size 24.6% 75.4% 100.0% % within lecture 56.1% 68.5% 65.0% % of Total 16.0% 49.0% 65.0% Total Count 57 143 200 % within size 28.5% 71.5% 100.0% % within lecture 100.0% 100.0% 100.0% % of Total 28.5% 71.5% 100.0%
Spearman rho= .13, p > .05, Chi-Square= 4.24, p > .05

181
On the Job Training Not Performed Performed Total SIZE Small Count 7 15 22 % within size 31.8% 68.2% 100.0% % within on the job training 12.7% 10.3% 11.0% % of Total 3.5% 7.5% 11.0% Medium Count 16 32 48 % within size 33.3% 66.7% 100.0% % within on the job training 29.1% 22.1% 24.0% % of Total 8.0% 16.0% 24.0% Large Count 32 98 130 % within size 24.6% 75.4% 100.0% % within on the job training 58.2% 67.6% 65.0% % of Total 16.0% 49.0% 65.0% Total Count 55 145 200 % within size 27.5% 72.5% 100.0% % within on the job training 100.0% 100.0% 100.0% % of Total 27.5% 72.5% 100.0%
Spearman rho= .08, p > .05, Chi-Square= 1.57, p > .05

182
APPENDIX L
CORRELATIONS AMONG METHODS OF NEED ANALYSIS
Questionnaires Interview PA Results AC Interview -.28** PA Results .05 -.15* AC -.07 .05 -.22** Manager Suggestions -.09 -.06 -.15* -.066
*p< .05, **p< .01

183
APPENDIX M
CORRELATIONS AMONG METHODS OF PERFORMANCE APPRAISAL
Che
cklis
t
-.01
BO
S
.15*
.14
BA
RS
.25*
*
.32*
*
-.06
Crit
ical
In
cide
nce
.12
.13
.37*
*
.10
GR
S .08
.17*
.13
.12
-.09
Forc
ed
Dis
tribu
tion
.07
.09
.01
.08
.09
-.01
Paire
d C
ompa
rison
.07
.14*
.01
.03
.04
.07
-.07
Ran
k
Ord
er
.17*
.09
-.01
.05
-.03
-.02
-.01
-.13
Paire
d C
ompa
rison
Forc
ed
Dis
tribu
tion
Gra
phic
Rat
ing
Crit
ical
Inci
denc
e
BA
RS
BO
S
Che
cklis
t
Obj
ectiv
e C
ards
*p<
.05,
**p
< .0
1

184
APPENDIX N
CROSSTAB ANALYSIS (ORGANIZATION SIZE BY PERFORMANCE
APPRAISAL METHODS)
Rank Order Not Performed Performed Total SIZE Small Count 17 5 22 % within size 77.3% 22.7% 100.0% % within rank order 11.5% 9.6% 11.0% % of Total 8.5% 2.5% 11.0% Medium Count 31 17 48 % within size 64.6% 35.4% 100.0% % within rank order 20.9% 32.7% 24.0% % of Total 15.5% 8.5% 24.0% Large Count 100 30 130 % within size 76.9% 23.1% 100.0% % within rank order 67.6% 57.7% 65.0% % of Total 50.0% 15.0% 65.0% Total Count 148 52 200 % within size 74.0% 26.0% 100.0% % within rank order 100.0% 100.0% 100.0% % of Total 74.0% 26.0% 100.0% Spearman rho= -.07, p > .05, Chi-Square= 2.91, p > .05 Forced Distribution Not Performed Performed Total SIZE Small Count 20 2 22 % within size 90.9% 9.1% 100.0% % within forced distribution 11.4% 8.0% 11.0% % of Total 10.0% 1.0% 11.0% Medium Count 41 7 48 % within size 85.4% 14.6% 100.0% % within forced distribution 23.4% 28.0% 24.0% % of Total 20.5% 3.5% 24.0% Large Count 114 16 130 % within size 87.7% 12.3% 100.0% % within forced distribution 65.1% 64.0% 65.0% % of Total 57.0% 8.0% 65.0% Total Count 175 25 200 % within size 87.5% 12.5% 100.0% % within forced distribution 100.0% 100.0% 100.0% % of Total 87.5% 12.5% 100.0% Spearman rho= .001, p > .05, Chi-Square= .43, p > .05

185
Graphic Rating Not Performed Performed Total SIZE Small Count 21 1 22 % within size 95.5% 4.5% 100.0% % within graphic rating 12.2% 3.6% 11.0% % of Total 10.5% .5% 11.0% Medium Count 40 8 48 % within size 83.3% 16.7% 100.0% % within graphic rating 23.3% 28.6% 24.0% % of Total 20.0% 4.0% 24.0% Large Count 111 19 130 % within size 85.4% 14.6% 100.0% % within graphic rating 64.5% 67.9% 65.0% % of Total 55.5% 9.5% 65.0% Total Count 172 28 200 % within size 86.0% 14.0% 100.0% % within graphic rating 100.0% 100.0% 100.0% % of Total 86.0% 14.0% 100.0% Spearman rho= .04, p > .05, Chi-Square= 1.96, p > .05
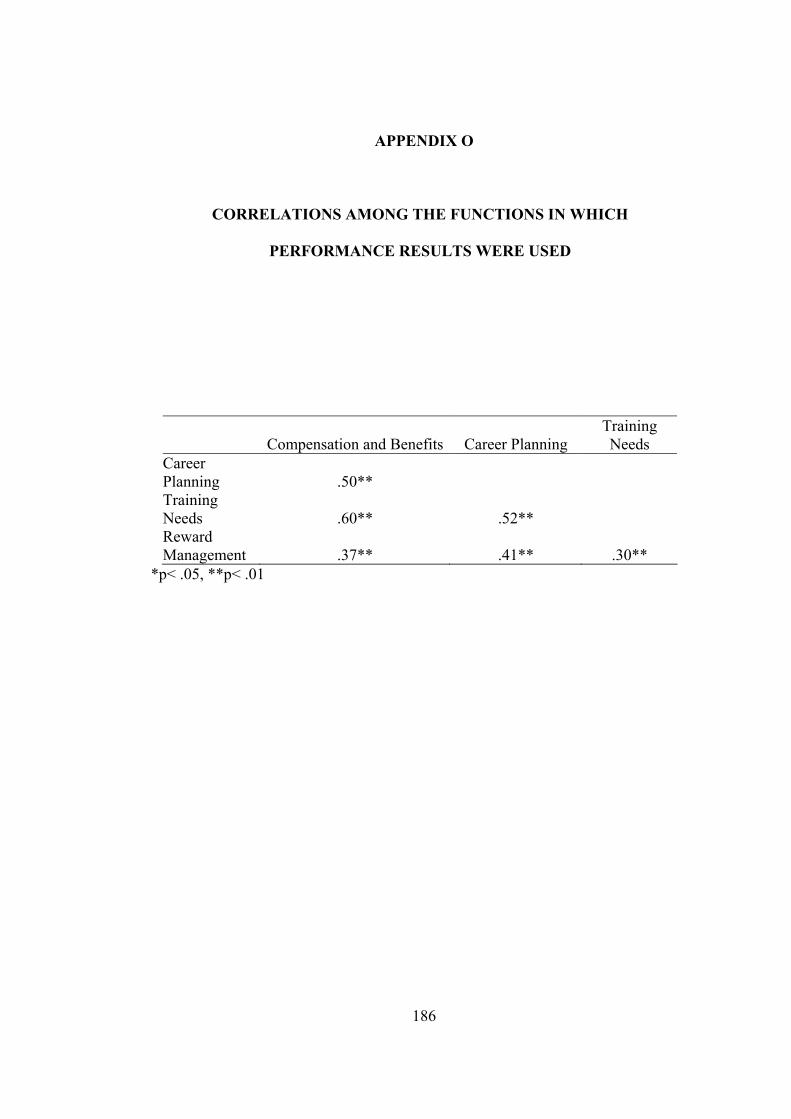
186
APPENDIX O
CORRELATIONS AMONG THE FUNCTIONS IN WHICH
PERFORMANCE RESULTS WERE USED
Compensation and Benefits Career Planning Training Needs
Career Planning .50** Training Needs .60** .52** Reward Management .37** .41** .30**
*p< .05, **p< .01

187
APPENDIX P
CORRELATIONS AMONG ASSESSORS OF EMPLOYEE
PERFORMANCE
360
Feed
back
-.01
HR
M
-.01
-.01
Cus
tom
er
-.03
-.02
-.02
Sub-
Ord
inat
e
.02
-.04
-.02
-.02
Self
.18*
.27*
*
.15*
-.03
-.03
Col
leag
ues
.15*
.47*
*
.22*
*
-.06
-.03
-.03
Seco
nd L
evel
M
anag
er
.13
.26*
*
.09
.03
.11
.12
.12
Firs
t Lev
el
Supe
rvis
or
.34*
*
.16*
.33*
*
.06
.13
.10
.06
.06
Seco
nd L
evel
M
anag
er
Col
leag
ues
Self
Sub-
Ord
inat
e
Cus
tom
er
HR
M
360
Feed
back
Exec
utiv
e C
omm
ittee
*p<
.05,
**p
< .0
1

188
APPENDIX Q
CROSSTAB ANALYSIS (ORGANIZATION SIZE BY CAREER
DEVELOPMENT ACTIVITIES)
Job Rotation Not Performed Performed Total SIZE Small Count 17 5 22 % within size 77.3% 22.7% 100.0% % within job rotation 12.1% 8.3% 11.0% % of Total 8.5% 2.5% 11.0% Medium Count 38 10 48 % within size 79.2% 20.8% 100.0% % within job rotation 27.1% 16.7% 24.0% % of Total 19.0% 5.0% 24.0% Large Count 85 45 130 % within size 65.4% 34.6% 100.0% % within job rotation 60.7% 75.0% 65.0% % of Total 42.5% 22.5% 65.0% Total Count 140 60 200 % within size 70.0% 30.0% 100.0% % within job rotation 100.0% 100.0% 100.0% % of Total 70.0% 30.0% 100.0%
Spearman rho= .13, p > .05, Chi-Square= 3.79, p > .05
Courses Not Performed Performed Total SIZE Small Count 16 6 22 % within size 72.7% 27.3% 100.0% % within courses 12.5% 8.3% 11.0% % of Total 8.0% 3.0% 11.0% Medium Count 35 13 48 % within size 72.9% 27.1% 100.0% % within courses 27.3% 18.1% 24.0% % of Total 17.5% 6.5% 24.0% Large Count 77 53 130 % within size 59.2% 40.8% 100.0% % within courses 60.2% 73.6% 65.0% % of Total 38.5% 26.5% 65.0% Total Count 128 72 200 % within size 64.0% 36.0% 100.0% % within courses 100.0% 100.0% 100.0% % of Total 64.0% 36.0% 100.0%
Spearman rho= .13, p > .05, Chi-Square= 3.67, p > .05

189
Seminars/Trainings Not Performed Performed Total SIZE Small Count 15 7 22 % within size 68.2% 31.8% 100.0% % within seminars/trainings 11.3% 10.4% 11.0% % of Total 7.5% 3.5% 11.0% Medium Count 33 15 48 % within size 68.8% 31.3% 100.0% % within seminars/trainings 24.8% 22.4% 24.0% % of Total 16.5% 7.5% 24.0% Large Count 85 45 130 % within size 65.4% 34.6% 100.0% % within seminars/trainings 63.9% 67.2% 65.0% % of Total 42.5% 22.5% 65.0% Total Count 133 67 200 % within size 66.5% 33.5% 100.0% % within seminars/trainings 100.0% 100.0% 100.0% % of Total 66.5% 33.5% 100.0%
Spearman rho= .03, p > .05, Chi-Square= .21, p > .05

190
APPENDIX R
CORRELATIONS AMONG THE ACTIVITIES OF CAREER
DEVELOPMENT
Job
Rotation Courses Seminars/Trainings Work Groups
Master Programs
Courses .37** Seminars/ Trainings .48** .59** Work Groups .37** .38** .33** Master Programs .38** .36** .38** .11 Development Centers .10 -.01 .09 -.06 .10
*p< .05, **p< .01

191
APPENDIX S
CORRELATIONS AMONG THE INDIVIDUALS PERFORMING CAREER
PLANNING
Specialist In the
Firm Specialist
Outside the Firm Managers/ Supervisors
Specialist Outside the Firm .01 Managers/Supervisors .25** -.07 HRM Department .004 .10 .21**
*p< .05, **p< .01

192
APPENDIX T
CORRELATIONS AMONG HUMAN RESOURCE PLANNING
Empl
oyee
Ev
alua
tion
.60*
*
Exis
ting
Man
pow
er
.68*
*
.56*
*
Man
pow
er
Eval
uatio
n
.52*
*
.43*
*
.56*
*
Equi
libriu
m
.44*
*
.54*
*
.36*
*
.48*
*
Dem
and-
Supp
ly
.35*
*
.35*
*
.27*
*
.19*
*
.21*
*
Man
pow
er
Ana
lysi
s
.35*
*
.22*
*
.37*
*
.24*
*
.31*
*
.31*
*
Dev
elop
men
t Sp
eed
.49*
*
.36*
*
.25*
*
.44*
*
.20*
*
.20*
*
.29*
*
Met
hods
.41*
*
.43*
*
.30*
*
.24*
*
.32*
*
.25*
*
.41*
*
.35*
*
Stra
tegi
es
.51*
*
.53*
*
.41*
*
.29*
*
.23*
*
.39*
*
.23*
*
.32*
*
.24*
*
Met
hods
Dev
elop
men
t Sp
eed
Man
pow
er
Ana
lysi
s
Dem
and-
Supp
ly
Equi
libriu
m
Man
pow
er
Eval
uatio
n
Exis
ting
Man
pow
er
Empl
oyee
Ev
alua
tion
Sour
ce
Ana
lysi
s
*p<
.05,
**p
< .0
1

193
APPENDIX U
CORRELATIONS AMONG THE FACTORS THAT AFFECT SALARY
INCREMENT
Wag
e R
esea
rch
-.01
Rel
atio
ns
-.04
-.03
Skill
.15*
-.05
-.03
App
oint
men
t
.11
-.002
.03
-.05
Educ
atio
n
.26*
*
.27*
*
.20*
*
.05
-.04
Expe
rienc
e
.38*
*
.13
.27*
*
.21*
*
.05
-.04
Prof
it .09
.10
.21*
*
.10
.07
-.09
-.06
Gro
up
Perf
orm
ance
.17*
.10
.18*
.21*
*
.23*
*
.17*
.05
-.03
Perf
orm
ance
.20*
*
.30*
*
.10
.15*
.34*
*
.09
-.04
.08
-.09
Infla
tion
.26*
*
.08
.32*
*
.12
.13
.29*
*
.11
-.05
-.04
-.10
Perf
orm
ance
Gro
up
Perf
orm
ance
Prof
it
Expe
rienc
e
Educ
atio
n
App
oint
men
t
Abi
lity
Rel
atio
ns
Wag
e R
esea
rch
Col
lect
ive
Bar
gain
ing
*p<
.05,
**p
< .0
1

194
APPENDIX V
CORRELATIONS AMONG THE FACTORS AND INDIVIDUALS PLAYING
A ROLE IN MANAGERS’ SALARY INCREMENT
Wag
e R
esea
rch
-.01
Col
lect
ive
Bar
gain
ing
-.01
-.01
Num
eric
al
PA C
riter
ia
.11
-0,0
4
-.03
PA
Res
ults
.30*
*
.15*
.15*
.12
Atta
tinin
g O
bjec
tives
.36*
*
.28*
*
-.05
.07
.04
EC
-.004
.03
.14*
.15*
-.07
-.05
Gen
eral
M
anag
er
.19*
*
.14*
.20*
*
.11
.02
-.08
.09
HR
M
anag
er
.18*
-.09
.27*
*
.17*
.10
-.05
-.05
.13
Seco
nd L
evel
M
anag
er
.08
-.08
-.06
.05
.08
-.003
-.05
-.05
.13
Firs
t Lev
el
Man
ager
.21*
*
.06
.05
-.06
.12
.12
.05
-.10
-.10
.07
Seco
nd L
evel
M
anag
er
HR
Man
ager
Gen
eral
M
anag
er
EC
Atta
tinin
g O
bjec
tives
PA R
esul
ts
Num
eric
al P
A
Crit
eria
Col
lect
ive
Bar
gain
ing
Wag
e R
esea
rch
Job
Eval
uatio
n
*p<
.05,
**p
< .0
1

195
APPENDIX W
CORRELATIONS AMONG THE FACTORS AND INDIVIDUALS
PLAYING A ROLE IN NON-MANAGERS’ SALARY INCREMENT
Wag
e R
esea
rch
-.01
Col
lect
ive
Bar
gain
ing
-.01
-.01
Num
eric
al P
A
Crit
eria
.08
-.04
-.03
PA
Res
ults
.28*
*
.08
.13
.09
Atta
tinin
g O
bjec
tives
.36*
*
.25*
*
-.07
.06
-.04
EC .0
2
.06
.12
.01
-.07
-.05
Gen
eral
M
anag
er
.17*
.04
.04
-.004
-.01
-.08
.09
HR
M
anag
er
.21*
*
-.02
.12
.16*
.10
-.08
-.07
.10
Seco
nd
Leve
l M
anag
er
.17*
.08
-.03
.08
.06
.11
-.08
-.07
.11
Firs
t Lev
el
Man
ager
.21*
*
.13
.16*
-.02
.12
.15*
.04
-.16*
-.13
.05
Se
cond
Le
vel
Man
ager
H
R
Man
ager
Gen
eral
M
anag
er
EC
Atta
tinin
g O
bjec
tives
PA R
esul
ts
Num
eric
al
PA C
riter
ia
Col
lect
ive
Bar
gain
ing
Wag
e R
esea
rch
Job
Eval
uatio
n
*p<
.05,
**p
< .0
1

196
APPENDIX X
CORRELATIONS AMONG MANAGERS’ BENEFITS
Soci
al
Ben
efits
-.03
Fuel
A
llow
ance
.43*
*
-.04
Educ
atio
n A
llow
ance
.46*
*
.30*
*
.15*
Chi
ldre
n A
llow
ance
.56*
*
.55*
*
.35*
*
-.04
Prof
it Sh
arin
g
.13
0.01
.04
.19*
*
-.03
Fest
ival
Pr
emiu
m
.10
.59*
*
.36*
*
.52*
*
.27*
*
.11
New
Yea
r Pr
emiu
m
.25*
*
.11
.24*
*
.19*
*
.17*
.26*
*
-.04
Clu
b M
embe
rshi
p
.08
.01
.17*
.17*
.04
-.01
-.07
-.03
Kin
der
Gar
den
.35*
*
.18*
.06
.13
.03
-.02
-.02
.13
-.02
Ren
t H
elp .0
9
.07
.22*
*
.17*
-.07
.03
.04
.19*
*
-.02
-.03
Free
A
partm
ent
.08
.25*
*
.03
.13
-.01
.14
-.07
-.07
-.004
.10
-.03
Hom
e Ph
one
.27*
*
.14*
.27*
*
.26*
*
.08
.09
.09
.14*
-.02
.04
-.02
-.02
Mob
ile
Phon
e
.01
.13
.05
.01
.20*
*
.09
.14*
.14*
.15*
.17*
.04
.09
.08
Gas
olin
e
.30*
*
.06
.04
.17*
-.04
-.03
.12
.25*
*
-.01
.18*
.28*
*
.19*
*
.13
.07
Trav
el
Allo
wan
ce
.23*
*
.06
.004
-.08
-.03
-.05
.07
.12
.22*
*
.03
.12
.07
.03
.03
-.05
Car
.10
.52*
*
.48*
*
.07
.06
.08
-.07
.05
.15*
.18*
.11
.24*
*
.36*
*
.23*
*
.1
.06
Spec
ial
Ret
irem
ent
.02
.06
.01
.18*
.10
.24*
*
.15*
.10
.15*
.08
.04
.18*
.003
-.01
-.03
-.03
-.03
Acc
iden
t In
sura
nce
.16*
.17*
-.08
.23*
*
.28*
*
-.09
.06
.23*
*
-.12
.09
.001
.25*
*
.04
.16*
.15*
.18*
.07
.14
Life
In
sura
nce
.28*
*
.28*
*
.11
-.04
.09
.17*
-.04
.02
.19*
*
.17*
.15*
-.06
.03
.10
-.07
-.01
.06
.04
-.04
Hea
lth
Insu
ranc
e
.37*
*
.26*
*
.19*
*
.18*
*
.11
.17*
.30*
*
-.03
.08
-.02
.07
.13
.07
.12
.15*
.15*
.07
.09
.13
-.06
Food
Se
rvic
e
.27*
*
.17*
.16*
.09
.28*
*
.29*
*
.28*
*
.30*
*
.09
.12
.16*
.17*
.13
.26*
*
.24*
*
.08
.27*
*
.24*
*
.25*
*
.23*
*
-.11
Hea
lth
Insu
ranc
e
Life
In
sura
nce
Acc
iden
t In
sura
nce
Spec
ial
Ret
irem
ent
Car
Trav
el
Allo
wan
ce
Gas
olin
e
Mob
ile
Phon
e
Hom
e Ph
one
Free
A
partm
ent
Ren
t Hel
p
Kin
der
Gar
den
Clu
b M
embe
rshi
p
New
Yea
r Pr
emiu
m
Fest
ival
Pr
emiu
m
Prof
it Sh
arin
g
Chi
ldre
n A
llow
ance
Educ
atio
n A
llow
ance
Fuel
A
llow
ance
Soci
al
Ben
efits
Food
A
llow
ance
*p<
.05,
*p<
.01

197
APPENDIX Y
CORRELATIONS AMONG NON-MANAGERS’ BENEFITS So
cial
B
enef
its
-.05
Fuel
.29*
*
-.05
Educ
atio
n A
llow
ance
.54*
*
.36*
*
-.04
Chi
ldre
n A
llow
ance
.46*
*
.60*
*
.32*
*
-.05
Prof
it
.04
.02
.12
.08
-.02
Fest
ival
Pr
emiu
m
.04
.48*
*
.42*
*
.53*
*
.39*
*
.09
New
Yea
r Pr
emiu
m
.16*
.02
.09
.26*
*
.15*
.15*
-.03
Clu
b M
embe
r
.05
.02
.18*
.03
.08
-.03
.10
-.02
Kin
der
Gar
den
.22*
*
.08
.17*
.08
.06
.12
.12
.18*
-.03
Ren
t H
elp
-.06
-.03
.13
.12
.14*
.17*
.03
.10
.23*
*
-.03
Free
Fl
at
.02
.08
.11
.03
.01
.05
.13
.10
.15*
.06
-.01
Hom
e Ph
one
.09
-.06
.13
.37*
*
.004
-.05
.28*
*
.03
.11
.08
.08
-.01
Mob
ile
Phon
e
-.05
-.02
-.12
-.02
.01
.15*
.07
.01
-.03
-.09
-.09
.01
-.02
Gas
.20*
*
-.07
.002
.18*
-.04
.14*
.08
-.12
-.04
-.04
-.14*
-.19*
*
.10
-.03
Trav
el
-.001
.13
-.08
-.03
.09
.14*
-.06
.06
.26*
*
.06
.15*
-.02
.16*
.13
-.06
Car
.09
.20*
*
.42*
*
-.05
.12
-.07
.07
.001
.23*
*
.04
-.05
-.03
.02
.01
.12
-.02
Spec
ial
Ret
irem
ent
-6
-.02
.17*
-.004
.15*
.04
.01
.05
.04
-.13
-.07
-.06
.04
-.04
-.02
.04
-.02
Acc
iden
t In
sura
nce
.10
-.03
-.10
.15*
.01
.13
.13
.17*
.06
.16*
.17*
.03
.09
.10
.10
.09
.18*
.2
Life
In
sura
nce
.20*
*
.06
.09
-.08
.20*
*
.04
.10
.05
-.04
.07
.26*
*
-.04
-.08
.04
-.06
.15*
-.03
.13
-.03
Hea
lth
Insu
ranc
e
.38*
*
.19*
*
.21
-.01
.10
.09
.06
.003
-.002
.04
.06
.11
-.05
.10
.02
.02
.04
-.03
.05
-.06
Food
Se
rvic
e
.22*
*
.17*
.15*
.14
.08
.24*
*
.12
.19
.02
.16*
.05
.09
.16*
.17*
.24*
*
.15*
.27*
*
.27*
*
.32*
*
.27*
*
-.12
Hea
lth
Insu
ranc
e Li
fe
Insu
ranc
e A
ccid
ent
Insu
ranc
e Sp
ecia
l R
etire
men
t
Car
Trav
el
Gas
Mob
ile
Phon
e
Hom
e
Phon
e
Free
Fla
t R
ent H
elp
Kin
der
Gar
den
Clu
b M
embe
r N
ew Y
ear
Prem
ium
Fest
ival
Pr
emiu
m
Prof
it
Chi
ldre
n A
llow
ance
Educ
atio
n A
llow
ance
Fuel
So
cial
B
enef
its
Food
A
llow
ance
*p<
.05,
*p<
.01

198
APPENDIX Z
CORRELATIONS AMONG THE METHODS OF JOB EVALUATION
Job Ranking Job Grading Scoring Job Grading .33** Scoring .16* .27** Factor Comparison .17* .11 .28** *p< .05, **p< .01